Article

Kinetic Study and Modeling of Wild-Type and Recombinant Broccoli Myrosinase Produced in E. coli and S. cerevisiae as a Function of Substrate Concentration, Temperature, and pH

1
Department of Chemical Engineering, Faculty of Engineering, University of Santiago of Chile (USACH), Av. Libertador Bernardo O’Higgins 3363, Estación Central, Santiago 9170019, Chile
2
Department of Biology, Faculty of Chemistry and Biology, University of Santiago of Chile (USACH), Av. Libertador Bernardo 3363, Estación Central, Santiago 9170019, Chile
*
Author to whom correspondence should be addressed.
Submission received: 27 May 2022 / Revised: 15 June 2022 / Accepted: 20 June 2022 / Published: 22 June 2022
(This article belongs to the Special Issue Current State-of-the-Art of Biocatalysts)

Abstract

:
The myrosinase enzyme hydrolyzes glucosinolates, among which is glucoraphanin, the precursor of the anticancer isothiocyanate sulforaphane (SFN). The main source of glucoraphanin is Brassicaceae; however, its natural concentration is relatively low, limiting the availability of SFN. An option to obtain SFN is its exogenous production, through enzymatic processes and under controlled conditions, allowing complete conversion of glucoraphanin to SFN. We characterized the kinetics of wild-type (BMYR) and recombinant broccoli myrosinases produced in E. coli (EMYR) and S. cerevisiae (SMYR) in terms of the reaction conditions. Kinetics was adjusted using empirical and mechanistic models that describe reaction rate as a function of substrate concentration, temperature, and pH, resulting in R2 values higher than 90%. EMYR kinetics differed significantly from those of BMYR and SMYR probably due to the absence of glycosylations in the enzyme produced in E. coli. BMYR and SMYR were subjected to substrate inhibition but followed different kinetic mechanisms attributed to different glycosylation patterns. EMYR (inactivation Ea = 76.1 kJ/mol) was more thermolabile than BMYR and SMYR. BMYR showed the highest thermostability (inactivation Ea = 52.8 kJ/mol). BMYR and EMYR showed similar behavior regarding pH, with similar pK1 (3.4 and 3.1, respectively) and pK2 (5.4 and 5.0, respectively), but differed considerably from SMYR.

Graphical Abstract

1. Introduction

Myrosinase (β-thioglucosidase glucohydrolase, EC 3.2.1.147) hydrolyzes a family of secondary plant metabolites called glucosinolates, resulting in isothiocyanates, nitriles, and epithionitriles, depending on the chemical conditions of the reaction milieu [1]. The isothiocyanate sulforaphane (SFN) offers important health benefits since it acts as an indirect antioxidant by inducing phase II detoxifying enzymes and thus protects the cells from oxidative damage [2]. This has a preventive, and in some cases palliative, effect on non-transmittable chronic diseases such as some types of cancer [3,4,5], neurodegeneration [6], gastric ulcer [7], cardiac diseases [8], etc. Accordingly, myrosinase has industrial potential aiming at producing isothiocyanates intended as drugs or bioactive compounds in functional foods.
Myrosinase sources are diverse; they can be found in Aspergillus sp. [9], aphids [10], gastric microflora [11,12], in Brassicaceae such as broccoli [13], etc. Molecular, physicochemical, and kinetic properties of myrosinases vary markedly among species and tissues since MYR genes codify multiple isoenzymes [14]. Accordingly, each myrosinase must be characterized independently, and the properties of one cannot be extrapolated to another myrosinase. Myrosinase activity also varies significantly between species. Section 3.1 shows the kinetic parameters of different myrosinases. Among Brassicaceae, broccoli myrosinase shows the highest catalytic activity [15].
For industrial production, extraction of myrosinase from natural sources is inviable. Heterologous production of the enzyme represents the best option [5]. Heterologous production of myrosinase from different sources has been investigated. Chen and Halkier [16] reported the heterologous expression of Brassica napus myrosinase MYR1 in Saccharomyces cerevisiae. The authors revealed that low expression levels due to myrosinase were toxic for yeast. Härtel and Brandt [17] expressed MYR1 in P. pastoris as secreted enzyme and avoided toxicity. Recently, Rosenbergová et al. [5] produced myrosinase from A. thaliana in P. pastoris, achieving high productivity by scaling up and optimizing the culture conditions in fermenters.
Structural information about myrosinases is relatively scarce. The crystal structure of Brevicoryne brassicae [18] and Sinapis alba [19] myrosinases are already elucidated; however, no crystallographic information about Brassicaceae myrosinases is currently available. Broccoli myrosinase has been isolated from inflorescences, and it has been characterized in terms of molecular mass, quaternary structure [13], cDNA sequence, three-dimensional structure model, and enzymatic kinetics [20,21]. In addition to showing the highest activity among Brassicaceae plants, its maximum activity occurs at pH 3.0, and it is stable up to 70 °C. These properties make broccoli myrosinase attractive as a catalyst to produce isothiocyanates and especially sulforaphane at the industrial level. For these reasons, it is imperative to express and produce the enzyme as a heterologous protein in well-known industrial hosts.
To design an enzyme production process, it is necessary to describe the enzyme kinetics and its dependence on pH and temperature to understand the underlying mechanisms and to count on mathematical models that allow representing the system and predict its behavior in different conditions. Hydrolysis products of myrosinase strongly depend on the chemical conditions of the reaction milieu. Considering that the product of interest is sulforaphane, it is essential to know myrosinase kinetic behavior at different pH values, temperatures, and substrate concentrations to determine the optimal reaction conditions that maximize sulforaphane formation to the detriment of undesirable side products such as nitriles and epithionitriles. Recombinant enzymes most likely differ in their kinetic properties from wild types; therefore, the kinetic properties of recombinant myrosinases must be investigated.
Recently, Curiqueo et al. [22] cloned and expressed broccoli myrosinase in E. coli and S. cerevisiae and determined some kinetic and biochemical properties. Recombinant myrosinases showed the maximum activity at pH = 3 and resulted in slightly less thermostability than the wild type. Even though Curiqueo et al. [22] performed a preliminary kinetic study, adjustments to kinetic models that represent more accurately recombinant myrosinases behavior were not included, nor was an analysis of the dependence of catalytic activity on pH and temperature, both crucial variables that determine myrosinase performance. Thus, in this study, we investigated the adjustment of kinetic models to the catalytic behavior of recombinant broccoli myrosinase produced in E. coli and S. cerevisiae [22], in terms of substrate concentration, pH, and temperature.

2. Enzyme Kinetics Models

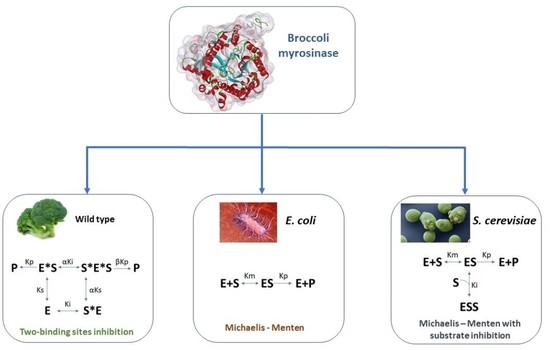
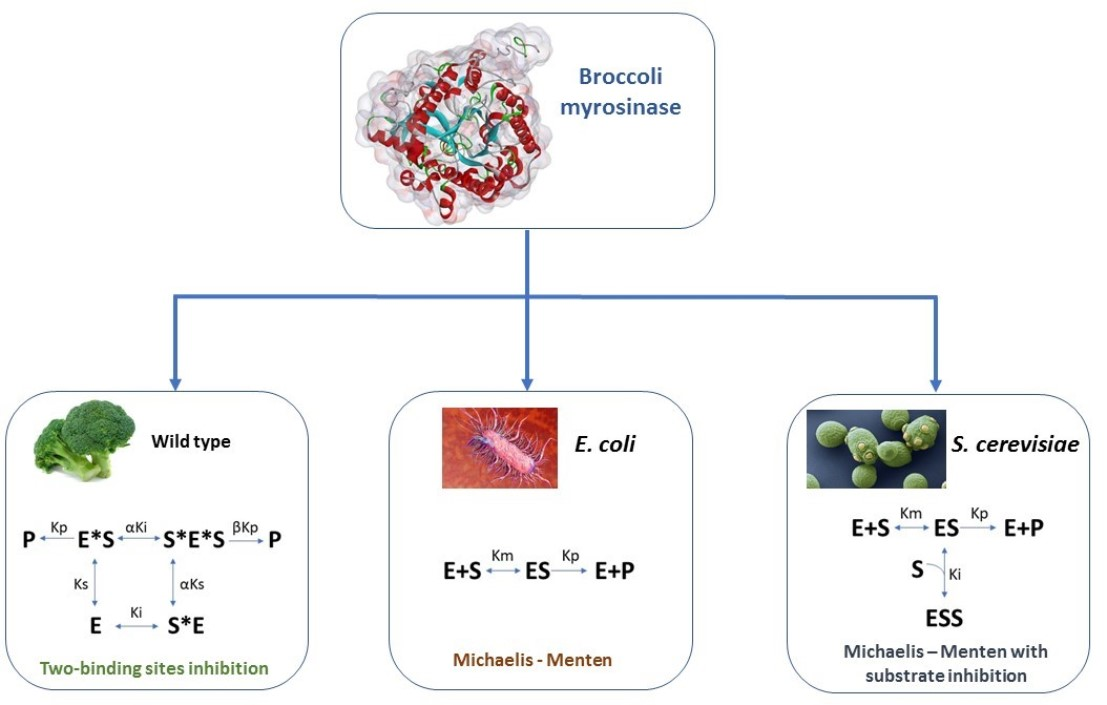
2.1. Substrate-Dependent Models

Studies about myrosinase kinetics are scarce. Bernardi et al. [23] adjusted the Michaelis–Menten (MM) model to Crambe abyssinica seeds myrosinase. Vastenhout et al. [24] informed that Sinapis alba myrosinase kinetics adjusted to the Michaelis–Menten model. Pardini et al. [25] reported that myrosinase from broccoli and cauliflower are subjected to strong substrate inhibition. At low substrate concentrations, myrosinase kinetics adjusted to the MM model. Broccoli myrosinase has been studied by the authors of [13], who isolated the enzyme from inflorescences and performed a preliminary kinetic and physicochemical characterization. Román et al. [20] adjusted the kinetics of broccoli myrosinase to the Michaelis–Menten model with and without substrate inhibition, and to the two-binding-site inhibition model (TBSI) [26], and concluded that the latter best describes its behavior. These results were confirmed with molecular docking simulations of the three-dimensional structure model of broccoli myrosinase and different substrates and inhibitors [21].
The classical Michaelis–Menten model assumes that there is only one substrate-binding site in the enzyme molecule that corresponds to the active site. The MM model with substrate inhibition (or non-competitive inhibition) assumes that there is one substrate-binding site that when occupied forms in the molecule another substrate-binding site that produces the inhibition. The substrate binds sequentially to the sites forming an inactive ternary complex. The two-binding-site inhibition model states that a subunit has two substrate-binding sites, one active and the other inhibitory. Binding to the inhibitory site reduces enzymatic activity [27]. Substrate molecules can bind randomly and simultaneously to both sites, and in the bound conformation, both sites can interact [28]. Figure 1 shows the mechanisms that support each model, and Equations (1)–(3) represent the models.
Models representing the kinetic mechanism of myrosinase are presented in Equation (1) (Michaelis-Menten, MM), (2) (Michaelis–Menten with substrate inhibition, SIMM), and (3) (Two-binding-site inhibition model, TBSI). Here, v m a x is the maximum rate, K m is Michaelis–Menten constant, [ S ] is the substrate concentration, K i is the dissociation constant for substrate binding to the inhibitory site, K s is approximately equal to Km, K s is the dissociation constant of a substrate molecule from the catalytic site, K i is the dissociation constant of a substrate molecule from the inhibitory site, and α ,   β are dissociation factors.
v = v m a x [ S ] K m + [ S ]
v = v m a x K m + [ S ] ( 1 + [ S ] K i )            
v = v m a x ( 1 K s + β · S K i K s ) 1 S + 1 K s + 1 K i + S α K s K i          

2.2. Temperature-Dependent Models

The dependence of enzymatic activity on temperature is a multifactor problem. The main phenomena involved are increases in rate constants induced by temperature and reduced activity due to structural changes in the enzyme induced by temperature. The effect on the rate constant can be described by the Arrhenius equation (Equation (4)), where k′ is the frequency factor, Ea is the activation energy, R is the universal gas constant, and T is the absolute temperature. The rate constant (k) is considered equivalent to enzyme activity since activity units are defined as the rate of substrate consumption [30].
k = k   e x p ( E a R T )
Reports about temperature-dependent models that describe enzymatic activity are scarce, and there is no information about such models applied to myrosinases. Prieto et al. [31] described temperature dependence of Glucanex activity using Equation (5), where A is enzymatic activity; T is temperature; a, b, and n are parameters to be adjusted, with n ≠ 1.
A = a * T n * e ( b T )
Models that describe biological phenomena with a bell shape can be used in enzymes. Equation (6) is an empirical function reported by [32] to describe the temperature-dependent development of arthropods. This model allows the detection of upper and lower temperature thresholds, it can describe asymmetry on optimal temperature, and it can represent the drastic activity reduction at temperatures above the optimal.
A = α * T ( T T m i n ) ( T m a x T ) 1 m
where A is enzymatic activity, T is the temperature (in degrees), Tmax is the upper threshold, Tmin is the lower threshold, and α and m are empirical constants.
Equation (7) shows a thermodynamic stochastic model used to represent the development of Lepidoptera as a function of temperature [33,34]. The model assumes an Arrhenius-type behavior and multiple conformational states of the enzymes that control the underlying processes. This model is valid for linear approximation, and it establishes low and high-temperature thresholds.
A = η ( 25 ° C ) T 298.2   ° C e x p ( Δ H A R ( 1 298.2   ° C 1 T ) ) 1 + e x p ( Δ H L R ( 1 T 1 / 2 L 1 T ) + Δ H H R ( 1 T 1 / 2 H 1 T ) )
where A is enzyme activity, T is the absolute temperature, and R is the universal gas constant. The enzyme-related parameters are η ( 25 ° C ) (activity at 25 °C assuming no inactivation), Δ H A (inactivation enthalpy), T 1 / 2 L (melting point of the enzyme at the low-temperature threshold), Δ H L (enthalpy change due to low-temperature inactivation), and Δ H H (enthalpy change due to high thermal inactivation).

2.3. pH-Dependent Models

The dependence of enzymatic activity on pH has been described through different models; however, there is no report about models to describe the pH dependency of myrosinase. Prieto et al. [31] used a fourth-grade polynomial to describe the joint effect of pH and temperature on Glucanex activity. The authors estimated the model parameters using the linear least-squares method. The model was able to describe the asymmetry of the curve at the near-maximum activity pH. Equation (8) shows an adaptation of that model which includes only pH as an independent variable since myrosinase activity dependence on pH showed a similar behavior at different temperatures. Here, bi is adjusted parameters, and pH is the measured pH in the reaction milieu.
A = b o pH 4 + b 2 pH 3 + b 22 pH 2 + b 33 pH + b 44
Using the same criteria, the Briere model can be adapted by replacing temperature for pH, considering that enzyme activity curves in terms of temperature and in terms of pH showed similar shapes (Equation (9)). Here, α and m are empirical constants, pH is the experimental value in the reaction milieu, and pHmin and pHmax are the pH values at which myrosinase showed the lowest and highest activity, respectively.
A = α * pH ( pH pH min ) ( pH max pH ) 1 m
Kambiré et al. [29] proposed a mechanistic model to describe the activity dependence of weevil β-glucosidase on pH. The bell shape of activity–pH curves suggests that, in the enzyme molecule, there are two catalytically essential ionizable groups. The enzyme is active only when one group is protonated, and the other is not. Figure 1D depicts the kinetic mechanism.
Considering that only the native conformation of the enzyme is active (E), in substrate saturation conditions, the activity varies according to the mechanism shown in Figure 1D, which is described by Equations (10) and (11).
E H 2 + E + 2 H +
E E + H +
The mathematical model that describes this mechanism is given by Equation (12), where A is enzyme activity at a defined pH, A m a x is the maximum initial activity, and p k 1 and p k 2 are the ionization constants at acid and basic pH, respectively. Equilibrium constants were defined according to [35].
A = A m a x 1 + 10 p k 1 2 p H + 10 p H p k 2

3. Results and Discussion

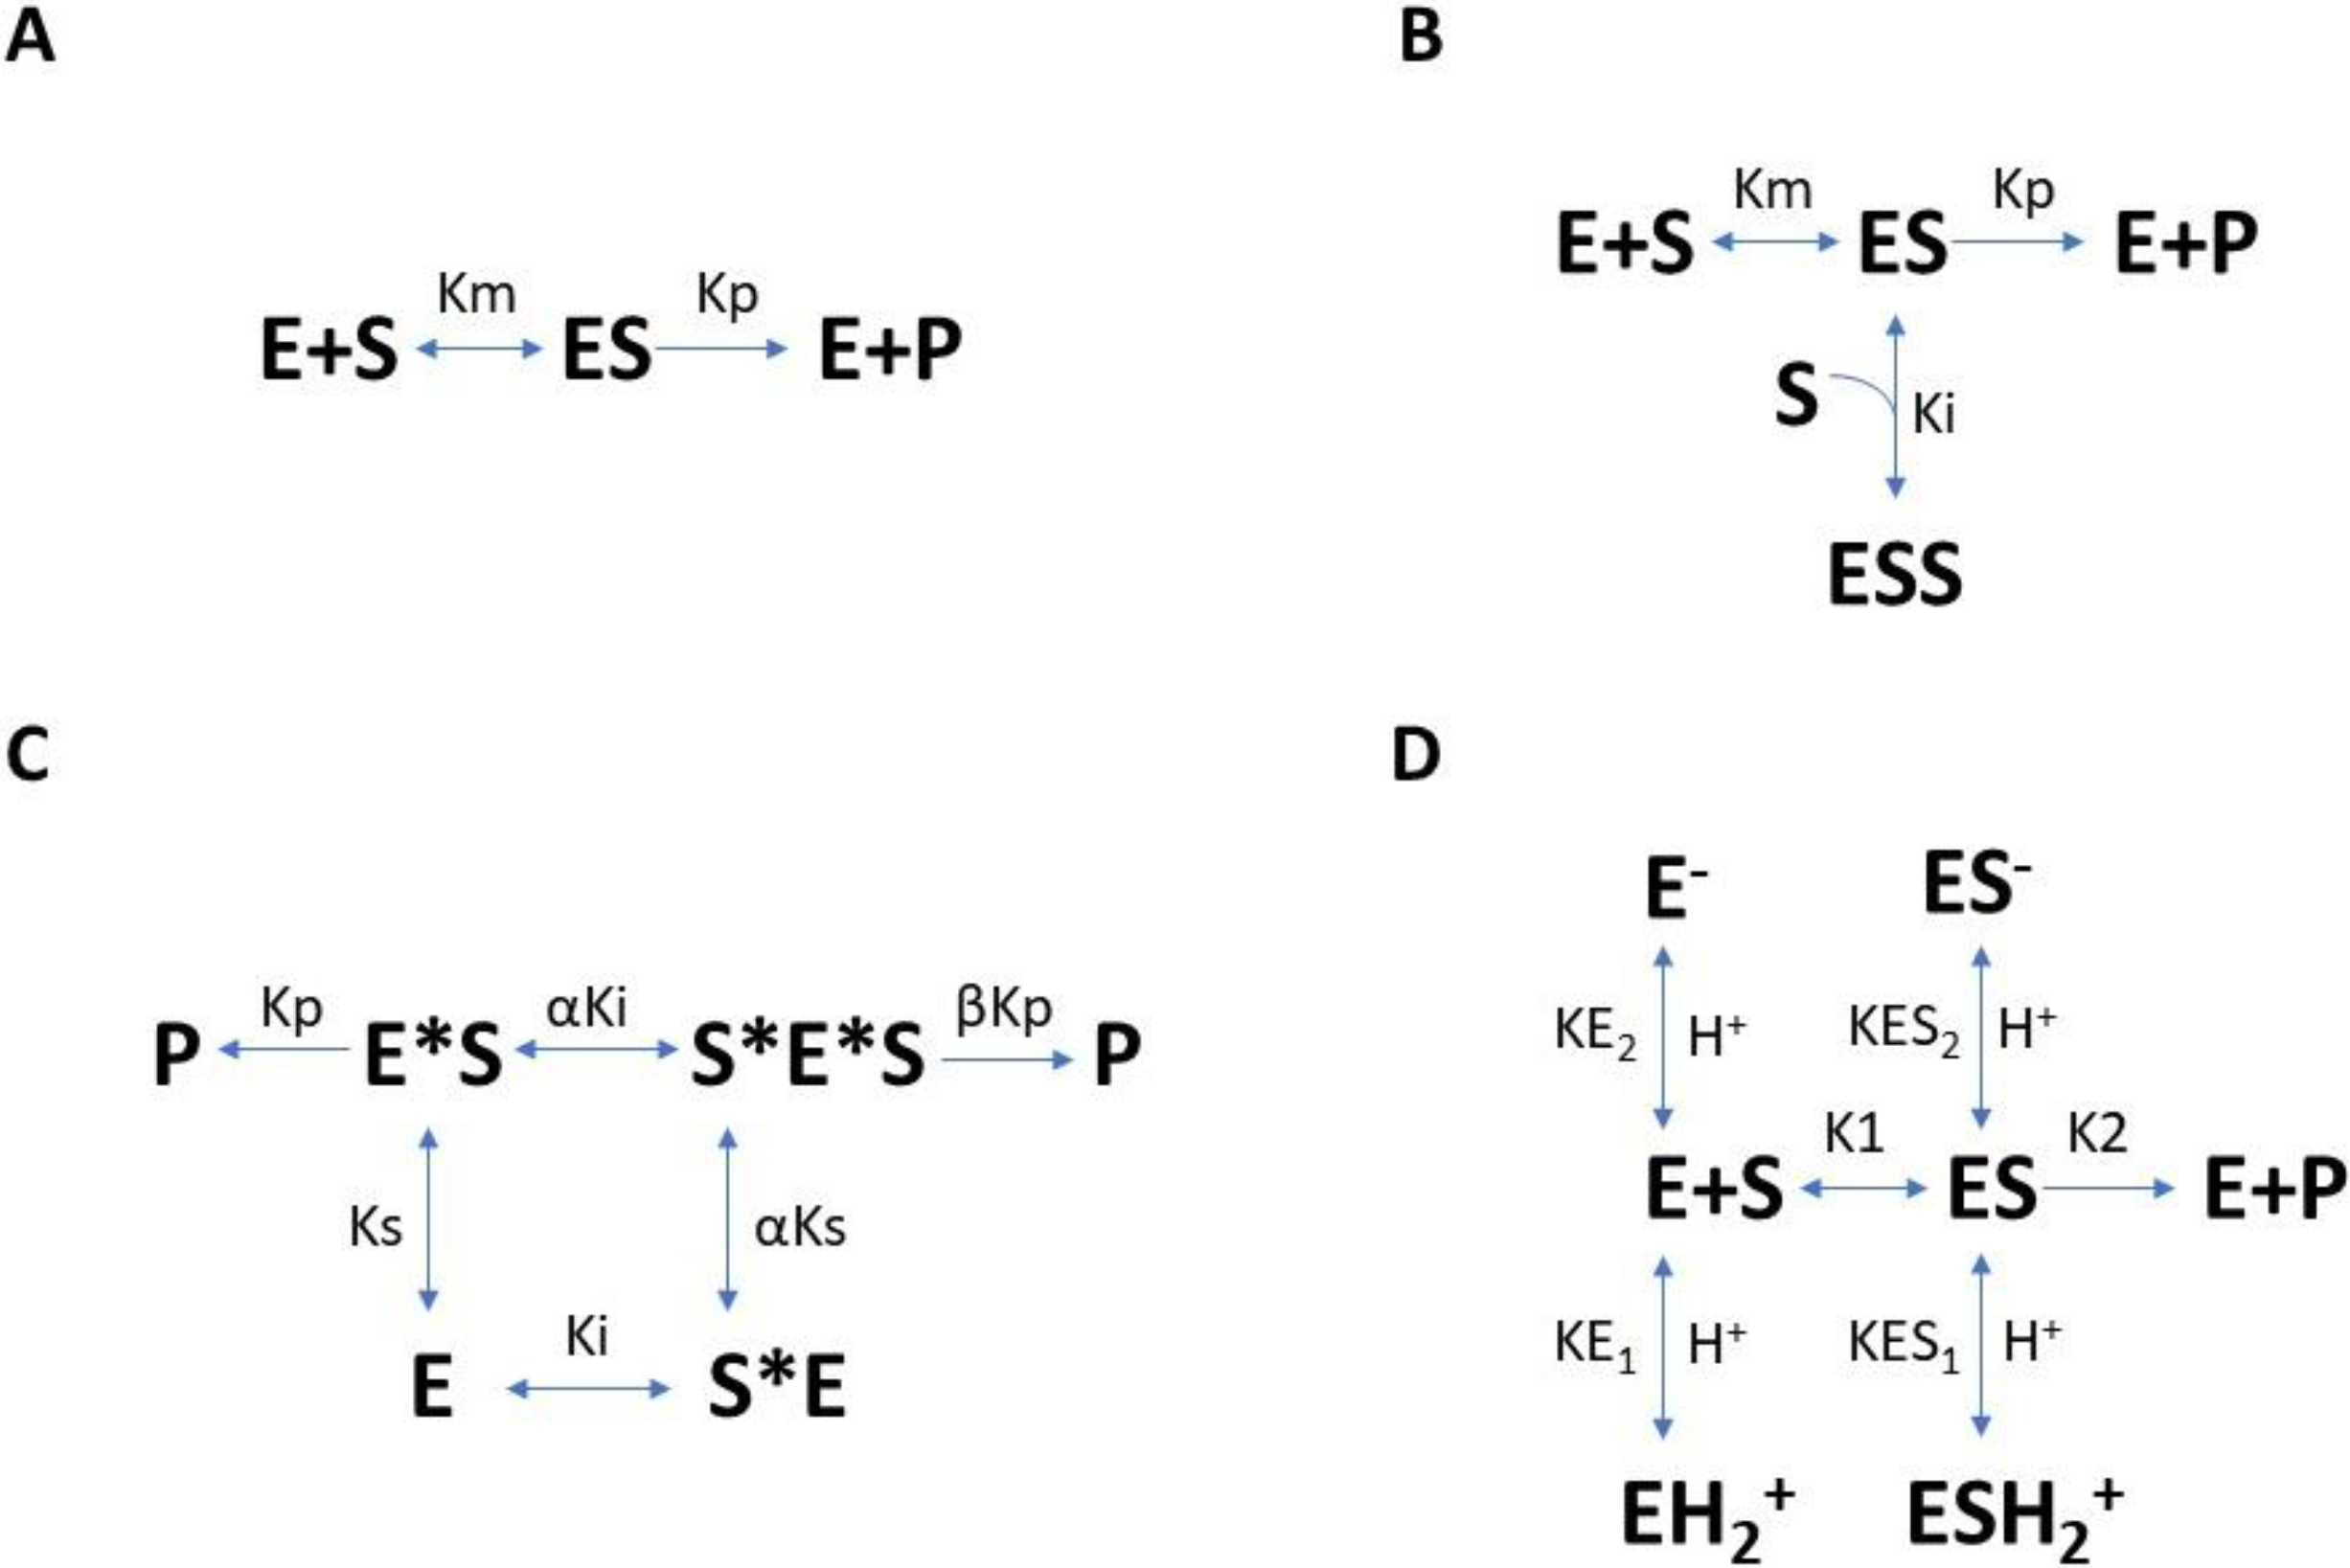
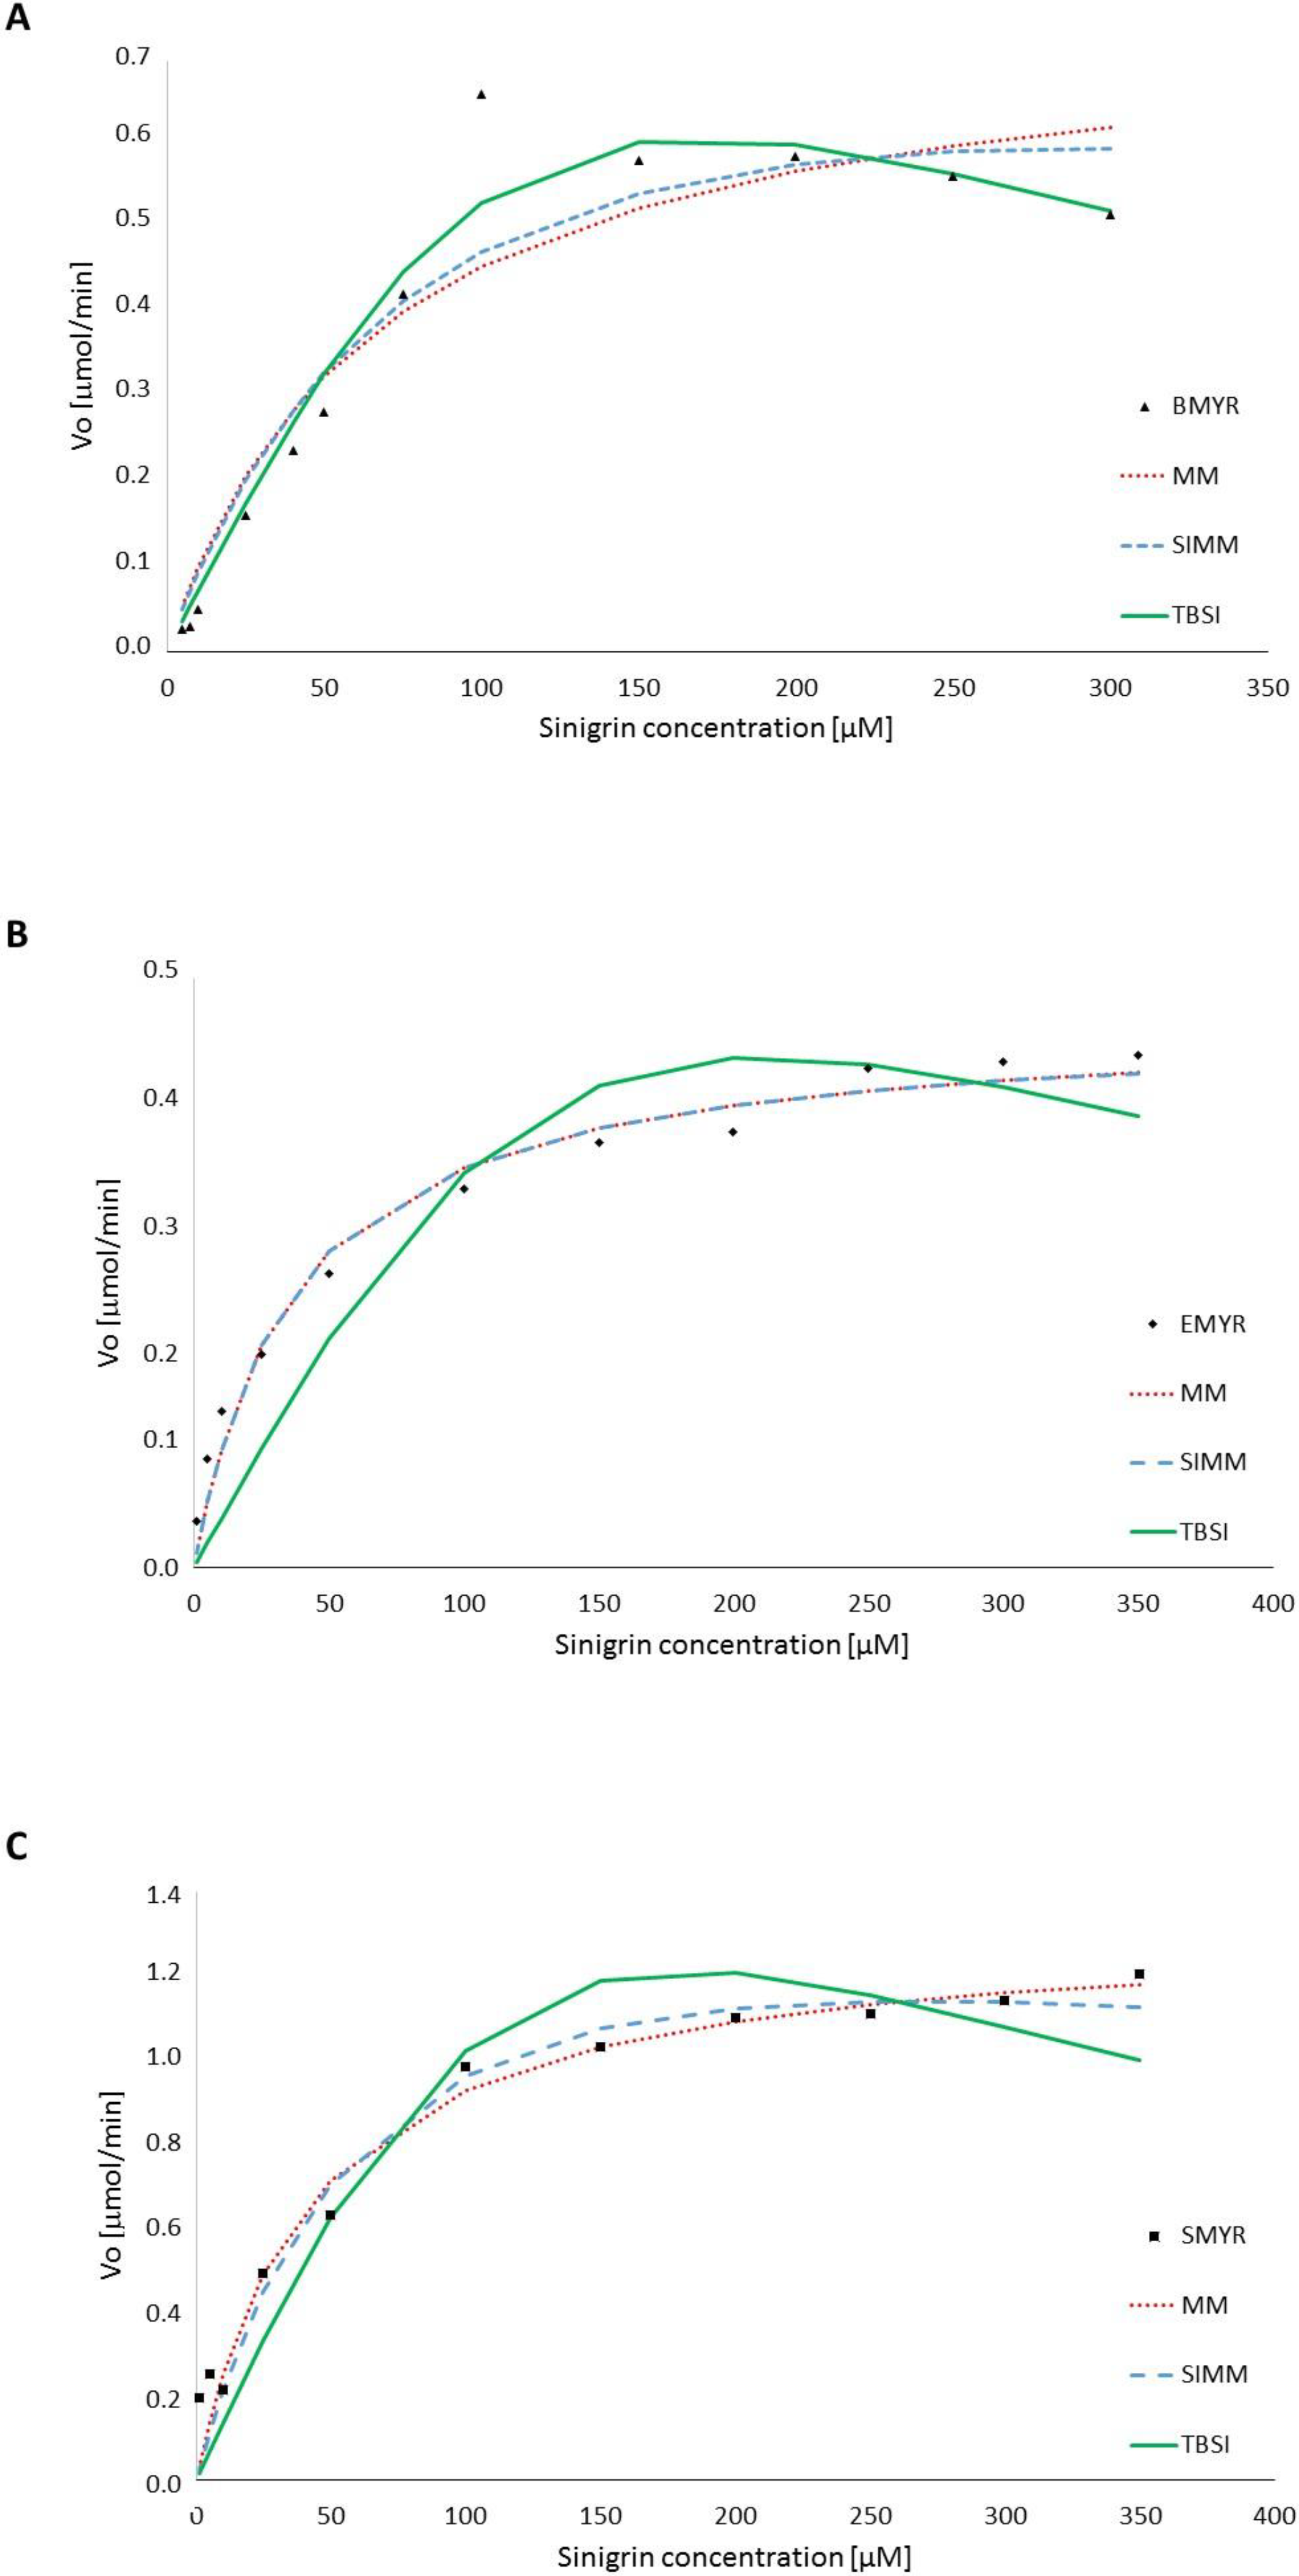
3.1. Enzyme Kinetics in Terms of Substrate Concentration

Enzyme kinetics of the three myrosinases were adjusted to MM (Equation (1)), MM with substrate inhibition (SIMM) (Equation (2)), and two-binding-site inhibition models (TBSI) (Equation (3)). The fit quality was evaluated through the determination coefficient (R2) and root-mean-squared deviation (RMSE). Figure 2 shows the adjustment of the three models to wild-type (Figure 2A), recombinant in E. coli (Figure 2B), and recombinant in S. cerevisiae (Figure 2C) myrosinase kinetics on sinigrin. Table 1 shows the adjusted parameters of each model. MM model gave the best fit to EMYR kinetics, with R2 = 99.1%, agreeing with the lowest RMSE (equal to 0.02) and a correlation between predicted and experimental of 0.995. SIMM gave the best fit to SMYR kinetics, with R2 = 99.0%, RMSE = 0.08, and a correlation between predicted and experimental of 0.993. Finally, the TBSI model adjusted the best to BMYR kinetics (R2 = 98.4% and RMSE = 0.05), with a correlation between predicted and experimental of 0.998.
Wild-type broccoli myrosinase (BMYR) exhibited its maximum activity at 100 mM sinigrin, with a marked decrease afterward (Figure 2A). This is indicative of substrate inhibition; thus, the MM model did not represent adequately this behavior. SIMM model indicated that Km < Ki confirmed substrate inhibition. However, the SIMM model did not agree with the curve shape, suggesting that the kinetic mechanism of BMYR is not subjected to non-competitive inhibition. TBSI best represented kinetic behavior, showing the highest R2 and the lowest RMSE. This agrees with the results reported by [20], who demonstrated that BMYR has two substrate-binding sites—one catalytic and the other regulatory, according to the TBSI mechanism (Figure 1C). Moreover, in this adjustment, Ki is higher than Ks, suggesting that substrate molecules have access to both binding sites. In this model, α values above 1 result in a bell-shaped profile, and β between 0 and 1 are associated with substrate inhibition [28].
Recombinant broccoli myrosinase produced in E. coli (EMYR) showed a MM behavior without inhibition, as seen in Figure 2B. The MM model gave the highest R2 and the lowest RMSE (Table 1). Kinetic parameters Vmax and Km estimated with MM and SIMM models were the same (0.42 mmol/min and 0.04 µM), and Ki from the SIMM model was significantly higher than substrate concentration, making the term [ S 2 ] K i negligible and, thus, demonstrated that there is no substrate inhibition. The TBSI model did not adjust well to the kinetic data since concentrations above 100 µM did not reduce activity. Accordingly, EMYR was not subjected to substrate inhibition.
Recombinant broccoli myrosinase produced in S. cerevisiae (SMYR) exhibited a substrate inhibition behavior (Figure 2C). This agrees with the results of [16], who expressed Brassica napus myrosinase in S. cerevisiae and found substrate inhibition, but the authors did not report kinetic parameters. The reaction rate of SMYR decreased at sinigrin concentrations above 100 µM, but this decrease was slighter than in BMYR. The parameter Km estimated using the SIMM model was lower than that estimated with the MM model, indicating a lower affinity of sinigrin to the enzyme. Ki was equal to that of BMYR (1.01 M), and Ki was higher than Km, agreeing with the kinetic mechanism of non-competitive substrate inhibition shown in Figure 1B. Adjustment to the TBSI model resulted in β = 0.11 within the limits reported by [28] to reflect substrate inhibition. The parameter α was higher than 1 but considerably lower than that estimated for BMYR, suggesting a lower binding affinity of the second substrate molecule. In addition, the affinity of sinigrin for the catalytic site was significantly higher than for the inhibitory site (Ks < Ki). In addition, considering that the SIMM model gave the highest R2 (99%), SMYR most likely followed non-competitive inhibition kinetics.
From these results, it is revealed that BMYR and SMYR are subjected to substrate inhibition, while EMYR is not. The different kinetics can be associated with structural differences attributable to possible glycosylation of the enzymes produced in eukaryotic organisms. Glycosylation affects protein folding and consequently the thermodynamic properties of the molecule [36]. Glycosylation stabilizes protein structure and limits the structural dynamics of the enzymes, thus affecting enzymatic kinetics [37]. BMYR is a glycosylated protein, and its biological unit is a homotrimer [13]. Therefore, its regulation mechanisms are more complex than in monomeric and non-glycosylated enzymes. EMYR is not glycosylated and shows no inhibitory behavior; then, it is most likely that glycosylation plays a crucial role in myrosinase regulation. Table 2 shows the kinetic parameters Km and Vmax estimated for different myrosinases assuming the Michaelis–Menten behavior. EMYR showed lower Km and Vmax than those reported for the other myrosinases, suggesting a higher affinity for sinigrin and the lowest catalytic efficiency. This is most likely related to the absence of glycosylations in this case.

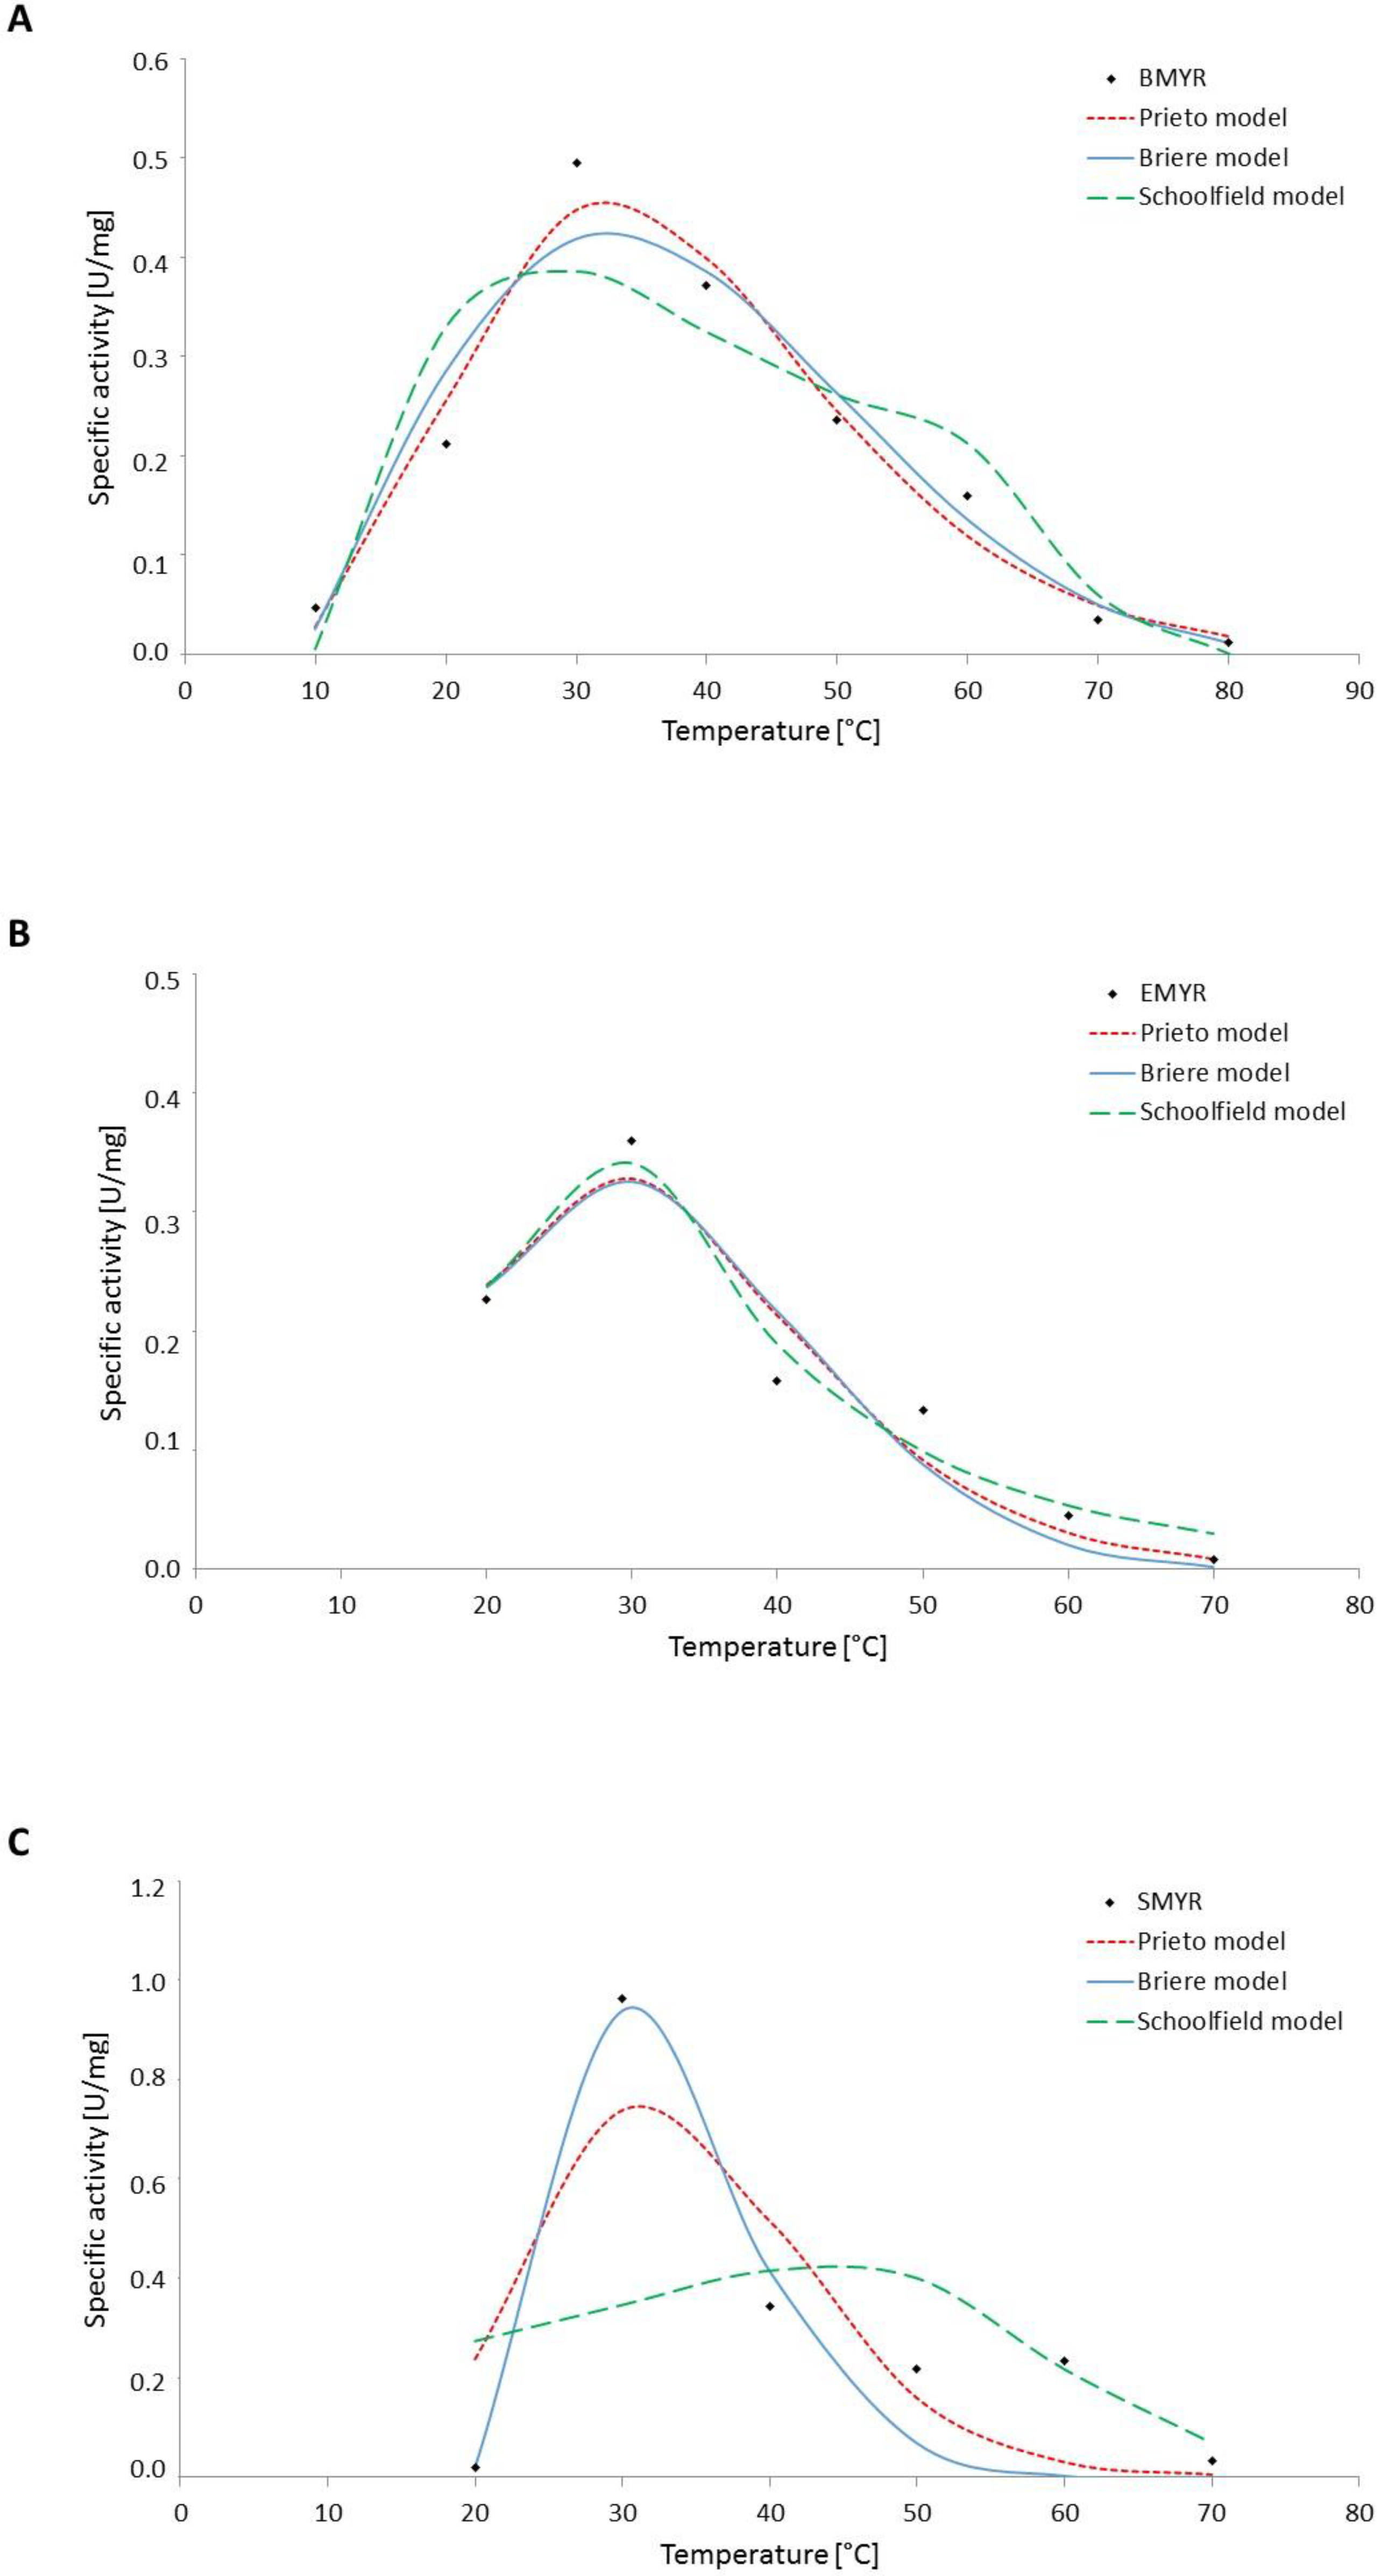
3.2. Effect of Temperature on Myrosinase Kinetics

Figure 3 shows the adjustment of the models of Prieto [31] (Equation (5)), Briere [32] (Equation (6)), and Schoolfield [34] (Equation (7)), and Table 3 shows the respective parameters and statistic. BMYR, EMYR, and SMYR showed different levels of thermal stability; BMYR remained active up to 80 °C, while EMYR and SMYR were almost inactive at 70 °C. All myrosinases were similar in having maximum activity at 30 °C. Activity dependence on temperature followed a bell-shaped curve, agreeing with the results reported by [12]. Activity increase below the optimum temperature is related to the decrease in Ea induced by temperature, while the decrease in activity above this temperature is associated with conformational changes in the protein structure that affect the interaction with the substrate. The Prieto model adequately adjusted the experimental data of BMYR and EMYR, with R2 equal to 98.6% and 96.3%, respectively. The best correlation between experimental and predicted values by the Prieto model was r = 0.963, for EMYR. The model showed a poorer fit to the SMYR data (R2 = 84.8%). The Briere model gave R2 higher than 95% for the three myrosinases, with the wild type showing the highest R2 (97.1%) and correlation between experimental and predicted (r = 0.971). This model was developed to describe the growth rate of insects in terms of temperature and resulted in adequate data to describe enzyme activity. These models allow the estimation of the temperatures that completely activate (Tmax) and inactivate (Tmin) the enzyme. When applying the criteria of [32] to enzyme kinetics, the parameter “m” represents the thermal stability of the enzyme; “m” below 2 indicates thermostability, and values above 2 are associated with thermolability. BMYR, EMYR, and SMYR showed “m” below 2, confirming the thermostability of the myrosinases family.
Adjustment of the Schoolfield model required estimating maximum and minimum temperatures to calculate T1/2L and T1/2H, as shown in Equations (13) and (14). Tmax and Tmin were calculated from the Briere model.
T 1 / 2 L = T o p T m i n 2 + T m i n
T 1 / 2 H = T m a x T o p 2 + T m a x
The Schoolfield model gave the highest R2 (R2 = 99.0%) and the best correlation between experimental and predicted values (r = 0.990) for BMYR, while for EMYR and SMYR, these values were 94.0% and 92.2%, respectively. However, the Schoolfield model adopted a similar shape in the case of BMYR and SMYR, showing a slight shoulder around 60 °C. This was not markedly observed for EMYR, probably because EMYR is a monomer and has no glycosylations. Román et al. [20] found that BMYR is heterotrimeric and that both the trimer and the monomer exhibit myrosinase activity. It is possible that monomer and trimer have different kinetic properties and, therefore, behave differently relative to temperature, resulting in a biased bell-shaped curve.
The inactivation enthalpies (ΔHH, ΔHL, and ΔHA) for SMYR were significantly higher than those obtained for BMYR and EMYR, indicating a higher thermostability in the range of 10–30 °C. This suggests structural differences between BMYR and EMYR.
The thermal activation energies (Ea below optimum temperature; between 10 and 30 °C in this case) for the increase in myrosinases’ activity were estimated based on Equation (4) (Table 4). The thermal activation Ea of SMYR was significantly lower than those obtained for BMYR and EMYR, agreeing with the highest inactivation enthalpies obtained from Equation (9). The thermal activation Ea agreed with maximum reaction velocities, with EMYR showing the minimum Vmax (0.44 mmol/min) and the highest Ea (−34.1 kJ/mol), and SMYR showing the maximum Vmax (1.2 mmol/min) and the lowest Ea (−288.1 kJ/mol). In this temperature range (10–30 °C), the increase in activity follows an increment in the number of collisions between enzyme and substrate molecules since, at these temperatures, the enzyme keeps its native structure conformation.
In the temperature range of 30–70 °C, myrosinases decreased their activity most likely due to conformational changes that lead to partial unfolding reducing the affinity for the substrate and weakening its interaction with the enzyme. Table 4 shows the activity at 60 and 70 °C and the inactivation Ea (Ea at temperatures above 30 °C, between 30 and 70 °C in this case) for the three myrosinases. The highest inactivation Ea was observed for EMYR, agreeing with the lowest activity at 60 and 70 °C, suggesting that EMYR is more thermolabile than BMYR and SMYR. BMYR showed the highest thermal stability associated with the highest activity at 60 and 70 °C and the lowest inactivation Ea. The inactivation Ea represents the energy necessary for the hydrolysis of sinigrin at a temperature above the optimum (30 °C); therefore, a high inactivation Ea reflects that the energy necessary to occur the hydrolysis is higher and then the reaction rate is lower. This different behavior of myrosinases regarding temperature is explained by the absence of glycosylations in EMYR, which probably affect structural stability. Information about thermal inactivation Ea of myrosinases is scarce. Ghawi et al. [42] reported inactivation Ea of green cabbage myrosinase in the range 35–50 °C to be between 52.5 and 66.5 kJ/mol. Mahn et al. [43] found an inactivation Ea of broccoli myrosinase equal to 57.3 kJ/mol, in the range of 25–60 °C, which is very close to the inactivation Ea found for BMYR in this study and in the same order of magnitude of EMYR and SMYR.

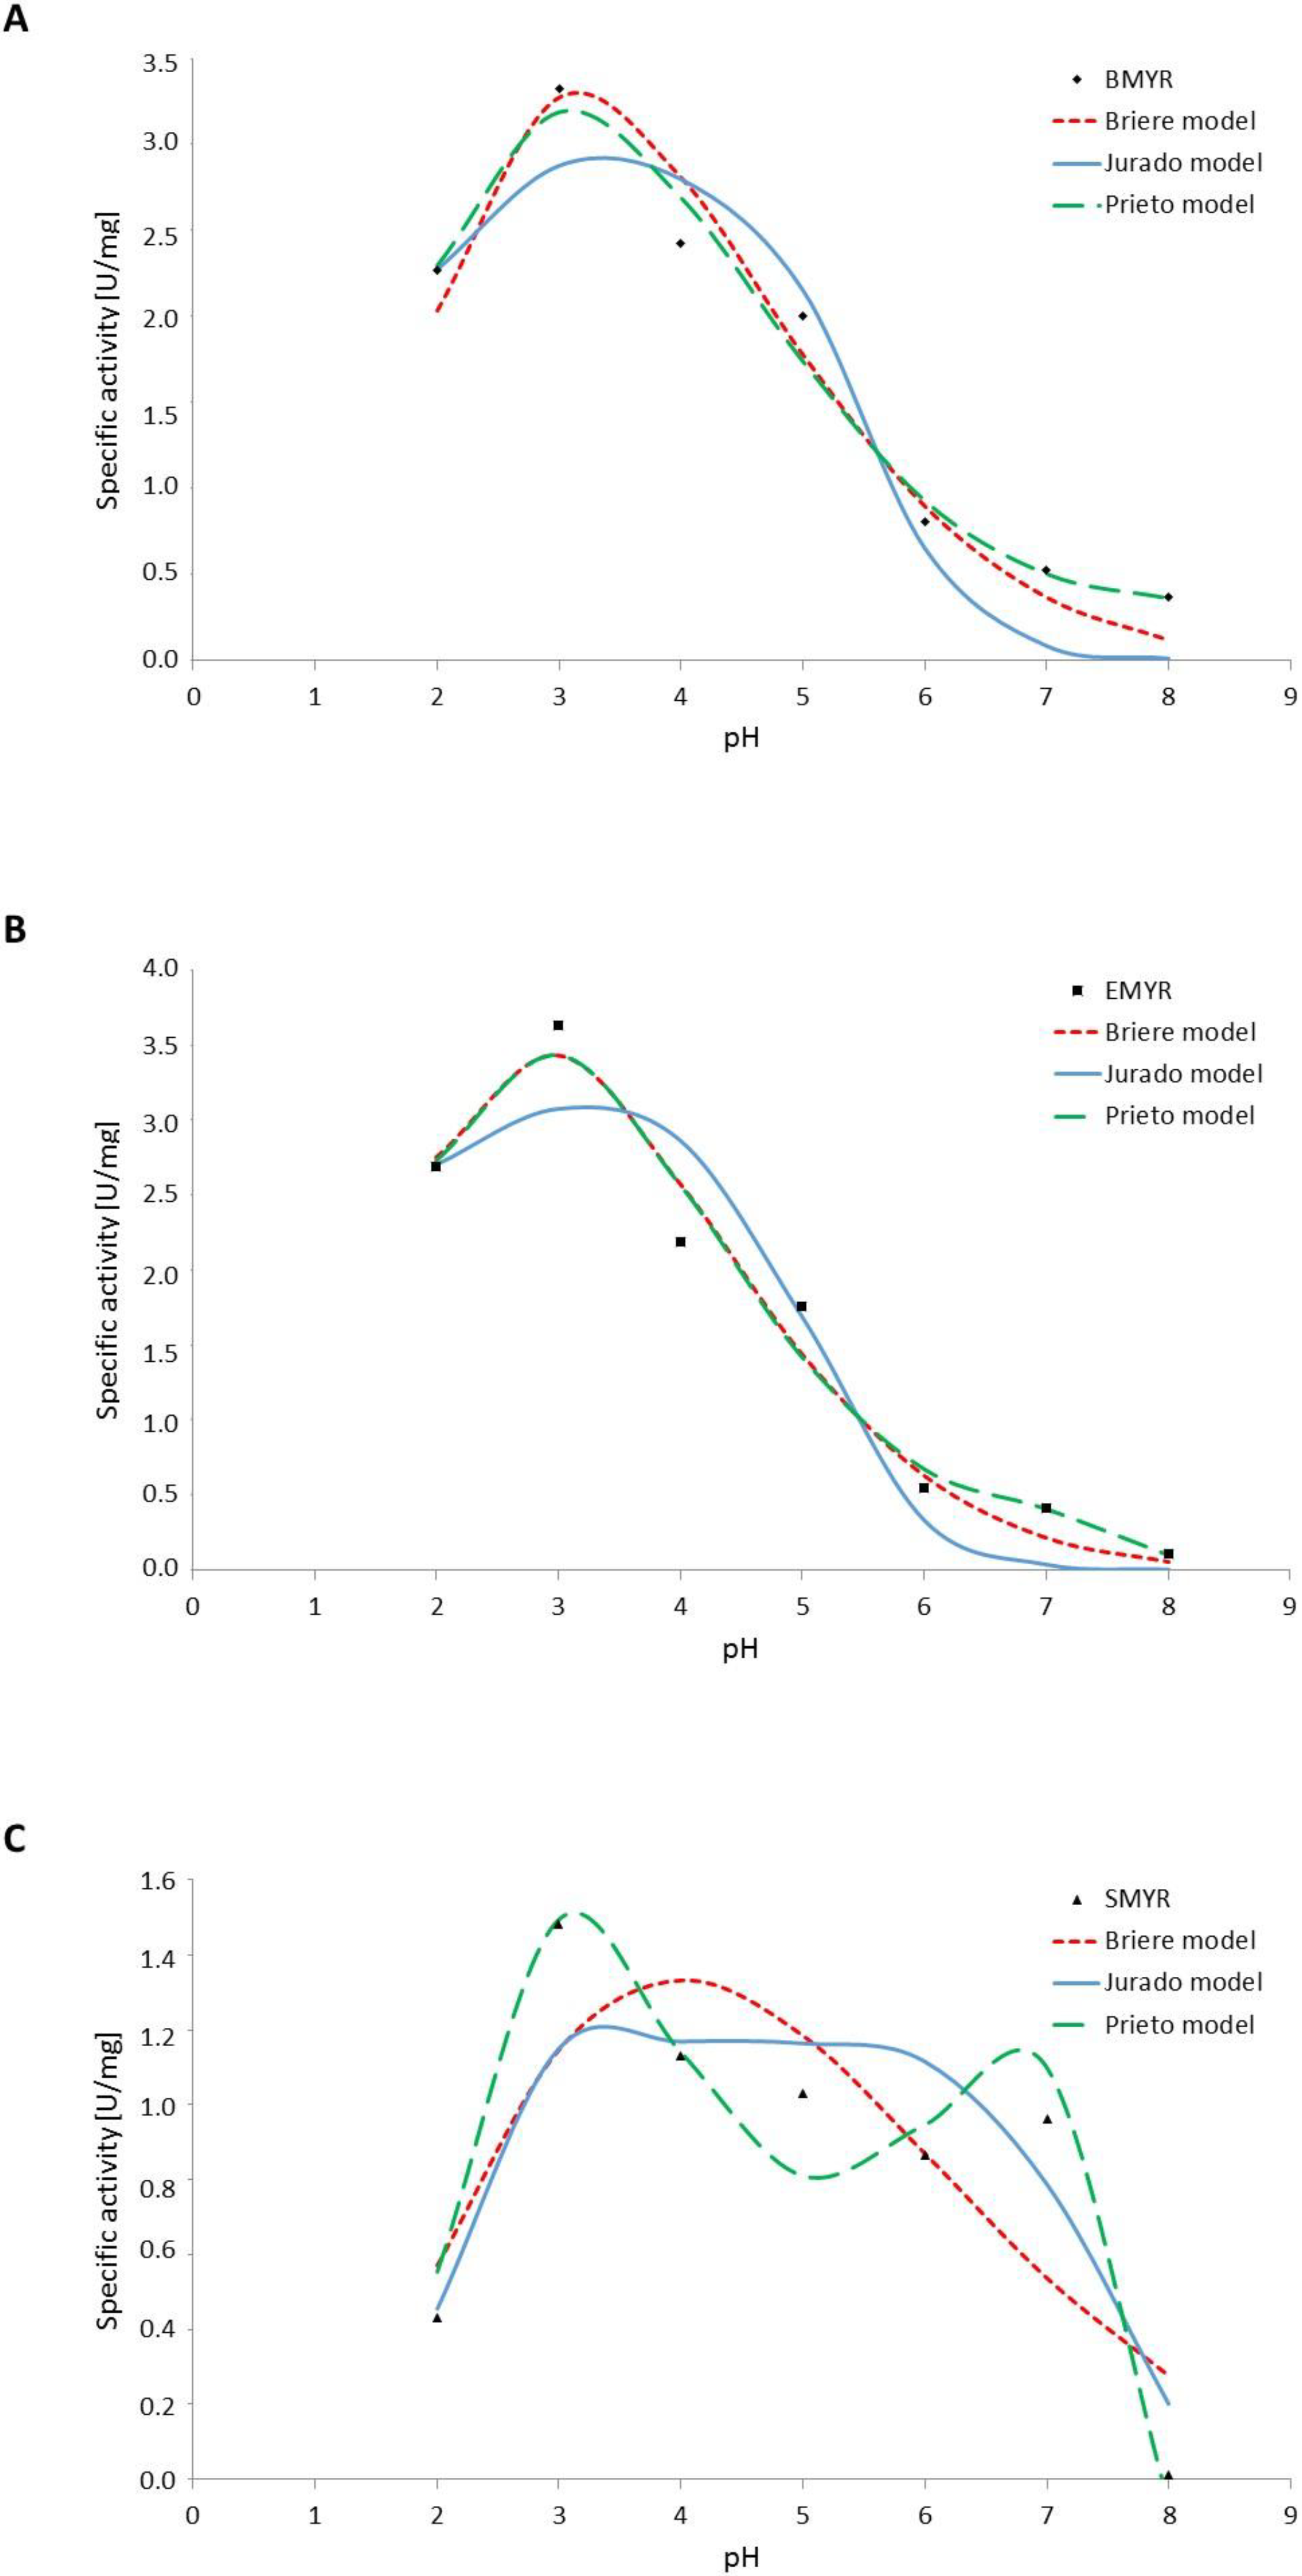
3.3. Effect of pH on Myrosinases Kinetics

The three myrosinases showed maximum activity at pH 3 and were stable at pH between 2 and 8, agreeing with reports about broccoli myrosinases [13,20]. The optimum pH of myrosinases varies according to their origin. For instance, white and red cabbage myrosinases show an optimum pH of 8, whereas wasabi myrosinase has an optimum pH of 7, and white mustard myrosinase has an optimum pH of 4.5 [44].
Figure 4 shows the adjustment of the models of Prieto (Equation (8)), Briere (Equation (9)), and Jurado (Equation (12)) to the experimental data. Table 5 shows the estimated parameters for each model and the statistic. The Briere model resulted in an acceptable fit for BMYR and EMYR but a modest fit for SMYR (R2 = 82.5%). The dependence of SMYR activity on pH differed from that of BMYR and EMYR; in the latter cases, there was only one maximum, but in the SMYR curve, one global and one local maximum appeared. Therefore, the models gave poorer adjustment for SMYR. The Prieto model was able to adequately describe the SMYR curve shape, providing the best fit (R2 = 96.8%) (Figure 4C), and gave a correlation between predicted and experimental of r = 0.968. The different behavior of SMYR on pH may be related to a more complex mechanism generated by the glycosylation pattern that differs from BMYR and that probably results in a different quaternary structure. Even though BMYR is a homotrimer [13], the monomers show catalytic activity [18], which can explain the reason why its activity varies similarly to EMYR at different pH values.
The Jurado model gave an acceptable fit for the three myrosinases (R2 > 90%), and its parameters suggested that myrosinase has two ionizable groups involved in the catalysis. For BMYR and EMYR, at pH below 3, the catalytic nucleophile is ionized, while ionization of the proton donor occurs above pH 3 [29]. The estimated values of pK1 were 3.4, 3.1, and 4.1, for BMYR, EMYR, and SMYR, respectively. The pK2 value obtained for each myrosinase was 5.4, 5.0, and 7.3, respectively. The amino acids that belong to the active site of BMYR are Glu, Cys, and Tyr [20], whose pK values agree with the values estimated by the Jurado model for BMYR and EMYR [45]. The values of pK1 and pK2 of SMYR differed considerably from those obtained for BMYR and EMYR, probably as an effect of a different glycosylation pattern that affects the quaternary structure and accordingly the control mechanism of SMYR activity since proton transfer can be modified by remote surface changes, as reported by [46].
Table 6 shows the specific activity of BMYR, EMYR, and SMYR at 30 °C (optimum temperature) and pH 7.0 and 3.0 (optimum pH). Even though at pH 7.0, SMYR presented the maximum specific activity, at pH 3.0, the maximum activity was observed for EMYR, very close to BMYR. The specific activity of SMYR was 2.5-fold lower than EMYR. This suggests that EMYR would be more attractive for its use in a productive process since, at optimum conditions, it showed the highest specific activity. Additionally, EMYR presents no substrate inhibition, and therefore, fermentation conditions can consider high substrate concentrations in the culture broth, making it possible to use a simple fermentation system. However, producing an industrial enzyme intended for food or pharmaceutical use requires its production in a GRAS microorganism, and E. coli does not meet this criterion. Accordingly, SMYR could be proposed as an industrial enzyme to obtain SFN exogenously due to its less marked substrate inhibition than BMYR, and S. cerevisiae is considered GRAS. Substrate inhibition can represent a hurdle that can be overcome with an adequate fermentation strategy, for instance, fed-batch culture.

4. Material and Methods

4.1. Myrosinase Production and Isolation

Wild-type myrosinase was isolated from broccoli inflorescences, following the protocol of [18]. Recombinant myrosinases were produced in E. coli BL21(DE3)-myr and S. cerevisiae MGY70-myr and purified according to [22]. E. coli BL21(DE3)-myr was grown in LB medium (1% tryptone, 1% yeast extract, 1% sodium chloride) containing 100 µg/mL ampicillin, up to an OD 0.5–0.6 (~4 h) at 600 nm. After this time, 1 mM IPTG was added to the culture medium, and 3 h later, the cells were centrifuged at 4500× g for 5 min at 4 °C. S. cerevisiae MGY70-myr was grown in a YPD medium (1% yeast extract, 2% peptone, 2% glucose, and 1.5% agar) for 16 h at 30 °C. Induction with 1% galactose was made when O.D. at 600 nm was 0.6, for 24 h. Purification of E. coli BL21(DE3)-myr myrosinase was carried out through IMAC using an NTA-Ni column (Novagen, Madison, WI, USA). S. cerevisiae MGY70-myr myrosinase was purified using the EZCatchTM GST-Spin purification Kit (BioVision, Milpitas, CA, USA), following the manufacturer’s instructions.

4.2. Myrosinase Kinetics

Myrosinase activity was determined as described by [43] using sinigrin (Sigma-Aldrich, Schnelldorf, Germany) as substrate. The effect of the substrate was assayed at sinigrin concentrations of 1, 5, 10, 25, 50, 100, 150, 200, 250, 300, and 350 μM; the reaction was conducted at 30 °C and pH 7.0. The effect of temperature was evaluated at 10, 20, 30, 40, 50, 60, 70, and 80 °C, at pH 7.0 (phosphate buffer 33 mM), 100 μM sinigrin, using a thermostatic bath (Stuart, UK), adding 100 μL of protein extract in the reaction mixtures. The effect of pH was determined using different buffer solutions: HCl–KCl (pH 2.0), glycine–HCl (pH 3.0), acetate (pH 4.0 and 5.0), sodium phosphate buffer (pH 6.0 and 7.0), and Tris · HCl (pH 8.0). Activity tests were performed at 30 °C, and 100 μL of protein extract was used in the reaction mixtures. Protein concentration was determined via the bicinchoninic acid (BCA) method using a commercial kit (Sigma-Aldrich, Schnelldorf, Germany). An activity unit (U) was defined as the enzyme amount that hydrolyses 1 μmol of sinigrin per minute. All measurements were obtained in triplicate.

4.3. Modeling

Kinetics dependence on substrate concentration was modeled by adjusting the experimental data to Michaelis–Menten (MM, Equation (1)), Michaelis–Menten with substrate inhibition (SIMM, Equation (2)), and two-binding-site inhibition (TBSI, Equation (3)) models. Temperature dependence was described through the empirical models of Prieto (Equation (5)), Briere (Equation (6)), and the thermodynamic stochastic model of Schoolfield (Equation (7)). Arrhenius equation was used to estimate kinetic constants (k) as a function of temperature (Equation (4)) and estimate activation energies (Ea). The dependence of enzymatic activity on pH was modeled using a 4th-grade polynomial model (Equation (8)), the empirical model of Briere adapted to pH (Equation (9)), and the mechanistic model of Jurado (Equation (12)).
Model adjustment to the experimental data was conducted with the GRG nonlinear solver approach using the Newton method, in Microsoft Excel. Adjustment quality was assessed with root-mean-squared error (RMSE) and determination coefficient (R2).

5. Conclusions

This work presents the first attempt to describe myrosinase kinetics in terms of different reaction conditions. Models developed to describe insect growth kinetics were adapted to enzyme kinetics, obtaining acceptable adjustment to experimental data and allowing some physicochemical interpretation of the underlying mechanisms. The results contribute to defining the most adequate reaction conditions that allow the myrosinase-mediated production of sulforaphane. EMYR showed no substrate inhibition, unlike BMYR and SMYR, probably because of the absence of glycosylations and the monomeric native structure. Both eukaryotic myrosinases were subjected to substrate inhibition but followed different kinetic mechanisms—SMYR followed a non-competitive substrate inhibition mechanism, while BMYR followed a substrate two-binding-site inhibition mechanism. Different glycosylation patterns would explain differences in the dependence of myrosinase activity on pH and temperature. EMYR was more thermolabile than BMYR and SMYR. SMYR showed the lowest thermal activation Ea, agreeing with the highest Vmax. BMYR showed the lowest thermal inactivation Ea, resulting in the most thermostable myrosinase. BMYR and EMYR showed similar behavior in terms of pH, in accordance with their similar pK1 and pK2. Myrosinase produced in E. coli showed the highest potential as an industrial enzyme, given its high specific activity and the absence of substrate inhibition, which would simplify the fermentation strategy in the production process.

Author Contributions

Conceptualization, A.M. and A.J.; methodology, A.J. and A.C.; software, A.J.; validation, A.M. and A.J. formal analysis, A.M.; investigation, A.J., A.C., and A.M.; resources, A.M.; data curation, A.M. and A.J.; writing—original draft preparation, A.J. and A.M.; writing—review and editing, A.M.; visualization, A.J.; supervision, A.M.; project administration, A.M.; funding acquisition, A.M. All authors have read and agreed to the published version of the manuscript.

Funding

This research and the APC were funded by Fondo Nacional de Investigación Científica y Tecnológica FONDECYT, grant number 1201418.

Data Availability Statement

Not applicable.

Conflicts of Interest

The authors declare no conflict of interest.

References

  1. Backenköhler, A.; Eisenschmidt, D.; Schneegans, N.; Strieker, M.; Brandt, W.; Wittstock, U. Iron is a centrally bound cofactor of specifier proteins involved in glucosinolate breakdown. PLoS ONE 2018, 13, e0205755. [Google Scholar] [CrossRef]
  2. Mahn, A.; Castillo, A. Potential of Sulforaphane as a Natural Immune System Enhancer: A Review. Molecules 2021, 26, 752. [Google Scholar] [CrossRef]
  3. Hossain, S.; Liu, Z.; Wood, R.J. Histone deacetylase activity and vitamin D-dependent gene expressions in relation to sulforaphane in human breast cancer cells. J. Food Biochem. 2019, 00, e13114. [Google Scholar] [CrossRef]
  4. Georgikou, C.; Yin, L.; Gladkich, J.; Xiao, X.; Sticht, C.; De la Torre, C.; Gretz, N.; Gross, W.; Schäfer, M.; Karakhanova, S.; et al. Inhibition of miR30a-3p by sulforaphane enhances gap junction intercellular communication in pancreatic cancer. Cancer Lett. 2020, 469, 238–245. [Google Scholar] [CrossRef]
  5. Rosenbergová, Z.; Kántorová, K.; Šimkovic, M.; Breier, A.; Rebros, M. Optimisation of Recombinant Myrosinase Production in Pichia pastoris. Int. J. Mol. Sci. 2021, 22, 3677. [Google Scholar] [CrossRef]
  6. Santín-Márquez, R.; Alarcón-Aguilar, A.; López-Diazguerrero, N.E.; Chondrogianni, N.; Königsberg, M. Sulforaphane-role in aging and neurodegeneration. GeroScience 2019, 41, 655–670. [Google Scholar] [CrossRef]
  7. Zeren, S.; Bayhan, Z.; Kocak, F.E.; Kocak, C.; Akcılar, R.; Bayat, Z.; Simsek, H.; Duzgun, S.A. Gastroprotective effects of sulforaphane and thymoquinone against acetylsalicylic acideinduced gastric ulcer in rats. J. Surg. Res. 2016, 203, 348e359. [Google Scholar] [CrossRef]
  8. Pereyra, K.V.; Andrade, D.C.; Toledo, C.; Schwarz, K.; Uribe-Ojeda, A.; Ríos-Gallardo, A.P.; Mahn, A.; Del Rio, R. Dietary supplementation of a sulforaphane-enriched broccoli extract protects the heart from acute cardiac stress. J. Funct. Foods 2020, 75, 104267. [Google Scholar] [CrossRef]
  9. Sakorn, P.; Rakariyatham, N.; Niamsup, H.; Nongkunsarn, P. Rapid detection of myrosinase-producing fungi: A plate method based on opaque barium sulphate formation. World J. Microbiol. Biotechnol. 2002, 18, 73–74. [Google Scholar] [CrossRef]
  10. Francis, F.; Lognay, G.; Wathelet, J.P.; Haubruge, E. Characterisation of aphid myrosinase and degradation studies of glucosinolates. Arch. Insect Biochem. Physiol. 2002, 50, 173–182. [Google Scholar] [CrossRef]
  11. Hanschen, F.S.; Klopsch, R.; Olivero, T.; Schreiner, M.; Vverkerk, R.; Dekker, M. Optimizing isothiocyanate formation during enzymatic glucosinolate breakdown by adjusting pH value, temperature and dilution in Brassica vegetables and Arabidopsis thaliana. Sci. Rep. 2017, 7, 40807. [Google Scholar] [CrossRef] [PubMed]
  12. Bhat, R.; Vyas, D. Myrosinase: Insights on structural, catalytic, regulatory, and environmental interactions. Crit. Rev. Biotechnol. 2019, 39, 508–523. [Google Scholar] [CrossRef] [PubMed]
  13. Mahn, A.; Angulo, A.; Cabañas, F. Purification and Characterization of Broccoli (Brassica oleracea var. italica) Myrosinase (β-Thioglucosidase Glucohydrolase). J. Agric. Food Chem. 2014, 62, 11666–11671. [Google Scholar] [CrossRef] [PubMed]
  14. Bellostas, N.; Petersen, I.L.; Sorensen, J.C.; Sorensen, H. A fast and gentle method for the isolation of myrosinase complexes from Brassicaceous seeds. J. Biochem. Biophys. Met. 2008, 70, 918–925. [Google Scholar] [CrossRef]
  15. Šamec, D.; Redovnikovic, I.R.; Salopek-Sondi, B. Comparative analysis of phytochemicals and activity of endogenous enzymes associated with their stability, bioavailability and food quality in five Brassicaceae sprouts. Food Chem. 2018, 269, 96–102. [Google Scholar] [CrossRef] [PubMed]
  16. Chen, S.; Halkier, B.A. Functional Expression and Characterization of the Myrosinase MYR1 from Brassica napus in Saccharomyces cerevisiae. Protein Expr. Purif. 1999, 17, 414–420. [Google Scholar] [CrossRef]
  17. Härtel, F.V.; Brandt, A. Characterization of a Brassica napus Myrosinase Expressed and Secreted by Pichia pastoris. Protein Expr. Purif. 2002, 24, 221–226. [Google Scholar] [CrossRef]
  18. Husebye, H.; Arzt, S.; Burmeister, W.P.; Hartel, F.W.; Brandt, A.; Rossiter, J.T.; Bones, A. Crystal structure at 1.1 A resolution of an insect myrosinase from Brevicoryne brassicae shows its close relationship to b-glucosidases. Insect Biochem. Mol. Biol. 2005, 35, 1311–1320. [Google Scholar] [CrossRef]
  19. Burmeister, W.P.; Cottaz, S.; Driguez, H.; Iori, R.; Palmieri, S.; Henrissat, B. The crystal structures of Sinapis alba myrosinase and a covalent glycosyl–enzyme intermediate provide insights into the substrate recognition and active-site machinery of an S-glycosidase. Structure 1997, 5, 663–676. [Google Scholar] [CrossRef] [Green Version]
  20. Román, J.; Castillo, A.; Cottet, L.; Mahn, A. Kinetic and structural study of broccoli myrosinase and its interaction with different glucosinolates. Food Chem. 2018, 254, 87–94. [Google Scholar] [CrossRef]
  21. Román, J.; Castillo, A.; Cottet, L.; Mahn, A. Molecular modeling of broccoli myrosinase and its interaction with different ligands. Chem. Eng. Trans. 2018, 64, 373–378. [Google Scholar]
  22. Curiqueo, C.; Mahn, A.; Castillo, A. Broccoli myrosinase expression in Escherichia coli and Saccharomyces cerevisiae. Biomolecules 2022, 12, 233. [Google Scholar] [CrossRef]
  23. Bernardi, R.; Finiguerra, M.G.; Rossi, A.A.; Palmieri, S. Isolation and Biochemical Characterization of a Basic Myrosinase from Ripe Crambe abyssinica Seeds, Highly Specific for epi-Progoitrin. J. Agric. Food Chem. 2003, 51, 2737–2744. [Google Scholar] [CrossRef] [PubMed]
  24. Vastenhout, K.J.; Tornberg, R.H.; Johnson, A.L.; Amolins, M.W.; Mays, J.R. HPLC-Based Method to Evaluate Kinetics of Glucosinolate Hydrolysis by Sinapis alba Myrosinase. Anal. Biochem. 2014, 465, 105–113. [Google Scholar] [CrossRef] [Green Version]
  25. Pardini, A.; Tamasi, G.; De Rocco, F.; Bonechi, C.; Consumi, M.; Leone, G.; Magnani, A.; Rossi, C. Kinetics of glucosinolate hydrolysis by myrosinase in Brassicaceae tissues: A high-performance liquid chromatography approach. Food Chem. 2021, 355, 129634. [Google Scholar] [CrossRef]
  26. Korzekwa, K.R.; Krishnamachary, N.; Shou, M.; Ogai, A.; Parise, R.A.; Rettie, A.E.; Gonzalez, F.J.; Tracy, T.S. Evaluation of atypical cytochrome P450 kinetics with two-substrate models: Evidence that multiple substrates can simultaneously bind to cytochrome P450 active sites. Biochemistry 1998, 37, 4137–4147. [Google Scholar] [CrossRef]
  27. Wu, B. Substrate inhibition kinetics in drug metabolism reactions. Drug Metab. Rev. 2011, 43, 440–456. [Google Scholar] [CrossRef] [PubMed]
  28. Lin, Y.; Lu, P.; Tang, C.; Mei, Q.; Sandig, G.; Rodrigues, A.D.; Rushmore, T.H.; Shou, M. Substrate Inhibition Kinetics for Cytochrome P450-Catalyzed Reactions. Drug Metab. Dispos. 2001, 29, 368. [Google Scholar]
  29. Kambiré, M.S.; Gnanwa, J.M.; Boa, D.; Kouadio, E.J.P.; Kouamé, L.P. Modeling of enzymatic activity of free β-glucosidase from palm weevil, Rhynchophorus palmarum Linn. (Coleoptera: Curculionidae) larvae: Effects of pH and temperature. Biophys. Chem. 2021, 276, 106611. [Google Scholar] [CrossRef]
  30. Al-Turki, A.I.; Dock, W.A. Myrosinase Activity in Soil. Soil Sci. Soc. Am. J. 2003, 67, 139–145. [Google Scholar] [CrossRef]
  31. Prieto, M.A.; Vázquez, J.A.; Murado, M.A. Comparison of several mathematical models for describing the joint effect of temperature and ph on glucanex activity. Biotechnol. Prog. 2011, 28, 372–381. [Google Scholar] [CrossRef] [PubMed] [Green Version]
  32. Briere, J.-F.; Pracros, P.; Le Roux, A.-Y.; Pierre, J.-S. A Novel Rate Model of Temperature-Dependent Development for Arthropods. Environ. Entomol. 1999, 28, 22–29. [Google Scholar] [CrossRef]
  33. Sharpe, P.J.H.; Schoolfield, R.M.; Butler, G.D. Distribution Model of Heliothis Zea (Lepidoptera: Noctuidae) Development Times. Can. Entomol. 1981, 113, 845–856. [Google Scholar] [CrossRef]
  34. Schoolfield, R.M.; Sharpe, P.J.H.; Magnuson, C.E. Non-linear regression of biological temperature-dependent rate models based on absolute reaction-rate theory. J. Theor. Biol. 1981, 88, 719–731. [Google Scholar] [CrossRef]
  35. Jurado, E.; Camacho, F.; Luzón, G.; Vicaria, J.M. Kinetic models of activity for β-galactosidases: Influence of pH, ionic concentration and temperature. Enzyme Microb. Technol. 2004, 34, 33–40. [Google Scholar] [CrossRef]
  36. Mitra, N.; Sinha, S.; Ramya, T.N.C.; Surolia, A. N-linked oligosaccharides as outfitters for glycoprotein folding, form and function. Trends Biochem. Sci. 2006, 31, 156–163. [Google Scholar] [CrossRef]
  37. Lee, H.S.; Qi, Y.; Im, W. Effects of N-glycosylation on protein conformation and dynamics: Protein Data Bank analysis and molecular dynamics simulation study. Sci. Rep. 2015, 5, 8926. [Google Scholar] [CrossRef]
  38. Ning, H.; Zhang, J.-M.; Li, D.-Q.; Wang, M.; Sun, X.-P.; Zhu, Y.J.; Meijer, J.; Wang, Q.-H. Characterization of a Novel β-thioglucosidase CpTGG1 in Carica papaya and its Substrate-dependent and Ascorbic Acid-independent O-β-glucosidase Activity. J. Integr. Plant Biol. 2010, 52, 879–890. [Google Scholar] [CrossRef]
  39. Wang, M.; Li, D.; Sun, X.; Zhu, Y.J.; Nong, H.; Zhang, J. Characterization of a root-specific β-thioglucoside glucohydrolase gene in Carica papaya and its recombinant protein expressed in Pichia pastoris. Plant Sci. 2009, 177, 716–723. [Google Scholar] [CrossRef]
  40. Andersson, D.; Chakrabarty, R.; Bejai, S.; Zhang, J.; Rask, L.; Meijer, J. Myrosinases from root and leaves of Arabidopsis thaliana have different catalytic properties. Phytochemistry 2009, 70, 1345–1354. [Google Scholar] [CrossRef]
  41. Li, X.; Kushad, M.M. Purification and characterization of myrosinase from horseradish (Armoracia rusticana) roots. Plant Physiol. Biochem. 2005, 43, 503–511. [Google Scholar] [CrossRef] [PubMed]
  42. Ghawi, S.K.; Methven, L.; Rastall, R.A.; Niranjan, K. Thermal and high hydrostatic pressure inactivation of myrosinase from green cabbage: A kinetic study. Food Chem. 2012, 131, 1240–1247. [Google Scholar] [CrossRef]
  43. Mahn, A.; Quintero, J.; Castillo, N.; Comett, R. Effect of Ultrasound-Assisted Blanching on Myrosinase Activity and Sulforaphane Content in Broccoli Florets. Catalysts 2020, 10, 616. [Google Scholar] [CrossRef]
  44. Van Eylen, D.; Oey, I.; Hendrickx, M.; Van Loey, A. Behavior of mustard seed (Sinapis alba L.) myrosinase during temperature/pressure treatments: A case study on enzyme activity and stability. Eur. Food Res. Technol. 2008, 226, 545–553. [Google Scholar] [CrossRef]
  45. Pace, C.N.; Grimsley, G.R.; Scholtz, J.M. Protein Ionizable Groups: pK Values and Their Contribution to Protein Stability and Solubility. J. Biol. Chem. 2009, 284, 13285–13289. [Google Scholar] [CrossRef] [Green Version]
  46. Kohen, A.; Jonsson, T.; Klinman, J.P. Effects of Protein Glycosylation on Catalysis:  Changes in Hydrogen Tunneling and Enthalpy of Activation in the Glucose Oxidase Reaction. Biochemistry 1997, 36, 2603–2611. [Google Scholar] [CrossRef]
Figure 1. Mechanisms of enzymatic kinetics described using the models in this study: (A) Michaelis–Menten; (B) Michaelis–Menten with substrate inhibition; (C) two-binding site inhibition model. E · S indicates the complex with the substrate attached to the catalytic site; S · E denotes the substrate attached to the inhibitor site; (D) mechanism of pH effect on the enzyme with two dissociable groups where the individually protonated enzyme–substrate complex is catalytically active [29].
Catalysts 12 00683 g001
Figure 2. Adjustment of Michaelis–Menten (MM), Michaelis–Menten with substrate inhibition (SIMM), and two-binding-site inhibition model (TBSI) models to kinetics of (A) BMYR, (B) EMYR, and (C) SMYR.
Catalysts 12 00683 g002
Figure 3. Adjustment of Prieto, Briere, and Schoolfield models to kinetic data of (A) BMYR, (B) EMYR, and (C) SMYR. Reactions were conducted at pH 7.0 and 100 μM sinigrin.
Catalysts 12 00683 g003
Figure 4. Adjustment of the pH-dependent models of Prieto, Briere, and Jurado models to kinetic data of (A) BMYR, (B) EMYR, and (C) SMYR.
Catalysts 12 00683 g004
Table 1. Estimation of kinetic parameters of myrosinase.
ModelSourceKinetic Parameters
Vmax (µmol/min)Km (µM)Ks (µM)Ki (M)βαR2 (%)RMSE
MM
(Equation (1))
BMYR0.760.07----94.70.08
EMYR0.420.04----99.10.02
SMYR1.330.04----98.90.07
SIMM
(Equation (2))
BMYR0.960.09-1.01--96.00.07
EMYR0.420.04-160.00--99.10.02
SMYR1.750.07-1.01--99.00.08
TBSI
(Equation (3))
BMYR143.02-19.8888.580.1050.9398.40.05
EMYR124.46-33.6862.000.1093.4397.20.05
SMYR65.184-4.8387.480.1114.1397.60.14
Table 2. Michaelis–Menten kinetic parameters of different β-thioglucosidases using sinigrin as substrate.
GeneSourceExpression SystemKm
(mM)
Vmax
(μmol/min)
Reference
CpTGG1Carica papayaP. pastoris 2.8359.9[38]
CpTGG2Carica papayaP. pastoris 2.2424.3[39]
TGG4Arabidopsis thalianaP. pastoris0.2512.2[40]
TGG5Arabidopsis thalianaP. pastoris0.5548.1[40]
TGG1Arabidopsis thalianaP. pastoris0.052.30[40]
Myr1Brassica napusP. pastoris1.0015.0[17]
MyrArmoracia rusticana-0.130.62[41]
MyrBrassica oleracea-0.070.76[20]
MyrBrassica oleraceaE. coli0.040.42[22]
MyrBrassica oleraceaS. cerevisiae0.041.33[22]
Table 3. Adjustment of temperature-dependent models to myrosinase kinetics.
ModelSourceParameters
Prieto
(Equation (5))
nab R2 (%)RMSE
BMYR5.762.83 × 10−70.17 98.60.03
EMYR6.351.19 × 10−70.22 96.30.04
SMYR12.722.05 × 10−80.40 84.80.16
Briere
(Equation (6))
αmTmin (°C)Tmax (°C)
BMYR8.0 × 10−60.188104 97.10.04
EMYR2.0 × 10−60.161287 95.80.09
SMYR1.4 × 10−10.141973 95.80.06
Schoolfield
(Equation (7))
∆H_H
(KJ/mol)
∆H_L
(KJ/mol)
∆H_A
(KJ/mol)
n25 (d−1)T1/2_L
(°C)
T1/2_H
(°C)
BMYR93.46182.3419.290.2619.4567.4899.00.06
EMYR127.8562.8014.670.2617.5035.5794.00.09
SMYR251.21523.3541.870.8222.0037.0092.20.14
Table 4. Estimation of activation and inactivation Ea using Arrhenius equation (Equation (4)).
EnzymeEa (kJ/mol) Activation (10–30 °C)Vmax (30 °C) (µmol/min)R2 (%)Ea (kJ/mol) Inactivation (30–70 °C)V (60 °C) (µmol/min)V (70 °C) (µmol/min)R2 (%)
EMYR−34.10.4486.676.10.04 ± 0.000.01 ± 0.0089.3
BMYR−83.50.6597.052.80.18 ± 0.010.07 ± 0.0192.6
SMYR−288.11.2088.972.20.16 ± 0.030.04 ± 0.0298.4
Table 5. Adjustment of pH-dependent models to myrosinase kinetics.
ModelSourceParameters
Briere
(Equation (8))
α (×106)mpH_minpH_max R2RMSE
BMYR9.56 × 10−61.0 · 10−1115 98.30.24
EMYR4.84 × 10−51.0 · 10−1114 98.50.24
SMYR1.3 × 10−11.7 · 10−1114 82.50.27
Jurado
(Equation (12))
Vmax (U/mg)pkES1pkES2
BMYR2.903.45.5 97.20.34
EMYR3.103.15.1 96.00.40
SMYR1.174.27.3 90.80.21
Prieto
(Equation (9))
b0b2b22b33b44
BMYR−9.1310.65−3.130.36−0.0198.80.17
EMYR−11.5914.12−4.510.57−0.0398.50.23
SMYR−14.9815.64−5.270.74−0.0496.80.13
Table 6. Specific activity of myrosinases at optimum temperature and different pH values.
Specific Activity at 30° (U/mg)
pH 7.0pH 3.0
BMYR0.503.30
EMYR0.383.60
SMYR1.001.45
Publisher’s Note: MDPI stays neutral with regard to jurisdictional claims in published maps and institutional affiliations.

