1. Introduction
Global oil consumption reached an estimated 99 million barrels per day in 2015, and it is projected to reach 116 million by 2030. In addition, it is expected that energy demands will increase by 50% in 2030 relative to 2011 [
1,
2]. Among the potential renewable oil/energy sources, biodiesel production from waste feedstocks and other low-cost materials can play an important role in reducing the global energy demand because of its environment-friendly and renewable properties [
3].
Fatty acid methyl ester (FAME) is a monoalkyl (typically ethyl or methyl) ester of long-chain fatty acids (FAs) derived from different sources of triglycerides [
1]. Alkaline transesterification is one of the most common and attractive chemical processes to produce biodiesel because of its low cost and simplicity (associated with the operational conditions and cost of reagents), and it is widely accepted [
4,
5]. However, the homogeneous alkaline catalysis process cannot be applied to materials with a high free fatty acid (FFA) content because of soap formation, which affects the viability of the process from technical and economical points of view [
6].
By avoiding soap formation [
7], hydroesterification represents a new alternative for the production of esters when raw materials with high water and FFA contents are used [
8]. FAME production at high yields might be conducted via hydroesterification of feedstocks by hydrolysis of the oil feedstock in the first step and esterification of the FFA produced in the second step, which takes advantage of all the lipids present [
9]. The high purity of the glycerol produced might also be seen as a significant advantage of this reaction since products can be readily used for further processing. This happens because the impurities and problems associated with the traditional process are related to the homogeneous catalyst reaction.
Recently, the use of enzymes as an effective biocatalyst has been seen as an emerging contribution for biodiesel production since they tolerate high FFA and water contents, require mild reaction conditions, and allow reuse of the catalyst, which shows versatility to catalyse hydrolysis, esterification, and transesterification with minimal wastewater treatment and downstream processing requirements [
10].
The chemical and physical properties of biodiesel are correlated to the properties of their corresponding feedstocks. The FFA content of feedstocks is frequently quantified to verify their viability for biodiesel production while taking into account traditionally employed processes. FAME content represents product purity, which is an important parameter to control biodiesel quality and illegal admixtures of other substances (e.g., fossil diesel).
The acid value (AV) is typically expressed by the KOH required (in mg) to neutralize the FFA contained in 1 g of oil (EN ISO 660). AV determination by titration depends on visual identification of the end point requiring substantial personnel time, a variety of analytical setups and glassware, as well as an accurate preparation of reagents. It uses solvents, such as diethyl ether, which is sensitive to carbon dioxide contamination from the atmosphere [
11]. Among the methods developed for consistent determination of FAME, gas chromatography (GC) with flame ionization detection (GC-FID) represents the most widely used approach. GC analysis is laborious and time consuming, presents high costs associated with gas consumption and energy, and involves utilization of hazardous chemicals during sample preparation and analysis [
12].
The use of noninvasive and chemical-free methods, such as Fourier transform infrared (FT-IR or FTIR), Fourier transform mid-infrared (FT-MIR), and Fourier transform near-infrared (FT-NIR) spectroscopies, for the determination of physical and chemical properties of edible oils and fats have been developed [
13]. In situ FTIR spectroscopy allows the identification of the changes in functional groups as the catalyst is heated and catalysing reaction(s) occur. FTIR spectroscopy analysis seems, therefore, to be a suitable technique for hydroesterification studies in order to gain an understanding of the mechanism of oil hydrolysis and FFA esterification [
8].
Given the drawbacks in using edible oils—such as limited sources, high costs, and competition with food resources—low-cost feedstocks, such as acid oil from soapstock and olive pomace oil, might be used to reduce the production costs of biodiesel and to increase food sustainability. Soapstock results from the neutralization of raw vegetable oils in order to reduce the FFA content, which is generated at a rate of 6% of the volume of the crude oil produced [
14]. This dark fraction generally contains about 50% of water with the balance made up of FFA; phosphoacylglycerols; mono-, di-, and triglycerides; pigments; and other minor nonpolar components [
15,
16]. Acid oil is obtained by acidulation of soapstocks in the presence of sulfuric acid [
17]. Olive pomace is a solid by-product from olive oil processing, usually containing pulp, skin, stones, and oil [
18]. From the traditional olive press process, Bayram et al. [
19] indicates that the processing of 1 tonne of olives leads to around 400 kg of solid waste (olive pomace), 200 kg of olive oil, and 600 kg of wastewater containing residual solids and oil. Moya et al. [
18] specifies the following average composition of the olive pomace: 49% of moisture and volatile matter, 24% of oil, and 27% of solid content. In Portugal, the olive production forecast for 2017 was around 858 thousand tonnes, which was almost twice the 2016 production (around 476 thousand tonnes) [
20].
Although FTIR application for monitoring FFA and FAME contents is not new [
6,
9,
10,
11], the research done has focused on edible oils. Taking into account the heterogeneity of wastes and by-products as well as the possible matrix effects on the obtained results, the study of such analytical process to alternative raw materials seems of high interest.
The present study focused on biodiesel production and monitoring using low-cost feedstocks (acid oil from soapstock of vegetable oil refining and olive pomace oil) and a commercial lipase as biocatalyst in a hydroesterification process. To evaluate the progression of the reactions, the FFA and FAME contents of the feedstocks were monitored using FTIR, and the method was calibrated with titrimetric and GC methods to establish a more simple and effective technique to control the process.
2. Results and Discussion
2.1. Characterization of Feedstocks
The acid oil from soapstock used in this work had 34 ± 1 wt.% FFA. Different FFA contents have been reported for soapstocks with values ranging from 41% to 65%. Bayram et al. [
19] studied a soybean acid oil with 59.3 wt.% of FFA, 28.0 wt.% of triglycerides, 4.4 wt.% of diglycerides, and less than 1% of monoglycerides. Su and Wei [
21] reported a soapstock oil containing around 41 wt.% of FFA, whereas Chiplunkar and Pratap [
22] studied an acid oil from soapstock of sunflower oil refining with 65% of FFA. The low value obtained in the present work resulted possibly from sampling in a different season of the year (where differences are frequently found in the acid value of the raw oil that is going to be refined) or due to variations in the process used to produce the acid oil from soapstock (by-product of refining), namely different mineral acid dosings (conventionally it is added to break the soaps). Olive pomace is reported in the literature as having a high content of oil and water depending upon the extraction process used to obtain the olive oil [
18,
23]. In the present work, the following results were obtained: 15 ± 2 wt.% of lipid content and a moisture content of 31 ± 1 wt.%. The lipid content result shows the recovery potential of this by-product in its recovery for biodiesel production. In terms of by-product management, the high moisture in olive pomace affects the costs of transport and also promotes its degradation. The FFA value in the olive pomace oil was 45 wt.%, much higher than that reported by Rajaeifar et al. [
24] who studied an olive pomace oil with 5.75 wt.% of FFA. Cruz et al. [
9] also reported an olive pomace oil with 2 wt.% FFA that was extracted from fresh olive pomace. The high acid value obtained may be attributed to the extraction of oil from olive pomace after ten months of by-product storage in the air at room temperature; such results show the relevance of storage practices in recovering by-products and wastes.
2.2. Calibration
Preliminary calibrations were performed using oleic acid as standard. However, the results showed a minimum error of 20% relative to the real values, which was too high to be considered adequate for calibration and revealed possible matrix effects. Thus, calibrations were made with the real matrixes.
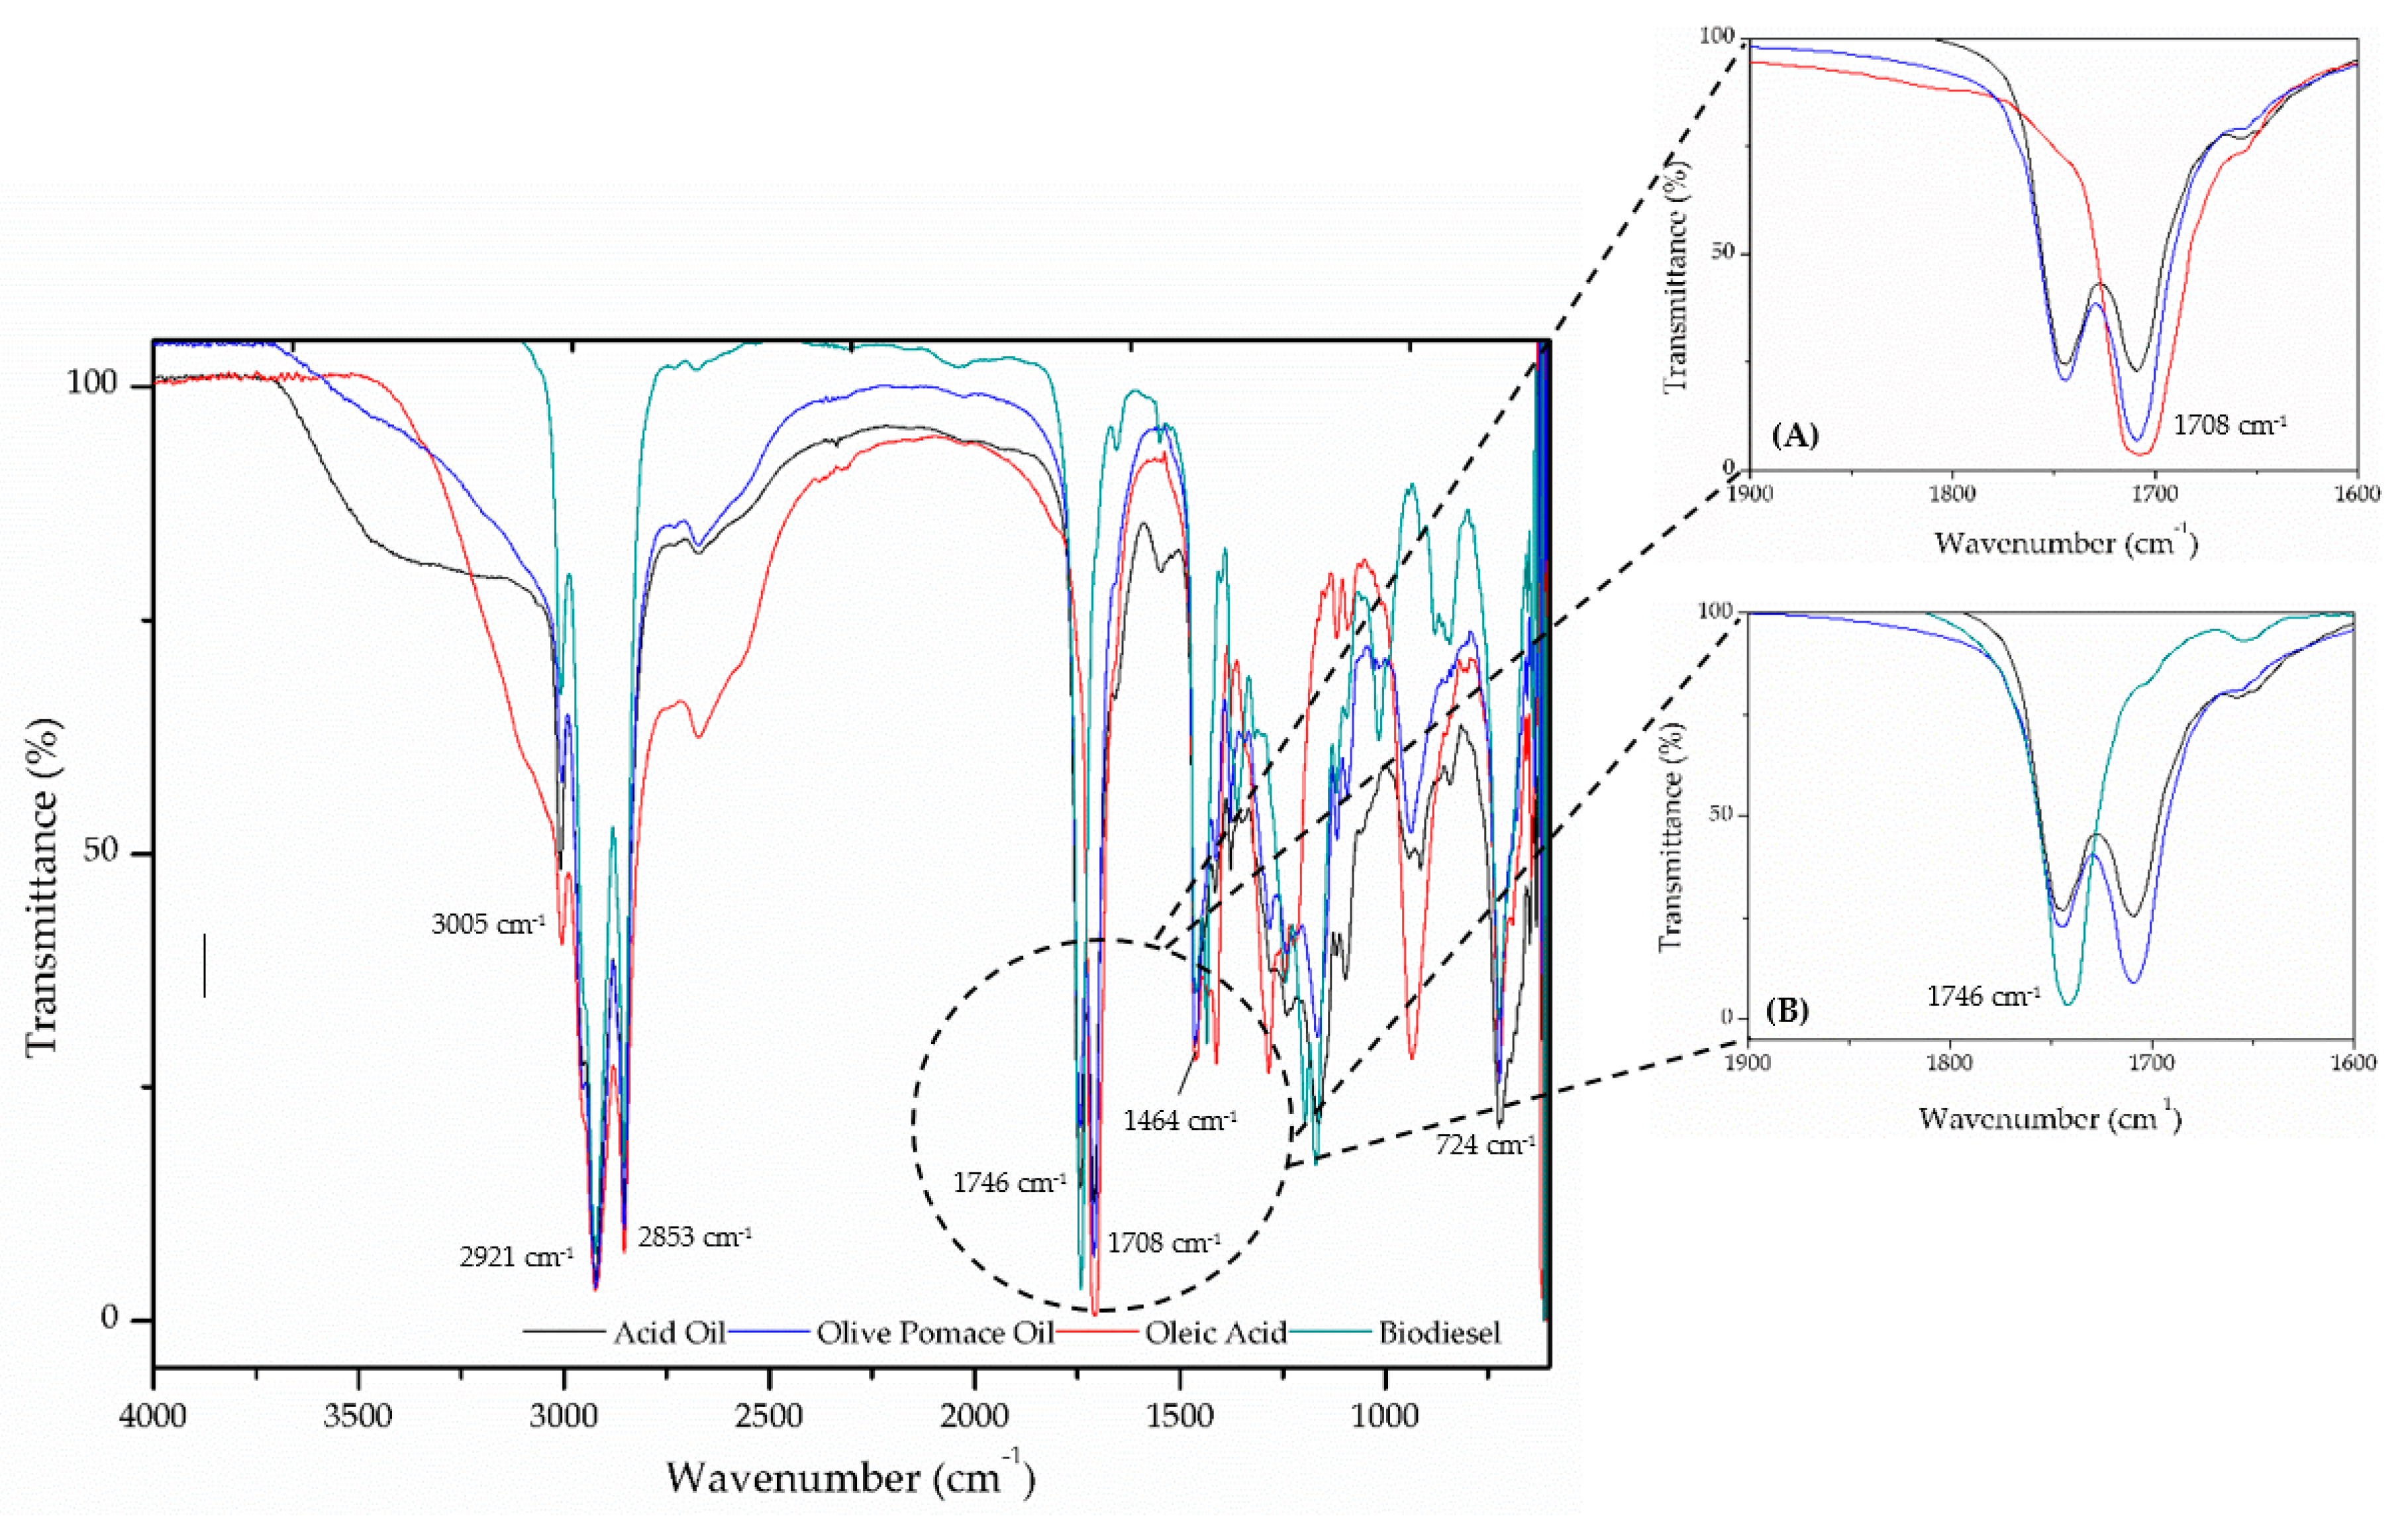
Figure 1 presents an FTIR spectra with the two feedstocks (acid oil from soapstock and olive pomace oil) having the FTIR-ATR reference spectrum of the oleic acid as well as a biodiesel standard.
The matching regions are identified in
Figure 1: (i) the CH stretching vibration of the cis-double bond (=CH) was observed at 3005 cm
−1; (ii) the CH
3 and CH
2 asymmetric stretching vibrations were found in the region of 2921 and 2853 cm
−1, respectively; and (iii) the CH absorption of bending vibrations CH
2 and CH
3 bands were clearly seen in the region of 1465 cm
−1, while the band at 723 cm
−1 was assigned to a CH
2 [
25,
26].
Hydroesterification occurred in two steps. Firstly, the glycerides (e.g., triglycerides to FFA and glycerol) were hydrolysed, and then the FFAs were esterified using an alcohol to produce biodiesel (esters) and water. Thus, the FFA and FAME related functional groups might be identified in the FTIR spectra. The FTIR spectra revealed some significant variations in the region of 1750–1690 cm
−1. Mahesar et al. [
25] and Shah et al. [
27] identified the bands at 1746 cm
−1 and 1708 cm
−1 were from the triglyceride ester carbonyl absorption and the C=O absorption of FFA, respectively.
The major differences in the FTIR spectra of FFA (
Figure 1A) were observed at 1708 cm
−1, which corresponded to the (C=O) band in carboxylic acids. Dong et al. [
28] established a linear equation for FFA determination in rapeseed and coconut oil by using the band of the FTIR spectra at 1711 cm
−1 relative to a baseline established at 1600 cm
−1 (1711 cm
−1/1600 cm
−1).
In the FTIR spectra of FAME (
Figure 1B), a band at 1746 cm
−1 was evidenced that corresponded to the C=O band in esters. Peaks that were attributed to the stretching of C=O (typical of esters and, thus, were common in both FAME and refined oil spectra) were observed in the region 1800–1700 cm
−1 [
29]. Muik et al. [
30] identified from FT-Raman spectra of olive pomace that the major bands of virgin olive oil were seen at 1267 cm
–1 (=C–H), deformation in unconjugated cis double bond, 1302 cm
–1 (in-phase methylene twisting motion), 1442 cm
–1 (CH
2), 1655 cm
–1 (C=C), 1747 cm
–1 (ν(C=O)), 2852 cm
–1 (CH
2), and 2900 cm
–1 (CH
3).
2.3. Acid Oil Hydroesterification
Figure 2 presents the spectra obtained when different concentrations of FAME were evaluated by measuring samples produced through hydroesterification of the acid oil from soapstock.
Figure 2A shows results from the hydrolysis reaction, whereas
Figure 2B shows the results obtained during the esterification reaction.
Results showed a linear spectral response for an FFA range of 35–83% and for a FAME range of 29–94%. Linear regression equations were produced considering the absorbance values, the referred properties, and by adopting different baselines as described in
Section 3. The results are presented in
Table 1.
The influence of different baselines as well as the use of peak height vs. the ratio between peak height and height of a reference peak were studied. For acid oil hydrolysis, the use of the ratio (CH2 reference peak 2853 cm−1) showed better results, expressed by a higher determination coefficient (R2 ≥ 0.995). However, for esterification, the results were different; calibration showed better results using only one peak. In all cases, better fits were obtained when one fixed point was used (one base) as the baseline.
Yu et al. [
31] and Dong et al. [
28] evaluated the direct determination of FFA by the FTIR method in edible oils using the 1711 cm
−1 wavenumber relative to a single baseline at 1600 cm
−1, and both reached adequate linear adjustments for calibration. Aryee et al. [
32] measured absorbance of the carboxylate band, ν(COO−), at 1573 cm
−1 relative to a single baseline at 1820 cm
−1 for FTIR determination of free fatty acids in fish oil, and they achieved a correlation coefficient of about 0.999.
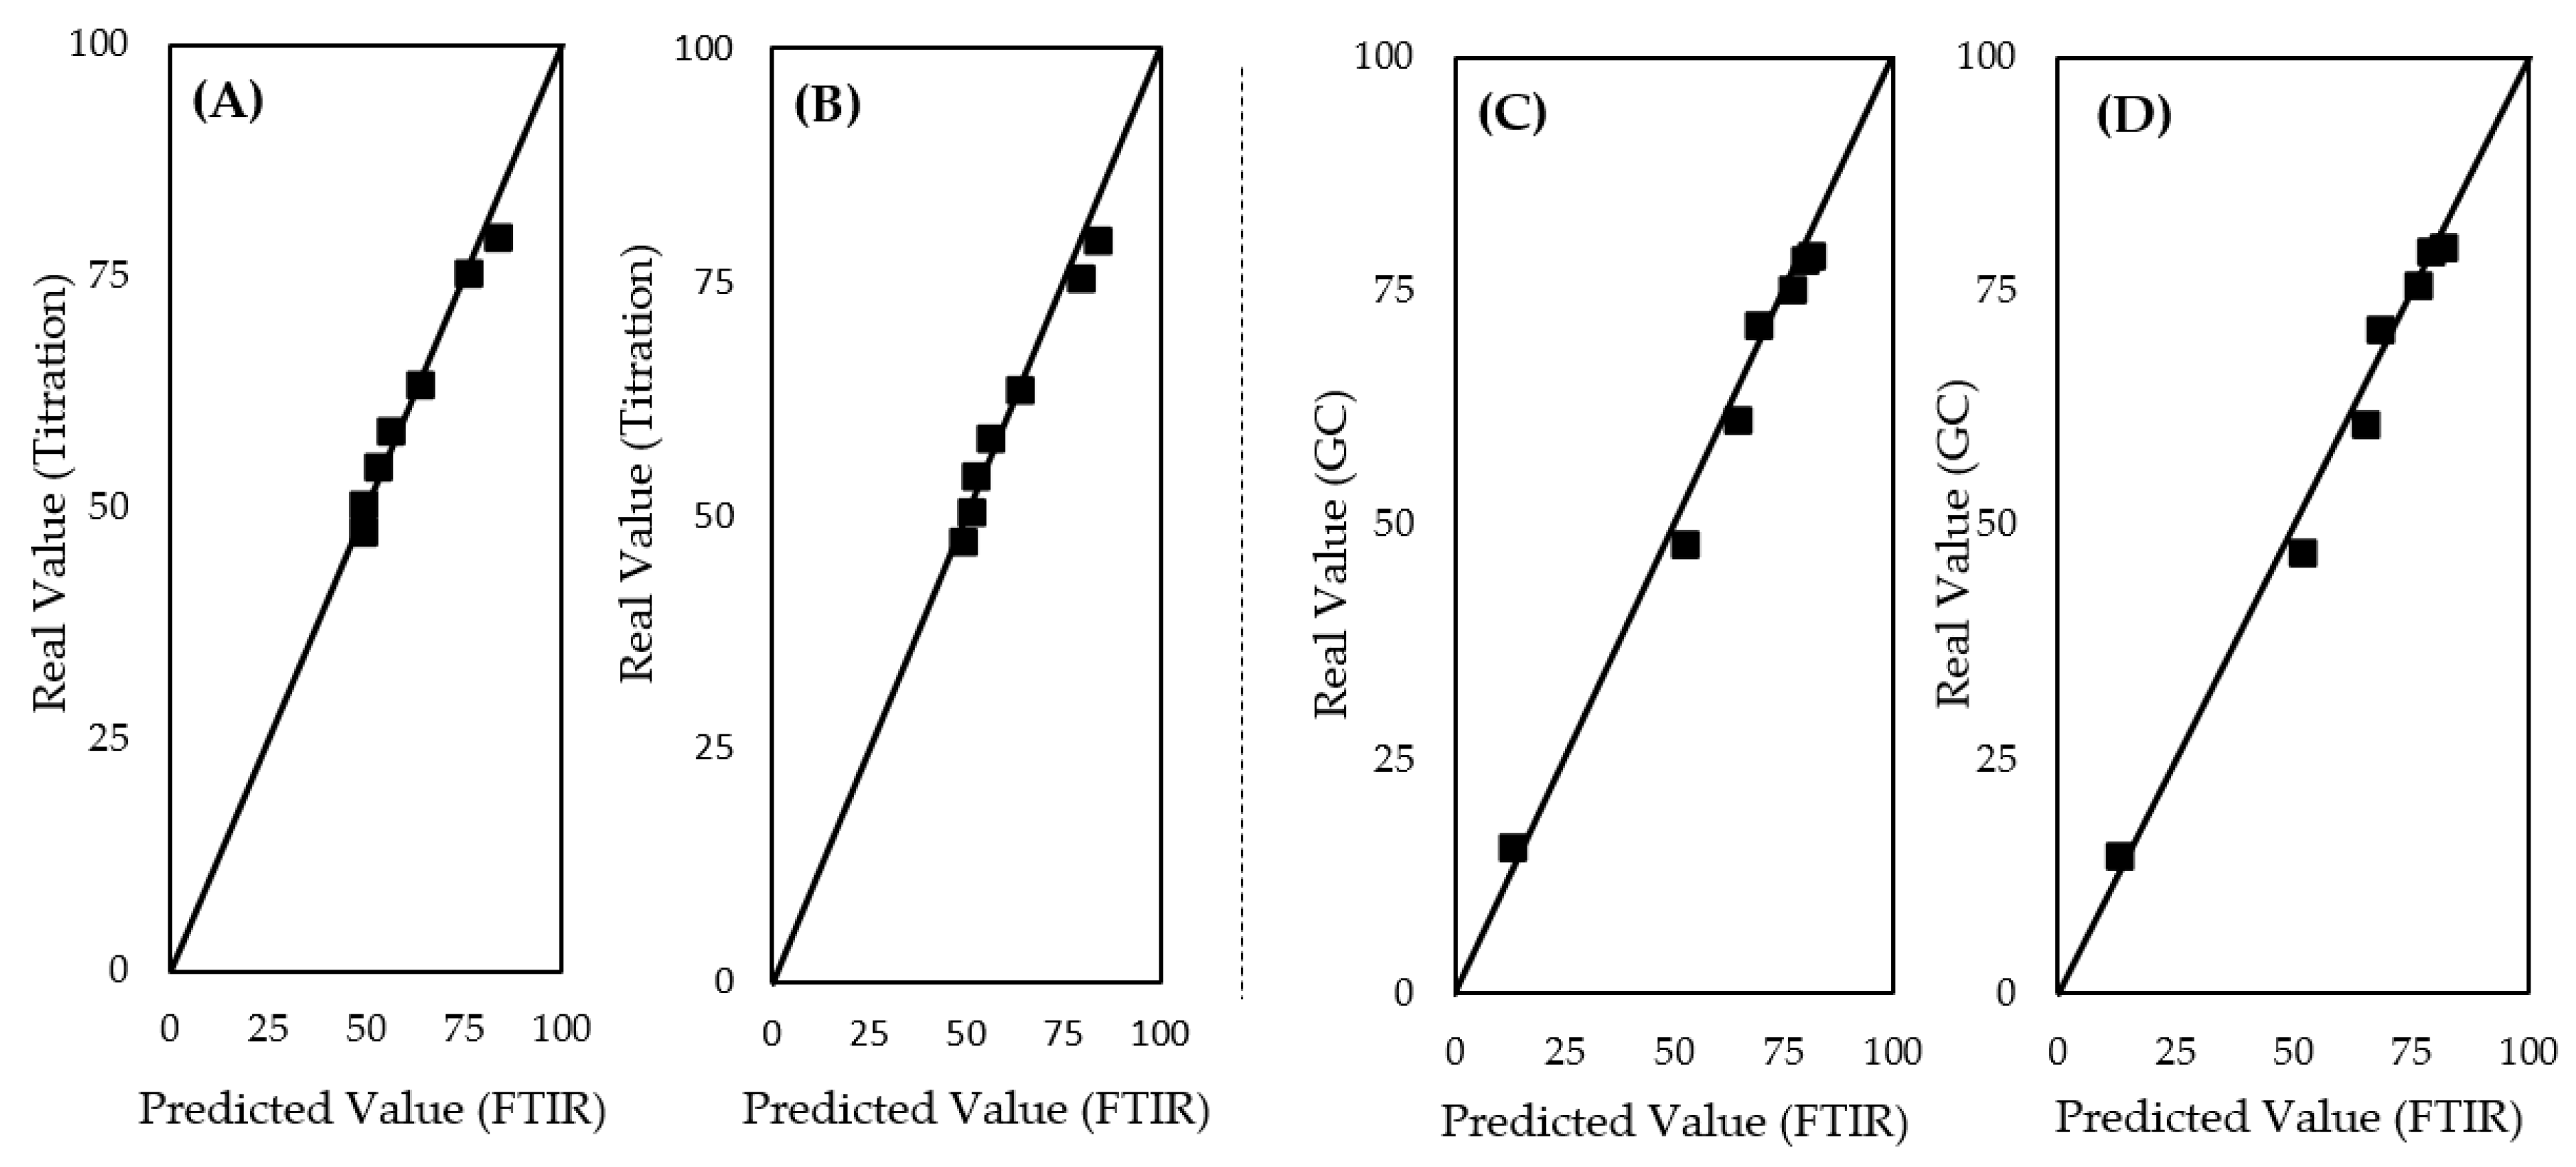
To assess the accuracy of the method, an additional hydroesterification reaction was performed with acid oil from soapstock. Both hydrolysed and esterified acid oil from soapstock were analysed in triplicate by FTIR; FFA and FAME contents were obtained using calibration lines. The results obtained were compared with the FFA and FAME percentages obtained through the best calibration equations reached. Real contents of FFA and FAME versus predicted ones are shown in
Figure 3.
Results showed that the established calibration lines were adequate for use. In the worst case, an error of 4.2% was obtained for the acid oil hydrolysis calibration, whereas about 5.6% was obtained for the calibration of the acid oil esterification reaction (error represents the coefficient of variation considering the difference of real values to calibration values of at least three replicates). In conclusion, all calibration equations described, with very reasonable accuracy, the parameters to be measured and, therefore, might be considered suitable for further use.
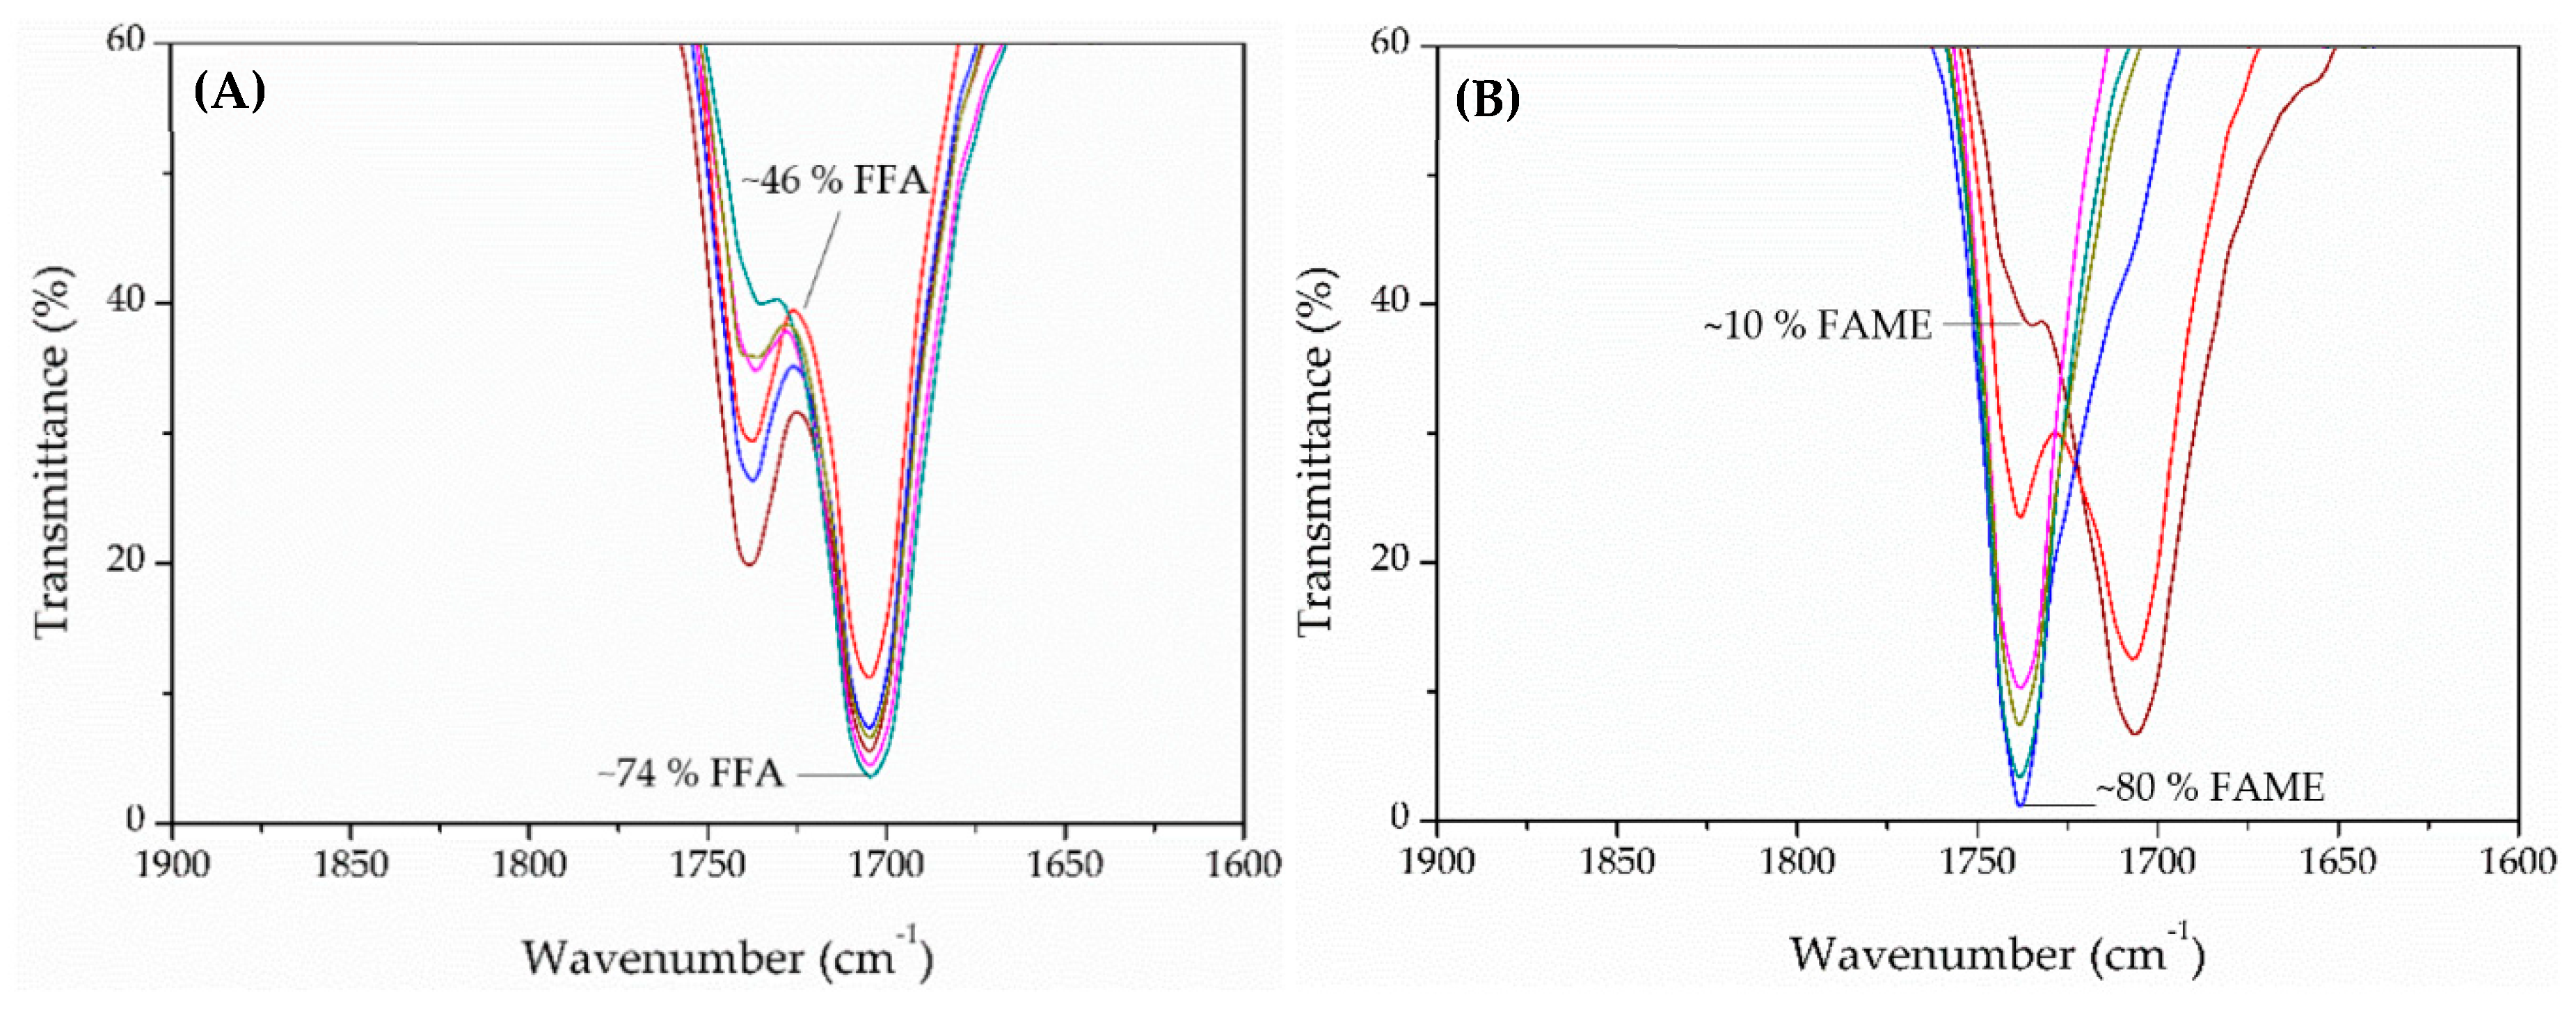
Figure 4 presents spectra obtained during monitoring of olive pomace oil hydroesterification (4A corresponds to hydrolysis and 4B to esterification reactions). These results showed that a linear spectral response was obtained over an FFA range of 46–74% and a FAME range of 10–80%.
Table 2 shows linear regression equations obtained for olive pomace oil hydroesterification with different absorbance values when adopting different baselines described in
Section 3. Similar to the acid oil, in olive pomace oil hydrolysis, use of the peak ratio (CH
2 reference peak 2853 cm
−1) showed better results (
R2 ≥ 0.995). In the case of esterification monitoring, good results were obtained under both conditions. All calibrations presented very good determination coefficients (
R2 > 0.995) regardless of the baseline.
Rohman [
33] and Muik et al. [
34] evaluated the effect of FFA content in olive oil through FTIR analysis. To study olive oil deterioration, Rohman [
31] established the following wavenumber regions: 1775–1689 and 1480–1050 cm
−1; Muik et al. [
32] built a regression model to determine FFA content by identifying the
ν(C=O) ester vibration and the
ν(C=O) of the carboxylic acid, which corresponded to 1747 and the 1720 cm
−1, respectively.
To assess the accuracy of the method for acid oil, an additional hydroesterification reaction was performed with olive pomace oil. The hydrolysed and esterified olive pomace oils were analysed in triplicate by FTIR using FFA and FAME contents obtained from calibration equations. A plot of the real versus predicted FFA and FAME content is presented in
Figure 5.
Predictions obtained for pomace olive oil were good for FFA and not so good for FAME. In the worst scenario, there was an error of 2.4% for hydrolysis and about 12.7% for esterification validation (error represents the coefficient of variation considering the difference of real values to calibration values of at least three replicates). In that way, for hydrolysis monitoring, both calibration equations were adequate for further analysis. Contrarily, the best option for esterification was the equation Abs (FTIR) = 0.0162 × %FAME + 0.2159 obtained using a ratio peak height 1742 cm−1/2853 cm−1 and one base.
Overall, FTIR spectroscopy seemed to be a rapid and easy technique to follow the progression of lipid hydrolysis into FFA and FAME by further esterification of FFA (hydroesterification). Although a good linearity was achieved for calibration equations for both substrates, the validation process for the olive pomace oil proved to be more unstable, probably because of matrix effects, justifying the relevance of performing such specific evaluations for different raw materials. The methods developed should also be studied in the future using other raw materials.
3. Materials and Methods
3.1. Reagents and Materials
The acid oil from soapstock of vegetable oil refining (mixture of seeds) was provided by Nature Light, Braga, Portugal, S.A. Olive pomace was supplied by DouroSol, Vila Real, Portugal, an olive oil enterprise of Northern Portugal. Petroleum ether (LabChem ≥ 90%) was used for oil extraction (soxhlet). Methanol (Fischer Scientific ≥ 99%) was used as the acyl acceptor. The catalyst used was the lipase from Thermomyces lanuginosus (Lipolase 100 L, activity ≥ 100,000 U/g) purchased from Sigma-Aldrich, St. Louis, MO, USA. All other reagents used were of analytical grade.
Reference standards used for the identification of FFA and FAME in the FTIR-ATR spectrum were oleic acid (Alfa Aesar, tech. 90%, Kandel, Germany) and Biodiesel certified European Reference Material from Sigma-Aldrich, Geel, Belgium (FAME content of 98.9 wt.%).
3.2. Free Fatty Acid Content and Methyl Ester Content Determination
The acidity (FFA content) of the acid oil from soapstock was determined according to EN 14104 (titrimetric method), and results were expressed as the weight percentage relative to oleic acid (molar mass 282 g mol−1).
For olive pomace, the moisture and oil percentages of the by-product were determined according to NP 12880 (2000) and NP EN ISO 659, respectively. The free fatty acid content of extracted olive pomace oil was further determined.
The methyl ester content of the final products was determined according to EN 14103 (2003) by gas chromatography, using a Dani Master GC with a DN-WAX capillary column of 30 m, 0.25 mm internal diameter, and 0.25 µm film thickness. The temperature program was as follows: 120 °C as starting temperature, followed by a temperature rise of 4 °C per minute, up to 220 °C, and held for 10 min.
3.3. Enzymatic Hydroesterification
Hydrolysis reactions for producing FFA were carried out in 100 mL Erlenmeyer flasks using an orbital shaking incubator (Agitorb 200IC) with constant stirring at 200 rpm for 24 h at 35 °C. For both feedstocks (acid oil from soapstock and olive pomace oil), a mass of 50.0 g was used, with a mass ratio of water of 1:0.25 and 5 wt.% of enzyme, which was in agreement with conditions previously established by Cruz et al. [
9].
The hydrolysis reaction creates two phases: oil and water/glycerol, which are essentially immiscible at mild temperatures and can be separated by centrifugation [
9]. Thus, at the end of the reaction, the final product was centrifuged (Hermile Z200A) at 3500 rpm for 12 min to obtain two separated phases. The final FFA content of the oil was determined. Esterification of the oily phase produced by hydrolysis reactions was carried out under batch conditions using 100 mL Erlenmeyer flasks in an orbital shaking incubator (Agitorb 200IC). For both feedstocks the reactions conditions were: 35 °C, 200 rpm, 1:2 molar ratio of acid:methanol, and 2 wt.% of enzyme. All experiments were carried out in duplicate, and variation of results was evaluated through the difference in percentage relative to the mean (RPD). In all cases, RPD was less than 10%.
3.4. Fourier Transform Infrared (FTIR) Analysis and Calibration
FTIR analyses were conducted on the products using a Jasco FT/IR-4100 instrument, Tokyo, Japan (signal-to-noise ratio specification of 22,000:1 (4 cm−1, 1 min, near 2200 cm−1)). A horizontal attenuated total reflectance (ATR) sampling accessory (PIKE) equipped with a ZnSe cell was employed. All spectra were collected with a scanning range of 4000–650 cm−1, at 4 cm−1 spectral resolution and 54 scans, and aimed to quantify free fatty acids and methyl esters. Analyses were carried out in triplicate.
Approximately 1 mL of the oily samples separated by centrifugation was placed in the sampling accessory to reach the best contact with the crystal. The spectra were corrected for background using SpectraManager software, Ver.2., Jasco, Tokyo, Japan.
A set of eight solutions with different concentrations covering an FFA content range of 38–83 wt.% for hydrolysis of olive pomace and eight calibration standards covering a FAME content range of 29–94 wt.% for esterification reaction were used in calibration. For acid oil hydroesterification calibration, six solutions with different concentrations were used. The range of FFA and FAME contents used for hydrolysis and esterification reactions of such raw material were 46–74 and 10–80 wt.%, respectively. Different concentration ranges were required since the two different raw materials studied (olive pomace oil and acid oil from soapstock–real matrixes) presented different initial FFA contents.
Calibrations were made with the real matrixes by correlating the FFA and FAME percentages with the absorbance (peak height). It should be highlighted that preliminary calibration studies using oleic acid as standard to evaluate the FFA content showed no acceptable results, reflecting the relevance of performing the calibration using real matrixes. More detailed information can be found in
Section 2.2.
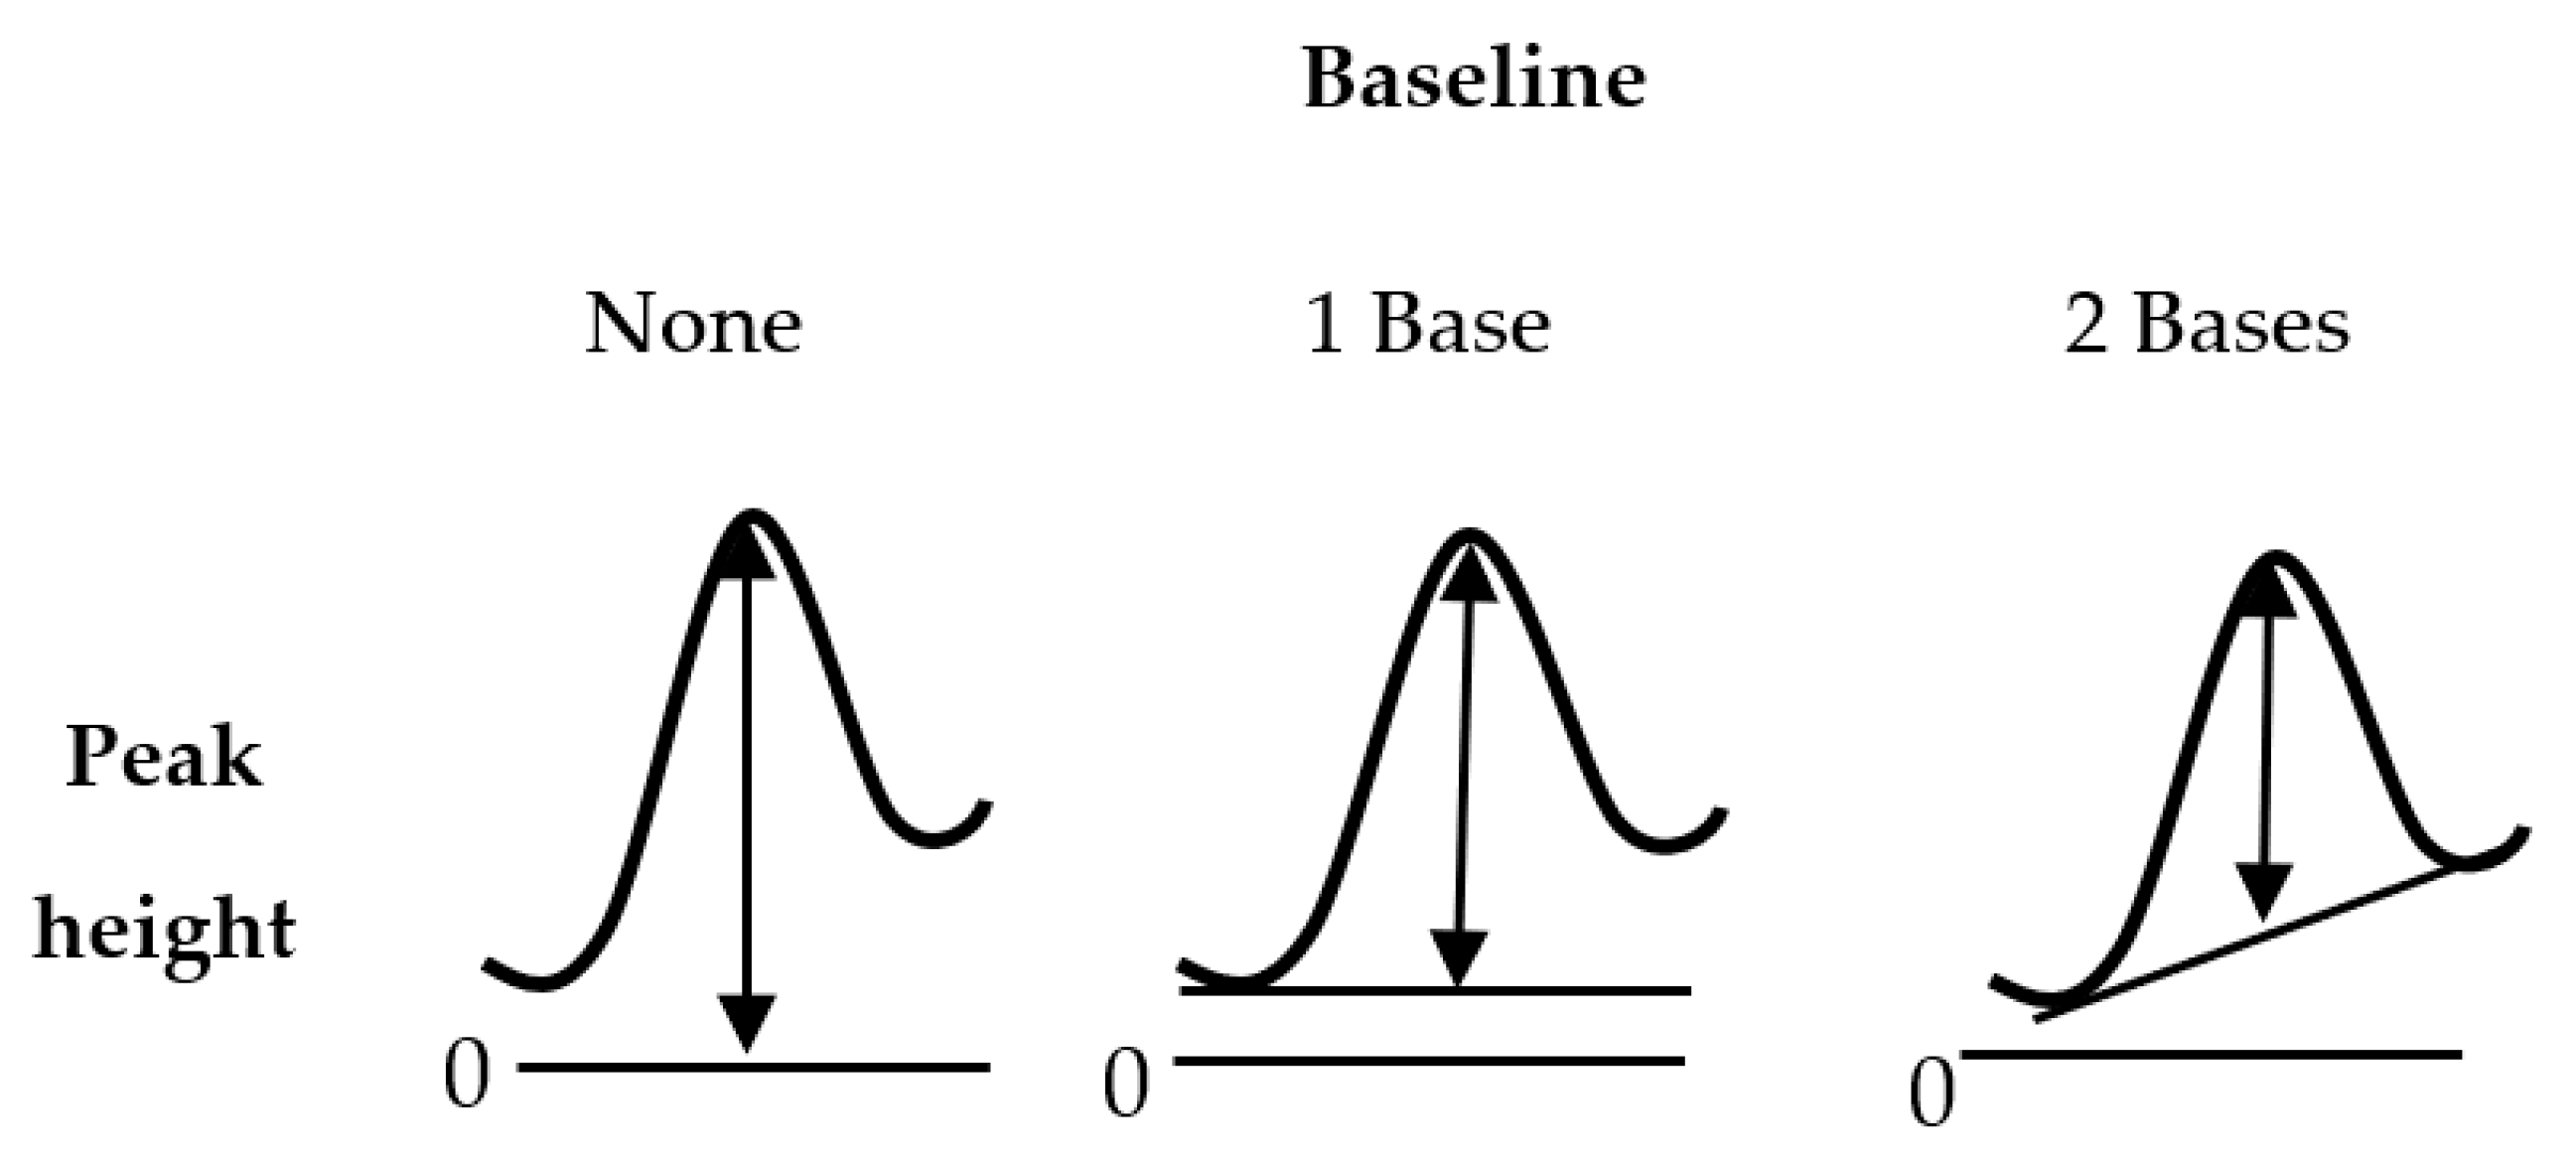
Considering that absorbance largely depends on the baseline considered, an evaluation was made by using the different options in order to select the best method to be employed. As shown in
Figure 6 [
35], peak height can be calculated by considering the total height of the peak from the baseline or considering the start (one base) or the start and the end of the peak (two bases).
Finally, in order to assess the accuracy of the method, an additional hydroesterification reaction was performed using the acid oil from soapstock and olive pomace oil as raw materials. The hydrolyzed and esterified feedstocks were analyzed in triplicate by FTIR, and the FFA and FAME contents were obtained using the calibration equations. Such results were compared with those obtained by the titrimetric method and the GC method, respectively.

 and
and 


