Photocatalytic Performance of NiO/NiTiO3 Composite Nanofiber Films
by
 ,
,
Bozhi Yang
1, 
Xuefeng Bai
1,
Jiaxuan Wang
1,
Minghao Fang
1,
Xiaowen Wu
1,
Yan’gai Liu
1,
Zhaohui Huang
1,
Cheng-Yen Lao
2 and
Xin Min
1,2,* 1
Beijing Key Laboratory of Materials Utilization of Nonmetallic Minerals and Solid Wastes, National Laboratory of Mineral Materials, School of Materials Science and Technology, China University of Geosciences (Beijing), Beijing 100083, China
2
Department of Materials Science and Metallurgy, University of Cambridge, Cambridge CB3 0FS, UK
*
Author to whom correspondence should be addressed.
Catalysts 2019, 9(6), 561; https://0-doi-org.brum.beds.ac.uk/10.3390/catal9060561
Submission received: 7 June 2019
/
Revised: 18 June 2019
/
Accepted: 20 June 2019
/
Published: 24 June 2019
(This article belongs to the Special Issue Electrocatalysis/Photocatalysis for CO2 Conversion, H2 Production, and Pollutant Removal)
Abstract
:Photocatalytic degradation of pollutants is one of the cleanest technologies for environmental remediation. Herein, we prepared NiO/NiTiO3 heterostructure nanofiber (200 nm) films by electrospinning and high temperature heat treatment, using nickel acetate and tetrabutyltitanate as nickel and titanium sources, respectively. The NiO/NiTiO3 heterostructure has advantages of good photodegradation rate constant and stability. By controlling the temperature, we can optimize the phase composition of these nanofibers for better photocatalytic performance. Based on our findings of the Rhodamine B degradation results, the best performance was obtained with 10% NiO and 90% NiTiO3; 92.9% of the Rhodamine B (5 mg/L) was degraded after reaction under full spectrum irradiation for 60 min. More importantly, the repeating test showed that these nanofiber films can remain active and stable after multiple cycles. The mechanisms of the photocatalysis reactions were also discussed. This demonstration provides a guideline in designing a new photocatalyst that we hope will serve the environmental needs for this and the coming century.
1. Introduction
As our society and the economy prosper, the amount of pollutants discharged increases rapidly and causes serious environmental problems. For example, the organic pollutants have irreversible effects on natural ecosystems and fresh water sources [1]. Many approaches have been proposed to solve these problems, such as activated carbon adsorption, photocatalytic degradation, and Fenton oxidation [2,3]. Among them, photocatalytic degradation reactions show great potential, due to the use of a clean and free reaction source, solar energy [4].
Several significant studies focus on optimizing high-performance semiconductor photocatalysts for pollutant degradation, including oxides (TiO2, ZnO, SnO2) [5,6,7], sulfides (CdS, ZnIn2S4) [8,9], nitrides, and oxynitrides (Ta3N5 and TaON) [10]. One way of improving the performance of existing materials is to optimize them through microstructural control and/or exposure of the more active crystal planes. The second method is to control the energy band structure of the photocatalysts by ion-doping or defect modification. The objective is to expand their photoresponse range, thereby improving their photocatalytic efficiency. Examples of this approach include black TiO2−x and nitrogen-doped TiO2−xNx, which are both reported in the literature with excellent photocatalytic properties in the visible light region [11,12]. The third route is the formation of a composite material consisting of a photocatalyst and a highly conductive material. The purpose of the conducting material is to suppress the recombination of electron-hole pairs by enabling fast photogenerated electrons transfer. Examples of materials used for this purpose include graphene, carbon nanotubes, carbon quantum dots, and nanometals [13,14,15]. The fourth approach is the formation of heterojunctions between two semiconductors with different band structures, such that separation of photogenerated charge carriers is realized by band structure matching. For example, investigations of Bi2O3/BiWO6, AgI/BiOI, and TiO2/WO3 showed that the heterojunction band structures in these materials can effectively inhibit electron-hole recombination and improve photocatalytic performance [16,17,18]. Based on the success of these four approaches, we have chosen composite heterostructures owing to the synergistic improvement of photocatalyst performance efficiency by both expanding the photoresponse range of wide bandgap semiconductors and suppressing the rapid recombination of photogenerated carriers.
Nano-catalysts can broaden the band gaps of their bulk counterparts due to quantum size effects, giving them stronger redox capability. Furthermore, the specific surface area increases with decreasing size scale. Within the nanoscale, we can expect a large specific surface area for more catalytic active surface sites and a higher capacity to adsorb pollutants. These effects ultimately lead to high catalytic activity. The practicality of nano-catalysts is, however, restricted due to the difficulties in recycling and reusing. Herein, we employ an electrospinning technique to construct a nano-catalyst into an easily reusable macroscale geometry. Electrospinning is a technique which uses a high-voltage electrostatic field to break down a precursor solution and form a one-dimensional nanofiber material [19]. The resulting fiber will be randomly stacked at the collecting end to form a porous membrane structure that can be maintained after the post-treatment. In practice, the organic pollutants pass through the photocatalyst membrane for degradation, thus the long-term reuse of the photocatalyst materials can be realized. We have chosen nickel titanates (NiTiO3) and nickel oxide (NiO) for our heterostructure nano-catalyst. NiTiO3 with a typical ilmenite-type trigonal structure is an n-type semiconductor with a band gap of 2.15 eV, which has application in the fields of gas sensors, catalysts, and rectifiers [20]. NiO is an ideal p-type semiconductor with a band gap of 3.40 eV, which has good photocatalytic performance [21]. Its band gap structure indicates that it is an ideal semiconductor capable of forming a p-n junction with NiTiO3. At present, the NiO/NiTiO3 p-n junction nano-structure and its photocatalytic properties is rarely reported. Therefore, in this work, we propose a NiO/NiTiO3 composite nanofiber membrane material formed by electrospinning combined with in situ heat treatment. By adjusting the nickel and titanium source in the electrospinning precursor, we control the amount of NiO (5–25%) present in the catalyst. The crystal phase and chemical composition, as well as the micro- and macrostructure of the composite material are studied. The NiO/NiTiO3 heterojunction model is carried out to clarify the underlying mechanism of photocatalytic performance improvement.
2. Results and Discussion
2.1. Crystal Phase Composition of NiO/NiTiO3 Composite Nanofibers
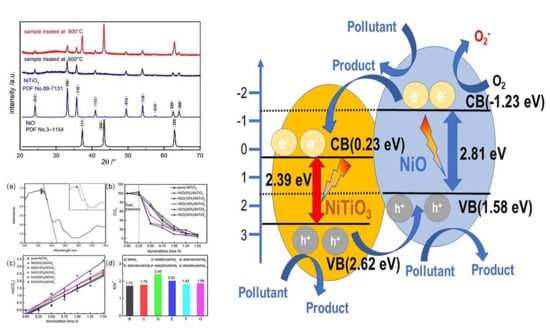
Figure 1 shows the X-ray powder diffractometer (XRD) patterns of the as-prepared composite nanofiber films obtained at 600 and 800 °C. Comparing with the standard diffraction patterns of NiO and NiTiO3, the phase composition of the product obtained at 600 °C is exclusively NiTiO3. As the temperature increased to 800 °C, a distinct NiO diffraction peak appears, indicating a mixture of NiTiO3 and NiO. No other peaks are detected here. The three diffraction peaks at 37.2°, 43.3°, and 62.8° corresponding to NiO (111), (200), (220) crystal plane, and the remaining diffraction peaks corresponding to (012), (104), (110), (113), (014), (116), (018), (300) planes of NiTiO3, respectively.
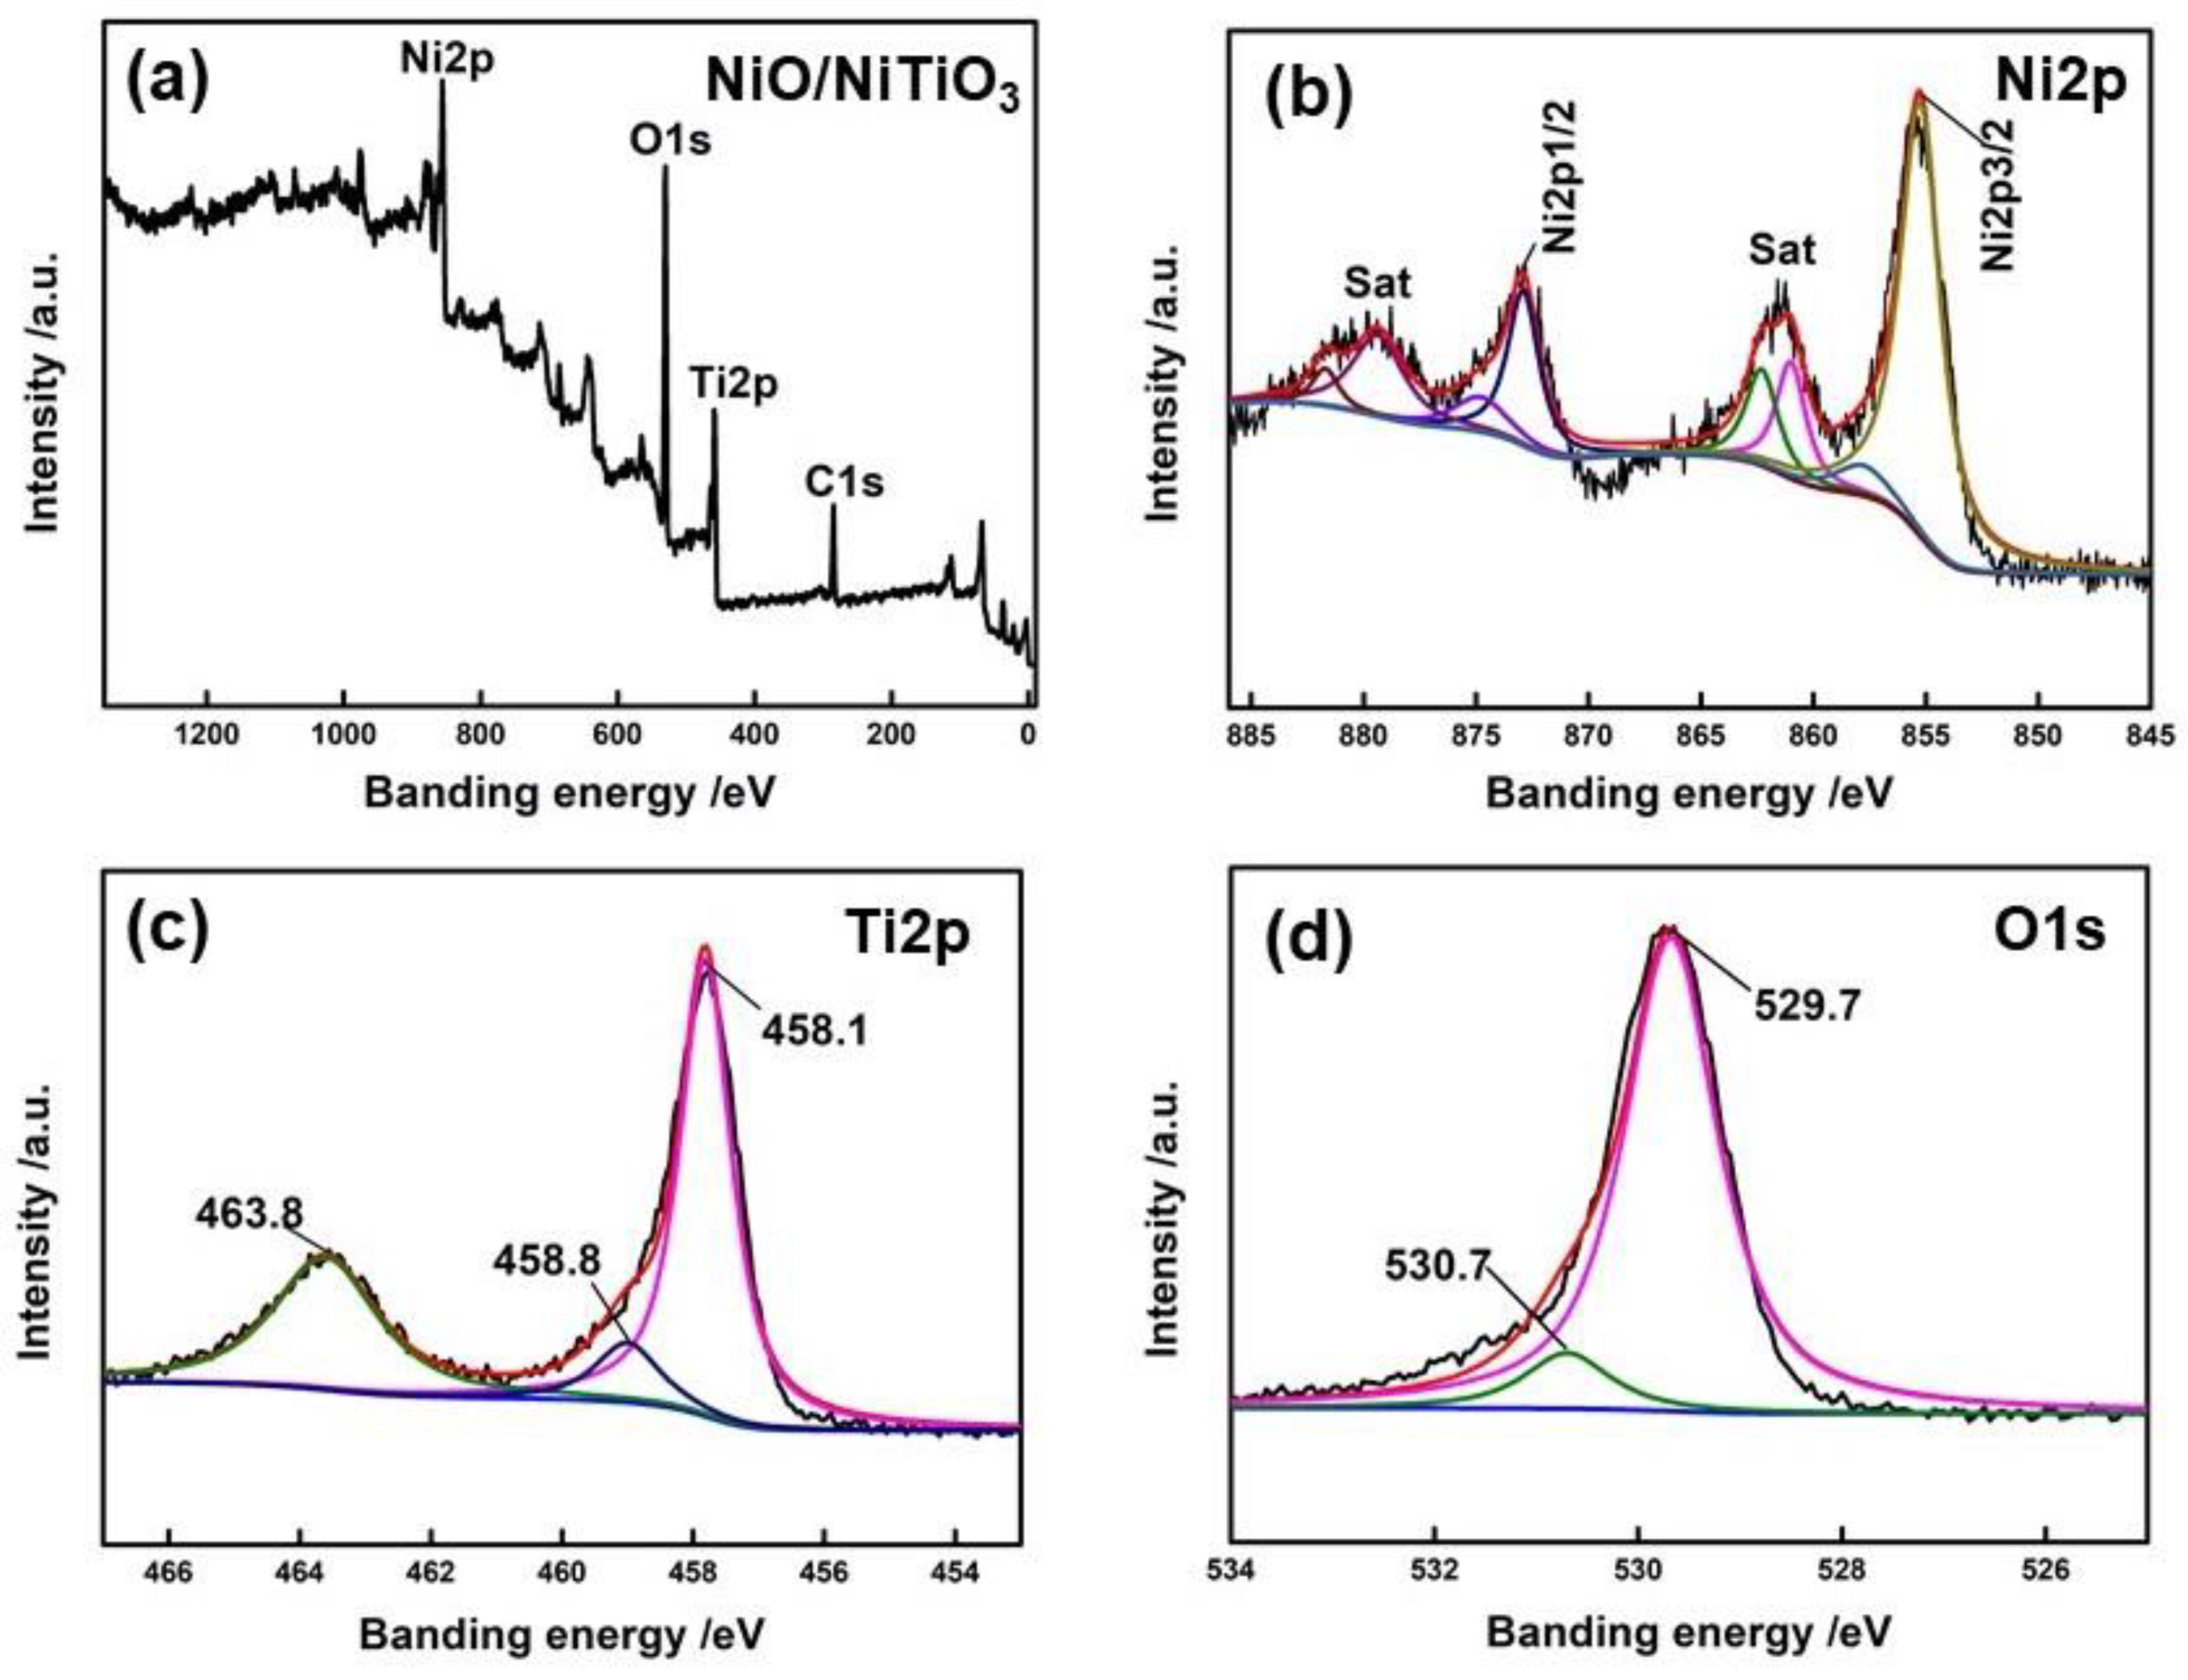
To further study the elemental composition and chemical state of the sample, X-ray photoelectron spectroscopy (XPS) characterization of the NiO(10%)/NiTiO3 obtained at 800 °C was carried out, as shown in Figure 2. From the full spectrum shown in Figure 2a, four elements, Ti, Ni, C, and O, can be determined in the sample. Carbon is presented as a standard component. From the high-resolution scan in the Ni2p region, shown in Figure 2b, the characteristic Ni2p1/2 and Ni2p3/2 peaks are observed (separated due to spin-orbit coupling) at peak binding energies of 873.8 eV and 855.8 eV, along with their satellite peaks. The main peaks are not symmetrical, and can be fit using two symmetrical Gaussian peaks, which are attributed to Ni-O in NiO and NiTiO3 [22,23]. There are two isolated peaks in the high resolution XPS spectrum of Ti2p, corresponding to Ti2p1/2 and Ti2p3/2 at peak binding energies of 463.8 eV and 458.1 eV, respectively [24,25]. The binding energy difference is 5.7 eV between the peaks, which is consistent with Ti existing in the form of Ti4+ ions. Individual peak fitting indicates that the titanium atoms are in two binding environments in the crystal [23]. Figure 2d is a detailed scan in the O1s region. The O1s feature can be fitted by two peaks, at 530.7 eV and 529.7 eV, corresponding to the Ti–O and Ni–O bonds, respectively [26,27]. The results of the above XPS analysis further confirm that both NiO and NiTiO3 exist in the sample, which is consistent with the XRD analysis discussed above.
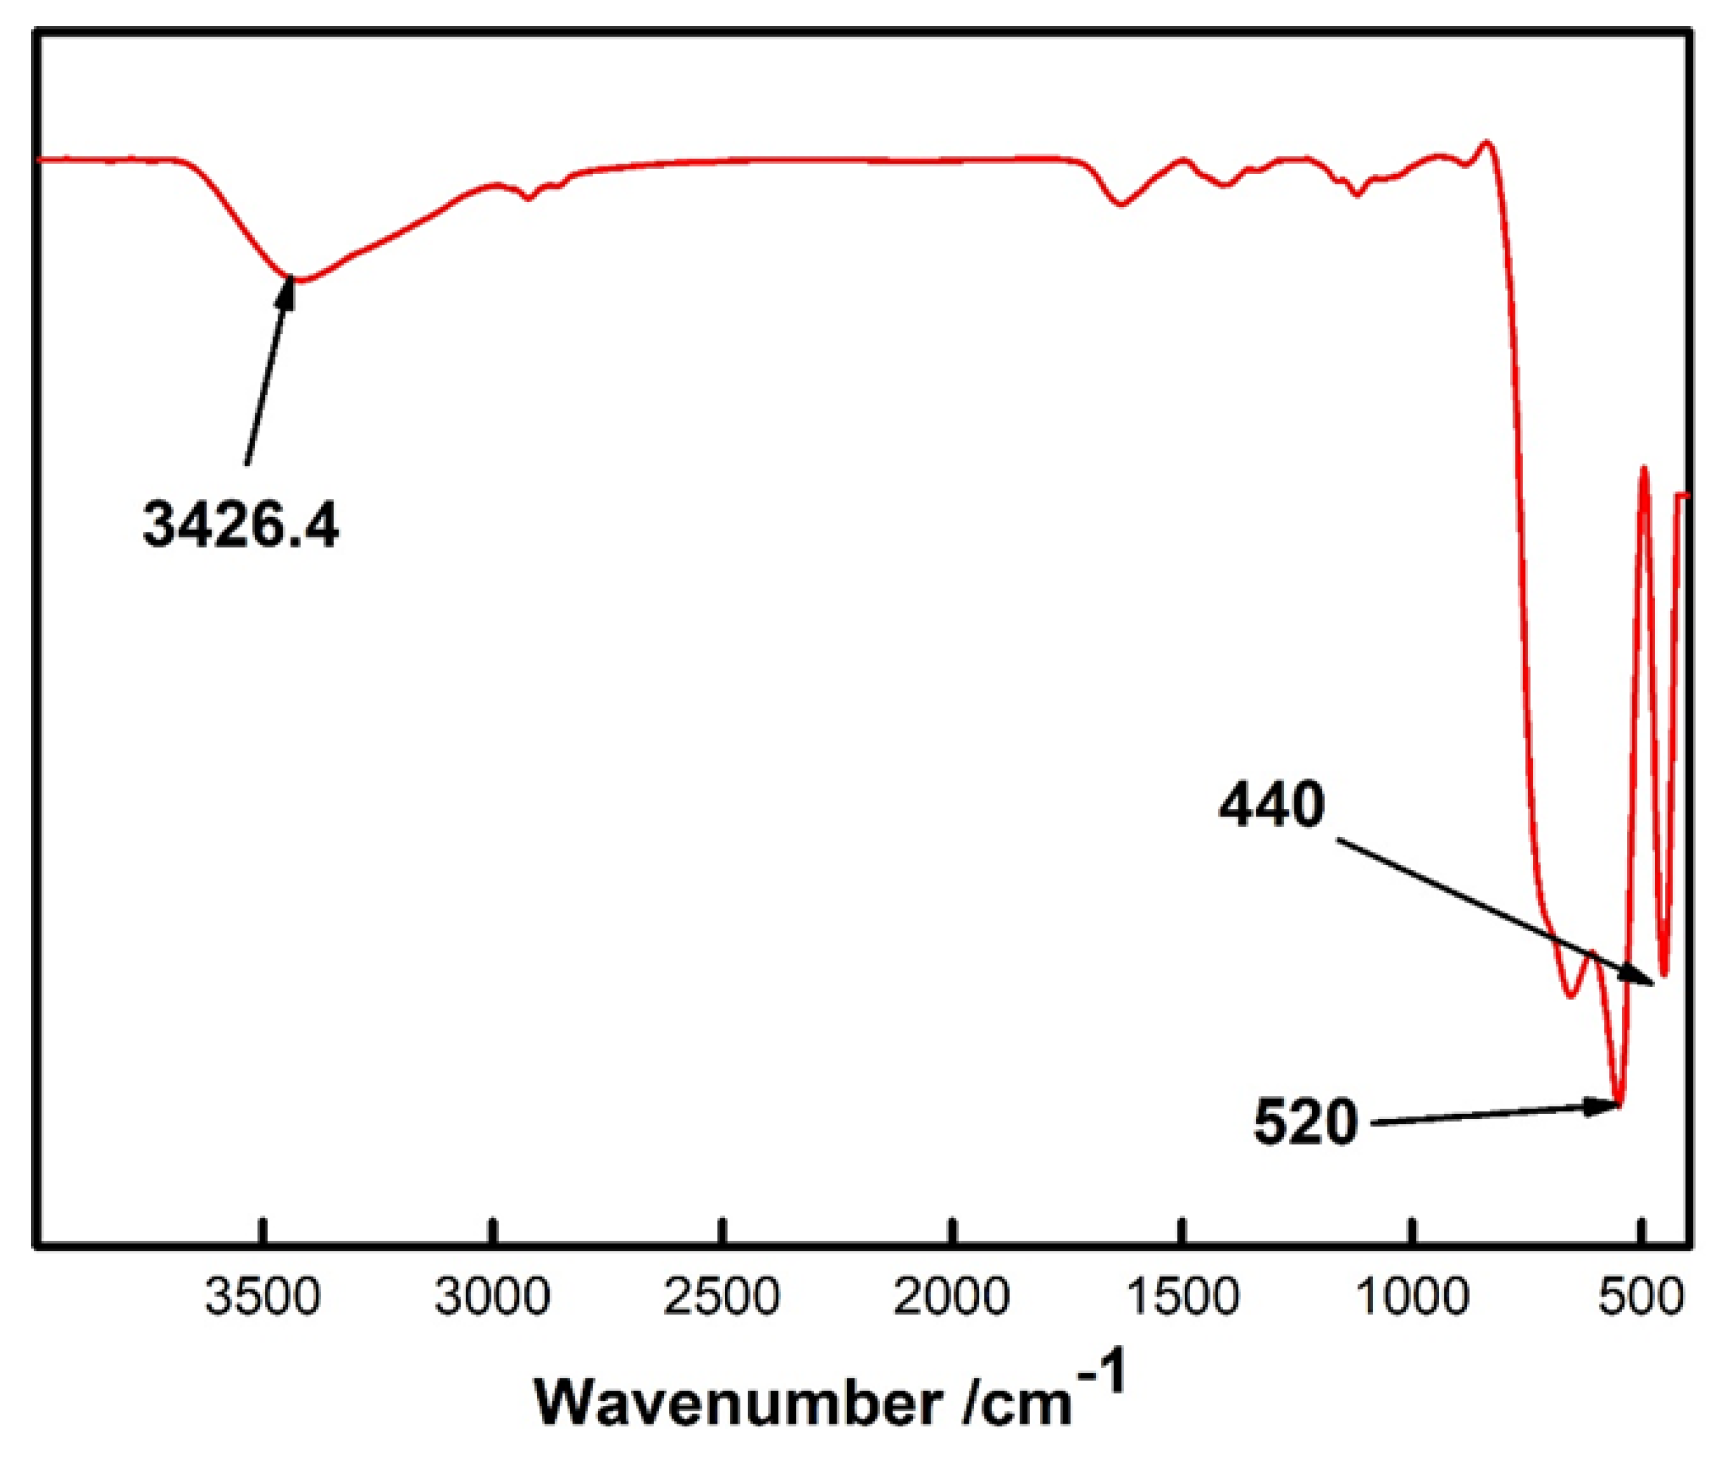
The bonding structure of the sample NiO/NiTiO3 was also investigated by Fourier Transform infrared (FT-IR) spectroscopy in the range of 4000–400 cm−1, as shown in Figure 3. The broad peak at 3426.4 cm−1 corresponds to the pyrrole functional group originates from the organic compounds which are not completely decomposed during calcination. The peak near 520 cm−1 may be the tensile vibration of the Ni–O and the Ti–O bonds [28], while the peak near 440 cm−1 corresponds to the Ti–O–Ni bond [29]. These results consist of the aforementioned structure and composition of NiO/NiTiO3 samples.
2.2. Morphology and Microstructure of the NiO/NiTiO3 Sample
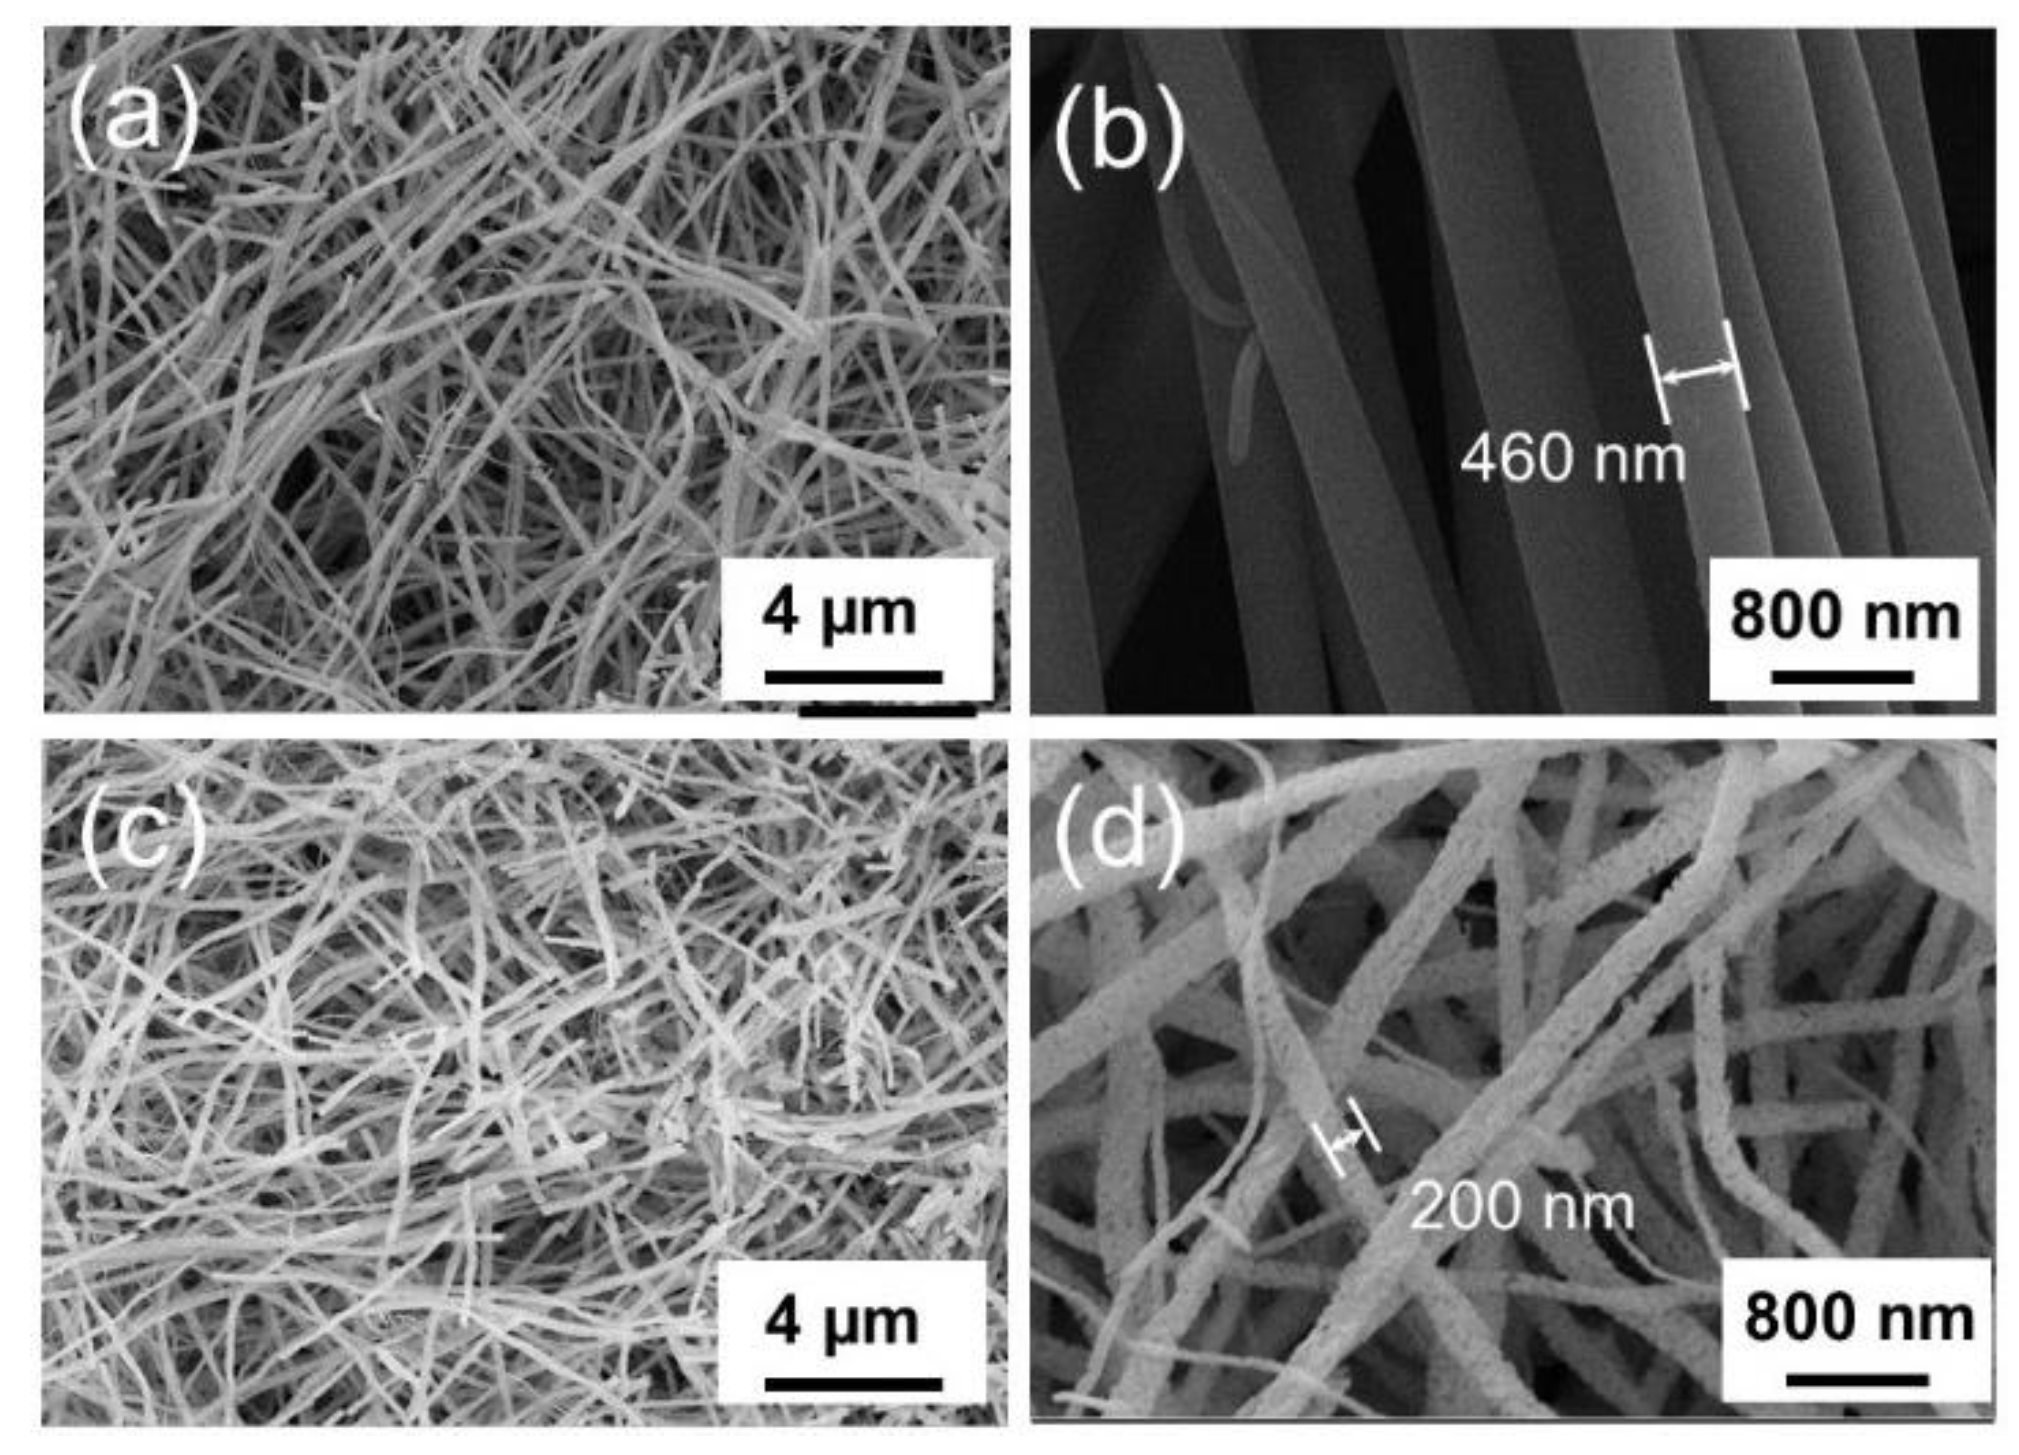
The microscopic morphology of the nanofiber membrane before and after heat treatment at 800 °C was characterized by scanning electron microscopy (SEM), using the NiO(10%)/NiTiO3 as an example. It can be seen from the SEM images in Figure 4 that the NiO/NiTiO3 precursor nanofibers obtained by the electrospinning process are layered and interwoven and form a membrane structure. The surfaces of these fiber are smooth with an average diameter of about 460 nm. After heat treatment at 800 °C, the membrane structure composed of nanofibers is maintained without any obvious fracturing apart from a small number of ultrafine fibers that can also be seen in the higher magnification image Figure 4d. The majority of the nanofibres have an average diameter of roughly 200 nm, or 2.3 times smaller than that of the precursor fibers with a rough surface. The main reason for the reduction in diameter is the decomposition and combustion of organic matter during heat treatment. In addition, the rough surface of the heat-treated NiO/NiTiO3 indicates that the NiO and NiTiO3 crystals in the nanofibers have gone through a nucleation and growth process to form irregularly arranged grains and pores.
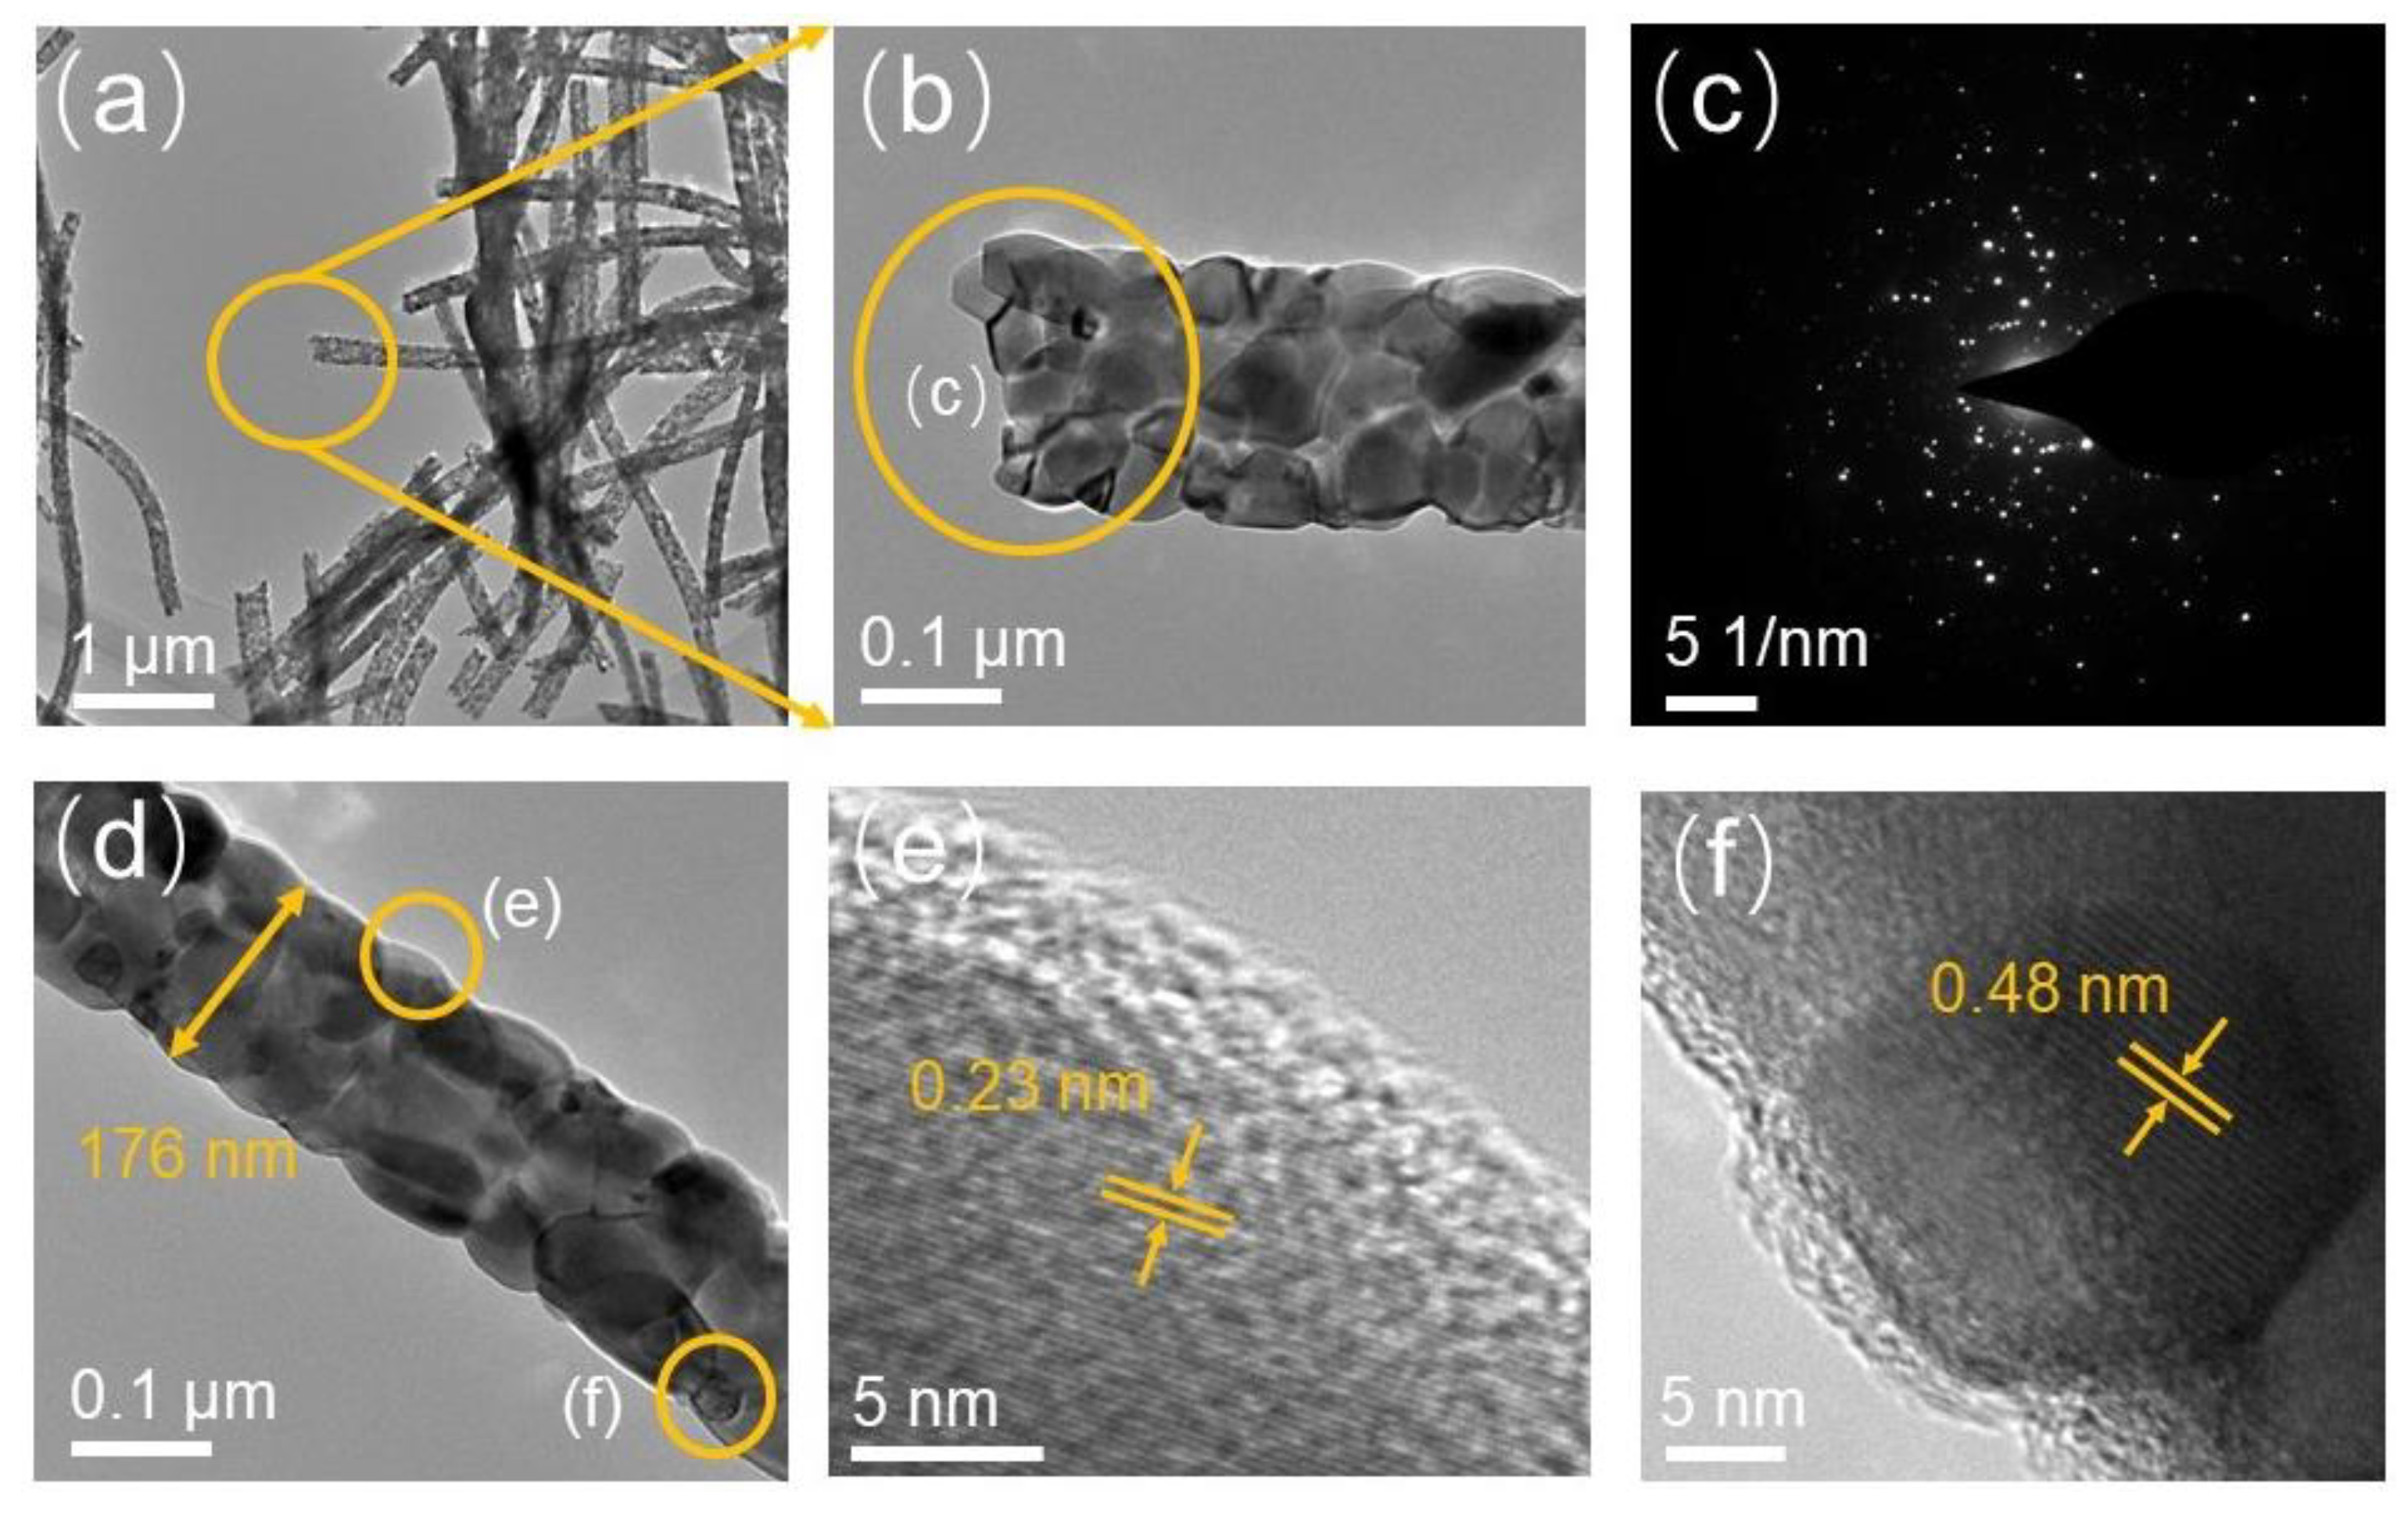
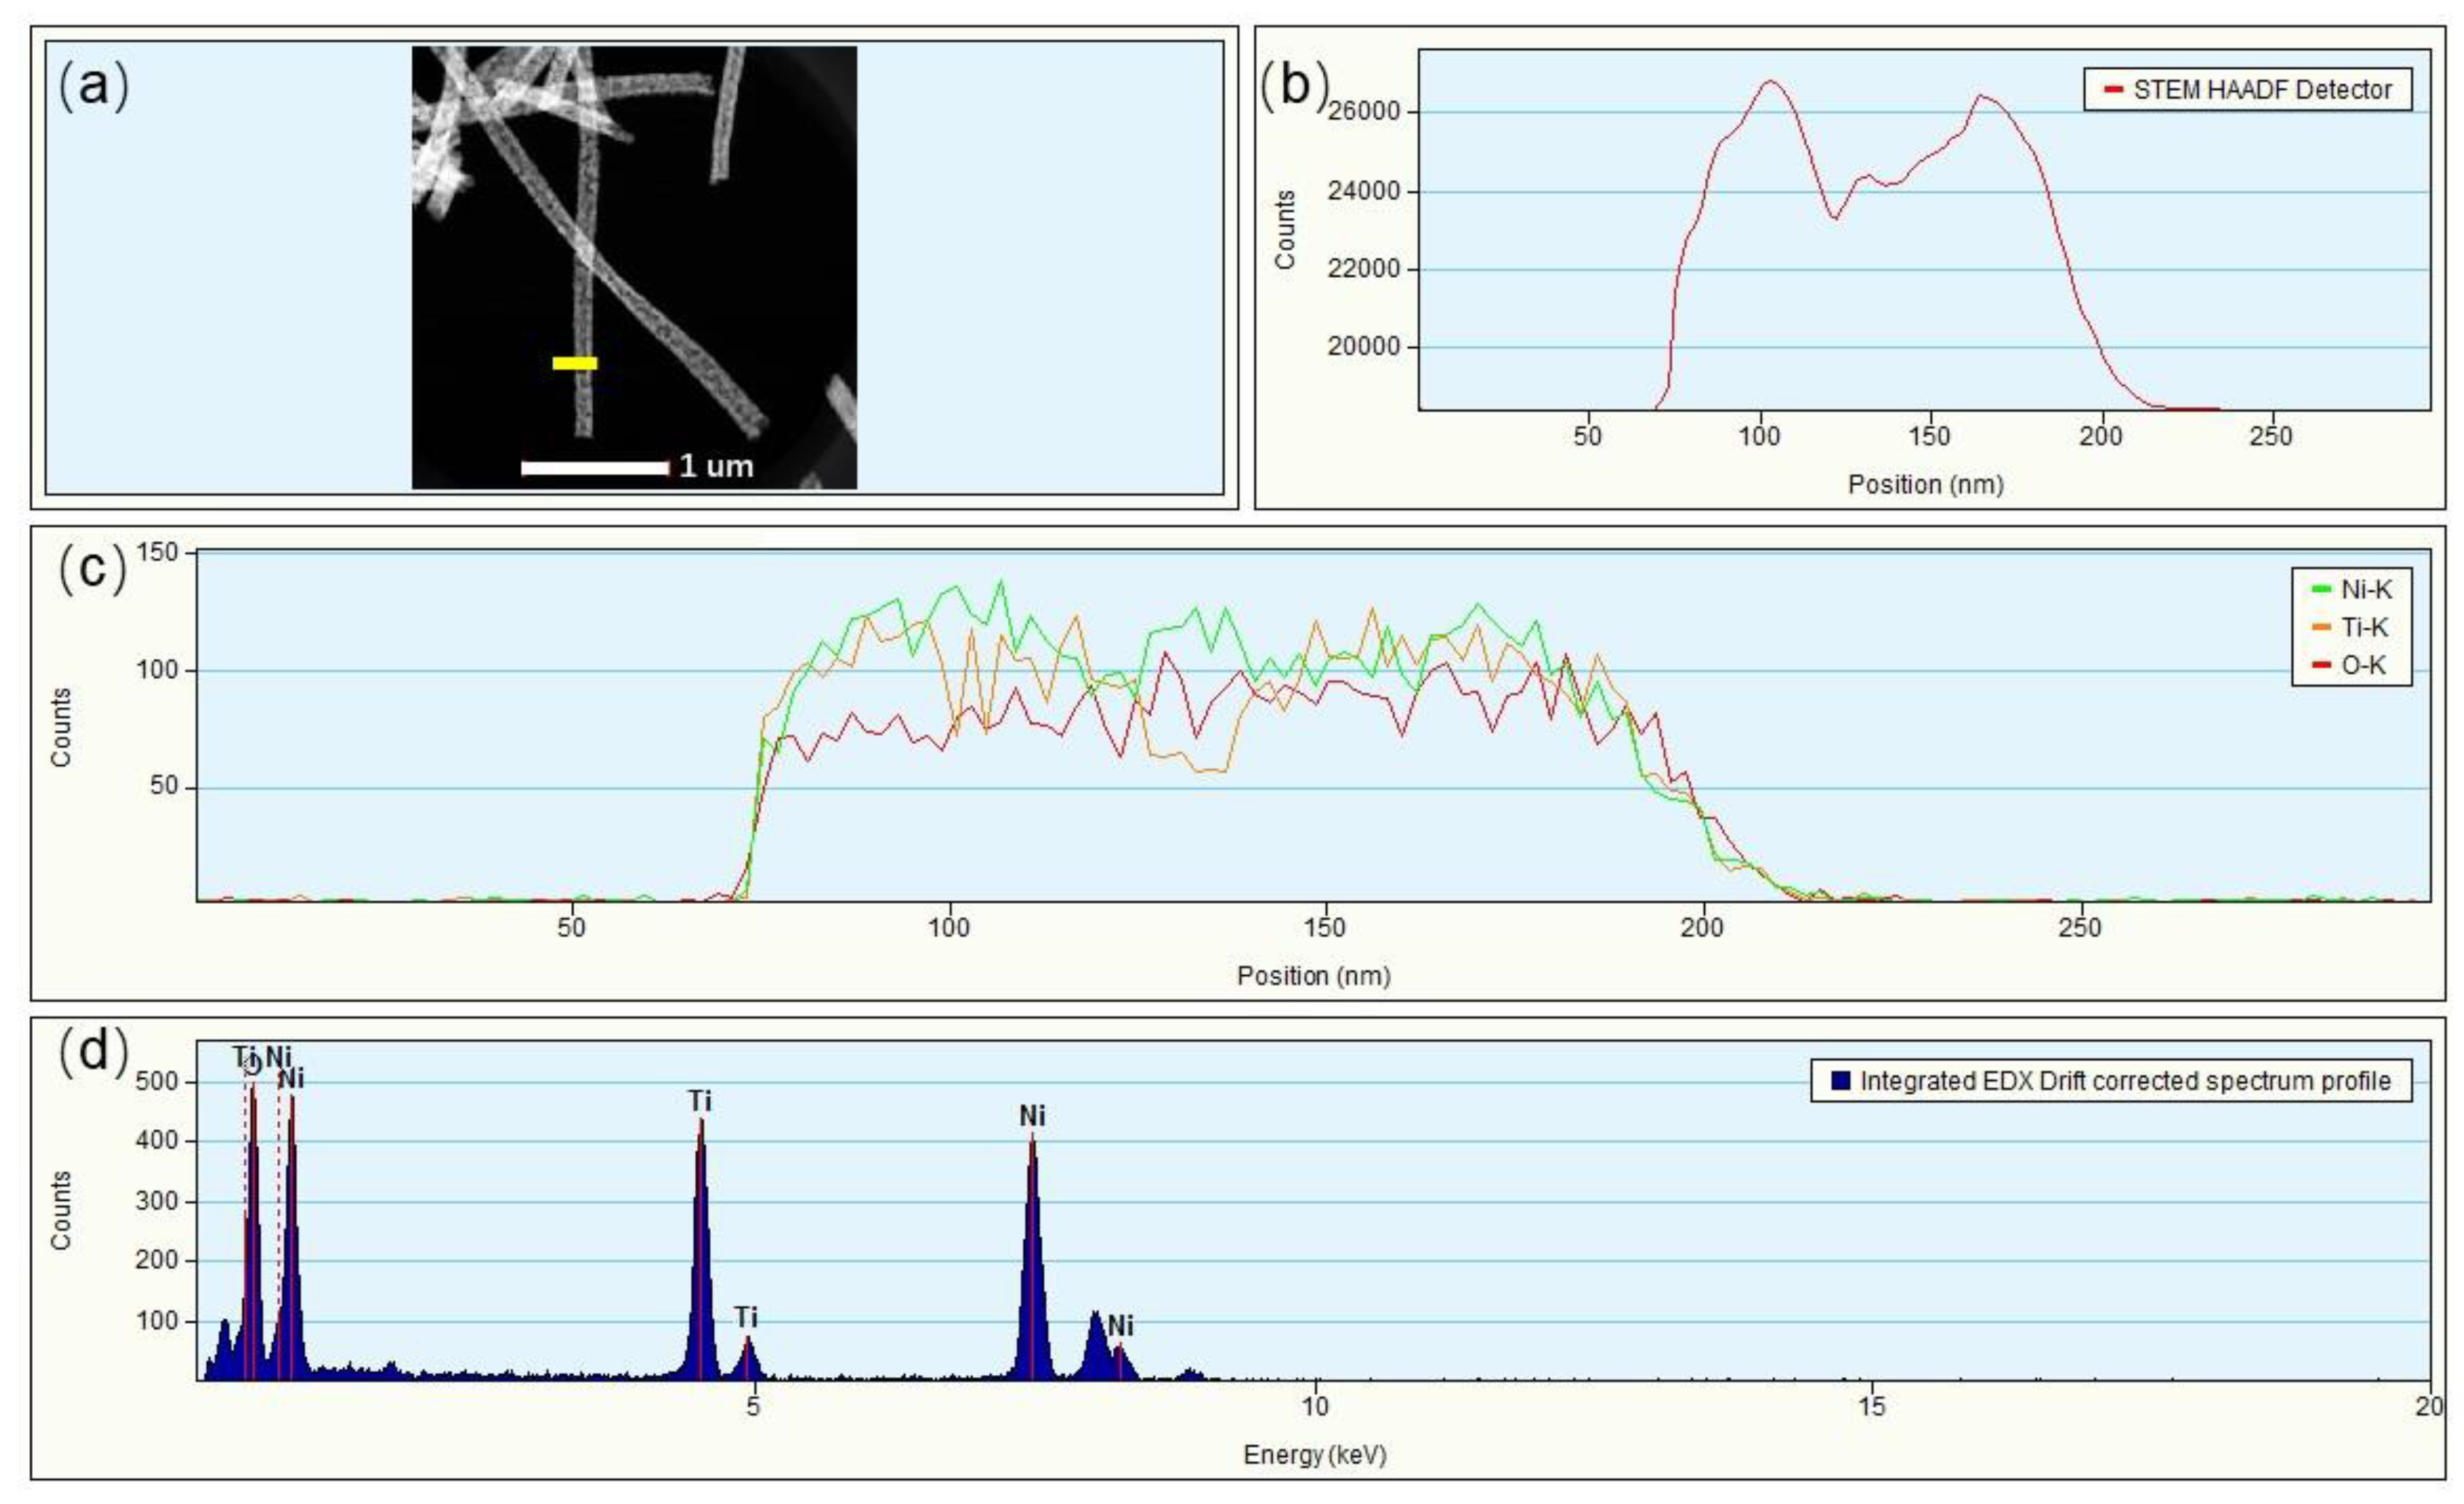
Transmission electron microscope (TEM) and high resolution TEM (HRTEM) were used to further analyze the grain distribution, size, and elemental composition of the NiO(10%)/NiTiO3 samples after heat treatment at 800 °C. From the images in Figure 5a,b,d, the crystal grains in the nanofibers are randomly packed in a compact manner, with a typical grain size of 50–100 nm. The nanofibers appear to be continuous with a rough surface. The nanofiber analyzed in Figure 5d has a diameter of about 176 nm, which is consistent with the estimate of 200 nm from SEM images. The electron diffraction pattern (Figure 5c) from a selected region in Figure 5b shows that the fiber is composed of a polycrystalline structure. The high-resolution images shown in Figure 5e,f are used for structural analysis due to the presence of clear lattice fringes. The lattice fringe spacing in the region in Figure 5e is 0.23 nm, which is consistent with the interplanar spacing of the (100) crystal plane of NiO, while the lattice fringe spacing in the region in Figure 5f is 0.48 nm, consistent with the expected spacing of the (003) planes of NiTiO3 [22]. These results confirm that both the NiO and NiTiO3 phases are presented in the nanofibers after heat treatment. Furthermore, the scanning transmission electron microscopy (STEM) mode was used to measure the diameter and elemental composition of NiO/NiTiO3 nanofibers. As shown in Figure 6b, the fiber diameter is about 160 nm, with a rough surface. Elemental analysis by EDAX in Figure 6c,d shows that the Ti, Ni and O elements distribute uniformly in the radial fiber direction and form a uniform NiO/NiTiO3 composite structure. The energy dispersive X-ray (EDX) spectrum shows that no other impurity elements are present in the fiber, consistent with the XRD, XPS and FT-IR above [30].
2.3. Photocatalytic Performance and Photocatalytic Mechanism
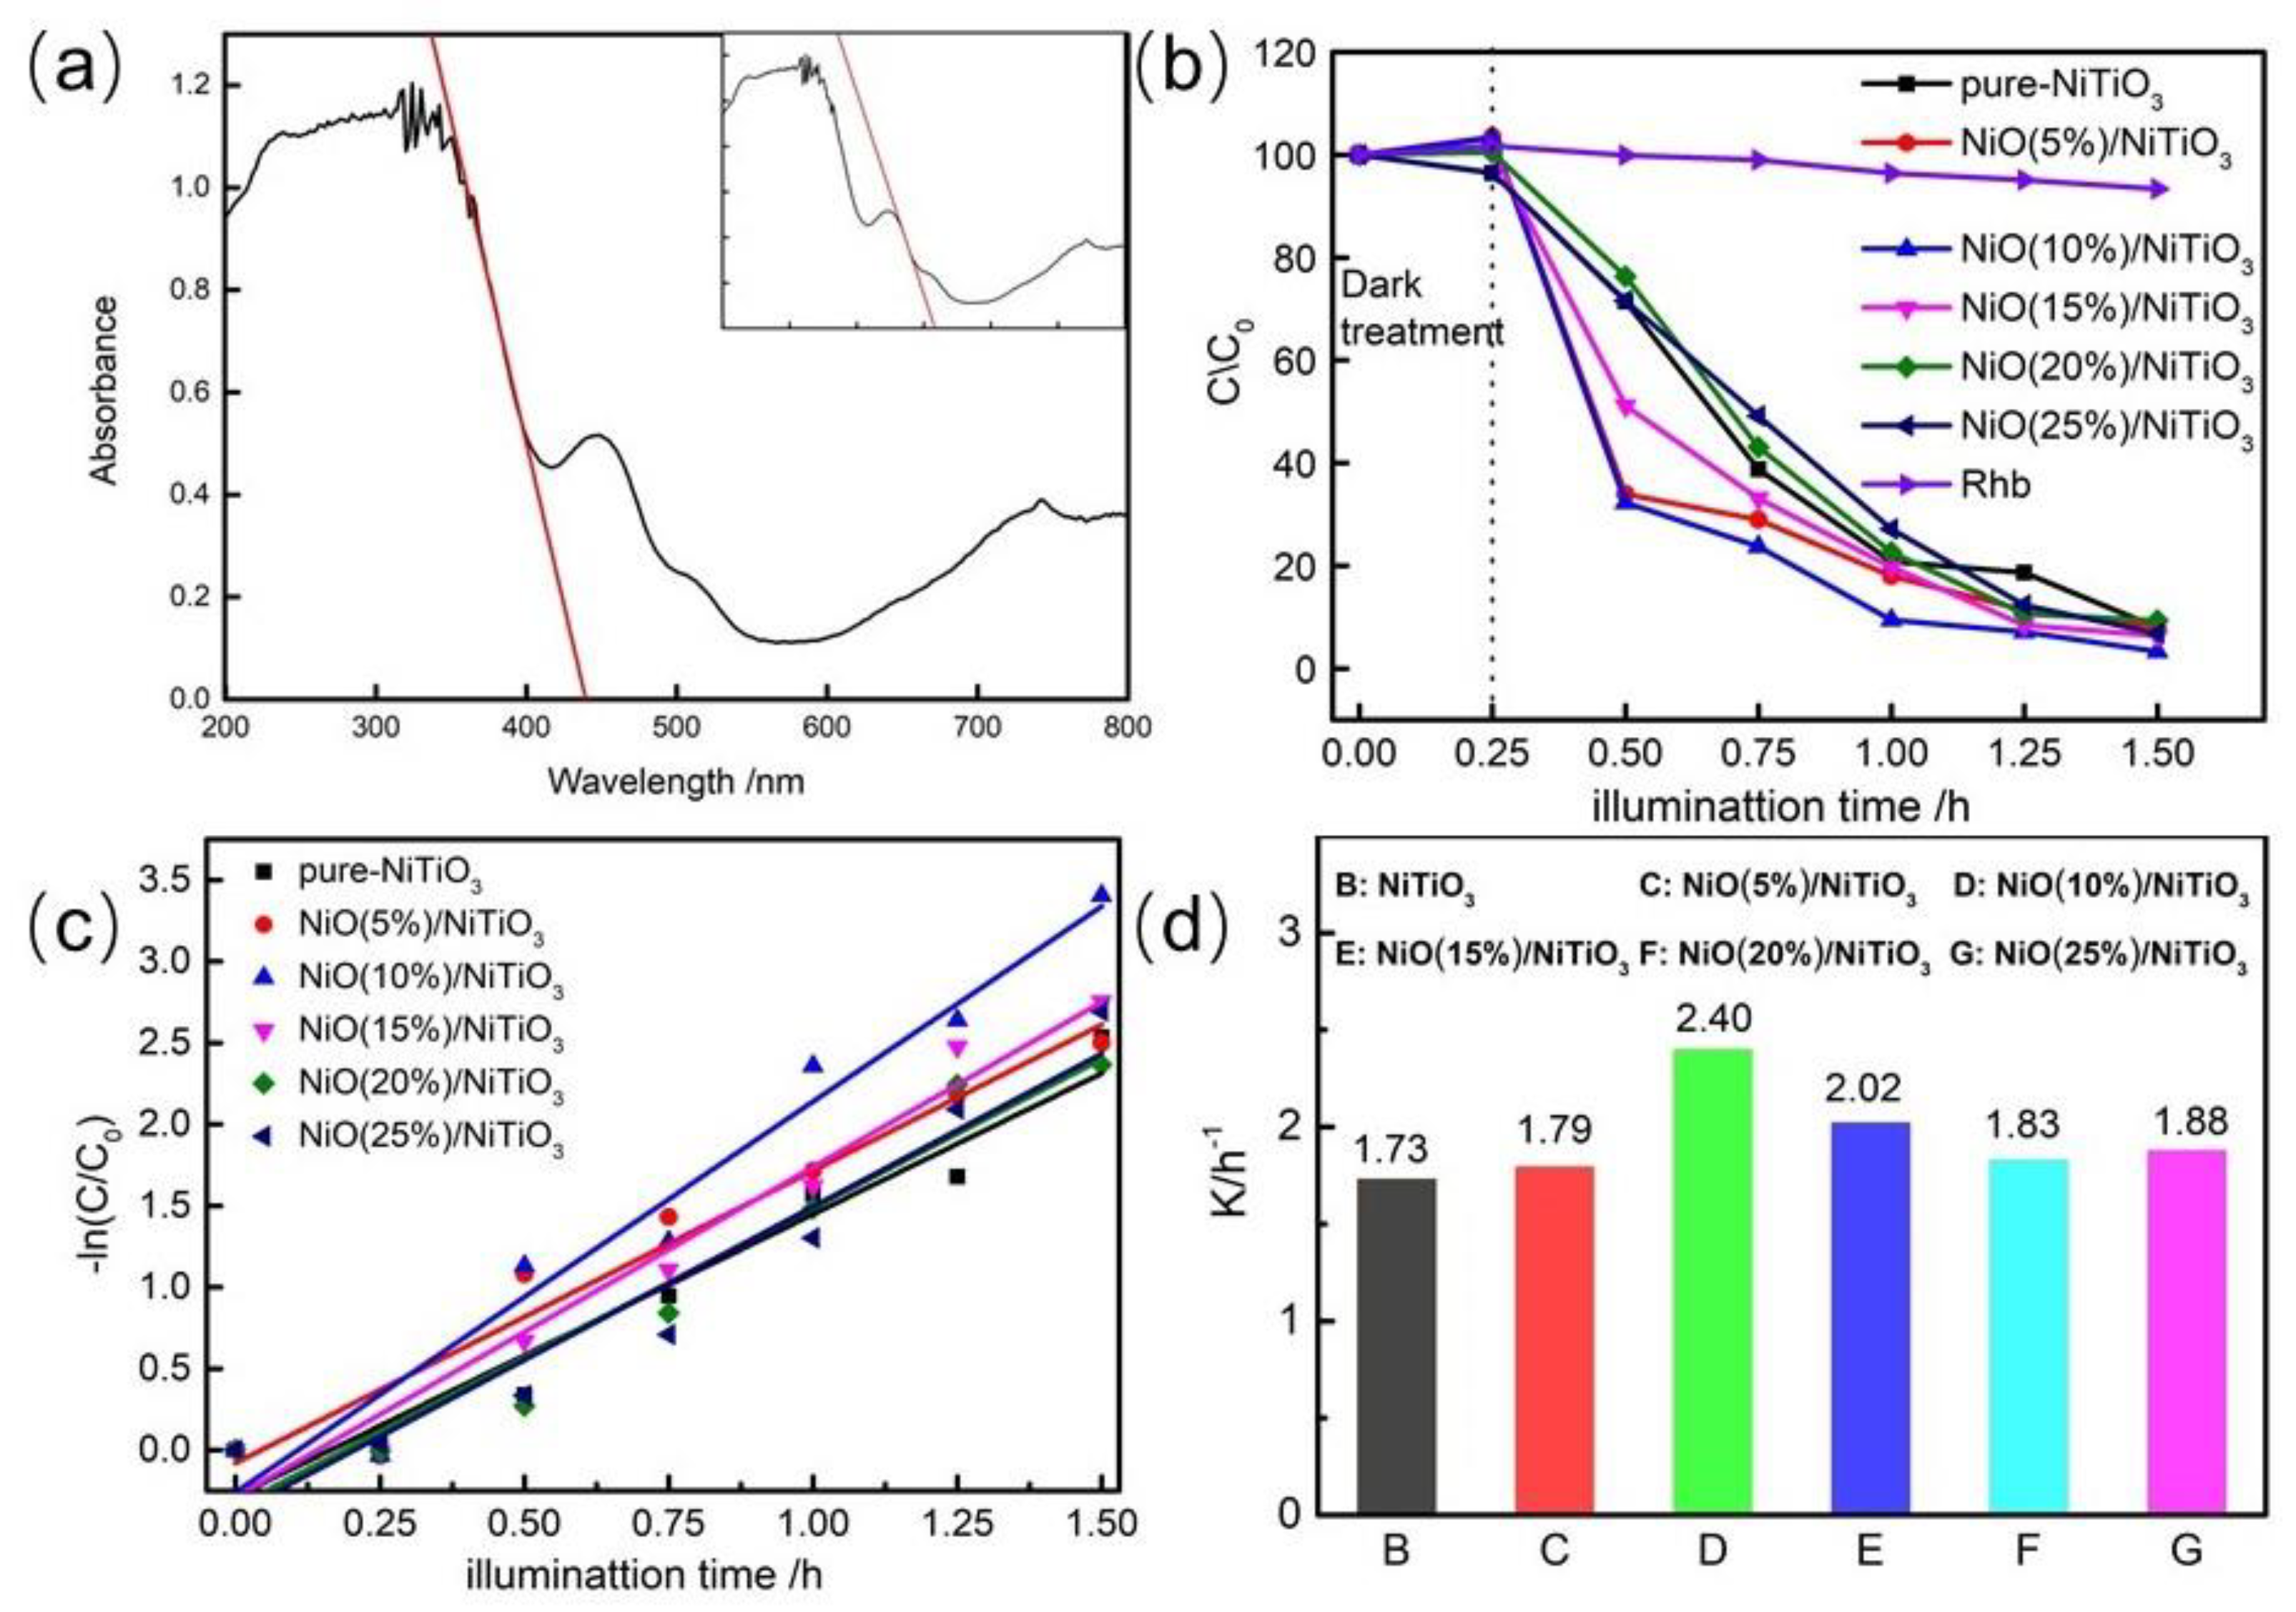
The absorption spectrum of NiO(10%)/NiTiO3 at 800 °C is shown in Figure 7a. The plateau starting at 310 nm is consistent with the absorption characteristics of NiO, and the absorption peak around 450 nm is similar to the absorption characteristics of NiTiO3 reported in the literature [29]. Thus, the energy gap of NiO and NiTiO3 is calculated to be 2.81 eV and 2.39 eV herein. Figure 7b shows the photocatalytic degradation of Rhodamine B versus time for NiO/NiTiO3 nanofiber membranes with different NiO molar ratios (5%, 10%, 15%, 20%, 25%). In the dark reaction stage, the adsorption-desorption equilibrium was reached after 15 min. As shown in the figure, pure NiTiO3 fiber and NiO/NiTiO3 nanofibers containing 5%, 10%, 15%, 20% and 25% NiO show the degradation of 81.4%, 88.8%, 92.9%, 91.6%, 89.4%, and 87.7%, respectively, after 60 min illumination under UV-visible full spectrum. The results indicate that the NiO/NiTiO3 composites present a higher degradation rate than pure NiTiO3 regardless of the amount of NiO presented. Figure 7c shows the first-order kinetic reaction curves, from which the degradation rate constant k can be obtained. A summary of K for various NiO/NiTiO3 samples is shown in Figure 7d and shows that K increases firstly and then decreases with the increase of molar ratio of NiO. The NiO(10%)/NiTiO3 exhibits the fastest reaction rate, with a degradation rate constant of 2.40. Compared with similar studies in literatures, including novel photocatalysts [31] and the physical adsorption method based on sodium montmorillonite clay [32], microwave-activated rice husk ash [33], and activated carbon [34], the NiO(10%)/NiTiO3 composite nanofiber also reveals comparable photocatalysis performance. Moreover, the composite nanofiber photocatalyst owns unique advantages, such as excellent catalytic rate, high stability, ease in separation, and reusability. In order to verify the stability of photocatalytic performance of the NiO/NiTiO3 composite, cycling degradation performance was carried out. The results, in Figure 8, show that the photocatalytic performance can be maintained after repeated cycles. The degradation rate slightly decreases after the first cycle, which may be due to a loss of photocatalyst quality during multiple filtrations.
The mechanism of photocatalytic degradation enhancement of the NiO/NiTiO3 composite is discussed in Figure 9. The mechanism involves photo-generated charge carriers’ separation and transfer promoted by the energy band dislocation at the NiO/NiTiO3 junction. Separation allows more efficient use of the generated charge carriers. Under full-spectrum illumination, electrons can absorb energy in NiO and NiTiO3, moving from the valence band to the conduction band with a corresponding number of holes generated in the valence band. At the p-n heterojunction interface of NiO and NiTiO3, the boundary potential of the NiO conduction band (−1.23 eV vs. NHE) is lower than that of NiTiO3 (0.23 eV vs. NHE) [35,36], resulting in easy transfer of photogenerated electrons from the conduction band of NiO to the conduction band position of NiTiO3. This phenomenon can encourage in situ absorption of oxygen to generate superoxide radicals, O2− [37,38,39]. At the same time, Rhodamine B is decomposed due to the hole (h+) in NiO and NiTiO3 generated by photo illumination. Since the potential of the valence band of NiTiO3 is higher than the potential of H2O/·OH (2.38 eV vs. NHE), both superoxide O2− radicals and photogenerated holes play a role in photocatalytic degradation by NiO/NiTiO3 composite fibers. Furthermore, the valence band potential of NiTiO3 is also higher than that of NiO, and the photogenerated holes generated by NiTiO3 are more easily transferred to the valence band of NiO. In addition, the p-n heterojunction between NiO and NiTiO3 also forms a local electric field at the phase interface. When the electrons of the p-n heterostructure composite are excited by illumination, this electric field moves the photogenerated electron to the n-type NiTiO3 semiconductor and the hole to the valence band of the p-type NiO. These two opposite charge carrier movements effectively suppress recombination of the photo-generated electrons and holes, thereby increasing the photocatalytic degradation rate of the composite.
3. Materials and Methods
3.1. Experimental Reagent
The main chemicals in this paper are as follows: polyvinylpyrrolidone (PVP, Mv = 1,300,000, Alfa Aesar, Ward Hill, MA, USA), tetrabutyl titanate (C16H36O4Ti, 99.5%, Sinopharm Chemical Reagent Co, Shanghai, China), nickel acetate (Ni(CH3COO)2, 99.5%, Aladdin, Shanghai, China), and absolute ethanol (C2H5OH, 99.7%, Chemical Reagent Co, Shanghai, China).
3.2. Preparation of NiO/NiTiO3 Composite Nanofiber Membrane
Nickel acetate (1.00, 1.05, 1.10, 1.15, 1.20, or 1.25 mmol) was dissolved in 2 mL of acetic acid to obtain solution A. A second solution B was prepared by adding 0.6 g polyvinylpyrrolidone (PVP) to 10 mL of ethanol. Solutions A and B were mixed at the ratio needed to meet the required viscosity for spinning. The resulting mixture was magnetically stirred until uniform. An extra 1.00 mmol of tetrabutyl titanate was added with continued stirring to obtain the precursor solution.
An appropriate amount of the precursor sol was spun using a conventional single spinneret electrospinning apparatus with a glass reservoir, using a voltage of 17.5 kV, receiving distance of 20 cm and a feed rate of the spinning solution of 1 mL/h. This film (the NiO/NiTiO3 composite fiber precursor) was placed in a muffle furnace at room temperature, then heated at a rate of 1 °C/min to 400 °C, where it was held for 0.5 h. The temperature was then raised at 1 °C/min to either 600 or 800 °C for 0.5 h. The material was then cooled to room temperature at a rate of 1 °C/min. This process burned off the organic component in the precursor membrane and generated a NiO/NiTiO3 composite nanofiber membrane with stable morphology.
3.3. Characterization and Performance Testing
The crystal phase composition of the sample was analyzed by X-ray powder diffractometer (XRD, D8 Advance, Bruker, Billerica, MA, USA), and the morphology of the sample was analyzed using scanning electron microscopy with a field emission source (SEM, Supra-55, Carl Zeiss Company, Oberkochen, Germany). Microstructural analysis was performed using transmission electron microscope (TEM, FEI Tecnai G2 F20, Hillsborough, OR, USA). The near-surface composition of the sample was characterized using X-ray photoelectron spectroscopy (XPS, ESCALAB 250XI, Thermo Scientific, MA, USA). UV-visible diffuse reflectance spectroscopy was carried out using UV-Visible spectroscopy (UV-Vis, CARY 300, Agilent, Santa Clara, CA, USA). Metal oxide bond type and functional groups were analyzed by Fourier transform infrared spectroscopy (FTIR, Tensor 27, Bruker, Karlsruhe, Baden-Württemberg, Germany).
For photocatalytic performance testing, Rhodamine B (5 mg/L) was used as a model organic pollutant. Twenty milligrams of a NiO/NiTiO3 composite nanofiber membrane sample was added into 30 mL Rhodamine B solution. After 15 min of dark reaction treatment, a full-spectrum parallel light source, providing stable photon energy, was switched on. The supernatant liquid was collected every 15 min till 1.5 h of total illumination, and the absorbance of the liquid at 554 nm was measured using a visible spectrophotometer (VS, 722N, Shanghai Precision Scientific Instrument Co., Ltd., Shanghai, China). Since the photocatalytic degradation reaction of Rhodamine B at low concentration is a quasi-first-order reaction, the relationship between the reactant concentration (c) and the reaction time (t) satisfies the following relationship:
where c0 is the initial concentration, ct is the concentration at the time t, and K is the rate constant. Photocatalytic performance is then evaluated by using the rate constant K of for rhodamine B.
lnc0/ct = Kt
4. Conclusions
The NiO/NiTiO3 nanofiber porous membrane was successfully prepared from electrospinning the PVP/nickel acetate/tetrabutyl titanate nanofiber memebrane precursor after calcination at 800 °C. The two phases are uniformly distributed in the radial direction with individual crystallite diameters of about 50–100 nm, forming a continuous fiber with a diameter of roughly 200 nm. The NiO/NiTiO3 composite with 10% NiO could degrade about 92.9% of the rhodamine B solution after 60 min illumination under full-spectrum light. The degradation rate and rate constant of this composite were significantly improved as compared to pure NiTiO3. This is because the NiO/NiTiO3 heterojunction promotes the generation of superoxide radicals O2− and photogenerated holes h+ by efficiently separating photogenerated charge carriers.
Author Contributions
The study was conceptualized by X.M.; methodology, X.M., B.Y., X.B.; formal analysis, X.M., B.Y.; experiments, B.Y., X.B., J.W.; resources, X.M.; writing original draft preparation, B.Y., X.B.; writing review and editing, X.M., B.Y., C.-Y.L., M.F., X.W., Y.L., Z.H.
Funding
This research was funded by China University of Geosciences (Beijing) Student’s Platform for Innovation and Entrepreneurship Training Program (No. 2018AX044) and Fundamental Research Funds for the Central Universities (No. 2652017342).
Conflicts of Interest
The authors declare no conflict of interest.
References
- Tang, L.; Wang, J.; Liu, X.D.; Shu, X.Q.; Zhang, Z.H.; Wang, J. Fabrication of Z-scheme photocatalyst, Er3+:Y3Al5O12@NiGa2O4-MWCNTs-WO3, and visible-light photocatalytic activity for degradation of organic pollutant with simultaneous hydrogen evolution. Renew. Energy 2019, 138, 474–488. [Google Scholar] [CrossRef]
- Barhoumi, N.; Oturan, N.; Olvera-Vargas, H. Pyrite as a sustainable catalyst in electro-fenton process for improving oxidation of sulfamethazine. Kinetics, mechanism and toxicity assessment. Water Res. 2016, 94, 52. [Google Scholar] [CrossRef] [PubMed]
- Barrera, L.A.; Escobosa, A.C.; Nevarez, A.; Dominguez, N.; Banuelos, J.L.; Westerhoff, P.; Noveron, J.C. TiO2-carbon nanoporous composites prepared via ZnO nanoparticle-templated carbonization of glucose adsorb and photodegrade organic pollutants in water. J. Water Process Eng. 2019, 28, 331–338. [Google Scholar] [CrossRef]
- Chong, M.N.; Jin, B.; Chow, C.W.K.; Saint, C. Recent developments in photocatalytic water treatment technology: A review. Water Res. 2010, 44, 2997–3027. [Google Scholar] [CrossRef]
- Akpan, U.G.; Hameed, B.H. Parameters affecting the photocatalytic degradation of dyes using TiO2-based photocatalysts: A review. J. Hazard. Mater. 2009, 170, 520–529. [Google Scholar] [CrossRef]
- Yu, J.G.; Yu, X.X. Hydrothermal synthesis and photocatalytic activity of zinc oxide hollow spheres. Environ. Sci. Technol. 2008, 42, 4902–4907. [Google Scholar] [CrossRef]
- Zhang, Z.Y.; Shao, C.L.; Li, X.H.; Zhang, L.; Xue, H.M.; Wang, C.H.; Liu, Y.C. Electrospun Nanofibers of ZnO-SnO2 Heterojunction with High Photocatalytic Activity. J. Phys. Chem. 2010, 114, 7920–7925. [Google Scholar] [CrossRef]
- Li, Q.; Li, X.; Wageh, S.; Al-Ghamdi, A.A.; Yu, J.G. CdS/Graphene Nanocomposite Photocatalysts. Adv. Energy Mater. 2015, 5, 1500010. [Google Scholar] [CrossRef]
- Lei, Z.B.; You, W.S.; Liu, M.Y.; Zhou, G.H.; Takata, T.; Hara, M.; Domen, K.; Li, C. Photocatalytic water reduction under visible light on a novel ZnIn2S4 catalyst synthesized by hydrothermal method. Chem. Commun. 2003, 17, 2142–2143. [Google Scholar] [CrossRef]
- Hara, M.; Hitoki, G.; Takata, T.; Kondo, J.; Kobayashi, H.; Domen, K. TaON and Ta3N5 as new visible light driven photocatalysts. Catal. Today. 2003, 78, 555–560. [Google Scholar] [CrossRef]
- Zhu, G.L.; Lin, T.Q.; Lu, X.J.; Zhao, W.; Yang, C.Y.; Wang, Z.; Yin, H.; Liu, Z.Q.; Huang, F.Q.; Lin, J.H. Black brookite titania with high solar absorption and excellent photocatalytic performance. J. Mater. Chem. A 2003, 1, 9650–9653. [Google Scholar] [CrossRef]
- Asahi, R.; Morikawa, T.; Ohwaki, T.; Aoki, K.; Taga, Y. Visible-light photocatalysis in nitrogen-doped titanium oxides. Science 2001, 293, 269–271. [Google Scholar] [CrossRef] [PubMed]
- Woan, K.; Pyrgiotakis, G.; Sigmund, W. Photocatalytic Carbon-Nanotube-TiO2 Composites. Adv. Mater. 2009, 21, 2233–2239. [Google Scholar] [CrossRef]
- Zhang, H.C.; Huang, H.; Ming, H.; Li, H.T.; Zhang, L.L.; Liu, Y.; Kang, Z.H. Carbon quantum dots/Ag3PO4 complex photocatalysts with enhanced photocatalytic activity and stability under visible light. J. Mater. Chem. 2012, 22, 10501–10506. [Google Scholar] [CrossRef]
- Ju, J.F.; Chen, X.; Shi, Y.J.; Wu, D.H. Investigation of PdSn nanometals alloy supported on spherical TiO2 for methanol electro-oxidation. Powder Technol. 2013, 241, 1–6. [Google Scholar] [CrossRef]
- Peng, Y.; Yan, M.; Chen, Q.G.; Fan, C.M.; Zhou, H.Y.; Xu, A.W. Novel onedimensional Bi2O3-Bi2WO6 p-n hierarchical heterojunction with enhanced photocatalytic activity. J. Mater. Chem. A 2014, 2, 8517–8524. [Google Scholar] [CrossRef]
- Yang, Q.; Huang, J.; Zhong, J.B.; Chen, J.F.; Li, J.Z.; Sun, S.Y. Charge separation behaviors of novel AgI/BiOI heterostructures with enhanced solar-photocatalytic performance. Curr. Appl. Phys. 2017, 17, 1202–1207. [Google Scholar] [CrossRef]
- Puddu, V.; Mokaya, R.; Puma, G.L. Novel one step hydrothermal synthesis of TiO2/WO3 nanocomposites with enhanced photocatalytic activity. Chem. Commun. 2007, 45, 4749–4751. [Google Scholar] [CrossRef]
- Teo, W.E.; Inai, R.; Ramakrishna, S. Technological advances in electrospinning of nanofibers. Sci. Technol. Adv. Mater. 2011, 12, 013002. [Google Scholar] [CrossRef]
- Yuan, P.H.; Fan, C.M.; Ding, G.Y.; Wang, Y.F.; Zhang, X.C. Preparation and photocatalytic properties of ilmenite NiTiO3 powders for degradation of humic acid in water. Int. J. Miner. Metall. Mater. 2012, 19, 372–376. [Google Scholar] [CrossRef]
- Hu, C.C.; Teng, H.S. Structural features of p-type semiconducting NiO as a co-catalyst for photocatalytic water splitting. J. Catal. 2010, 272, 1–8. [Google Scholar] [CrossRef]
- Moghiminia, S.; Farsi, H.; Raissi, H. Comparative optical and electrochemical studies of nanostructured NiTiO3 and NiTiO3-TiO2 prepared by a low temperature modified Sol-Gel route. Electrochim. Acta 2014, 132, 512–523. [Google Scholar] [CrossRef]
- Han, H.J.; Chao, S.J.; Yang, X.L.; Wang, X.B.; Wang, K.; Bai, Z.Y.; Yang, L. Ni nanoparticles embedded in N doped carbon nanotubes derived from a metal organic framework with improved performance for oxygen evolution reaction. Int. J. Hydrog. Energy 2017, 42, 16149–16156. [Google Scholar] [CrossRef]
- Li, F.B.; Li, X.Z. Photocatalytic properties of gold/gold ion-modified titanium dioxide for wastewater treatment. Appl. Catal. A-Gen. 2002, 228, 5–27. [Google Scholar] [CrossRef]
- Hu, Y.; Tan, O.K.; Pan, J.S.; Yao, X. A new form of nanosized SrTiO3 material for near-human-body temperature oxygen sensing applications. J. Phys. Chem. B 2004, 108, 11214–11218. [Google Scholar] [CrossRef]
- Qu, Y.; Zhou, W.; Ren, Z.Y.; Du, S.C.; Meng, X.Y.; Tian, G.H.; Pan, K.; Wang, G.F.; Fu, H.G. Facile preparation of porous NiTiO3 nanorods with enhanced visible-light-driven photocatalytic performance. J. Mater. Chem. 2012, 22, 16471–16476. [Google Scholar] [CrossRef]
- Yin, H.Y.; Zhu, J.J.; Chen, J.L.; Gong, J.Y.; Nie, Q.L. MOF-derived in situ growth of carbon nanotubes entangled Ni/NiO porous polyhedrons for high performance glucose sensor. Mater. Lett. 2018, 221, 267–270. [Google Scholar] [CrossRef]
- Pavithra, C.; Madhuri, W. Electrical and magnetic properties of NiTiO3 nanoparticles synthesized by the sol-gel synthesis method and microwave sintering. Mater. Chem. Phys. 2018, 211, 144–149. [Google Scholar] [CrossRef]
- Yuvaraj, S.; Nithya, V.D.; Fathima, K.S.; Sanjeeviraja, C.; Selvan, G.K.; Arumugam, S.; Selvan, R.K. Investigations on the temperature dependent electrical and magnetic properties of NiTiO3 by molten salt synthesis. Mater. Res. Bull. 2012, 48, 1110–1116. [Google Scholar] [CrossRef]
- Mohamed, R.M.; Ismail, A.A.; Othman, I.; Ibrahim, I.A. Preparation of TiO2-ZSM-5 zeolite for photodegradation of EDTA. J. Mol. Catal. A-Chem. 2005, 238, 151–157. [Google Scholar] [CrossRef]
- Rahman, Q.I.; Ahmad, M.; Misra, S.K.; Lohani, M. Effective photocatalytic degradation of rhodamine B dye by ZnO nanoparticles. Mater. Lett. 2013, 91, 170–174. [Google Scholar] [CrossRef]
- Suc, N.V.; Chi, D.K. Removal of rhodamine B from aqueous solution via adsorption onto microwave-activated rice husk ash. J. Dispers. Sci. Technol. 2017, 38, 216–222. [Google Scholar] [CrossRef]
- Selvam, P.P.; Preethi, S.; Basakaralingam, P.; Thinakaran, N.; Sivasamy, A.; Sivanesan, S. Removal of rhodamine B from aqueous solution by adsorption onto sodium montmorillonite. J. Hazard. Mater. 2008, 155, 39–44. [Google Scholar] [CrossRef] [PubMed]
- Lacerda, V.D.; Lopez-Sotelo, J.B.; Correa-Guimaraes, A.; Hernandez-Navarro, S.; Sanchez-Bascones, M.; Navas-Gracia, L.M.; Martin-Ramos, P.; Martin-Gil, J. Rhodamine B removal with activated carbons obtained from lignocellulosic waste. J. Environ. Manag. 2015, 155, 67–76. [Google Scholar] [CrossRef] [PubMed] [Green Version]
- Li, S.J.; Hu, S.W.; Jiang, W.; Liu, Y.P.; Zhou, Y.T.; Liu, Y.; Mo, L.Y. Hierarchical architectures of bismuth molybdate nanosheets onto nickel titanate nanofibers: Facile synthesis and efficient photocatalytic removal of tetracycline hydrochloride. J. Colloid Interface Sci. 2018, 521, 42–49. [Google Scholar] [CrossRef] [PubMed]
- Rawool, S.A.; Pai, M.R.; Banerjee, A.M.; Arya, A.; Ningthoujam, R.S.; Tewari, R.; Rao, R.; Chalke, B.; Ayyub, P.; Tripathi, A.K.; et al. pn Heterojunctions in NiO:TiO2 composites with type-II band alignment assisting sunlight driven photocatalytic H-2 generation. Appl. Catal. B-Environ. 2018, 221, 443–458. [Google Scholar] [CrossRef]
- Sabzehmeidani, M.M.; Karimi, H.; Ghaedi, M. Electrospinning preparation of NiO/ZnO composite nanofibers for photodegradation of binary mixture of rhodamine B and methylene blue in aqueous solution: Central composite optimization. Appl. Organomet. Chem. 2018, 32, 6. [Google Scholar] [CrossRef]
- Najafian, H.; Manteghi, F.; Beshkar, F.; Salavati-Niasari, M. Enhanced photocatalytic activity of a novel NiO/Bi2O3/Bi3ClO4 nanocomposite for the degradation of azo dye pollutants under visible light irradiation. Sep. Purif. Technol. 2019, 209, 6–17. [Google Scholar] [CrossRef]
- Tzvetkov, G.; Tsvetkov, M.; Spassov, T. Ammonia-evaporation-induced construction of three-dimensional NiO/g-C3N4 composite with enhanced adsorption and visible light-driven photocatalytic performance. Superlattices Microstruct. 2018, 119, 122–133. [Google Scholar] [CrossRef]
Figure 1.
XRD patterns of NiO(10%)/NiTiO3 composite nanofibers calcined at different temperatures.

Figure 2.
XPS spectra of NiO/NiTiO3 composite nanofibers calcined at 800 °C. (a) survey scan, and high-resolution scans of (b) Ni2p, (c) Ti2p, and (d) O1s.
Figure 2.
XPS spectra of NiO/NiTiO3 composite nanofibers calcined at 800 °C. (a) survey scan, and high-resolution scans of (b) Ni2p, (c) Ti2p, and (d) O1s.

Figure 3.
FTIR spectra of NiO/NiTiO3 composite nanofibers calcined at 800 °C.

Figure 4.
SEM images of (a,b) precursor of a NiO(10%)/NiTiO3 composite nanofiber membrane, and (c,d) the same sample calcined at 800 °C.
Figure 4.
SEM images of (a,b) precursor of a NiO(10%)/NiTiO3 composite nanofiber membrane, and (c,d) the same sample calcined at 800 °C.

Figure 5.
(a,b,d) TEM images of NiO/NiTiO3 composite fibers calcined at 800 °C, (c) selected area electron diffraction in (b), and (e,f) high-resolution TEM images.
Figure 5.
(a,b,d) TEM images of NiO/NiTiO3 composite fibers calcined at 800 °C, (c) selected area electron diffraction in (b), and (e,f) high-resolution TEM images.

Figure 6.
(a) STEM-HAADF images of NiO(10%)/NiTiO3 composite nanofiber films, (b,c) show the EDX element Line Scanning of the yellow line in (a), (d) shows the EDX energy spectrum.
Figure 6.
(a) STEM-HAADF images of NiO(10%)/NiTiO3 composite nanofiber films, (b,c) show the EDX element Line Scanning of the yellow line in (a), (d) shows the EDX energy spectrum.

Figure 7.
(a) The UV-vis diffuse reflectance spectra of NiO(10%)/NiTiO3 composite nanofiber films; (b) degradation of RhB concentration with respect to reaction time and (c) their first order reaction kinetics curve and (d) K values of the degradation rates of various samples. Rhb is a blank control group in figure (b), which hardly degrades after 60 min illumination under UV-visible full spectrum.

Figure 8.
Cycling degradation curves of NiO(10%)/NiTiO3 nanofiber films on the degradation of 5 mg/L RhB.
Figure 8.
Cycling degradation curves of NiO(10%)/NiTiO3 nanofiber films on the degradation of 5 mg/L RhB.

Figure 9.
Diagram of the photocatalytic mechanism of NiO–NiTiO3 composite nanofiber films.

© 2019 by the authors. Licensee MDPI, Basel, Switzerland. This article is an open access article distributed under the terms and conditions of the Creative Commons Attribution (CC BY) license (http://creativecommons.org/licenses/by/4.0/).
Share and Cite
MDPI and ACS Style
Yang, B.; Bai, X.; Wang, J.; Fang, M.; Wu, X.; Liu, Y.; Huang, Z.; Lao, C.-Y.; Min, X. Photocatalytic Performance of NiO/NiTiO3 Composite Nanofiber Films. Catalysts 2019, 9, 561. https://0-doi-org.brum.beds.ac.uk/10.3390/catal9060561
AMA Style
Yang B, Bai X, Wang J, Fang M, Wu X, Liu Y, Huang Z, Lao C-Y, Min X. Photocatalytic Performance of NiO/NiTiO3 Composite Nanofiber Films. Catalysts. 2019; 9(6):561. https://0-doi-org.brum.beds.ac.uk/10.3390/catal9060561
Chicago/Turabian StyleYang, Bozhi, Xuefeng Bai, Jiaxuan Wang, Minghao Fang, Xiaowen Wu, Yan’gai Liu, Zhaohui Huang, Cheng-Yen Lao, and Xin Min. 2019. "Photocatalytic Performance of NiO/NiTiO3 Composite Nanofiber Films" Catalysts 9, no. 6: 561. https://0-doi-org.brum.beds.ac.uk/10.3390/catal9060561
Note that from the first issue of 2016, this journal uses article numbers instead of page numbers. See further details here.