Anatomical Variation of Human Bone Bioapatite Crystallography


1
Department für Geo- und Umweltwissenschaften, Ludwig-Maximilians-Universität, 80333 Munich, Germany
2
Staatssammlung für Anthropologie und Paläoanatomie München, Karolinenpl. 2a, 80333 Munich, Germany
*
Author to whom correspondence should be addressed.
Crystals 2020, 10(10), 859; https://0-doi-org.brum.beds.ac.uk/10.3390/cryst10100859
Submission received: 1 August 2020
/
Revised: 12 September 2020
/
Accepted: 17 September 2020
/
Published: 24 September 2020
(This article belongs to the Special Issue Biominerals: Formation, Function, Properties)
Abstract
:This systematic investigation of bioapatite, the mineral component of human bone, aims to characterize its crystallographic state, including lattice parameters and average crystallite size, and correlate these values with respect to anatomical position (bone function), physicality, and bone chemical composition. In sample sets of buried bone from three different human adult skeletons, anatomical variation of crystallographic parameters and correlation to chemical composition were indeed observed. In general, the observed bioapatite a unit-cell edge-length among all analyzed human bones in this study was larger by 0.1–0.2% compared to that of stoichiometric hydroxylapatite (HAp), and substantially larger than that of fluorapatite (FAp). Across all analyzed samples, the a (=b) lattice parameter (unit cell edge-length) varies more than does the c lattice parameter. Average crystallite size (average coherent diffracting domain size) in the c-direction was equal to approximately 25 nm, ranging among the analyzed 18 bone samples from about 20–32 nm, and varying more than crystallite size in the a,b-direction (~8–10 nm). Neither lattice parameters nor average bioapatite crystallite sizes appeared to be correlated with bone mechanical function. The relative chemical composition of the bone material, however, was shown to correlate with the a (=b) lattice parameter. To our knowledge, this research provides, for the first time, the systematic study of the crystallographic parameters of human bone bioapatite in the context of anatomical position, physical constitution, and bone chemical composition using X-ray powder diffraction (XRPD) and Fourier transform infrared spectroscopy (FTIR).
1. Introduction
Apatites have long been employed in biomedical innovations. The first documented use of an implanted calcium phosphate mineral dates back to almost 100 years ago, when Albee (1920) [1] successfully demonstrated the use of tricalcium phosphate as a stimulus to enhance bone growth and repair after fracture in rabbits. Calcium phosphates have long been explored for their therapeutic potential as biomaterials [2,3]. Over the last decades, substituted hydroxylapatites have been synthesized and investigated for their suitability in biomedical applications, which range from bone tissue scaffolds to bioactive coatings for implants [4,5,6,7]. A more thorough understanding of bone mineral structure and composition throughout the human body could guide selection of ionic substitutions for synthetic alternatives. Learning more about human bone mineral structure should not only be considered a priority in biomaterials research; archaeologists and anthropologists can face difficulties identifying the ages of subjects post-mortem from skeletal remains for individuals ranging in age between the young adult and late adult age groups [8,9], particularly in those remains which are archaeological [10]. A comprehensive database outlining potential trends in bone mineral structure in the context of such variables as anatomical position of the bone or subject age, build, and gender could prove useful to professionals tasked with identifying human skeletal remains. It appears that comparatively few studies have focused on detailing the crystallographic parameters of human bone bioapatite [11,12,13,14,15,16,17,18,19] to our knowledge. Systematic studies of the variation of bone mineral crystallographic structure with respect to anatomical position have yet to be performed but could yield information useful to the development of biomimetic materials [20] and the investigation of archaeological and forensic bone samples [8,9,20,21,22].
Bone tissue is composed of an inorganic mineral phase (including the calcium phosphate biomineral commonly referred to as bone apatite or bioapatite), an organic phase (including mainly the extracellular matrix and the cells involved in bone formation and remodeling), and water [23,24]. Bone’s relative composition is approximately 60 wt% mineral content, 30 wt% organic content, and 10 wt% water [25,26,27]. The structure of bone is complex and hierarchically organized. The inorganic mineral component is a nanocrystalline phase which gives bone its rigid constitution and characteristic hardness; this inorganic phase itself forms amongst the organic matrix [1,28,29,30,31]. The organic matrix consists chiefly of bundled Type I collagen fibrils, which provide elasticity, as well as other non-collagenous proteins and glycoproteins [32,33,34,35,36].
More complex than hydroxylapatite ((Ca10(PO4)6(OH)), bioapatite has a structure which can be better described as a calcium-deficient and carbonate-substituted version of its stoichiometric relative (hydroxylapatite, Ca/P = 1.67) [37]; the specific substitutions can be described by the flexible formula ((Ca, Mg, Na, vacancy)5(PO4, HPO4, CO3)3)(CO3, H2O, OH, F, Cl…)) [27,38,39]. The 2002 review of apatite-group minerals by Pan and Fleet includes a table worth referencing which summarizes crystallographic lattice parameters for different varieties of apatite mineral determined in earlier studies [39]. For context, the a lattice parameters reported in the review for fluorapatite, carbonate-bearing fluorapatite, hydroxylapatite, and carbonate-bearing hydroxylapatite, are listed as 9.391 Å, 9.346 Å, 9.4166 Å, and 9.419 Å, respectively [39].
Greiner et al. [40] showed that bovine femoral bone contains no FTIR-detectable hydroxide; it contains water and carbonate instead. Bioapatite characteristically consists of approximately five to eight weight percent carbonate, which is supposed to substitute in specific “Type A” (in place of hydroxyl ions in the channel along the crystallographic c-axis) and “Type B” (in place of tetrahedral phosphate groups) sites [41,42,43,44]. It is thought that the charge balance for carbonate substitution of phosphate is maintained by a loss of calcium cations, while charge balance for the carbonate substitution of hydroxyl is maintained by hydroxyl vacancies [39,41].
Carbonate-containing bioapatite shows greater solubility than does hydroxylapatite [42]. It is theorized that when carbonate ions substitute into hydroxyl channel sites or replace the phosphate group, their size and charge mismatch introduces structural disorder, and that the high surface area of the smaller crystallites and the increased structural disorder both contribute to an increase in free energy, thus resulting in improved solubility, which in turn can affect the bone remodeling cycle [22,40]. Specifically, such an increase in solubility facilitates bone resorption [43,44,45].
The accommodating nature of the bioapatite lattice permits facile ionic substitution throughout, although substitution is limited by the ionic species available in vivo. An impressive 99% of the human body’s supply of calcium [46], 85% of its supply of phosphorus, 60% of its supply of magnesium [47], and 25% of the supply of sodium [48] are estimated to be stored within the skeleton at any given time. Fluoride and chloride ions substitute preferentially in hydroxyl sites, and various cations may substitute for calcium [40].
The flexibility of the lattice which permits this ion substitution is vital to the metabolic processes required to sustain life. The nanocrystalline structure of the bioapatite phase is also suited to this purpose; the large surface area of nanocrystals facilitates ion exchange and dissolution of atomic species within the lattice [41]. The absence of carbonate species within the lattice of bone apatite, as in the transformation to hydroxylapatite upon calcination, has been shown to result in increased crystallite sizes and smaller lattice parameters [40], which may hinder ion exchange.
Metabolic activity, which may change with respect to age, disease, injury, diet, or physical activity, will influence ion exchange and therefore bioapatite lattice parameters and composition, complicating its characterization [35,49]. Systematic studies of the diversity of bioapatite structure and composition could help to elucidate possible relationships between factors such as bone function or shape and specific structural traits.
The focus of this study is to investigate the dependence of crystallographic parameters (bioapatite lattice parameters and the crystallite or “coherent diffracting domain” sizes) on biomechanical load situation. We analyze human bones from various anatomical positions in three different subjects using XRPD and perform Rietveld refinement of diffraction data to examine crystallographic structural parameters and attenuated total reflection (ATR) FTIR to examine relative chemical composition.
2. Materials and Methods
A total of 18 human bone samples were provided for the study by the State Collection for Anthropology and Paleoanatomy in Munich, Germany. All remains were sourced from the same churchyard cemetery of St. Pankratius in Altdorf/Düren, Germany, and may have been interred there any time between 1860 to the mid−20th century [50]. Six bone samples from different locations in the body were taken from each of three individual skeletons: an average-build male (ABM) aged 60–70 at time of death, a robust-build male (RBM) aged 20–25 at time of death, and a petite-build female (PBF) whose age could not be determined. Adult skeletons were used so that all samples would be representative of completed skeletal development. Skeletons of varying physical build were selected expecting differing mechanical stresses on the bones.
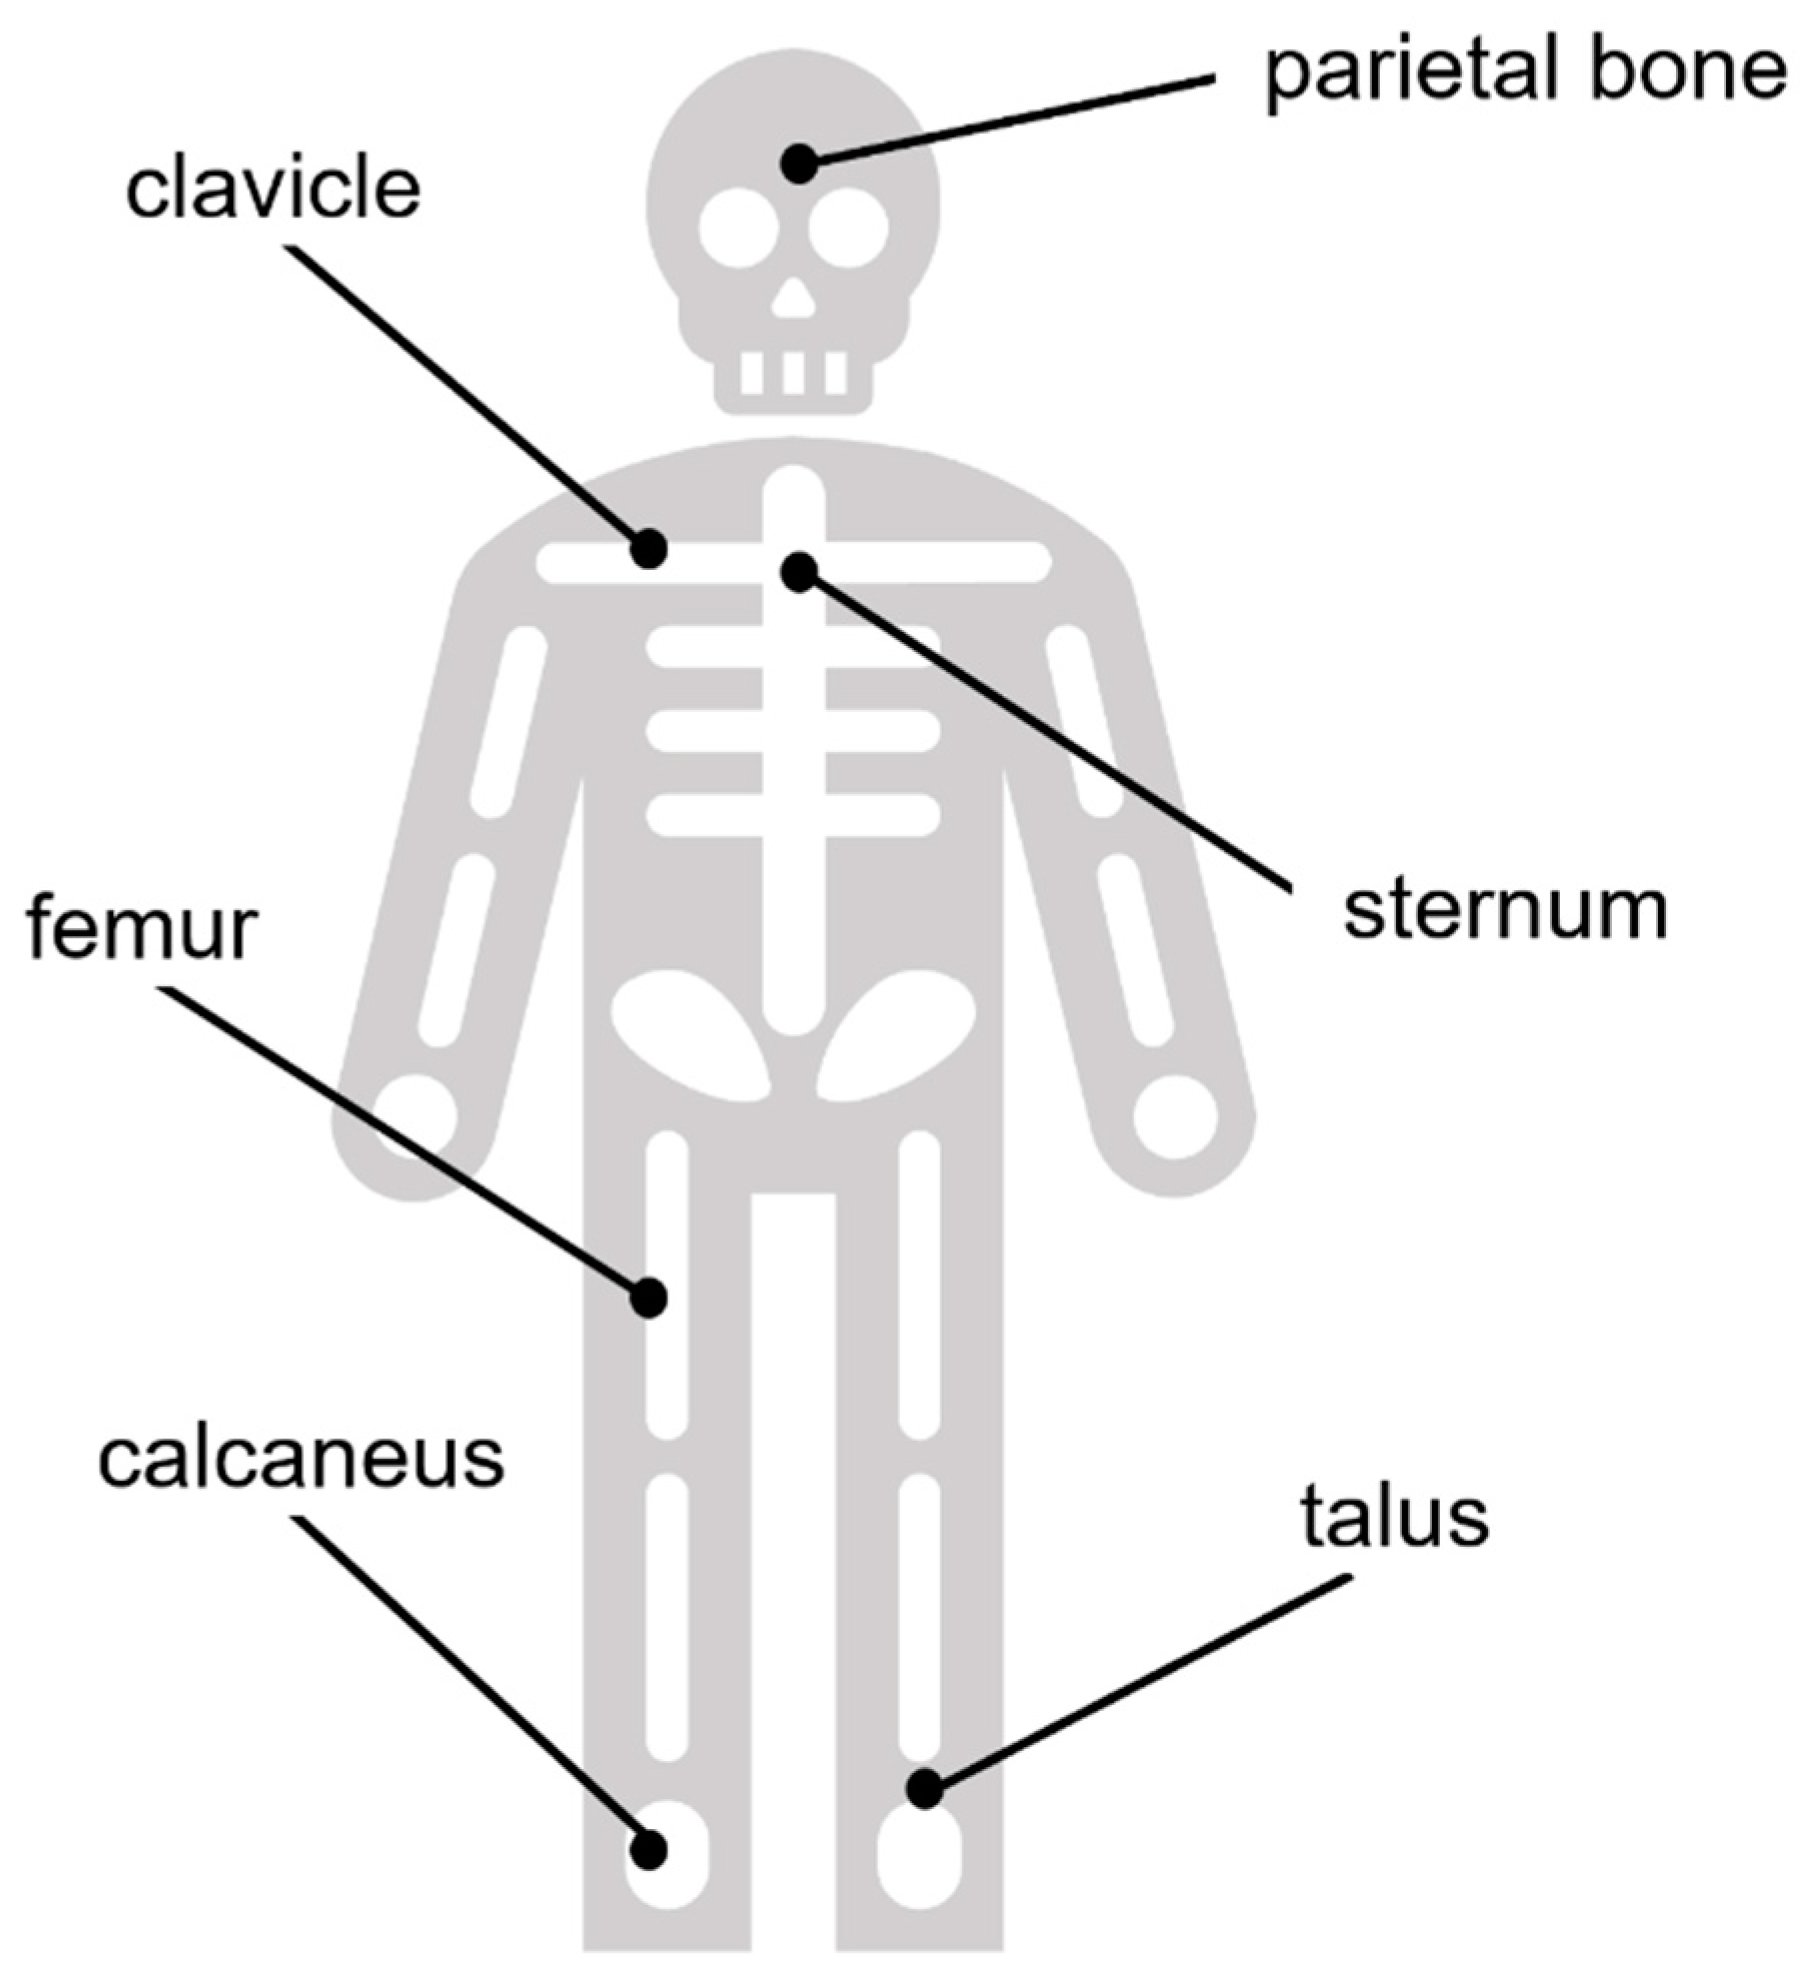
Bone samples measured ca. 2 cm × 2 cm (4.5 cm3) and were removed using a Dremel Multi-Tool equipped with a fine-toothed circular saw. Samples in all three individuals were excised from the same areas and were selected to represent differences in biomechanical stresses on the bones. Sample areas included the mid-posterior calcaneal tuberosity (rationale: tendon attachments at the calcaneus), superior aspect at mid-shaft of the clavicle (rationale: non-weight-bearing), anterior diaphysis at mid-shaft of the femur (rationale: significant weight-bearing and muscular stress), parietal eminence of the parietal bone (rationale: non-weight-bearing), middle of the sternal body (rationale: non-weight-bearing), and the talus at the middle of the articular surface of the trochlea (rationale: heavy focal pressure). A diagram demonstrating the approximate anatomical locations of these bones in the body is provided in the Appendix A (Figure A1) for further reference. Considering the bone morphologies, we can also compare flat (parietal, sternum), long (femur, clavicle), and short bones (calcaneus, talus) within the scope of our study.
Bone samples were neither demineralized nor cleaned by chemical means prior to characterization, but were brushed clean to remove debris, rinsed with water to evacuate fine particulates, and allowed to air dry. Cleaned and dried bone samples were homogenized by agate mortar and pestle prior to characterization by XRPD. Ground bone powder was sieved using a 100 µm plate to control for particle (agglomerate) size. Internal standard (NIST 660b LaB6) was incorporated into final powder samples at approximately two weight percent to calibrate instrumental aberrations in order to improve the accuracy of the refinement results.
XRPD was performed using a General Electric (Ahrensburg, Germany), type 3003 powder X-ray diffractometer with Bragg-Brentano geometry and a 1D-Meteor detector (DECTRIS, Ltd., Baden, Switzerland). Samples were analyzed on zero-background quartz single crystal sample holders using Cu-Kα1 monochromator (HUBER, Rimsting, Germany)-selected incident radiation at 1000 s total exposure time per step and 0.013° 2θ step size over the range of 10–110° 2θ at 40 kV and 40 mA.
Data processing, including Rietveld refinement [51] and fitting by the Le Bail method [52], was performed using the FULLPROF software suite and code [53,54]. The background function was fit using a six-coefficient polynomial. Structure refinement was performed over the 10–110° 2θ range. Considerable agreement between the observed and theoretical diffraction profiles was achieved using a Ca-deficient apatite model with hexagonal symmetry [55] by refining the scale factor, sample displacement, apatite unit cell axes lengths, and peak shape parameters. The lattice parameters of the NIST 660b LaB6 internal standard were fixed to the certified values and used to refine sample displacement.
The fitting of Caglioti parameters was aided with the use of an instrumental resolution function (IRF) determined from the NIST 660b LaB6 internal standard. A Thompson–Cox–Hastings Voigt profile was chosen, convoluting the instrumental resolution with anisotropic crystallite size and isotropic microstrain broadening [56]. Temperature factors and site occupancies were held constant. Peak broadening, which results from the poorly crystalline nature of bioapatite, complicates the interpretation of crystallite size (coherently scattering domain size) approximations by Rietveld refinement and the Scherrer equation. For crystallite size determination, a cylindrical anisotropy was employed (the so-called “platelet shape model” of FULLPROF software [40,53,54]). This model allows for different crystallite size in the [001] or c-axis direction from that in the (001)-plane or a-b-plane. As the crystallographic symmetry is hexagonal, reflections hkl, ihl, and kil, where i = −(h + k) are perfectly superimposed, so an additional anisotropy within the a-b-plane cannot be resolved realistically with the XRD method and only an average crystallite size for the a-b-plane was obtained. The 002 reflection corresponds to the crystallographic c-axis and its sharper profile relative to the other XRD peaks indicates elongated growth in the c-direction [17,57]. To determine the average crystallite size in the crystallographic c-direction, the 002 reflection was sectioned from 25.50° 2θ to 26.40° 2θ for refinement and fitted independently of the other reflections.
Whole-pattern fitting with constant scale factor (Le Bail method) was also performed. The lattice parameters for either sample which had been previously determined using the Rietveld method were employed as initial parameters. Fitting was performed over the full 2θ range, using only a four-coefficient polynomial background function. The percent difference between the lattice parameters determined by either method is provided as the error value, as it surpassed the estimated standard deviation calculated from the counting statistics according to the Rietveld method alone. All bone samples in this study were also analyzed by FTIR to verify that the human bone mineral is carbonated apatite. A Spectrum Two FT-IR Spectrometer (PerkinElmer LAS, Rodgau, Germany) equipped with a micro-attenuated total reflection monoreflective objective (Diamond ATR Pike GladiATR™, Pike Technologies, Madison, WI, USA) was used in reflection mode for all samples. Each measurement collected 128 scans at a spectral resolution of 4 cm−1. Curve-fitting was achieved using a residuals-based method, assumption of a Gaussian peak shape, application of a linear baseline and no smoothing. Spectra were fitted over the range of 1580–1715 cm−1 for the amide I band region, over the range of 885–1200 cm−1 for the phosphate band region, and over the range of 820–890 cm−1 for the ν2 carbonate band region. Visual representations of these regions of interest are annotated in spectra provided in the Results section. Additionally, exemplary FTIR spectra of human femur bones from this study compared to spectra of fresh bovine bone femur and a bovine femur heated at 1000 °C as a hydroxylapatite reference [40] are shown in the Appendix A (Figure A2).
3. Results
Figure 1a–c display comparisons of the XRPD profiles; for clarity, only the range of 24–40° 2θ is shown for each bone sample from the ABM, PBF, and RBM, respectively.
In addition to bioapatite and the internal standard, quartz was identified in 13 out of 18 total samples. Where necessary, quartz was incorporated into the refinement procedure as a third phase.
The Rietveld refinement fits of all bone samples for the ABM, PBF, and RBM are given in the Appendix A as Figure A3, Figure A4 and Figure A5, respectively. Figure 2 shows an example of the differences observed after performing Rietveld refinement versus the Le Bail fit for bone material from the RBM clavicle. The Le Bail fit yielded an improved match compared to the Rietveld refinement. The greatest improvement was observed around the major diffraction peak at 31.7° 2θ resulting from the equivalent 121 and 211 reflections and its overlapping neighbors at 32.2° 2θ (112), 32.9° 2θ (030), and 34.0° 2θ (022). However, an improved match with the Le Bail method is also evident from the flattened residuals function across the entire 2θ range.
We were unable to achieve a satisfactory fit for the 002 peak profile when it was refined together with all peaks in the full 2θ range of the diffractogram using the crystallite size anisotropy models in FULLPROF. The 002 reflection at 25.9° 2θ persists with an ill fit of peak shape even with the application of the Le Bail method, which is to be expected considering the elongation of bioapatite crystallite growth in the c-direction.
The Rietveld refinement relies on an adequate parameterization of the structural model, i.e., atomic positions and site occupancies, etc., to describe the observed diffraction intensities. The LeBail fit, on the other hand, adjusts the intensity of reflections freely and does not rely on a specific structural model other than the dimensions of the unit cell. The description of the peak shape and peak widths with an anisotropic parameterization of the size and shape of the coherently diffracting domain is consistent for both refinements in our study. Thus, the result of the Rietveld vs. LeBail comparison is that the main remaining discrepancies between calculated and observed diffraction profile do not reside in inadequacies of the peak shape model. Rather, they can be attributed to limitations in parameterizing said structural model. The employed parameterization of the structure allows optimization of its adjustable parameters by the Rietveld process, so inadequacies are introduced through non-adjustable fundamental assumptions, e.g., the location and orientation of carbonate groups in the structure. However, there are simply too many possibilities and conceivable parameters for this to expect a unique solution based on the small remaining differences of observed and calculated diffraction profile.
Lattice parameters determined by Rietveld refinement of bioapatite are provided in Table 1 with estimated uncertainties. Figure 3 displays the a (=b) (Figure 3a) and c (Figure 3b) lattice parameters for bioapatite as determined by the Rietveld refinement of the XRPD profile for each bone sample, as well as their percent difference from the average lattice parameter value across all samples.
Bone samples from the RBM subject showed a (=b) lattice parameters equal to or larger than the mean taken over all samples, except for the sternum. However, the c lattice parameter for the RBM sternum showed the greatest percent difference from the mean, yielding the largest value of all samples. Both the RBM and the ABM showed significant (p < 0.10) variation of the a (=b) lattice parameter from the mean of all samples. The ABM showed considerable variation of the a (=b) lattice parameter which tended to fall below the average. Values for the PBF showed less deviation among themselves, especially in terms of the c unit cell length for all samples, which also tended to not stray from the mean.
In some cases, the a (=b) lattice parameter was consistent within error between subjects for a given anatomical position. The a (=b) lattice parameter for the calcaneus was almost identical in the RBM and the PBF, but was less beyond error in the ABM. The same pattern is true for the a (=b) lattice parameter for the parietal bone. The a (=b) lattice parameter for the sternum was consistent within error across all three subjects. Samples from the talus, femur, and clavicle did not show consistent values between subjects.
The c lattice parameter for the clavicle, sternum, and talus all differed beyond error between subjects with respect to anatomical position. The c lattice parameter for the calcaneus was consistent between the ABM and the RBM, but was greater for the PBF. The c lattice parameter for the femur was consistent for the ABM and the PBF, and both were greater than that for the RBM. The c lattice parameter for the parietal bone was consistent within error between the RBM and the ABM and between the ABM and the PBF. The c lattice parameters for each subject did not appear to differ significantly from the mean (p > 0.10). Overall, our lattice parameter variation did not show any clear dependence on bone function and the associated mechanical stresses.
All diffractograms showed a sharper 002 reflection compared to the peak shape profiles of the other reflections, specifically, 121, 112, and 030. Sharper peaks observed for the 00l reflections is evidence of elongation of the bioapatite mineral crystallites (coherently diffracting domains) in the c-direction. X-ray diffraction cannot distinguish different crystallite sizes in the a- and b-directions, as the corresponding peaks are directly superimposed. The obtained average crystallite size in the a,b-direction and the average crystallite size in the c-direction are summarized in Table 2 and visualized in Figure 4.
The experimental uncertainty of calculated average crystallite size was determined by repeated refinement from different starting parameters; the estimated error was taken as the difference between values reached upon convergence from no less than 10 refinements and was found to be approximately five percent.
The calcaneus showed the lowest average crystallite size in the c-direction across all sample sets. In the RBM, the calcaneus was followed by the sternum and the parietal bone as second lowest, both consistent within error. The RBM femur and talus had the next greatest crystallite size in the c-direction, also consistent within error. The RBM clavicle yielded a larger value than the other bones.
In the PBF, the clavicle and the sternum shared the next lowest crystallite size in the c-direction (after the PBF calcaneus). The PBF talus was third and consistent within error to the sternum. The femur was surpassed by the parietal bone for the maximum crystallite size in the c-direction in the PBF.
In the ABM, the second lowest crystallite size in the c-direction (after the ABM calcaneus) was observed for the clavicle and the femur, both consistent within error. The value for the ABM parietal bone, only slightly higher, was consistent with that of the femur. The maximum crystallite sizes in the c-direction for the ABM were observed in the sternum and talus, which were consistent within error. Maximum crystallite size in the c-direction was greatest for the RBM and lowest for the PBF.
Average crystallite size in the a,b-direction varied with respect to anatomical position and between subjects. The coefficient of variation is used here to compare the distributions of average crystallite sizes. The coefficient of variation (cv) is defined as where σ is the sample standard deviation and µ is sample mean. Values for the ABM varied slightly more (~6.3% cv,ABM) than did those for the RBM and PBF (~5.7% cv,RBM, ~5.9% cv,PBF).
Average crystallite size in the c-direction varied considerably between subjects. Values for the RBM varied more (~15.9% cv,RBM) than did those for the PBF and ABM (~9.4% cv,PBF, ~6.7% cv,ABM).
This pattern was not observed for the average crystallite size in the a,b-direction. The minimum crystallite size in the a,b-direction was observed in the talus, calcaneus, and sternum in the ABM, PBF, and RBM, respectively. In the ABM, the clavicle, parietal bone, and sternum values were consistent within error. In the PBF, the femur, parietal bone, sternum, and talus were consistent within error. Values for the bones of the RBM showed more variation; values for the femur and sternum were lowest and consistent within error, closely followed by the calcaneus and the parietal bone, whose values were consistent with the femur. The clavicle and talus showed slightly greater values. The maximum crystallite size in the a,b-direction was observed in the sternum, clavicle, and talus of the ABM, PBF, and RBM, respectively. Average crystallite size in the a,b-direction for the ABM and the RBM differed significantly (p < 0.10) from the mean of all samples. Average crystallite size did not appear to exhibit any dependence on bone function or morphology (i.e., flat, long, short).
Peak fitting of FTIR spectra of human bone can be utilized to determine relative changes in chemical parameters between samples [58,59]. The regions of interest in the FTIR spectra of human bone samples considered in this study are visualized in Figure 5a. In this case, the mineral-to-matrix ratio (M/M) is defined as the ratio of the integrated peak area for the phosphate band region from 885–1200 cm−1 to the integrated peak area over the amide I band region from 1580–1715 cm−1; the carbonate-to-phosphate ratio (C/P) is defined as the ratio of the integrated peak areas for the ν2 carbonate out-of-plane bending region sectioned from 820–890 cm−1 (region was fitted with three peaks at average positions of approximately 861 cm−1, 872 cm−1, and 880 cm−1) to that of the aforementioned phosphate band region [58] (Figure 5b); and a carbonate-to-organic ratio is defined as the integrated peak areas for the ν2 carbonate band region to that of the amide I band region [58]. An example of the peak-fitting featuring the ν2 carbonate band region in the ATR-FTIR spectrum of bone material from the ABM calcaneus is provided in Figure 5c.
The chemical parameters of the bone samples, as far as they can be described by the above defined spectral features, did not appear to correlate with anatomical position nor with bone morphology.
4. Discussion
In this pilot study, we analyzed crystallographic structural data for human bone, including crystallographic lattice parameters and average crystallite size as determined by Rietveld refinement, for their variation with respect to anatomical location of the bone and physical constitution and age of the individual. We examined parameters determined directly from refinement and calculated results for information about the size of the crystallographic unit cell so that we may gain more insight into substitution trends of bioapatite compared to hydroxylapatite.
4.1. Consideration of Diagenetic Overprint
As the analyzed bone samples were buried for about 100 years, it is necessary to address the possibility that the bones underwent diagenetic alterations, such as trace element uptake. A common method to assess the degree of this diagenetic alteration is the determination of the Infrared Splitting Factor (IRSF), an indicator of bone crystallinity (e.g., [60,61]). However, studies have shown that one should not only rely on the IRSF to estimate the diagenetic change of bone [62]. Numerous authors (e.g., [62,63]) discuss that the crystallinity seems to be more related to the taphonomic conditions and that the chemical alteration of bone is controlled by site-specific conditions. As such, if these samples have thus been chemically altered, they are expected to be comparably affected, as the bodies were buried at the same location and so the site-specific conditions, such as groundwater or soil characteristics, are believed to be consistent.
The preservation of bone post-mortem mainly depends on whether the intimate association between collagen and mineral remains intact [64] The degradation of the collagen is caused by microbial attack [64,65]. Hence, processes which induce diagenetic alteration of buried bone, such as mineral-pore water interactions, are rate-limited by the breakdown / decomposition of collagen and therefore exposure of crystal surfaces [62]. In our samples, we rule out the substitution of F− after considering the lattice parameters reported for fluorapatite (2.02 wt% F−) by Stathopoulou et al. [21], which are substantially smaller than the bone mineral lattice parameters and our samples plotted in the region of fresh bovine bone (Figure 6). In a study of archeological animal bones sampled in the same region as the human bones investigated in the present study, and covering ages from 7600 to 550 years before present, Schmahl et al. [22,66] found no significant correlation between archeological age (burial time) and lattice parameters. In summary, we therefore conclude that the biomineral structure in our analyzed bone samples remained widely untouched by diagenetic processes during the 100 years of burial.
4.2. Consideration of Literature Findings
The average a (=b) lattice parameter over all samples was 9.4354(33) Å. This value is greater than the values reported for hydroxylapatite, carbonate-bearing hydroxylapatite, and carbonate-bearing fluorapatite in the 2002 review of apatite-group minerals by Pan and Fleet [39]: 9.4166 Å, 9.419 Å, and 9.346 Å, respectively. However, this average is comparable to the value previously reported by Meneghini et al. (2003) [17] for human fetal bones (9.4411(57) Å), although it is 0.55% greater than the value which they reported for fresh adult bone (9.3836(9) Å). The average c lattice parameter over all samples was 6.8866(4) Å, comparable with the values reported in the Pan and Fleet review for carbonate-bearing hydroxylapatite and carbonate-bearing fluorapatite (6.8860 Å and 6.8870 Å, respectively) [39]. This average was also consistent with the value reported by Meneghini et al. (2003) [17] for human fetal bones (6.8862(23) Å), but 0.17% greater than their finding for adult bone (6.8745(9) Å) and the value for hydroxylapatite reported by Pan and Fleet (also 6.8745 Å) [39]. Greiner et al. (2019) [40] observed lattice parameters for fresh bovine femur (a = b = 9.4376(5) Å, c = 6.8847(5) Å) which are within 0.03% of the average values observed for adult human bone in this study.
Nuzzo et al. (2003) [18] observed a crystallite size along the c-direction of approximately 15–25 nm for human fetal bones and approximately 40 nm for adult bone samples, compared to a size of more than 60 nm for their synthetic hydroxylapatite. In the present study the crystallite size observed in the c-direction, averaged across all 18 bone samples, was equal to approximately 25 nm, ranging overall from about 20–32 nm. The average crystallite size in the c-direction is consistent with values observed by Nuzzo et al. (2003) [18] for fetal bones. In their investigation of archaeological bone samples from various domestic animals, Greiner (2019) [67] observed crystallite sizes in the c-direction ranging from 16.5 nm to almost 35 nm, which is consistent with the range observed in this study. Greiner (2019) [67] observed average crystallite sizes in the a,b-direction ranging from approximately 6–14 nm, also consistent with our findings (~8–10 nm).
4.3. Trends of Crystallostructural Variation
In Figure 6, the lattice parameters determined from refinement are plotted with respect to the calculated unit cell volume following the suggestion of Handschin and Stern (1992) [13] and Stathopoulou et al. (2008) [21]. To compare measured variation of the a and c lattice parameters, which have different absolute values, both data sets are plotted using the same relative scale of strain, with respect to the unit cell dimensions of hydroxylapatite (HAp) as reference. Accordingly, the strains for both the a- and c-axis of the unit cell are defined as:
The reference values of hydroxylapatite unit cell lengths are taken from Greiner et al. (2019) [40]. This hydroxylapatite sample was generated from bovine bone apatite by heat treatment at 1000 °C (see Greiner et al. 2019 [40] for details). Note that even though significantly decreased unit cell lengths are observed for hydroxylapatite compared to bone apatite, its values are consistent with the trend observed for bone bioapatite unit cell lengths vs. unit cell volume in Figure 6.
The unit cell volume V is trivially related to the lattice parameters as and because of this the trends in Figure 6 may at first appear trivial. However, we observe that the a (=b) lattice parameter varies in a much wider (relative) range than the c lattice parameter, which remains relatively constant. This finding is consistent with the same trend originally realized by Stathopoulou et al. (2008) [21] and confirmed by Schmahl et al. (2017) [22] in their investigation of 63 archaeological bone samples by XRPD and Rietveld refinement.
From the expected theoretical slopes of the graphs of unit cell edge lengths versus unit cell volume (, ) in Figure 6 can be calculated as and . Thus, we find that for a random distribution of the lattice parameters around the observed mean values, we expect in Figure 6 a slope of 0.00889 Å−2 for lattice parameter a (=b) and a ~25% larger slope of 0.0130 Å−2 for lattice parameter c. Contrary to this expectation, we observed that c is almost constant with a relative standard deviation of 0.018% (excluding HAp), while only the lattice parameter a (=b) varies significantly with a relative standard deviation of 0.032% (excluding HAp), showing the expected calculated slope versus unit cell volume, V.
Greiner et al. (2019) [40] showed that the a (=b) unit cell length in bovine bone decreases from approximately 9.432 Å to 9.422 Å (both measured at room temperature) upon annealing at 650 °C, which drives out the carbonate and produces hydroxylapatite. In other words, the unit cell (as measured at room temperature) in fact shrinks as bone carbonate apatite transforms to hydroxylapatite (cf. Figure 6).
Figure A2 compares the FTIR spectrum of the hydroxylapatite produced by Greiner et al. (2019) [40] with a representative FTIR spectra of human bone samples from the femurs of the ABM, PBF, and RBM. Carbonate absorption bands are present in the human bone bioapatite samples and the OH− libration and stretching signals are absent, while the hydroxylapatite sample clearly exhibits the OH− stretching and libration absorption bands and the carbonate signals are absent. In this regard, we associate decreased a (=b) unit cell length with reduced carbonate content. This may be supported by our observation of some correlation of the a (=b) unit cell length with increasing carbonate-to-organic ratio for this sample set (Figure 7).
Handschin and Stern (1992) claimed (see their Figures 2 and 3 in [13]) that hydroxylapatite has larger lattice parameters than bone apatite; however, they obtained their reference values for hydroxylapatite from a 1962 textbook on minerals, which quotes only two digits after the comma (as sufficient for a textbook). With our more accurate and reliable reference value for HAp, which is also very close to the values of the NIST standard we come to the opposite conclusion than Handschin and Stern (1992) [13] as far as lattice parameters of human bone compared to hydroxylapatite are concerned.
4.4. Implications for Substitution Trends
The plot in Figure 6 clearly illustrates that the crystallochemical variation of bone apatite, which can probably be related to exchange of carbonate for phosphate and of water and carbonate for OH−, affects the a-axis more significantly than the c-axis of the unit cell of the natural bone mineral. Increased a (=b) lattice parameters relative to stoichiometric hydroxylapatite have been proposed to be suggestive of carbonate preferentially occupying OH− channel sites (A-type substitution) from experimental studies [68,69,70,71] as well as DFT modeling [72]. It has long been suggested that decreased a (=b) lattice parameter could be attributed to prevalent carbonate substitution for tetrahedral phosphate from both experimental studies on synthetic carbonated apatites [69,71,73] and computer modelling [20], given the significant difference in size between the two species of ionic complexes.
In 1965, LeGeros et al. [73] demonstrated that at least with B-type substitution achieved in synthetic apatites, increased carbonate substitution resulted in decreased a (=b) length, but acknowledged the argument against absolute decrease of a (=b) length with respect to carbonate content by recognizing that A-type substitution could result in increased a (=b) length. Just recently, in their study with synthesized carbonated apatites containing varying amounts of A-type and B-type carbonate and also a combination of the two, Madupalli et al. observed a contraction of the a (=b) lattice parameter with increasing B-site carbonate concentration and decreasing A-site carbonate concentration for materials containing a combination of both substitution types [71]. Unfortunately, none of the unit cells which they observe are consistent with both the average a (=b) lengths and c lengths observed herein.
In contrast, we see a moderate increase of the a (=b) lattice parameter in human bone compared to hydroxylapatite. These results may indicate the manifestation of both substitution types and begs the question of whether the B-type pattern of substitution is more or less prevalent than A-type substitution in these samples. In 1998, Barralet et al. encouraged consideration of novel models describing combined A-type and B-type substitution when they observed a hypothesized preference for substitution depending on total carbonate content [74]. They observed an increase in the a lattice parameter of precipitated carbonated hydroxylapatites with respect to increasing carbonate content up to approximately 4 wt%, after which point they observed contraction of the lattice parameter with increasing carbonate content [74]. Absolute carbonate composition is not known for these samples; however, in Greiner et al.’s study of bovine bone incineration, they estimated an absolute carbonate content of approximately 4 wt% for bovine femur [40].
It is worthwhile to recall that the samples used in this study were buried for a prolonged period, so future investigation aimed at comparing these data to those of fresh adult human bone could explain whether or not this is an environmental effect. Additionally, the carbonate content discussed herein is carbonate content relative to organic content, but is not necessarily indicative of absolute carbonate content for a given sample volume. An independent measure of absolute carbonate content, though not available for these samples, would be further informative in understanding substitution trends.
We analyzed the lattice parameter values of synthetic (A + B) substituted carbonated apatites given by Madupalli et al. (2017) [71] in their Table 3, adding our values for hydroxylapatite, with bivariant regression analysis. This leads to the equation for the lattice parameter a:
with a0 = 9.42(1) Å, A = +0.025(3) Å/wt%, B = −0.025(4) Å/wt%. with a bivariant correlation coefficient of 0.986. So a mixed A- and B-type substitution could easily lead to the observed moderate increase of the lattice parameter in our human bone samples compared to hydroxylapatite.
a[Å] = a0 + A * [wt% carbonate on A] + B × [wt% carbonate on B]
Decreased a (=b) unit cell length, such as that observed by Meneghini et al. (2003) [17] in the adult human bone, has been hypothesized to be indicative of carbonate (trigonal planar) Type B substitution for phosphate (tetrahedral) [69,71,73], which is larger than the carbonate ion [20,71]. The FTIR analysis of A- and B-type substitution in the indicative range of 830–890 cm−1 is hampered in our bone samples by the fact that there are (at least) three spectral contributions this range. Complementary systematic compositional analysis of the samples, in which the amount of carbonate in each sample is quantified, is in progress and will provide valuable information about substitution trends and their relation to the size of the crystallographic unit cell. However, these analyses are far from trivial, as carbon compounds residing in the organic component of bone cannot clearly be distinguished from carbonate in the apatite crystal structure.
4.5. Implications for Variation with Respect to Physicality and Age
Figure 6 clearly visualizes that the ABM data cluster at smaller a (=b) lengths and unit cell volumes compared to the RBM data. As we see this trend for all bone anatomical positions in a single individual, this cannot be caused by differences in biomechanical load. We rather attribute the ABM and RBM differences to either the physical constitution, or the individual age. As the RBM age of death was estimated to 20–25 and the ABM age of death was estimated to 60–70, one can suggest that the a (=b) lattice parameter and therefore the bioapatite unit cell in human bones decreases with age of the individual, whereas the c length remains relatively constant. In this case, we would expect to see a shorter a,b length in adult bones than in fetal bones, which is indeed observed in the study by Meneghini et al. (2003) [17]. Given the assumption that decreased a (=b) unit cell lengths are correlated with reduced carbonate content (Figure 7), this data supports the idea that the carbonate content in human bone decreases with advancing age; this was recently observed in broiler chickens by Sánchez-Rodríguez et al. (2019) [75]. However, it may be questionable whether results from short-lived small animals are translatable to humans: Donnelly et al. [76] concluded from Raman peak heights on rat cortex that carbonate substitution in apatite increased with age of the rat in an investigated life span of 70 days. Unfortunately, the article [76] does not contain the original measurement data. Peak areas (intensities) would give a more reliable information than peak heights, as the width of the peaks may have varied as well.
5. Conclusions
In this study, we present results on the bioapatite crystallographic structural variations in buried human bones and consider their relation to the body’s physical constitution and the bones’ individual anatomical locations, and therefore their function. Anatomical variation of bioapatite unit cell dimensions was observed in all investigated sample sets. We show that the a-length of the human bone bioapatite unit cell is 0.1–0.2% greater than that of HAp and exhibits more variation than does the c length, which appears consistent with that of HAp and remains relatively constant across anatomical locations and across different physical constitutions. Importantly, we observe that the crystallostructural analysis of these buried human bone samples may be considered without concern for flouride substitution in the lattice, for which substantially lower a-lengths than even HAp are characteristic. Our original assumption that habitual biomechanical load influences crystallostructural variation, however, is not supported by the structural data generated in the present study. Variation of both lattice parameters and average crystallite sizes did not appear to trend with respect to bone function and the associated mechanical stresses. Consideration of crystallographic data in the context of the relative chemical composition of bone samples illustrated trends between crystallostructural parameters of human bone apatite and composition, including the positive correlation between the unit cell length a and the carbonate-to-organic ratio.
This study should prompt interest in the organization of large-scale systematic studies of human bone bioapatite crystallographic structure with consideration of different influencing biological parameters, including but not limited to anatomical position, individual physical build, gender or age. Future systematic studies of human bone bioapatite should also include characterization of bioapatite crystallochemical composition, in which the absolute carbonate content is well-characterized to better understand the crystallostructural effects of ionic substitution throughout the lattice.
Author Contributions
Conceptualization, W.W.S., M.G., G.M., and B.F.; methodology, B.F., M.G., and W.W.S.; software, B.F.; investigation and data analysis, B.F., M.G.; resources, W.W.S. and G.M.; sample curation G.M., data curation, B.F.; writing—original draft preparation, B.F.; writing—review and editing, B.F., M.G., W.W.S. and G.M.; visualization, B.F.; supervision, W.W.S. and M.G.; funding acquisition, W.W.S. All authors have read and agreed to the published version of the manuscript.
Funding
This work was supported by the Ludwig-Maximilians-Universität München, Department für Geo- und Umweltwissenschaften.
Acknowledgments
The authors want to thank the academic editor and anonymous reviewers for their valuable comments. They also want to thank the editor for handling the manuscript. The authors would also like to thank Moritz Zenkert for his assistance in setting up laboratory instrumentation for ATR-FTIR experiments.
Conflicts of Interest
The authors declare no conflict of interest.
Appendix A
Figure A1.
Explanatory graphic summarizing the approximate anatomical positions of the bone samples used in this study.
Figure A1.
Explanatory graphic summarizing the approximate anatomical positions of the bone samples used in this study.

Figure A2.
FTIR spectra from top to bottom of: fresh bovine femur (Greiner et al., 2019) [40], RBM femur, PBF femur, ABM femur, and bovine femur heated at 1000 °C (and subsequently measured at room temperature) which serves as a HAp reference (Greiner et al., 2019 [40]). Fresh bovine, RBM, PBF, and ABM femur spectra show carbonate absorption bands and an absence of both, the OH− libration and the OH− stretching band, while the HAp standard shows absence of carbonate bands and presence of OH− libration and stretching bands. This verifies that t mineral component is not hydroxylapatite but rather carbonated apatite.

Figure A3.
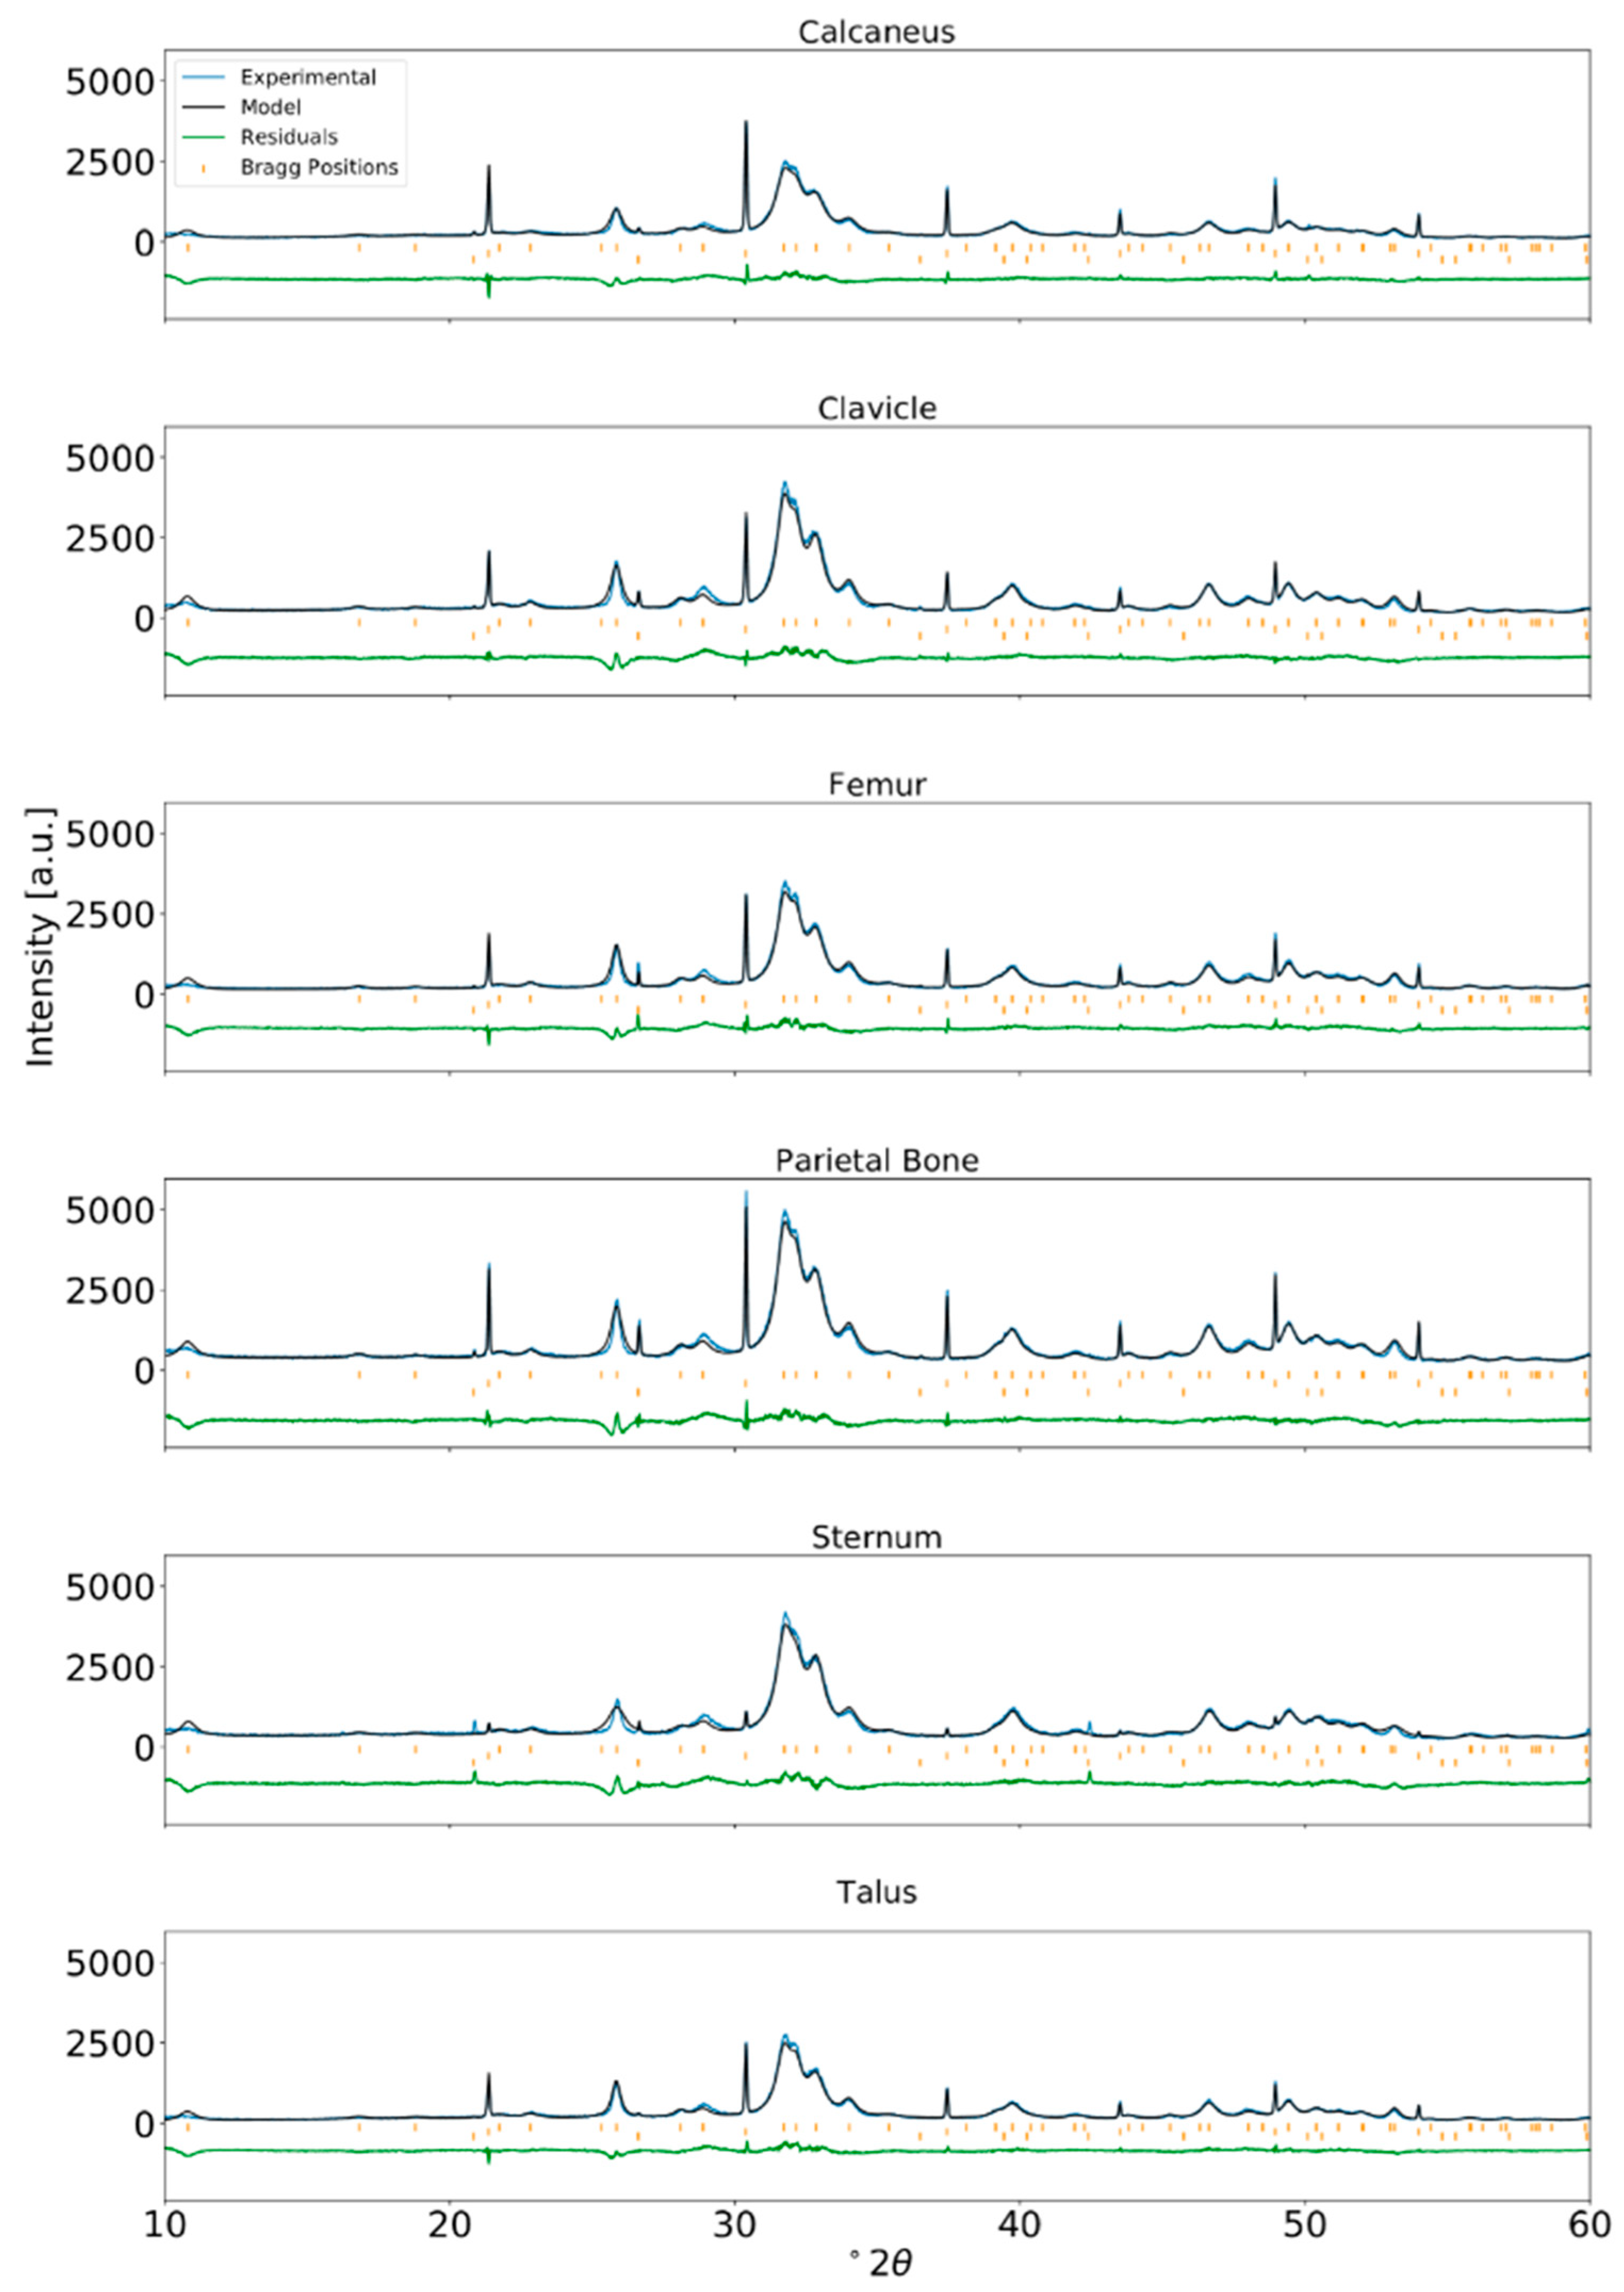
Rietveld refinement of XRPD data for human bone from an ABM adult and internal standard NIST LaB6 incorporated at approximately 2 wt% (λ = Cu-Kα1).
Figure A3.
Rietveld refinement of XRPD data for human bone from an ABM adult and internal standard NIST LaB6 incorporated at approximately 2 wt% (λ = Cu-Kα1).

Figure A4.
Rietveld refinement of XRPD data for human bone from a PBF adult and internal standard NIST LaB6 incorporated at approximately 2 wt% (λ = Cu-Kα1).
Figure A4.
Rietveld refinement of XRPD data for human bone from a PBF adult and internal standard NIST LaB6 incorporated at approximately 2 wt% (λ = Cu-Kα1).

Figure A5.
Rietveld refinement of XRPD data for human bone from a RBM adult and internal standard NIST LaB6 incorporated at approximately 2 wt% (λ = Cu-Kα1).
Figure A5.
Rietveld refinement of XRPD data for human bone from a RBM adult and internal standard NIST LaB6 incorporated at approximately 2 wt% (λ = Cu-Kα1).

References
- Albee, F.H. Studies in bone growth: Triple calcium phosphate as a stimulus to osteogenesis. Ann. Surg. 1920, 71, 32–39. [Google Scholar] [CrossRef] [PubMed]
- Glimcher, M.J. The Nature of the Mineral Phase in Bone: Biological and Clinical Implications. In Metabolic Bone Disease and Clinically Related Disorders; Academic Press: Cambridge, MA, USA, 1998; pp. 23–52. [Google Scholar] [CrossRef]
- Bohner, M. Calcium orthophosphates in medicine: From ceramics to calcium phosphate cements. Injury 2000, 31. [Google Scholar] [CrossRef]
- Matsumoto, T.; Okazaki, M.; Nakahira, A.; Sasaki, J.; Egusa, H.; Sohmura, T. Modification of Apatite Materials for Bone Tissue Engineering and Drug Delivery Carriers. Curr. Med. Chem. 2007, 14, 2726–2733. [Google Scholar] [CrossRef]
- Šupová, M. Substituted hydroxyapatites for biomedical applications: A review. Ceram. Int. 2015, 41, 9203–9231. [Google Scholar] [CrossRef]
- Habraken, W.; Habibovic, P.; Epple, M.; Bohner, M. Calcium phosphates in biomedical applications: Materials for the future? Mater. Today 2016, 19, 69–87. [Google Scholar] [CrossRef]
- Ishikawa, K. Carbonate apatite scaffolds for regenerative medicine. In Handbook of Intelligent Scaffolds for Tissue Engineering and Regenerative Medicine, 2nd ed.; Pan Stanford Publishing Pte. Ltd.: Singapore, 2017; pp. 141–160. [Google Scholar]
- Vodanović, M.; Dumančić, J.; Galić, I.; Pavičin, I.S.; Petrovečki, M.; Brkić, H. Age estimation in archaeological skeletal remains: Evaluation of four non-destructive age calculation methods. J. Forensic Odonto-Stomatol. 2011, 29, 14–21. [Google Scholar]
- Milner, G.R.; Boldsen, J.L. Skeletal age estimation: Where we are and where we should go. In A Companion to Forensic Anthropology; Wiley-Blackwell: Hoboken, NJ, USA, 2012. [Google Scholar]
- Brothwell, D.R. Digging up Bones: The Excavation, Treatment and Study of Human Skeletal Remains, 3rd ed.; British Museum (Natural History) and Oxford University Press: Oxford, UK, 1981. [Google Scholar]
- Chatterji, S.; Jeffery, J.W. Changes in Structure of Human Bone with Age. Nature 1968, 219, 482–484. [Google Scholar] [CrossRef]
- Smith, C.B.; Smith, D.A. An X-ray diffraction investigation of age-related changes in the crystal structure of bone apatite. Calcif. Tissue Int. 1977, 22, 219–226. [Google Scholar] [CrossRef]
- Handschin, R.G.; Stern, W.B. Crystallographic lattice refinement of human bone. Calcif. Tissue Int. 1992, 51, 111–120. [Google Scholar] [CrossRef]
- Handschin, R.G.; Stern, W.B. X-ray diffraction studies on the lattice perfection of human bone apatite (Crista Iliaca). Bone 1995, 16, S355–S363. [Google Scholar] [CrossRef]
- Royle, G.J.; Speller, R.D. Quantitative X-ray diffraction analysis of bone and marrow volumes in excised femoral head samples. Phys. Med. Biol. 1995, 40, 1487–1498. [Google Scholar] [CrossRef] [PubMed]
- Peters, F.; Schwarz, K.; Epple, M. The structure of bone studied with synchrotron X-ray diffraction, X-ray absorption spectroscopy and thermal analysis. Thermochim. Acta 2000, 361, 131–138. [Google Scholar] [CrossRef]
- Meneghini, C.; Dalconi, M.C.; Nuzzo, S.; Mobilio, S.; Wenk, R.H. Rietveld Refinement on X-Ray Diffraction Patterns of Bioapatite in Human Fetal Bones. Biophys. J. 2003, 84, 2021–2029. [Google Scholar] [CrossRef] [Green Version]
- Nuzzo, S.; Meneghini, C.; Braillon, P.; Bouvier, R.; Mobilio, S.; Peyrin, F. Microarchitectural and Physical Changes During Fetal Growth in Human Vertebral Bone. J. Bone Miner. Res. 2003, 18, 760–768. [Google Scholar] [CrossRef] [PubMed]
- Jackson, S.A.; Cartwright, A.G.; Lewis, D. The morphology of bone mineral crystals. Calc. Tissue Res. 1978, 25, 217–222. [Google Scholar] [CrossRef] [PubMed]
- Deymier, A.C.; Nair, A.K.; Depalle, B.; Qin, Z.; Arcot, K.; Drouet, C.; Yoder, C.H.; Buehler, M.J.; Thomopoulos, S.; Genin, G.M.; et al. Protein-free formation of bone-like apatite: New insights into the key role of carbonation. Biomaterials 2017, 127, 75–88. [Google Scholar] [CrossRef] [PubMed] [Green Version]
- Stathopoulou, E.T.; Psycharis, V.; Chryssikos, G.D.; Gionis, V.; Theodorou, G. Bone diagenesis: New data from infrared spectroscopy and X-ray diffraction. AAPG Stud. Geol. 2008, 266, 168–174. [Google Scholar] [CrossRef]
- Schmahl, W.W.; Toncala, A.; Grupe, G. The crystalline state of archaeological bone material. Across the Alps in Prehistory. In Across the Alps in Prehistory; Springer: Berlin/Heidelberg, Germany, 2017; pp. 75–104. [Google Scholar]
- Leeuwenhoeck, A.V. Microscopical observations of the structure of Teeth and other Bones: Made and communicated, in a letter by Mr. Anthony Leeuwenhoeck. Philos. Trans. R. Soc. Lond. 1677, 12, 1002–1003. [Google Scholar] [CrossRef] [Green Version]
- Gray, H.; Carter, H.V.; Davidson, G. Gray’s Anatomy, 2nd ed.; Arcturus: London, UK, 2017. [Google Scholar]
- Gong, J.K.; Arnold, J.S.; Cohn, S.H. Composition of trabecular and cortical bone. Anat. Rec. 1964, 149, 325–331. [Google Scholar] [CrossRef]
- LeGeros, R.Z. Calcium Phosphates in Oral Biology and Medicine; Karger: Basel, Switzerland, 1991. [Google Scholar]
- Elliott, J.C. Calcium Phosphate Biominerals. Rev. Mineral Geochem. 2002, 48, 427–453. [Google Scholar] [CrossRef]
- Weiner, S.; Arad, T.; Traub, W. Crystal organization in rat bone lamellae. FEBS Lett. 1991, 285, 49–54. [Google Scholar] [CrossRef] [Green Version]
- Weiner, S.; Traub, W. Organization of Crystals in Bone, Mechanisms and Phylogeny of Mineralization in Biological Systems; Springer: Berlin/Heidelberg, Germany, 1991; pp. 247–253. [Google Scholar] [CrossRef]
- Traub, W.; Arad, T.; Weiner, S. Origin of Mineral Crystal Growth in Collagen Fibrils. Matrix 1992, 12, 251–255. [Google Scholar] [CrossRef]
- Fratzl, P.; Gupta, H.S.; Paschalis, E.P.; Roschger, P. Structure and mechanical quality of the collagen–mineral nano-composite in bone. J. Mater. Chem. 2004, 14, 2115–2123. [Google Scholar] [CrossRef]
- Currey, J. The structure and mechanical properties of bone. Bioceram. Clin. Appl. 2008, 3–27. [Google Scholar] [CrossRef]
- Zhu, W.; Robey, P.G.; Boskey, A.L. The Regulatory Role of Matrix Proteins in Mineralization of Bone. Osteoporosis 2008, 191–240. [Google Scholar] [CrossRef]
- Gentili, C.; Cancedda, R. Cartilage and bone extracellular matrix. Curr. Pharm. Des. 2009, 15, 1334–1348. [Google Scholar] [CrossRef]
- Boskey, A.L.; Coleman, R. Aging and Bone. J. Dent. Res. 2010, 89, 1333–1348. [Google Scholar] [CrossRef]
- Theocharis, A.D.; Skandalis, S.S.; Gialeli, C.; Karamanos, N.K. Extracellular matrix structure. Adv. Drug Deliver. Rev. 2016, 97, 4–27. [Google Scholar] [CrossRef]
- Pellegrino, E.D.; Biltz, R.M. Bone Carbonate and the Ca to P Molar Ratio. Nature 1968, 219, 1261–1262. [Google Scholar] [CrossRef]
- Montel, G.; Bonel, G.; Heughebaert, J.; Trombe, J.; Rey, C. New concepts in the composition, crystallization and growth of the mineral component of calcified tissues. J. Cryst. Growth. 1981, 53, 74–99. [Google Scholar] [CrossRef]
- Pan, Y.; Fleet, M.E. Compositions of the Apatite-Group Minerals: Substitution Mechanisms and Controlling Factors. Rev. Mineral Geochem. 2002, 48, 13–49. [Google Scholar] [CrossRef]
- Greiner, M.; Rodríguez-Navarro, A.; Heinig, M.F.; Mayer, K.; Kocsis, B.; Göhring, A.; Toncala, A.; Grupe, G.; Schmahl, W.W. Bone incineration: An experimental study on mineral structure, colour and crystalline state. J. Archaeol. Sci. Rep. 2019, 25, 507–518. [Google Scholar] [CrossRef]
- Wopenka, B.; Pasteris, J.D. A mineralogical perspective on the apatite in bone. Mater. Sci. Eng. C. 2005, 25, 131–143. [Google Scholar] [CrossRef]
- Pan, H.; Darvell, B.W. Effect of Carbonate on Hydroxyapatite Solubility. Cryst. Growth Des. 2010, 10, 845–850. [Google Scholar] [CrossRef]
- Baig, A.A.; Fox, J.L.; Young, R.A.; Wang, Z.; Hsu, J.; Higuchi, W.I.; Chhettry, A.; Zhuang, H.; Otsuka, M. Relationships Among Carbonated Apatite Solubility, Crystallite Size, and Microstrain Parameters. Calcif. Tissue Int. 1999, 64, 437–449. [Google Scholar] [CrossRef]
- Pasteris, J.D.; Wopenka, B.; Freeman, J.J.; Rogers, K.; Valsami-Jones, E.; van der Houwen, E.J.A.; Silva, M.J. Lack of OH in nanocrystalline apatite as a function of degree of atomic order: Implications for bone and biomaterials. Biomaterials 2004, 25, 229–238. [Google Scholar]
- Currey, J.D. Bones: Structure and Mechanics; Princeton University Press: Princeton, NJ, USA, 2002. [Google Scholar]
- Ross, A.C.; Taylor, C.L.; Yaktine, A.L.; del Valle, H.B. Dietary Reference Intakes for Calcium and Vitamin D; Academies Press: Cambridge, MA, USA, 2011. [Google Scholar] [CrossRef]
- Castiglioni, S.; Cazzaniga, A.; Albisetti, W.; Maier, J. Magnesium and Osteoporosis: Current State of Knowledge and Future Research Directions. Nutrients 2013, 5, 3022–3033. [Google Scholar] [CrossRef] [Green Version]
- Harrison, H.E. The sodium content of bone and other calcified material. J. Biol. Chem. 1937, 120, 457–462. [Google Scholar]
- Boskey, A. Variations in bone mineral properties with age and disease. J. Musculoskelet Neuronal Interact. 2002, 2, 532–534. [Google Scholar]
- Grigat, A. The St. Pankratius churchyard in Altdorf/Düren [North Rhine-Westphalia, Germany]—Selected pathologies from a 19th–20th century population. In Limping Together through the Ages. Joint Afflictions and Bone Infections; DOAB 6; Gisela, G., George, M., Eds.; Marie Leidorf: North Rhine-Westphalia, Germany, 2009. [Google Scholar]
- Rietveld, H.M. A profile refinement method for nuclear and magnetic structures. J. Appl. Cryst. 1969, 2, 65–71. [Google Scholar] [CrossRef]
- Bail, A.L.; Duroy, H.; Fourquet, J. Ab-initio structure determination of LiSbWO6 by X-ray powder diffraction. Mater. Res. Bull. 1988, 23, 447–452. [Google Scholar] [CrossRef]
- Rodríguez-Carvajal, J. Recent advances in magnetic structure determination by neutron powder diffraction. Physica B 1993, 192, 55–69. [Google Scholar] [CrossRef]
- Rodríquez-Carvajal, J.; Roisnel, T. Line Broadening Analysis Using FullProf*: Determination of Microstructural Properties. Mater. Sci. Forum. 2004, 444, 123–126. [Google Scholar] [CrossRef]
- Wilson, R.M.; Elliott, J.C.; Dowker, S.E.P. Rietveld refinement of the crystallographic structure of human dental enamel apatites. Am. Mineral. 1999, 84, 1406–1414. [Google Scholar] [CrossRef]
- Thompson, P.; Cox, D.E.; Hastings, J.B. Rietveld refinement of Debye–Scherrer synchrotron X-ray data from Al2O3. J. Appl. Crystallogr. 1987, 20, 79–83. [Google Scholar] [CrossRef] [Green Version]
- Carlström, D.; Glas, J.E. The size and shape of the apatite crystallites in bone as determined from line-broadening measurements on oriented specimens. Biochim. Biophys. Acta 1959, 35, 46–53. [Google Scholar] [CrossRef]
- Boskey, A.L.; Spevak, L.; Weinstein, R.S. Spectroscopic markers of bone quality in alendronate-treated postmenopausal women. Osteoporos. Int. 2009, 20, 793–800. [Google Scholar] [CrossRef] [Green Version]
- Dominguez-Gasca, N.; Benavides-Reyes, C.; Sánchez-Rodríguez, E.; Rodríguez-Navarro, A.B. Changes in avian cortical and medullary bone mineral composition and organization during acid-induced demineralization. Eur. J. Mineralog. 2019, 31, 209–216. [Google Scholar] [CrossRef]
- Shemesh, A. Crystallinity and diagenesis of sedimentary apatites. Geochim. Cosmochim. Acta 1990, 54, 2433–2438. [Google Scholar] [CrossRef]
- Weiner, S.; Bar-Yosef, O. States of preservation of bones from prehistoric sites in the Near East: A survey. J. Archaeol. Sci. 1990, 17, 187–196. [Google Scholar] [CrossRef]
- Trueman, C.N.; Privat, K.; Field, J. Why do crystallinity values fail to predict the extent of diagenetic alteration of bone mineral? Palaeogeogr. Palaeoclimatol. Palaeoecol. 2008, 266, 160–167. [Google Scholar] [CrossRef]
- Person, A.; Bocherens, H.; Saliège, J.F.; Paris, F.; Zeitoun, V.; Gérard, M. Early Diagenetic Evolution of Bone Phosphate: An X- ray Diffraction Analysis. J. Archaeol. Sci. 1995, 22, 211–221. [Google Scholar] [CrossRef]
- Nielsen-Marsh, C.; Gernaey, T.; Turner-Walker, G.; Hedges, R.; Pike, A.; Collins, M. The Chemical Degradation of Bone. Available online: https://www.researchgate.net/profile/Gordon_Turner-Walker/publication/316184282_The_chemical_degradation_of_bone/links/5b025b8e0f7e9be94bd9c577/The-chemical-degradation-of-bone.pdf (accessed on 18 September 2020).
- Hedges, R.E.M. Bone Diagenesis: An Overview of Processes. Archaeometry 2000, 44, 319–328. [Google Scholar] [CrossRef]
- Schmahl, W.W.; Kocsis, B.; Toncala, A.; Grupe, G. Mineralogic characterisation of archaeological bone. In Isotopic Landscapes in Bioarchaeology; Springer: Berlin/Heidelberg, Germany, 2016; pp. 91–110. [Google Scholar]
- Greiner, M. Crystal Growth and Mineral Replacement Reactions in Biomimetic and Biological Calciumcarbonate and Calciumphosphate Composites. Ph.D. Thesis, Ludwig Maximilian University of Munich, Munich, Germany, 2019. [Google Scholar]
- Suetsugu, Y.; Takahashi, Y.; Okamura, F.P.; Tanaka, J. Structure analysis of A-type carbonate apatite by a single-crystal X-ray diffraction method. J. Solid State Chem. 2000, 155, 292–297. [Google Scholar] [CrossRef]
- Fleet, M.E.; Liu, X.; King, P.L. Accommodation of the carbonate ion in apatite: An FTIR and X-ray structure study of crystals synthesized at 2–4 GPa. Am. Mineral. 2004, 89, 1422–1432. [Google Scholar] [CrossRef]
- Tonegawa, T.; Ikoma, T.; Yoshioka, T.; Hanagata, N.; Tanaka, J. Crystal structure refinement of A-type carbonate apatite by X-ray powder diffraction. J. Mater. Sci. 2010, 45, 2419–2426. [Google Scholar] [CrossRef]
- Madupalli, H.; Pavan, B.; Tecklenburg, M.M. Carbonate substitution in the mineral component of bone: Discriminating the structural changes, simultaneously imposed by carbonate in A and B sites of apatite. J. Solid State Chem. 2017, 255, 27–35. [Google Scholar] [CrossRef]
- Astala, R.; Stott, M.J. First principles investigation of mineral component of bone: CO3 substitutions in hydroxyapatite. Chem. Mater. 2005, 17, 4125–4133. [Google Scholar] [CrossRef]
- Zapanta-Legeros, R. Effect of Carbonate on the Lattice Parameters of Apatite. Nature 1965, 206, 403–404. [Google Scholar] [CrossRef]
- Barralet, J.; Best, S.; Bonfield, W. Carbonate substitution in precipitated hydroxyapatite: An investigation into the effects of reaction temperature and bicarbonate ion concentration. J. Biomed. Mater. Res. 1998, 41, 79–86. [Google Scholar] [CrossRef]
- Sánchez-Rodríguez, E.; Benavides-Reyes, C.; Torres, C.; Domínguez-Gasca, N.; García-Ruiz, A.I.; González-Loepz, S.; Rodríguez-Navarro, A.B. Changes with age (from 0 to 37 D) in tibiae bone mineralization, chemical composition and structural organization in broiler chickens. Poultry Sci. 2019, 98, 5215–5225. [Google Scholar] [CrossRef] [PubMed]
- Donnelly, E.; Boskey, A.L.; Baker, S.P.; van der Meulen, M.C. Effects of tissue age on bone tissue material composition and nanomechanical properties in the rat cortex. J. Biomed. Mater. Res. Part A Off. J. Soc. Biomater. 2010, 92, 1048–1056. [Google Scholar] [CrossRef] [PubMed] [Green Version]
Figure 1.
X-ray powder diffraction profiles of human bone sampled from the calcaneus, clavicle, femur, parietal bone, sternum, and talus of (a) an average-build male, (b) a petite-build female, and (c) a robust build male. Diffraction profiles are sectioned from 24–40° 2θ, λ = Cu-Kα1). The sharp peak near 26.5° 2θ is due to quartz mineral from the soil. Peaks of LaB6 internal standard are marked.

Figure 2.
Rietveld refinement (top) and Le Bail fit (bottom) of the XRPD profile for bone material from a robust-build human male clavicle. Internal standard LaB6 was added (approximately two weight percent). Fitting by the Le Bail method yields a better-fitting calculated profile than does Rietveld refinement, suggesting that the large misfits between the calculated and measured profile in Rietveld refinement are due to inadequacies of the structural model and cannot be attributed to inadequacies of peak shape parameterization alone.

Figure 3.
Absolute value of the lattice parameters as determined from Rietveld refinement of XRPD data (bars) and percentage difference of lattice parameters with respect to average value for lattice parameter across all samples (points) are plotted in (a) for the a (=b) lattice parameter and in (b) for the c lattice parameter, respectively.

Figure 4.
Average crystallite size of human bone bioapatite determined from the Rietveld refinement of XRPD data from human bone. Average crystallite size appeared elongated in the (a) c-direction compared to the (b) a,b-direction.
Figure 4.
Average crystallite size of human bone bioapatite determined from the Rietveld refinement of XRPD data from human bone. Average crystallite size appeared elongated in the (a) c-direction compared to the (b) a,b-direction.

Figure 5.
Normalized ATR-FTIR spectra of powderized bone samples from the ABM sectioned from 450–2000 cm−1 for ease of viewing (a). Important chemical parameters can be characterized by integrating and comparing characteristic absorption bands relating to the mineral and organic content of the bone. Absorption bands are approximated from peak fitting using a residuals-based method for characteristic ν2 carbonate (yellow), phosphate (blue), and amide I (dark orange) absorption band regions. The ν2 carbonate and phosphate band regions are more clearly visualized over the range 820–1200 cm−1 (b). Absorption band regions were deconvoluted using a residuals-based peak-fitting method to identify their constituent bands; an example is provided (c) for the ν2 carbonate band region in the ATR-FTIR spectrum of bone material from the ABM calcaneus.


Figure 6.
Unit cell lengths of human bone bioapatite determined from the Rietveld refinement of XRPD data of human bone (left axis) plotted with respect to calculated unit cell volume (bottom axis). The lengths of the lattice parameters are also expressed as strain relative to the value for hydroxylapatite (HAp) (right axis). The lengths of the lattice parameters of 2.02 wt% FAp reported by Stathopoulou et al. (2008) [21] are also plotted for comparison. RBM: Robust-build male, ABM: Average build male, PBM: Petite build female. Note that the human bone samples consistently show a much larger a (=b) lattice parameter than HAp and FAp.

Figure 7.
The carbonate-to-organic ratio of adult human bone bioapatite as determined by peak fitting of ATR-FTIR spectra appears to trend with respect to the a,b lattice parameter derived from Rietveld refinement of X-ray powder diffraction data.
Figure 7.
The carbonate-to-organic ratio of adult human bone bioapatite as determined by peak fitting of ATR-FTIR spectra appears to trend with respect to the a,b lattice parameter derived from Rietveld refinement of X-ray powder diffraction data.


Table 1.
Lattice parameters a (=b) and c of the hexagonal unit cell of human bone bioapatite determined from the Rietveld refinement of XRPD data from human bone analyzed with internal standard NIST LaB6. Error is given as the maximum difference observed between lattice parameters calculated from structure refinement using Rietveld refinement versus whole-pattern fitting with constant scale factor. Error values are indicated in the parentheses.
| Lattice Parameter | a (=b) [Å] | c [Å] | ||||
|---|---|---|---|---|---|---|
| Anatomical Position | ABM | PBF | RBM | ABM | PBF | RBM |
| Calcaneus | 9.4303(14) | 9.4356(14) | 9.4355(14) | 6.8864(4) | 6.8872(4) | 6.8866(4) |
| Clavicle | 9.4327(14) | 9.4363(14) | 9.4429(14) | 6.8850(4) | 6.8877(4) | 6.8866(4) |
| Femur | 9.4352(14) | 9.4368(14) | 9.4390(14) | 6.8869(4) | 6.8867(4) | 6.8852(4) |
| Parietal bone | 9.4345(14) | 9.4373(14) | 9.4374(14) | 6.8857(4) | 6.8860(4) | 6.8853(4) |
| Sternum | 9.4328(14) | 9.4324(14) | 9.4314(14) | 6.8857(4) | 6.8863(4) | 6.8901(4) |
| Talus | 9.4326(14) | 9.4362(14) | 9.4391(14) | 6.8857(4) | 6.8875(4) | 6.8858(4) |
Table 2.
Average crystallite size in the a,b direction and in the c direction of human bone bioapatite determined from the Rietveld refinement of XRPD data from human bone assuming a platelet shape model. Error values are indicated in the parentheses.
Table 2.
Average crystallite size in the a,b direction and in the c direction of human bone bioapatite determined from the Rietveld refinement of XRPD data from human bone assuming a platelet shape model. Error values are indicated in the parentheses.
| Average Crystallite Size | In the a,b Direction [Å] | In the c Direction [Å] | ||||
|---|---|---|---|---|---|---|
| Anatomical Position | ABM | PBF | RBM | ABM | PBF | RBM |
| Calcaneus | 97.7(4.9) | 83.3(4.2) | 86.2(4.3) | 231.7(11.6) | 199.8(10.0) | 210.1(10.5) |
| Clavicle | 100.1(5.0) | 100.1(5.0) | 92.1(4.6) | 244.7(12.2) | 220.4(11.0) | 318.5(15.9) |
| Femur | 92.4(4.6) | 93.9(4.7) | 84.8(4.2) | 248.6(12.4) | 248.7(12.4) | 277.7(13.9) |
| Parietal bone | 100.7(5.0) | 95.8(4.8) | 89.2(4.5) | 259.6(13.0) | 262.6(13.1) | 234.5(11.7) |
| Sternum | 105.2(5.3) | 93.8(4.7) | 80.4(4.0) | 268.9(13.5) | 229.7(11.5) | 224.9(11.3) |
| Talus | 88.3(4.4) | 93.3(4.7) | 94.2(4.7) | 279.3(14.0) | 237.6(11.9) | 276.4(13.8) |
© 2020 by the authors. Licensee MDPI, Basel, Switzerland. This article is an open access article distributed under the terms and conditions of the Creative Commons Attribution (CC BY) license (http://creativecommons.org/licenses/by/4.0/).
Share and Cite
MDPI and ACS Style
Foley, B.; Greiner, M.; McGlynn, G.; Schmahl, W.W. Anatomical Variation of Human Bone Bioapatite Crystallography. Crystals 2020, 10, 859. https://0-doi-org.brum.beds.ac.uk/10.3390/cryst10100859
AMA Style
Foley B, Greiner M, McGlynn G, Schmahl WW. Anatomical Variation of Human Bone Bioapatite Crystallography. Crystals. 2020; 10(10):859. https://0-doi-org.brum.beds.ac.uk/10.3390/cryst10100859
Chicago/Turabian StyleFoley, Brittany, Martina Greiner, George McGlynn, and Wolfgang W. Schmahl. 2020. "Anatomical Variation of Human Bone Bioapatite Crystallography" Crystals 10, no. 10: 859. https://0-doi-org.brum.beds.ac.uk/10.3390/cryst10100859
Note that from the first issue of 2016, this journal uses article numbers instead of page numbers. See further details here.