Brief Report

Bacterial Colonization on the Surface of Copper Sulfide Minerals Probed by Fourier Transform Infrared Micro-Spectroscopy

by
Constantinos Varotsis
*,
Marios Papageorgiou
,
Charalampos Tselios
,
Konstantinos A. Yiannakkos
,
Anastasia Adamou
and
Antonis Nicolaides
Department of Chemical Engineering, Cyprus University of Technology, Eirinis 95, Limassol 3041, Cyprus
*
Author to whom correspondence should be addressed.
Submission received: 11 September 2020 / Revised: 3 November 2020 / Accepted: 3 November 2020 / Published: 5 November 2020
(This article belongs to the Special Issue Biominerals: Formation, Function, Properties)

Abstract

:
Biofilm formation is a molecular assembly process occurring at interfaces, such as in bioleaching processes. The real time monitoring of the marker bands of amide I/amide II by FTIR microspectroscopy during Acidithiobacillus ferrooxidans colonization on chalcopyrite surfaces revealed the central role of lipids, proteins and nucleic acids in bacterial cell attachment to copper sulfide surfaces. The Raman and FTIR spectra of the interactions of Acidithiobacillus ferrooxidans with bornite are also reported.

1. Introduction

Microorganism–mineral interactions are of great importance in hydrometallurgy, because it is the most important mineral processing technique of low-grade ores. It is environmentally and economically friendly and has been applied for copper extraction from minerals [1,2,3,4]. The bioleaching mechanisms can be categorized through contact, un-contact, and cooperative mechanisms. One of the most well-studied copper sulfide ores is chalcopyrite [CuFeS2], due to considerable ore reserves that could be exploited [1,2,3,4]. Metal extraction from low-grade sulfide ores and concentrates is based on the bacterial activities of acidophilic iron- and sulfur-oxidizing microorganisms. Acidithiobacillus ferroxidans has been extensively studied, for its interactions with metal sulfides, due to its ability to oxidize Fe2+ ions, elemental sulfur, hydrogen, and hydrogen sulfide in acidic solutions [1,2]. In several procedures, biofilm formation occurs at interfaces between solid substrates and liquids due to molecular assembly processes such as protein adsorption and subsequent bacterial adherence [3,4].
Biofilms are densely packed communities of microorganisms that are surrounded by a self-produced matrix of extracellular polymeric substances (EPS), where they form their immediate environment [5,6]. Attachment or surface contact of the bacteria stimulates the production of EPS. These secreted bio-polymers (EPS) are mainly polysaccharides, proteins, nucleic acids and lipids. Cell attachment and biofilm formation on metal sulfides triggers mineral dissolution, as attached microorganisms are the ones altering the leaching process by forming a reaction space, enriched in ferric ions, between the metal sulfide surface and the cells [7,8].
It is widely accepted that bacterial strains of the genus Acidithiobacillus are the dominant structural members in biofilm communities that grow in acidic environments [8,9,10]. This is due to the development of a cell communication mechanism called Quorum Sensing (QS), through which the processes of biofilm formation and EPS production are regulated. More specifically, bacterial cells can sense the density of their population through the secretion of diffuse self-inductors, thus regulating intercellular or intracellular processes. In Gram-negative bacteria, the main component of QS is homoserine lactone (AHL), and A. ferrooxidans has been reported to produce N-acyl homoserine lactones (AHLs). However, they do not have all the bacteria of the genus Acidithiobacillus genes coding for the population–sense mechanism, as is the case with A. caldus and A. thiooxidans, where the processes of biofilm formation and production of EPS are regulated by other molecular pathways, such as cyclic digouanilinic acid (c-di-GMP) [8].
FTIR is an excellent method for investigating the dynamics of the secondary structure of proteins, as it enables the analysis of chemical bonds [11,12,13,14,15]. Raman spectroscopy has been applied as a structure-sensitive technique for the investigation of minerals formed during the bioleaching of chalcopyrite [3,4]. This way, monitoring the formation of K+-and NH4+-jarosite as well as EPS formation by a microbial community in a heterogeneous sample is feasible.
There is no consensus on the dynamics of the bio-reactions involved in the oxidation of sulfide-containing minerals. In an attempt to contribute towards our understanding of the mechanisms involved, we measured the structural evolution of the FTIR marker bands of amide I/amide II by FTIR microspectroscopy in order to monitor the bacterial–sulfide mineral interactions. The aim of this paper is to give an outline of how bacteria cells of A. ferrooxidans interact with chalcopyrite surfaces through molecular assembly processes. This will be done by presenting data on the structural configuration of the protein-like band of the extracellular polymeric substances of A. ferrooxidans before (free EPS) and on their bioactive interactions with CuFeS2 surfaces, giving an extensive interpretation on formational changes of the structures and entities occurring in the broad band of amide I and amide II at decisive points in the process of bio-extraction. Furthermore, we report the FTIR and Raman spectra of the interactions of A. ferrooxidans with bornite [Cu5FeS4].

2. Materials and Methods

Chalcopyrite and bornite (0.5–0.6) × (0.5–0.6) cm2 samples were collected from the Hellenic Copper Mines in Skouriotissa, Cyprus, and placed in glass tubes with the growth medium and cell suspensions from pure cultures of A. ferrooxidans (DSM 14882). The experiments were carried out under aseptic conditions in a water bath at 37 °C using recirculating solutions. The glass tubes were fitted with rubber stoppers and the suspension (growth medium and cells) was recirculated by a pump through inlet/outlet tubes. The samples were partially dehydrated by purging N2 over the surface of the samples.

2.1. Extraction of Extracellular Polymeric Substances (EPS) from Bacterial Cells

Bacterial cells were harvested from pure cultures of A. ferrooxidans, by centrifugation at 7012× g for 20 min at 4 °C. The collected cells were then re-suspended in 10 mL of 0.22% formaldehyde solution and 8.5% sodium chloride, and stored at 4 °C for 2 h. Subsequently, the suspension was centrifuged (7012× g, 4 °C, 20 min) and the resultant pellet containing the EPS was dissolved in 10 mL of deionized water. The suspension was then centrifuged again (7012× g, 4 °C, 20 min) to remove cellular debris. The suspended pellet was dissolved in 10 mL deionized water, sonicated for 3 min, and centrifuged at 7012× g for 20 min at 4 °C. The last step of the method concerned the precipitation of EPS after re-suspension of the harvested pellet in 5 mL KCl 10−2 M and 10 mL of cold ethanol (100%) and incubation at 4 °C quench. After incubation, the suspension was centrifuged (7012× g, 4 °C, 20 min) and the harvested pellet of EPS was dissolved in 10 mL of deionized water and stored at 4 °C for further analysis [16].

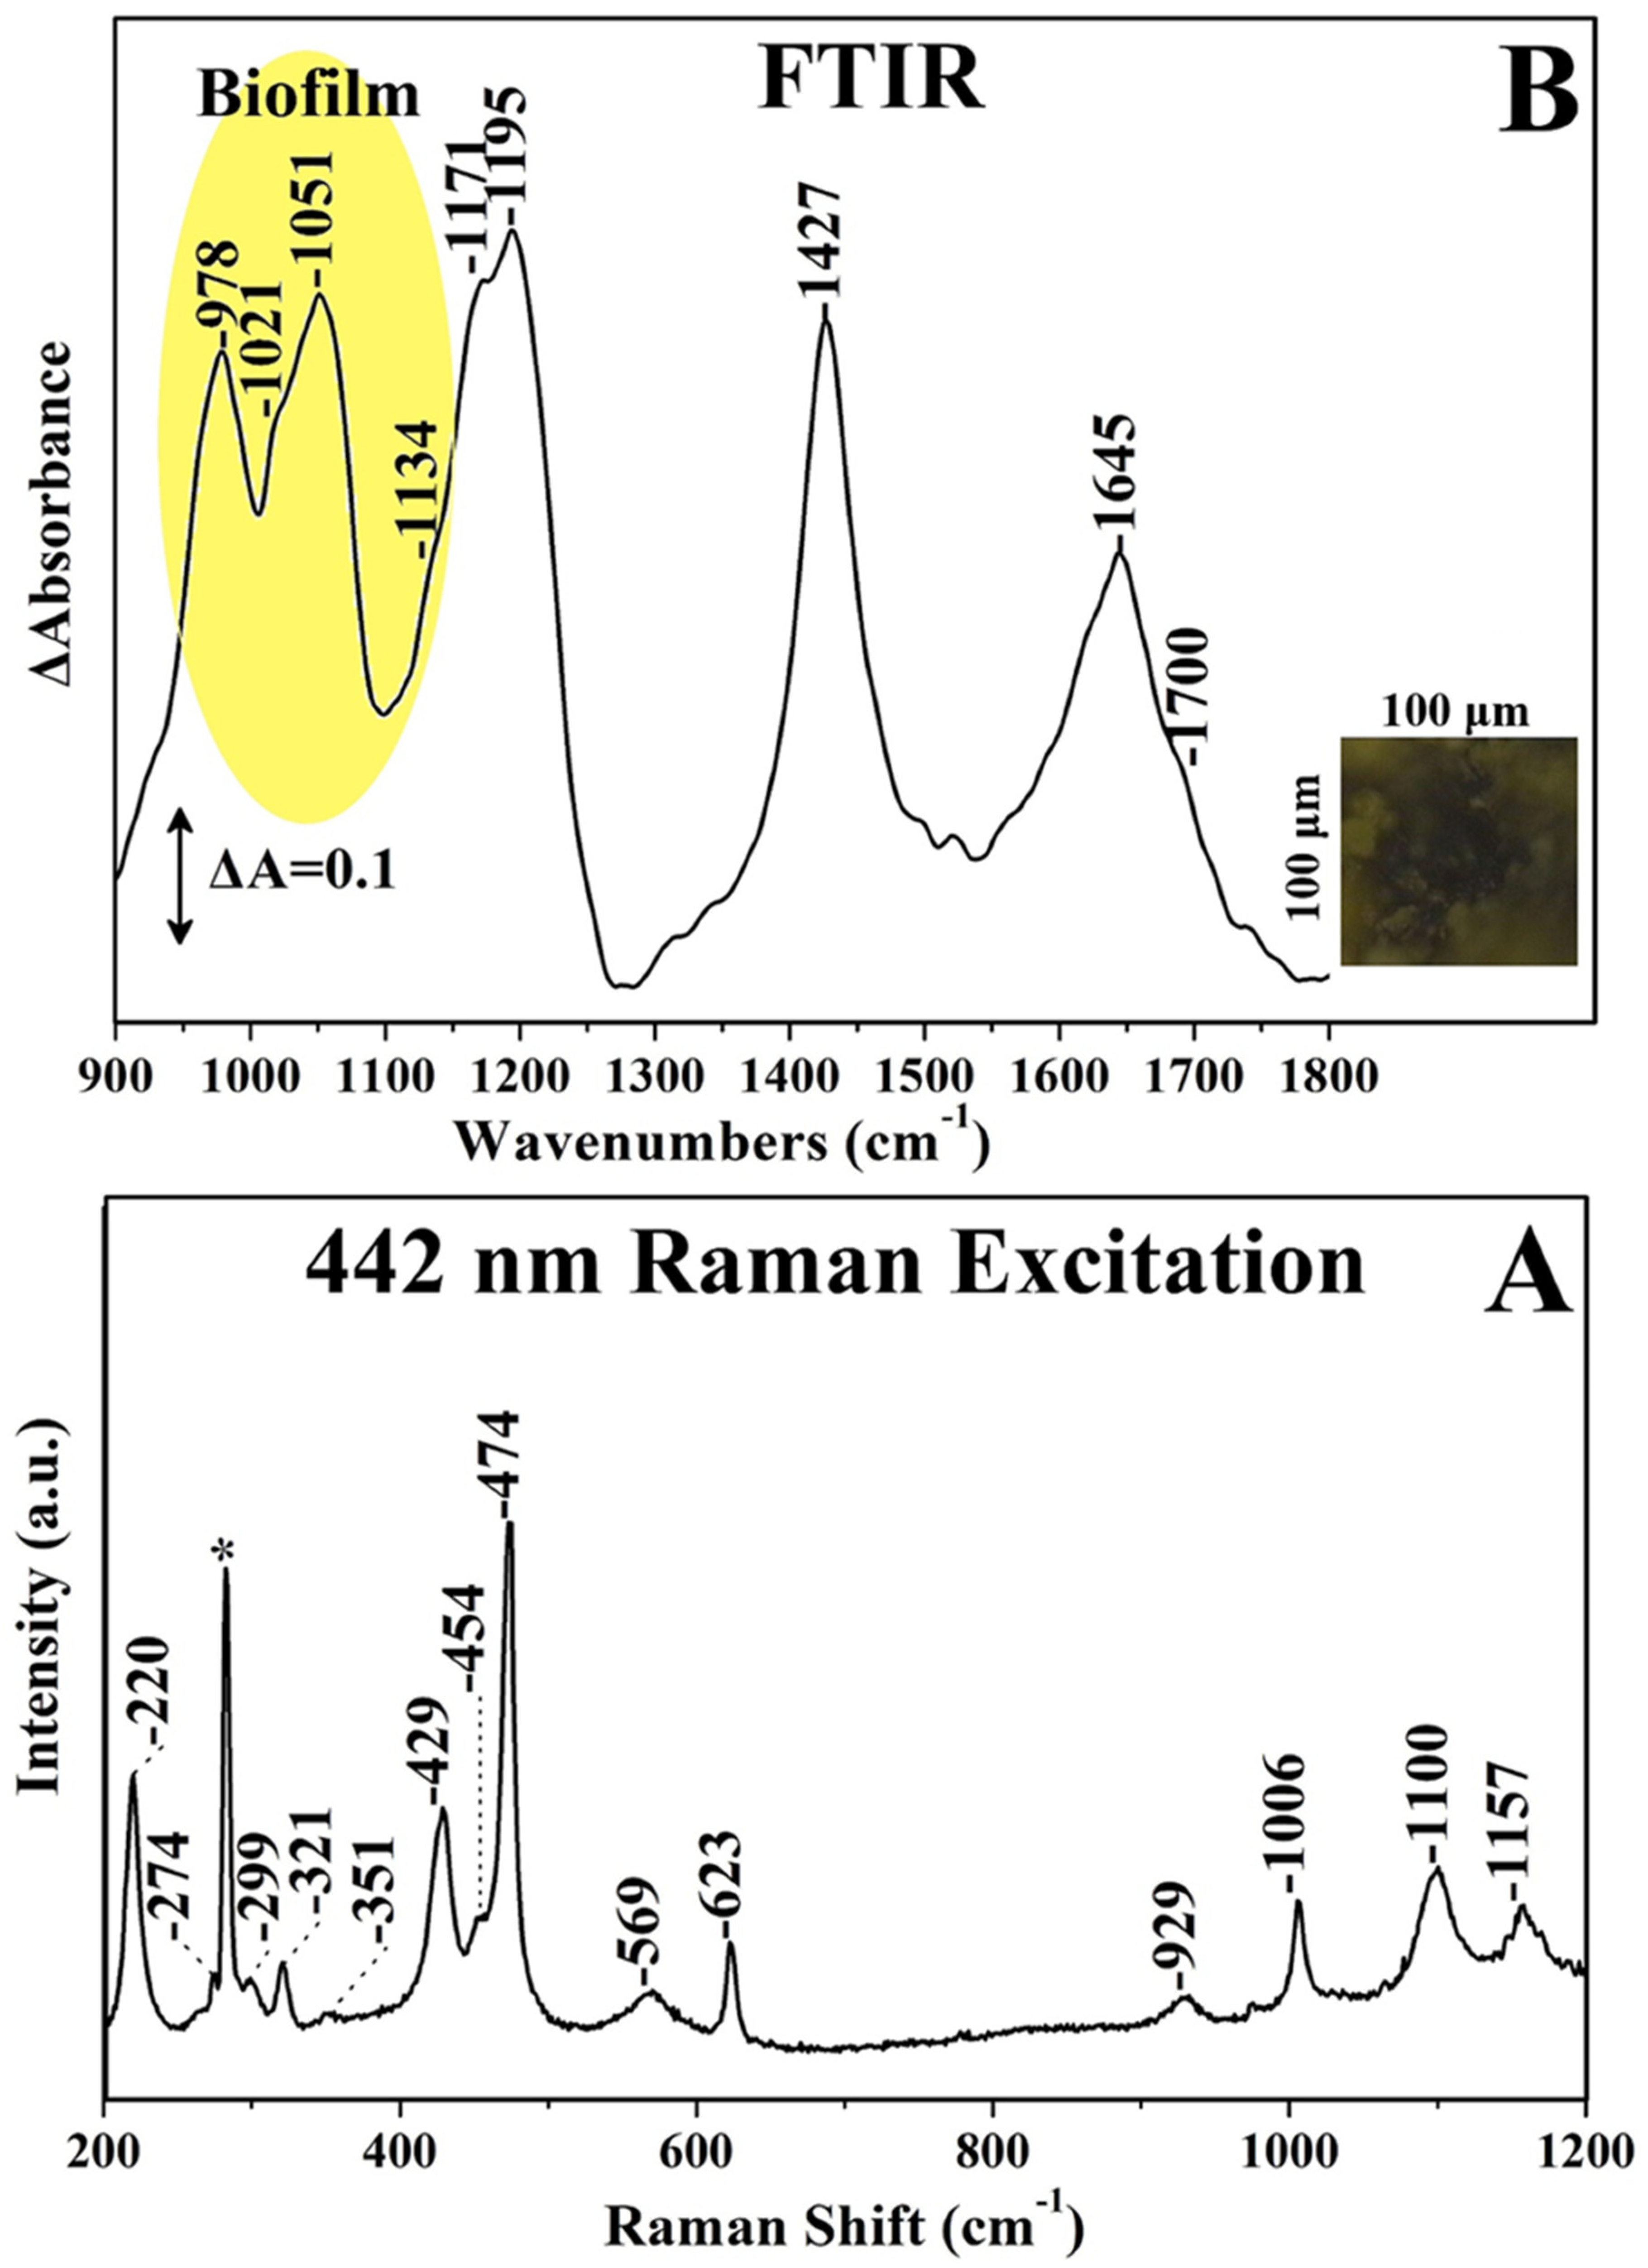
2.2. FTIR and Raman Microspectroscopy

Fourier Transform InfraRed microspectroscopy was applied at defined time intervals in order to monitor the conformational changes in amide I during the biofilm formation on chalcopyrite surfaces. Spectra were collected with a Tensor 27 Fourier transform infrared spectrometer (BRUKER, Karlsruhe, Germany) and a coupled HYPERION 2000 microscope (BRUKER, Karlsruhe, Germany) [3,4]. Attenuated total reflection was used to obtain infrared spectra of extracellular polymeric substances in film form. Spectra were collected using an ATR-Germanium plate (Pike Technologies, Fitchburg, WI 53719, USA) and the FTIR Tensor 27 spectrometer equipped with a deuterated triglyceride sulfate (DTGS) detector. The spectra were collected in the 900–4000 cm−1 spectral range with a resolution of 4 cm−1 and 100 co-exposures. Prior to each sample measurement, a background spectrum was collected. The OPUS 7/IR (BRUKER, Karlsruhe, Germany) software package was used to acquire and process the FTIR spectra. Raman data were collected by a LabRAM equipped with an Olympus BX41 microscope 50X and CCD detector [3,4].

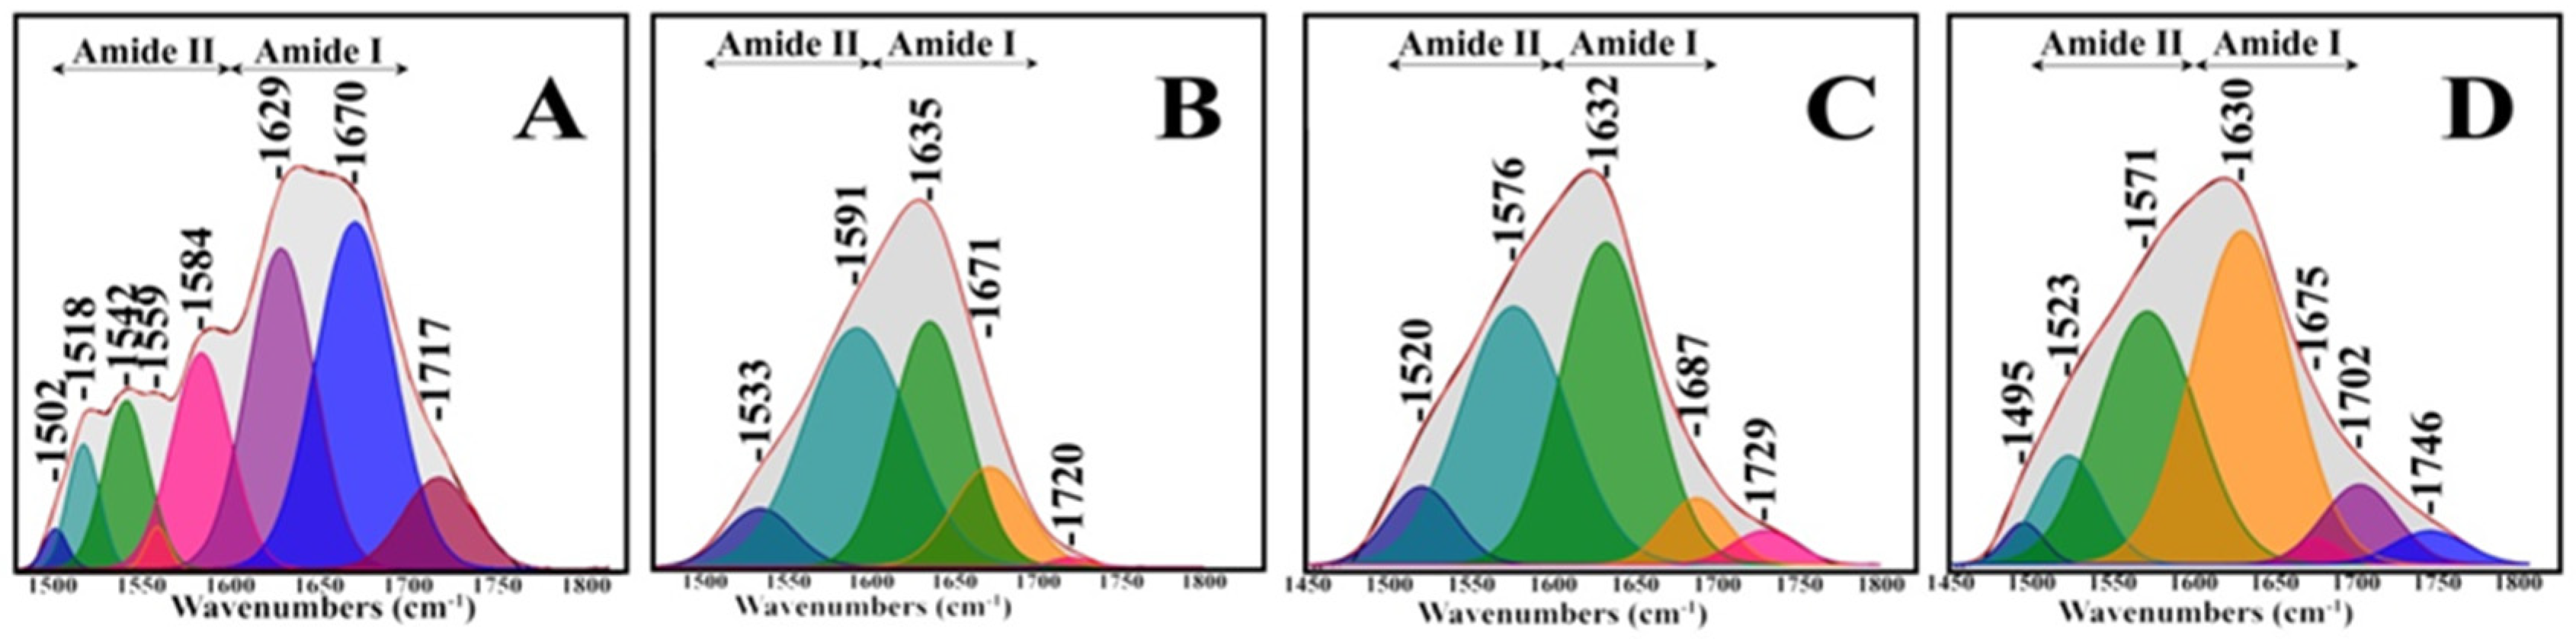
2.3. Deconvolution of Amide I

Quantitative analysis of the amide I band contour was performed with the OPUS software package (Version 7) supplied by Bruker using curve-fitting, 2nd derivative, and Fourier self-deconvolution. The 2nd-derivative spectral analysis was applied to locate the position of the overlapping components of the amide I band. Therefore, a curve-fitting procedure was applied to quantitatively estimate the area of each component representing a type of secondary structure. The curve-fitting was successfully performed based on the damped least-squares optimization algorithm developed by Levenberg–Marquardt, and assuming Gaussian band envelopes. The obtained residual root mean squared error was 0.000161–0.000594.

3. Results and Discussion

Figure 1 shows the Raman and FTIR spectrum of bornite [Cu5FeS4] over a period of ten months of bioleaching by A. ferrooxidans. The bands at 220 and 429 cm−1 originate from the ν(Fe–O) of K+-jarosite and the bands at 454, 623, 1006, 1097, and 1157 cm−1 from the ν2(SO42−), ν4(SO42−), ν1(SO42−), ν3(SO42−) and ν3(SO42−) of K+-jarosite, respectively, in agreement with the previously reported 1–6 months bioleached experiments [3].
Figure 1B shows the FTIR spectra, and the 100 × 100 μm FTIR imaging spectra presented in Figure 1A shows the changes of the bornite surface over the ten-month bioleaching period of the samples used for the Raman experiments. The peaks at 1645 and 1427 cm−1 are assigned to amide I and the N–H vibration of NH4+-jarosite, respectively. There are additional bands in the 978–1134 cm−1 range due to biofilm and near 1700 cm−1 which we assign to the C=O of the O-acetyl ester bond of free EPS. The peaks at 978, 1021 and 1051 cm−1 are due to carbohydrates, and the peaks at 1134 cm−1 are due to P=O. Most importantly is the band at 1171 cm−1, which originated from Fe–O–P [3,4].
Valuable insights into the secondary structures of proteins were provided by analyzing the amide vibrations revealing information about conformation and folding. Each type of secondary structure gives rise to a characteristic absorption band of amide I and amide II due to variations in H-bonding patterns between the amide C=O and N–H groups, as well as contributions from the local environment. The major bands of proteins in an infrared spectrum are amide I, amide II and amide III, which absorb in the spectral range of 1600–1700 cm−1, 1500–1600 cm−1 and 1200–1350 cm−1, respectively. The amide I is related to the backbone conformation and is associated with the C=O vibration (80%), and a small contribution (20%) arises from C–N stretching [17]. Amide II band arises from the N–H bending vibration and the C–N stretching vibration [17,18]. The amide III absorption is attributed to C–N stretching vibrations, coupled to in-plane N–H bending vibrations, with weak contributions from modes of C–C and C=O. Therefore, amide III is of little practical use for protein conformational studies due to its complexity in relation to hydrogen bonding, side chains contributions and force field details [19].
The amide I and amide II bands contain information on the structural properties of EPS proteins, with the amide I band being more sensitive to conformational effects. Amide I contains significant information about the secondary structure. Thus, the observed amide I band consists of many overlapping component bands, and each of these conformational entities represents different structural elements such as α-helices, parallel or antiparallel β-sheets, turns, and unordered or irregular structures [18]. The difficulty of analyzing the amide I envelopes arises from the fact that the widths of its component bands are usually greater than the separation between the maxima of adjacent peaks. For this reason, resolution-enhancement procedures such as Fourier self-deconvolution of Fourier-derivation have been used to reveal the underlying components of the broad amide I band [17,18,19]. It should also be noted that analysis of the amide I absorptions was perturbed by the strongly absorbing and bending vibrations of water near 1640 cm−1 [17,18]. It is known that amide I frequencies are highly dependent on the length and direction of hydrogen bonds. Differences in these features leads to strength variations of the hydrogen bonds for different secondary structures, resulting in a wide range of vibrational frequencies of the amide C=O group. It should be noted that the stronger the hydrogen bonds are, the lower the amide I absorption frequencies will be. The frequency of the C=O stretching vibration can also be affected by its local environment, due to transition dipole coupling [17]. The relative contributions of the different secondary structural elements in amide I fall in the following spectral regions: α-helix between 1645–1662 cm−1; β-sheets between 1613–1637 cm−1 and 1710–1682 cm−1; β-turns between 1662–1682 cm−1; and disordered or random coils between 1637–1645 cm−1 [4,19,20]. Proteins that contain predominantly a-helical structures in amide II, absorb in the spectral range of 1540–1550 cm−1, whereas those which are a predominantly β-sheet structure showed an amide II peak between 1520–1540 cm−1 [12].
Monitoring EPS protein’s structural modulation through the bioleaching procedure of a pure bacterial culture of iron- and sulfur-oxidizing microorganisms provides a unique insight for studying its dynamics and development during biofilm formation. Figure 2 shows the decoupled broad bands of amide I–amide II from the free EPS surrounding the bacterial cell and the attached EPS of the bacterial–mineral surface interacting system at fixed intervals. The decomposition of amide I–amide II of the free extracellular polymeric substances from bacterial cells of Acidithiobacillus ferrooxidans (Figure 2A) revealed the individual components at 1502, 1518, 1542, 1559, 1584, 1629, 1670 and 1717 cm−1. Peaks at 1502, 1518, 1542, 1559 and 1584 cm−1 are within the amide II range, whereas the bands at 1629 and 1670 cm−1 are within the amide I domain. The band at 1502 cm−1 is derived from the bending vibrations of -CH2 and -CH3 of the lipids and proteins [19,20,21]. Peaks at 1518 and 1542 cm−1 can be attributed to the secondary structures of β-sheet surfaces and to the α-helix, respectively. Carboxylate ion stretching vibrations at 1559 and 1584 cm−1 of the aspartate and glutamate side chain groups typically reflect the conformational changes in the micro-environment or the coordination of the -COO- groups of the side chains with the metal ions [19,20,21]. The structural pattern of the amide I band of free EPS from the A. ferrooxidans bacterium consists predominantly of β-sheet and β-turns, due to the presence of the relevant bands at 1629 and 1670 cm−1, respectively. The peak at 1717 cm−1 originates from the C=O stretch vibration usually observed in hydrated microbial cell spectra [17]. Table 1 summarizes the assignments of the subcomponent bands of the amide I–amide II peaks of free EPS of the bacterial capsule of A. ferrooxidans in the spectral range of 1500–1800 cm−1.
The FTIR broad band of mainly amides I/II represents a different behavior from that presented in previous study with a mixed bacterial culture on a chalcopyrite surface [3,4]. At one (Figure 2B) and three (Figure 2C) weeks of bioleaching, this broad band had a maximum at 1628, 1630 and 1629 cm−1, respectively. However, at six (Figure 2C) and seven (Figure 2D) weeks the peak is even more shifted, at 1610, 1622 and 1619 cm−1, respectively. This band shifted to lower frequency with time, therefore we suggest that the proteins of EPS were involved in the EPS adsorption on chalcopyrite and structural dynamics, and rearrangements were taking place within the biomolecules.
At three weeks of bioleaching (Figure 2B), the bands at 1533 and 1591 cm−1 of the amide II region can be assigned to β-sheet structures and the stretching mode of C=C, respectively. For amide I, the peaks at 1635 and 1671 cm−1 are attributed to β-sheets and β-turns. An increase in the β-structural motif both in the amide I and amide II region is observed, leading to the conclusion that a continuous redistribution of the secondary structure components occurs in the interfacial space between the surface of the sulfide mineral and the bacterial membrane. The small contribution of the peak at 1720 cm−1 is due to the presence of free EPS. At six weeks of interactions between the bacterial cells and the sulfide’s mineral surface (Figure 2C), structures of β-sheets are present both in the amide II and amide I spectral range at 1520 cm−1 and 1632 cm−1, respectively. In amide II, the β-structural component is downshifted, revealing stronger hydrogen bonds, while in the case of the same subcomponent in amide I region this structure has lost some of the electron density of hydrogen bonding, leading to it being shifted slightly to a higher frequency. The band at 1576 cm−1 can be assigned to amino acid side chain vibrations of aspartate and glutamate. A new subcomponent band in the amide I range is observed at 1687 cm−1 and can be attributed to the intermolecular (antiparallel) pairing of β-strands. The band at 1729 cm−1 is due to ν(C=O) of the O-acetyl-ester bond of free EPS, revealing similar behavior as that observed in the bioleaching experiments of chalcopyrite, covellite, bornite and chalcocite with mixed bacterial cultures in previous studies [3,4]. At seven weeks of bio-interaction (Figure 2D), changes in the secondary structure were found to be less subtle. The band at 1495 cm−1 arose from side chains of amino acids [21]. The major components of amide II are β-sheet structures and aspartate and glutamate, due the peak absorbance at 1523 and 1571 cm−1 [21]. Structures of β-sheet have been lightly shifted to a higher frequency due to weaker hydrogen bonds, but their contribution in the amide II region had been increased compared with the previous week. The species at 1571 cm−1 seemed to have the major role over the spectral range of amide II due to its high absorbance contribution. β-sheet structures and their conformations seemed to be predominant in the amide I region. Subcomponent bands at 1630, 1675 and 1702 cm−1 are attributed to β-sheet structures, β-turns and antiparallel β-sheets, respectively. Alterations in the amide I region are obvious, as β-sheet structures were shifted slightly to a lower frequency in order to have space for the turns of β-sheets. Intermolecular pairing of β-strands occurred, due to the significant observed shift at 1702 cm−1, revealing weak hydrogen bonding compared with the findings of the previous week. The absorbance band at 1746 cm−1 could be attributed to C=O stretching vibration of the acyl chains of membrane lipids, indicating that the cells were attached to chalcopyrite surface [3,4]. This marker FTIR band was observed only in cell-bound but not in free EPS. This marker FTIR band was observed only in cell-bound but not in free EPS. The images from the surface of chalcopyrite after bio-interacting with bacterial cells of Acidithiobacillus ferrooxidans at one-to-seven weeks of bioleaching are presented in Figure 3.
Quantitative analysis about the component bands of amide I and amide II can be provided through the infrared intensities, which are highly dependent on the nature of the molecular structure, their bonds, and their environment. The shape of the broad band of amide I and amide II is influenced by the overall composition in the secondary structure of the bio-interacted system. Table 2 summarizes the assignments and % composition of the amide I–amide II band components during bio-interaction of A. ferrooxidans bacterial cells with chalcopyrite surfaces.

4. Conclusions

The FTIR data demonstrate the sensitivity of the hydrogen bonding pattern at each of the secondary structural motifs in the EPS–chalcopyrite system reflecting adsorption-induced variation phenomena. Probing the amide secondary structure during the bio-degradation procedures of the mineral provides a unique insight in the dynamics and development within the reaction space of the extracellular polymeric matrix (EPS). We suggest that the “direct-contact mechanism” shown in Figure 4 of bioleaching bacteria is the net result of miscellaneous interactions of the secondary structural motif.
Raman and FTIR spectroscopies have been applied in our laboratory for more than 25 years for the investigation of biological mechanisms of NO and O2 respiration by heme-copper enzymes and the interactions of microorganisms with surfaces and metals [22,23,24,25,26,27,28,29,30,31,32,33,34,35]. The present work extends our previous investigation of the bioleaching dynamics of Cu-containing minerals, and provides analysis of the secondary structure of the interacting system between the protein band of extracellular polymeric substances and the surface of chalcopyrite. The detailed analysis demonstrated the presence of nucleic constituents, proteins and lipids. The FTIR and Raman data on the bioleaching experiments of bornite indicated that a similar analysis, which is under investigation in our laboratory, is feasible and can be applied in a number of Cu-containing minerals.

Author Contributions

M.P., C.T., K.A.Y., and A.N. performed the experiments. A.A. performed experiments and analyzed the results and C.V. analyzed and wrote the paper. All authors have read and agreed to the published version of the manuscript.

Funding

Financial support by the European Regional Development Fund and the Republic of Cyprus through the Research Promotion Foundation (Grant No ENTERPRISES/0916/0069).

Acknowledgments

Financial support by the European Regional Development Fund and the Republic of Cyprus through the Research Promotion Foundation (Grant No ENTERPRISES/0916/0069) is gratefully acknowledged.

Conflicts of Interest

The authors declare no conflict of interest.

References

  1. Jiang, L.; Zhou, H.; Peng, X. Bio-Oxidation of Pyrite, Chalcopyrite and Pyrrhotite by Acidithiobacillus Ferrooxidans. Chin. Sci. Bull. 2007, 52, 2702–2714. [Google Scholar] [CrossRef]
  2. Zhao, H.; Wang, J.; Gan, X.; Zheng, X.; Tao, L.; Hu, M.; Li, Y.; Qin, W.; Qiu, G. Effects of Pyrite and Bornite on Bioleaching of Two Different Types of Chalcopyrite in the Presence of Leptospirillum Ferriphilum. Bioresour. Technol. 2015, 194, 28–35. [Google Scholar] [CrossRef] [PubMed]
  3. Adamou, A.; Manos, G.; Messios, N.; Georgiou, L.; Xydas, C.; Varotsis, C. Probing the Whole Ore Chalcopyrite–bacteria Interactions and Jarosite Biosynthesis by Raman and FTIR Microspectroscopies. Bioresour. Technol. 2016, 214, 852–855. [Google Scholar] [CrossRef] [PubMed]
  4. Adamou, A.; Nicolaides, A.; Varotsis, C. Bio-hydrometallurgy dynamics of copper sulfide-minerals probed by micro-FTIR mapping and Raman microspectroscopy. Miner. Eng. 2019, 132, 39–47. [Google Scholar] [CrossRef]
  5. Di Giambattista, L.; Grimaldi, P.; Udroiu, I.; Pozzi, D.; Cinque, G.; Giansanti, A.; Congiu Castellano, A. FTIR Spectral Imaging as a Probe of Ultrasound Effect on Cells in Vitro. arXiv 2009, 2, arXiv:1007.0864. [Google Scholar]
  6. Schmitt, Y.; Hähl, H.; Gilow, C.; Mantz, H.; Jacobs, K.; Leidinger, O.; Bellion, M.; Santen, L. Structural Evolution of Protein-Biofilms: Simulations and Experiments. Biomicrofluidics 2010, 4, 32201. [Google Scholar] [CrossRef] [PubMed] [Green Version]
  7. Mutch, L.A.; Watling, H.R.; Watkin, E.L.J. Microbial Population Dynamics of Inoculated Low-Grade Chalcopyrite Bioleaching Columns. Hydrometallurgy 2010, 104, 391–398. [Google Scholar] [CrossRef]
  8. Yang, Y.; Tan, S.N.; Glenn, A.M.; Harmer, S.; Bhargava, S.; Chen, M. A Direct Observation of Bacterial Coverage and Biofilm Formation by Acidithiobacillus Ferrooxidans on Chalcopyrite and Pyrite Surfaces. Biofouling 2015, 31, 575–586. [Google Scholar] [CrossRef]
  9. Vera, M.; Krok, B.; Bellenberg, S.; Sand, W.; Poetsch, A. Shotgun Proteomics Study of Early Biofilm Formation Process of Acidithiobacillus Ferrooxidans ATCC 23270 on Pyrite. Proteomics 2013, 13, 1133–1144. [Google Scholar] [CrossRef]
  10. Diao, M.; Taran, E.; Mahler, S.; Nguyen, A.V. A Concise Review of Nanoscopic Aspects of Bioleaching Bacteria-Mineral Interactions. Adv. Colloid Interface Sci. 2014, 212, 45–63. [Google Scholar] [CrossRef] [Green Version]
  11. Gallagher, W. FTIR Analysis of Protein Structure. Biochemistry 1997, 1958, 662–666. [Google Scholar]
  12. Litvinov, R.I.; Faizullin, D.A.; Zuev, Y.F.; Weisel, J.W. The α-Helix to β-Sheet Transition in Stretched and Compressed Hydrated Fibrin Clots. Biophys. J. 2012, 103, 1020–1027. [Google Scholar] [CrossRef] [Green Version]
  13. Troullier, A.; Reinstädler, D.; Dupont, Y.; Naumann, D.; Forge, V. Transient Non-Native Secondary Structures during the Refolding of α- Lactalbumin Detected by Infrared Spectroscopy. Nat. Struct. Biol. 2000, 7, 78–86. [Google Scholar] [PubMed]
  14. Williams, S.; Causgrove, T.P.; Gilmanshin, R.; Fang, K.S.; Callender, R.H.; Woodruff, W.H.; Dyer, R.B. Fast Events in Protein Folding: Helix Melting and Formation in a Small Peptide. Biochemistry 1996, 35, 691–697. [Google Scholar] [CrossRef]
  15. Amenabar, I.; Poly, S.; Nuansing, W.; Hubrich, E.H.; Govyadinov, A.A.; Huth, F.; Krutokhvostov, R.; Zhang, L.; Knez, M.; Heberle, J.; et al. ARTICLE Structural Analysis and Mapping of Individual Protein Complexes by Infrared Nanospectroscopy. Nat. Commun. 2013, 4, 1–9. [Google Scholar] [CrossRef] [PubMed]
  16. Gong, A.S.; Bolster, C.H.; Benavides, M.; Walker, S.L. Extraction and Analysis of Extracellular Polymeric Substances: Comparison of Methods and Extracellular Polymeric Substance Levels in Salmonella Pullorum SA 1685. Environ. Eng. Sci. 2009, 26, 1523–1532. [Google Scholar] [CrossRef] [Green Version]
  17. Seshadri, S.; RituKhurana, R.; Fink, A.L. Fourier Transform Infrared spectroscopy of Protein Deposits. Methods Enzymol. 1999, 309, 559–576. [Google Scholar]
  18. Garidel, P.; Schott, H. Fourier-Transform Mid-infrared Spectroscopy for Analysis and Screening of Liquid Protein Formulations Part 2: Details Analysis and Applications. Bioprocess Int. 2006, 1, 48–55. [Google Scholar]
  19. Kong, J.; Yu, S. Fourier Transform Infrared Spectroscopic Analysis of Protein Secondary Structures. Acta Biochim. Biophys. Sin. 2007, 39, 549–559. [Google Scholar] [CrossRef] [Green Version]
  20. Walther, F.J.; Waring, A.J.; Hernandez-Juviel, J.M.; Gordon, L.M.; Wang, Z.; Jung, C.-L.; Ruchala, P.; Clark, A.P.; Smith, W.M.; Sharma, S.; et al. Critical Structural and Functional Roles for the N-Terminal Insertion Sequence in Surfactant Protein B Analogs. PLoS ONE 2010, 5, e8672. [Google Scholar] [CrossRef]
  21. Naumann, D. Infrared Spectroscopy in Microbiology. 2000, pp. 102–131. Available online: http://citeseerx.ist.psu.edu/viewdoc/download?doi=10.1.1.195.1805&rep=rep1&type=pdf (accessed on 5 November 2020). [CrossRef]
  22. Pinakoulaki, E.; Varotsis, C. Nitric oxide activation and reduction by heme–copper oxidoreductases and nitric oxide reductase. J. Inorg Biochem. 2008, 102, 1277–1287. [Google Scholar] [CrossRef]
  23. Pinakoulaki, E.; Varotsis, C. Time-Resolved Resonance Raman and Time-Resolved Step-Scan FTIR Studies of Nitric Oxide Reductase from Paracoccus denitrificans: Comparison of the Heme b3 -FeB Site to That of the Heme-CuB in Oxidases. Biochemistry 2003, 42, 14856–14861. [Google Scholar] [CrossRef]
  24. Varotsis, C.; Woodruff, W.H.; Babcock, G.T. Time-resolved Raman detection of. mu.(Fe-O) in an early intermediate in the reduction of oxygen by cytochrome oxidase [Erratum to document cited in CA111. J. Am. Chem. Soc. 1990, 112, 1297. [Google Scholar] [CrossRef]
  25. Koutsoupakis, C.; Pinakoulaki, E.; Stavrakis, S.; Daskalakis, V.; Varotsis, C. Time-resolved step-scan Fourier transform infrared investigation of heme-copper oxidases: Implications for O2 input and H2O/H+ output channels. Biochim. Biophys. Acta Bioenerg. 2004, 1655, 347–352. [Google Scholar] [CrossRef] [Green Version]
  26. Iwase, T.; Varotsis, C.; Shinzawa-Itoh, K.; Yoshikawa, S.; Kitagawa, T. Infrared evidence for CuB ligation of photodissociated CO of cytochrome c oxidase at ambient temperatures and accompanied deprotonation of a carboxyl side chain of protein T Iwase, C Varotsis, K Shinzawa-Itoh, S Yoshikawa, T Kitagawa. J. Am. Chem. Soc. 1999, 121, 1415–1416. [Google Scholar] [CrossRef]
  27. Pinakoulaki, E.; Ohta, T.; Soulimane, T.; Kitagawa, T.; Varotsis, C. Simultaneous Resonance Raman Detection of the Heme a3-Fe-CO and CuB-CO Species in CO-bound ba3-Cytochrome c Oxidase from Thermus thermophilus EVIDENCE FOR A CHARGE TRANSFER CuB. J. Biol. Chem. 2004, 279, 22791–22794. [Google Scholar] [CrossRef] [Green Version]
  28. Koutsoupakis, C.; Soulimane, T.; Varotsis, C. Docking site dynamics of ba3-cytochrome c oxidase from Thermus thermophiles. J. Biol. Chem. 2003, 278, 36806–36809. [Google Scholar] [CrossRef] [Green Version]
  29. Stavrakis, S.; Pinakoulaki, E.; Urbani, A.; Varotsis, C. Fourier transform infrared evidence for a ferric six-coordinate nitrosylheme b3 complex of cytochrome cbb3 oxidase from Pseudomonas stutzeri at ambient temperature. J. Phys. Chem. B 2002, 106, 12860–12862. [Google Scholar] [CrossRef]
  30. Varotsis, C.; Vamvouka, M. Resonance Raman and Fourier Transform Infrared Detection of Azide Binding to the Binuclear Center of Cytochrome bo3 Oxidase from Escherichia coli. J. Phys. Chem. B 1999, 103, 3942–3946. [Google Scholar] [CrossRef]
  31. Babcock, G.T.; Varotsis, C.; Zhang, Y. O2 activation in cytochrome oxidase and in other heme proteins. Biochim. Biophys. Acta Bioenerg. 1992, 1101, 192–194. [Google Scholar] [CrossRef]
  32. Pinakoulaki, E.; Yoshimura, H.; Yoshioka, S.; Aono, S.; Varotsis, C. Recognition and discrimination of gases by the oxygen-sensing signal transducer protein HemAT as revealed by FTIR spectroscopy. Biochemistry 2006, 45, 7763–7766. [Google Scholar] [CrossRef]
  33. Ohta, T.; Pinakoulaki, E.; Soulimane, T.; Kitagawa, T.; Varotsis, C. Detection of a Photostable Five-Coordinate Heme a3-Fe−CO Species and Functional Implications of His384/α10 in CO-Bound ba3-Cytochrome c Oxidase from Thermus thermophiles. J. Phys. Chem. B 2004, 108, 5489–5491. [Google Scholar] [CrossRef]
  34. Papageorgiou, M.; Tselios, C.; Varotsis, C. Photosensitivity responses of Sagittula stellata probed by FTIR, fluorescence and Raman microspectroscopy. RSC Adv. 2019, 9, 27391–27397. [Google Scholar] [CrossRef] [Green Version]
  35. Tselios, C.; Papageorgiou, M.; Varotsis, C. Extracellular electron uptake from carbon-based π electron surface-donors: Oxidation of graphite sheets by Sulfobacillus thermosulfidooxidans probed by Raman and FTIR spectroscopy. RSC Adv. 2019, 9, 19121–19125. [Google Scholar] [CrossRef] [Green Version]
Figure 1. Panel (A): 442 nm Raman excitation spectra of bioleached bornite. The laser power incident on the sample was 20 mW and the accumulation time was 15 min. Panel (B): 100 × 100 μm FTIR imaging spectra of the surface of bioleached bornite [Cu5FeS4] by Acidithiobacillus ferrooxidans and the FTIR spectra collected from the surface of the mineral. The area of infrared fingerprint is 0.01 mm2 with spectra resolution of 4 cm−1.
Crystals 10 01002 g001
Figure 2. Deconvoluted amide I–amide II broad band from the free extracellular polymeric substance (EPS) of the bacterial capsule of A. ferrooxidans (A) and the bio-interacted system of A. ferrooxidans—chalcopyrite mineral in the spectral region of 1500–1800 cm−1. FTIR measurements were recorded at three (B), six (C) and seven (D) weeks during the bioleaching.
Crystals 10 01002 g002
Figure 3. Images from the surface of chalcopyrite after bio-interacting with bacterial cells of Acidithiobacillus ferrooxidans at one-to-seven weeks of bioleaching. The FTIR measurements presented in Figure 2 are correlated, respectively, with the 100 × 100 μm images.
Crystals 10 01002 g003
Figure 4. Schematic of the three possible bioleaching mechanisms: the contact, the cooperative, and the un-contact mechanism.
Crystals 10 01002 g004
Table 1. Assignments of the subcomponent bands of the amide I–amide II peaks of free EPS of the bacterial capsule of A. ferrooxidans in the spectral range of 1500–1800 cm−1.
Component BandComposition %Assignments
15021-CH2 and -CH3 bending modes of lipids and proteins
15185β-sheet structures
15429α-helical
15591Asymmetric stretching -COO-
158416Carboxylate str. of aspartate and glutamate
162927Β-sheet structures
167033Β-turns
17178C=O stretching
Table 2. Assignments and % composition of the amide I–amide II band components in the 1500–1800 cm−1 spectral range during bio-interaction of A. ferrooxidans bacterial cells with chalcopyrite surfaces.
Week of Bio-InteractionComponent BandComposition %Assignments
1 week15011-CH2 and -CH3 bending modes of lipids and proteins
15212β-sheet
15371β-sheet
155410α-helical
160051DNA/RNA components
163828β-sheet
16784β-sheet
17732C=O stretching mode of lipids
3 weeks15337β-sheet
159145Stretching mode of C=C
163533β-sheet
167113β-turn
17201Free EPS
6 weeks152010β-sheet
157634Carboxylate str. of aspartate/ glutamate
163242β-sheet
16879Antiparallel β-sheet
17294Free EPS
7 weeks14955Side chain vibrations
152312β-sheet structures
157129Carboxylate str. of aspartate and glutamate
163038β-sheet structures
16753β-turns
17029Antiparallel β-sheet structures
17464Bound EPS
Publisher’s Note: MDPI stays neutral with regard to jurisdictional claims in published maps and institutional affiliations.

