Article

Microwave-Assisted vs. Conventional Hydrothermal Synthesis of MoS2 Nanosheets: Application towards Hydrogen Evolution Reaction

1
Division of Materials Science, Department of Engineering Science and Mathematics, Luleå University of Technology, 971 87 Luleå, Sweden
2
CNR-Institute of Microelectronics and Microsystem (IMM), Section of Bologna Via Piero Gobetti 101, 40129 Bologna, Italy
*
Author to whom correspondence should be addressed.
Submission received: 16 October 2020 / Revised: 3 November 2020 / Accepted: 10 November 2020 / Published: 16 November 2020

Abstract

:
Molybdenum sulfide (MoS2) has emerged as a promising catalyst for hydrogen evolution applications. The synthesis method mainly employed is a conventional hydrothermal method. This method requires a longer time compared to other methods such as microwave synthesis methods. There is a lack of comparison of the two synthesis methods in terms of crystal morphology and its electrochemical activities. In this work, MoS2 nanosheets are synthesized using both hydrothermal (HT-MoS2) and advanced microwave methods (MW-MoS2), their crystal morphology, and catalytical efficiency towards hydrogen evolution reaction (HER) were compared. MoS2 nanosheet is obtained using microwave-assisted synthesis in a very short time (30 min) compared to the 24 h hydrothermal synthesis method. Both methods produce thin and aggregated nanosheets. However, the nanosheets synthesized by the microwave method have a less crumpled structure and smoother edges compared to the hydrothermal method. The as-prepared nanosheets are tested and used as a catalyst for hydrogen evolution results in nearly similar electrocatalytic performance. Experimental results showed that: HT-MoS2 displays a current density of 10 mA/cm2 at overpotential (−280 mV) compared to MW-MoS2 which requires −320 mV to produce a similar current density, suggesting that the HT-MoS2 more active towards hydrogen evolutions reaction.

Graphical Abstract

1. Introduction

Two-dimensional (2D) transition-metal dichalcogenides (TMDs), such as MoS2, MoSe, WS2, have attracted much attention owing to their various applications. As a low-cost and layer-type transition metal dichalcogenide, MoS2 is considered to be a promising electrocatalyst candidate for use in the hydrogen evolution reaction (HER) [1,2] supercapacitor [3], and in battery research areas [4,5]. Crystals of MoS2 are composed of vertically stacked, weakly interacting layers held together by Van der Waals interactions, where a Mo atom is sandwiched between two layers of S atoms (shown in Figure 1a,b). 2D MoS2 can be obtained as monolayers, multilayers, as a form of nanosheets, nanoflowers, and nanoribbons [6,7]. Based on Structure, four poly-types of MoS2 structures have been identified: 1T-MoS2, 1H-MoS2, 2H-MoS2, and 3R-MoS2 [8,9].
2H-MoS2 is one of the most stable among all poly-types, and has trigonal prismatic coordination around the molybdenum atom with two S-Mo-S units per elemental cell [10]. The origin of the high catalytic activity of MoS2 was found to be due to the presence of under coordinated sulfur atoms at the edge that possess a metallic character allowing for more effective absorption of H+ for conversion into molecular hydrogen. Moreover, the importance of MoS2 as a catalyst is not only based on its relatively high activity but also on its extremely excellent stability and long-term durability when in contact with various electrolytes. However, the bulk MoS2 catalyst is not very efficient towards HER due to the limited number of active sites at the exposed edges of MoS2 layers [10]. Recent research reports revealed that nanostructuring is effective to improve this kind of issue since it enhances the concentration of catalytically active edges. MoS2 exhibits relatively higher catalytic performance for HER due to its optimum hydrogen adsorbing ability and high capability of accepting electrons through weak van der Waals interactions [11]. In addition, the HER activity of MoS2 can be further improved by doping and heterostructure formation which results in improved catalytical activity. For instance, Yi Shi et al. [12] reported doping MoS2 by Zn, Co, Fe, Ni, and Cu. The result shows doping with Zn improved the electrochemical activity and a positive shift in the onset potential with a turnover of 15.44 s−1 at 300 mV overpotential was achieved. Liqian Wua et al. [13] synthesized the Mn-MoS2/rGO hybrid catalyst which exhibits excellent HER activity with a small overpotential of 110 mV with a small Tafel slope (76 mV·dec−1). Moreover, in terms of Tafel slope, MoS2-based catalysts possess lower values [11,12,14,15] compared to metal oxides [16,17]. However, the hydrogen evolution performance of MoS2 is still not satisfactory when compared to the platinum-based catalyst. Furthermore, the synthesis method mainly affects the catalytical properties due to the high tendency of oxidation of the metal surfaces.
MoS2 can be synthesized by many different techniques, such as Micromechanical Exfoliation [18], Liquid Phase Exfoliation [19] (called top-down synthesis methods), Physical Vapor Deposition [20], chemical vapor deposition [21], atomic layer deposition [22], and solution-based synthesis (called bottom-up approach). Hydrothermal and microwave synthesis methods have been used for synthesizing MoS2 nanosheets and nanoparticles at a relatively higher yield. Hydrothermal synthesis is mostly used due to the availability of the instruments used for synthesis but lacks uniform heating. For the microwave synthesis method, the precursors can be heated quickly, thus providing a more uniform temperature gradient compared to the conventional oven-based hydrothermal methods. In addition, it is known that the reactions vessels (Teflon) are microwave transparent which can provide constant heating across the reaction vessels. Furthermore, the instantaneous and rapid heating, high-temperature homogeneity, and selective heating is an advantage of Microwave over conventional methods [23]. Even if the acceleration of the reaction time by MW irradiation remains controversial, some results appear to show that the MW strategy does help to save time [23]. The reactions are mainly based on the ability of their precursors, including the solvents, to efficiently absorb the MW energy.
One of the fundamental questions in the synthesis of MoS2 nanoparticle is its fast, easy, and scalable synthesis methods. In this work, we used microwave irradiation and conventional hydrothermal methods for the synthesis of MoS2 nanosheets. In several reports [24,25,26,27], conventional heating inside an oven which takes roughly 24 h is used to synthesis MoS2 nanosheets. We compared the crystal structure and morphology as well as the catalytical efficiency of both samples towards HER.

2. Materials and Methods

2.1. Materials Synthesis

HT-MoS2 is synthesized by a typical hydrothermal method, similar to our previously reported method [14]. 200 mg of ammonium molybdate tetrahydrate and 300 mg of L-cysteine were dissolved in 80 mL of distilled water and stirred by a magnetic stirrer for 20 min as shown in Figure 1c,d. The obtained yellow solutions in the Teflon line vessels were transferred into a flexiWAVE advanced microwave reactor and maintained at 180 °C for 30 min. The heating ramp is displayed in Figure 1e. After the reaction mixtures cooled down to room temperature naturally, vacuum filtration was performed and MoS2 powders were collected. After that, the filter papers were dried in a vacuum oven at 75 °C for 30 min. In the end, the powders were annealed at 500 °C in a tube furnace under argon gas flow for 2 h. For HT-MoS2 the Teflon line autoclave was heated inside an oven at 180 °C for 24 h. Similar methods were used to extract the powder with similar annealing temperatures.

2.2. Materials Characterization

The morphology of the as-synthesized catalyst was characterized by Field Emission Scanning Electron Microscope (FE-SEM) (Jeol Ltd., Tokyo, Japan). High-Resolution Transmission electron microscope (HR-TEM) characterization was performed on an FEI Tecnai G20 equipped with EDAX Energy-dispersive X-ray spectroscopy (EDS) and Fischione STEM-HAADF detector (FEI Company, Hillsboro, OR, USA). XRD was carried on the PANalytical Empyrean X-ray diffraction diffractometer (Malvern Panalytical, Malvern, UK) with Cu Kα source. Raman spectra were conducted with a Senterra Raman spectrometer (Bruker, Hamburg, Germany) equipped with a 532 nm laser for excitation in the ambient environment.
The electrochemical performances are measured in a three-electrode configuration using ModuLab XM ECS potentiostat (Solartron Instrument) (AMETEK Scientific Instrument, Essex, UK). Platinum (Pt) sheets, catalyst deposited on glassy carbon electrodes (GC), and Ag/AgCl (3 M KCl), used as a counter, working and reference electrodes, respectively, under 0.5 M H2SO4 electrolytes with a scan rate of 5 mV/s. The potential of the reference electrode was converted to a reversible hydrogen electrode (RHE) by the formula E(RHE) = E(Ag/AgCl) + 0.059 × pH + 0.1976 with 0.47 pH. For preparing the catalyst ink, 10 mg of each powder is dispersed in 40 µL Nafion and 200 µL isopropanol solution by sonication for 30 min. Electrochemical impedance spectroscopy (EIS) (AMETEK Scientific Instrument, Essex, UK) was conducted over the frequency spectrum range from 100 kHz to 50 MHz at Ac amplitude of 5 mV. The polarization curves were manually IR compensated.

3. Results

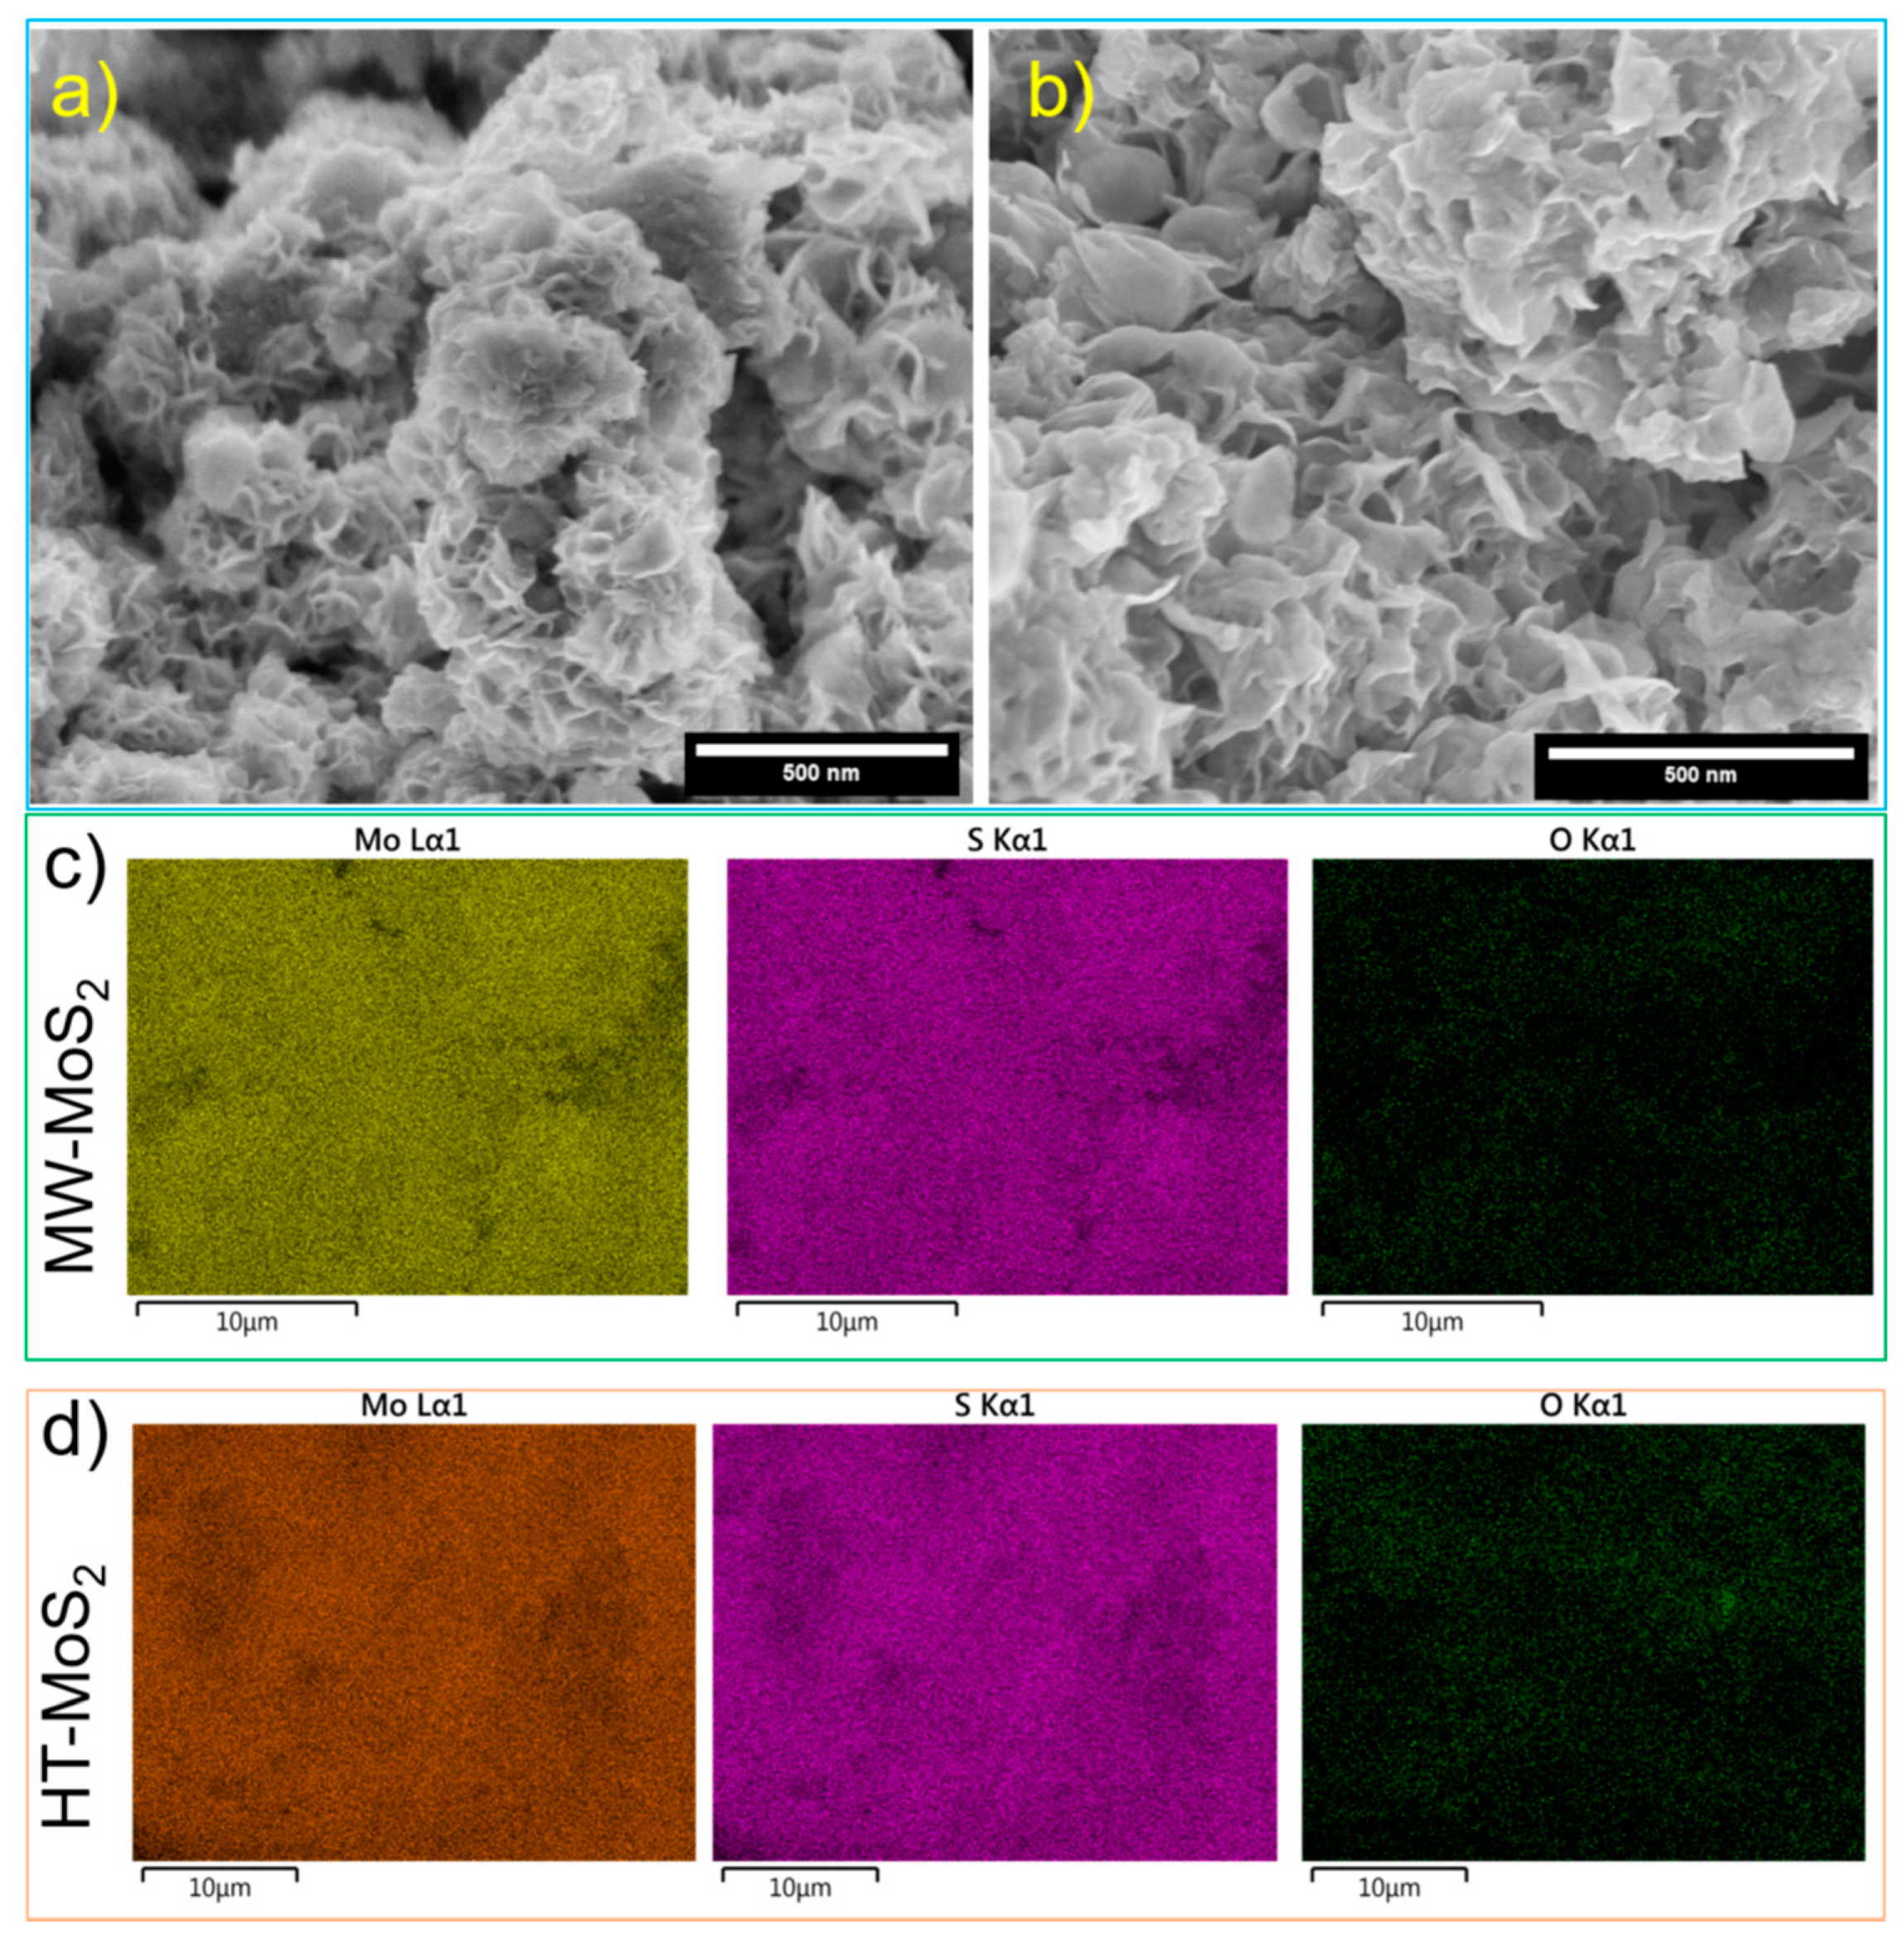
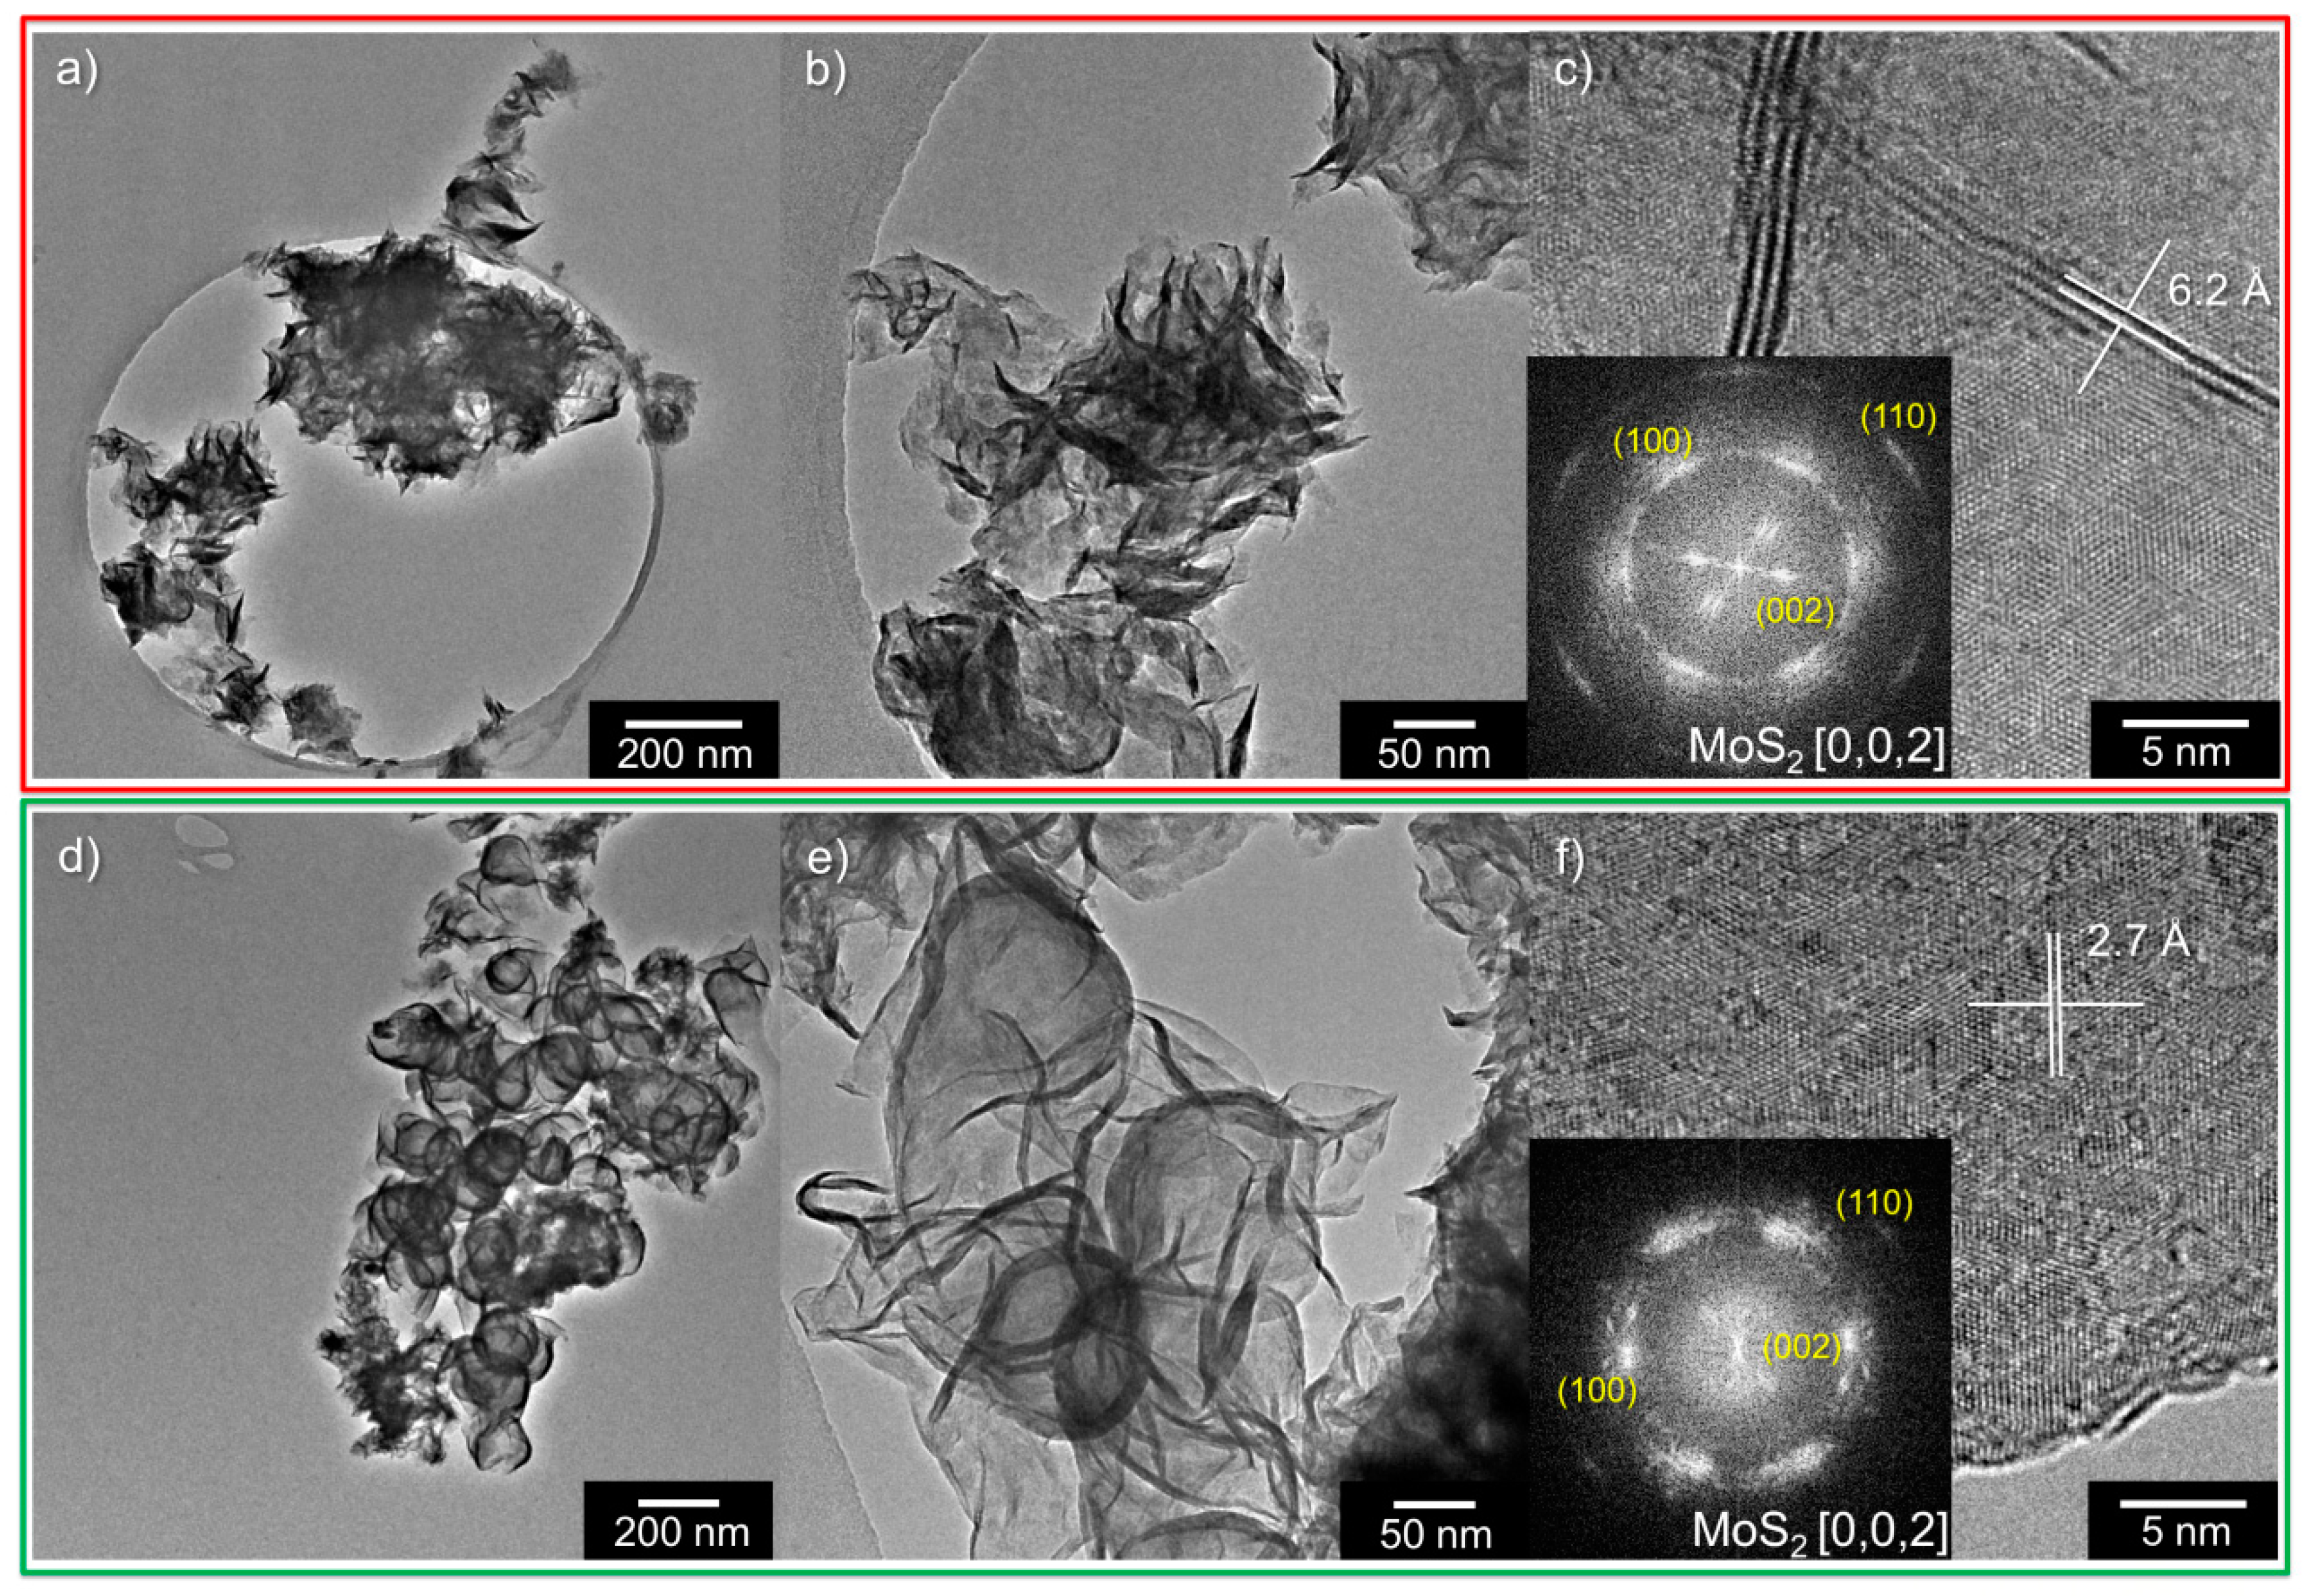
3.1. Morphology Characterization

Figure 2 shows the XRD patterns of the as-prepared catalyst. As shown, HT-MoS2 presents diffraction peaks at 2θ = 14.2°, 33.3°, 39.6°, 58.9°, and 69.3° that can be indexed as the (002), (100), (103), (110), and (201) peaks of pure hexagonal (P63/mmc space group) MoS2 phase (JCPD card no. 96-101-1287), in agreement with similar works [14,28]. Similarly, the XRD pattern MW-MoS2 result in identical diffraction peaks related to the hexagonal MoS2 structure with identical intensities, which are quite broad, indicating a relatively poor crystallinity. The peak broadening is observed for both samples, suggesting the crystalline size is very small. The intensity difference between the reference pattern in the JCPD card and the as-prepared sample for (100) and (103) XRD peaks are due to the difference in texture (crystallite size variation) and the difference in the size of the scattering domains. There are no other peaks of impurities or different phases observed in the XRD patterns, demonstrating the crystal structure is pure MoS2 nanosheets. Besides, both catalysts’ XRD patterns display a broad peak (002) which agrees with an interlayer spacing of 0.62 nm (obtained from TEM characterizations results).
The Raman spectra (Figure 3) of both samples displayed two characteristics peaking at 375 cm−1 and 401.5 cm−1, corresponding to the vibrational modes of the E12g and A1g, suggesting that the crystal structure is 2H MoS2. The intralayer bonding and the lattice vibrations of Molybdenum and Sulfur atoms are affected by the week Van der Waals interactions between the planes. The two prominent Raman active modes are visible and intense. The in-plane relative motion between the two sulfur atoms and Mo is responsible for the E12g vibrational mode. Whereas, the out of plane vibrations of the two sulfur atoms are responsible for the A1g mode of vibrations [29]. The peak separation between E12g and A1g vibration modes determines the number of layers in the 2D MoS2 [30]. In Bulk MoS2, a blue shift in the frequency of E12g peak and a redshift A1g frequency observed with increasing layer numbers due to the interlayer Van der Waals force that suppresses the MoS2 atom vibrations [30]. In this work also around 26 cm−1 peak width separation is observed for both samples, which are different from 18 cm−1 (for single-layer MoS2), suggesting the bulk nature of the as-prepared sample, consistent with previous reports [30]. Both the XRD and the Raman characterization of the as-prepared sample result in a similar crystal structure, suggesting the two methods can provide similar MoS2 nanosheets.
The crystal morphology of the as-prepared materials is further examined by FE-SEM (Figure 4a,b). For both samples, the flower-like structure of MoS2 is observed and it consists of crumpled and aggregated MoS2 nanosheets. The Hydrothermal method results in very short range ordered wrinkle nanosheets compared to microwave methods. As depicted in Figure 4a,b, the MW-MoS2 are smoother and interconnected nanosheets, suggesting that for the HT-MoS2, the longer hydrothermal synthesis methods produce pours and very small crumpled MoS2 nanosheets. Interestingly, the surface is rough which might possess many defective sites and could improve the catalytical properties of MoS2.
The energy dispersive spectra (EDS) and corresponding elemental mapping are conducted to analyze the catalyst atomic composition. The quantitative surface analysis from EDS shows the presence of all the expected elements as shown in Figure S1g ESI. The uniform distribution of molybdenum, Sulfur, and oxygen are described in the EDS mapping shown in Figure 4c,d for both HT-MoS2 and MW-MoS2. According to high-resolution EDS elemental mapping, the samples displayed a uniform and homogeneous distribution of all elements across the nanosheets.
To further investigate the morphology and atomic structure of the as-prepared sample, transmission electron microscopy (TEM) is utilized. As displayed in Figure 5, both HT MoS2 and MW-MoS2 show a layered structure with wrinkled edges. The aggregates are formed by 2D nanosheets wrapped into particle-like structures (Figure 4a,d), with many wrinkles and folding observed for both hydrothermal and microwave synthesis methods (Figure 5b,e, and Figure S1 ESI). Microwave synthesis is resulting in a less crumpled structure with respect to the hydrothermal one, with smoother edges and “softer” curves. The average thickness is about six layers of MoS2 for both samples, but the standard deviation decreases from 3.6 to 2.2 layers by employing the microwave-based method compared to the classic hydrothermal setup (measured by counting the (0, 0, 2) fringes). This suggests a more homogeneous thickness distribution that may be responsible for the slightly different morphology.
High-resolution (HR-TEM) micrographs (Figure 5c,f) of the wrinkled nanosheets display highly crystalline lattice, with the typical interplanar spacing associated with 2H-MoS2. The wrinkles and folded edges are characterized by the 0.62 nm spacing, as expected for multi-layer crystalline Molybdenite [31]. The MoS2 nanosheets are very thin as shown in TEM images, and each MoS2 nanosheet is well stacked with an interlayer distance of 0.62 nm, corresponding to the (002) plane of MoS2. It is also clearly seen that the MoS2 nanosheets consist of randomly oriented layers with a larger interlayer distance of approximately 0.62 nm for both samples as shown in Figure 5b,e, and Figure S1 ESI. Additionally, the hexagonal pattern of MoS2 can be recognized in the fast Fourier transform (FFT) of the HR-TEM micrographs as shown in the red color (Figure S1d ESI).

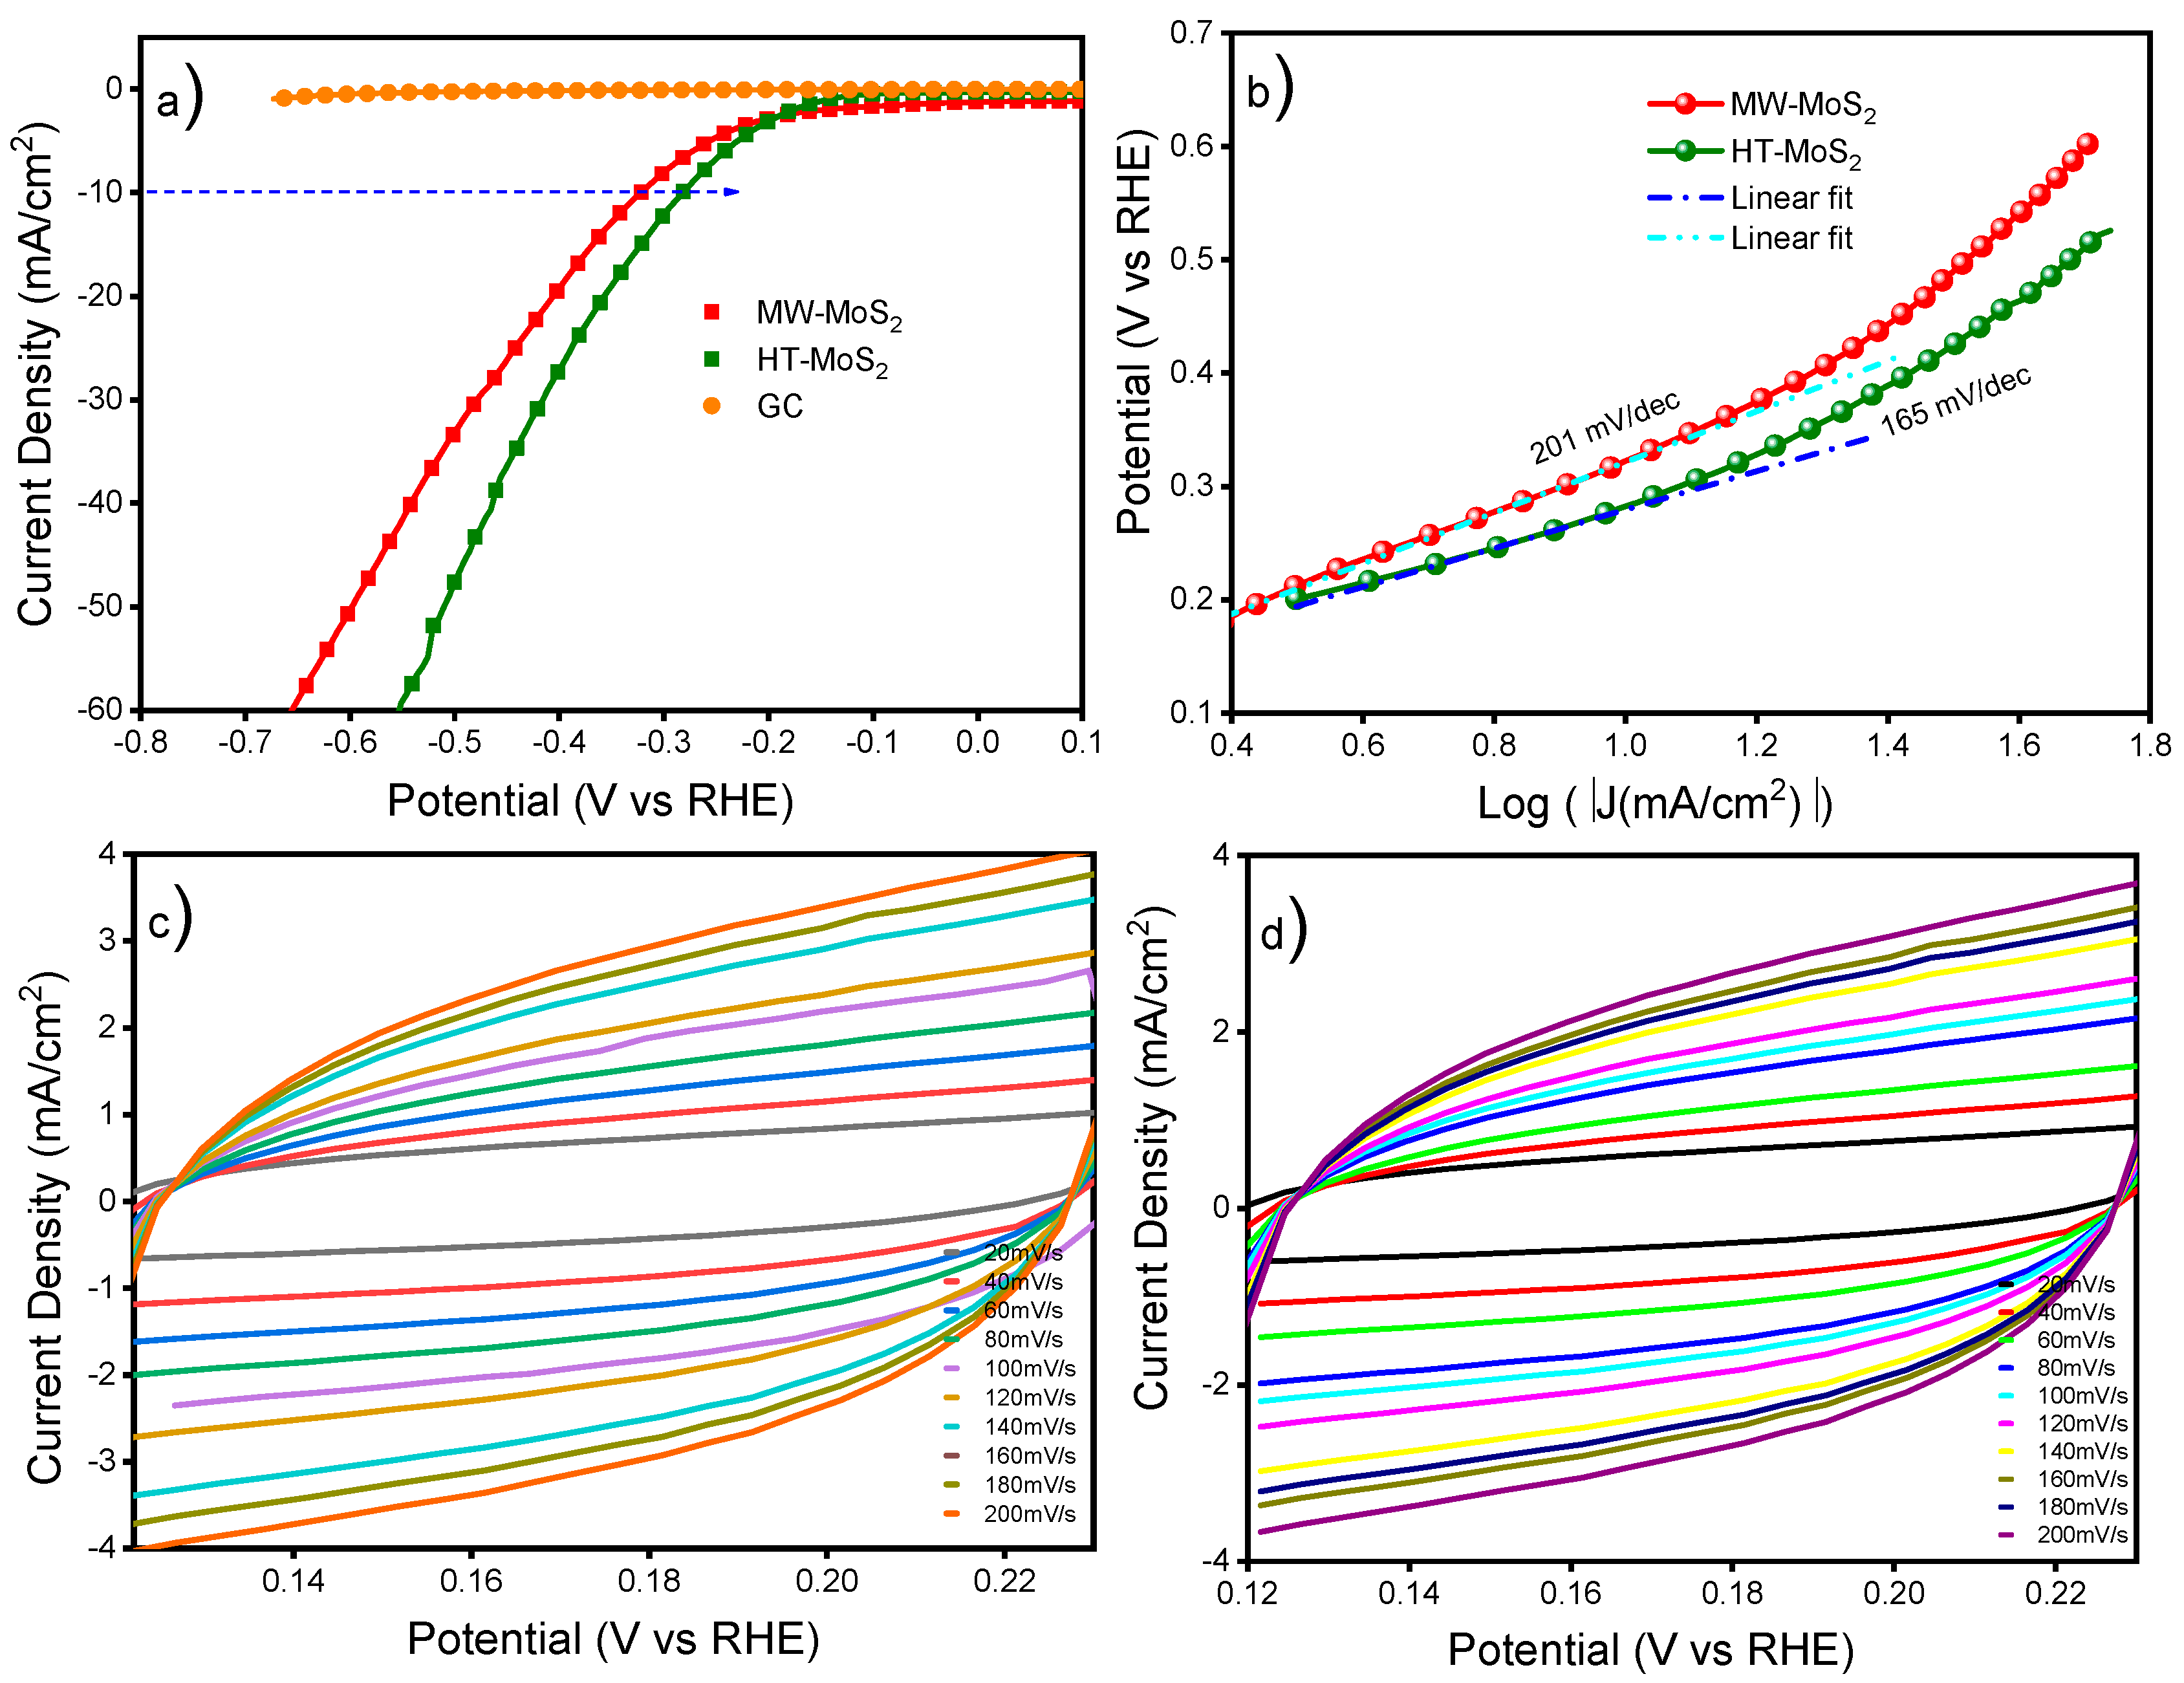
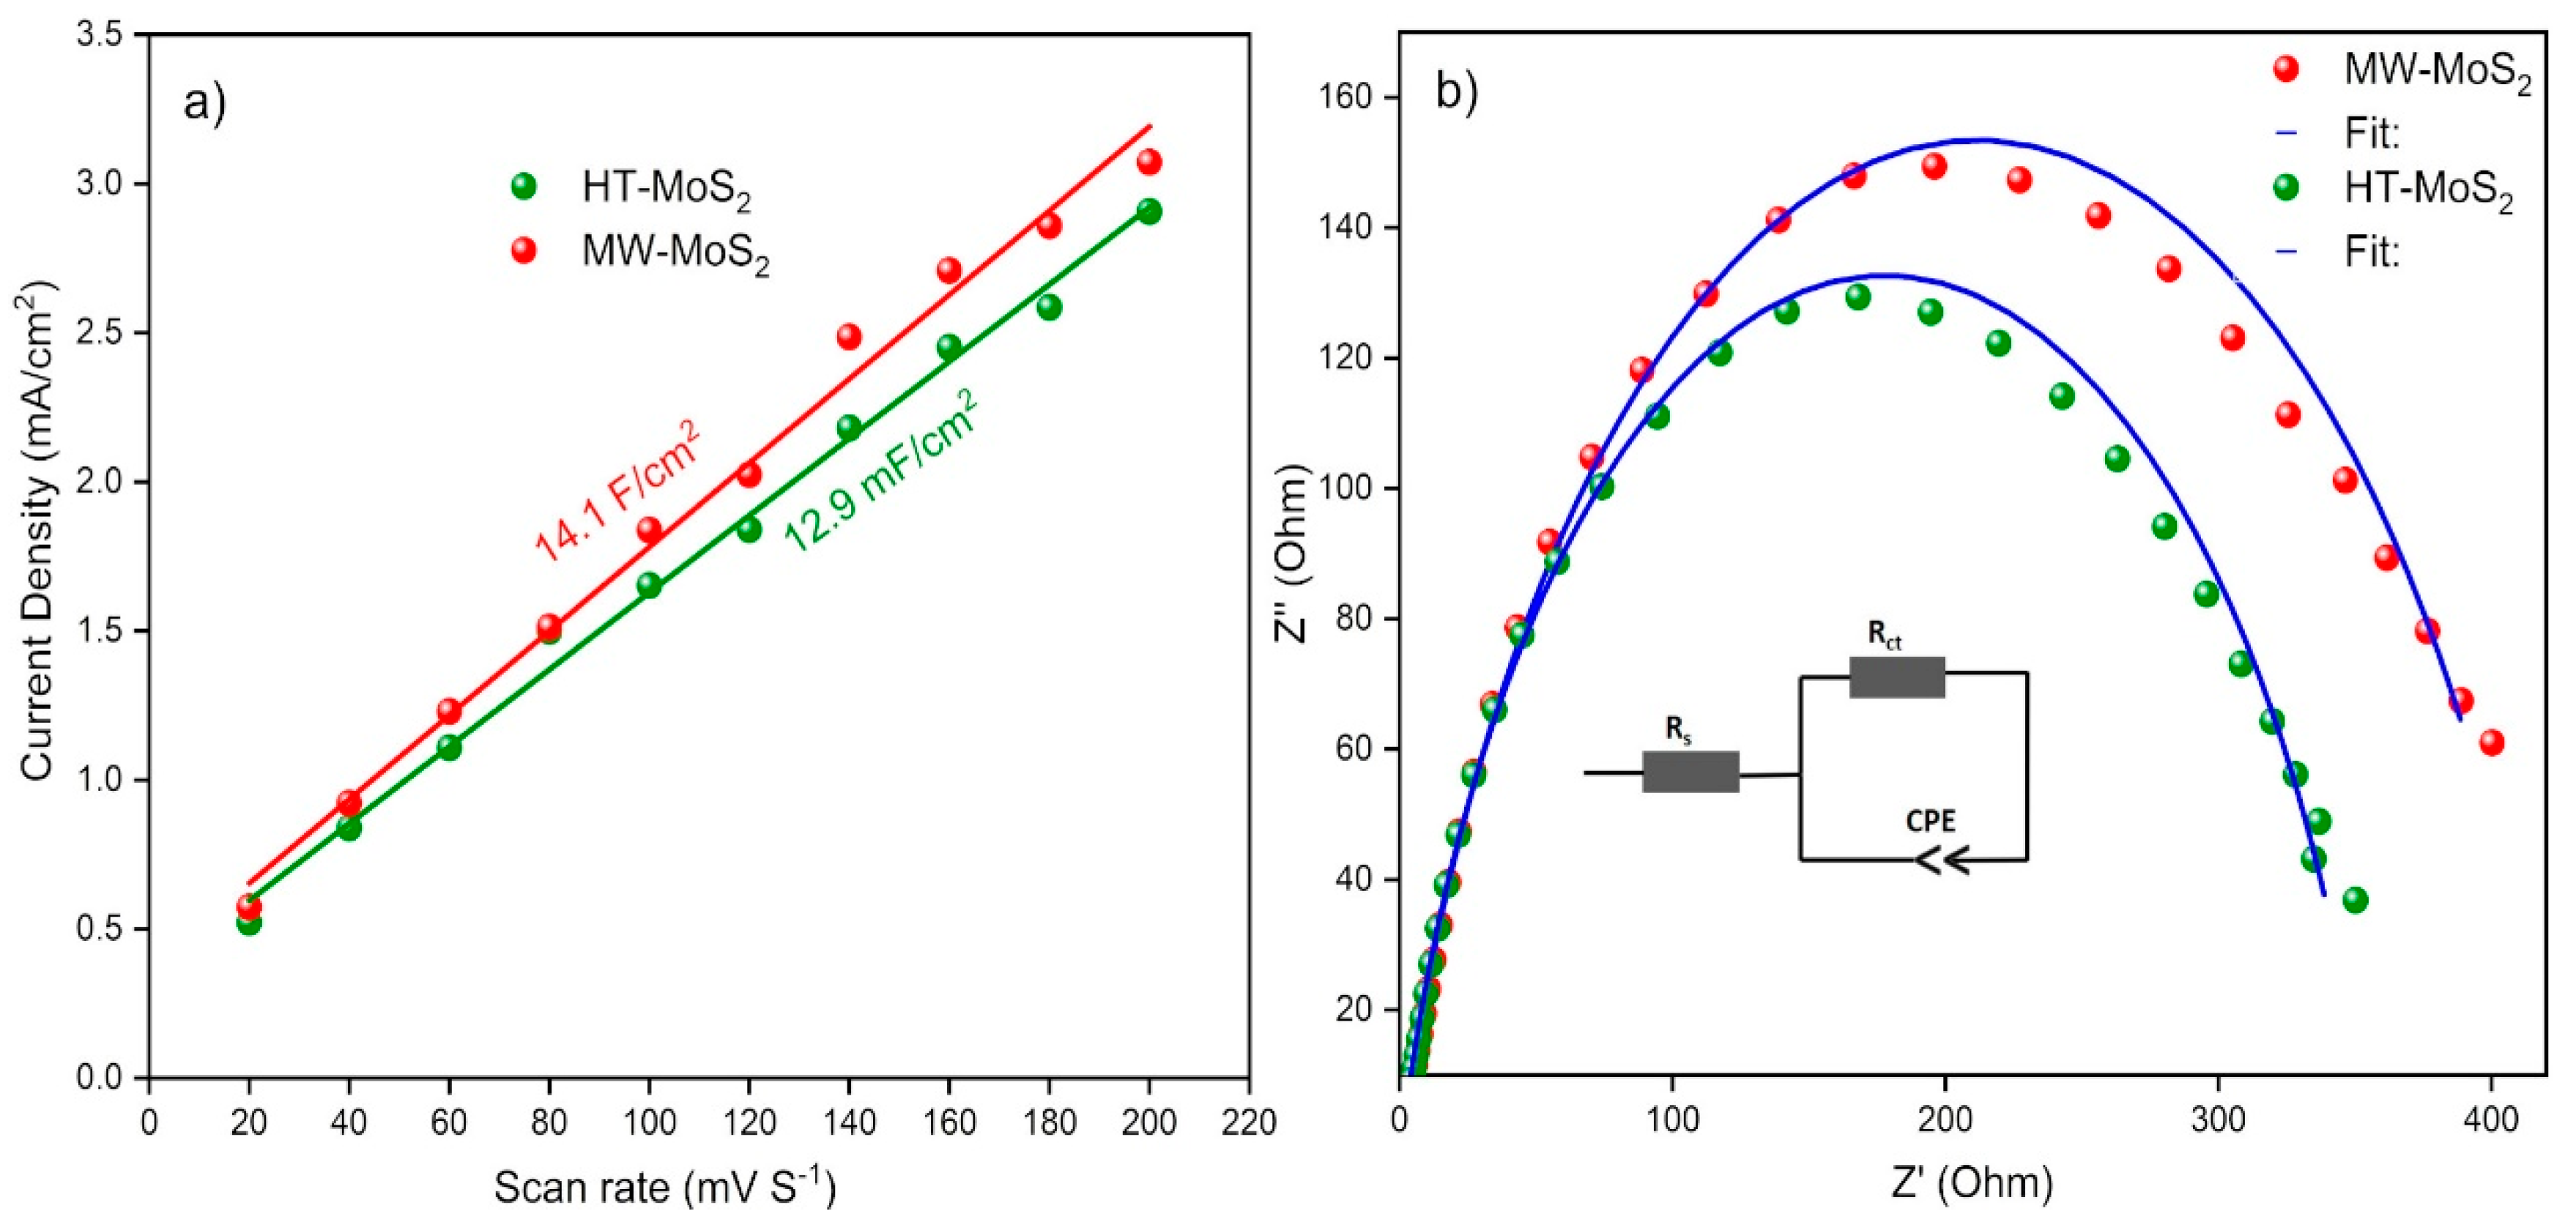
3.2. Electrochemical Characterization

To compare and discuss the electrocatalytic performances of HT-MoS2 and MW-MoS2 towards HER activity, the as-prepared catalysts were both tested in Ar-saturated 0.5 M H2SO4 electrolyte solution as described in the experimental sections. The catalytic HER performance of the prepared MoS2 is shown in Figure 6. As can be seen, both samples show negligible currents at the low potential region. However, when the potential is increased, the current increased indicating the starting of HER electrocatalytic activity. It can be seen from Figure 6a the bare GC does not have any faradic process happening within a similar potential region while both HT-MoS2 and MW-MoS2 show enhancement in the current density due to the active nature of MoS2. In sharp contrast, GC exhibited the complete absence of HER electrocatalytic activity due to the low current density and large onset potential. However, both HT-MoS2 and MW-MoS2 result in a similar onset potential.
Compared with MW-MoS2, the HT-MoS2 resulted in more activity and offered an increase in current densities after the onset potential. However, nearly similar non-faradic processes happening within the potential range from (0 to −190 mV vs. RHE). We compared the overpotential needed to reach a current density of −10 mA/cm2 for both samples. Accordingly, HT-MoS2 needs −280 mV to produce a current density of −10 mA/cm2, however, MW-MoS2 needs −320 mV to reach a similar current density, suggesting that the HT-MoS2 is more active within the faradic region. Moreover, the little improvement in the HER performance of the HT-MoS2 catalyst was further evidenced by its lower Tafel slopes (165 mV/dec) compared to MW-MoS2 (201 mV/dec) which were obtained by fitting the Tafel equation (Figure 6b). The decrease in the Tafel slope in the HT-MoS2 sample is attributed to the improved electrical conductivity of the catalyst, which is caused by the presence of enriched active surface site densities.
The Lower Tafel slope suggests a rapid increase in HER kinetics leading an improved HER catalytical performance [32]. Higher values of Tafel slope (also in this work) are probably due to the coexistence of the parallel steps, such as the absorption and desorption of intermediates steps [33], which makes it difficult to precisely identify the reactions steps based on the Tafel slope.
To understand the surface activity of the catalyst, the electrochemical active surface area (ECSA) is estimated by measuring the double-layer capacitance (Cdl) using cyclic voltammograms recorded from 0.12–0.23 V (vs. RHE). Figure 6c,d shows the CV with different scan rates for HT-MoS2 and MW-MoS2. The halves of the anodic and cathodic current density (capacitive current) at a constant potential (0.18 V) are plotted against the scan rate to obtain the double layer capacitance as shown in Figure 7a. The electrochemically active surface area can be approximated by the slope of the linear fitting of the capacitive current versus scan rate (Figure 6a), which is 14.11 mF/cm2 and 12.9 mF/cm2 for MW-MoS2 and HT-MoS2, respectively. The Cdl value obtained confirms that MW-MoS2 shows a little improved ECSA which is also observed from the polarization curve (Figure 6a) exhibiting an improved current in the non-faradic region. Both samples result in a favorable surface with abundant and fully accessible active sites.
Figure 7b shows the electrochemical impedance spectroscopy (EIS) for MW-MoS2 and HT-MoS2. The fitting was performed using the Nyquist circuit shown in Figure 7b inset and this gives back all the necessary information including charge transfer resistance (Rct), constant phase (CPE), and solution resistance (Rs) associated with HER kinetics. The fitting results are given in Table 1. The EIS measurement was conducted at a DC potential of −0.4 V vs. RHE. The lower charge transfer resistance is associated with the higher HER catalytic performance.
The values obtained for HT-MoS2 (354.4 ohms) confirm the enhanced electrochemical properties compared to the MW-MoS2 (401 ohms). The very small difference in the charge transfer resistance values is attributed to the higher active sites and better conductivity of the HT-MoS2 catalyst which is also observed in the polarization curve Figure 6a.

4. Discussion

Based on the result obtained above, microwave-assisted synthesis methods have an advantage over hydrothermal methods because of their uniform heating, minimum energy consumptions, higher yield, and shorter synthesis time. The nanosheets obtained by microwave methods show thin and uniform morphology confirmed by the SEM images. The nanosheets obtained by hydrothermal methods are a more crumpled structure with short-range order. However, based on their HER activities the hydrothermal methods provide better catalytical performances. Hydrothermal methods usually result in defect rich surfaces, especially for MoS2 and related metal sulfides, with rich sulfur vacancies [14,34,35]. The presence of intrinsic sulfur vacancies in the hydrothermally synthesized sample can provide an additional electrocatalytic platform for improved hydrogen evolution performance. Sulfur vacancy sites can also introduce a favorable hydrogen binding energy, leading to the highest per-site turnover frequency. In the catalysis field, particularly for HER, it is advantageous to have a defect rich MoS2. However, for other applications, such as electrical and mechanical applications, high-quality and defect-free MoS2 nanosheet becomes a difficult problem. The uniform heating rate and shorter synthesis time for Microwave methods can be ideal options for having defect-free or less defect rich MoS2 compared to hydrothermal methods.

5. Conclusions

MoS2 is successfully synthesized using two methods (conventional Hydrothermal and Microwave method). The as-prepared catalyst is compared in terms of crystal morphology and catalytical performance towards HER. From the crystal morphology analysis (XRD and Raman), both methods result in similar crystal structural characteristics. However, the SEM images revealed that the hydrothermal method results in very short range ordered wrinkle nanosheets compared to microwave methods.
Comparing the catalytical performance of the catalyst obtained using the two methods towards HER kinetics, it results in a very small difference in catalyst performance, which suggests that the short-range ordered wrinkle nanosheets (for HT-MoS2) favor more active sites during the catalysis. In particular, the HT-MoS2 needs −280 mV to produce a current density of 10 mA/cm2, whereas −320 mV potential is needed to reach a similar current density for MW-MoS2, suggesting that the HT-MoS2 is more active within the faradic region. Moreover, the HT-MoS2 catalyst also possesses lower Tafel slopes (165 mV/dec) compared to MW-MoS2 (201 mV/dec). The EIS conducted at a dc potential of −0.4 V vs. RHE results in lower charge transfer resistance for HT-MoS2 (354.4 ohms) compared to the MW-MoS2 (401 ohms).
In general, we believe that this comparison can provide important information on the two synthesis methods of MoS2. Even if there is a small difference in catalytical performance, the very short time needed for synthesizing MoS2 using a microwave is very easy and safe as well as less energy-consuming which results in a similar crystal structure compared to the hydrothermal methods.

Supplementary Materials

The following are available online at https://0-www-mdpi-com.brum.beds.ac.uk/2073-4352/10/11/1040/s1, Figure S1: HR-TEM micrographs of HT-MoS2 (a–d), MW-MoS2 (e,f), EDX spectrum confirming the presence of all elements (g).

Author Contributions

Data curation, Draft preparation, and formal analysis G.S., TEM analysis, R.M., Investigation, A.V., I.C., V.M., Writing & editing, G.S, and A.V. All authors have read and agreed to the published version of the manuscript.

Funding

This work was funded by financial support from Knut & Alice Wallenberg foundation, the Swedish foundation consolidator fellowship, the European Union’s Horizon 2020 research and innovation program under grant agreement No 654002, Luleå University of Technology laboratory fund program, and Kempe Foundation for partial funding. VINNOVA under the VINNMER Marie cure incoming Grant for partial funding (project “Light Energy”, LiEN, 2015-01513). The European Union’s Horizon 2020 research and innovation program under GrapheneCore2 785219—Graphene Flagship for partial funding.

Conflicts of Interest

The authors declare no conflict of interest.

References

  1. Ramachandran, R.; Menon, R.K. An overview of industrial uses of hydrogen. Int. J. Hydrogen Energy 1998, 23, 593–598. [Google Scholar] [CrossRef]
  2. Concina, I.; Ibupoto, Z.H.; Vomiero, A. Semiconducting metal oxide nanostructures for water splitting and photovoltaics. Adv. Energy Mater. 2017, 7, 1700706. [Google Scholar] [CrossRef] [Green Version]
  3. Acerce, M.; Voiry, D.; Chhowalla, M. Metallic 1T phase MoS2 nanosheets as supercapacitor electrode materials. Nat. Nanotechnol. 2015, 10, 313–318. [Google Scholar] [CrossRef]
  4. Li, S.; Liu, P.; Huang, X.; Tang, Y.; Wang, H. Reviving bulky MoS2 as an advanced anode for lithium-ion batteries. J. Mater. Chem. A 2019, 7, 10988–10997. [Google Scholar] [CrossRef]
  5. Feng, C.; Ma, J.; Li, H.; Zeng, R.; Guo, Z.; Liu, H. Synthesis of molybdenum disulfide (MoS2) for lithium ion battery applications. Mater. Res. Bull. 2009, 44, 1811–1815. [Google Scholar] [CrossRef]
  6. Wei, R.; Yang, H.; Du, K.; Fu, W.; Tian, Y.; Yu, Q.; Liu, S.; Li, M.; Zou, G. A facile method to prepare MoS2 with nanoflower-like morphology. Mater. Chem. Phys. 2008, 108, 188–191. [Google Scholar] [CrossRef]
  7. Yang, T.; Feng, X.; Tang, Q.; Yang, W.; Fang, J.; Wang, G.; Shi, W.; Shi, L.; Ding, P. A facile method to prepare MoS2 with nanolameller-like morphology. J. Alloys Compd. 2011, 509, L236–L238. [Google Scholar] [CrossRef]
  8. Sun, J.; Li, X.; Guo, W.; Zhao, M.; Fan, X.; Dong, Y.; Xu, C.; Deng, J.; Fu, Y. Synthesis Methods of Two-Dimensional MoS2: A Brief Review. Crystals 2017, 7, 198. [Google Scholar] [CrossRef]
  9. Krishnan, U.; Kaur, M.; Singh, K.; Kumar, M.; Kumar, A. A synoptic review of MoS2: Synthesis to applications. Superlattices Microstruct. 2019, 128, 274–297. [Google Scholar] [CrossRef]
  10. Kothari, R.; Buddhi, D.; Sawhney, R.L. Sources and technology for hydrogen production: A review. Int. J. Glob. Energy Issues 2004, 21, 154. [Google Scholar] [CrossRef]
  11. Qian, X.; Ding, J.; Zhang, J.; Zhang, Y.; Wang, Y.; Kan, E.; Wang, X.; Zhu, J. Ultrathin molybdenum disulfide/carbon nitride nanosheets with abundant active sites for enhanced hydrogen evolution. Nanoscale 2018, 10, 1766–1773. [Google Scholar] [CrossRef] [PubMed]
  12. Shi, Y.; Zhou, Y.; Yang, D.R.; Xu, W.X.; Wang, C.; Wang, F.B.; Xu, J.J.; Xia, X.H.; Chen, H.Y. Energy Level Engineering of MoS2 by Transition-Metal Doping for Accelerating Hydrogen Evolution Reaction. J. Am. Chem. Soc. 2017, 139, 15479–15485. [Google Scholar] [CrossRef] [PubMed]
  13. Wu, L.; Xu, X.; Zhao, Y.; Zhang, K.; Sun, Y.; Wang, T.; Wang, Y.; Zhong, W.; Du, Y. Mn doped MoS2 /reduced graphene oxide hybrid for enhanced hydrogen evolution. Appl. Surf. Sci. 2017, 425, 470–477. [Google Scholar] [CrossRef]
  14. Solomon, G.; Mazzaro, R.; You, S.; Natile, M.M.; Morandi, V.; Concina, I.; Vomiero, A. Ag2S/MoS2 Nanocomposites Anchored on Reduced Graphene Oxide: Fast Interfacial Charge Transfer for Hydrogen Evolution Reaction. ACS Appl. Mater. Interfaces 2019, 11, 22380–22389. [Google Scholar] [CrossRef]
  15. Kamila, S.; Mohanty, B.; Samantara, A.K.; Guha, P.; Ghosh, A.; Jena, B.; Satyam, P.V.; Mishra, B.K.; Jena, B.K. Highly Active 2D Layered MoS2 -rGO Hybrids for Energy Conversion and Storage Applications. Sci. Rep. 2017, 7, 8378. [Google Scholar] [CrossRef] [Green Version]
  16. Bandal, H.A.; Jadhav, A.R.; Tamboli, A.H.; Kim, H. Bimetallic iron cobalt oxide self-supported on Ni-Foam: An efficient bifunctional electrocatalyst for oxygen and hydrogen evolution reaction. Electrochim. Acta 2017, 249, 253–262. [Google Scholar] [CrossRef]
  17. Wang, D.; Li, Q.; Han, C.; Xing, Z.; Yang, X. When NiO@Ni Meets WS2 nanosheet array: A highly efficient and ultrastable electrocatalyst for overall water splitting. ACS Cent. Sci. 2018, 4, 112–119. [Google Scholar] [CrossRef] [Green Version]
  18. Zhou, K.; Zhu, Y.; Yang, X.; Zhou, J.; Li, C. Demonstration of photoluminescence and metal-enhanced fluorescence of exfoliated MoS2. ChemPhysChem 2012, 13, 699–702. [Google Scholar] [CrossRef]
  19. Jawaid, A.; Nepal, D.; Park, K.; Jespersen, M.; Qualley, A.; Mirau, P.; Drummy, L.F.; Vaia, R.A. Mechanism for Liquid Phase Exfoliation of MoS2. Chem. Mater. 2016, 28, 337–348. [Google Scholar] [CrossRef]
  20. Tao, J.; Chai, J.; Lu, X.; Wong, L.M.; Wong, T.I.; Pan, J.; Xiong, Q.; Chi, D.; Wang, S. Growth of wafer-scale MoS2 monolayer by magnetron sputtering. Nanoscale 2015, 7, 2497–2503. [Google Scholar] [CrossRef]
  21. Wang, X.; Feng, H.; Wu, Y.; Jiao, L. Controlled synthesis of highly crystalline MoS2 flakes by chemical vapor deposition. J. Am. Chem. Soc. 2013, 135, 5304–5307. [Google Scholar] [CrossRef] [PubMed]
  22. Tan, L.K.; Liu, B.; Teng, J.H.; Guo, S.; Low, H.Y.; Loh, K.P. Atomic layer deposition of a MoS2 film. Nanoscale 2014, 6, 10584–10588. [Google Scholar] [CrossRef] [PubMed]
  23. Gawande, M.B.; Shelke, S.N.; Zboril, R.; Varma, R.S. Microwave-Assisted Chemistry: Synthetic Applications for Rapid Assembly of Nanomaterials and Organics. Acc. Chem. Res. 2014, 47, 1338–1348. [Google Scholar] [CrossRef] [PubMed]
  24. Li, W.J.; Shi, E.W.; Ko, J.M.; Chen, Z.Z.; Ogino, H.; Fukuda, T. Hydrothermal synthesis of MoS2 nanowires. J. Cryst. Growth 2003, 250, 418–422. [Google Scholar] [CrossRef]
  25. Lin, H.; Chen, X.; Li, H.; Yang, M.; Qi, Y. Hydrothermal synthesis and characterization of MoS2 nanorods. Mater. Lett. 2010, 64, 1748–1750. [Google Scholar] [CrossRef]
  26. Peng, Y.; Meng, Z.; Zhong, C.; Lu, J.; Yu, W.; Yang, Z.; Qian, Y. Hydrothermal Synthesis of MoS2 and Its Pressure-Related Crystallization. J. Solid State Chem. 2001, 159, 170–173. [Google Scholar] [CrossRef]
  27. Muralikrishna, S.; Manjunath, K.; Samrat, D.; Reddy, V.; Ramakrishnappa, T.; Nagaraju, D.H. Hydrothermal synthesis of 2D MoS2 nanosheets for electrocatalytic hydrogen evolution reaction. RSC Adv. 2015, 5, 89389–89396. [Google Scholar] [CrossRef]
  28. Park, S.-K.; Yu, S.-H.; Woo, S.; Quan, B.; Lee, D.-C.; Kim, M.K.; Sung, Y.-E.; Piao, Y. A simple L-cysteine-assisted method for the growth of MoS2 nanosheets on carbon nanotubes for high-performance lithium ion batteries. Dalton Trans. 2013, 42, 2399–2405. [Google Scholar] [CrossRef]
  29. Reshmi, S.; Akshaya, M.V.; Satpati, B.; Roy, A.; Kumar Basu, P.; Bhattacharjee, K. Tailored MoS2 nanorods: A simple microwave assisted synthesis. Mater. Res. Express 2017, 4, 115012. [Google Scholar] [CrossRef]
  30. Li, H.; Zhang, Q.; Yap, C.C.R.; Tay, B.K.; Edwin, T.H.T.; Olivier, A.; Baillargeat, D. From bulk to monolayer MoS2: Evolution of Raman scattering. Adv. Funct. Mater. 2012, 22, 1385–1390. [Google Scholar] [CrossRef]
  31. Li, M.; Wang, D.; Li, J.; Pan, Z.; Ma, H.; Jiang, Y.; Tian, Z. Facile hydrothermal synthesis of MoS2 nano-sheets with controllable structures and enhanced catalytic performance for anthracene hydrogenation. RSC Adv. 2016, 6, 71534–71542. [Google Scholar] [CrossRef]
  32. Li, R.; Yang, L.; Xiong, T.; Wu, Y.; Cao, L.; Yuan, D.; Zhou, W. Nitrogen doped MoS2 nanosheets synthesized via a low-temperature process as electrocatalysts with enhanced activity for hydrogen evolution reaction. J. Power Sources 2017, 356, 133–139. [Google Scholar] [CrossRef]
  33. Shinagawa, T.; Garcia-Esparza, A.T.; Takanabe, K. Insight on Tafel slopes from a microkinetic analysis of aqueous electrocatalysis for energy conversion. Sci. Rep. 2015, 5, 13801. [Google Scholar] [CrossRef] [Green Version]
  34. Tahira, A.; Ibupoto, Z.H.; Mazzaro, R.; You, S.; Morandi, V.; Natile, M.M.; Vagin, M.; Vomiero, A. Advanced Electrocatalysts for Hydrogen Evolution Reaction Based on Core-Shell MoS2/TiO2 Nanostructures in Acidic and Alkaline Media. ACS Appl. Energy Mater. 2019, 2, 2053–2062. [Google Scholar] [CrossRef]
  35. Ibupoto, Z.H.; Tahira, A.; Tang, P.Y.; Liu, X.; Morante, J.R.; Fahlman, M.; Arbiol, J.; Vagin, M.; Vomiero, A. MoSx@NiO Composite Nanostructures: An Advanced Nonprecious Catalyst for Hydrogen Evolution Reaction in Alkaline Media. Adv. Funct. Mater. 2019, 29, 1807562. [Google Scholar] [CrossRef] [Green Version]
Figure 1. 3D crystal structural representation of MoS2 displaying the interlayer distance between the atoms (a), Top view MoS2 displaying the hexagonal structure (b), synthesis methods of MoS2 using hydrothermal (c), Microwave (d), Microwave reaction parameters showing the temperature ramp program, actual temperature and microwave power displayed by the thin red line, bold red line, and blackline, respectively (e).
Crystals 10 01040 g001
Figure 2. Powder XRD patterns of HT-MoS2 and MW-MoS2.
Crystals 10 01040 g002
Figure 3. Raman spectra of HT-MoS2 (a) and MW-MoS2 (b) conducted with a laser excitation of 532 nm.
Crystals 10 01040 g003
Figure 4. Scanning Electron Microscope (SEM) image of HT-MoS2 (a) and MW-MoS2 (b). Energy Dispersive Spectra (EDS) mapping of Mo, S, and O for MW-MoS2 (c) and MW-MoS2 (d) indicating the homogeneous distribution of each element.
Crystals 10 01040 g004
Figure 5. High-Resolution Transmission electron microscope (HR-TEM) micrographs of HT-MoS2 (ac), MW-MoS2 (df) with increasing magnification. In the inset, fast Fourier transform (FFT) of the HR-TEM micrograph displaying the typical hexagonal pattern of MoS2 Zone Axis [0, 0, 2].
Crystals 10 01040 g005
Figure 6. Polarization curves for HT-MoS2 and MW-MoS2 (a) Tafel slope derived from the polarization curve (b), and cyclic voltammetry conducted for measuring double-layer capacitance at different scan rate (from 20 mV/s to 200 mV/s) (c,d).
Crystals 10 01040 g006
Figure 7. The linear slope for obtaining double-layer capacitance Cdl (a), potentiostat impedances (b), the inset is an equivalent circuit used for fitting potentiostat impedances result.
Crystals 10 01040 g007
Table 1. Electrochemical impedance result obtained from the fitting.
Catalyst Rs (Ohms)Rct (Ohms)CPE q1CPEα
HT-MoS24353.40.00070.820
MW-MoS24.64010.00060.802
Publisher’s Note: MDPI stays neutral with regard to jurisdictional claims in published maps and institutional affiliations.

