Direct Observation of Molecular Orbitals Using Synchrotron X-ray Diffraction
by
 , , and
Shunsuke Kitou
1,* ,
,
Yuto Hosogi
1,
Ryo Kitaura
2,
Toshio Naito
3,4,5,
Toshikazu Nakamura
6 and
Hiroshi Sawa
1,* 1
Department of Applied Physics, Nagoya University, Nagoya 464-8603, Japan
2
Department of Chemistry, Nagoya University, Nagoya 464-8602, Japan
3
Graduate School of Science and Engineering, Ehime University, Matsuyama 790-8577, Japan
4
Research Unit for Development of Organic Superconductors, Ehime University, Matsuyama 790-8577, Japan
5
Geodynamics Research Center (GRC), Ehime University, Matsuyama 790-8577, Japan
6
Institute for Molecular Science, Myodaiji, Okazaki 444-8585, Japan
*
Authors to whom correspondence should be addressed.
Crystals 2020, 10(11), 998; https://0-doi-org.brum.beds.ac.uk/10.3390/cryst10110998
Submission received: 15 October 2020
/
Revised: 30 October 2020
/
Accepted: 30 October 2020
/
Published: 3 November 2020
(This article belongs to the Special Issue Organic Conductors)
Abstract
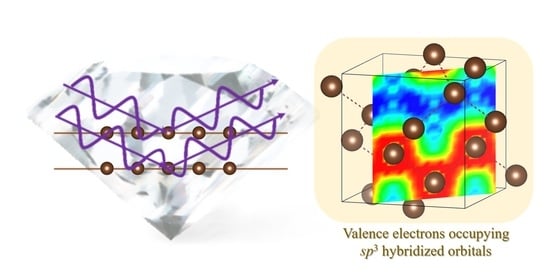
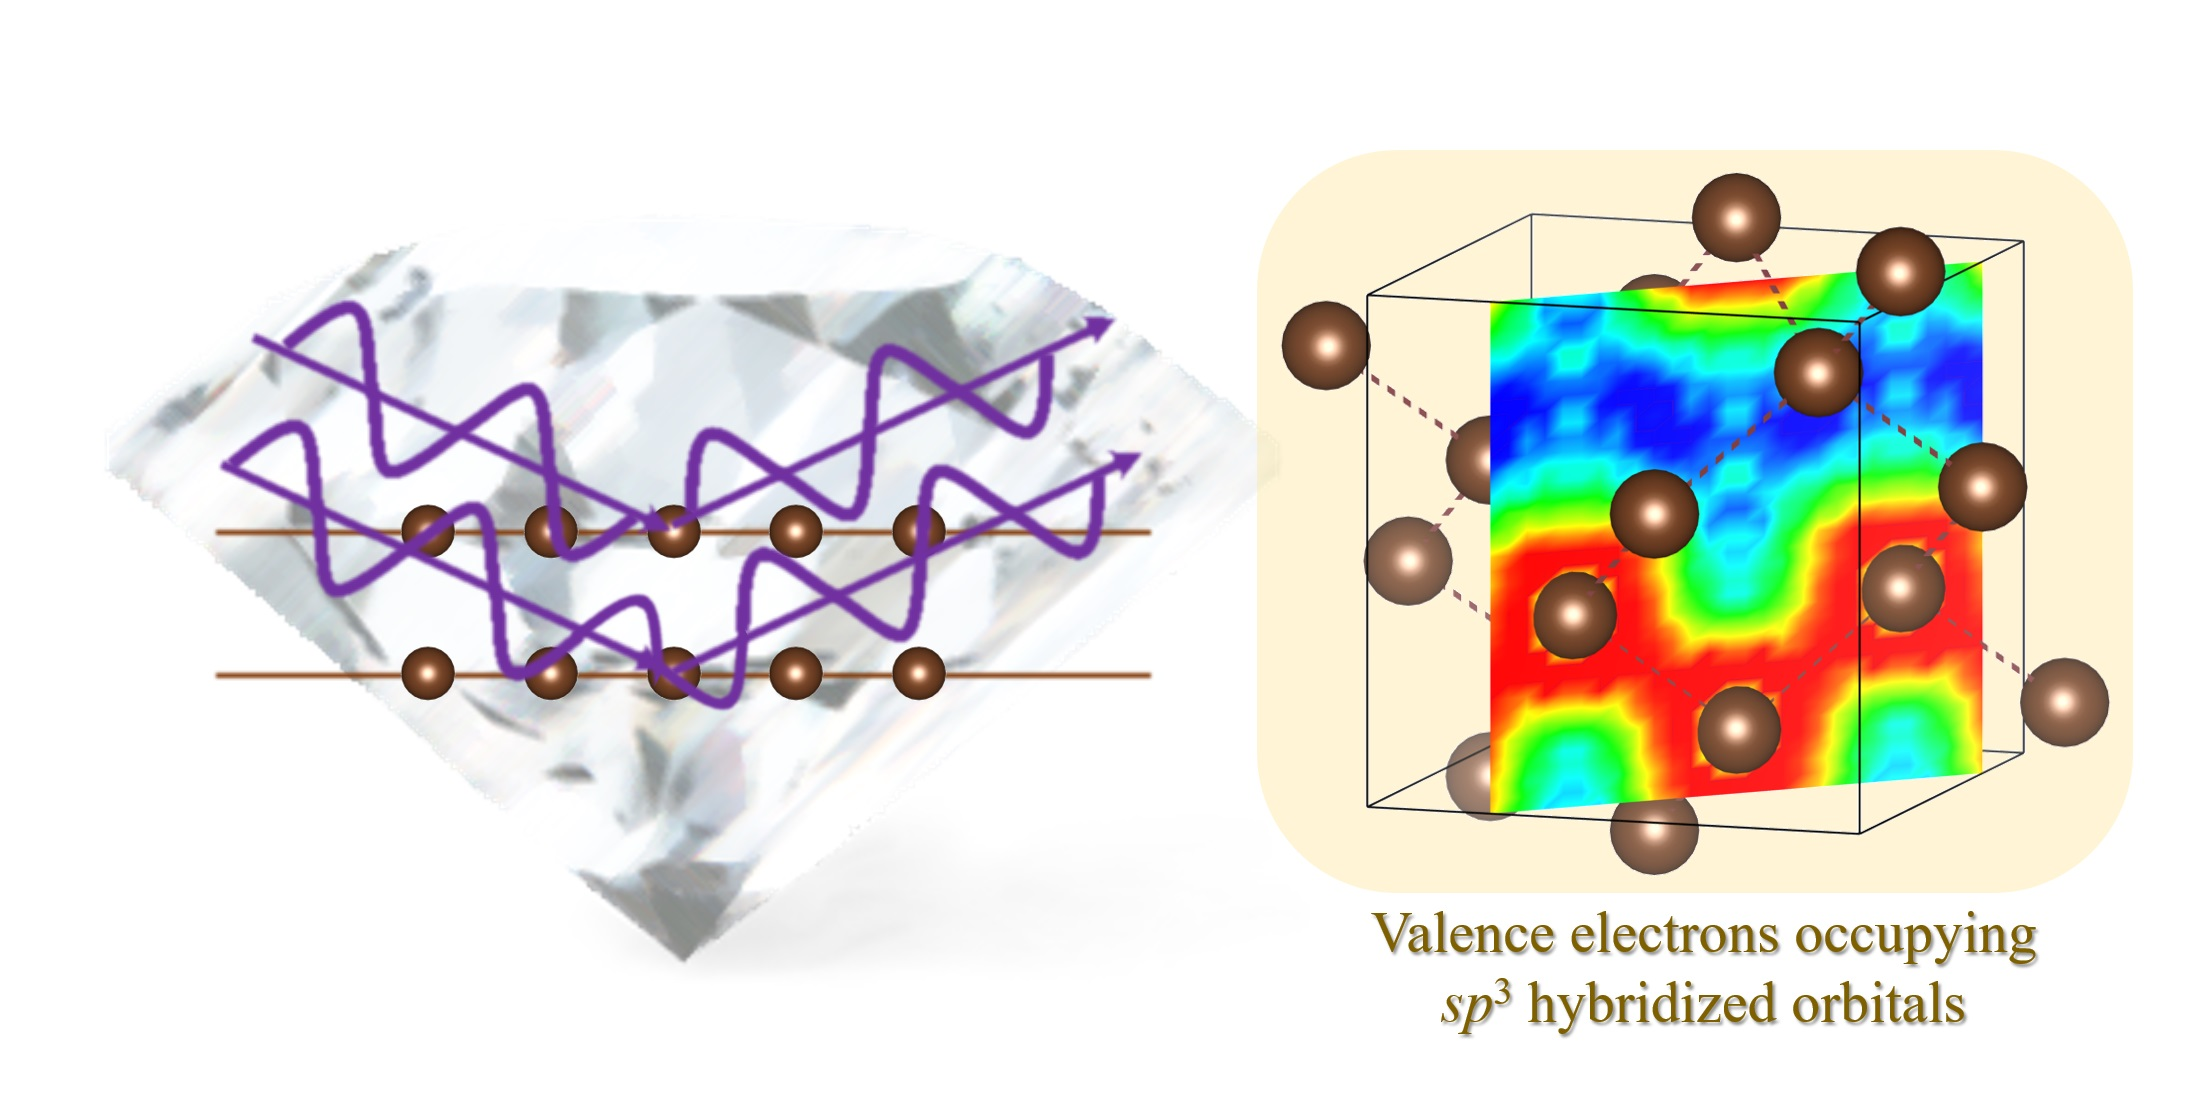
:The physical properties of molecular crystals are governed by the frontier orbitals of molecules. A molecular orbital, which is formed by superposing the atomic orbitals of constituent elements, has complicated degrees of freedom in the crystal because of the influence of electron correlation and crystal field. Therefore, in general, it is difficult to experimentally observe the whole picture of a frontier orbital. Here, we introduce a new method called “core differential Fourier synthesis” (CDFS) using synchrotron X-ray diffraction to observe the valence electron density in materials. By observing the valence electrons occupied in molecular orbitals, the orbital state can be directly determined in a real space. In this study, we applied the CDFS method to molecular materials such as diamond, C60 fullerene, (MV)I2, and (TMTTF)2X. Our results not only demonstrate the typical orbital states in some materials, but also provide a new method for studying intramolecular degrees of freedom.
1. Introduction
The degree of freedom of electron orbitals in materials is closely related to physical properties, such as electrical conductivity, magnetic, dielectric, and optical properties, and crystal structure [1,2,3]. An electron orbital corresponds to the existence probability of electrons in a real space. In other words, the orbital state can be correctly understood by observing the spatial distribution of electrons in materials. Among the three degrees of freedom in electrons (i.e., charge, spin, and orbital), because the charge and spin can readily respond to external electric and/or magnetic fields, their properties are relatively easy to measure. On the other hand, several experimental methods, such as electron spin resonance (ESR), nuclear magnetic resonance (NMR), high harmonics generated from femtosecond laser pulses [4], ultraviolet angle-resolved photoelectron spectroscopy [5], polarized neutron diffraction [6], resonant X-ray scattering [7], and multipole analysis [8] using X-ray diffraction (XRD), are known to extract orbital information that control the anisotropy of the physical properties. However, in these methods, the measurable substances are limited, and the results may depend on the applied model. Furthermore, as the molecular substance formed by the bonding of multiple atoms has several independent parameters that describe the crystal structure, it is very difficult to estimate the frontier orbital state of the entire system from quantum chemical or first-principles calculations.
The spatial distribution of electrons observed experimentally will be useful for understanding the orbital states in materials. In this sense, XRD is one of the most powerful experimental probes to observe electrons around atoms in a solid. XRD is based on the scattering phenomenon of electrons in a crystal, where the periodic structure of electrons and diffraction intensities are linked by a Fourier transform. In principle, a complete electron density (ED) distribution can be reproduced by performing the inverse Fourier transform on the ‘infinite’ number of diffraction intensities corresponding to the Fourier series. However, in reality, because the number of diffraction reflections obtained by the XRD experiment is ‘finite’, it is impossible to reproduce the complete ED distribution owing to the mathematical truncation effects of the Fourier synthesis. Moreover, of all the electrons around an atom, only valence electrons, which are very small in number compared to the total number of electrons in the crystal, are responsible for their physical properties. Therefore, to extract the frontier orbital information from the ED, only the valence electrons need to be extracted. Due to these difficulties, instead of observing the ED, the crystal structure is usually determined from XRD experiments by refining the internal parameters (e.g., atomic positions, atomic displacement parameters, and site occupancies) of the assumed crystal structural model through the least squares method to match the diffraction intensities. This method is called a crystal structural analysis. To access the orbital state (i.e., the distribution of electrons) with high accuracy in materials from the XRD, a new method of analysis is required.
In this paper, we introduce the core differential Fourier synthesis (CDFS) method [9,10] for directly observing the valence electron density (VED) in a crystal from XRD data. The details of the method are also explained in [10]. CDFS can efficiently extract only the valence electron information, which corresponds to the physical properties. By using this method, the orbital state that governs the anisotropy of the physical properties can be directly observed in a real space. Here, we show the results of applying the CDFS method to diamond, C60 fullerene, (MV)I2 (MV = methyl viologen), and (TMTTF)2X (TMTTF = tetramethyl tetrathiafulvalene; X = PF6, and AsF6).
2. Methods
The XRD experiments using single crystals were performed on the BL02B1 beamline at the synchrotron radiation facility SPring-8 in Japan [11]. A helium-gas-blowing device (Japan Thermal Engineering Co., Ltd., Japan) was employed to cool the sample. A two-dimensional (2D) imaging plate (FUJIFILM Co., Japan) and a CdTe PILATUS (DECTRIS Ltd., Switzerland) detectors, which had a dynamic range of ~106, were installed in the diffractometer (Rigaku Co., Japan). Diffraction intensity averaging and a structural analysis were performed using SORTAV [12] and Jana2006 [13], respectively. The crystal structure and ED distribution figures were visualized using VESTA [14].
The diffraction intensity obtained from the XRD experiment can be described as a Fourier transform of the ED using the scattering vector (Equation (1)).
Here, S is a scaling factor. The integration range ( in Equation (1)) corresponds to the range in which X-rays interfere in the crystal. In the case of a crystal, can be described as Equation (2) using Laue functions , , and , where .
Here, is the absolute value of the experimentally observed crystal structure factor. Generally, if the number of unit cells in a crystal is sufficiently large, then the Laue function becomes only when all of the are integers; otherwise, . In principle, the ED distribution can be reproduced by the inverse Fourier transform of the diffraction intensity according to
if the infinite diffraction data were observed. However, the calculation of the ED generally has three problems. (i) To extract the VED with anisotropic information, a sufficiently wide dynamic range of intensity is required. (ii) is obtained from the experimentally diffraction intensity because of the relationship of . In this case, does not include information of the phase term as , which is necessary for the calculation of . (iii) Because the number of the data is finite, the mathematical truncation effect seriously affects the ED distribution.
With regard to (i), the relationship between the number of focused electrons and the number of electrons in the unit cell is important. In the case of a quasi-one-dimensional (1D) molecular conductor (TMTTF)2X, a 3/4-filled system, because is a monovalent anion, such as , , , , or , there is one hole for two TMTTF molecules forming a dimer. The number of electrons in the (TMTTF)2X unit is approximately 350. To estimate the amount of charge transfer of less than 1e in the TMTTF dimer in the charge ordering state, a dynamic range that can accurately extract of the measured maximum intensity is necessary. Here, the signal information should be observed with a sufficient signal-to-noise (S/N) ratio. This requirement is sufficiently fulfilled using the current synchrotron radiation facility, in which the dynamic range of is guaranteed.
With regard to (ii), because the phase term can be assigned from the calculated crystal structure factor
as , Equation (3) can be rewritten as
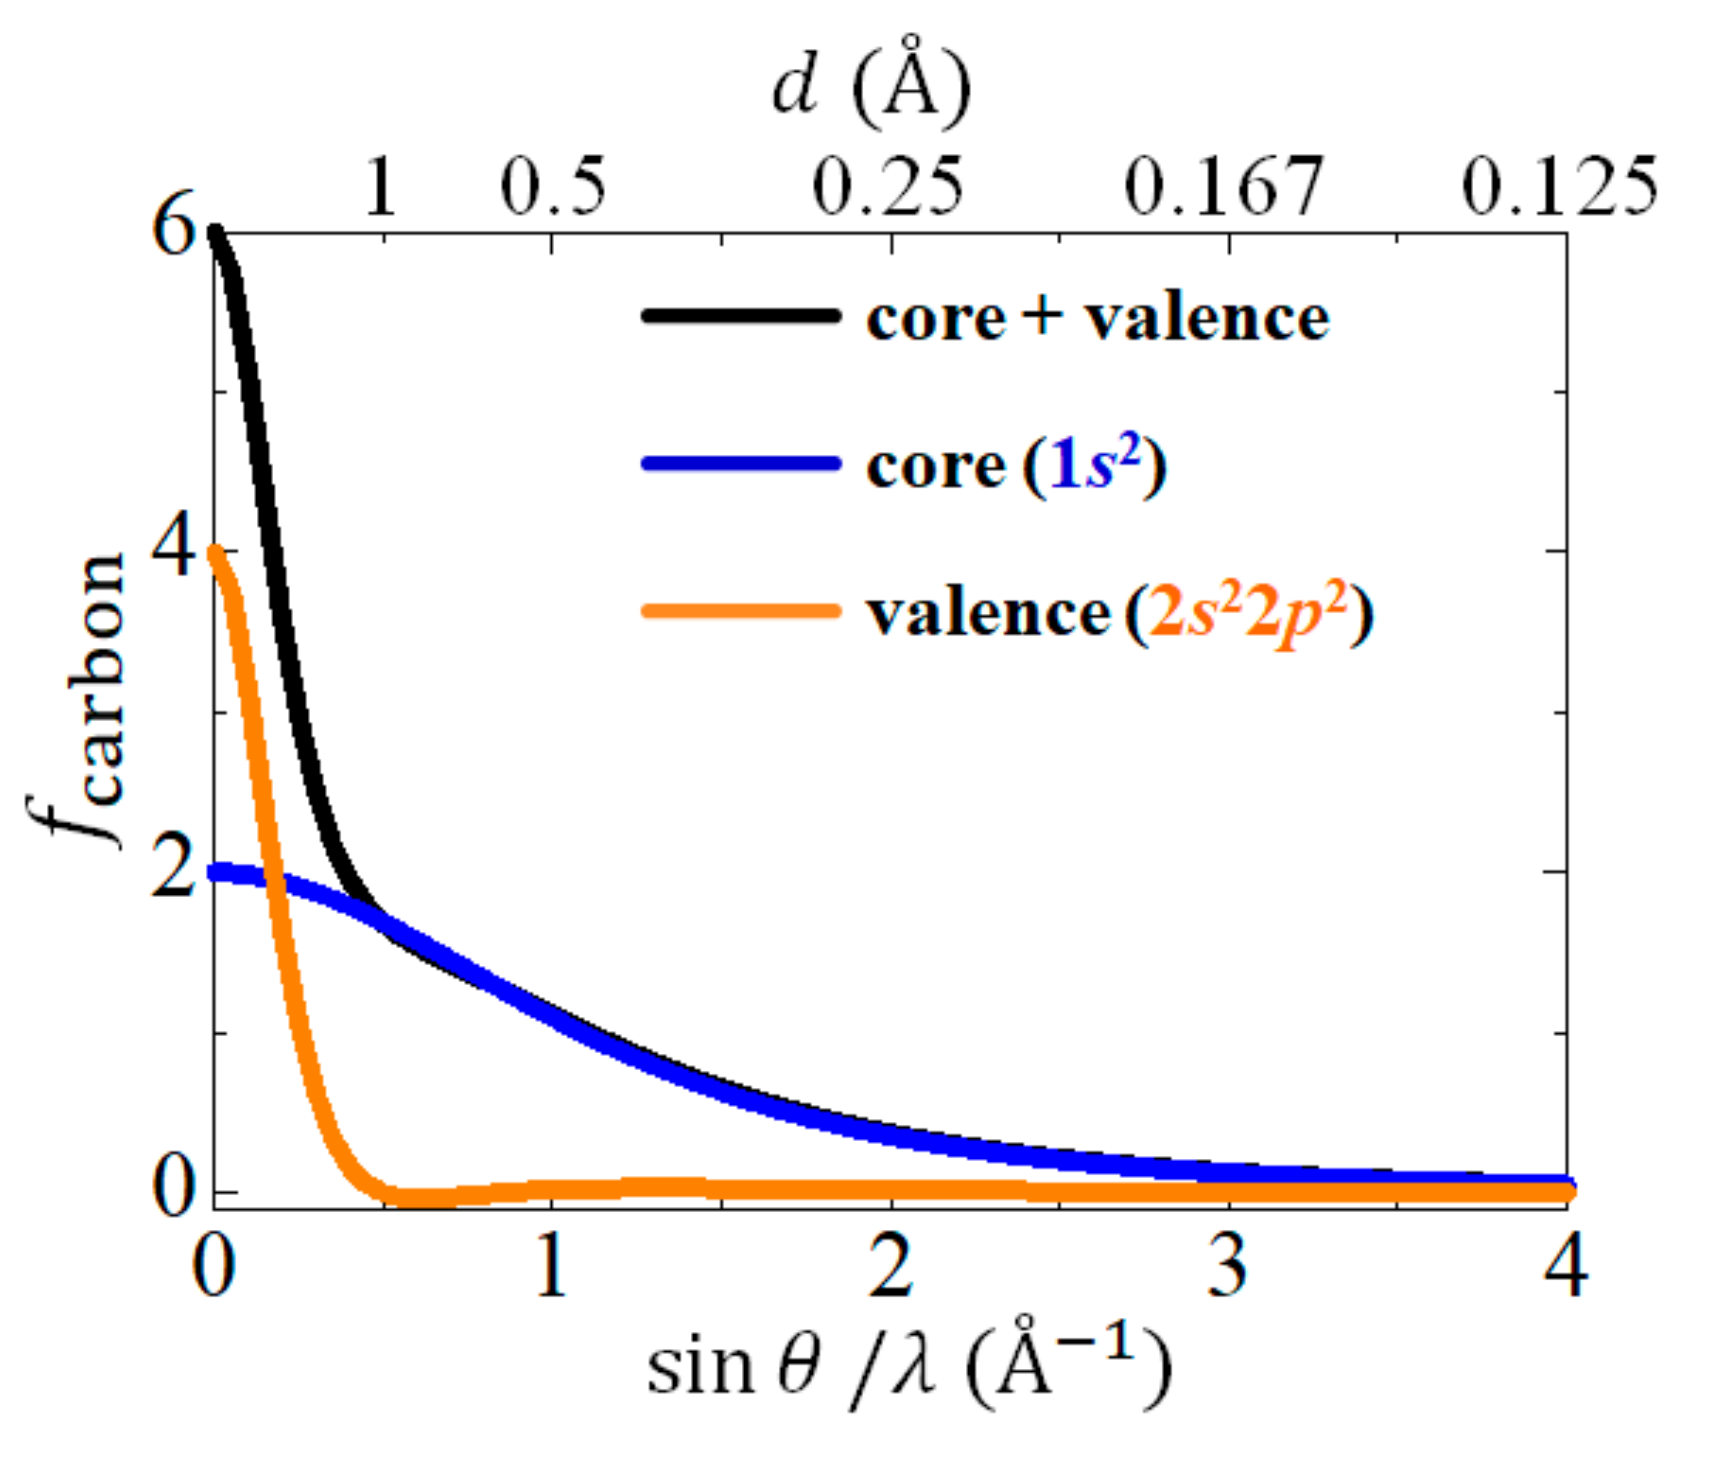
Here, is the jth atomic position, is the jth atomic displacement parameter, and is the jth atomic scattering factor, which is described as
Figure 1 shows the atomic scattering factor of carbon as a function of [15]. Here, is the wavelength of the incident X-ray, and is the XRD angle. While the contribution of the core electrons extends to the high-angle region, the contribution of the valence electrons exists only in the low-angle region (). When calculating the ED, it is necessary to determine with high accuracy to obtain the correct phase term . For this purpose, the structural refinement is performed using only the high-angle (i.e., high-angle analysis), where the contribution of the spatially spread valence electron is very small.
With regard to (iii), the truncation effect of the Fourier synthesis can be suppressed using the CDFS method. The equation of the inverse Fourier transform by the CDFS method is described as
Here, is the jth atomic scattering factor with only the core electron contribution, which corresponds to the blue line in Figure 1. is the phase term with only the core electron contribution calculated as . is the total number of valence electrons contained in the unit cell. The Bragg reflection intensity cannot be observed experimentally. When ignoring the second term in Equation (7), the total number of electrons in the unit cell becomes zero. Therefore, the VED distribution data are corrected by adding the term. In general, measured experimentally is () even when using the short-wavelength X-ray obtained at the synchrotron radiation facility. In Figure 1, a nonzero value remains in at . Therefore, even if a short-wavelength X-ray is used, the mathematical truncation effect cannot be avoided from the calculation using Equation (5). Meanwhile, in Equation (7), the inverse Fourier transform is performed on the term obtained by subtracting the core electron contribution from , which contains the contribution of all electrons. Because most of the contribution of the remaining exists only in , the VED can be extracted with a little truncation effect of the Fourier synthesis by the CDFS analysis.
3. Results and Discussion
3.1. Diamond
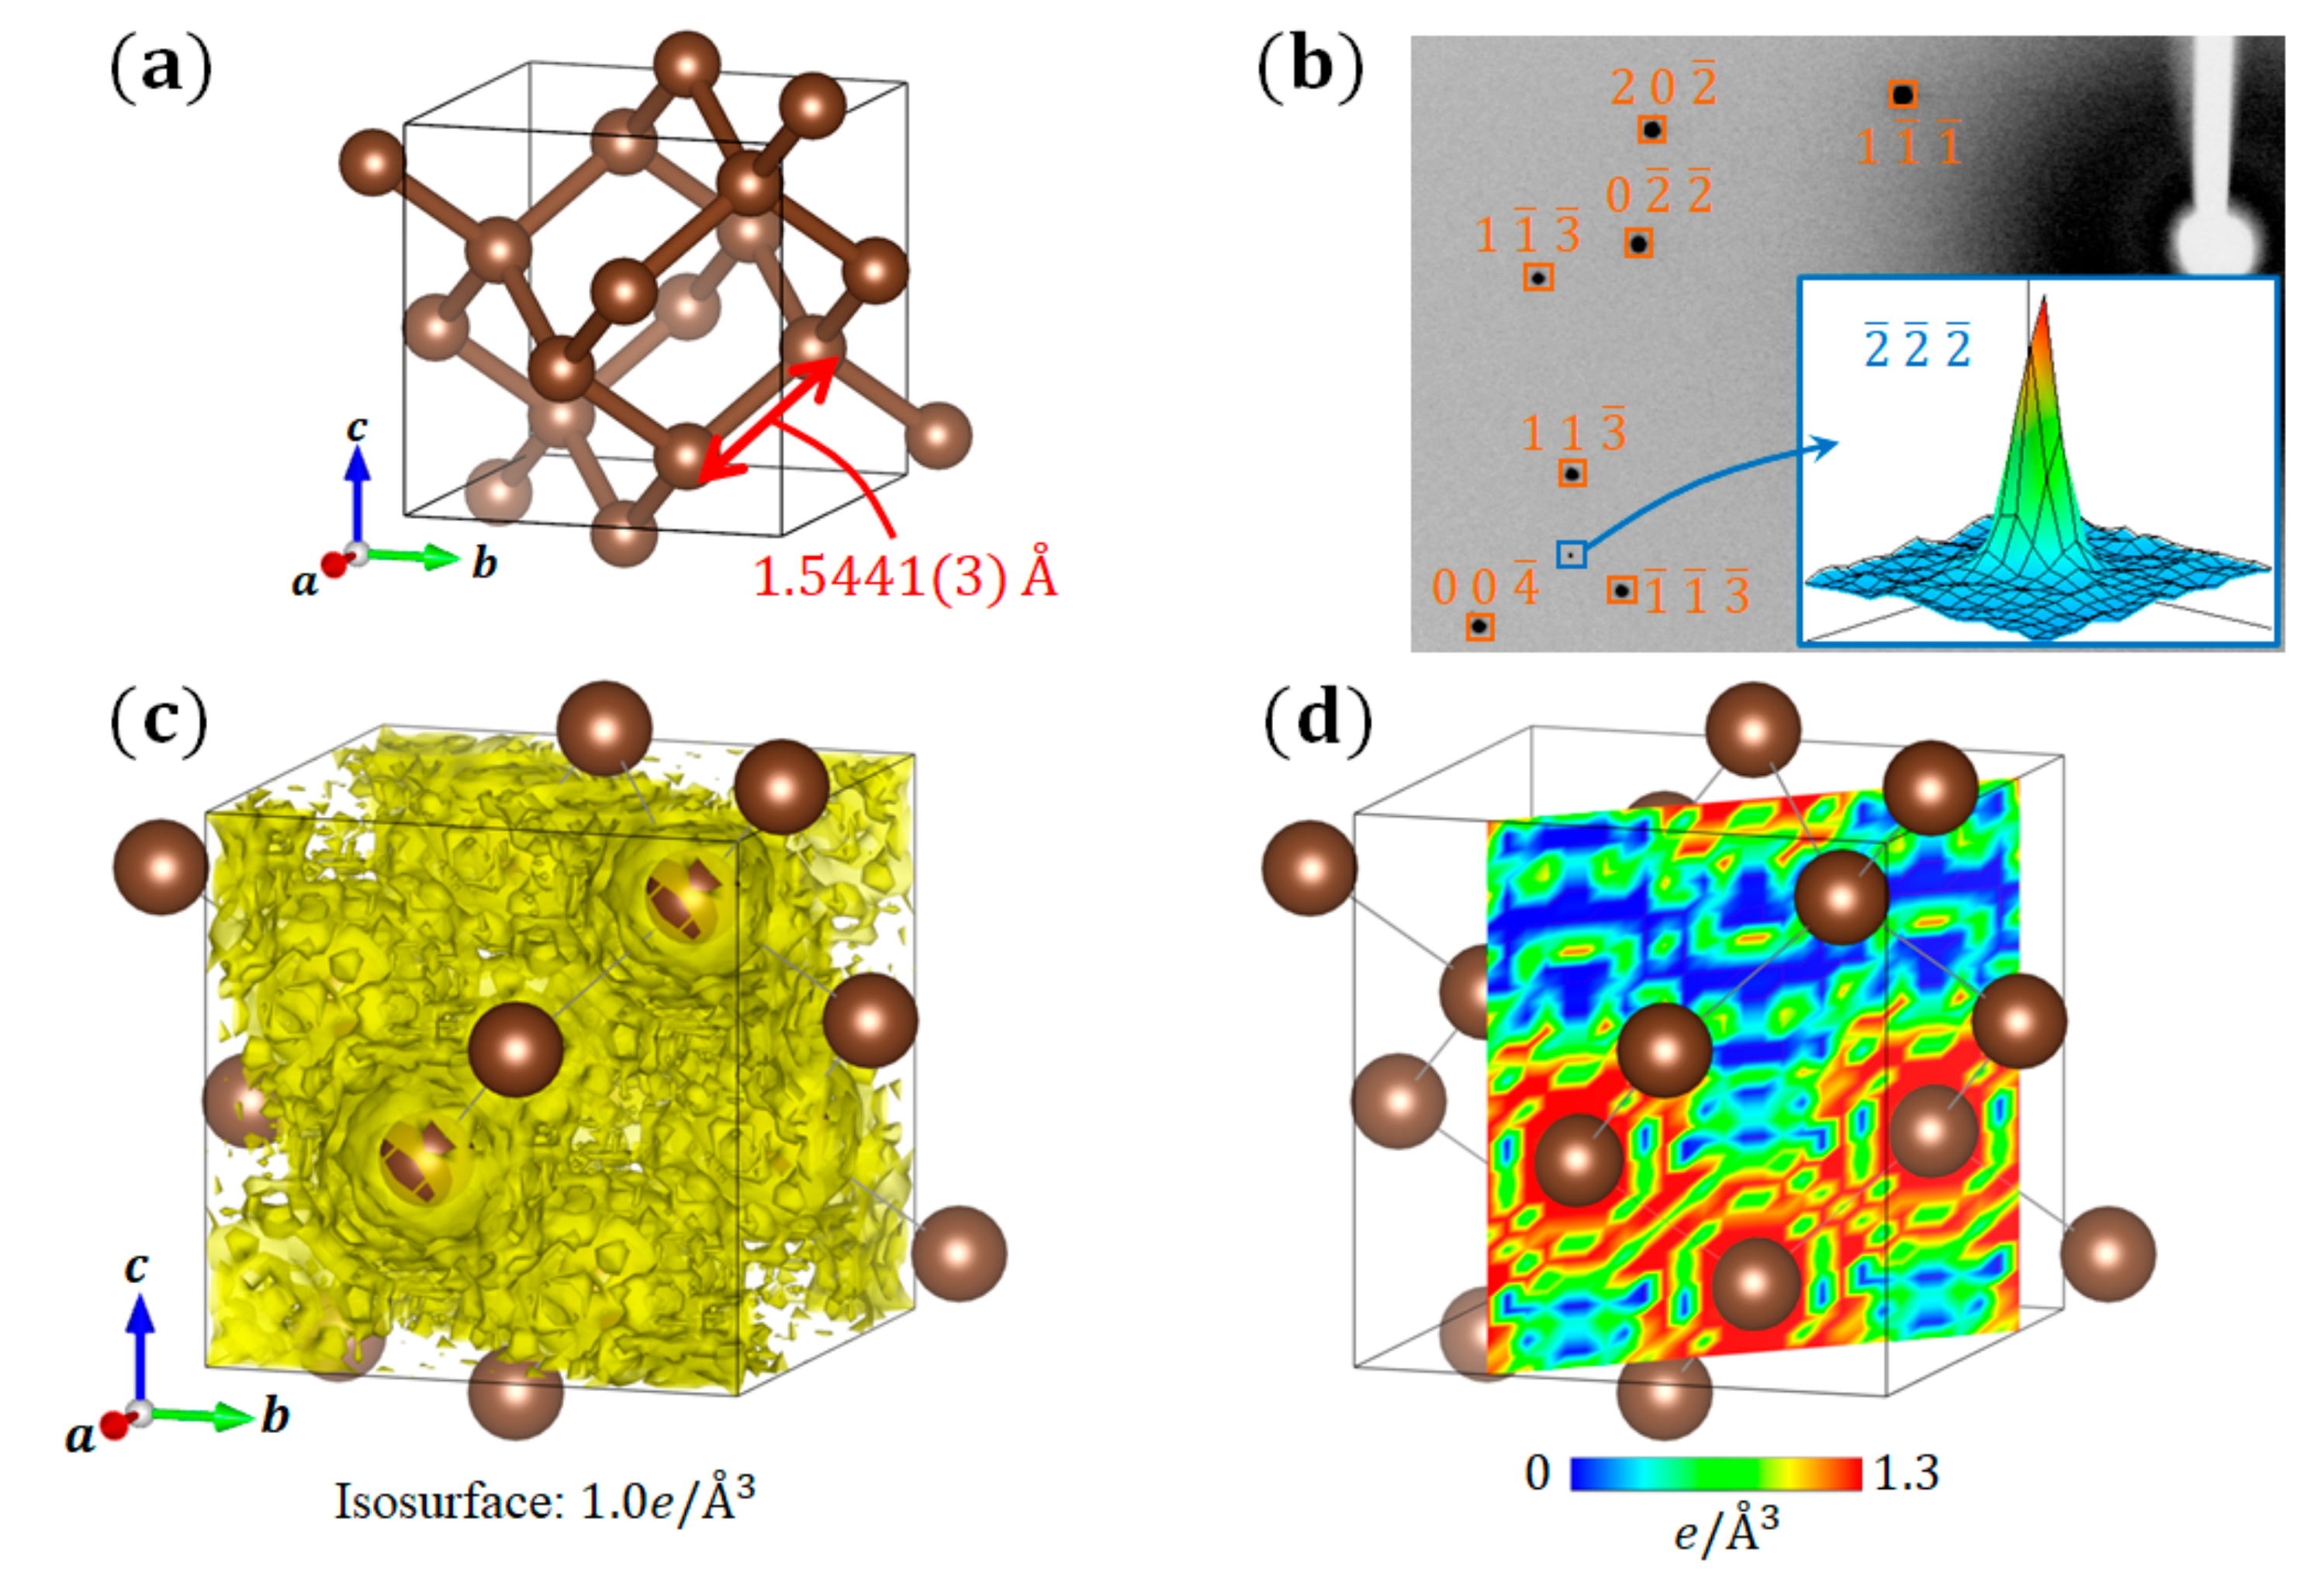
First, we describe the VED of diamond, which is a typical compound that forms sp3 hybridized orbitals. Diamond forms a crystal structure in which C atoms are arranged in three dimensional space (space group: ) (Figure 2a). Each C atom has six electrons, where the inner 1s orbital is occupied by two electrons, and the outer 2s and 2p orbitals are occupied by two electrons. In general, the valence electrons occupying the outer shell orbitals contribute to the physical properties. In the case of diamond, the four valence electrons of each C atom occupy the sp3 hybridized orbitals, forming a very strong bond state called a covalent bond.
Because the d-glide ( reflections disappear) exists in the space group , the diffraction intensity of a reflection is originally zero. However, the (and its equivalent reflections) intensity appears in the data obtained by the synchrotron XRD experiment at 30 K (Figure 2b). This finding corresponds to the fact that the extinction rule of d-glide is violated by the bonding electrons existing between C atoms. Using the high-resolution diffraction data obtained by the short-wavelength X-rays of synchrotron radiation, an ED analysis based on the usual inverse Fourier transform equation (Equation (5)) is performed, where reflections that satisfy the d-glide extinction rule are also included. Because the obtained total ED distribution of diamond is greatly disturbed (Figure 2c,d), the VED distribution corresponding to the covalent bonds cannot be confirmed. This is the mathematical truncation effect of the Fourier synthesis mentioned above.
Figure 3 shows the VED distribution of diamond obtained by the CDFS analysis using Equation (7). A very smooth ED distribution is observed, and the VED corresponding to the C–C covalent bonds is clearly visible. The density at the center point of the C–C covalent bonds is . Compared with the VED distribution obtained by the first-principles calculation [16], this result not only qualitatively reproduces its shape, but also quantitatively reproduces its density well. As shown here, the VED distribution can be extracted with high accuracy through the CDFS analysis. In diamond, valence electrons contributed only to covalent bonds. In the following, we will introduce some systems in which the valence electrons play more roles. In particular, beginning with a small, simple molecule with a rather localized electronic system, we will progressively go into the details of more complicated molecular systems with delocalized electrons, concluding with discussion of those capable of phase transitions.
3.2. C60 Fullerene
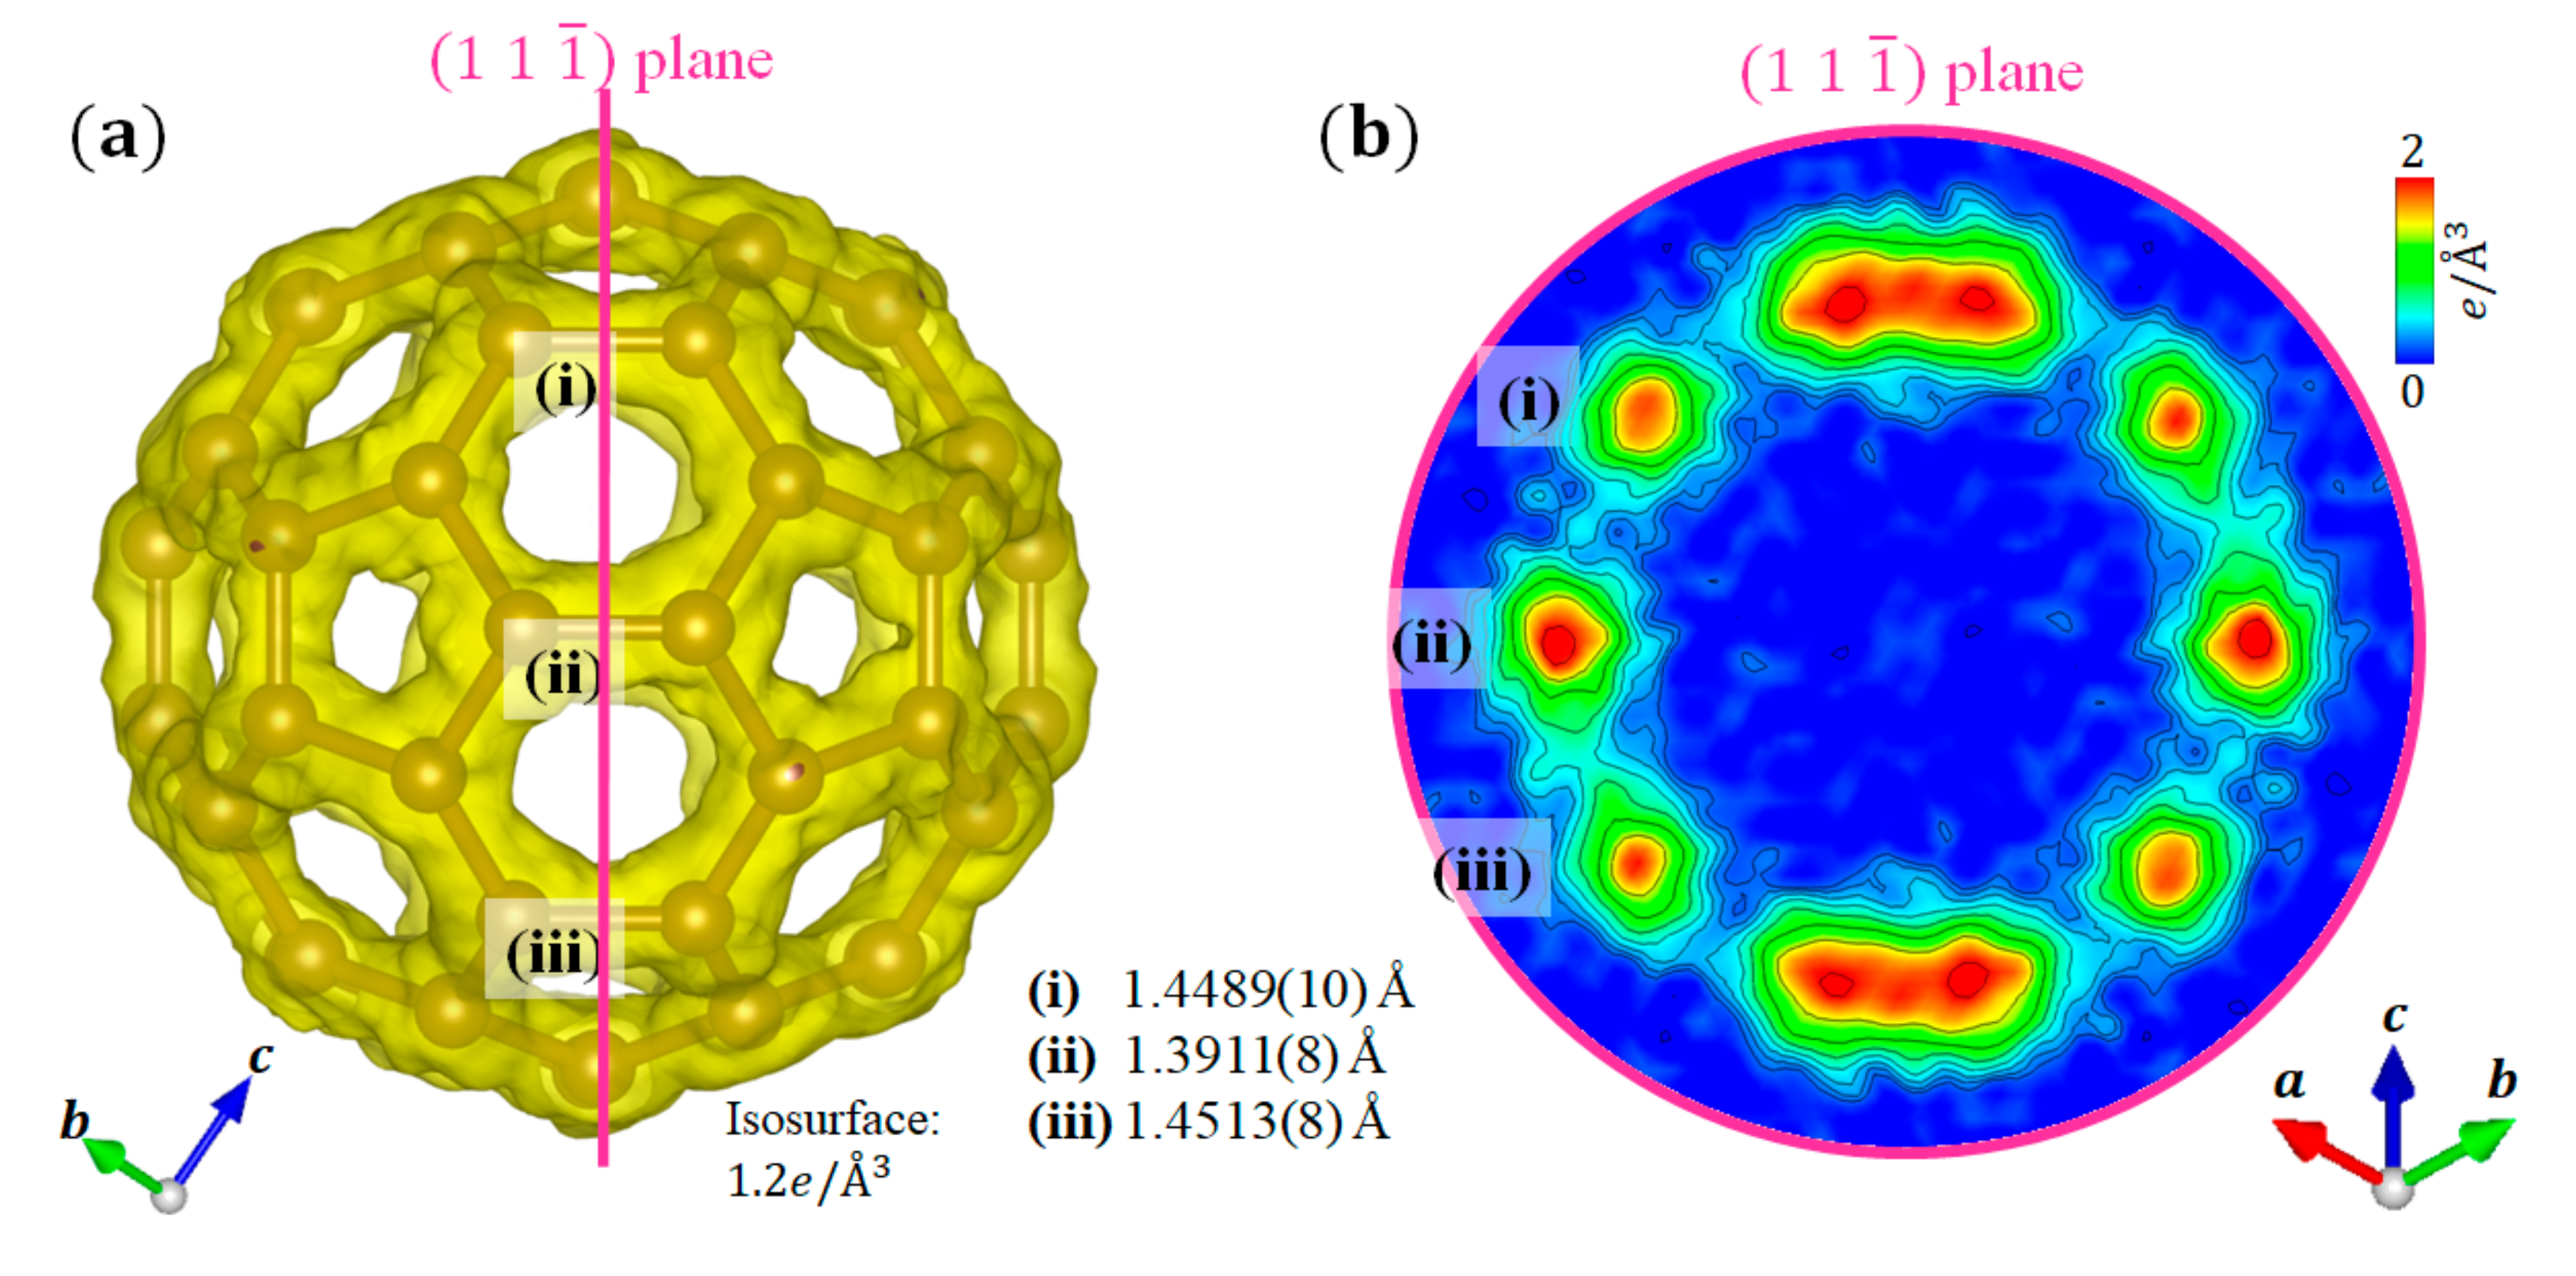
Next, we show the VED of C60 fullerene [17,18], which has two types of features of the sp2 and sp3 hybridizations. Many structural studies of C60 have been reported so far [19,20,21,22,23,24]. The C60 cluster consists of 20 hexagons and 12 pentagons. The former involves the sp2 hybridization, and the latter sp3 hybridization. There are two different types of C–C bonds; one is on the regular pentagon (single bond), and the other is shared by two hexagons (double bond). In the high-temperature phase of a C60 crystal, the C60 molecules are completely orientationally disordered and continue to randomly rotate, where the space group is . At 260 K, C60 exhibits a first-order phase transition; below that temperature, there is a discontinuous reorientation principally around the [111] direction, where the space group is . Below 90 K, the discontinuous rotational motion is frozen, although a small amount of static disorder still exists [19,23].
In this study, we focus on the low-temperature phase at 30 K without a dynamical motion of C60 molecules. The lattice parameter in is at 30 K. The detail of the structural analysis results is shown in Appendix A (Table A1). As reported in previous structural studies [22,23], there may be two types of domains in the low-temperature phase. One is the merohedral domain described in [22], in which and are superimposed, and the other is the rotational domain around the [111] direction described in [23], in which two kinds of C60 configurations exist. Our structural analysis results show that the ratio of the merohedral domain is 0.4995(8):0.5005, and the ratio of the rotational domain is 0.818(3):0.182. When observing the VED distribution, the contributions of the former domain can be separated analytically. In the latter domain, the two components appear independently, where the VED in two directions coexist in a real space. However, in this case, because the ratio of the rotational domain was quite different, the VED was observed as almost one domain.
Figure 4a shows the crystal structure and VED of a C60 molecule, and Figure 4b shows a sectional view of the plane. The (i) and (iii) bonds, , correspond to the single bonds, and the (ii) bond, , corresponds to the double bond. Certainly, the double bond forms a stronger bond than the single bond. The VED distribution is clearly observed along the shape of the C60 molecule, which is very similar to the results of previous density functional theory calculations [25]. Furthermore, the difference in the ED is confirmed between the single (shown as (i) and (iii)) and double (shown as (ii)) bonds (Figure 4b). The ED at the double bond is higher than that at the single bond, which corresponds to the strength of the C–C covalent bond. We succeeded in quantitatively evaluating the covalent bond strength in the C60 molecule from the VED.
3.3. (MV)I2
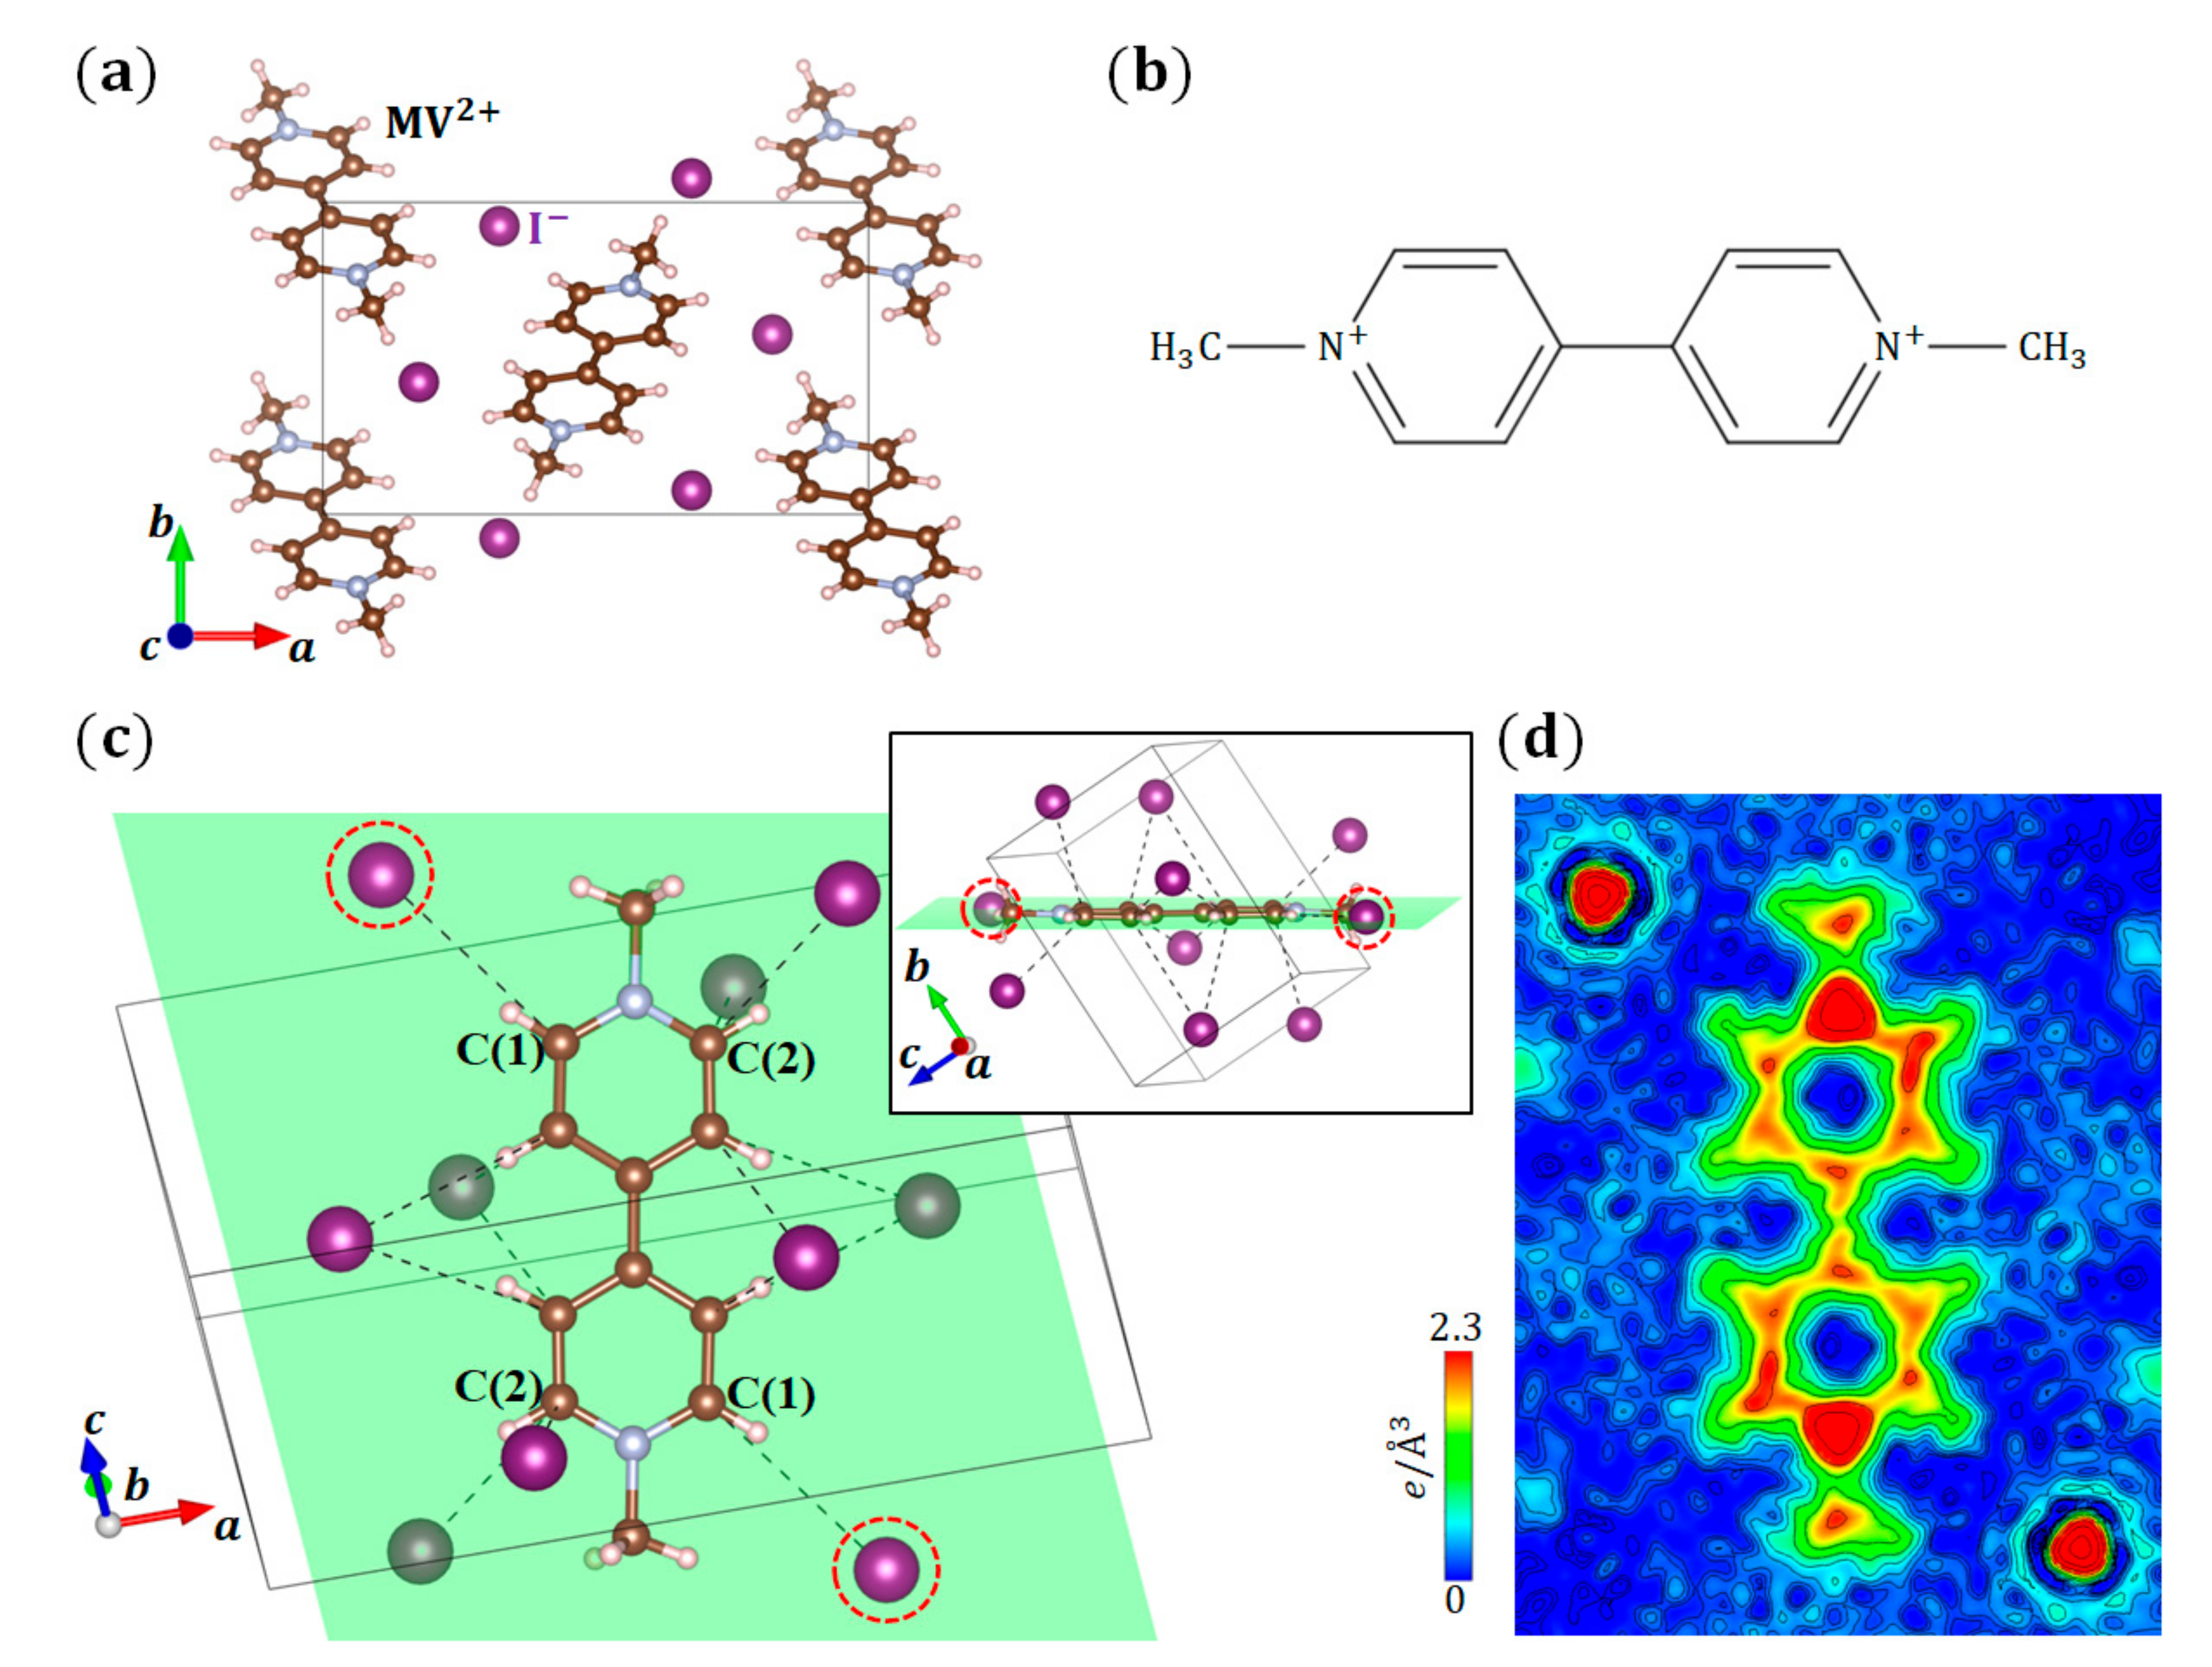
In (MV)I2 (space group: ) [26], the valence of an MV molecule is 2+ because of two ions. The crystal structure of (MV)I2 and the molecular structure of MV2+ are shown in Figure 5a,b, respectively. We performed the structural analysis and CDFS analysis of (MV)I2 at 100 K. Figure 5d shows the VED of an MV2+ molecule, in which H, C, and N atoms have 1s1, 2s22p2, and 2s22p3 valence electrons, respectively. Although C and N+ have the same number of valence electrons, the distribution states of valence electrons on the C and N atoms in the MV2+ molecule are quite different from each other. The ED around C is spatially spread, whereas that around N+ is localized on the atom. This result corresponds to the difference in electronegativities between the C and N atoms, where the N atoms are more electronegative than the C atoms. Furthermore, there is a difference in the EDs around the two C atoms bonded to N in the six-membered ring of the MV2+ molecule. The ED around the C(1) atoms close to the anions (surrounded by red dotted circles) on the MV2+ molecular plane, which is in the direction of the hydrogen bond, is lower than that of the C(2) atoms located at the opposite side. This result suggests that the anisotropic VED distribution on the MV2+ molecule is realized by the anisotropic electrostatic interactions with the surrounding the ions. A CDFS analysis directly visualized the distribution state of complicated molecular orbitals composed of different types of atoms.
3.4. (TMTTF)2X
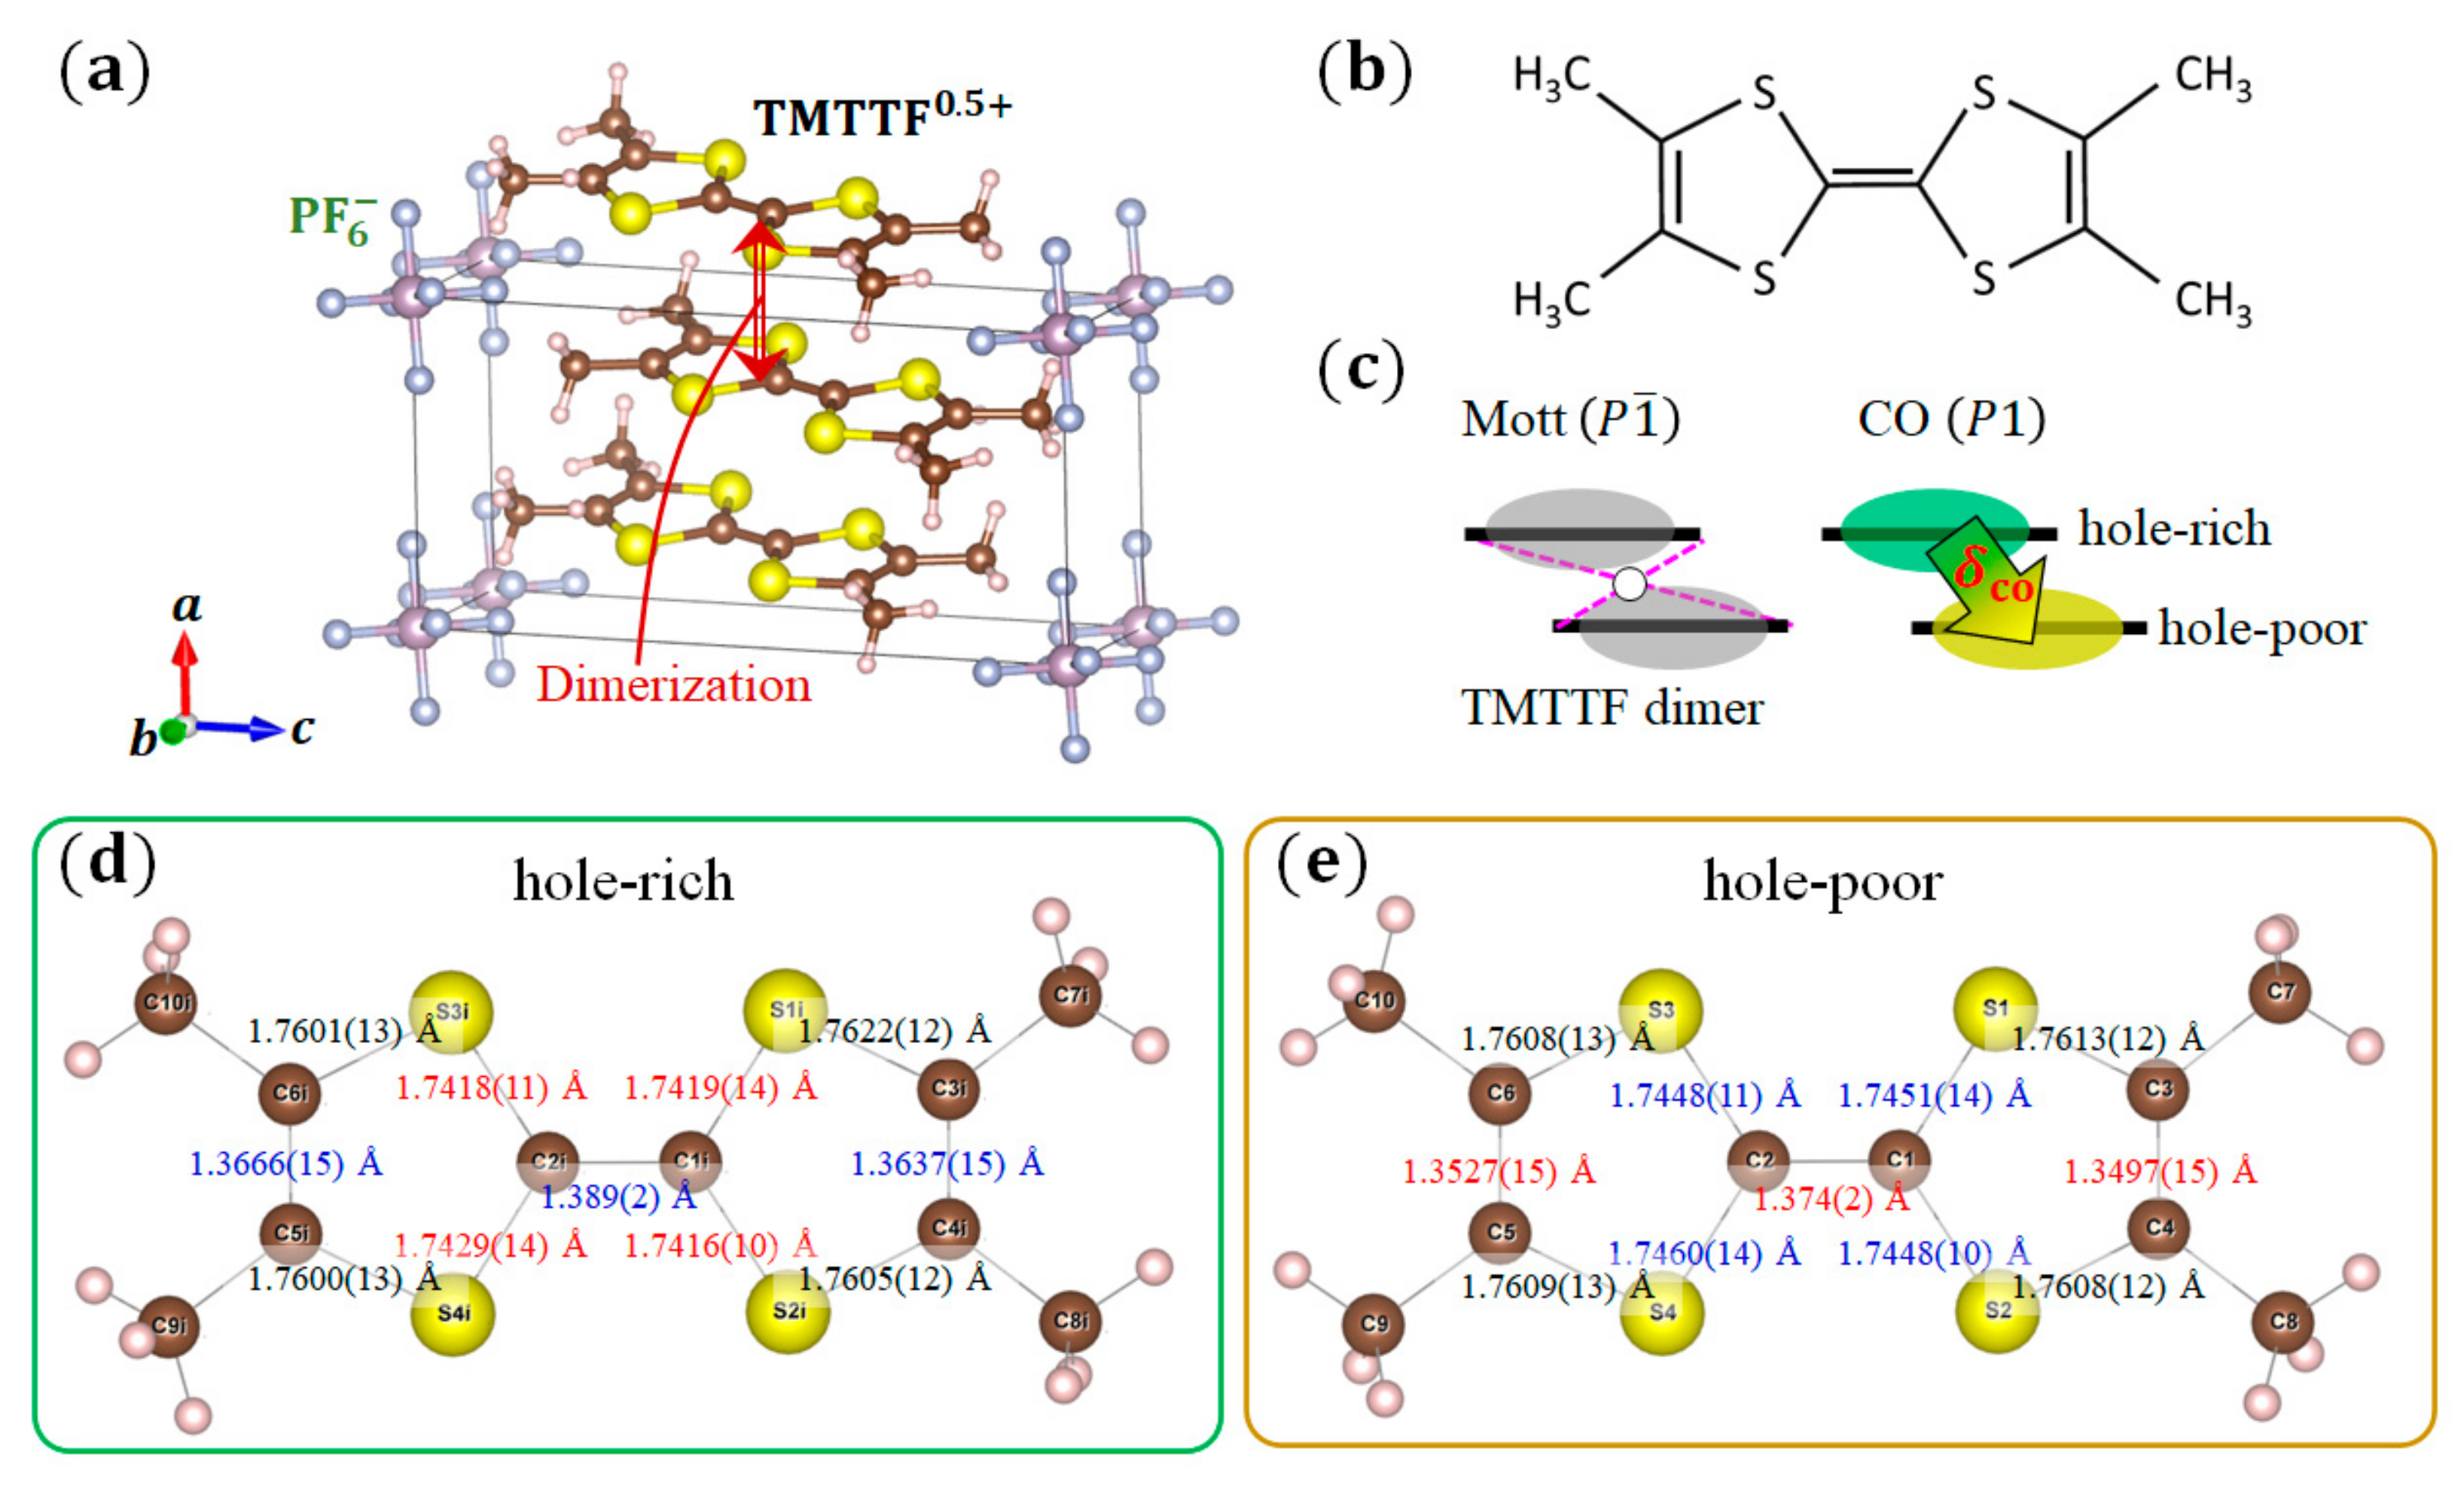
Finally, we applied the CDFS analysis to quasi-1D molecular conductors (TMTTF)2X [27], which shows various electronic properties in the pressure–temperature phase diagram [28,29,30,31]. Figure 6a,b shows the crystal structure of (TMTTF)2PF6 and the molecular structure of TMTTF, respectively. For the charge ordering phase transition of (TMTTF)2PF6 () at ambient pressure, although responses associated with the charge ordering are confirmed by the dielectric constant [32,33], NMR [34,35], ESR [36], infrared, and Raman spectroscopies [37,38], no evidence of charge ordering has been observed from the crystal structure [39,40]. Thus, this transition from the dimer Mott phase to the charge ordering phase (Figure 6c), which is associated with the lack of an inversion center, has been called a mysterious ‘structureless transition’ [41,42,43]. We investigated the crystal structure and VED distribution of the charge ordering phase in (TMTTF)2PF6 using synchrotron XRD [9].
The precise structural parameters at 30 K in the charge ordering phase are obtained by a high-angle analysis. Figure 6d,e shows the bond length in the hole-rich and hole-poor TMTTF molecules at 30 K, respectively. The C=C bonds at the center and both sides in the hole-rich molecule are longer than those in the hole-poor molecule. The central C–S bonds in the hole-rich molecule are shorter than those in the hole-poor molecule. These results correctly reflect the tendency of the charge ordering state in the TMTTF dimer. The amount of charge transfer is estimated from the bond length in the TMTTF molecule. Two types of formulas, (set 1) and (set 2), are given for empirically calculating the valence of a TMTTF molecule in [44]. Here, is the valence of the TMTTF, and is a ratio of the central () C=C bond and () C–S bonds length. The amount of charge transfer in the TMTTF dimer is calculated as . By using these formulas, (set 1) and (set 2) are obtained from our structural analysis results at 30 K. The difference of the highest occupied molecular orbital levels between the hole-poor and hole-rich TMTTF molecules, , was confirmed by the extended Hückel calculation [45]. These results show that our crystal structural analysis revealed the charge ordering state in (TMTTF)2PF6.
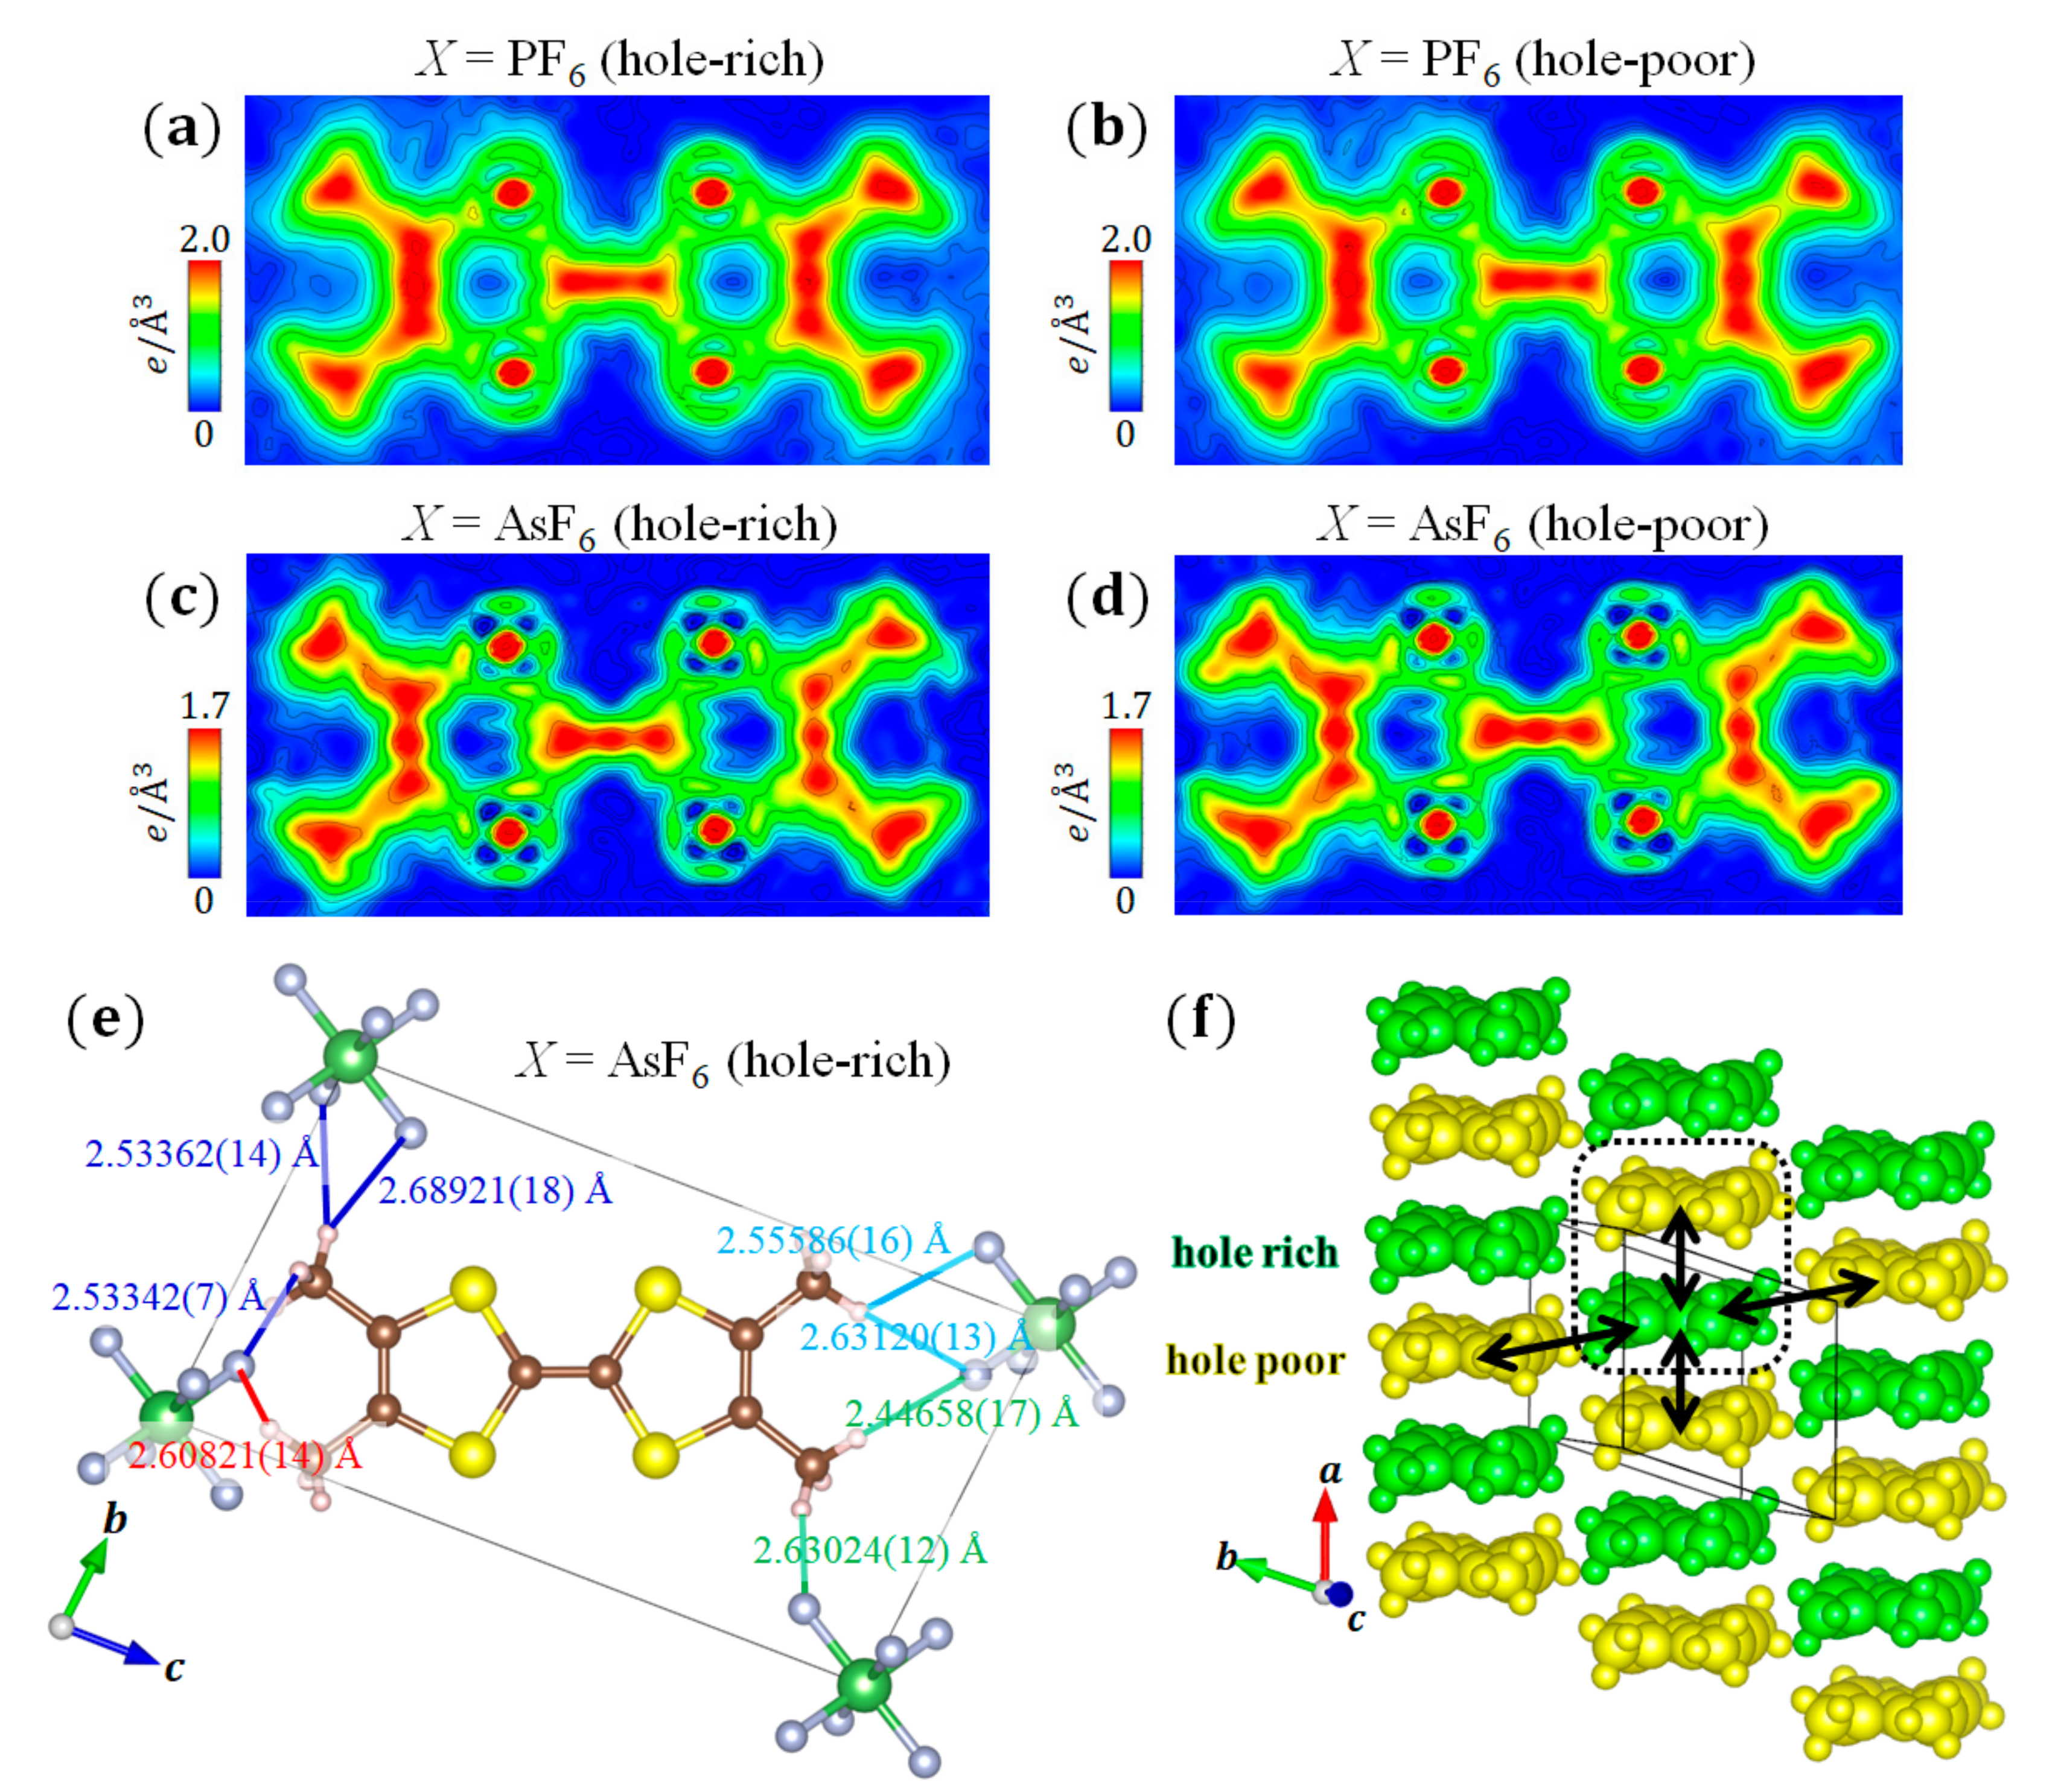
Figure 7a,b shows the VED of the hole-rich and hole-poor TMTTF molecules in the charge ordering phase of (TMTTF)2PF6 obtained from the CDFS analysis. In this case, the valence electrons of H, C, and S constituting the TMTTF molecule correspond to 1s1, 2s22p2, and 3s23p4, respectively. The ED corresponding to the bonding orbital on the C=C bonds and the node of ED corresponding to the antibonding orbital on the C–S bonds are clearly shown. Moreover, the ED reflecting the isotropic s orbitals is observed on the S and C atoms of the methyl groups. Almost no difference is observed between the appearance in the two VED distributions (Figure 7a,b), because the amount of charge transfer () is too small compared to the number of valence electrons of a TMTTF molecule (64e). Therefore, we compared the number of valence electrons between the two molecules in the dimer. By comparing the number of valence electrons in the atomic basin of the respective atoms in the TMTTF molecule calculated by Bader’s topological analysis [46], the amount of charge transfer was determined as [9], which is consistent with the estimation from the bond length () (set 1), from the Raman ( [38]), from the infrared ( [31]), and from the NMR spectroscopies ( [35]).
To investigate the intramolecular degrees of freedom, we focus on (TMTTF)2AsF6, which has the common crystal structure (TMTTF)2PF6 and undergoes a charge ordering phase transition at [47]. A larger charge transfer in the dimer than that of (TMTTF)2PF6 was confirmed in the charge ordering phase of (TMTTF)2AsF6 by the Raman ( [38]), infrared ( [31]), and NMR spectroscopies ( [48], [49]). We investigated whether the difference in the amount of charge transfer affects the VED distribution of the TMTTF molecule. As a result of the high-angle analysis of (TMTTF)2AsF6 at 30 K, (set 1), which is larger than that of X = PF6, is determined from the bond lengths in the TMTTF molecules using the formulas in [44]. This tendency is consistent with those described in previous reports of X = PF6 and AsF6 [31,35,38,48,49].
Figure 7c,d shows the VED of the hole-rich and hole-poor TMTTF molecules in the charge ordering phase of (TMTTF)2AsF6 obtained from the CDFS analysis, respectively. Almost no difference is observed in the appearance between the hole-rich and hole-poor TMTTF molecules in X = AsF6, and the VED distributions of X = AsF6 are also approximately identical to those of X = PF6. In this case, the difference in the magnitude of the absolute value of the ED between X = PF6 and AsF6 is of little significance because the CDFS analysis is based on the inverse Fourier transform of finite data (Equation (7)). However, when calculating the amount of the charge transfer in the dimer from the VED of X = AsF6, the charge transfer is obtained, which is larger than that of X = PF6. This tendency is consistent with that in our structural analysis.
The importance of H–F interactions between the methyl group in the TMTTF molecule and X anions is pointed out in this system [50]. Thus, we investigated the distance between hydrogen in the methyl group and fluorine in the anion. Figure 7e shows the H–F distances of or less in the hole-rich TMTTF molecule. In this regard, we focused on the anisotropy of the VED distribution in the TMTTF molecule in X = AsF6 (Figure 7c). The VED is concentrated around the methyl groups, but there seems to be no correlation between the distribution state and H–F distances. This tendency is the same for the hole-poor TMTTF in X = AsF6 (Figure 7d) and for the hole-rich and hole-poor TMTTF in X = PF6 (Figure 7a,b). Therefore, no clear effect of closed-shell anions was confirmed from the VED distribution of TMTTF.
From the above results, we directly revealed that the spatial charge ordering pattern formed a 2D Wigner crystal state (Figure 7f) from the molecular structure and VED distribution in the charge ordering phase in (TMTTF)2X (X = PF6 and AsF6). This pattern is also consistent with previous ESR experiment [36] and theoretical expectations [51,52,53].
4. Conclusions
We succeeded in directly observing the VED distribution of several molecular materials, i.e., diamond, C60 fullerene, (MV)I2, and (TMTTF)2X, using synchrotron XRD and the CDFS method. When a molecule is formed by bonds between atoms, various interactions work depending on the shapes and energy levels of the hybridized orbitals. As a result, even molecules with relatively simple structures produce complex molecular orbitals. Therefore, it is difficult to observe the whole picture of molecular orbitals with existing experimental methods. On the other hand, because the CDFS method using synchrotron XRD can directly observe the distribution state of valence electrons occupying the reconstructed molecular orbitals in a real space, it is possible to take an approach which differs from the existing methods for the study of molecular substances. Furthermore, the VED distribution obtained from the CDFS analysis corresponds to the square of the wave function, which provides essential information for quantum chemical and first-principles calculations. In fact, with complementary study of the CDFS analysis and first-principles calculations in transition metal oxides, we succeeded in clarifying the whole orbital state formed by the localized 3d orbitals on an atom and the metal–ligand hybridized orbitals [10]. The research methods we propose may signal a breakthrough in the study of the orbital states in materials.
Author Contributions
S.K. and H.S. designed and coordinated this study. R.K., T.N. (Toshio Naito) and T.N. (Toshikazu Nakamura) synthesized the samples. S.K., Y.H. and H.S. performed the XRD experiment; S.K. and Y.H. analyzed the XRD data. S.K. and H.S. wrote the manuscript. All authors have read and agreed to the published version of the manuscript.
Funding
This work was supported by a Grant-in-Aid for Scientific Research (No. JP19J11697) from JSPS. The synchrotron radiation experiments were performed at SPring-8 with the approval of the Japan Synchrotron Radiation Research Institute (JASRI) (Proposal No. 2011B0083, No. 2019A0070, and No. 2019B0070).
Acknowledgments
We thank Ken Niwa for providing materials used in the experiments, Takeshi Hara, Keita Kojima, Taishun Manjo, Naoyuki Katayama, and Kunihisa Sugimoto for their support in the synchrotron XRD experiments, Mariano De Souza, and Jean-Paul Pouget for fruitful discussions.
Conflicts of Interest
The authors declare no conflict of interest.
Appendix A
CCDC 2036797 contains the supplemental crystallographic data of C60 fullerene at 30 K. The data is provided free of charge by The Cambridge Crystallographic Data Centre [54].

Table A1.
Summary of the crystallographic data of C60.
| CCDC Deposit Number | 2036797 |
|---|---|
| Temperature (K) | 30 |
| Wavelength () | 0.35044 |
| Space group | |
| a () | 14.0279(6) |
| V () | 2760.4(2) |
| Z | 24 |
| F (000) | 1440 |
| (sinθ/λ)Max () | 1.11 |
| NTotal,obs | 65,092 |
| NUnique,obs | 4920 |
| Average redundancy | 11.4 |
| Completeness (%) | 100 |
| # of reflections () | 5424 |
| R () | 4.36 |
| wR () | 3.73 |
| GOF () | 1.21 |
References
- Albright, T.A.; Burdett, J.K.; Whangbo, M.H. Orbital Interactions in Chemistry; Wiley: Hoboken, NJ, USA, 2013. [Google Scholar]
- Beveridge, D.L. Approximate Molecular Orbital Theory of Nuclear and Electron Magnetic Resonance Parameters. In Semiempirical Methods of Electronic Structure Calculation. Modern Theoretical Chemistry; Segal, G.A., Ed.; Springer: Boston, MA, USA, 1977; Volume 8, pp. 163–214. [Google Scholar] [CrossRef]
- Tokura, Y.; Nagaosa, N. Orbital Physics in Transition-Metal Oxides. Science 2000, 288, 462–468. [Google Scholar] [CrossRef] [PubMed] [Green Version]
- Itatani, J.; Levesque, J.; Zeidler, D.L.; Niikura, H.; Pépin, H.; Kieffer, J.C.; Corkum, P.B.; Villeneuve, D.M. Tomographic imaging of molecular orbitals. Nature 2004, 432, 867–871. [Google Scholar] [CrossRef] [PubMed]
- Puschnig, P.; Berkebile, S.; Fleming, A.J.; Koller, G.; Emtsev, K.; Seyller, T.; Riley, J.D.; Ambrosch-Draxl, C.; Netzer, F.P.; Ramsey, M.G. Reconstruction of Molecular Orbital Densities from Photoemission Data. Science 2009, 326, 702–706. [Google Scholar] [CrossRef] [PubMed] [Green Version]
- Ito, Y.; Akimitsu, J. Observation of Orbital Ordering in K2CuF4. J. Phys. Soc. Jpn. 1976, 40, 1333–1338. [Google Scholar] [CrossRef]
- Murakami, Y.; Hill, J.P.; Gibbs, D.; Blume, M.; Koyama, I.; Tanaka, M.; Kawata, H.; Arima, T.H.; Tokura, Y.; Hirota, K.; et al. Resonant X-ray Scattering from Orbital Ordering in LaMnO3. Phys. Rev. Lett. 1998, 81, 582–585. [Google Scholar] [CrossRef]
- Hansen, N.K.; Coppens, P. Testing aspherical atom refinements on small-molecule data sets. Acta Crystallogr. Sect. A Cryst. Phys. Diffraction Theor. Gen. Crystallogr. 1978, 34, 909–921. [Google Scholar] [CrossRef]
- Kitou, S.; Fujii, T.; Kawamoto, T.; Katayama, N.; Maki, S.; Nishibori, E.; Sugimoto, K.; Takata, M.; Nakamura, T.; Sawa, H. Successive Dimensional Transition in (TMTTF)2PF6 Revealed by Synchrotron X-ray Diffraction. Phys. Rev. Lett. 2017, 119, 065701. [Google Scholar] [CrossRef] [PubMed]
- Kitou, S.; Manjo, T.; Katayama, N.; Shishidou, T.; Arima, T.H.; Taguchi, Y.; Tokura, Y.; Nakamura, T.; Yokoyama, T.; Sugimoto, K.; et al. Collapse of the simple localized 3d1 orbital picture in Mott insulator. Phys. Rev. Res. 2020, 2, 033503. [Google Scholar] [CrossRef]
- Sugimoto, K.; Ohsumi, H.; Aoyagi, S.; Nishibori, E.; Moriyoshi, C.; Kuroiwa, Y.; Sawa, H.; Takata, M. Extremely High Resolution Single Crystal Diffractometry for Orbital Resolution using High Energy Synchrotron Radiation at SPring-8. AIP Conf. Proc. 2010, 1234, 887. [Google Scholar] [CrossRef]
- Blessing, R.H. Data Reduction and Error Analysis for Accurate Signal Crystal Diffraction Intensities. Crystallogr. Rev. 1987, 1, 3–58. [Google Scholar] [CrossRef]
- Petříček, V.; Dušek, M.; Palatinus, L. Crystallographic Computing System JANA2006: General features. Z. Krist. Cryst. Mater. 2014, 229, 345. [Google Scholar] [CrossRef]
- Momma, K.; Izumi, F. VESTA 3 for three-dimensional visualization of crystal, volumetric and morphology data. J. Appl. Crystallogr. 2011, 44, 1272–1276. [Google Scholar] [CrossRef]
- Su, Z.; Coppens, P. Relativistic X-ray Elastic Scattering Factors for Neutral Atoms Z= 1–54 from Multiconfiguration Dirac–Fock Wavefunctions in the 0–12Å−1 sinθ/λ Range, and Six-Gaussian Analytical Expressions in the 0–6Å−1 Range. Acta Crystallogr. Sect. A Found. Crystallogr. 1997, 53, 749–762. [Google Scholar] [CrossRef] [Green Version]
- Pavone, P.; Karch, K.; Schütt, O.; Strauch, D.; Windl, W.; Giannozzi, P.; Baroni, S. Ab initiolattice dynamics of diamond. Phys. Rev. B 1993, 48, 3156–3163. [Google Scholar] [CrossRef]
- Kroto, H.W.; Heath, J.R.; O Brien, S.C.; Curl, R.F.; Smalley, R.E. C60: Buckminsterfullerene. Nature 1985, 318, 162–163. [Google Scholar] [CrossRef]
- Krätschmer, W.; Lamb, L.D.; Fostiropoulos, K.; Huffman, D.R. Solid C60: A new form of carbon. Nature 1990, 347, 354–358. [Google Scholar] [CrossRef]
- David, W.I.F.; Ibberson, R.M.; Matthewman, J.C.; Prassides, K.; Dennis, T.J.S.; Hare, J.P.; Kroto, H.W.; Taylor, R.; Walton, D.R.M. Crystal structure and bonding of ordered C60. Nature 1991, 353, 147–149. [Google Scholar] [CrossRef]
- Fischer, J.E.; Heiney, P.A.; McGhie, A.R.; Romanow, W.J.; Denenstein, A.M.; McCauley, J.P.; Smith, A.B. Compressibility of Solid C60. Science 1991, 252, 1288–1290. [Google Scholar] [CrossRef] [PubMed]
- Heiney, P.A.; Fischer, J.E.; McGhie, A.R.; Romanow, W.J.; Denenstein, A.M.; McCauley, J.P., Jr.; Smith, A.B.; Cox, D.E. Orientational ordering transition in solid C60. Phys. Rev. Lett. 1991, 66, 2911–2914. [Google Scholar] [CrossRef]
- Liu, S.; Lu, Y.J.; Kappes, M.M.; Ibers, J.A. The Structure of the C60 Molecule: X-ray Crystal Structure Determination of a Twin at 110 K. Science 1991, 254, 408–410. [Google Scholar] [CrossRef]
- David, W.I.F.; Ibberson, R.M.; Dennis, T.J.S.; Hare, J.P.; Prassides, K. Structural Phase Transitions in the Fullerene C60. Europhysics Lett. 1992, 18, 219–225. [Google Scholar] [CrossRef]
- Bürgi, H.B.; Blanc, E.; Schwarzenbach, D.; Liu, S.; Lu, Y.J.; Kappes, M.M.; Ibers, J.A. The Structure of C60: Orientational Disorder in the Low-Temperature Modification of C60. Angew. Chem. Int. Ed. 1992, 31, 640–643. [Google Scholar] [CrossRef]
- Saito, S.; Oshiyama, A. Cohesive mechanism and energy bands of solid C60. Phys. Rev. Lett. 1991, 66, 2637–2640. [Google Scholar] [CrossRef] [PubMed]
- Russell, J.H.; Wallwork, S.C. The crystal structures of the dichloride and isomorphous dibromide and diiodide of the N,N’-dimethyl-4,4′-bipyridylium ion. Acta Crystallogr. Sect. B Struct. Crystallogr. Cryst. Chem. 1972, 28, 1527–1533. [Google Scholar] [CrossRef]
- Galigné, J.L.; Liautard, B.; Peytavin, S.; Brun, G.; Fabre, J.M.; Torreilles, E.; Giral, L. Etude structurale du bromure de tétraméthyltétrathiafulvalène, (TMTTF)2Br. Acta Crystallogr. Sect. B Struct. Crystallogr. Cryst. Chem. 1978, 34, 620–624. [Google Scholar] [CrossRef]
- Jérome, D.; Schulz, H.J. Organic conductors and superconductors. Adv. Phys. 1982, 31, 299–490. [Google Scholar] [CrossRef]
- Jérome, D. The Physics of Organic Superconductors. Science 1991, 252, 1509–1514. [Google Scholar] [CrossRef] [PubMed]
- Pouget, J.P.; Ravy, S. Structural Aspects of the Bechgaard Salts and Related Compounds. J. Phys. I 1996, 6, 1501–1525. [Google Scholar] [CrossRef]
- Dressel, M.; Dumm, M.; Knoblauch, T.; Masino, M. Comprehensive Optical Investigations of Charge Order in Organic Chain Compounds (TMTTF)2X. Crystals 2012, 2, 528–578. [Google Scholar] [CrossRef] [Green Version]
- Nad, F.; Monceau, P.; Carcel, C.; Fabre, J.M. Dielectric response of the charge-induced correlated state in the quasi-one-dimensional conductor (TMTTF)2PF6. Phys. Rev. B 2000, 62, 1753–1756. [Google Scholar] [CrossRef] [Green Version]
- Monceau, P.; Nad, F.Y.; Brazovskii, S. Ferroelectric Mott-Hubbard Phase of Organic (TMTTF)2X Conductors. Phys. Rev. Lett. 2001, 86, 4080. [Google Scholar] [CrossRef] [PubMed] [Green Version]
- Chow, D.S.; Zamborszky, F.; Alavi, B.; Tantillo, D.J.; Baur, A.; Merlic, C.A.; Brown, S.E. Charge Ordering in the TMTTF Family of Molecular Conductors. Phys. Rev. Lett. 2000, 85, 1698–1701. [Google Scholar] [CrossRef] [Green Version]
- Nakamura, M.; Furukawa, K.; Hara, T. Redistribution of Charge in the Proximity of the Spin-Peierls Transition: 13C NMR Investigation of (TMTTF)2PF6. J. Phys. Soc. Jpn. 2007, 76, 64715. [Google Scholar] [CrossRef]
- Nakamura, M. Possible Charge Ordering Patterns of the Paramagnetic Insulating States in (TMTTF)2X. J. Phys. Soc. Jpn. 2003, 72, 213–216. [Google Scholar] [CrossRef]
- Jacobsen, C.S.; Tanner, D.B.; Bechgaard, K. Optical and infrared properties of tetramethyltetraselenafulvalene [(TMTSF)2X] and tetramethyltetrathiafulvalene [(TMTTF)2X] compounds. Phys. Rev. B 1983, 28, 7019–7032. [Google Scholar] [CrossRef] [Green Version]
- Świetlik, R.; Barszcz, B.; Pustogow, A.; Dressel, M. Raman spectroscopy evidence of domain walls in the organic electronic ferroelectrics (TMTTF)2X (X=SbF6, AsF6, PF6). Phys. Rev. B 2017, 95, 085205. [Google Scholar] [CrossRef]
- Pouget, J.P.; Moret, R.; Comes, R.; Bechgaard, K.; Fabre, J.M.; Giral, L. X-ray Diffuse Scattering Study of Some (TMTSF)2X and (TMTTF)2X Salts. Mol. Cryst. Liq. Cryst. 1982, 79, 485–499. [Google Scholar] [CrossRef]
- Foury-Leylekian, P.; Le Bolloc’h, D.; Hennion, B.; Ravy, S.; Moradpour, A.; Pouget, J.P. Neutron-scattering evidence for a spin-Peierls ground state in (TMTTF)2PF6. Phys. Rev. B 2004, 70, 180–405. [Google Scholar] [CrossRef] [Green Version]
- Coulon, C.; Parkin, S.S.P.; Laversanne, R. Structureless transition and strong localization effects in bis-tetramethyltetrathiafulvalenium salts [(TMTTF)2X]. Phys. Rev. B 1985, 31, 3583–3587. [Google Scholar] [CrossRef]
- De Souza, M.; Foury-Leylekian, P.; Moradpour, A.; Pouget, J.P.; Lang, M. Evidence for Lattice Effects at the Charge-Ordering Transition in (TMTTF)2X. Phys. Rev. Lett. 2008, 101, 216–403. [Google Scholar] [CrossRef] [Green Version]
- Foury-Leylekian, P.; Petit, S.; Andre, G.; Moradpour, A.; Pouget, J.P. Neutron scattering evidence for a lattice displacement at the charge ordering transition of (TMTTF)2PF6. Phys. B Condens. Matter 2010, 405B, S95–S97. [Google Scholar] [CrossRef]
- Umland, T.C.; Allie, S.; Kuhlmann, T.; Coppens, P. Relation between geometry and charge transfer in low-dimensional organic salts. J. Phys. Chem. 1988, 92, 6456–6460. [Google Scholar] [CrossRef]
- Mori, T.; Kobayashi, A.; Sasaki, Y.; Kobayashi, H.; Saito, G.; Inokuchi, H. The Intermolecular Interaction of Tetrathiafulvalene and Bis(ethylenedithio)tetrathiafulvalene in Organic Metals. Calculation of Orbital Overlaps and Models of Energy-band Structures. Bull. Chem. Soc. Jpn. 1984, 57, 627–633. [Google Scholar] [CrossRef]
- A Computer Program Package for Multipole Refinement, Topological Analysis of Charge Densities and Evaluation of Intermolecular Energies from Experimental and Theoretical Structure Factors. Available online: https://www.chem.gla.ac.uk/~louis/xd-home/ (accessed on 3 November 2020).
- Nad, F.; Monceau, P.; Carcel, C.; Fabre, J.M. Charge ordering phase transition in the quasi-one-dimensional conductor (TMTTF)2AsF6. J. Phys. Condens. Matter 2000, 12, L435–L440. [Google Scholar] [CrossRef]
- Zámborszky, F.; Yu, W.; Raas, W.; Brown, S.E.; Alavi, B.; Merlic, C.A.; Baur, A. Competition and coexistence of bond and charge orders in (TMTTF)2AsF6. Phys. Rev. B 2002, 66, 081103. [Google Scholar] [CrossRef] [Green Version]
- Fujiyama, S.; Nakamura, M. Redistribution of Electronic Charges in Spin-Peierls State in (TMTTF)2AsF6 Observed by 13C NMR. J. Phys. Soc. Jpn. 2006, 75, 14705. [Google Scholar] [CrossRef] [Green Version]
- Pouget, J.P. Structural Aspects of the Bechgaard and Fabre Salts: An Update. Crystals 2012, 2, 466–520. [Google Scholar] [CrossRef]
- Seo, H.; Fukuyama, H. Antiferromagnetic Phases of One-Dimensional Quarter-Filled Organic Conductors. J. Phys. Soc. Jpn. 1997, 66, 1249–1252. [Google Scholar] [CrossRef] [Green Version]
- Mazumdar, S.; Clay, R.T.; Campbell, D.K. Bond-order and charge-density waves in the isotropic interacting two-dimensional quarter-filled band and the insulating state proximate to organic superconductivity. Phys. Rev. B 2000, 62, 13400–13425. [Google Scholar] [CrossRef] [Green Version]
- Shibata, Y.; Nishimoto, S.; Ohta, Y. Charge ordering in the one-dimensional extended Hubbard model: Implication to the TMTTF family of organic conductors. Phys. Rev. B 2001, 64, 235107. [Google Scholar] [CrossRef] [Green Version]
- The Cambridge Crystallographic Data Centre. Available online: https://www.ccdc.cam.ac.uk/structures/ (accessed on 3 November 2020).
Figure 1.
Atomic scattering factor of carbon [15]. Black, blue, and orange lines indicate the contribution of the total, core, and valence electrons, respectively.
Figure 1.
Atomic scattering factor of carbon [15]. Black, blue, and orange lines indicate the contribution of the total, core, and valence electrons, respectively.

Figure 2.
(a) Crystal structure of diamond; (b) Synchrotron X-ray diffraction (XRD) data of a diamond crystal at 30 K. (c,d) Total electron density (ED) distribution of diamond calculated by the general inverse Fourier transform of diffraction intensity using Equation (5); (c) Surface plot; (d) Sectional view of the (4 4 0) plane.

Figure 3.
Valence electron density (VED) distribution of diamond calculated by the CDFS method using Equation (7): (a) Surface plot, and (b) Sectional view of the (4 4 0) plane.
Figure 3.
Valence electron density (VED) distribution of diamond calculated by the CDFS method using Equation (7): (a) Surface plot, and (b) Sectional view of the (4 4 0) plane.

Figure 4.
VED distribution of C60 fullerene: (a) Surface plot; (b) Sectional view of the plane. The (i) and (iii) bonds correspond to the single bonds, which are on the regular pentagons. The (ii) bond corresponds to the double bond, which is shared by two hexagons.
Figure 4.
VED distribution of C60 fullerene: (a) Surface plot; (b) Sectional view of the plane. The (i) and (iii) bonds correspond to the single bonds, which are on the regular pentagons. The (ii) bond corresponds to the double bond, which is shared by two hexagons.

Figure 5.
(a) Crystal structure of (MV)I2; (b) Molecular structure of MV2+; (c) Relationship between a MV2+ molecule and surrounding
ions. There is an inversion center at the central C–C bond in the MV2+ molecule. The least square (LS) plane, on which the central six C atoms are located, is shown in green. The
ions surrounded by the red dotted circles exist near the green plane. (d) VED distribution of the MV2+ molecule. This density plane corresponds to the green plane in (c). The orientations of the MV2+ molecules are the same between (c,d).

Figure 6.
(a) Crystal structure of (TMTTF)2PF6; (b) Molecular structure of a TMTTF; (c) Schematic configuration of the dimer Mott and charge ordering (CO) phases; (d,e) Bond length in the (d) hole-rich and (e) hole-poor TMTTF molecules at 30 K in the charge ordering phase of (TMTTF)2PF6. The red (blue) values indicate that the bonds are shorter (longer) than the others at the same positions. The black values indicate that bonds at the same position are consistent within the error range.

Figure 7.
(a–d) VED distribution of hole-rich and hole-poor TMTTF molecules of (TMTTF)2PF6 and (TMTTF)2AsF6 on LS planes, respectively. The LS planes are defined by the central two C and four S atoms of the TMTTF molecules. (e) H–F distances of or less in the hole-rich TMTTF molecule of (TMTTF)2AsF6. The orientations of the TMTTF molecules are the same between (c,e). (f) Charge ordering patterns of hole-rich and hole-poor TMTTF molecules in (TMTTF)2X (X = PF6 and AsF6), which indicate a 2D Wigner crystal state. The region surrounded by the dotted square shows a TMTTF molecule dimer.

Publisher’s Note: MDPI stays neutral with regard to jurisdictional claims in published maps and institutional affiliations. |
© 2020 by the authors. Licensee MDPI, Basel, Switzerland. This article is an open access article distributed under the terms and conditions of the Creative Commons Attribution (CC BY) license (http://creativecommons.org/licenses/by/4.0/).
Share and Cite
MDPI and ACS Style
Kitou, S.; Hosogi, Y.; Kitaura, R.; Naito, T.; Nakamura, T.; Sawa, H. Direct Observation of Molecular Orbitals Using Synchrotron X-ray Diffraction. Crystals 2020, 10, 998. https://0-doi-org.brum.beds.ac.uk/10.3390/cryst10110998
AMA Style
Kitou S, Hosogi Y, Kitaura R, Naito T, Nakamura T, Sawa H. Direct Observation of Molecular Orbitals Using Synchrotron X-ray Diffraction. Crystals. 2020; 10(11):998. https://0-doi-org.brum.beds.ac.uk/10.3390/cryst10110998
Chicago/Turabian StyleKitou, Shunsuke, Yuto Hosogi, Ryo Kitaura, Toshio Naito, Toshikazu Nakamura, and Hiroshi Sawa. 2020. "Direct Observation of Molecular Orbitals Using Synchrotron X-ray Diffraction" Crystals 10, no. 11: 998. https://0-doi-org.brum.beds.ac.uk/10.3390/cryst10110998
Note that from the first issue of 2016, this journal uses article numbers instead of page numbers. See further details here.