Article

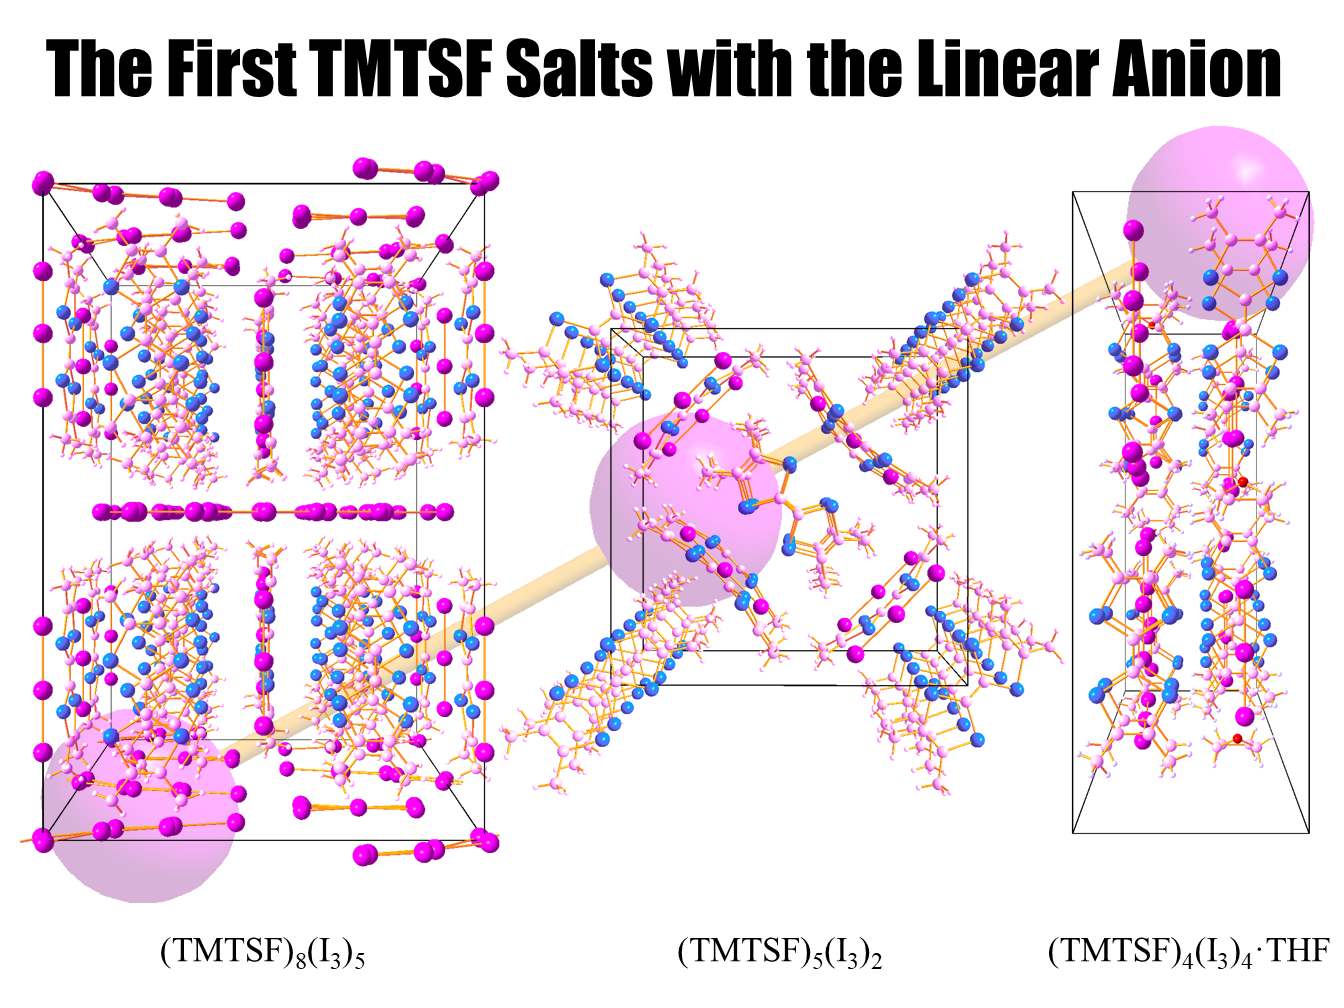
Crystal Structures and Electrical Resistivity of Three Exotic TMTSF Salts with I 3 : Determination of Valence by DFT and MP2 Calculations

1
Graduate School of Science, Osaka City University, Osaka 558-8585, Japan
2
Center for Advanced High Magnetic Field Science, Graduate School of Science, Osaka University, Toyonaka, Osaka 560-0043, Japan
3
Graduate School of Engineering, Osaka City University, Sumiyoshi-ku, Osaka 558-8585, Japan
*
Author to whom correspondence should be addressed.
Submission received: 2 November 2020 / Revised: 30 November 2020 / Accepted: 5 December 2020 / Published: 8 December 2020
(This article belongs to the Special Issue Organic Conductors)

Abstract

:
Three novel organic conductors (TMTSF) 8 (I 3 ) 5 , (TMTSF) 5 (I 3 ) 2 , and (TMTSF) 4 (I 3 ) 4 ·THF (THF = tetrahydrofuran) were synthesized and their crystal structures were characterized by X-ray diffraction analyses, where TMTSF denotes tetramethyltetraselenafulvalene. The crystals of both the (TMTSF) 8 (I 3 ) 5 and (TMTSF) 5 (I 3 ) 2 are composed of one-dimensional stacks of TMTSF trimers separated by TMTSF monomers. The crystal of the (TMTSF) 4 (I 3 ) 4 ·THF is composed of the TMTSF tetramers and I 3 tetramers; and regarded as the elongated rock-salt structure. The electrical conductivity of the (TMTSF) 8 (I 3 ) 5 and (TMTSF) 5 (I 3 ) 2 is about 60 and 50 S·cm 1 at room temperature, respectively. The electrical resistivity of (TMTSF) 8 (I 3 ) 5 is weakly metallic below room temperature and rapidly increases below 88 and 53 K on cooling suggesting two possible phase transitions. The electrical resistivity of (TMTSF) 5 (I 3 ) 2 is semiconducting below room temperature but shows an anomaly around 190 K, below which the activation energy becomes small. The application of hydrostatic pressure up to 1.7 GPa do not change these behaviors of (TMTSF) 8 (I 3 ) 5 and (TMTSF) 5 (I 3 ) 2 very much. A method to evaluate the non-integer valence of crystallographically independent TMTSF molecules is developed by using the DFT (density-functional-theory) and MP2 (Hartree–Fock calculations followed by Møller–Plesset correlation energy calculations truncated at second order) calculations. It is shown that the method gives the valence of the TMTSF molecules of the I 3 salts consistent with their electrical properties.

Graphical Abstract

1. Introduction

The organic donor TMTSF (= tetramethyltetraselenafulvalene.) is known to give the first organic superconductor (TMTSF) 2 PF 6 ( T c = 0.9 K, p c 1.2 GPa) [1] and first ambient-pressure organic superconductor (TMTSF) 2 ClO 4 ( T c = 1.2 K) [2]. These superconductors are most studied members of Bechgaard salts, which are the 2:1 radical salts of TMTSF and monovalent anions (PF 6 , AsF 6 , SbF 6 , TaF 6 , BF 4 , ClO 4 , NO 3 ) [3,4]. In addition to the starting seven members, yet eight isostructural salts have been synthesized with NbF 6 [5], ReO 4 [6,7], BrO 4 [8], FSO 3 [8], PF 2 O 2 [9], CF 3 SO 3 [10,11], H 2 F 3 [12], and SiF 5 [13], respectively.
Their crystal structures are characterized by the weakly dimerized stacks of the planar TMTSF molecules along the most-conducting a-axis. There are weak interaction between the neighboring stacks along the second-conducting b-axis forming the TMTSF layers. Finally, each TMTSF layer is separated by an anion layer resulting in a sandwich structure.
The physical properties of the PF 6 and ClO 4 salts are so interesting that the studies of the TMTSF salts seem to have been mainly focused on the starting members of Bechgaard salts including the two. Many experimental and theoretical efforts have been devoted to reveal the nature of, for example, possible exotic superconductivity [14,15,16,17,18], spin-density-wave (SDW) transitions [19,20,21,22,23,24,25,26,27], field-induced SDW transitions [28,29,30,31,32,33,34,35], and a variety of angular-dependent magnetoresistance oscillations [36,37,38,39,40,41,42,43,44], all of which is closely related to the low dimensionality of electronic systems of Bechgaard salts.
On the other hand, much less attention has been paid to “exotic” TMTSF salts other than Bechgaard ones. To the best of the authors’ knowledge, there are reports on the six charge-transfer complexes with acceptor molecules [45,46,47,48,49,50] as well as twenty five salts with inorganic or complex anions, where TMTSF molecules have the average valence of ( 1 / 2 ) + [51,52,53,54,55], ( 2 / 3 ) + [56,57,58,59,60,61], ( 3 / 4 ) + [62,63], ( 4 / 5 ) + [64], and 1 + [65,66,67,68,69,70,71], respectively. Actually, the number of the exotic TMTSF salts is larger than that of the fifteen Bechgaard ones mentioned above. Although the superconductivity has never been reported, new phenomena to be explored will be probably provided by the variety of their exotic crystal structures giving different oxidation states and/or packing patterns of TMTSF molecules from that of Bechgaard salts.
In this paper, we present three novel exotic TMTSF salts with the same counter anion I 3 , namely (TMTSF) 8 (I 3 ) 5 (8:5 salt), (TMTSF) 5 (I 3 ) 2 (5:2 salt), and (TMTSF) 4 (I 3 ) 4 ·THF (4:4 salt, THF = tetrahydrofuran), respectively. Their crystal structures are of different types from those of any TMTSF salts ever reported. We carried out the X-ray crystal structure analyses; and the electrical resistivity measurements at ambient pressure as well as at pressures up to 1.7 GPa.
The information on the valence of donors and/or acceptors is helpful to understanding the electronic states of charge-transfer complexes with partial charge transfer. In some literature of the exotic TMTSF salts, they attempted to estimate the TMTSF valence on the basis of bond lengths within the TMTSF molecule [46,60,63,71]. It is, however, shown below that such an method does not give plausible estimates for the present I 3 salts.
Instead, we estimated the valence from the difference between calculated energies of the neutral and cationic TMTSF molecules using the conformations observed for the crystals. By comparing these energies with that obtained for the quantum mechanically optimized conformations, it is shown that one can obtain reasonably quantitative valence of TMTSF molecules in the crystals. This method is probably applicable to the other exotic TMTSF salts as well as to salts of other organic donors and/or acceptors.

2. Results

2.1. (TMTSF) 8 (I 3 ) 5

2.1.1. Crystal Structure

The crystal structure of the 8:5 salt is shown in Figure 1; and its crystallographic and refinement data are summarized in Table 1. Crystallographic data files are available as Supplemental Materials. The appearance of single crystals are black thick cuboids reflecting the orthorhombic crystal system with the space group C m c m .
There are four TMTSF stacks along the c-axis in the unit cell with the period of six TMTSF molecules. There are two crystallographically independent TMTSF molecules (P and Q) in the stack, which is made of repetition of trimers (PQP). The normal to the molecular plane defined with the four Se atoms is tilted from the stacking direction ( | | a ) by 2.23 ° for P, while that of Q is not tilted as its carbon and selenium atoms are on a mirror plane ( | | bc ).
The stacks are separated by another independent TMTSF molecules (R) along the b-axis; and by I 3 chains along the a-axis. Although there exist shorter Se⋯Se contacts than the sum of van der Waals radii of two Se atoms (<4.0 Å) between Q and R as in Figure 2, such contacts do not form networks along the b-axis. Thus, the electronic system is probably quasi-one-dimensional along the c-axis. Here we adopted 2.0 Å as the van der Waals radius of Se by Pauling [72], while 1.9 Å by Bondi [73] is used in some literature [13,56,58,60]. The length and number of such short contacts between neighboring molecules are the primitive but important measure to find strong intermolecular interactions; namely the stronger interactions along a direction can give the wider band dispersion than that along the other directions.
The distance between the molecular planes, which is defined by the four Se atoms in each molecule, is almost the same for that between P and Q ( d 1 = 3.56 ( 1 ) Å) and between P and P ( d 2 = 3.559 ( 8 ) Å), respectively (Figure 2). On the other hand, the average short Se⋯Se contacts between P and Q and between P and P are 3.95 Å and 3.82 Å suggesting that the interaction between P and P is slightly stronger than that between P and Q.
While dimer units of donors are widely observed as building blocks of organic conductors such as Bechgaard salts, TMTSF trimers are also not so rare in the exotic TMTSF salts. For example, there are reports on (TMTSF) 3 [Ti 2 F 8 (C 2 O 4 )] [56], (TMTSF) 3 M(CN) 4 (M = Pt, Ni) [57], (TMTSF) 3 W 6 O 19 (DMF) 2 (DMF = N,N-dimethylformamide) [58], (TMTSF) 3 [Cr(NCS) 4 (phen)] 2 ·CH 2 Cl 2 (phen = 1,10-phenanthroline) [59], and (TMTSF) 3 (TFPB) 2 (TFPB = tetrakis[3,5-bis(trifluoromethyl)phenyl]borate) [60], (TMTSF) 3 Ta 2 F 10 O [61], respectively. In most of these salts, the average valence of a TMTSF molecule is ( 2 / 3 ) + suggesting the stability of the [(TMTSF) 3 ] 2 + unit.
On the other hand, the existence of the TMTSF monomer separating TMTSF stacks like R in the present 8:5 salt was reported for (TMTSF) 3 [Cr(NCS) 4 (phen)] 2 ·CH 2 Cl 2 [59] and (TMTSF) 4 (TMTSF)Nb 6 Cl 18 ·(CH 2 Cl 2 ) 0.5 [62,63]. This is also the case with the 5:2 salt shown below. When a rather strong interaction is expected between such a monomer and a donor stack, it is difficult to estimate the valence of TMTSF molecules because the crystallographically independent molecules naturally have different charges from one another and a TMTSF molecule easily possesses an irrational charge when it participates in forming energy bands. The estimation of the valence of TMTSF molecules in the present salts is discussed in Section 3.
There exist three types of disorders in the 8:5 salt at room temperature as shown in Figure 3. The first is a conformational disorder of three methyl groups of the TMTSF molecule Q. Each of the methyl groups at the carbon C5, C9, and C10 is disordered between two energetically favorable states.
The second is the positional disorder of the I 3 anions on a mirror plane and they are labeled I4–I5–I6 and I7–I8–I9, respectively. The crystal structure analysis was carried out by assuming the same probability of 1 / 2 for each of the red and blue sites. The slight bending of I–I–I is probably spurious and caused by the overlap of the electron density of the disordered anions.
The third is the orientational disorder of the I 3 anion whose center is labeled I10. The crystal structure was solved by assuming I11–I10–I12 (pink) has the probability of 1 / 2 and each of the two orientations of I11B–I10–I12B (lime green and orange) has 1 / 4 .
In addition to the orthorhombic crystal system, these disorders and the large unit cell containing the thirty two TMTSF molecules and twenty I 3 anions are characteristic to the 8:5 salt.

2.1.2. Electrical Resistivity
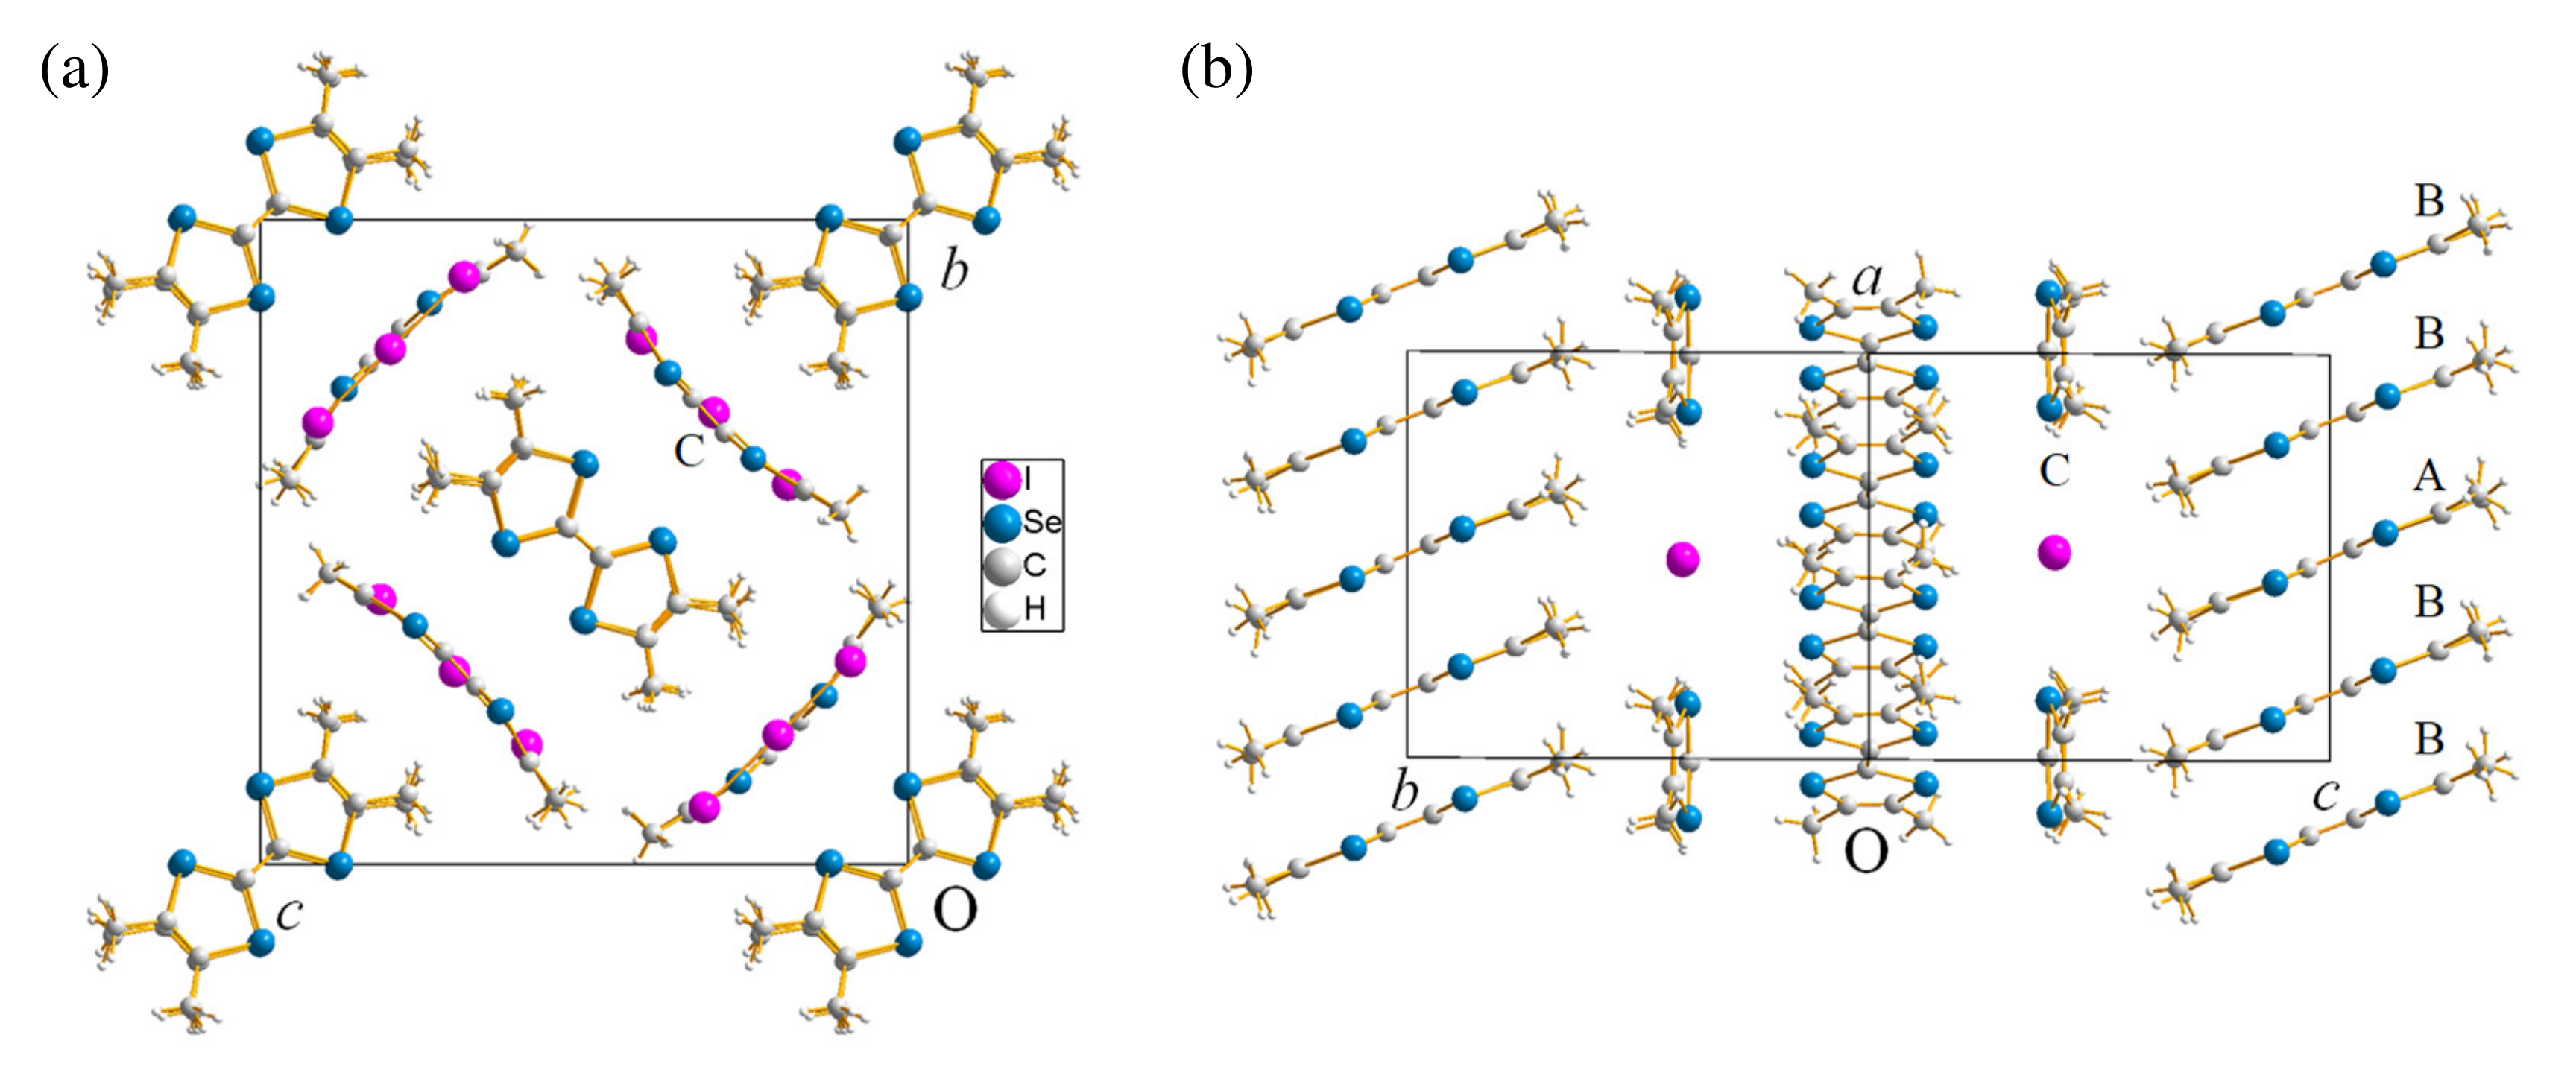
The electrical resistivity ρ of (TMTSF) 8 (I 3 ) 5 was measured at ambient pressure and under hydrostatic pressures up to 1.73 GPa.
The single crystals are rather thick and plate-like. The dimensions are 0.5 × 0.2 × 0.07 mm 3 on average for the seven samples. Although the correspondence between the crystal edges and the lattice vectors has not been determined, the anisotropy of ρ —those along the most and least grown directions are ∼60 and ∼2 S·cm 1 —suggests that the longest crystal edge is parallel to the stacking direction of TMTSF molecules (c-axis).
The ρ along the most-grown edge ( I longest edge) is weakly metallic below room temperature, but resistance jumps make its intrinsic behavior very unclear and hysteretic. On the other hand, the reproducibility was good when the electrical current was applied along the least-grown edge, in other words perpendicular to the widest surface ( I plane). Such behavior is very similar to that observed for the Bechgaard salts. Thus, we measured the pressure dependence of the ρ with I plane.
The result obtained for the sample #1908 is shown in Figure 4a. At ambient pressure, the ρ weakly increases below 300 K on cooling and becomes almost temperature independent below about 190 K. The ρ starts to increase very rapidly below 88 K suggesting a kind of phase transition or a change in the electronic state. After the increase in the ρ becomes gradual approaching 60 K, another rapid increase starts at 53 K.
The behavior of the ρ at higher pressures is similar to that observed at ambient pressure. The ρ becomes smaller and, at 1.7 GPa at room temperature, it reaches about 3.3% of that at ambient pressure. The temperatures of the steps also become lower at higher pressures.
One can see that the weak metallic behavior appears in the intermediate temperature region above 0.88 GPa. Please note that the hydrostatic pressure was applied using a clamped type pressure cell with Daphne 7373 oil as pressure medium as described in Section 4. Then the inside pressure decreases on cooling [74,75] resulting in the increase in the ρ , which sometimes cancels out the weak metallic behavior. Thus, the observation of the metallic behavior for the 8:5 salt suggests the existence of the small number of free charge carriers and a Fermi pocket, or a narrow band gap at Fermi level.
In the temperature dependence at ambient pressure, we see subtle hysteresis above 190 K as shown by the arrows (Figure 4a). Although the overall behavior under pressure is very similar to that at ambient pressure, no hysteresis was recognized at and above 0.30 GPa. It suggests that the apparent hysteresis has the same origin as the resistance jumps for I longest edge and is caused by an extrinsic effect like micro-cracks.
The steps below 88 K and 53 K are clearly seen also in the Arrhenius plot of ρ shown in Figure 4b. In addition to these steps, the Arrhenius plot reveals the existence of the third step above 200 K at each pressure. Figure 4c shows the numerical derivative of the Arrhenius plot. The calculations were carried out after smoothing the data. The rapid increases in the ρ in Figure 4a,b are recognized as the peaks in Figure 4c. Here we assume each peak corresponds to a phase transition or a change in the electronic state.
It should be noted that the pressure medium Daphne 7373 gradually solidifies around 200 K at ambient pressure; and the solidification temperature increases up to 300 K at 2.2 GPa [74,75]. The solidification results in rather rapid decrease in the inside pressure (∼0.1 GPa) on cooling and can be detected as a subtle extrinsic anomaly in the ρ as indicated by the arrows in Figure 4c. This is, however, not the case with the result at ambient pressure as the sample was in vacuum. Therefore, the the third anomaly above 200 K is not that caused by the pressure change.
We can define the possible transition temperatures T c 1 and T c 2 as the peak tops in Figure 4c as well as that of the cross point in Figure 4a,b. The T c 1 and T c 2 defined by the cross point is 2–3 K higher than that at the peak top. On the other hand, it is difficult to define the T c 3 , since the steps in Figure 4a,b, and the peaks in Figure 4c are incomplete. This shows that the step-like change in the high temperature region in the Arrhenius plot probably starts above 310 K.
Figure 4d shows the Tp phase diagram made by plotting the T c 1 and T c 2 defined as the cross points. The pressures at low temperatures were corrected by using the clamped pressure at room temperature and the temperature dependence of the pressure inside the clamped-type cell with Daphne 7373 as the pressure medium [74,75]. The nature of the phase transitions is unclear at present, but it is obvious that we need much higher pressure to suppress the semiconducting/insulating states (high-R 1 and high-R 2) than 1.7 GPa.

2.2. (TMTSF) 5 (I 3 ) 2

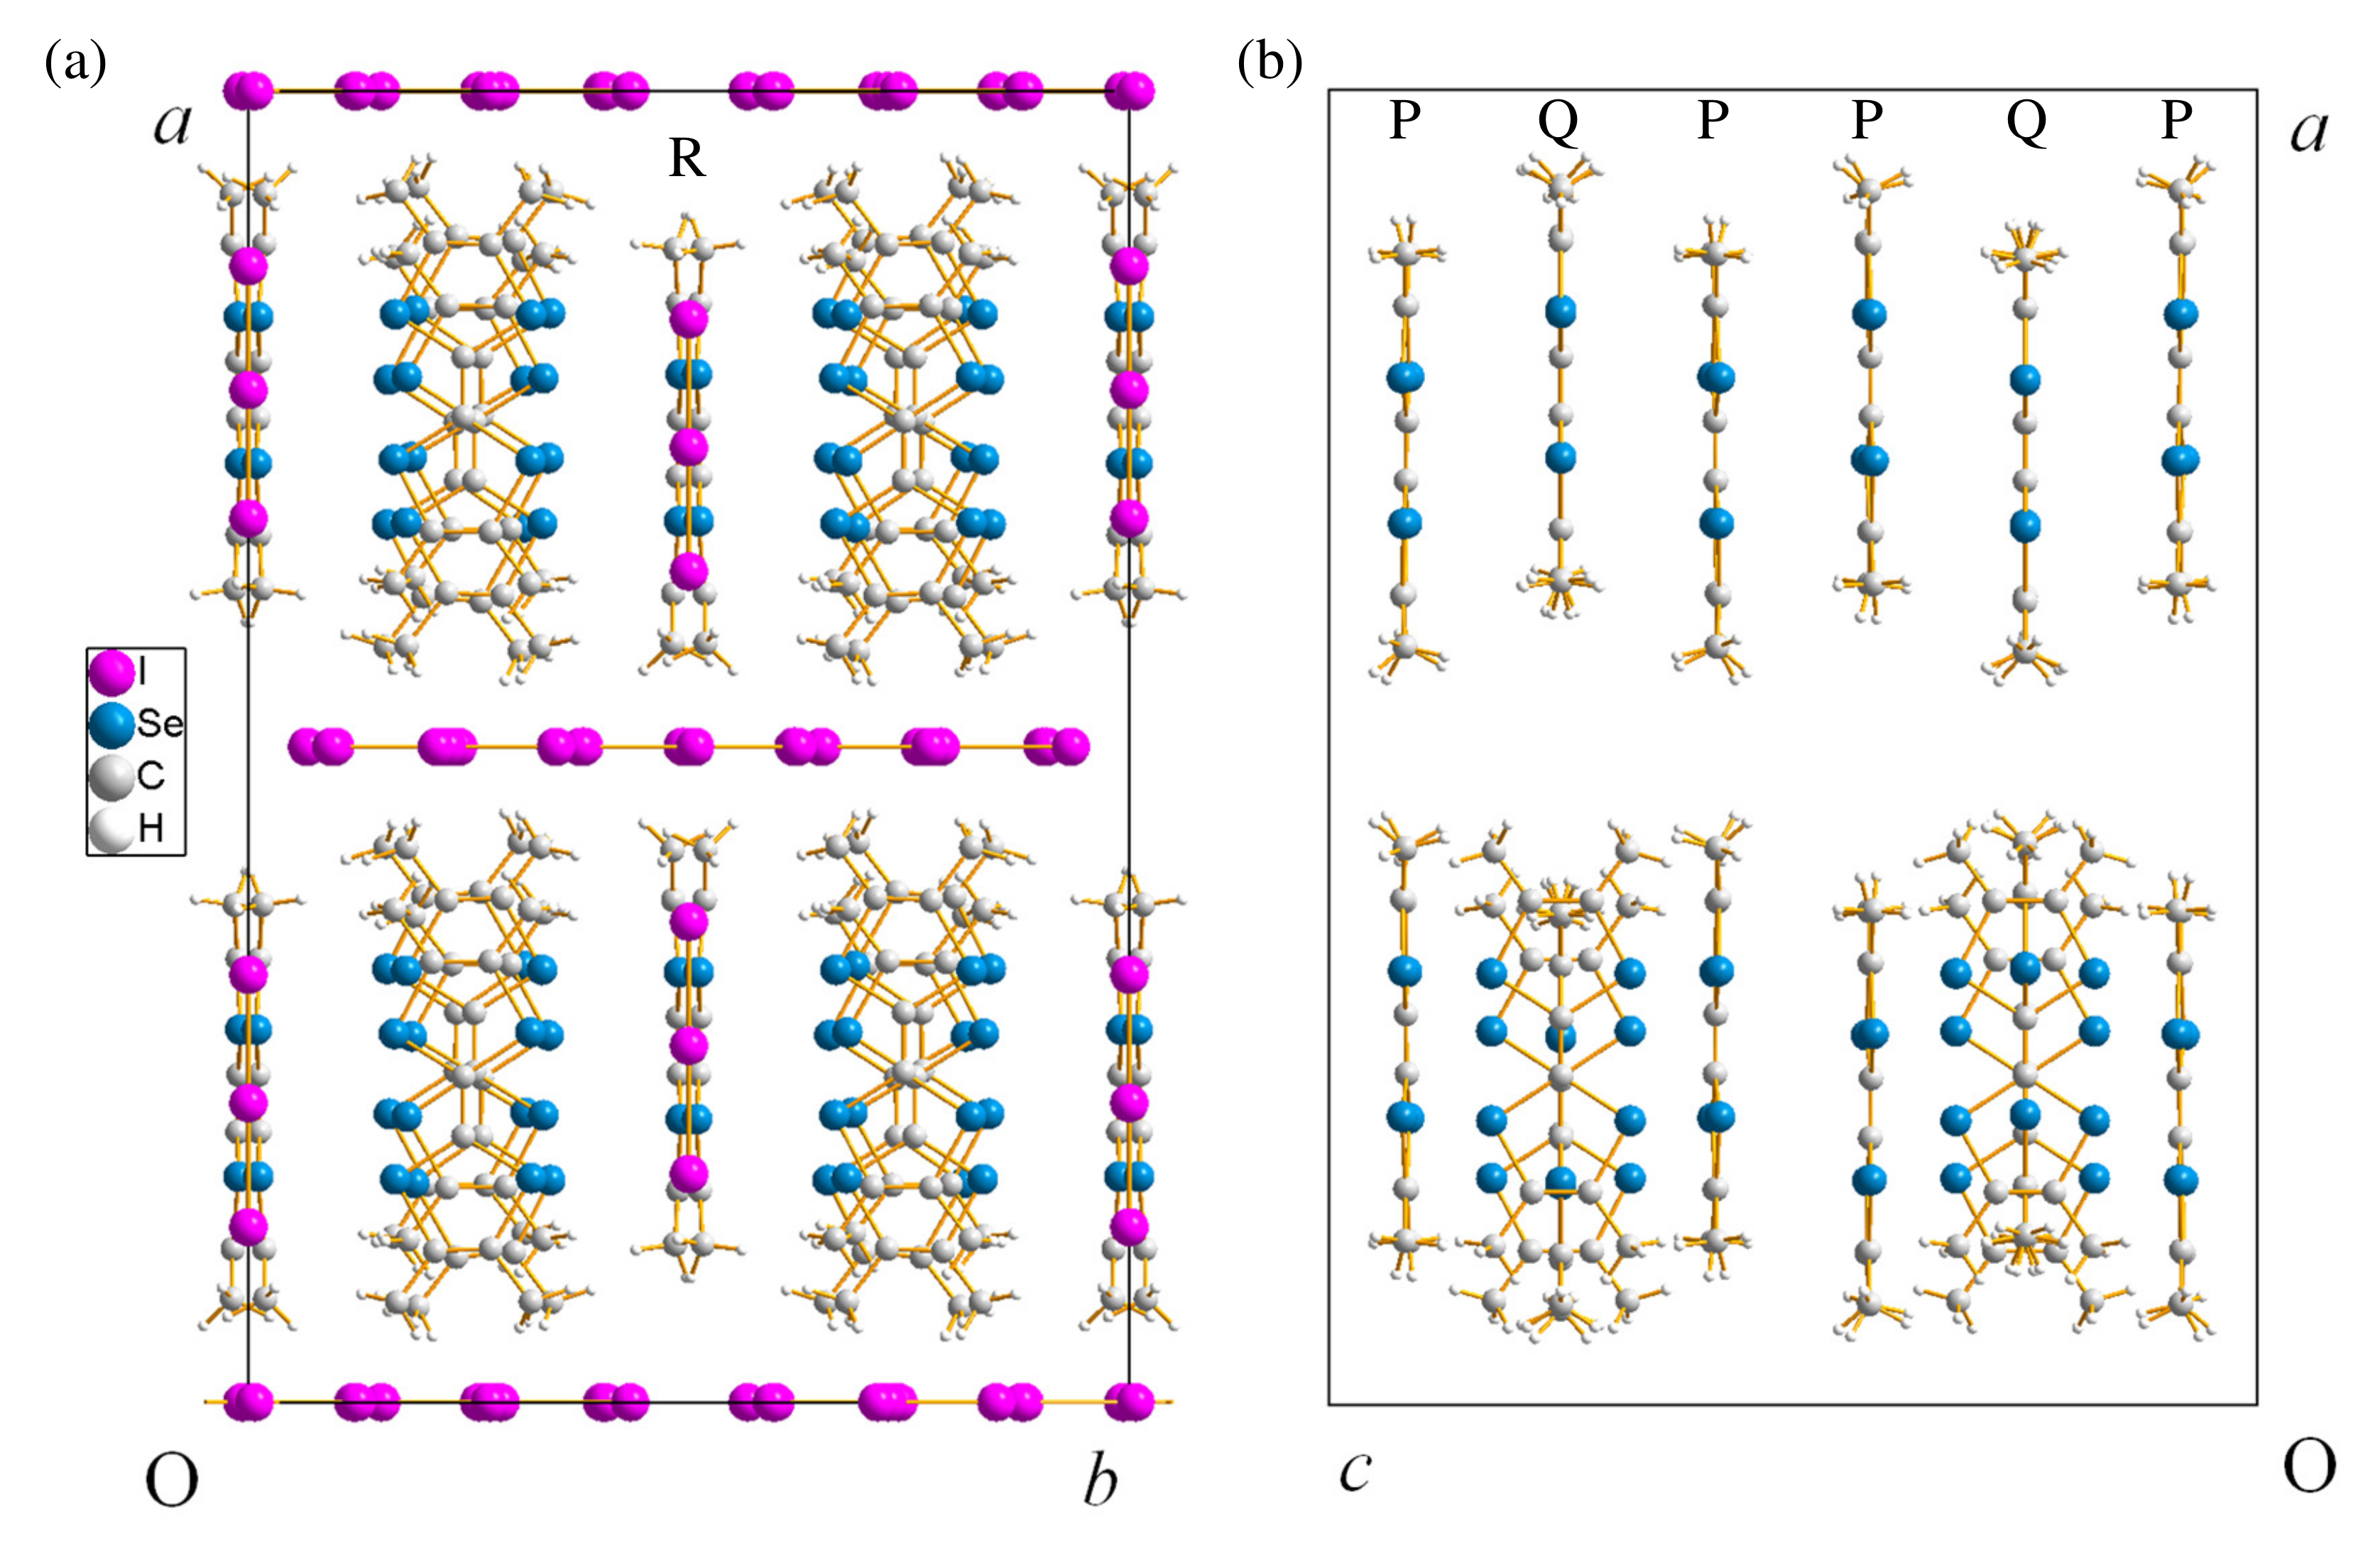
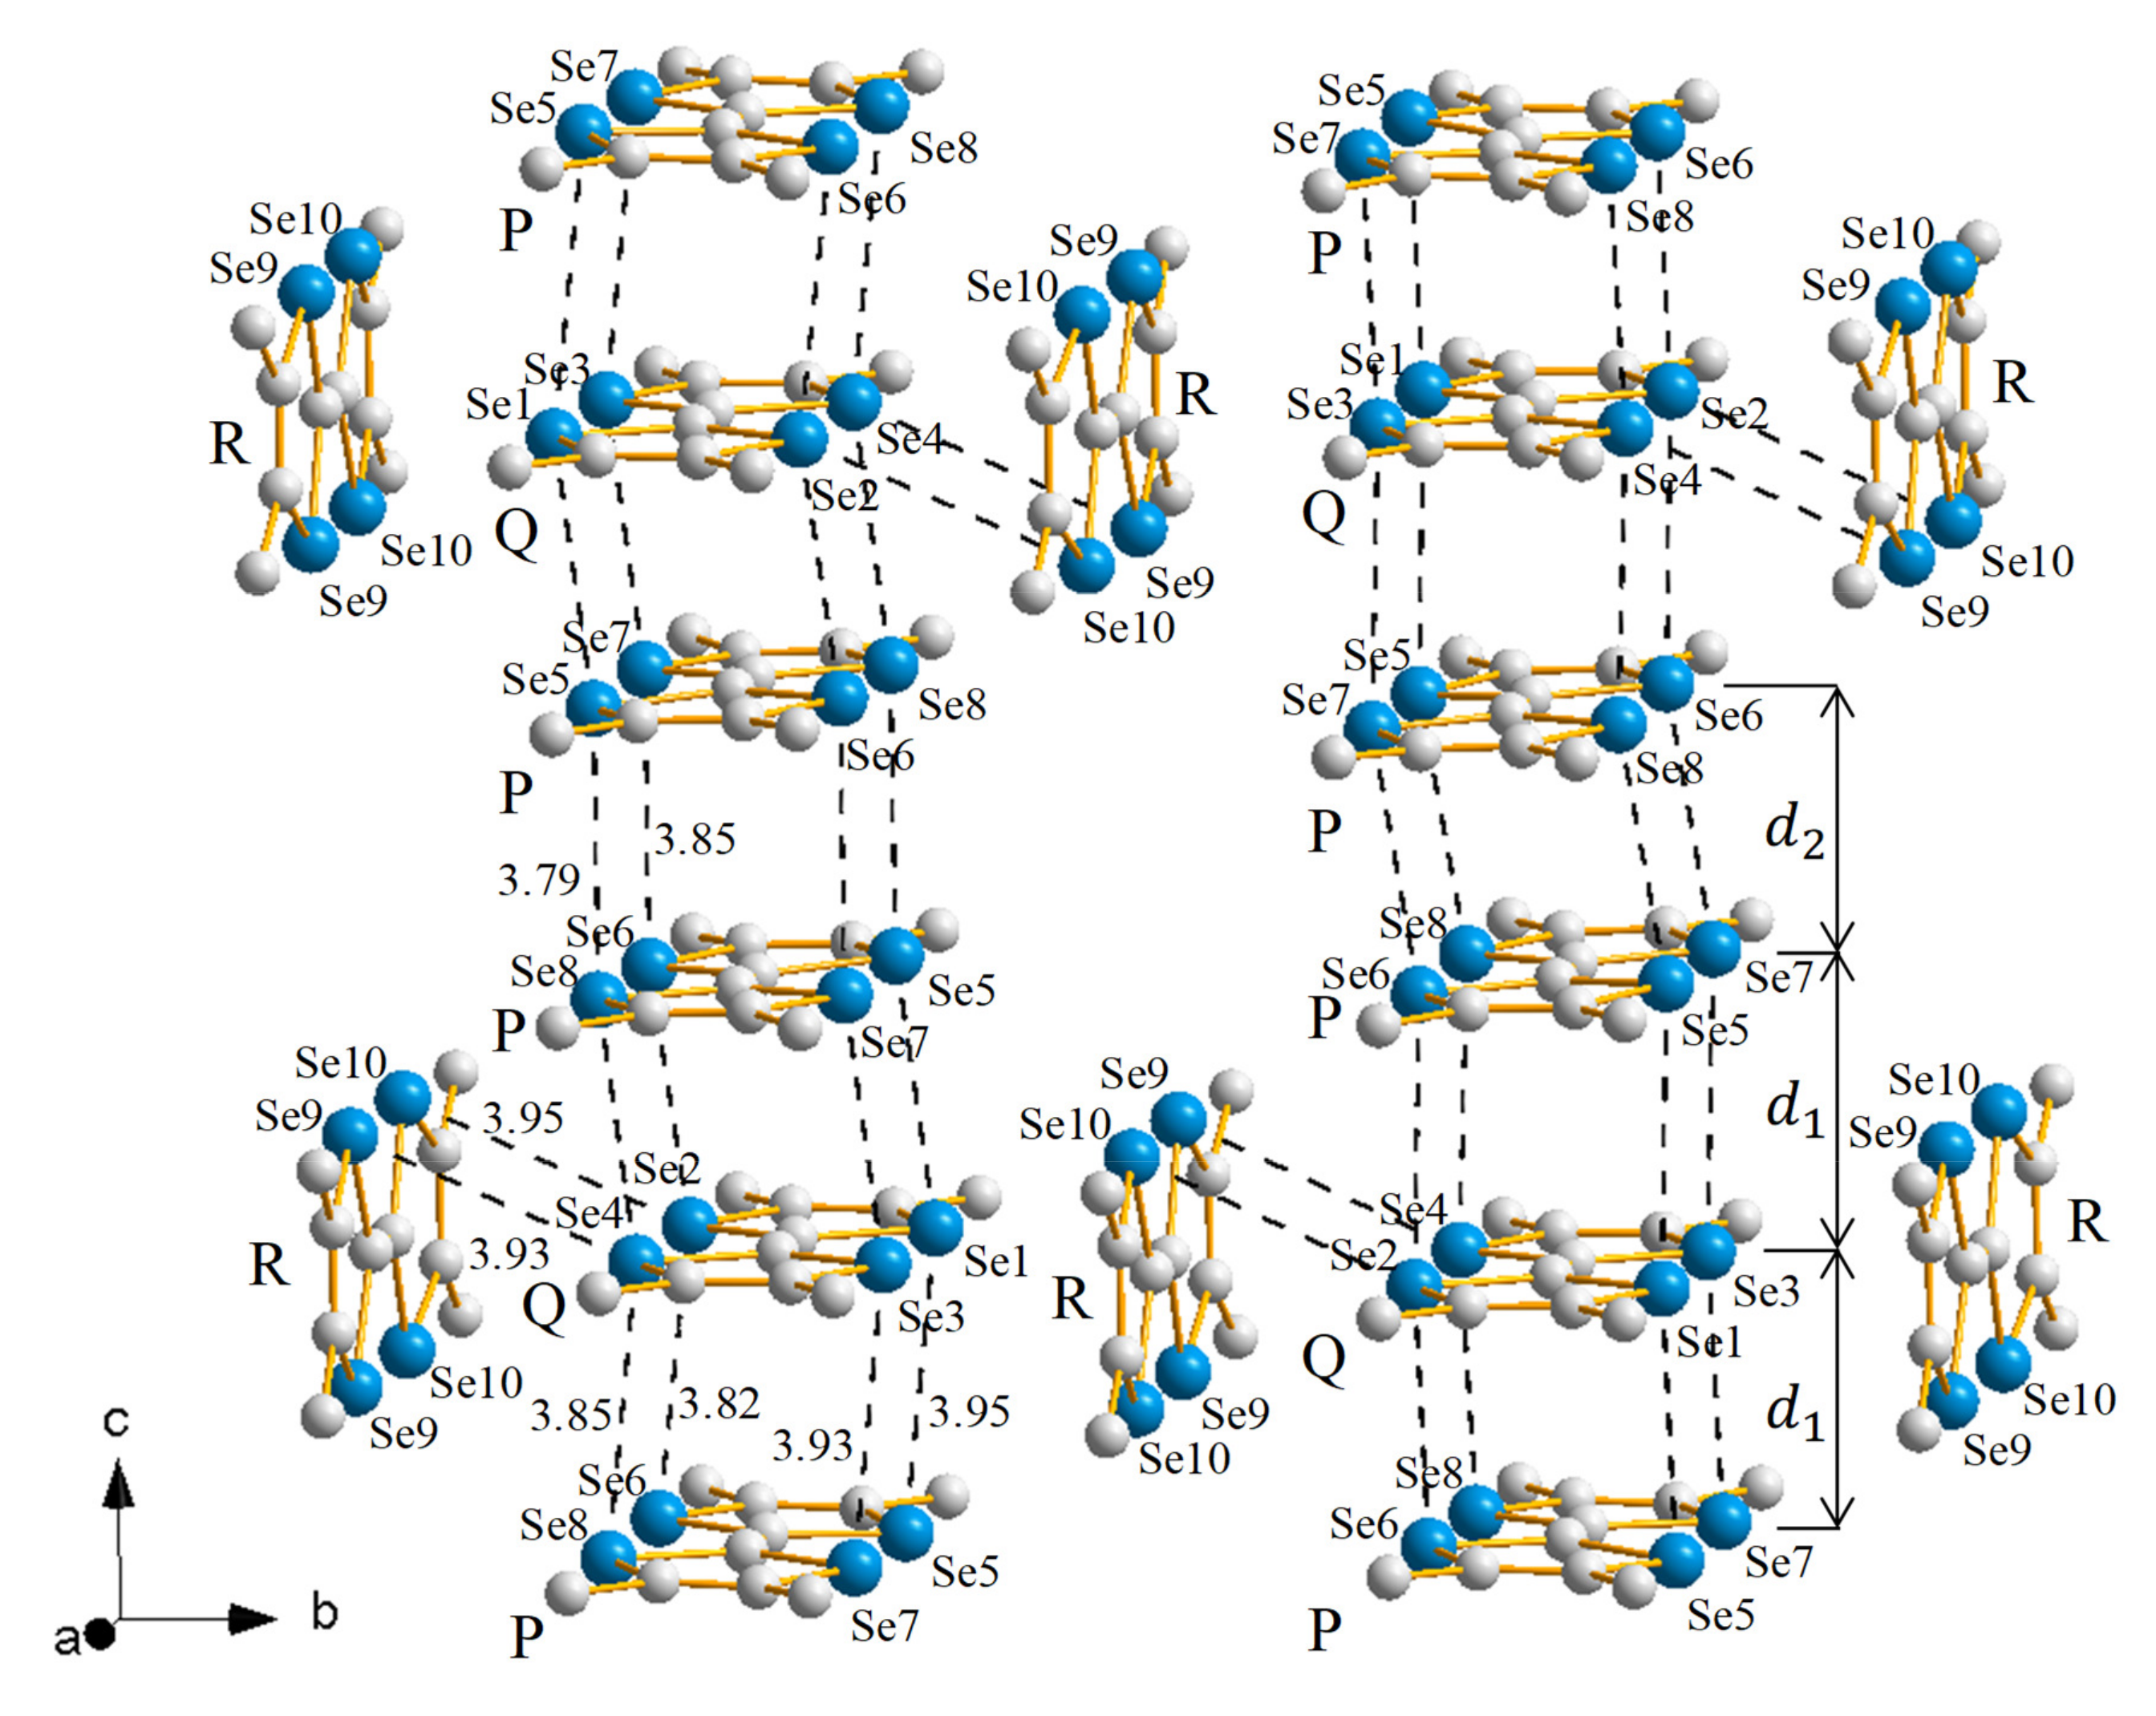
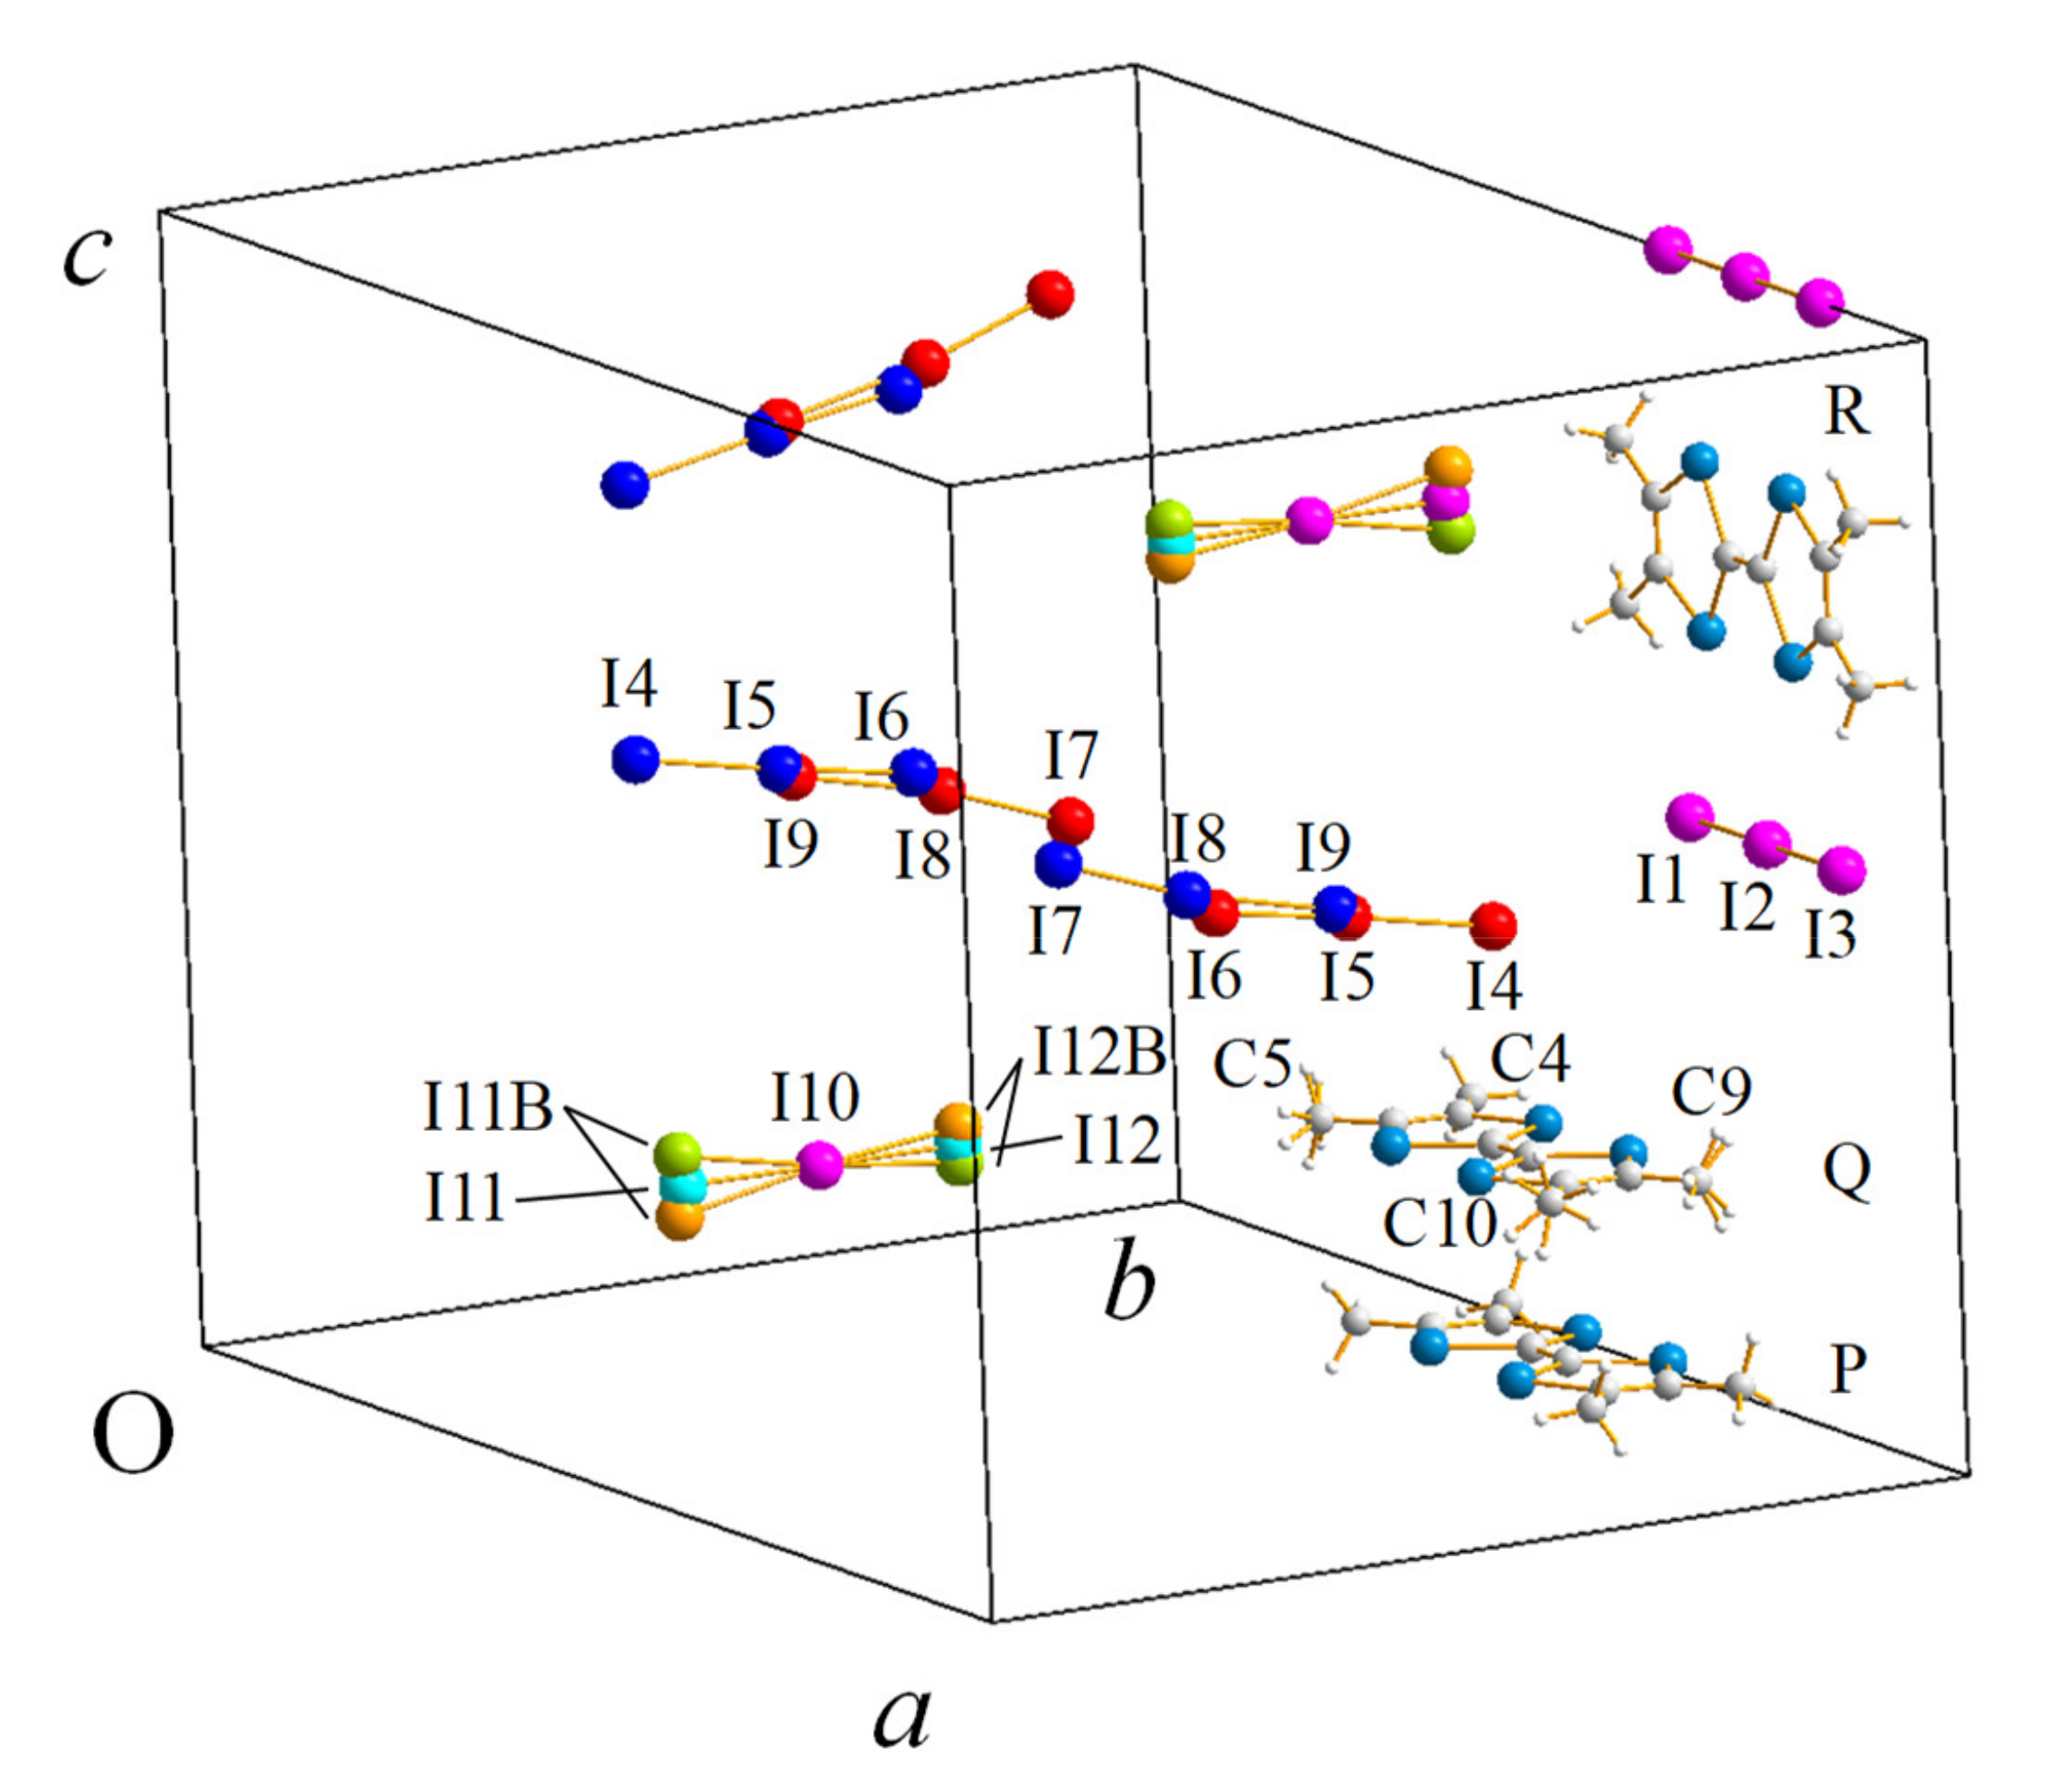
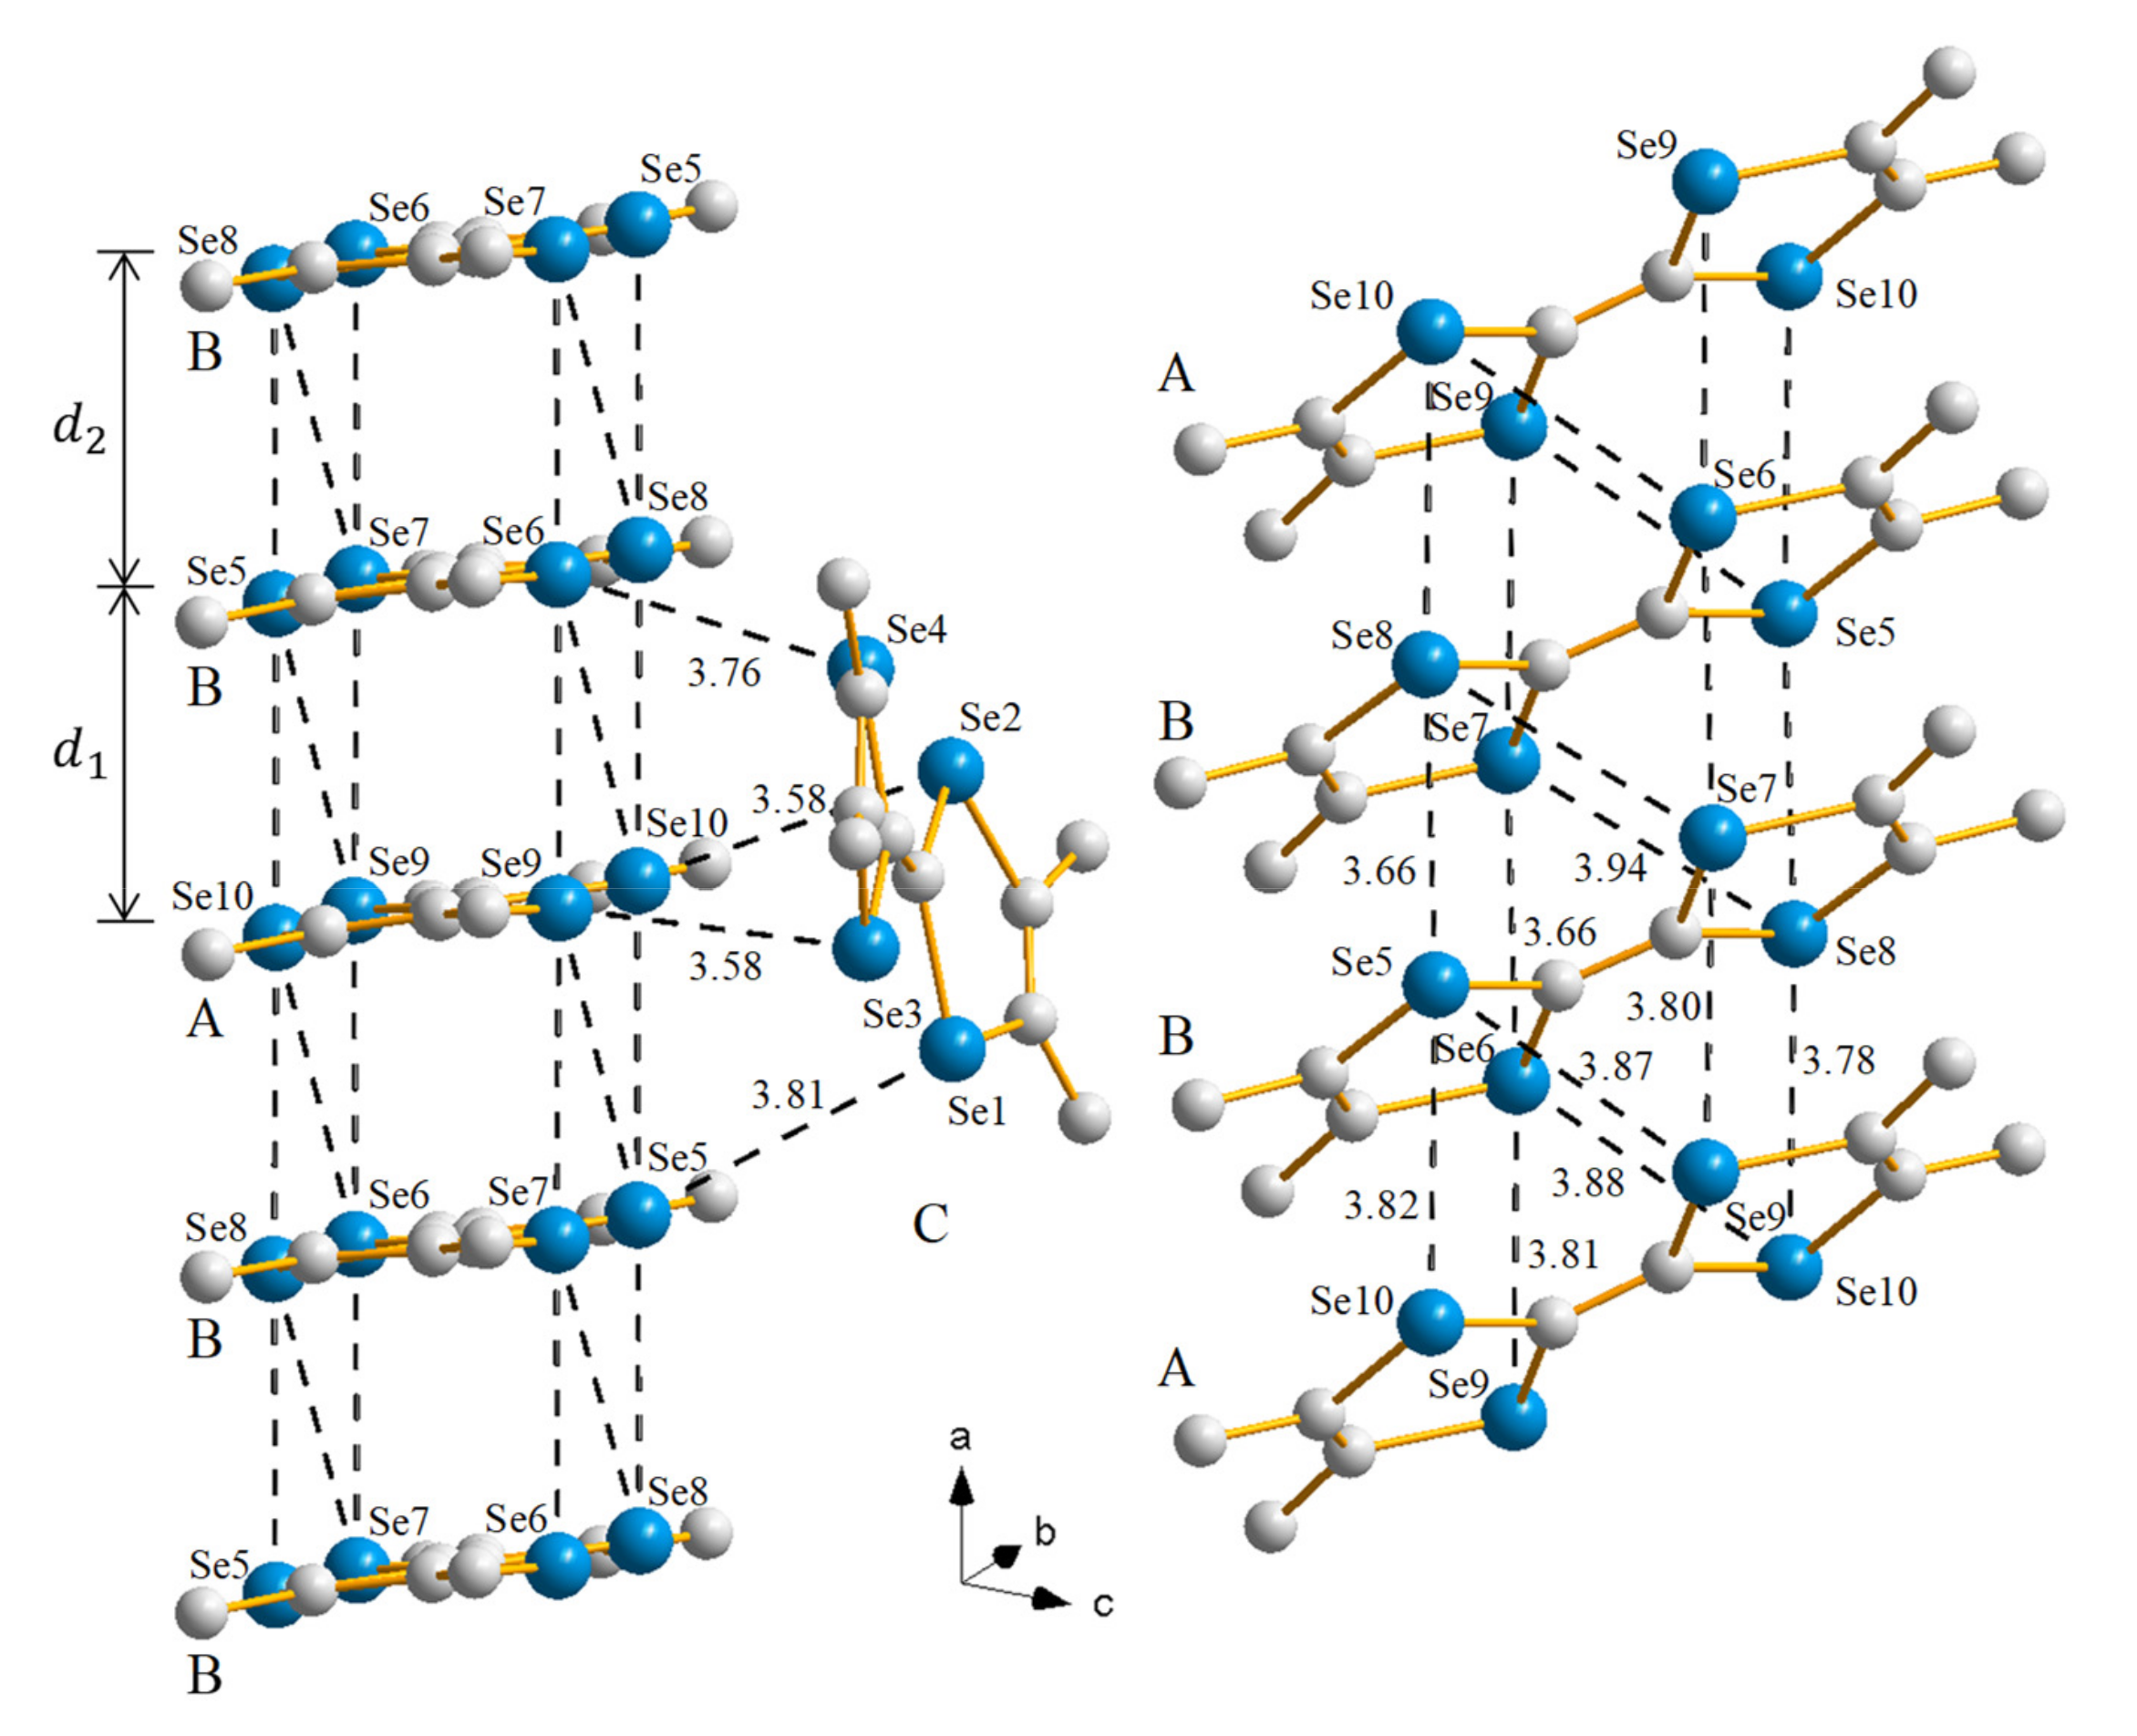
2.2.1. Crystal Structure

The crystal structure of (TMTSF) 5 (I 3 ) 2 at room temperature is shown in Figure 5; and its crystallographic and refinement data are summarized in Table 1. The crystal system is monoclinic with the space group P 2 1 / n , but β = 90.355 ° is close to 90 ° .
There are two TMTSF stacks along the a-axis in the unit cell. The stack at the center of the unit cell is crystallographically identical to that at the corners, which are related by the two-fold screw axis along the b-axis to each other.
Each stack is made of the repetition of trimers, where the donors are labeled as B, A, and B, respectively. Please note that the center of the molecule A is located at an inversion center. The tilt angle of the normal to the molecular plane from the a-axis is 24.26 ° and 23.79 ° for A and B, respectively. In this sense, the trimer stack of the 5:2 salt is rather different from that of the 8:5 salt, where the molecular plane is almost perpendicular to the stacking direction.
The TMTSF stacks are separated by the TMTSF monomers C and the I 3 anions as in the 8:5 salt. The molecular plane of C is, however, not flat as the monomer R in the 8:5 salt. This suggests that C is in a different oxidation state from that of R.
Figure 6 shows the arrangement of the TMTSF molecules of the 5:2 salt. There are six Se⋯Se short contacts between the neighboring TMTSF molecules in each stack. The interplanar distance between A and B is d 1 = 3.45 ( 3 ) Å; and that between B and B is d 2 = 3.39 ( 4 ) Å, respectively. Thus the much stronger interactions than that in the 8:5 salt are expected for the 5:2 salt. In addition, each monomer C shares four short contacts with one of neighboring stacks. Thus, we cannot simply conclude that C is neutral. The valence of each TMTSF molecule is estimated together with that in the other I 3 salts in Section 3.

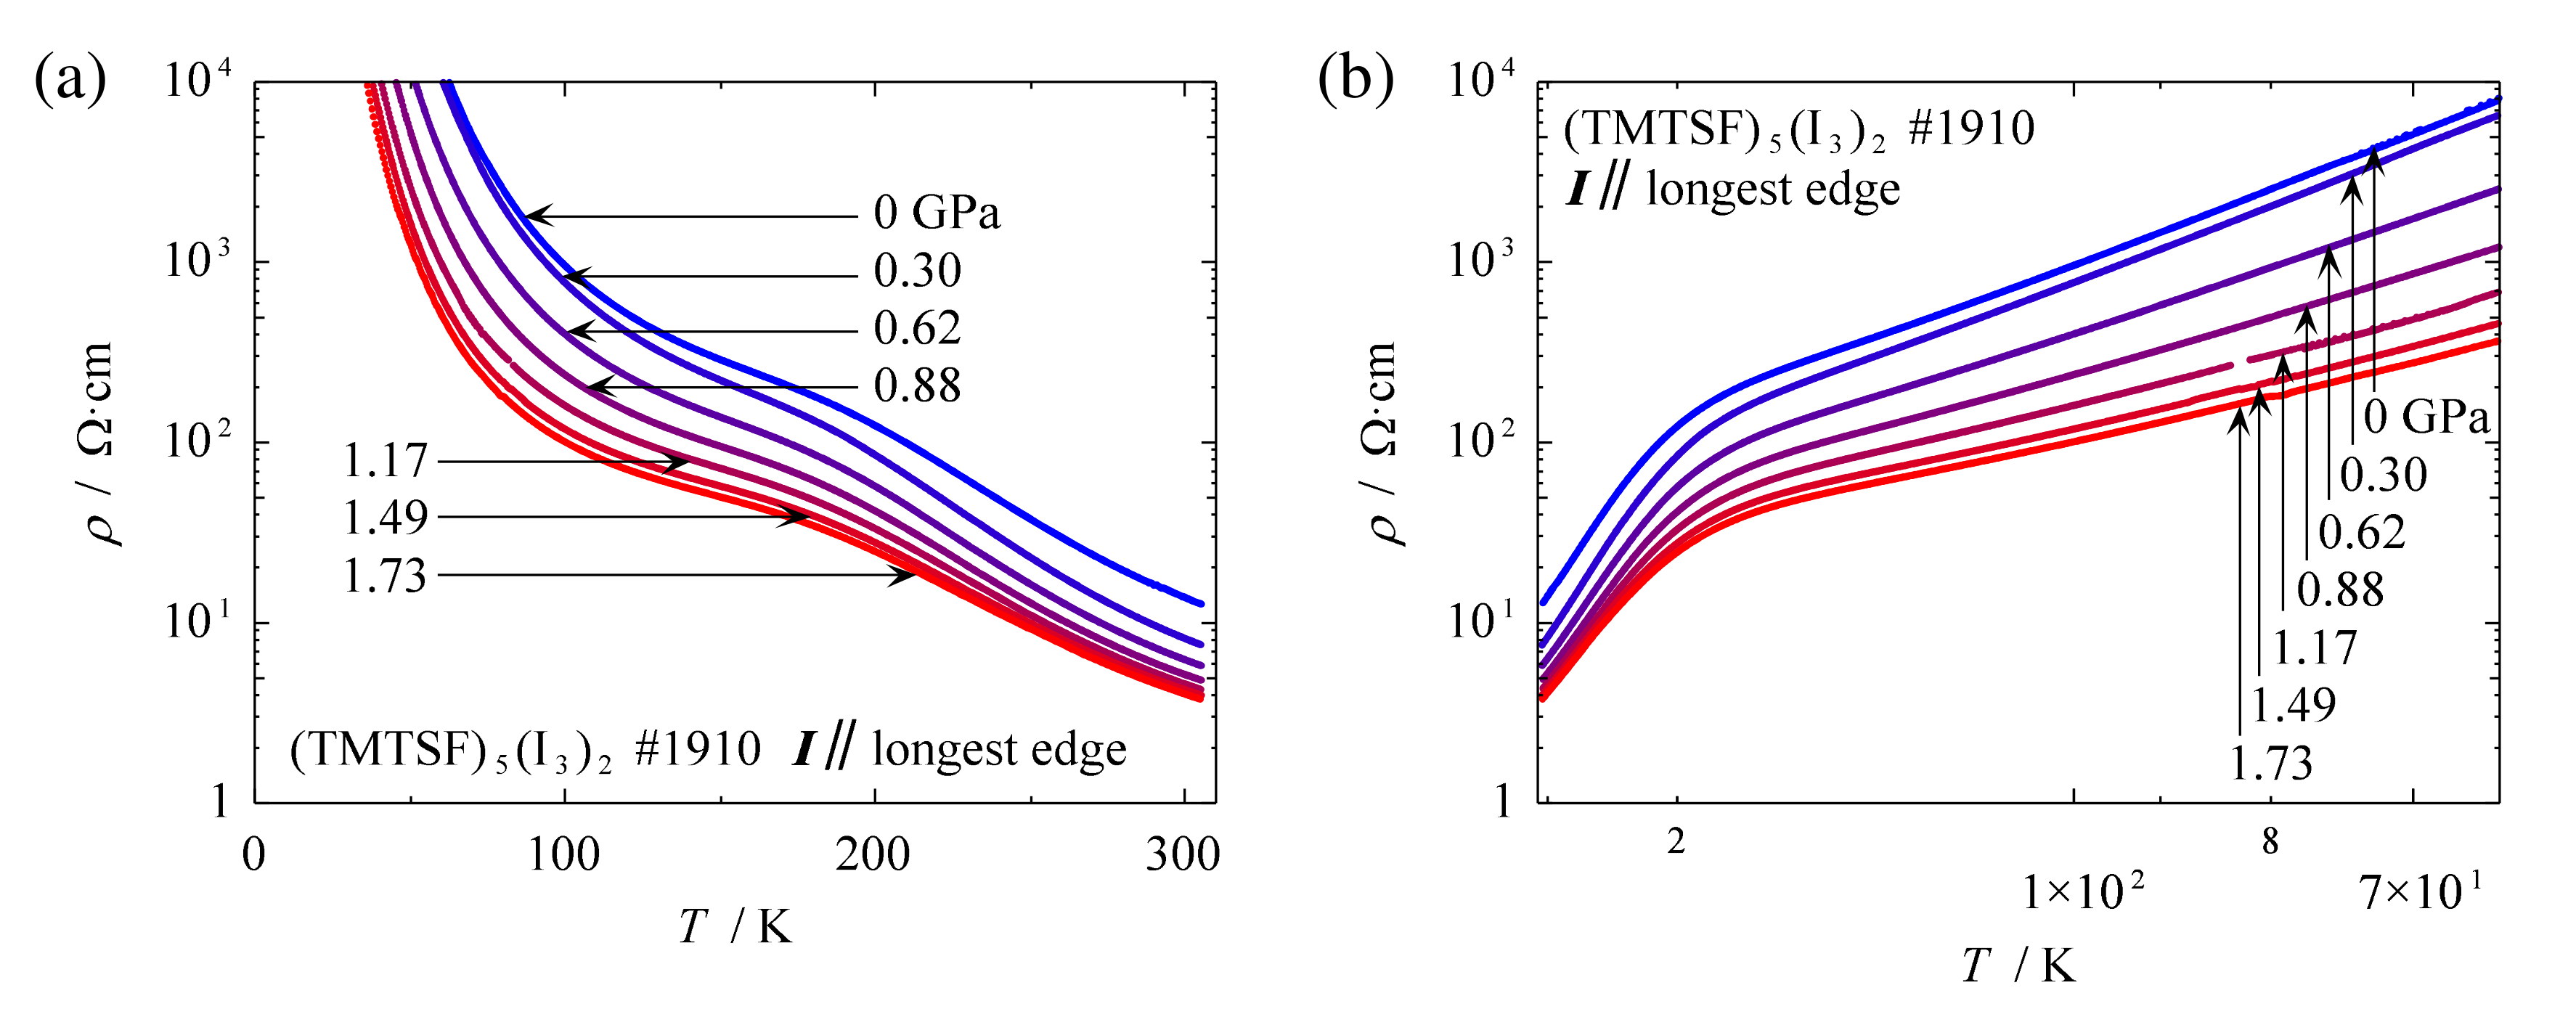
2.2.2. Electrical Resistivity
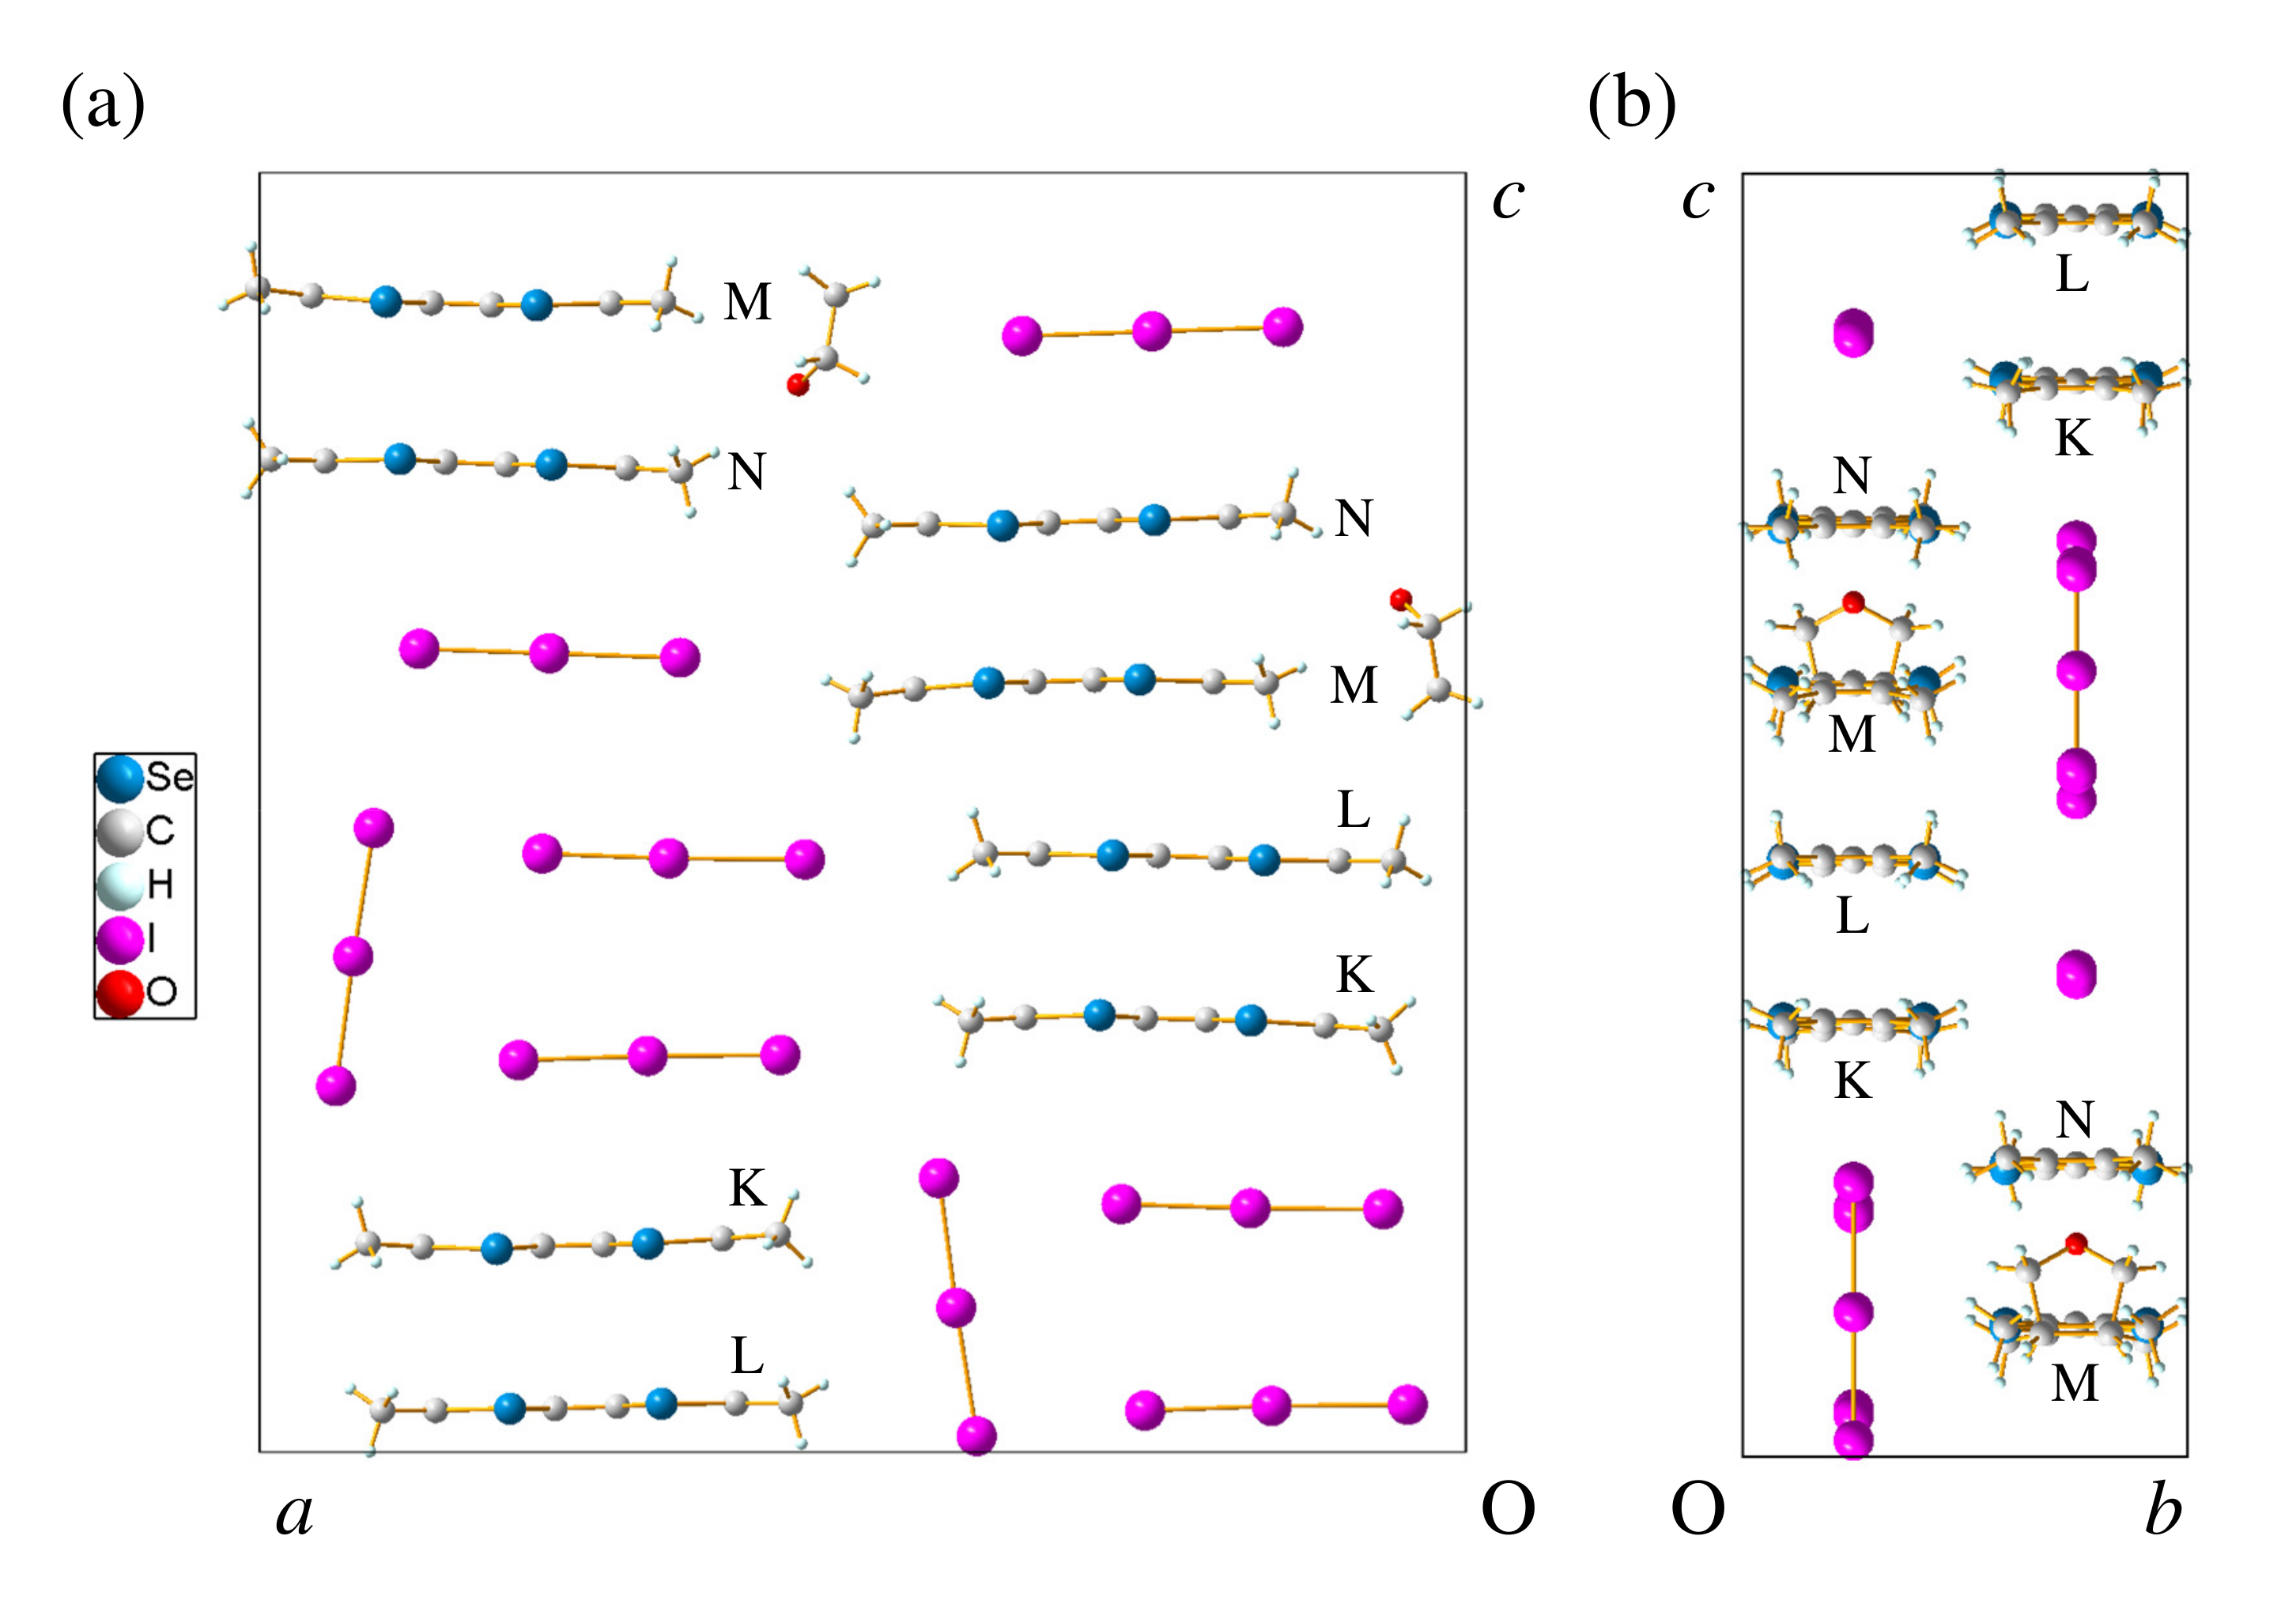
The ρ was measured along the most grown crystal axis. Although the correspondence between the crystal edges and the lattice vectors was not determined, it is natural to assume the crystal grows the best along the TMTSF stacks. The room temperature electrical conductivity is typically 50 S·cm 1 but scattered between 1 and 200 S·cm 1 among the seven single crystals measured.
The temperature dependence of the ρ is shown for the sample #1910 in Figure 7a. The ρ increases with decreasing temperature suggesting the existence of a band gap at Fermi level. Anomalous change in slope was observed around 190 K. It is clearly seen in the Arrhenius plot in Figure 7b. The slope becomes small below 190 K. Assuming the activation type temperature dependence, the tentative activation energy E a above and below 190 K is estimated as 1.3 × 10 2 and 34 meV, respectively.
The application of hydrostatic pressure up to 1.73 GPa does not change the behavior very much. The room temperature resistivity was decreased to about 25% of that at ambient pressure. The tentative E a was also reduced to 90 and 22 meV above and blow 185 K, respectively.

2.3. (TMTSF) 4 (I 3 ) 4 ·THF

The crystal structure of the 4:4 salt is shown in Figure 8; and its crystallographic and refinement data are summarized in Table 1. The crystal system is orthorhombic with the space group P n m a . The major building blocks of the crystal are the tetramers of TMTSF molecules and I 3 anions in addition to the THF molecules coming from the crystal growth solvent. Since the composition of TMTSF: I 3 is 1:1, the average valence of TMTSF should be 1 + .
The TMTSF molecules in a tetramer are labeled K, L, M, and N as in Figure 8. They are not crystallographically identical to one another, while every molecule is on a mirror plane parallel to the ac-plane. Thus, it is natural to consider that the valence of these TMTSF molecules is not the same within the tetramer. This is discussed in Section 3.
The arrangement of the TMTSF molecules in the tetramer is shown in Figure 9. There are no short Se⋯Se contacts between the nearest tetramers. The normal to the molecular plane defined with the four Se atoms is almost parallel to the stacking direction (c-axis) but slightly tilted. The angle between the normal to each molecular plane and the c-axis is 2.11 ° , 1.85 ° , 1.34 ° , and 2.04 ° for K, L, M, and N, respectively.
The tetramer is regarded as made of two non-equivalent dimers K–L and M–N as is obvious in Figure 9. The intradimer distance d 1 = 3.60 Å (K–L) and d 3 = 3.63 Å (M–N) is much shorter than the interdimer distance d 2 = 3.92 Å (L–M). There are four short Se⋯Se contacts within each of the dimers (K–L and M–N), while there are only two contacts between the dimers (L–M) and it is rather long (3.98 Å).
Each TMTSF tetramer is surrounded by six I 3 tetramers and vice varsa. In this sense, the 4:4 salt is similar to the rock salt NaCl. In addition, there is no strong interaction between the nearest TMTSF tetramers. Thus, the system is probably insulating, though the electrical conductivity is not known due to the rarity of its single crystals.
Among the exotic TMTSF salts, (TMTSF) 4 (TMTSF)[Nb 6 Cl 18 ]·(CH 2 Cl 2 ) 0.5 also has a TMTSF tetramer as a building unit [62,63]. In this case, however, a one-dimensional TMTSF stacks are formed by the repetition of tetramers resulting in its moderate electrical conductivity (0.5 S·cm 1 ) at room temperature. The orthorhombic rock-salt-like structure with the TMTSF and I 3 tetramers of the 4:4 salt is unique even in the exotic TMTSF salts.

3. Discussion

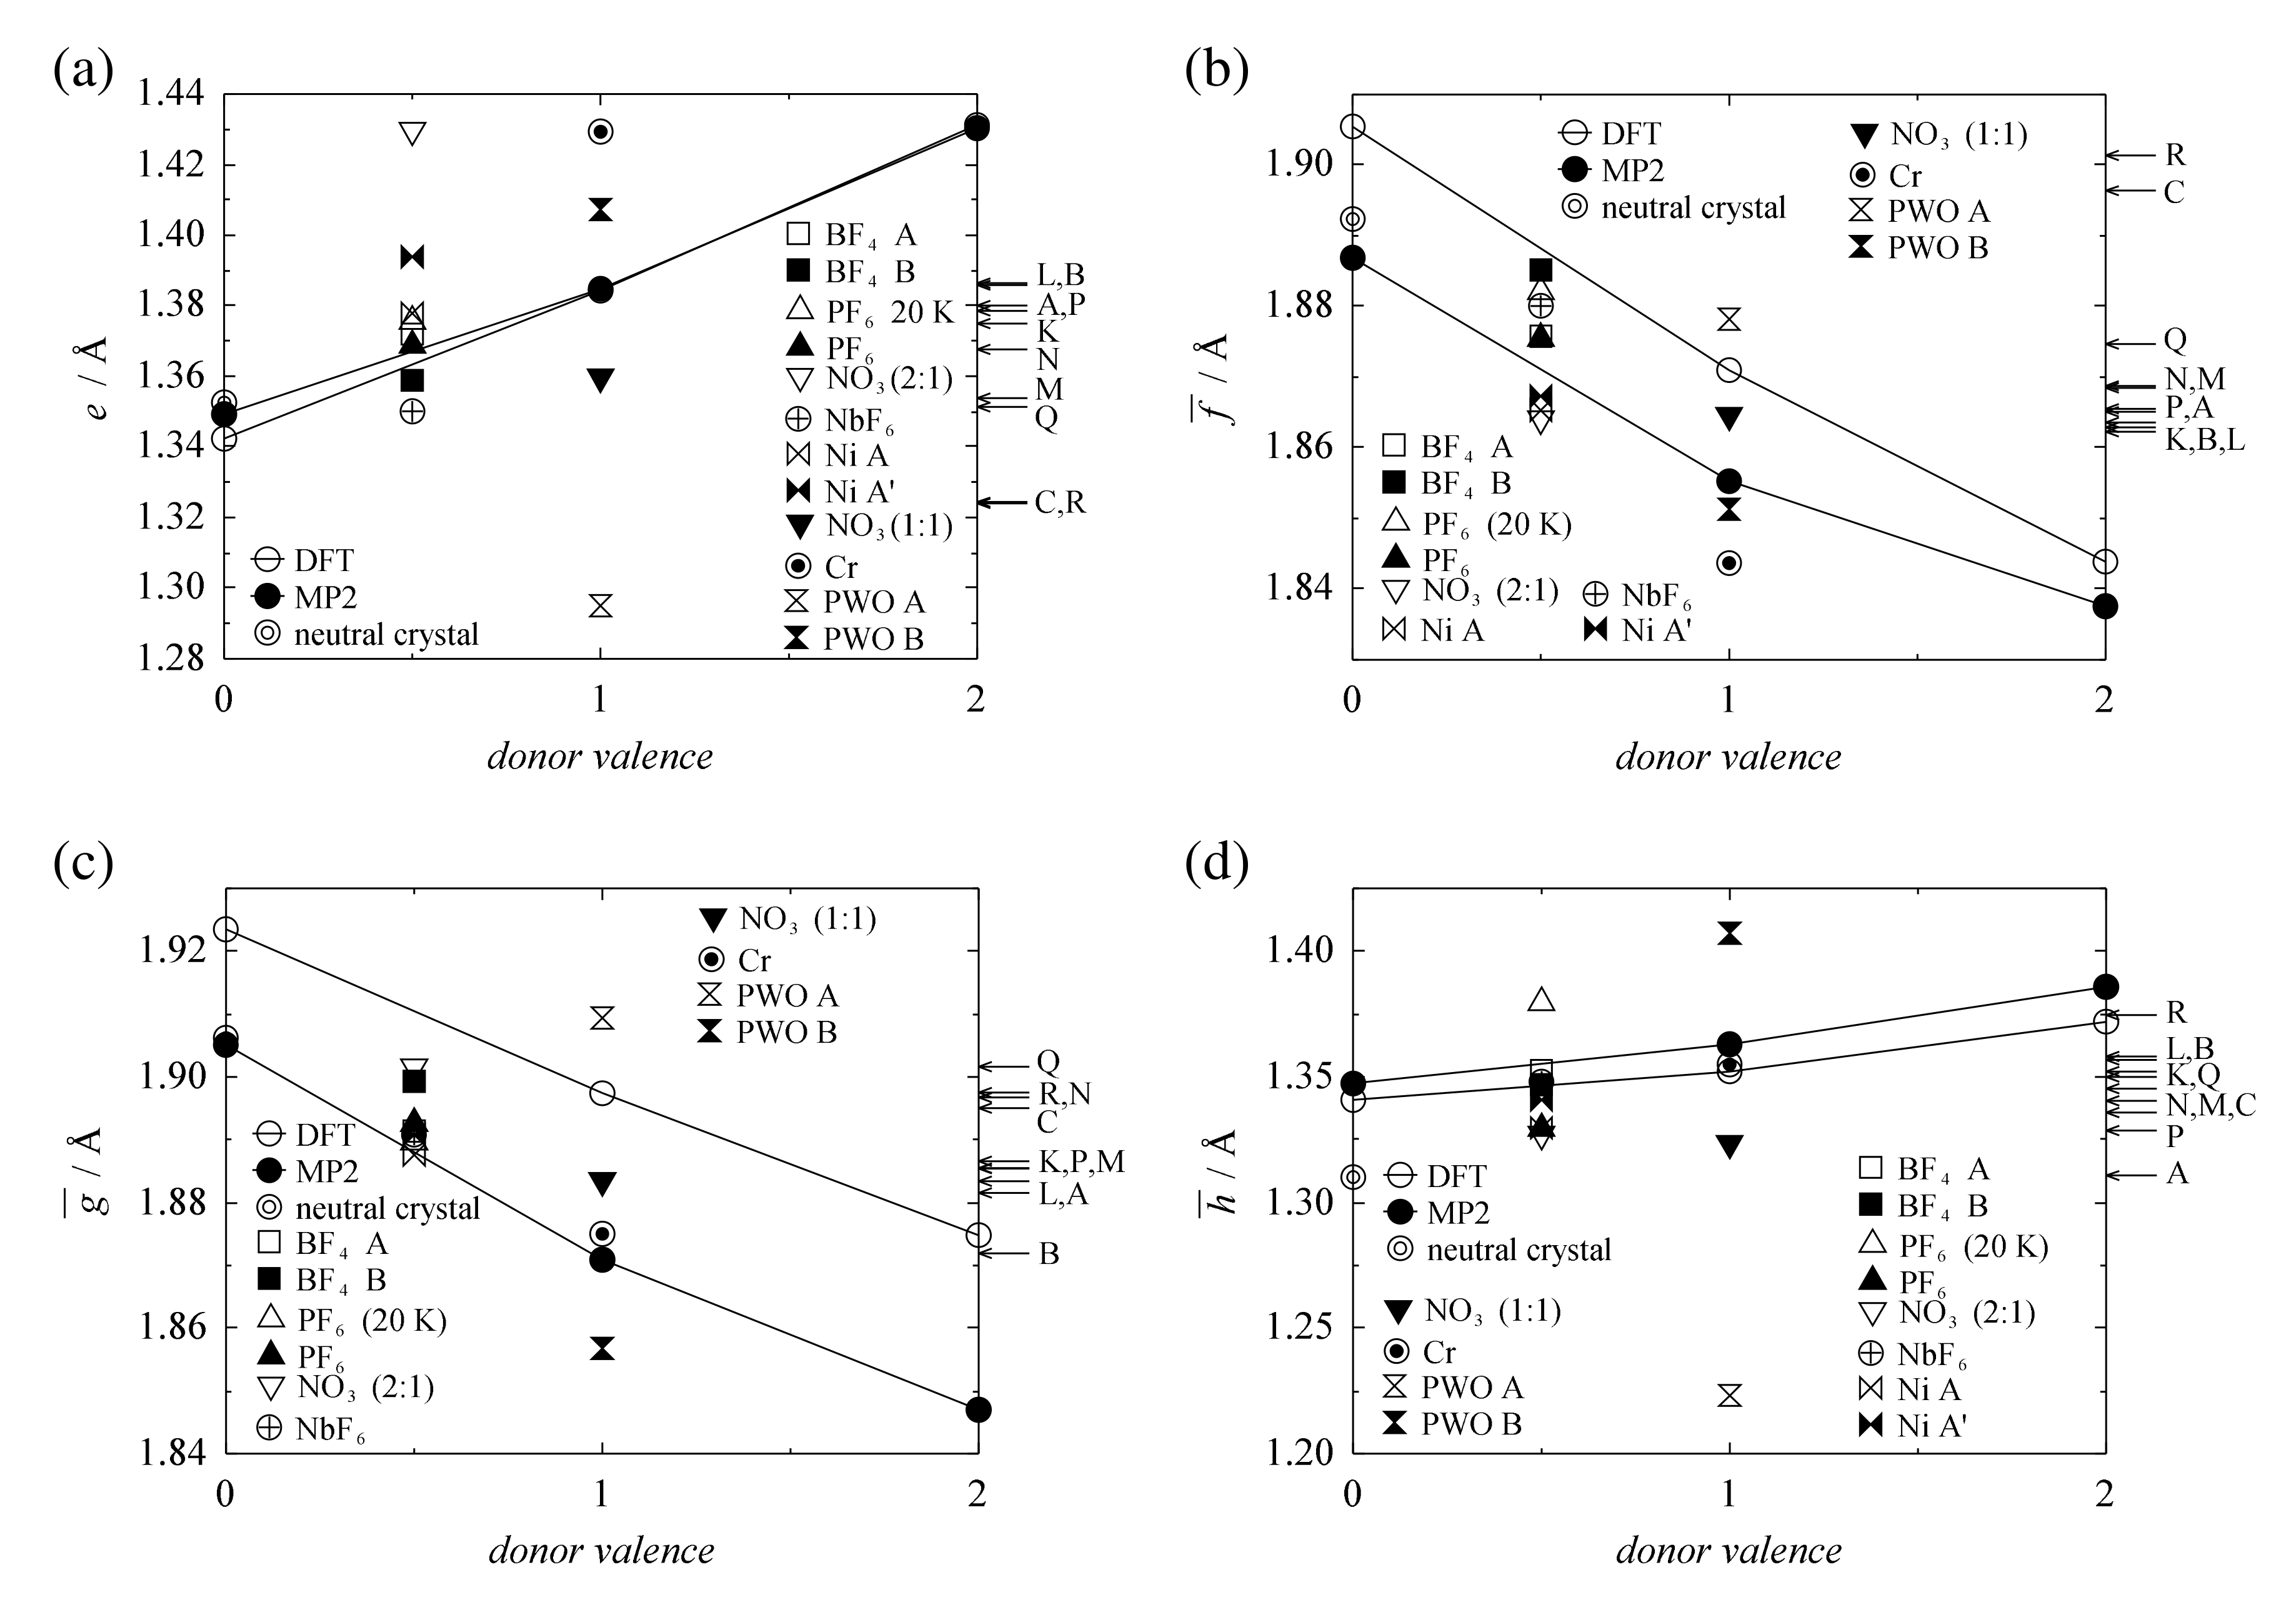
3.1. Valence and Bond Lengths of TMTSF Molecules

The knowledge of the valence of donors in conducting salts is essential to understand their electronic states because it determines the band filling and, therefore, Fermi energy. Once the band structure is available, one can predict whether the system has a Fermi surface or not. In Bechgaard salts, where the ratio of the TMTSF molecule to the monovalent anion is 2:1, the valence of the TMTSF molecule is ( 1 / 2 ) + . In the exotic TMTSF salts, however, the evaluation is sometimes not so simple due to the existence of non-equivalent TMTSF molecules.
Some authors reported the attempts to estimate the valence of TMTSF molecules partially oxidized in salts on the basis of the intramolecular bond lengths [46,60,63,71]. Indeed, there seems to be a kind of correlation between the valence and the bond lengths of TMTSF molecules in the neutral crystal (TMTSF 0 ) [76]; the 2:1 radical salts (TMTSF 0.5 + ) [5,52,77,78,79,80]; and (TMTSF)NO 3 [69], (TMTSF)[Cr(Br 4 SQ) 2 (Br 4 Cat) (SQ = semiquinonate, Cat = catecholate) [70], and (TMTSF) 3 PW 12 O 40 [68] (TMTSF 1 + ) as tabulated in Table 2.
Here we label the bond lengths e, f i , g i , and h i as in the inset of Table 2, where the subscript i distinguishes the chemically equivalent bonds from one another. For example, the length of the central and outer C=C bonds (e, h 1 , and h 2 ) have rough tendency to increase when the molecular valence changes from 0 to 1 + , while the C−Se single bonds ( f i and g i ) tend to become shorter.
Please note that we chose the BF 4 , PF 6 , and NbF 6 Bechgaard salts because they are representatives of the 2:1 radical salts with small (radius r = 2.72 Å), middle ( r = 2.95 Å) [81] and large ( r = 3.20 Å) [5] counter anions, respectively. (TMTSF) 2 NO 3 is the last Bechgaard salt that we could find the atomic coordinate of hydrogen atoms for the quantum mechanical energy calculations. (TMTSF) 2 Ni(tds) 2 (tds = [bis(trifluoromethyl)ethylene]diselenolato) [52] also has the 2:1 composition, but it is one of the exotic TMTSF salts with two crystallographically independent TMTSF molecules A and A’ at room temperature.
On the other hand, (TMTSF)NO 3 , (TMTSF)[Cr(Br 4 SQ) 2 (Br 4 Cat), and (TMTSF) 3 PW 12 O 40 are examples of TMTSF 1 + simply from their chemical compositions.
We also carried out quantum mechanical calculations [82] on the basis of the density functional theory (DFT, B3LYP/6-31G(d,p)) as well as Hartee–Fock (HF) calculations followed by Møller–Plesset correlation energy calculations truncated at the second order (MP2, 6-31G(d,p)) for TMTSF 0 , TMTSF 1 + , and TMTSF 2 + to obtain each optimized structure for comparison. The calculated bond lengths as well as those of the TMTSF molecules in the I 3 salts are also summarized in Table 2.
The rough correlation noted above is shown by plotting the e; and the averages of f i , g i , and h i ( f ¯ , g ¯ , and h ¯ ) against the donor valence in Figure 10. The bond lengths observed in the I 3 salts are indicated by the arrows at the right-side vertical axis in each plot.
In case of the central C=C bond e (Figure 10a), the DFT and MP2 results coincide to each other showing the almost linear valence dependence. On the other hand, the DFT and MP2 calculations give 1–2% difference in the other bond lengths from each other, though they are still close. The experimental bond lengths are mostly around the lines connecting the calculated points, but we see exceptionally scattered points at the valence = 0.5 and 1.
The optimized structures are of the isolated molecules in vacuum and highly symmetric. On the other hand, the TMTSF molecules in the crystals are affected by their surroundings as well as by the formation of their own energy bands. Therefore, they are rather unsymmetric, even if the chemical structure of TMTSF is symmetric. This is the reason we compared the “average” bond lengths such as f ¯ . In addition, the energy of TMTSF molecule also depends on bond angles, which are not considered here. Therefore, the scattering of the experimental data in Figure 10 is very natural.
Furthermore, the bond lengths observed for the crystallographically independent TMTSF molecules (PWO A and B) in (TMTSF) 3 PW 12 O 40 are anomalously far from the others at the valence = 1. The deviation is qualitatively understood assuming that A is close to neutral and B is more oxidized than 1 + . This is consistent with the results of the quantum mechanical energy calculations discussed in Section 3.
A more important result we see here is, however, the unsystematic scattering of the arrows from A to Q at the right-side vertical axes. We can expect, for example, the monomers R and C in the 8:5 and 5:2 salts are probably less oxidized. Indeed, the C and R are far from the others in Figure 10a,b, but that is not the case in Figure 10c,d. Another difficulty is about K, L, M, and N in the 4:4 salt, where their average valence is most likely 1 + and higher than the others in the 8:5 and 5:2 salts. They are, however, inside the distribution.
It should be noted that Rosoka et al. [60] proposed an equation to estimate the effective valence by combining the bond lengths of the target molecule with those in the crystals of the neutral and cation radical salts. Although they succeeded in evaluating the TMTSF valence close to ( 2 / 3 ) + in (TMTSF) 3 (TFPB) 2 by the equation, we do not adopt their method in this study due to the low correlation in Figure 10. Instead, we carried out the quantum mechanical energy calculations, which consider all the information of each molecule not only the bond lengths but also bond angles, and even electron correlations.

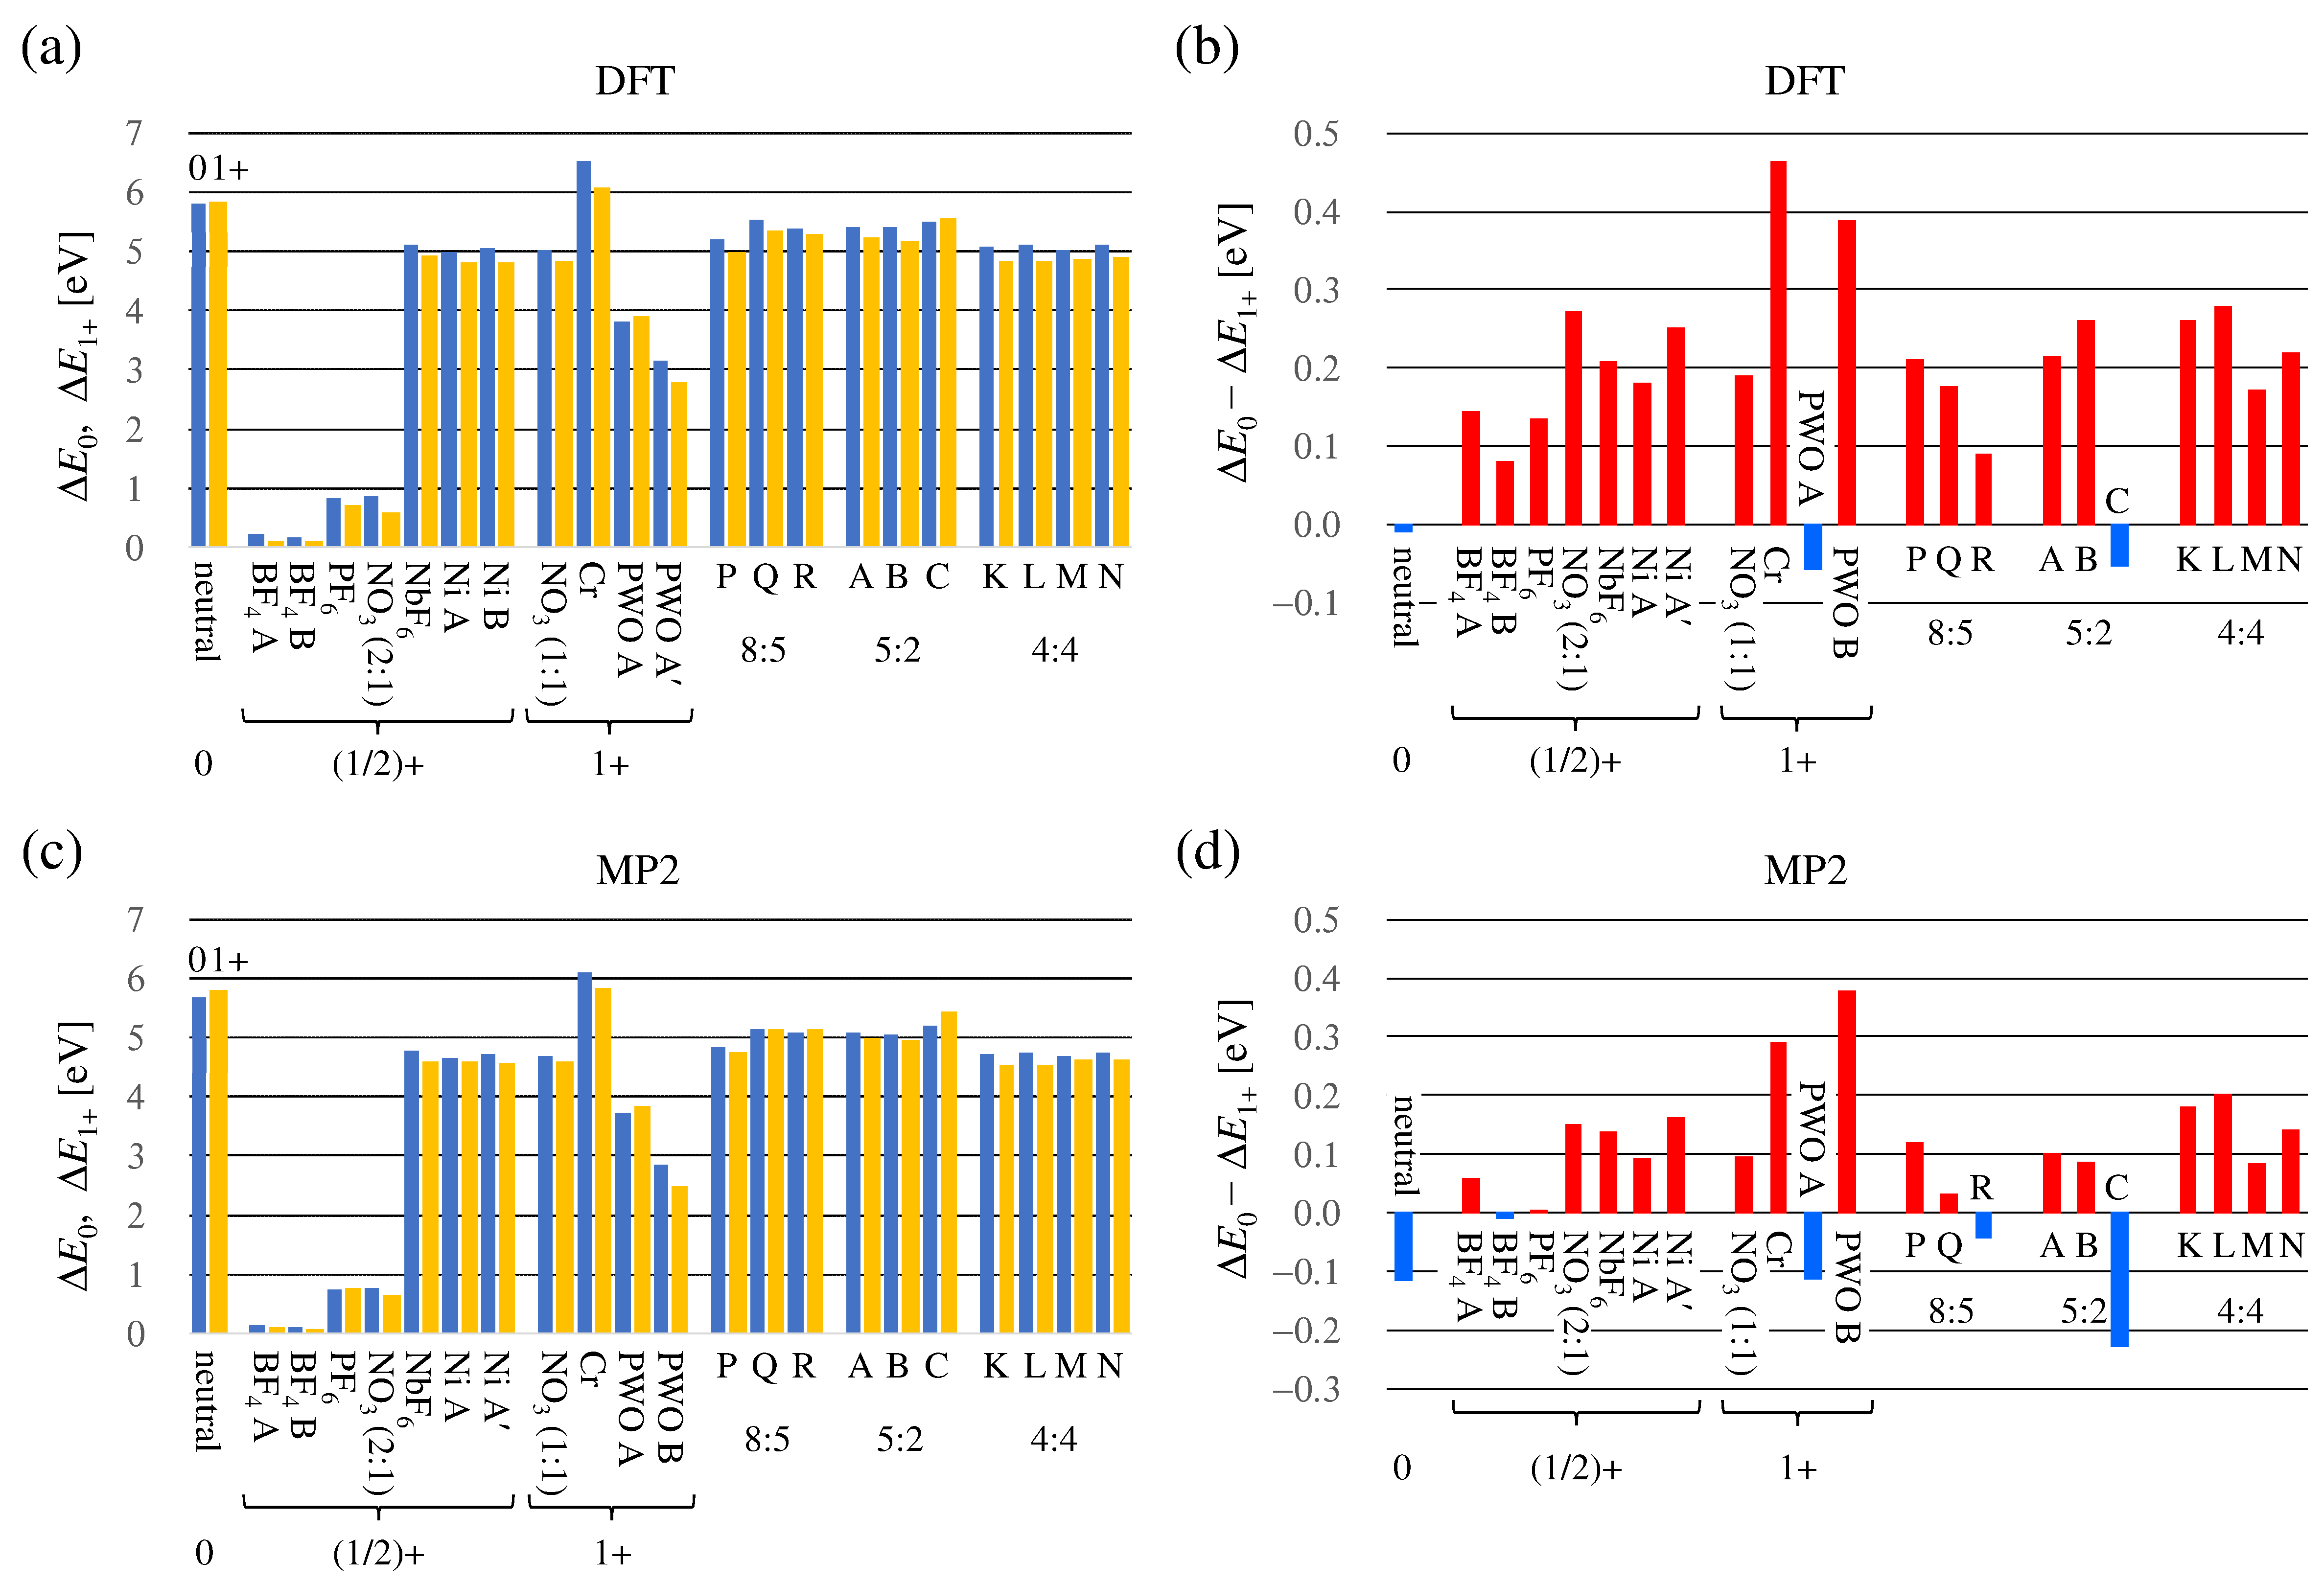
3.2. Valence of TMTSF Molecule Estimated from Total Energy
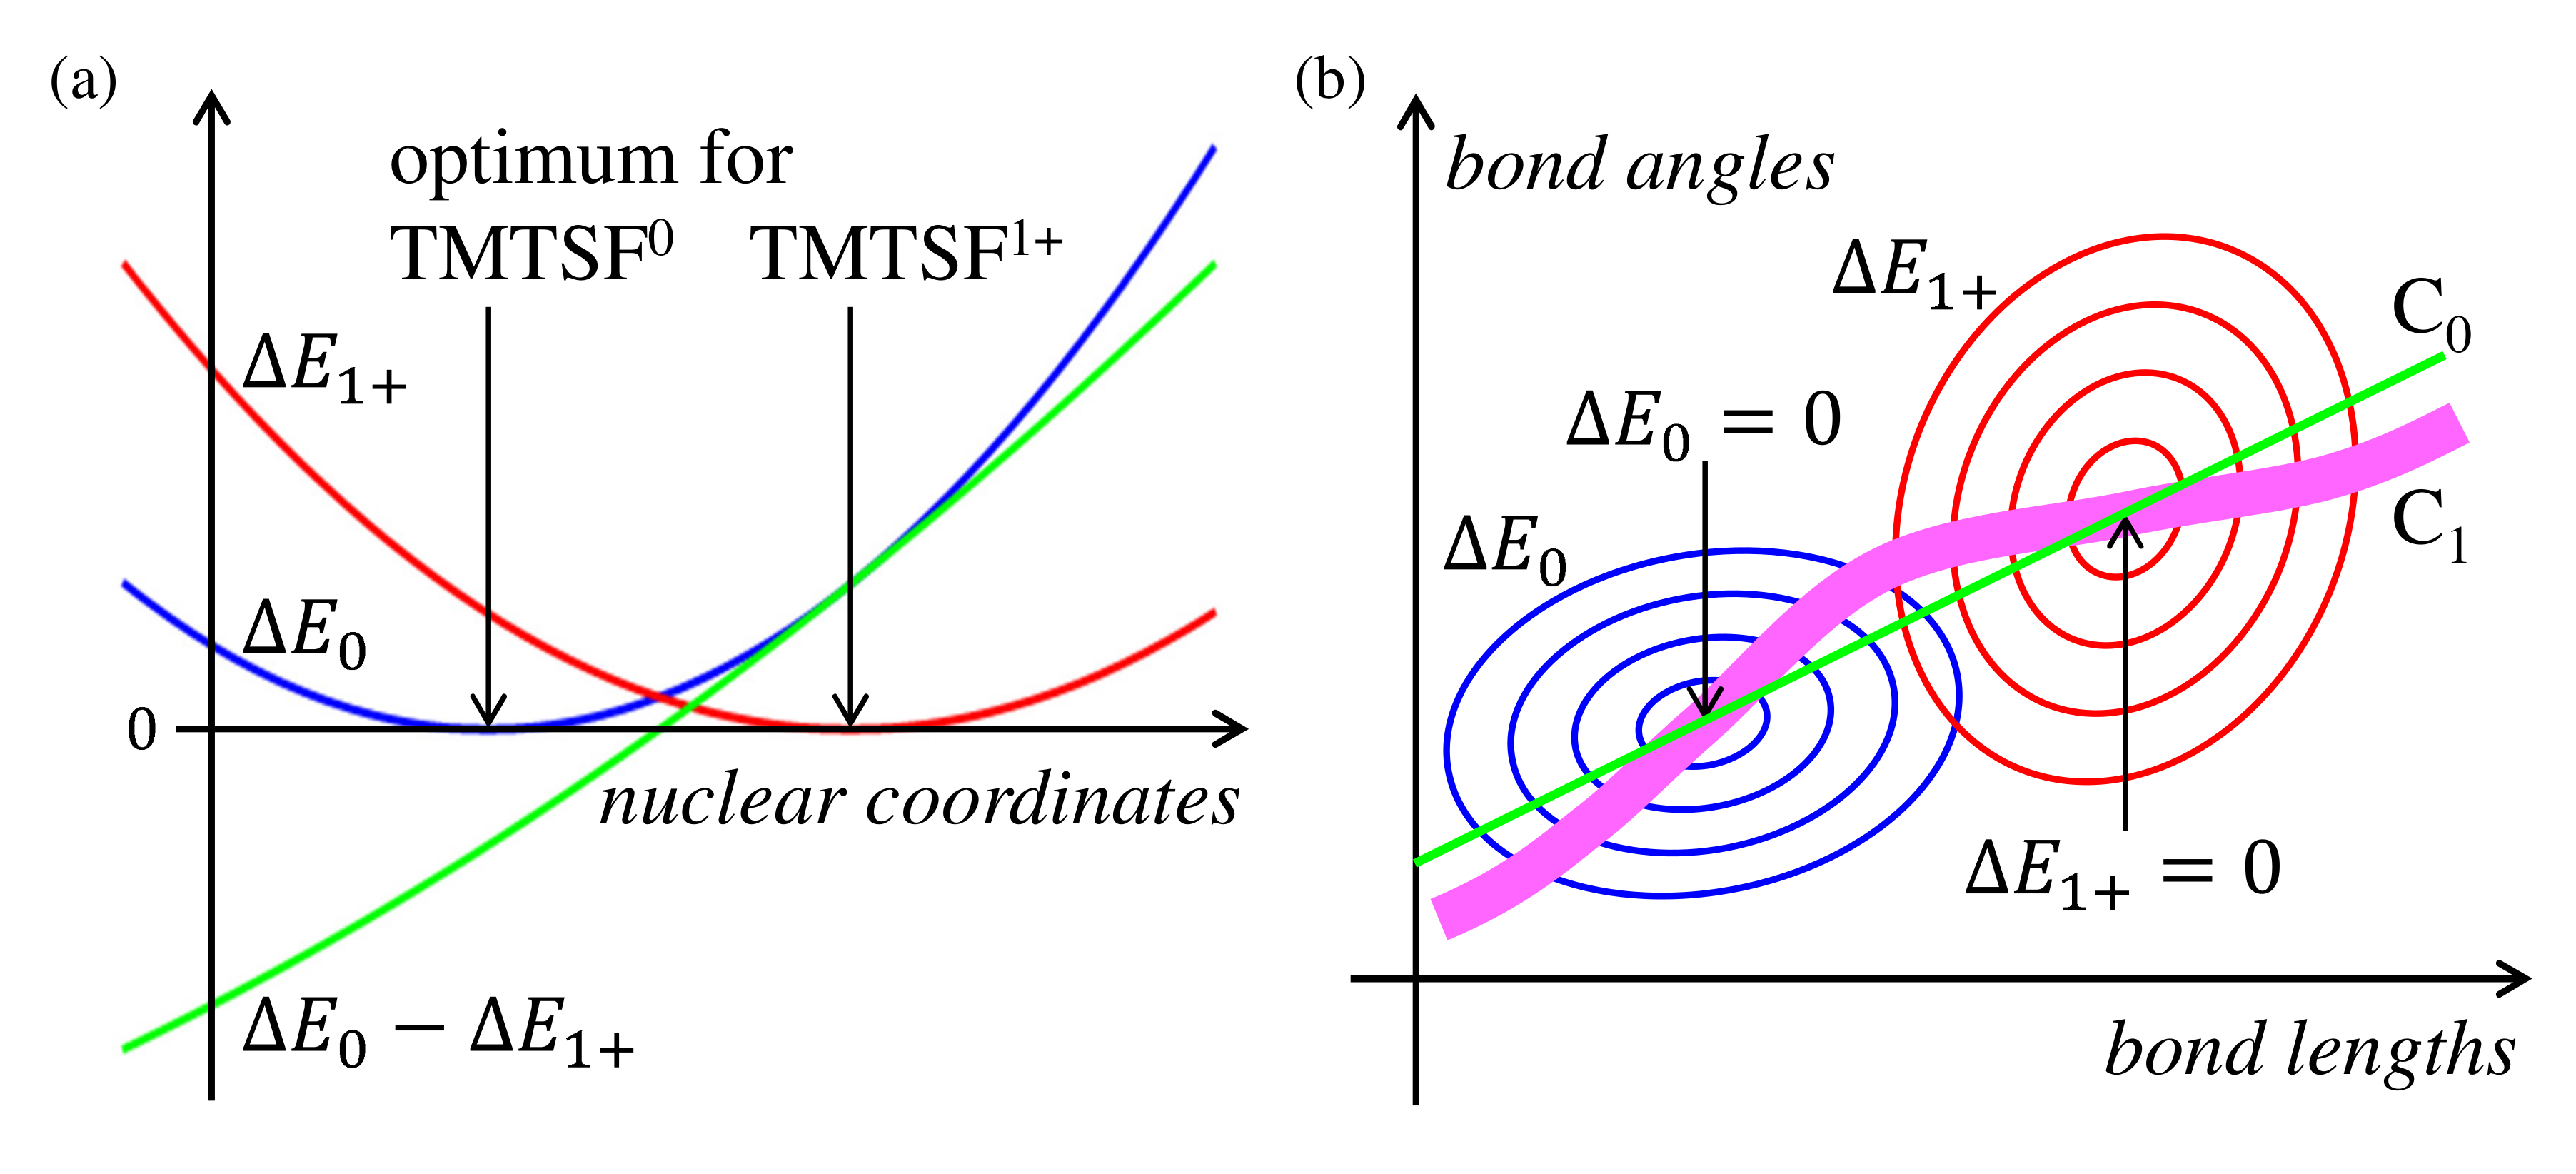
3.2.1. Principles

The method we propose here to estimate the valence of TMTSF molecules in the crystals is as follows. This is base on the quantum mechanical calculations with the DFT or MP2 method used in the previous subsection.
  • The optimized structures and their total energies of TMTSF 0 ( E 0 ( 0 ) = E 0 ( optimized   for 0 ) ) and TMTSF 1 + ( E 1 + ( 1 + ) = E 1 + ( optimized   for 1 + ) ) are calculated. Please note that the spin-unrestricted calculations are applied for cations; and all the electrons are considered in the MP2 calculations.
  • For example, for the TMTSF A in the 5:2 salt, the total energies of TMTSF 0 ( E 0 ( A ) ) and TMTSF 1 + ( E 1 + ( A ) ) are calculated using the crystallographic data.
  • The energy differences Δ E 0 = E 0 ( A ) E 0 ( 0 ) and Δ E 1 + = E 1 + ( A ) E 1 + ( 1 + ) are calculated. The Δ E 0 and Δ E 1 + should be positive since the conformation of A is not optimum both in the neutral and cationic states.
  • The difference Δ E 0 Δ E 1 + is used as a measure of the valence of A in the crystal.
The Δ E 0 and Δ E 1 + are the energy increase of the TMTSF molecule from those at its neutral and cationic states with their optimized conformations, respectively. Therefore, the Δ E 0 will be smaller than the Δ E 1 + when a TMTSF molecule in a crystal has a conformation which is more stable at a less oxidized state than at a more oxidized one. On the other hand, the Δ E 1 + will become smaller than the Δ E 0 when a conformation approaches to what is stable at a valence close to 1 + . In addition, if the effective valence of a molecule is ( 1 / 2 ) + with a conformation in a crystal, the Δ E 0 and Δ E 1 + will be comparable to each other. These are schematically shown in Figure 11a.
These relations are simply expressed by the Δ E 0 Δ E 1 + . The energy increase Δ E 0 and Δ E 1 + as functions of the nuclear coordinates/conformation are approximated by parabolas in the vicinity of their minima. Although the curvatures of the parabolas would be different from each other in general, the Δ E 0 Δ E 1 + changes monotonically as shown by the green curve in Figure 11a as long as the difference between the curvatures is not so large.
The green curve ( Δ E 0 Δ E 1 + ) becomes negatively and positively large at the bottom of the blue ( Δ E 0 ) and red ( Δ E 1 + ) curves, respectively. In addition, the green curve becomes almost zero when the Δ E 0 and Δ E 1 + are comparable to each other, where one can probably expect that the effective molecular valence is also in the middle between 0 and 1 + . When the effective molecular valence changes continuously from 0 to 1 + , the optimum conformation smoothly changes from that of TMTSF 0 to that of TMTSF 1 + on the horizontal axis. Then the Δ E 0 Δ E 1 will scale the molecular valence.
Actually the Δ E 0 and Δ E 1 + are multivariable functions of the nuclear coordinates. Thus, each of the red and blue curves in Figure 11a is just one aspect of the multidimensional paraboloid, which is schematically shown in the two-dimensional space in Figure 11b, where the atomic coordinates in Figure 11a are separated into the bond lengths and bond angles. Each of the Δ E 0 and Δ E 1 + is zero at a point in the multidimensional parametric space, where the molecule has the optimized conformation for each valence.
Using the Δ E 0 Δ E 1 + as a gauge of the valence corresponds to use the green line C 0 in Figure 11b connecting the points of Δ E 0 = 0 and Δ E 1 + = 0 . It corresponds to the green curve Δ E 0 Δ E 1 + in Figure 11a, when one adds the Δ E 0 Δ E 1 + as the third axis in Figure 11b.
In reality, the “paraboloids” would have rather complicated contours in the multidimensional space; and the Δ E 0 Δ E 1 + is not a curve but a multidimensional plane. In addition, even if the valence of a TMTSF molecule in a crystal is exactly 0 or 1 + , its conformation is not the optimum one. Therefore each TMTSF molecule in different crystals or even at different temperatures is somewhere on a thick path connecting the points of Δ E 0 = 0 and Δ E 1 + = 0 such as the pink curve C 1 in Figure 11b. The estimate of the effective molecular valence shown below will hold as long as the pink curve is not so thick and not far from the green line in the multidimensional space.

3.2.2. Energy Calculations

The results by the DFT and MP2 calculations are summarized in Table 3 and Table 4, respectively. The E 0 and E 1 + of the crystals are calculated by using the experimentally determined atomic coordinates whose significant figures are typically three or four. The change in the atomic positions from material to material results in the difference among the last four digits of the E 0 and E 1 + in the tables. Therefore we estimated that the resulting Δ E 0 Δ E 1 + would have three significant figures at most.
The energy differences Δ E 0 , Δ E 1 + , and Δ E 0 Δ E 1 + are shown as histograms in Figure 12. The results by the DFT calculations (Figure 12a,b) are similar to those by the MP2 (Figure 12c,d), but the latter is considered to be more plausible in the absolute values as described below.
At first glance, both the Δ E 0 and Δ E 1 + are almost the same for each TMTSF molecule in the crystals, thus one might feel that it does not tell anything. The large values (5–6 eV) in Figure 12a,c, just show the conformations of the TMTSF molecules are far from the optimized ones for the neutral and monocationic states.
It is, however, interesting that the results for the BF 4 , PF 6 , and NO 3 salts are very close to zero. This is probably because the crystal structures determined at low temperatures were used only for these salts, while the others are those at room temperature. It is reasonable because the optimized conformations by the calculations correspond to those at 0 K and no thermal oscillations are considered.
The relatively small size of the BF 4 , PF 6 , and NO 3 anions may contribute to suppress the Δ E 0 and Δ E 1 + . However, this is inconsistent with that the neutral crystal gives the large values. To find the conclusive results, we need the crystal structures of an identical material both at low and high temperatures, but the present authors could not find such reports. The atomic coordinate of hydrogen atoms is needed for this purpose, but it is often unavailable in early works.
Even though the thermal oscillations might affect the Δ E 0 and Δ E 1 + , their effect seems to be canceled to an extent after calculating the Δ E 0 Δ E 1 + as in Figure 12b,d. One can see a rough tendency that the Δ E 0 Δ E 1 + increases from negative to positive values as the effective valence changes from 0 to 1 + for the materials reported previously. This suggests that the effects making the Δ E 0 and Δ E 1 + large are regarded as systematic errors depending on materials. For example, the anharmonicity of the molecular vibrations always increase the bond lengths. This will increase both the Δ E 0 and Δ E 1 + in a similar manner.
One significant exception in the tendency is the smaller value for TMTSF 1 + in (TMTSF)NO 3 than those for TMTSF ( 1 / 2 ) + of (TMTSF) 2 NO 3 , (TMTSF) 2 NbF 6 , and (TMTSF) 2 Ni(tds) 2 . The reason is unclear, but it would be the representative showing the limitation of the present method to determine the absolute values of the effective valence as discussed in the previous subsection.
On the other hand, the negative and large positive values of the Δ E 0 Δ E 1 + for (TMTSF) 3 PW 12 O 40 (PWO A and B) are well understood as follows. The material has a “criss–cross” stacking of the monomer A and the dimer B–B along the a-axis [68]. As is shown in Figure 10, the bond lengths observed in the material are anomalous as TMTSF 1 + ; and suggest that A is close to neutral and B is more oxidized than 1 + . In Figure 12b,d, now we see that A and B show large negative and positive values of the Δ E 0 Δ E 1 + , respectively. If A is exactly neutral, the valence of B is ( 3 / 2 ) + due to PW 12 O 40 3 . This is consistent with the positively large Δ E 0 Δ E 1 + assuming also that we can extrapolate the relation between the effective valence and Δ E 0 Δ E 1 + to above 1 + .
By considering the variation in the materials as well as in the methods to determine their crystal structures, the correlation between the effective valence of the TMTSF molecules and the value Δ E 0 Δ E 1 + seems reasonably high. Despite the difficulty in determining the absolute value of the effective valence, it is probably possible to compare the degree of oxidation of the non-equivalent TMTSF molecules in the identical material as in (TMTSF) 3 PW 12 O 40 .

3.2.3. (TMTSF) 5 (I 3 ) 2

It should be noted that the crystal structure of (TMTSF) 2 PF 6 used for the DFT and MP2 calculations was obtained by the neutron diffraction. It means that the C−H bond lengths are less precise and shorter in the materials other than (TMTSF) 2 PF 6 (20 K) since neutrons are scattered by protons directly. It might change the Δ E 0 and Δ E 1 + of the others slightly from the actual values, but the change will probably cancel out each other in Δ E 0 Δ E 1 + .
Finally, we can estimate the valence of TMTSF molecules in the present I 3 salts.
At a glance, the large negative value of the monomer C is noticeable. This is the strong evidence that the monomer C in the 5:2 salt is close to neutral. Assuming it is exactly neutral, the valence of the donors in the stacks is estimated as ( 2 / 3 ) + on average because the 5:2 salt is regarded as a 3:2 salt by omitting C. We believe that each of A and B has almost the same valence ( 2 / 3 ) + as the Δ E 0 Δ E 1 + is almost the same.
Within the band picture, all of these seem consistent with the semiconducting behavior of the ρ . The one-dimensional stack made of the trimers will result in three separated energy bands. Then the lower two are filled, while the highest one remains empty at 0 K.
Another interesting possibility comes up when the upper two bands merge leaving the lowest third band apart. Then the upper band will be half-filled with highly one-dimensional nature. In such electronic systems, the Mott insulating state could be realized when the bandwidth is relatively small as compared with the on-site Coulomb energy [83]. The origin of the semiconducting state should be elucidated in a future work.

3.2.4. (TMTSF) 8 (I 3 ) 5

A simple picture of the oxidation of the TMTSF molecules in the 8:5 salt is obtained by assuming that R is almost neutral as it is a monomer. Then the molecules 4P + 2Q will have the charge of + 5 in total since the composition of the 8:5 salt is P:Q:R:I 3 = 4:2:2:5. In other words, the average valence of P and Q is ( 5 / 6 ) + . This is, however, not reasonable since the Δ E 0 Δ E 1 + of P and Q is smaller than that of the TMTSF ( 1 / 2 ) + of the 2:1 NO 3 , NbF 6 , and Ni(tds) 2 salts as in Figure 12d.
The monomer R has a smaller negative value than that of the monomer C in the 5:2 salt. This is not strange since the molecular plane of R is flat such as P and Q (Figure 1a), while C has a curved structure (Figure 5a). The small difference in the Δ E 0 Δ E 1 + among P, Q, and R probably suggests that all the TMTSF molecules in the 8:5 salt accompany to form energy bands and their average valence is considered to be ( 5 / 8 ) + as expected simply from the composition. On the other hand, P and R are probably the most and least oxidized, respectively, on the basis of the Δ E 0 Δ E 1 + in Figure 12d.
Even though the knowledge of the valence of TMTSF is available, the highly symmetric but the rather complicated donor arrangement of the 8:5 salt makes the discussion of its band structure difficult without any band calculations. The sixteen HOMO’s (highest occupied molecular orbitals) in one TMTSF layer will give the sixteen energy bands separated by narrow band gaps. When ten out of thirty two electrons in the HOMO’s are removed (5/16-filled by holes in total), the Fermi level will be inside such a small band gap. This picture is consistent with the weak metallic behavior of the ρ for I longest edge below room temperature, and also with the semiconducting behavior for I plane, respectively.
Or, in the real space picture, the possible difference in the effective valence of P, Q, and R probably implies that the electronic system is in a charge-disproportionated (or ordered) state in the 8:5 salt.

3.2.5. (TMTSF) 4 (I 3 ) 4 ·THF

The average of Δ E 0 Δ E 1 + of K, L, M, and L in the 4:4 salt is 0.151 eV and it is relatively high in Figure 12d. This is consistent with the average valence 1 + expected from the composition. On the other hand, we see that these crystallographically independent TMTSF molecules naturally give the relatively large distribution of Δ E 0 Δ E 1 + , namely 0.083 eV (M), 0.140 eV (N), 0.180 eV (K), and 0.201 eV (L), respectively.
The distribution poses an interesting possibility that some of the TMTSF molecules have the valence larger than a unity (>1+). One will easily understand that it is certainly possible by taking a look at the crystal structure in Figure 8a.
In a simplified picture, the 4:4 salt has an elongated rock-salt structure, but the cation and anion units are composed of not by single atoms such as Na + and Cl but by the tetramers of molecules. Therefore, the electrons do not have to distribute uniformly within each tetramer.
Indeed, the TMTSF molecules K and L are surrounded by more I 3 anions than M and N. Especially, the molecule M is next to a neutral THF molecule instead of an I 3 anion. Thus, the molecules K and L can possess more positive charge than M; and N will be in between them. Considering it like this, the order of the height of bars in Figure 12b,d is understood naturally.

3.2.6. Ionization Potentials

The difference between the total energy obtained for the optimized structure at “neutral” state ( E 0 ( optimized   for 0 ) ) and that for the “cationic” state ( E 1 + ( optimized   for 1 + ) ) corresponds to the adiabatic ionization potential I a of the TMTSF molecule as,
I a = E 1 + ( optimized   for 1 + ) E 0 ( optimized   for 0 ) .
On the other hand, the difference between E 0 ( optimized   for 0 ) and the total energy of the cationic state with the structure optimized for the “neutral” state ( E 1 + ( optimized   for 0 ) ) gives the vertical ionization energy I v as,
I v = E 1 + ( optimized   for 0 ) E 0 ( optimized   for 0 ) .
Comparison of the I a and I v values by the present calculations with the experimental ones will be a good test for knowing the reliability of the fundamental values of E 0 and E 1 + in Table 3 and Table 4.
By the present calculations, the values I a = 5.81 eV (DFT) and 5.65 eV (MP2); and I v = 6.09 eV (DFT) and 6.01 eV (MP2) are obtained for the isolated TMTSF molecule, while the values I a = 6.27 eV and I v = 6.58 eV were determined by the photoelectron spectroscopy for that in gas phase [84]. The calculated values are fairly close to the experimental ones, though the former is 7–9% smaller than the latter.
We confirmed that the agreement is much more improved (within ∼1%), when Møller–Plesset correlation energy calculations, in combination with the basis set cc-pVTZ, is truncated at fourth order (MP4(SDQ)), as I a = 6.17 eV and I v = 6.55 eV, respectively. Therefore, the results in Figure 12c,d will be further refined by the MP4 calculations (in progress), though it takes much longer machine time than the DFT and MP2 ones.

4. Materials and Methods

4.1. Sample Preparation

All the present I 3 salts were grown by the electrochemical oxidation using stick-type platinum electrodes.
The single crystals of the 8:5 and 5:2 salts were obtained from the mixed solution of TMTSF (22.7 mg) and tetrabutylammonium triiodide (8.7 mg) with THF (98%, 30 mL) as the solvent. The constant DC electrical current of 2 μ A was applied between electrodes for 143 h in air at 20 ° C.
The crystals of both the 8:5 and 5:2 salts grew together on the anode. The crystals are black cuboids for the 8:5 salt and black needle-like for the 5:2 salt, respectively. After the crystals were removed from the electrode, they were washed by ethanol and dried in air.
The single crystals of the 4:4 salt were obtained from the mixed solution of TMTSF (22.8 mg) and tetrabutylammonium triiodide (9.0 mg) with THF (98%, 30 mL) as the solvent. The constant DC electrical current of 5 μ A was applied between electrodes for 45 h in air at 20 ° C.
The crystals of the 4:4 salt grew on the anode, but the major product was the 5:2 salt. The crystals of the 4:4 salt are black plate-like and most of them are much larger than those of the 5:2 salt.

4.2. X-ray Crystal Structure Analysis

Data collections for the present I 3 salts were performed using a MSC Mercury CCD X-ray system (Rigaku, Tokyo, Japan) equipped with MoK α radiation ( λ = 0.7107 Å) at room temperature. All the structures were solved by the direct method using SHELXS-97 software package and were refined by the full-matrix least-squares method. The refinement data are summarized in Table 1.

4.3. Measurement of Electrical Resistivity

The electrical resistance was measured by a standard four-probe technique. Annealed gold wires (10 μ m in diameter) were attached as electrodes with carbon paste (XC-12, Fujikura-kasei Co., Tokyo, Japan). The DC electrical current of 1–10 μ A was applied by a current source (7651, Yokogawa, Tokyo, Japan) and the voltage signal was measured by a nano-volt/micro-ohm-meter (34420A, Keysight Technologies, Santa Rosa, CA, USA) or a digital multi-meter (34970A, Keysight Technologies, CA, USA). The polarity of the electrical current was switched to eliminate the parasitic voltage. Thus, the electrical resistance was determined as the slope of the voltage to the current. The electrical resistivity ρ was calculated using the size of each crystal assuming their shapes are rectangular.
The temperature dependence of the ρ at ambient pressure was measured in the vacuum chamber of a home-made cryostat. A clamped-type pressure cell made of BeCu was used for the measurement under pressure. We used Daphne 7373 (Idemitsu Kosan Co., Tokyo, Japan) as the pressure transmitting medium. The pressure inside was corrected by the clamped pressure at room temperature and the temperature dependence of the inside pressure in the previous reports [74,75].
After the measurement was finished, the lattice parameters of the samples #1908 and #1910 were determined by the X-ray diffraction pattern and they were identified as the 8:5 and 5:2 salts, respectively.

5. Conclusions

Three types of novel TMTSF salts (TMTSF) 8 (I 3 ) 5 , (TMTSF) 5 (I 3 ) 2 , and (TMTSF) 4 (I 3 ) 4 ·THF were synthesized and their crystal structures were solved at room temperature. The electrical resistivity was measured for (TMTSF) 8 (I 3 ) 5 and (TMTSF) 5 (I 3 ) 2 at ambient pressure and under hydrostatic pressure up to 1.73 GPa.
The X-ray crystal structure analyses revealed that the 8:5 and 5:2 salts have one-dimensional TMTSF stacks made of TMTSF trimers. The TMTSF stacks are separated by TMTSF monomers in these salts. On the other hand, the crystal structure of the 4:4 salt is regarded as an elongated rock-salt type, where a TMTSF tetramer is surrounded by six I 3 tetramers and vice versa.
The electrical resistivity of (TMTSF) 8 (I 3 ) 5 is metallic for the electrical current along the highest conducting direction. The resistivity shows rapid increase below 88 and 53 K suggesting two phase transitions or changes in electronic states. The analysis of the ρ revealed the possibility of the third change in the electronic state above 310 K.
The electrical resistivity of (TMTSF) 5 (I 3 ) 2 is semiconducting below room temperature. It shows the change in slope in the Arrhenius plot suggesting a kind of change in electronic state or a crossover from a wider-band-gap to a narrow-band-gap states around 190 K.
No large change in the behavior of the electrical resistivity was observed for the 8:5 and 5:2 salts by the application of hydrostatic pressures up to 1.73 GPa.
The valence of the crystallographically independent TMTSF molecules in the three I 3 salts has been estimated on the basis of the quantum mechanical calculations of the total energy. The method was found to give the plausible valence of each TMTSF molecule.
The large unit cell of the 8:5 salt is probably results in a number of energy bands separated by small band gaps. The estimated TMTSF valence ( ( 5 / 8 ) + on average) gives the band filled by 5/16 with holes in total, though crystallographically independent TMTSF molecules P, Q, and R are probably less oxidized in this order.
The electronic state of the 5:2 salt is semiconducting and this is consistent with the trimer structures with TMTSF ( 2 / 3 ) + since the TMTSF monomer C is most likely neutral.
The average valence of TMTSF molecules is 1 + in the 4:4 salt, but the quantum mechanical calculations and its crystal structure strongly suggest that the valence of two TMTSF molecules K and L in the tetramer is higher than 1 + .
It is concluded that the quantum mechanical energy calculations give relative change in the non-integer valence of TMTSF molecules in the I 3 salts, in spite of the limitation that the Gaussian package can accept only the integer valence as an input parameter for single molecule.
On the other hand, there exist more direct and powerful methods to determine not only valence but also the charge distribution within a molecule as well as a unit cell. For example, the electron density analysis based on the synchrotron X-ray diffraction has been successfully applied to investigate the charge-ordering transitions of α -(BEDT-TTF) 2 I 3 (BEDT-TTF = bis(ethylenedithio)tetrathiafulvalene) [85] and (TMTTF) 2 PF 6 (TMTTF = tetramethyltetrathiafulvalene) [86].
Please note that the Gaussian package provides a function to calculate the electron density map under the periodic boundary condition. In our calculation environment, however, the DFT calculations fail in case of, for example, the 4:4 salt due to the limitation of the number of atoms or basis sets. In addition, even though the electron density map has been obtained, there should be the problem in defining the borders between neighboring molecules to integrate the electron density numerically. This type of estimation of molecular valence in a crystal with a large unit cell will be another challenge.
The present method, however, provides a quick and convenient way to estimate the more precise valence of donors and acceptors than that just by comparing the bond lengths before trying a time-consuming method.

Author Contributions

Sample preparation, Y.I.; X-ray crystal structure analyses, R.T.; electrical resistivity measurements, H.Y., Y.I., Y.T. and C.M.; quantum-mechanical calculations, H.Y.; interpretation of results, H.Y.; writing—original draft preparation, H.Y.; All authors have read and agreed to the published version of the manuscript.

Funding

This work was supported by JSPS KAKENHI Grant Number JP25400380.

Conflicts of Interest

The authors declare no conflict of interest.

References

  1. Jérome, D.; Mazaud, A.; Ribault, M.; Bechgaard, K. Superconductivity in a synthetic organic conductor (TMTSF)2PF6. J. Phys. Lett. 1980, 41, L95–L98. [Google Scholar] [CrossRef] [Green Version]
  2. Bechgaard, K.; Carneiro, K.; Olsen, M.; Rasmussen, F.B. Zero-pressure organic superconductor: Di-(tetramethyltetraselenafulvalenium)-perchlorate [(TMTSF)2ClO4]. Phys. Rev. Lett. 1981, 46, 852–855. [Google Scholar] [CrossRef] [Green Version]
  3. Bechgaard, K.; Jacobsen, C.S.; Mortensen, K.; Pedersen, H.J.; Thorup, N. The properties of five highly conducting salts: (TMTSF)2X, X = PF 6 , AsF 6 , SbF 6 , BF 4 and NO 3 , derived from tetramethyltetraselenafulvalene (TMTSF). Solid State Commun. 1980, 33, 1119–1125. [Google Scholar] [CrossRef]
  4. Parkin, S.S.S.; Ribault, M.; Jérome, D.; Bechgaard, K. Superconductivity in the family of organic salts based on the tetramethyltetraselenafulvalene (TMTSF) molecule: (TMTSF)2X (X = ClO4, PF6, AsF6, SbF6, TaF6). J. Phys. C Solid State Phys. 1981, 14, 5305–5326. [Google Scholar] [CrossRef]
  5. Sakata, M.; Yoshida, Y.; Maesato, M.; Hagiwara, R. Preparation of superconducting (TMTSF)2NbF6 by electrooxidation of TMTSF using ionic liquid as electrolyte. Mol. Cryst. Liq. Cryst. 2006, 452, 103–112. [Google Scholar] [CrossRef]
  6. Parkin, S.S.S.; Jérome, D.; Bechgaard, K. Pressure dependence of the metal–insulator and superconducting phase transitions in (TMTSF)2ReO4. Mol. Cryst. Liq. Cryst. 1981, 79, 213–224. [Google Scholar]
  7. Rindorf, G.; Soling, H.; Thorup, N. The structures of di(2,3,6,7-tetramethyl-1,4,5,8-tetraselenafulvalenium) perrhenate, (TMTSF)2ReO4, and perchlorate, (TMTSF)2ClO4. Acta Cryst. B 1982, 38, 2805–2808. [Google Scholar] [CrossRef] [Green Version]
  8. Williams, J.M.; Beno, M.A.; Appelman, E.H.; Capriotti, J.M.; Wudl, F.; Aharon-Shalom, E.; Nalewajek, D. New (TMTSF)2X derivatives: A change in the selenium network dimensionality derived from the molecular and crystal structures of (TMTSF)2(FSO3) [T = 298K, 123K] and (TMTSF)2(BrO4) T = 298K. Mol. Cryst. Liq. Cryst. 1982, 79, 319–326. [Google Scholar] [CrossRef]
  9. Cox, S.; Boysel, R.M.; Moses, D.; Wudl, F.; Chen, J.; Ochsenbein, S.; Heeger, A.J.; Walsh, W.M., Jr.; Rupp, L.W., Jr. (TMTSF)2F2PO2: An unusual member of the (TMTSF)2X family of organic metals. Solid State Commun. 1984, 49, 259–263. [Google Scholar] [CrossRef]
  10. Soling, H.; Rindorf, G.; Thorup, N. Di(4,4′,5,5′-tetramethyl-Δ2,2′-bi-1,3-diselenolyliden)ium trifluoromethanesulfonate, C21H24F3O3SSe8, (TMTSF)2CF3SO3. Acta Cryst. C 1983, 39, 490–491. [Google Scholar] [CrossRef]
  11. Thorup, N.; Rindorf, G.; Soling, H.; Johannsen, I.; Mortensen, K.; Bechgaard, K. Structural studies of some (TMTSF)2X compounds. J. Phys.-Paris C 1983, 3, 1017–1020. [Google Scholar] [CrossRef]
  12. Beno, M.A.; Blackman, G.S.; Williams, J.M.; Bechgaard, K. Synthetic metals based on tetramethyltetraselenafulvalene (TMTSF): Synthesis, structure (T = 298 and 125 K), and novel properties of (TMTSF)2H2F3. Inorg. Chem. 1982, 21, 3860–3862. [Google Scholar] [CrossRef]
  13. Eriks, K.; Beno, M.A.; Bechgaard, K.; Williams, J.M. The structure of di(3,3′,4,4′-tetramethyl-2,2’,5,5′-tetraselenafulvalenium) pentafluorosilicate, (C10H11Se4)2SiF5 at 293 and 125 K. Acta Cryst. C 1984, 40, 1715–1717. [Google Scholar] [CrossRef] [Green Version]
  14. Nickel, J.C.; Duprat, R.; Bourbonnais, C.; Dupuis, N. Triplet superconducting pairing and density-wave instabilities in organic conductors. Phys. Rev. Lett. 2005, 95, 247001. [Google Scholar] [CrossRef] [Green Version]
  15. Rozhkov, A.V. Superconductivity without attraction in a quasi-one-dimensional metal. Phys. Rev. B 2009, 79, 224520. [Google Scholar] [CrossRef] [Green Version]
  16. Lebed, A.G. d-Wave-like nodal superconductivity in the organic conductor (TMTSF)2ClO4. Physica B 2012, 404, 1803–1805. [Google Scholar] [CrossRef] [Green Version]
  17. Tanaka, Y.; Kuroki, K. Microscopic theory of spin-triplet f-wave pairing in quasi-one-dimensional organic superconductors. Phys. Rev. B 2004, 70, 060502R. [Google Scholar] [CrossRef] [Green Version]
  18. Fuseya, Y.; Suzumura, Y. Superconductivity and density wave in the quasi-one-dimensional systems: Renormalization group study. J. Phys. Soc. Jpn. 2005, 74, 1263–1269. [Google Scholar] [CrossRef] [Green Version]
  19. Pouget, J.P.; Moret, R.; Comes, R.; Bechgaard, K.; Fabre, J.M.; Giral, L. X-ray diffuse scattering study of some (TMTSF)2X and (TMTTF)2X salts. Mol. Cryst. Liq. Cryst. 1982, 79, 129–143. [Google Scholar] [CrossRef]
  20. Andrieux, A.; Jérome, D.; Bechgaard, K. Spin-density wave ground state in the one-dimensional conductor (TMTSF)2PF6: Microscopic evidence from 77Se and 1H NMR experiments. J. Phys. Lett. 1981, 42, L87–L90. [Google Scholar] [CrossRef]
  21. Scott, J.C.; Pedersen, H.J.; Bechgaard, K. Proton NMR in the organic conductor tetramethyltetraselenafulvalinium hexafluorophosphate. Phys. Rev. B 1981, 24, 475–477. [Google Scholar] [CrossRef]
  22. Mortensen, K.; Tomkiewicz, Y.; Bechgaard, K. Antiferromagnetism in the organic conductor bis-tetramethyltetraselenafulvalene hexafluoroarsenate [(TMTSF)2AsF6]: Static magnetic susceptibility. Phys. Rev. B 1982, 25, 3319–3325. [Google Scholar] [CrossRef] [Green Version]
  23. Torrance, J.B.; Pedersen, H.J.; Bechgaard, K. Observation of antiferromagnetic resonance in an organic superconductor. Phys. Rev. Lett. 1982, 49, 881–884. [Google Scholar] [CrossRef] [Green Version]
  24. Walsh, W.M., Jr.; Wudl, F.; Aharon-Shalom, E.; Rupp, L.W., Jr.; Vandenberg, J.M.; Andres, K.; Torrance, J.B. Itinerant-electron antiferromagnetism precursor to superconductivity in an organic conductor. Phys. Rev. Lett. 1982, 49, 885–888. [Google Scholar] [CrossRef]
  25. Delrieu, J.M.; Roger, M.; Toffano, Z.; Moradpour, A.; Bechgaard, K. NMR proton lineshape in (TMTSF)2X: Incommensurability of nesting vector and order parameter. J. Phys. 1986, 47, 839–861. [Google Scholar] [CrossRef]
  26. Takahashi, T.; Maniwa, Y.; Kawamura, H.; Saito, G. Determination of SDW characteristics in (TMTSF)2PF6 by 1H-NMR analysis. J. Phys. Soc. Jpn. 1986, 55, 1364–1373. [Google Scholar] [CrossRef]
  27. Takahashi, T.; Maniwa, Y.; Kawamura, H.; Saito, G. Pressure dependence of SDW properties in the organic conductor, (TMTSF)2PF6. J. Phys. Soc. Jpn. 1989, 58, 703–709. [Google Scholar] [CrossRef]
  28. Kwak, J.F.; Schirber, J.E.; Greene, R.L.; Engler, E.M. Magnetic quantum oscillations in tetramethyltetraselenafulvalenium hexafluorophosphate [(TMTSF)2PF6]. Phys. Rev. Lett. 1981, 46, 1296–1299. [Google Scholar] [CrossRef]
  29. Bando, H.; Oshima, K.; Suzuki, M.; Kobayashi, H.; Saito, G. Shubnikov–de Haas effect in (TMTSF)2ClO4. J. Phys. Soc. Jpn. 1982, 51, 2711–2712. [Google Scholar] [CrossRef]
  30. Chaikin, P.M.; Choi, M.-Y.; Kwak, J.F.; Brooks, J.S.; Martin, K.P.; Naughton, M.J.; Engler, E.M.; Greene, R.L. Tetramethyltetraselenafulvalenium perchlorate, (TMTSF)2ClO4, in high magnetic fields. Phys. Rev. Lett. 1983, 51, 2333–2336. [Google Scholar] [CrossRef]
  31. Azevedo, L.J.; Williams, J.M.; Compton, S.J. Field-induced magnetic order in bis-tetramethyltetraselenafulvalenium perchlorate (TMTSF)2ClO4. Phys. Rev. B 1983, 28, 6600–6602. [Google Scholar] [CrossRef]
  32. Takahashi, T.; Jérome, D.; Bechgaard, K. An NMR study of the organic superconductor: (TMTSF)2ClO4. J. Phys. 1984, 45, 945–952. [Google Scholar] [CrossRef] [Green Version]
  33. Montambaux, G.; Héritier, H.; Lederer, P. Spin susceptibility of the two-dimensional electron gas with open Fermi surface under magnetic field. Phys. Rev. Lett. 1985, 55, 2078–2081. [Google Scholar] [CrossRef] [PubMed]
  34. Yamaji, K. Theory of field-induced spin-density-wave in Bechgaard salts. Synth. Met. 1986, 13, 29–43. [Google Scholar] [CrossRef]
  35. Maki, K. Thermodynamics of field-induced spin-density-wave states in Bechgaard salts. Phys. Rev. B 1986, 33, 4826–4829. [Google Scholar] [CrossRef]
  36. Lebed, A.G.; Bak, P. Theory of unusual anisotropy of magnetoresistance in organic superconductors. Phys. Rev. Lett. 1989, 63, 1315–1317. [Google Scholar] [CrossRef]
  37. Boebinger, G.S.; Montambaux, G.; Kaplan, M.L.; Haddon, R.C.; Chichester, S.V.; Chiang, L.Y. Anomalous magnetoresistance anisotropy in metallic and spin-density-wave phases of the quasi-one-dimensional organic conductor (TMTSF)2ClO4. Phys. Rev. Lett. 1990, 64, 591–594. [Google Scholar] [CrossRef]
  38. Osada, T.; Kawasumi, A.; Kagoshima, S.; Miura, N.; Saito, G. Commensurability effect of magnetoresistance anisotropy in the quasi-one-dimensional conductor tetramethyltetraselenafulvalenium perchlorate, (TMTSF)2ClO4. Phys. Rev. Lett. 1991, 66, 1525–1528. [Google Scholar] [CrossRef]
  39. Osada, T.; Kagoshima, S.; Miura, N. Resonance effect in magnetotransport anisotropy of quasi-one- dimensional conductors. Phys. Rev. B 1992, 46, 1812–1815. [Google Scholar] [CrossRef]
  40. Danner, G.M.; Kang, W.; Chaikin, P.M. Measuring the Fermi surface of quasi-one-dimensional metals. Phys. Rev. Lett. 1994, 72, 3714–3717. [Google Scholar] [CrossRef]
  41. Lee, I.J.; Naughton, M.J. Effective electrons and angular oscillations in quasi-one-dimensional conductors. Phys. Rev. B 1998, 57, 7423–7426. [Google Scholar] [CrossRef]
  42. Osada, T. Novel angular effect and electron orbital motion in quasi-one-dimensional conductors. Synth. Met. 1997, 86, 2143–2144. [Google Scholar] [CrossRef]
  43. Lebed, A.G.; Bagmet, N.N. Nonanalytical magnetoresistance, the third angular effect, and a method to investigate Fermi surfaces in quasi-one-dimensional conductors. Phys. Rev. B 1997, 55, R8654–R8657. [Google Scholar] [CrossRef]
  44. Yoshino, H.; Murata, K. Origin of the third angular effect of magnetoresistance of quasi-one-dimensional metals. J. Phys. Soc. Jpn. 1999, 68, 3027–3033. [Google Scholar] [CrossRef]
  45. Bechgaard, K.; Kistenmacher, T.J.; Bloch, A.N.; Cowan, D.O. The crystal and molecular structure of an organic conductor from 4,4′,5,5′-tetramethyl-Δ2,2′-bis-1,3-diselenole and 7,7,8,8,-tetracyano-p-quinodimethane [TMTSF–TCNQ]. Acta Cryst. B 1977, 33, 417–422. [Google Scholar] [CrossRef]
  46. Kistenmacher, T.J.; Emge, T.J.; Bloch, A.N.; Cowan, D.O. Structure of the red, semiconducting form of 4,4′5,5′-tetramethyl-Δ2,2′-bi-1,3-deselenole-7,7,8,8,-tetracyano-p-quinodimethane, TMTSF–TCNQ. Acta Cryst. B 1982, 38, 1193–1199. [Google Scholar] [CrossRef]
  47. Andersen, J.R.; Bechgaard, K.; Jacobsen, C.S.; Rindorf, G.; Soling, H.; Thorup, N. The crystal and molecular structure of the organic conductor 2,3,6,7-tetramethyl-1,3,5,8-tetraselenafulvalenium 2,5-dimethyl-7,7,8,8-tetracyano-p-quinodimethanide (TMTSF–DMTCNQ). Acta Cryst. B 1978, 34, 1901–1905. [Google Scholar] [CrossRef]
  48. Stokes, J.P.; Emge, T.J.; Bryden, W.A.; Chappell, J.S.; Cowan, D.O.; Poehler, T.O.; Bloch, A.N.; Kistenmacher, T.J. (TMTSF)2(2,5-TCNQBr2): Structure and physical properties. Mol. Cryst. Liq. Cryst. 1982, 79, 327–336. [Google Scholar] [CrossRef]
  49. Konovalikhin, S.V.; D’yachenko, O.A.; Shilov, G.V.; Spitsyna, N.G.; Van, K.V.; Yagubskii, E.B. Crystal structure of a new molecular complex of fullerene with tetramethyltetraselenafulvalene: C60·TMTSF·2CS2. Russ. Chem. B+ 1997, 46, 1415–1420. [Google Scholar] [CrossRef]
  50. Konovalikhin, S.V.; Dyachenko, O.A.; Shilov, G.V.; Spitsyna, N.G.; Yagubskii, E.B. Crystal and molecular structure of a new complex of [60]fullerene, 2(C60)·2(TMTSF)·(C6H6). Fullerene Sci. Techn. 1998, 6, 563–575. [Google Scholar] [CrossRef]
  51. Heuer, W.B.; Hoffman, B.M. A novel phase transition in conductive molecular crystals based on metal bis-diselenoalkene complexes: [TMTSF]2[M{Se2C2(CF3)2}2]; M = Ni, Pt; TMTSF = tetremethyltetraselenafulvalene. J. Chem. Soc. Chem. Commun. 1986, 174–175. [Google Scholar] [CrossRef]
  52. Heuer, W.B.; Squattrito, P.J.; Hoffman, B.M.; Ibers, J.A. Phase transition in the conductive molecular crystals bis(tetramethyltetraselenafulvalene)[bis(trifluoromethyl)ethylene]diselenolatonickel and -platinum, [TMTSF]2[M(tds)2], M = Ni, Pt. Relation to the Copper Analogue. J. Am. Chem. Soc. 1988, 110, 792–803. [Google Scholar] [CrossRef]
  53. Morgado, J.; Alcácer, L.; Almeida, M. Electrical resistivity and thermoelectric power of (TMTSF)2M(tds)2, M = Pt, Cu and Ni; evidence for the existence of two different phases. Solid State Commun. 1994, 89, 755–759. [Google Scholar] [CrossRef]
  54. Kazheva, O.N.; Chekhlov, A.N.; Alexandrov, G.G.; Buravov, L.I.; Kravchenko, A.V.; Starodub, V.A.; Sivaev, I.B.; Bregadze, V.I.; Dyachenko, O.A. Synthesis, structure and electrical conductivity of fulvalenium salts of cobalt bis(dicarbollide) anion. J. Organomet. Chem. 2006, 691, 4225–4233. [Google Scholar] [CrossRef]
  55. Kazheva, O.N.; Alexandrov, G.G.; Kravchenko, A.V.; Starodub, V.A.; Sivaev, I.B.; Lobanova, I.A.; Bregadze, V.I.; Bravov, L.I.; Dyachenko, O.A. New fulvalenium salts of bis(dicarbollide) cobalt and iron: Synthesis, crystal structure and electrical conductivity. J. Organomet. Chem. 2007, 692, 5033–5043. [Google Scholar] [CrossRef]
  56. Penicaud, A.; Batail, P.; Bechgaard, K.; Sala-Pala, J. A conductive tetramethyltetraselenafulvalenium salt based on a divalent oxalato-bridged bis-(tetrafluorometallate) complex: (TMTSF)3[Ti2F8(C2O4)]. Synth. Met. 1988, 22, 201–207. [Google Scholar] [CrossRef]
  57. Ouahab, L.; Paiou, J.; Grandjean, D.; Garrigou–Langrange, C.; Delhaes, P.; Bencharif, M. Charge transfer salts obtained with organic donors (TTF, TMTTF, TMTSF, and BEDT-TTF) and tetracyanometallate planar dianions [M(CN) 4 2 , M = PtII, NiII]. J. Chem. Soc. Chem. Commun. 1998, 1038–1041. [Google Scholar] [CrossRef]
  58. Triki, S.; Ouahab, L.; Paidou, J.; Grandjean, D. The use of polyoxometallates as acceptors in charge transfer salts: Preparation, X-ray crystal structures, and preliminary spectroscopic characterizations of D3M6O19, D = TTF, TMTSF; M = Mo, W. J. Chem. Soc. Chem. Commun. 1998, 1068–1070. [Google Scholar] [CrossRef]
  59. Turner, S.S.; Le Pevelen, D.; Day, P.; Prout, K. TTF based charge transfer salts of [Cr(NCS)4(phen)]: Bulk magnetic order and crystal structures of the TTF, TMTTF (tetramethyltetrathiafulvalene) and TMTSF (tetramethyltetraselenafulvalene) derivatives. J. Chem. Soc. Dalton Trans. 2000, 2739–2744. [Google Scholar] [CrossRef]
  60. Rosokha, S.V.; Stern, C.L.; Ritzert, J.T. π-bonded molecular wires: Self-assembly of mixed-valence cation-radical stacks within the nanochannels formed by inert tetrakis[3,5-bis(trifluoromethyl)phenyl]borate anions. CrystEngComm 2013, 15, 10638. [Google Scholar] [CrossRef]
  61. Mroweh, N.; Mézière, C.; Allain, M.; Auban–Senzier, P.; Canadell, E.; Avarvari, N. Conservation of structural arrangements and 3:1 stoichiometry in a series of crystalline conductors of TMTTF, TMTSF, BEDT-TTF, and chiral DM-EDT-TTF with the oxo-bis[pentafluorotantalate(V)] dianion. Chem. Sci. 2020, 11, 10078–10091. [Google Scholar] [CrossRef]
  62. Penicaud, A.; Batail, P.; Perrin, C.; Coulon, C.; Parkin, S.S.P.; Torrance, J.B. First cation radical mixed-valence hybrid salts of the paramagnetic octahedral cluster Nb6Cl183−. Preparation, crystal structures, and conducting and magnetic properties of pentakis[2,3,6,7-tetramethyl-1,4,5,8-tetra-selena- and -thia-fulvalenium) hexachloro(dodeca-μ2-chloro-octahedro-hexaniobate). J. Chem. Soc. Chem. Commun. 1987, 330–332. [Google Scholar] [CrossRef]
  63. Pénicaud, A.; Batail, P.; Coulon, C.; Canadell, E.; Perrin, C. Novel redox properties of the paramagnetic hexanuclear niobium cluster halide Nb6Cl183− and the preparation, structures, and conducting and magnetic properties of its one-dimensional mixed-valence tetramethyltetra(selena and thia)fulvalenium salts: [TMTSF and TMTTF]5[Nb6Cl18]·(CH2Cl2)0.5. Chem. Mater. 1990, 2, 123–132. [Google Scholar]
  64. Reinheimer, E.W.; Galán-Mascarós, J.R.; Cómez-García, C.J.; Zhao, H.; Fourmigué, M.; Dunbar, K.R. Radical salts of TTF derivatives with the metal–metal bonded [Re2Cl8]2− anion. J. Mol. Struct. 2008, 890, 81–89. [Google Scholar] [CrossRef]
  65. Kobayashi, H.; Kobayashi, A.; Sasaki, Y.; Saito, G.; Inokuchi, H. The crystal structure of tetramethyltetraselenafulvalenium perrheneate, (TMTSF)(ReO4)(C2H3Cl3)0.25. Bull. Chem. Soc. Jpn. 1983, 56, 2894–2898. [Google Scholar] [CrossRef]
  66. Batail, P.; Ouahab, L.; Torrance, J.B.; Pylman, M.L.; Parkin, S.S.P. Cation radical salts with magnetic anions: Preparation and characterization of FeCl4 salts of TMTTF and TMTSF. Solid State Commun. 1985, 55, 597–600. [Google Scholar] [CrossRef]
  67. Batail, P.; Ouahab, L. Effect of anion volume on dimensionality of radical cation salts. Mol. Cryst. Liq. Cryst. 1985, 125, 205–214. [Google Scholar] [CrossRef]
  68. Ouahab, L.; Grandjean, D. Structure of tris(3,3′,4,4′-tetramethyl-2,2’5,5′-tetraselenafulvalenium) phosphododecatungstate: (TMTSF)3PW12O40. Acta Cryst. C 1991, 47, 2670–2672. [Google Scholar] [CrossRef]
  69. Wu, L.Y.; Coppens, P.; Bu, X.H. Crystal structure of tetramethyltetraselenafulvalene nitrate, (C10H12Se4)NO3. Z. Krist.-New Cryst. St. 1997, 212, 101–102. [Google Scholar] [CrossRef]
  70. Chang, H.-C.; Kitagawa, S.; Kondo, M.; Ishii, T. Structural, spectroscopic and magnetic properties of charge-transfer complex, (TMTSF)[Cr(Cl4SQ)2(Cl4Cat)]·0.5CH2Cl2. Mol. Cryst. Liq. Cryst. 1999, 335, 183–192. [Google Scholar] [CrossRef]
  71. Chang, H.-C.; Ishii, T.; Kondo, M.; Kitagawa, S. Synthesis, X-ray crystal structures and properties of chromium complexes with semiquinonate and catecholate. J. Chem. Soc. Dalton Trans. 1999, 2467–2476. [Google Scholar] [CrossRef]
  72. Pauling, L. The Nature of the Chemical Bond, 3rd ed.; Cornell Univ. Press: Ithaca, NY, USA, 1960; p. 260. [Google Scholar]
  73. Bondi, A. van der Waals volumes and radii. J. Phys. Chem. 1964, 441–448. [Google Scholar] [CrossRef]
  74. Murata, K.; Yoshino, H.; Yadav, H.O.; Honda, Y.; Shirakawa, N. Pt resistor thermometry and pressure calibration in a clamped pressure cell with the medium, Daphne 7373. Rev. Sci. Instrum. 1997, 68, 2490–2493. [Google Scholar] [CrossRef]
  75. Yokogawa, K.; Murata, K.; Yoshino, H.; Aoyama, S. Solidification of high-pressure medium Daphne 7373. Jpn. J. Appl. Phys. 2007, 46, 3636–3639. [Google Scholar] [CrossRef]
  76. Kistenmacher, T.J.; Emge, T.J.; Shu, P.; Cowan, D.O. 4,4′,5,5′-tetramethyl-Δ2,2′-bis-1,3-diselenole, TMTSF. Acta Cryst. B 1979, 35, 772–775. [Google Scholar] [CrossRef]
  77. Emge, T.J.; Wang, H.H.; Beno, M.A.; Williams, J.M.; Whangbo, M.-H.; Evain, E. Effect of anion ordering on the H-anion interactions and band electronic structure of (TMTSF)2BF4 at 20 K. J. Am. Chem. Soc. 1986, 108, 8215–8223. [Google Scholar] [CrossRef]
  78. Gallois, B.; Gaultier, J.; Hauw, C.; Lamcharfi, T.D.; Filhol, A. Neutron low-temperature (4 and 20 K) and X-ray high-pressure (6.5×10² and 9.8×10² MPa) structures of the organic superconductor di(2,3,6.7-tetramethyl-1,4,5,8-tetraselenafulvalenium) hexafluorophosphate, (TMTSF)2PF6. Acta Cryst. B 1986, 42, 564–575. [Google Scholar] [CrossRef]
  79. Thorup, N.; Rindorf, G.; Soling, H.; Bechgaard, K. The structure of di(2,3,6,7-tetramethyl-1,4,5,8- tetraselenafulvalenium) hexafluorophosphate, (TMTSF)2PF6, the first superconducting organic solid. Acta Cryst. B 1981, 37, 1236–1240. [Google Scholar] [CrossRef]
  80. Beno, M.A.; Daws, C.A.; Wang, H.H.; Williams, J.M. Novel structural features, and their relationship to the electrical properties, of the organic conductor (TMTSF)2NO3 at 298 K and 125 K. Mol. Cryst. Liq. Cryst. 1984, 116, 153–171. [Google Scholar] [CrossRef]
  81. Kistenmacher, T.J. Anion symmetry and the separability of structural parameters for tetramethyltetraselenafulvalenium salts, (TMTSF)2X. Mol. Cryst. Liq. Cryst. 1986, 136, 361–382. [Google Scholar] [CrossRef]
  82. Frisch, M.J.; Trucks, G.W.; Schlegel, H.B.; Scuseria, G.E.; Robb, M.A.; Cheeseman, J.R.; Scalmani, G.; Barone, V.; Petersson, G.A.; Nakatsuji, H.; et al. Gaussian 16, Revision C.01; Gaussian, Inc.: Wallingford, CT, USA, 2019. [Google Scholar]
  83. Emery, V.J.; Bruinsma, R.; Barišić, S. Electron-electron Umklapp scattering in organic superconductors. Phys. Rev. Lett. 1982, 48, 1039–1043. [Google Scholar] [CrossRef]
  84. Gleiter, R.; Kobayashi, M.; Spanget-Larsen, J.; Ferraris, J.P.; Bloch, A.N.; Bechgaard, K.; Cowan, D.O. Photoelectron and electronic absorption spectra of tetrathiafulvalene and related compounds. Ber. Bursenges. Phys. Chem. 1975, 79, 1218. [Google Scholar] [CrossRef]
  85. Kakiuchi, T.; Wakabayashi, Y.; Sawa, H.; Takahashi, T.; Nakamura, T. Charge ordering in α-(BEDT-TTF)2I3 by synchrotron X-ray diffraction. J. Phys. Soc. Jpn. 2007, 76, 113702. [Google Scholar] [CrossRef] [Green Version]
  86. Kitou, S.; Fujii, T.; Kawamoto, T.; Katayama, N.; Maki, S.; Nishibori, E.; Sugimoto, K.; Takata, M.; Nakamura, T.; Sawa, H. Sawa, Successive dimensional transition in (TMTTF)2PF6 revealed by synchrotron X-ray diffraction. Phys. Rev. Lett. 2017, 119, 065701. [Google Scholar] [CrossRef]
Figure 1. The crystal structure of (TMTSF) 8 (I 3 ) 5 at room temperature viewed along (a) the c-axis and (b) the b-axis. The crystallographically independent TMTSF molecules are labeled P, Q, and R, respectively.
Crystals 10 01119 g001
Figure 2. Donor arrangement in a half unit cell of (TMTSF) 8 (I 3 ) 5 . Hydrogen atoms are not shown for clarity. The crystallographically independent TMTSF molecules are labeled P, Q, and R, respectively. The broken lines show the Se⋯Se contacts shorter than 4.0 Å, namely the sum of van der Waals radii of two Se atoms (see text). The interplanar distance between P and Q is d 1 = 3.56 ( 1 ) Å; and that between P and P is d 2 = 3.559 ( 8 ) Å, respectively.
Crystals 10 01119 g002
Figure 3. Some molecules in the unit cell of (TMTSF) 8 (I 3 ) 5 selected to show the three types of disorders. (1) The conformational disorder of three methyl groups at the carbons C5, C9, and C10. (2) The positional disorder of the I 3 anions of I4–I5–I6 and I7–I8–I9. (3) The orientational disorder of the I 3 anions of I11–I10–I12 and I11B–I10–I12B.
Crystals 10 01119 g003
Figure 4. (a) Temperature dependence of the electrical resistivity ρ of (TMTSF) 8 (I 3 ) 5 measured perpendicular to the most grown crystal surface. (b) Arrhenius plot of the same data in (a). Please note that the values in the horizontal axis is T but the scale is linear in T 1 . (c) Numerical derivative of the Arrhenius plot in (b) calculated after smoothing the data. A series of data at each pressure was shifted from one another for clarity. The arrows at high temperatures indicate the subtle anomalies caused by the solidification of the pressure medium (see text). (d) Temperature–pressure phase diagram of (TMTSF) 8 (I 3 ) 5 below 150 K.
Crystals 10 01119 g004
Figure 5. The crystal structure of (TMTSF) 5 (I 3 ) 2 at room temperature viewed along (a) the a-axis and (b) the (b + c)-direction, respectively. The crystallographically independent TMTSF molecules are labeled A, B, and C.
Crystals 10 01119 g005
Figure 6. Donor arrangement in (TMTSF) 5 (I 3 ) 2 . Hydrogen atoms are not shown for clarity. The crystallographically independent TMTSF molecules are labeled A, B, and C, respectively. The broken lines show the Se⋯Se contacts shorter than the sum of van der Waals radii of two Se atoms (4.0 Å). The interplanar distance between A and B is d 1 = 3.45 ( 3 ) Å; and that between B and B is d 2 = 3.39 ( 4 ) Å, respectively.
Crystals 10 01119 g006
Figure 7. (a) Temperature dependence of the electrical resistivity ρ of (TMTSF) 5 (I 3 ) 2 measured along the longest crystal edges. (b) Arrhenius plot of the same data in (a). Please note that the values in the horizontal axis is T but the scale is linear in T 1 .
Crystals 10 01119 g007
Figure 8. The crystal structure of (TMTSF) 4 (I 3 ) 4 ·THF at room temperature viewed along (a) the b-axis and (b) a-axis, respectively. The crystallographically independent TMTSF molecules are labeled K, L, M, and N. The molecules in a half unit cell is shown in each of (a,b).
Crystals 10 01119 g008
Figure 9. Donor arrangement in a tetramer of (TMTSF) 4 (I 3 ) 4 ·THF. Hydrogen atoms are not shown for clarity. The crystallographically independent TMTSF molecules are labeled K, L, M and N, respectively. The broken lines show the Se⋯Se contacts shorter than 4.0 Å. The interplanar distances are d 1 = 3.599 ( 5 ) Å (K–L), d 2 = 3.92 ( 7 ) Å (L–M), and d 3 = 3.53 ( 2 ) Å (M–N), respectively.
Crystals 10 01119 g009
Figure 10. Dependence of the bond lengths (a) e, (b) f ¯ , (c) g ¯ , and (d) h ¯ of the TMTSF molecules in the crystals on the valence expected from their chemical compositions. The open and closed circles show the corresponding bond lengths in the optimized structures by the quantum mechanical calculations (see text and the caption in Table 2). The solid lines are guides to the eye.
Crystals 10 01119 g010
Figure 11. (a) Schematic image of Δ E 0 (red), Δ E 1 + (blue), and Δ E 0 Δ E 1 + (green) as functions of the nuclear coordinates of a TMTSF molecule in a crystal. (b) Simplified images of Δ E 0 and Δ E 1 + as multidimensional paraboloids, which are the functions of bond lengths and bond angles of a TMTSF molecule in a crystal. The thin green line C 0 represents the path when the conformation changes continuously keeping the optimum one at each effective valence. In reality, the molecular conformations are not optimum in crystals, thus the molecules will be somewhere on the thick pink curve C 1 (see text).
Crystals 10 01119 g011
Figure 12. Visualization of (a) Δ E 0 and Δ E 1 + ; and (b) Δ E 0 Δ E 1 + obtained by the DFT calculations in Table 3. (c,d) The correspondents by the HF energy calculations and its correlation-energy correction by the MP2 calculations in Table 4.
Crystals 10 01119 g012
Table 1. X-ray crystallographic and refinement data for (TMTSF) 8 (I 3 ) 5 , (TMTSF) 5 (I 3 ) 2 , and (TMTSF) 4 (I 3 ) 4 ·THF, respectively.
Compound(TMTSF) 8 (I 3 ) 5 (TMTSF) 5 (I 3 ) 2 (TMTSF) 4 (I 3 ) 4 ·THF
FormulaC 80 H 96 Se 32 I 15 C 50 H 60 Se 8 I 6 C 44 H 56 OSe 16 I 12
Formula weight5488.212054.183387.28
Crystal systemOrthorhombicMonoclinicOrthorhombic
Space group C m c m (No.63) P 2 1 / n (No.14) P n m a (No.62)
a (Å)30.362(5)11.263(9)26.900(6)
b (Å)20.389(3)18.174(14)9.914(2)
c (Å)21.346(3)18.166(14)28.547(7)
α ( ° )909090
β ( ° )9090.355(9)90
γ ( ° )909090
Volume (Å 3 )13,214.263718.407613.10
Z 424
λ (Å)0.710700.710700.71070
μ (mm 1 )12.36412.32812.562
Temperature (K)296(2)296(2)296(2)
Number of reflections collected793585129107
Number of reflections with [ F 0 > 2 σ ( F 0 ) ]721656217309
Number of parameters refined361337368
( 2 θ ) max ( ° )25.1125.3625.08
final R indices [ I > 2 σ ( I ) ] R 1 0.09970.10180.0656
w R 2 0.24010.25590.1629
R indices (all data) R 1 0.10620.13760.0812
w R 2 0.24310.29180.1749
Z = the number of chemical formula units per unit cell.
Table 2. Comparison of bond lengths in TMTSF molecules in the crystals of neutral TMTSF and some salts. Each of f ¯ , g ¯ , and h ¯ is the average such as f ¯ = ( f 1 + f 2 + f 3 + f 4 ) / 4 .
Crystals 10 01119 i001
(Average) ValenceMaterial/Calculation e f ¯ g ¯ h ¯
0neutral 1 1.35261.89241.90621.3101
0.5 + BF 4 (A, 20 K) 2 1.37201.87581.89141.3525
0.5 + BF 4 (B, 20 K) 2 1.35891.88521.89931.3469
0.5 + PF 6 (20 K) 3 1.37561.88211.88961.3796
0.5 + PF 6 4 1.36881.87551.89261.3295
0.5 + NO 3 (2:1, 125 K) 5 1.42971.86411.90161.3271
0.5 + NbF 6 6 1.35011.88011.89081.3481
0.5 + Ni (A) 7 1.37791.86531.88761.3297
0.5 + Ni (A’) 7 1.39391.86731.89081.3409
1 + NO 3 (1:1) 8 1.35981.86461.88351.3235
1 + Cr 9 1.42931.84371.87501.3550
1 + PWO (A) 10 1.29511.87821.90941.2232
1 + PWO (B) 10 1.40721.85131.85681.3392
8:5 (P)1.37861.86551.88551.3287
8:5 (Q)1.35131.87471.90161.3499
8:5 (R)1.32411.90141.89751.3747
5:2 (A)1.38011.86511.88151.3107
5:2 (B)1.38581.86291.87191.3568
5:2 (C)1.32441.89641.89501.3359
4:4 (K)1.37501.86361.88661.3522
4:4 (L)1.38641.86231.88341.3582
4:4 (M)1.35391.86851.88541.3404
4:4 (N)1.36761.86881.89671.3453
0DFT 11 1.34241.90551.92351.3409
1 + DFT 11 1.38431.87101.89741.3522
2 + DFT 11 1.43121.84391.87481.3720
0MP2 12 1.34931.88691.90511.3474
1 + MP2 12 1.38481.85531.87091.3630
2 + MP2 12 1.43031.83761.84701.3859
1 Neutral crystal [76]. 2 (TMTSF) 2 BF 4 at the anion ordered state at 20 K with two crystallographically independent TMTSF molecules (A and B) [77]. 3 (TMTSF) 2 PF 6 at 20 K with the neutron diffraction structural analysis [78]. 4 (TMTSF) 2 PF 6 [79]. 5 (TMTSF) 2 NO 3 at 125 K [80]. 6 (TMTSF) 2 NbF 6 [5]. 7 (TMTSF) 2 Ni(tds) 2 (tds = [bis(trifluoromethyl)ethylene]diselenolato) [52]. 8 (TMTSF)NO 3 [69]. 9 (TMTSF)[Cr(Br 4 SQ) 2 (Br 4 Cat)] ·(CH 2 Cl 2 ) 2 (SQ = semiquinonate, Cat = catecholate) [71]. 10 (TMTSF) 3 PW 12 O 40 [68]. 11 Optimized structures calculated by the density-functional theory method (B3LYP/6-31G(d,p)) [82]. 12 Optimized structures obtained by Hartree–Fock calculations (6-31G(d,p)) followed by Møller–Plesset correlation energy calculations truncated at second order [82] .
Table 3. The total energies of TMTSF molecules at neutral and cationic states ( E 0 and E 1 + ); their relative values with respect to those calculated for the optimized structures ( Δ E 0 = E 0 E 0 ( optimized   for 0 ) and Δ E 1 + = E 1 + E 1 + ( optimized   for 1 + ) ); and their difference ( Δ E 0 Δ E 1 + ) as a measure of the valence of each conformation of TMTSF molecule. The calculations of E 0 and E 1 + were carried out on the basis of the density-functional theory (B3LYP, 6-31G(d,p)) [82].
Conformation E 0 /Hartree 1 E 1 + /Hartree Δ E 0 /eV Δ E 1 + /eV ( Δ E 0 Δ E 1 + ) /eV
optimized for 0 9985.7935 9985.5699 0.000 0.279 0.279
optimized for 1 + 9985.7884 9985.5801 0.139 0.000 0.139
neutral 2 9985.5799 9985.3662 5.813 5.822 0.009
BF 4 (A, 20 K) 3 9985.7854 9985.5773 0.221 0.077 0.144
BF 4 (B, 20 K) 3 9985.7877 9985.5772 0.159 0.080 0.079
PF 6 (20 K) 4 9985.7636 9985.5552 0.815 0.679 0.135
NO 3 (2:1) 5 9985.7622 9985.5588 0.853 0.580 0.272
NbF 6 6 9985.6057 9985.3999 5.111 4.904 0.207
Ni (A) 7 9985.6104 9985.4036 4.984 4.803 0.181
Ni (A’) 7 9985.6078 9985.4036 5.055 4.805 0.250
NO 3 (1:1) 8 9985.6095 9985.4029 5.009 4.824 0.185
Cr 9 9985.5534 9985.3570 6.535 6.073 0.462
PWO (A) 10 9985.6532 9985.4377 3.818 3.877 0.058
PWO (B) 10 9985.6773 9985.4782 3.164 2.775 0.388
8:5 (P) 9985.6030 9985.3973 5.185 4.976 0.209
8:5 (Q) 9985.5909 9985.3839 5.515 5.339 0.176
8:5 (R) 9985.5961 9985.3859 5.374 5.285 0.089
5:2 (A) 9985.5943 9985.3887 5.421 5.208 0.213
5:2 (B) 9985.5945 9985.3906 5.416 5.158 0.259
5:2 (C) 9985.5916 9985.3763 5.495 5.548 0.053
4:4 (K) 9985.6067 9985.4028 5.084 4.825 0.259
4:4 (L) 9985.6056 9985.4024 5.114 4.836 0.278
4:4 (M) 9985.6087 9985.4016 5.030 4.860 0.170
4:4 (N) 9985.6063 9985.4010 5.095 4.876 0.219
1 1 hartree = 27.211386245988(53) eV. 2 Neutral crystal [76]. 3 (TMTSF) 2 BF 4 at the anion ordered state at 20 K with two crystallographically independent TMTSF molecules (A and B) [77]. 4 (TMTSF) 2 PF 6 at 20 K by the neutron diffraction structural analysis [78]. 5 (TMTSF) 2 NO 3 at 125 K [80]. 6 (TMTSF) 2 NbF 6 [5]. 7 (TMTSF) 2 Ni(tds) 2 (tds = [bis(trifluoromethyl)ethylene]diselenolato) [52]. 8 (TMTSF)NO 3 [69]. 9 (TMTSF)[Cr(Br 4 SQ) 2 (Br 4 Cat)] · (CH 2 Cl 2 ) 2 (SQ = semiquinonate, Cat = catecholate) [71]. 10 (TMTSF) 3 PW 12 O 40 [68].
Table 4. The total energies of TMTSF molecules at neutral and cationic states ( E 0 and E 1 + ); their relative values with respect to those calculated for the optimized structures ( Δ E 0 = E 0 E 0 ( optimized   for 0 ) and Δ E 1 + = E 1 + E 1 + ( optimized   for 1 + ) ); and their difference ( Δ E 0 Δ E 1 + ) as a measure of the valence of each conformation of TMTSF molecule. The E 0 and E 1 + were obtained by Hartree–Fock (HF) calculations (6-31G(d,p)) followed by Møller–Plesset correlation energy calculations truncated at second order (MP2) [82].
Conformation E 0 /Hartree 1 E 1 + /Hartree Δ E 0 /eV Δ E 1 + /eV ( Δ E 0 Δ E 1 + ) /eV
optimized for 0 9977.9803 9977.7594 0.000 0.361 0.361
optimized for 1 + 9977.9745 9977.7726 0.158 0.000 0.158
neutral 2 9977.7718 9977.5598 5.675 5.792 0.117
BF 4 (A, 20 K) 3 9977.9752 9977.7696 0.141 0.082 0.059
BF 4 (B, 20 K) 3 9977.9761 9977.7681 0.115 0.123 0.009
PF 6 (20 K) 4 9977.9531 9977.7455 0.741 0.739 0.002
NO 3 (2:1) 5 9977.9518 9977.7495 0.778 0.629 0.148
NbF 6 6 9977.8048 9977.6021 4.777 4.641 0.136
Ni (A) 7 9977.8092 9977.6046 4.657 4.571 0.085
Ni (A’) 7 9977.8070 9977.6050 4.718 4.561 0.157
NO 3 (1:1) 8 9977.8086 9977.6044 4.674 4.579 0.094
Cr 9 9977.7564 9977.5594 6.094 5.804 0.290
PWO (A) 10 9977.8438 9977.6319 3.716 3.830 0.113
PWO (B) 10 9977.8760 9977.6821 2.841 2.463 0.377
8:5 (P) 9977.8026 9977.5992 4.837 4.719 0.117
8:5 (Q) 9977.7911 9977.5846 5.150 5.118 0.032
8:5 (R) 9977.7941 9977.5848 5.068 5.112 0.044
5:2 (A) 9977.7942 9977.5902 5.065 4.965 0.100
5:2 (B) 9977.7951 9977.5906 5.041 4.955 0.086
5:2 (C) 9977.7888 9977.5728 5.212 5.439 0.227
4:4 (K) 9977.8070 9977.6059 4.717 4.537 0.180
4:4 (L) 9977.8063 9977.6060 4.736 4.535 0.201
4:4 (M) 9977.8084 9977.6037 4.679 4.596 0.083
4:4 (N) 9977.8057 9977.6032 4.752 4.612 0.140
1 1 hartree = 27.211386245988(53) eV. 2 Neutral crystal [76]. 3 (TMTSF) 2 BF 4 at the anion ordered state at 20 K with two crystallographically independent TMTSF molecules (A and B) at 20 K [77]. 4 (TMTSF) 2 PF 6 at 20 K by the neutron diffraction structural analysis [78]. 5 (TMTSF) 2 NO 3 at 125 K [80]. 6 (TMTSF) 2 NbF 6 [5]. 7 (TMTSF) 2 Ni(tds) 2 (tds = [bis(trifluoromethyl)ethylene]diselenolato) [52]. 8 (TMTSF)NO 3 [69]. 9 (TMTSF)[Cr(Br 4 SQ) 2 (Br 4 Cat)] · (CH 2 Cl 2 ) 2 (SQ = semiquinonate, Cat = catecholate) [71]. 10 (TMTSF) 3 PW 12 O 40 [68].
Publisher’s Note: MDPI stays neutral with regard to jurisdictional claims in published maps and institutional affiliations.

