Phase Transitions and Crystal Structures of Ni(II) Complexes Determined with X-ray Powder Diffraction Data

X-ray Instrument Division, Rigaku Corporation, Tokyo 1968666, Japan
*
Authors to whom correspondence should be addressed.
Crystals 2020, 10(2), 106; https://0-doi-org.brum.beds.ac.uk/10.3390/cryst10020106
Submission received: 15 January 2020
/
Revised: 5 February 2020
/
Accepted: 6 February 2020
/
Published: 12 February 2020
(This article belongs to the Special Issue Crystal Structure Characterization by Powder Diffraction)
Abstract
:Structural changes of chloride and bromide complexes, [Ni(Et2en)2(H2O)2]Cl2 (designated as 1a) and [Ni(Et2en)2]Br2 (2a), have been investigated by using simultaneous measurements of powder X-ray diffraction (XRD) and differential scanning calorimetry data under the temperature and humidity controls. The hydrate form of chloride complex 1a was transformed into an anhydrate form (1b) by heating at a temperature of 361 K. Then the 1b was reversibly returned to the original 1a by humidification at 25% relative humidity (RH) and temperature of 300 K. On the other hand, the anhydrate form of the bromide complex 2a was first transformed into a hydrate form (2b) at 30% RH and 300 K. On heating, the 2b turned to a new anhydrate form (2c) at 344 K, and then it returned to the original form 2a on further heating. In the present experiments, a series of reactions of 2a proceeded via 2c, which was newly found with the benefit of differential scanning calorimetry (DSC) measurements performed in parallel to the XRD measurements. Crystal structures of new crystalline forms of 1b, 2b, and 2c were determined from the powder XRD data.
1. Introduction
The physical and chemical properties of crystalline materials are largely dependent on their crystal structures as well as their chemical compositions. Therefore, the structure-property relationship is always spotlighted in many fields of materials science. Many materials change their properties by responding to varying environmental factors, such as, temperature, pressure, humidity, electric field, light, etc. They sometimes undergo phase transitions, and they discontinuously change their properties. These materials have been used, when their properties are useful, as functional materials, such as memory devices, switching devices, sensors, antibacterial plates, etc. To understand the mechanisms of generating these properties/functions, structural information is required, and many crystal structures have been analyzed in situ or in operand as well as at ambient conditions. In investigating structural changes with varying environmental factors, the determination of a crystal structure is, in general, an easy task when a single crystal, suitable for a diffraction experiment, is available, whereas it becomes a difficult task when the original crystal is, for example, fragmented into pieces accompanied with the volume expansion during the phase transition. In such a case, crystal structure determination from powder diffraction data becomes indispensable.
Ni(II) complexes, with the N,N-diethylethylenediamine (Et2en) ligand, are known to exhibit color changes accompanied by hydration/dehydration transitions and thermochromism depending on selected anions, and their physical properties, as well as crystal structures, have been studied by many researchers [1,2,3,4,5,6,7]. The crystal structures of Ni(II) complexes have been elucidated when single crystals capable of X-ray diffraction studies were available, while many of them still remain as unknown structures because they can be obtained just as powders.
In this study, [Ni(Et2en)2(H2O)2]Cl2 and [Ni(Et2en)2]Br2 were chosen for their structural investigations, and, in the following, they are designated as 1a and 2a, respectively. The 1a with water molecules exhibits light-blue color. It is transformed into a dehydrated form, [Ni(Et2en)2Cl2], designated as 1b, on heating [2]. On the other hand, the 2a undergoes a hydration transition to [Ni(Et2en)2(H2O)2]Br2 (2b) by humidification, and water molecules are supposed to be coordinated to Ni(II) [2]. The crystal structures of 1a and 2a have been reported [8,9], while their structures after the dehydration (1b) and hydration (2b) have not yet been reported. In this study, transition phenomena accompanied by dehydration (1a → 1b) and hydration (2a → 2b) and their reverse processes have been reinvestigated by simultaneous measurements of powder X-ray diffraction (XRD) and differential scanning calorimetry (DSC) data under the temperature and humidity controls. During the study on hydration and dehydration processes of 2a and 2b, we also found a new form, 2c. In this study, crystal structures of 1b, 2b, and 2c have been determined from powder XRD data collected with laboratory diffractometer systems.
2. Experimental and Data Analysis
2.1. Sample Preparation
Samples used in this study were synthesized in our house-laboratory. The complex 1a was prepared by adding NiCl2·6H2O (2 mmol) and Et2en (4 mmol) in 4 ml of methanol. After stirring the solution for 30 minutes, it was cooled in a refrigerator for 10 hours to yield the desired blue crystals, which was subsequently filtered and then washed with cold methanol. The complex 2a was prepared by mixing NiBr2 (0.1 mmol) and Et2en (0.2 mmol) in 2 ml of acetonitrile. The solution was stirred overnight to yield the desired orange-colored crystals, which was subsequently filtered and then washed with cold acetonitrile.
2.2. Intensity Data Collection
Two kinds of powder diffraction experiments were conducted. One is the simultaneous measurement of powder XRD and DSC data for elucidating the structural changes of 1a and 2a crystals as a function of temperature and humidity. The other one is the powder XRD intensity data collection for ab initio crystal structure determination of the crystalline phases formed during the hydration-dehydration reaction processes (1b, 2b, and 2c) and for Rietveld refinements of all crystalline phases examined in this study. A SmartLab powder diffractometer (Rigaku Corporation, Akishima, Tokyo, Japan), equipped with DSC and humidity control attachments, was used for the former experiment with CuKα radiation in the Bragg–Brentano geometry. Some instrumental parameters were a rotating anode generator (45 kV, 200 mA), divergence slit (DS) = 1/4°, Soller slits = 2.5°, Si strip one-dimensional detector, D/teX Ultra 250 (strip width = 75 mm, 256 channels), and Ni filter in front of the detector for anti-Kβ line. A SmartLab, which can provide the CuKα1 radiation, monochromatized with a Johansson-type Ge (111) monochromator crystal on the incident-beam side, was used in the transmission geometry for the latter experiment. Aperture angles of Soller slits were = 1.0° and 2.5°. In the latter experiment, powder specimens were filled in borosilicate glass capillaries (0.4 mmϕ). During the intensity measurement, the capillary sample was rotated with a temperature-controllable capillary spinner. Heating temperatures for intensity data collections will be specified in individual sections. Scanning conditions were: the 2θ-range = 5–35° at a step interval of 0.02°/2θ for the former experiment and 5–90° at a step interval of 0.006°/2θ for the latter.
2.3. Data Analysis
Regarding the structure determinations of 1b, 2b, and 2c, powder diffraction patterns were first indexed using a computer program for the powder pattern indexing, N-TREOR [10]. Initial crystal structures of 1b and 2b were solved by using EXPO2009 [11] based on direct methods. In the case of 1b, all the non-hydrogen atoms were found, while one carbon atom of the Et2en group was missing at the end of direct methods in case of 2b. The positions of all the hydrogen atoms were determined by calculation. The initial crystal structure of 2c was observed by direct space methods based on direct space methods (parallel-tempering [12]). The powder diffraction pattern of 2c was not of a single-phase, coexisting with a 2a-related form, and details of the structure solution of 2c will be described in a later section. Although the crystal structures of 1a and 2a have already been analyzed with single-crystal data, they were also determined with EXPO2009 in order to confirm the equivalence of their structures with single-crystal data. Structural models, thus derived were used as initial structures for subsequent structure refinements using the Rietveld method [13]. In Rietveld refinements, atomic coordinates under restraints on the bond distances and angles and isotropic atomic displacement parameters were least-squares fitted together with unit-cell parameters and profile parameters. The same isotropic atomic displacement parameter was applied to all the atoms in the asymmetric unit except the Ni atom, free Cl, and Br ions. All powder XRD data were analyzed using a Rigaku powder XRD data analysis software suite, PDXL [14].
3. Results and Discussion
3.1. Phase Transition Behaviors of Chloride Complex 1a
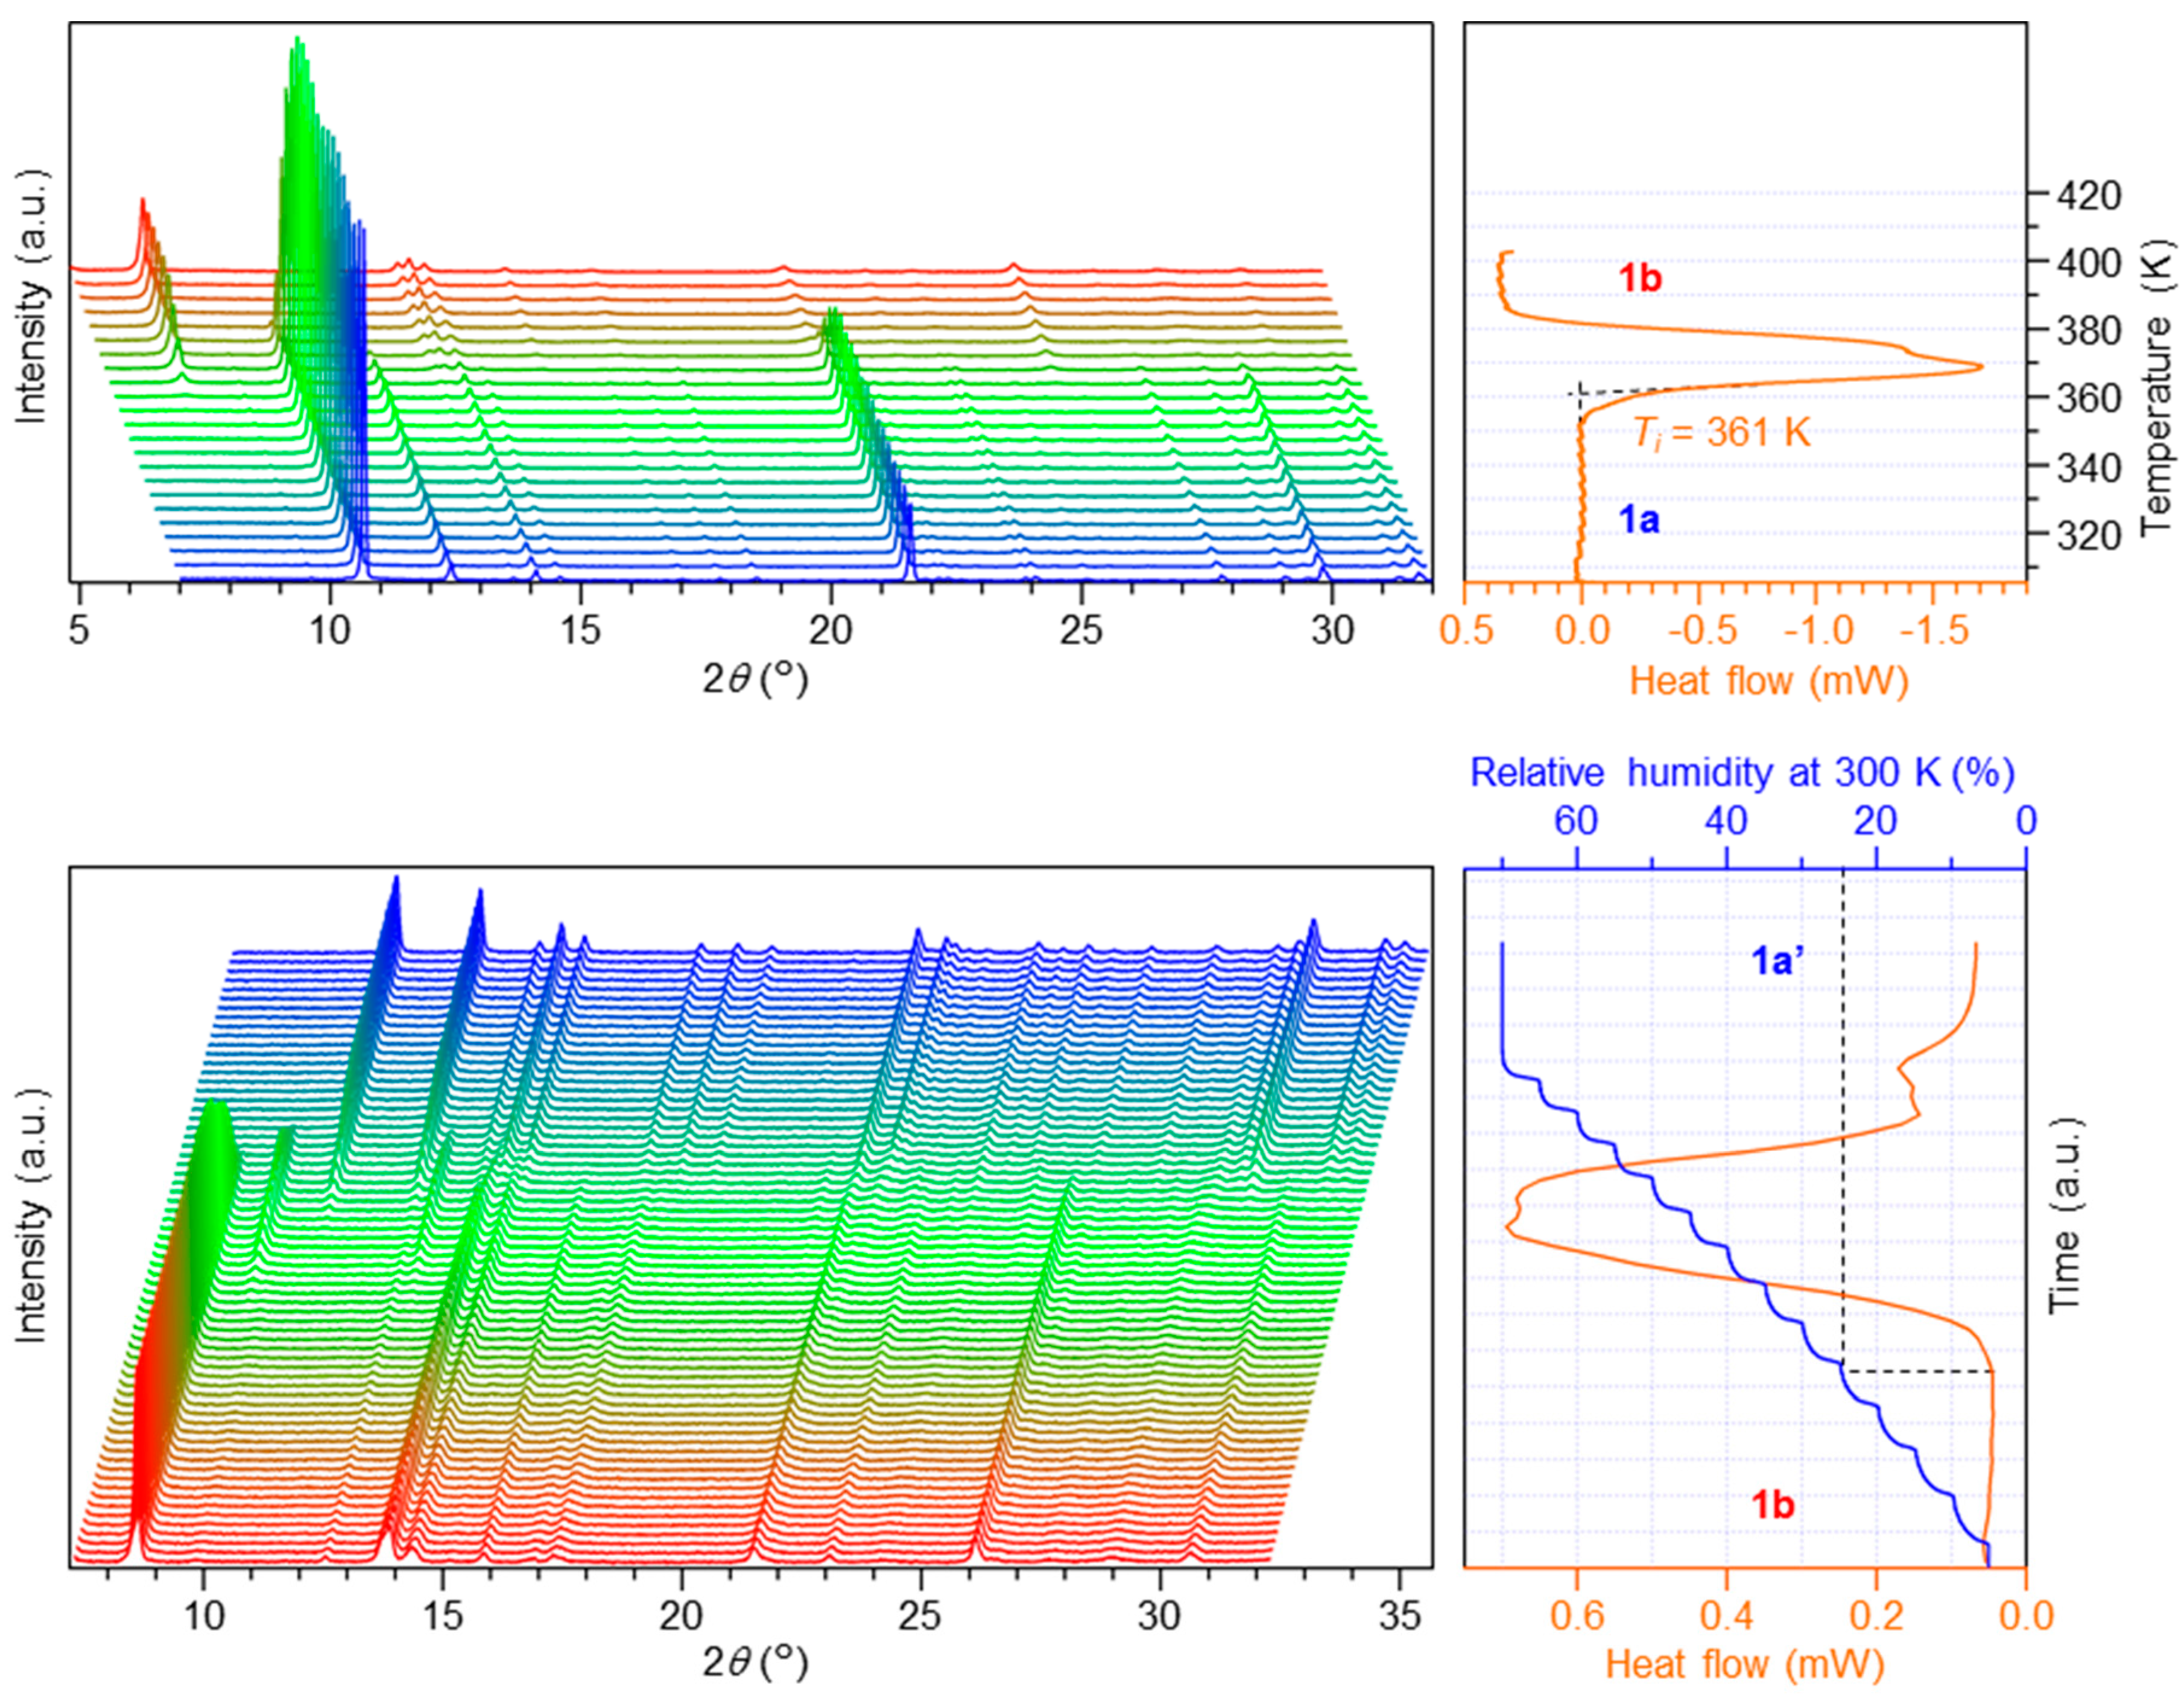
Figure 1a shows the powder XRD patterns and DSC chart, which were obtained by XRD-DSC measurements of the hydrated complex 1a in heating at temperatures from 300 to 400 K. An endothermic reaction was observed at 361 K, and a structural change at the same temperature was also indicated in the XRD patterns. These results are considered to be due to the crystal-to-crystal dehydration transition of the 1a to the dehydrated form 1b induced by heating.
Figure 1b shows results of XRD-DSC measurements, conducted for observing the reverse process of 1b, under humidity control but at a constant temperature of 300 K. With increasing relative humidity (RH) from 5 to 70%, an exothermic reaction was observed at 25% RH. XRD patterns also indicated a structural change at the same RH. A crystalline phase above 25% RH was identified to be the same as the 1a, and it was temporarily designated as 1a’. Differences in the relative intensities of several peaks between the 1a (Figure 1a) and 1a’ (Figure 1b) are considered to be caused by the difference in the degree of the preferred orientation: the crystal 1a exhibited the strong preferred orientation, while the degree of preferred orientation of the 1a’ was relatively small. The 1a’ was formed in the sample pan for the DSC measurement along with the crystal-to-crystal transition. Thus, individual crystallites would be formed in less preferentially oriented directions. These two XRD-DSC measurements indicate that the 1a was transformed into the 1b by dehydration under heating, and the 1b was reversibly transformed into the 1a by hydration under humidification.
3.2. Phase Transition Behaviors of Bromide Complex 2a
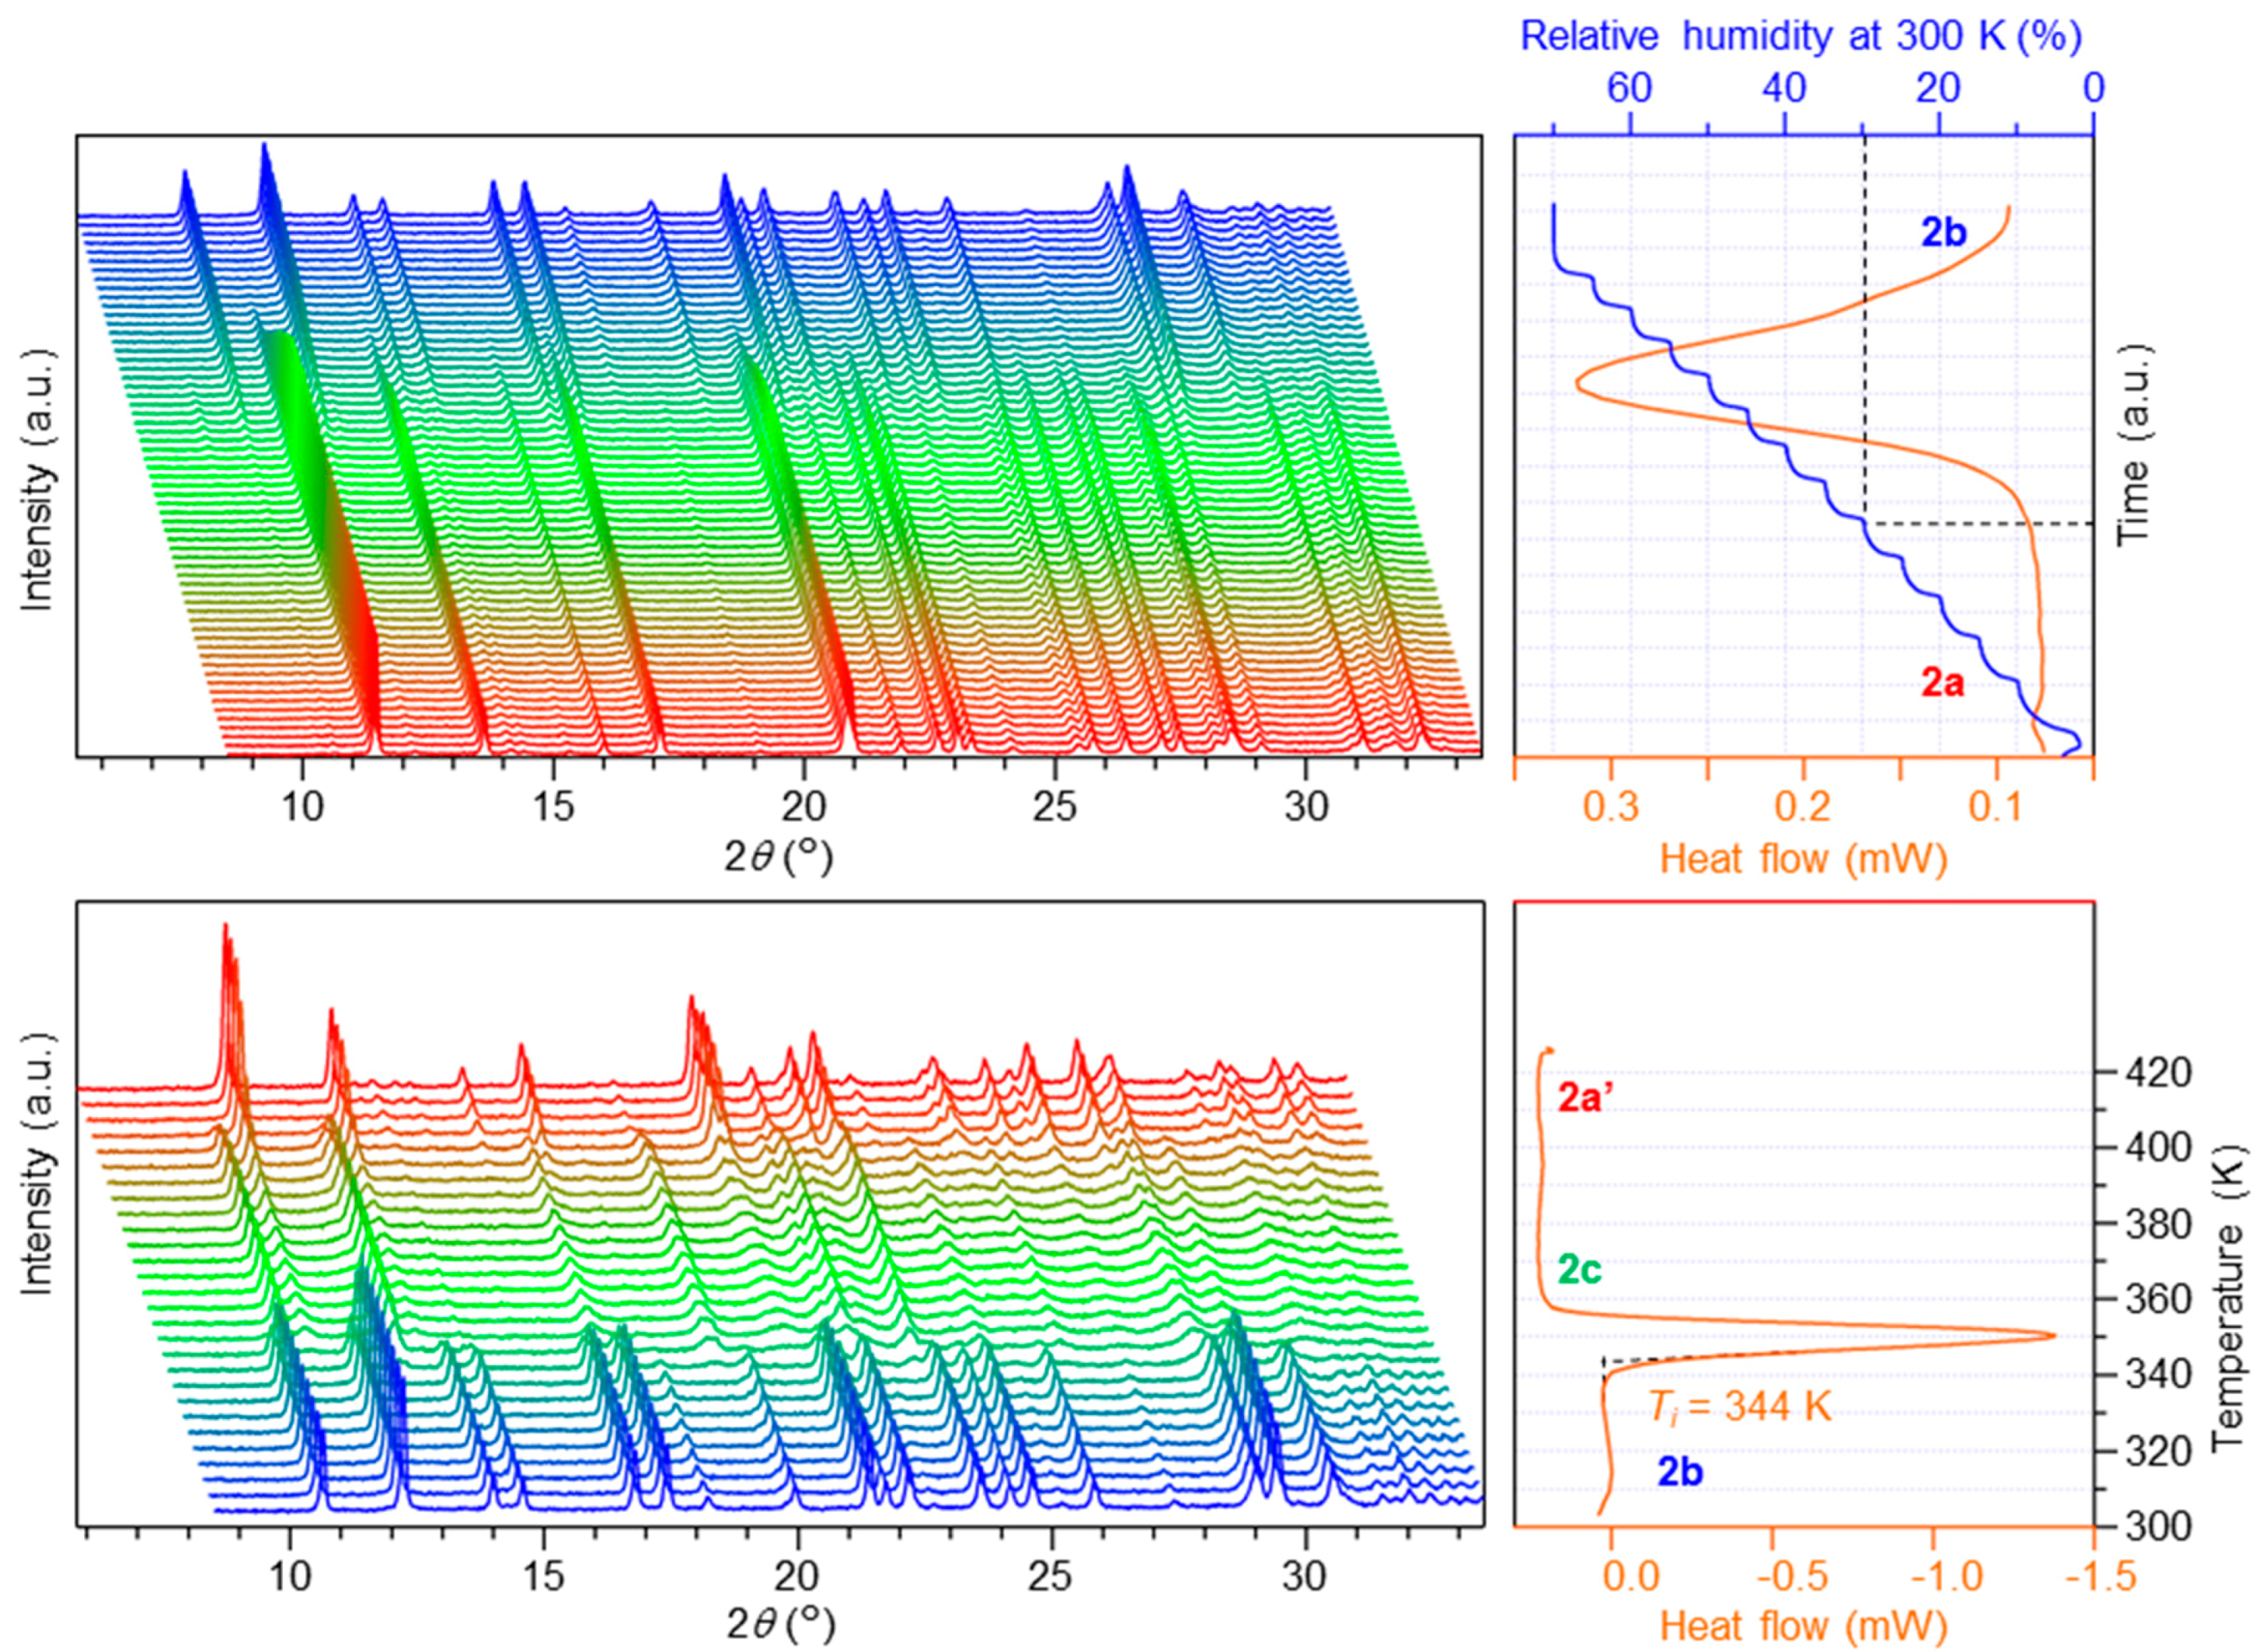
Figure 2a shows the powder XRD patterns and DSC chart, which were obtained by XRD-DSC measurements of the bromide complex 2a, under the humidity control at a constant temperature of 300 K. With increasing RH from 5 to 70%, an exothermic reaction was observed at 30% RH. XRD patterns also indicated a structural change at the same RH. A hydrated crystalline phase, denoted as 2b, was formed above 30% RH by the crystal-to-crystal hydration transition.
Figure 2b shows results of XRD-DSC measurements, conducted for observing the reverse process of the hydrated complex 2b in heating at temperatures from 300 to 420 K. An endothermic reaction was observed at 344 K, and a new crystalline form, designated as 2c, diffraction patterns of which were different from those of both 2a and 2b, was formed. The diffraction patterns of the new crystalline form, 2c were then returned to those of 2a under further heating, and it was temporarily designated as 2a’. Although the diffraction patterns of 2c were clearly changed to those of the 2a’, a subtle change was observed in the DSC chart in the temperature range from 390 to 400 K. Observations of XRD patterns indicated that the new crystalline form 2c underwent a structural phase transition during heating, while the chart indicated that the structural change was not so drastic. Since any crystalline or amorphous phase other than 2a, 2b, 2c, and 2a’ was not observed to be present in a sequence of structural changes of these forms, the 2a was considered to undergo the crystal-to-crystal hydration-dehydration-structural change, and then returned to the original 2a via three steps with an intermediate phase 2c. Thus, the reaction chain is different from the case of the chloride complexes 1a.
3.3. Crystal Structures of Chloride Complexes
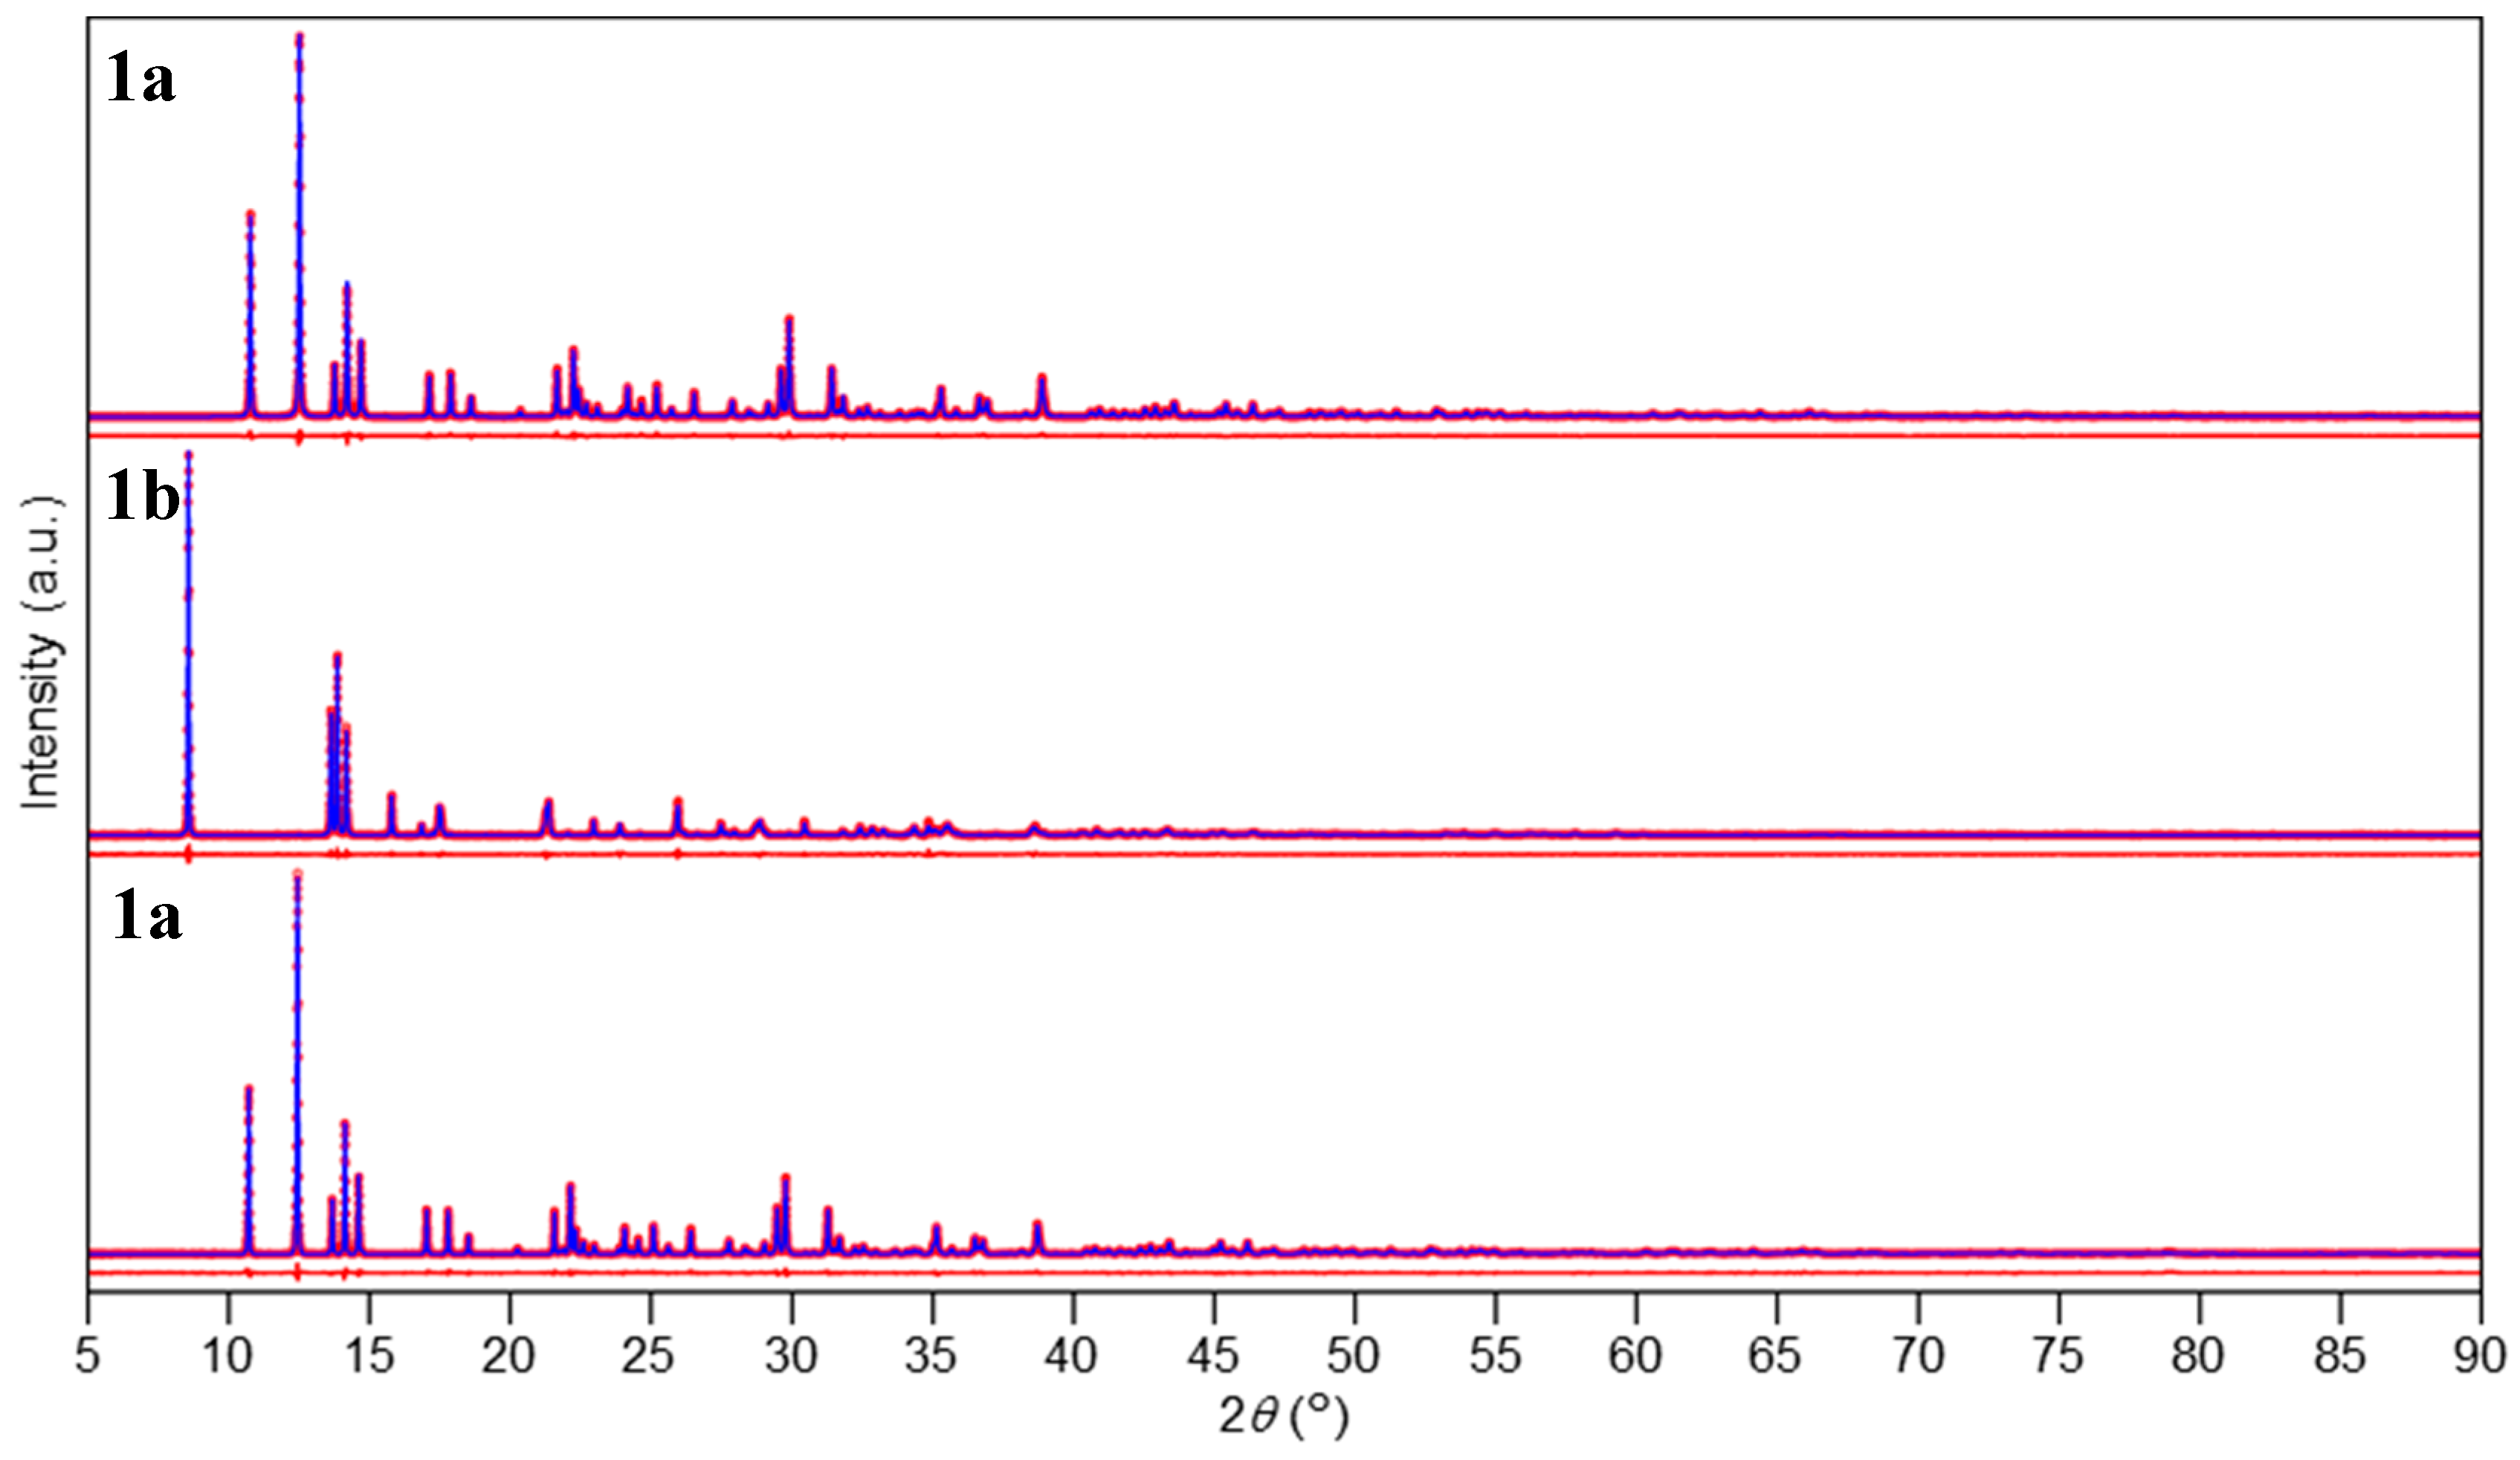
Figure 3 shows final results of Rietveld refinements for 1a (Rp = 4.29%, Rwp = 5.99%, and S = 1.39), 1b (5.89%, 8.21%, and 1.28), and 1a’ (3.49%, 4.51%, and 1.08). Table 1 gives crystallographic data derived after the Rietveld refinements. Figure 4 shows refined crystal structures of 1a and 1b. The crystal structure of 1a is known to belong to the space group of P21/n in the monoclinic system. The new form 1b, profile intensity data of which were collected for the structure determination at a temperature of 390 K, has been elucidated to belong to the space group of P-1 in the triclinic system. The refined crystal structure of 1a’ has been shown to be identical to the 1a. The shrinkage of the unit-cell volume per one molecule for 1b is considered to be primarily due to the dehydration.
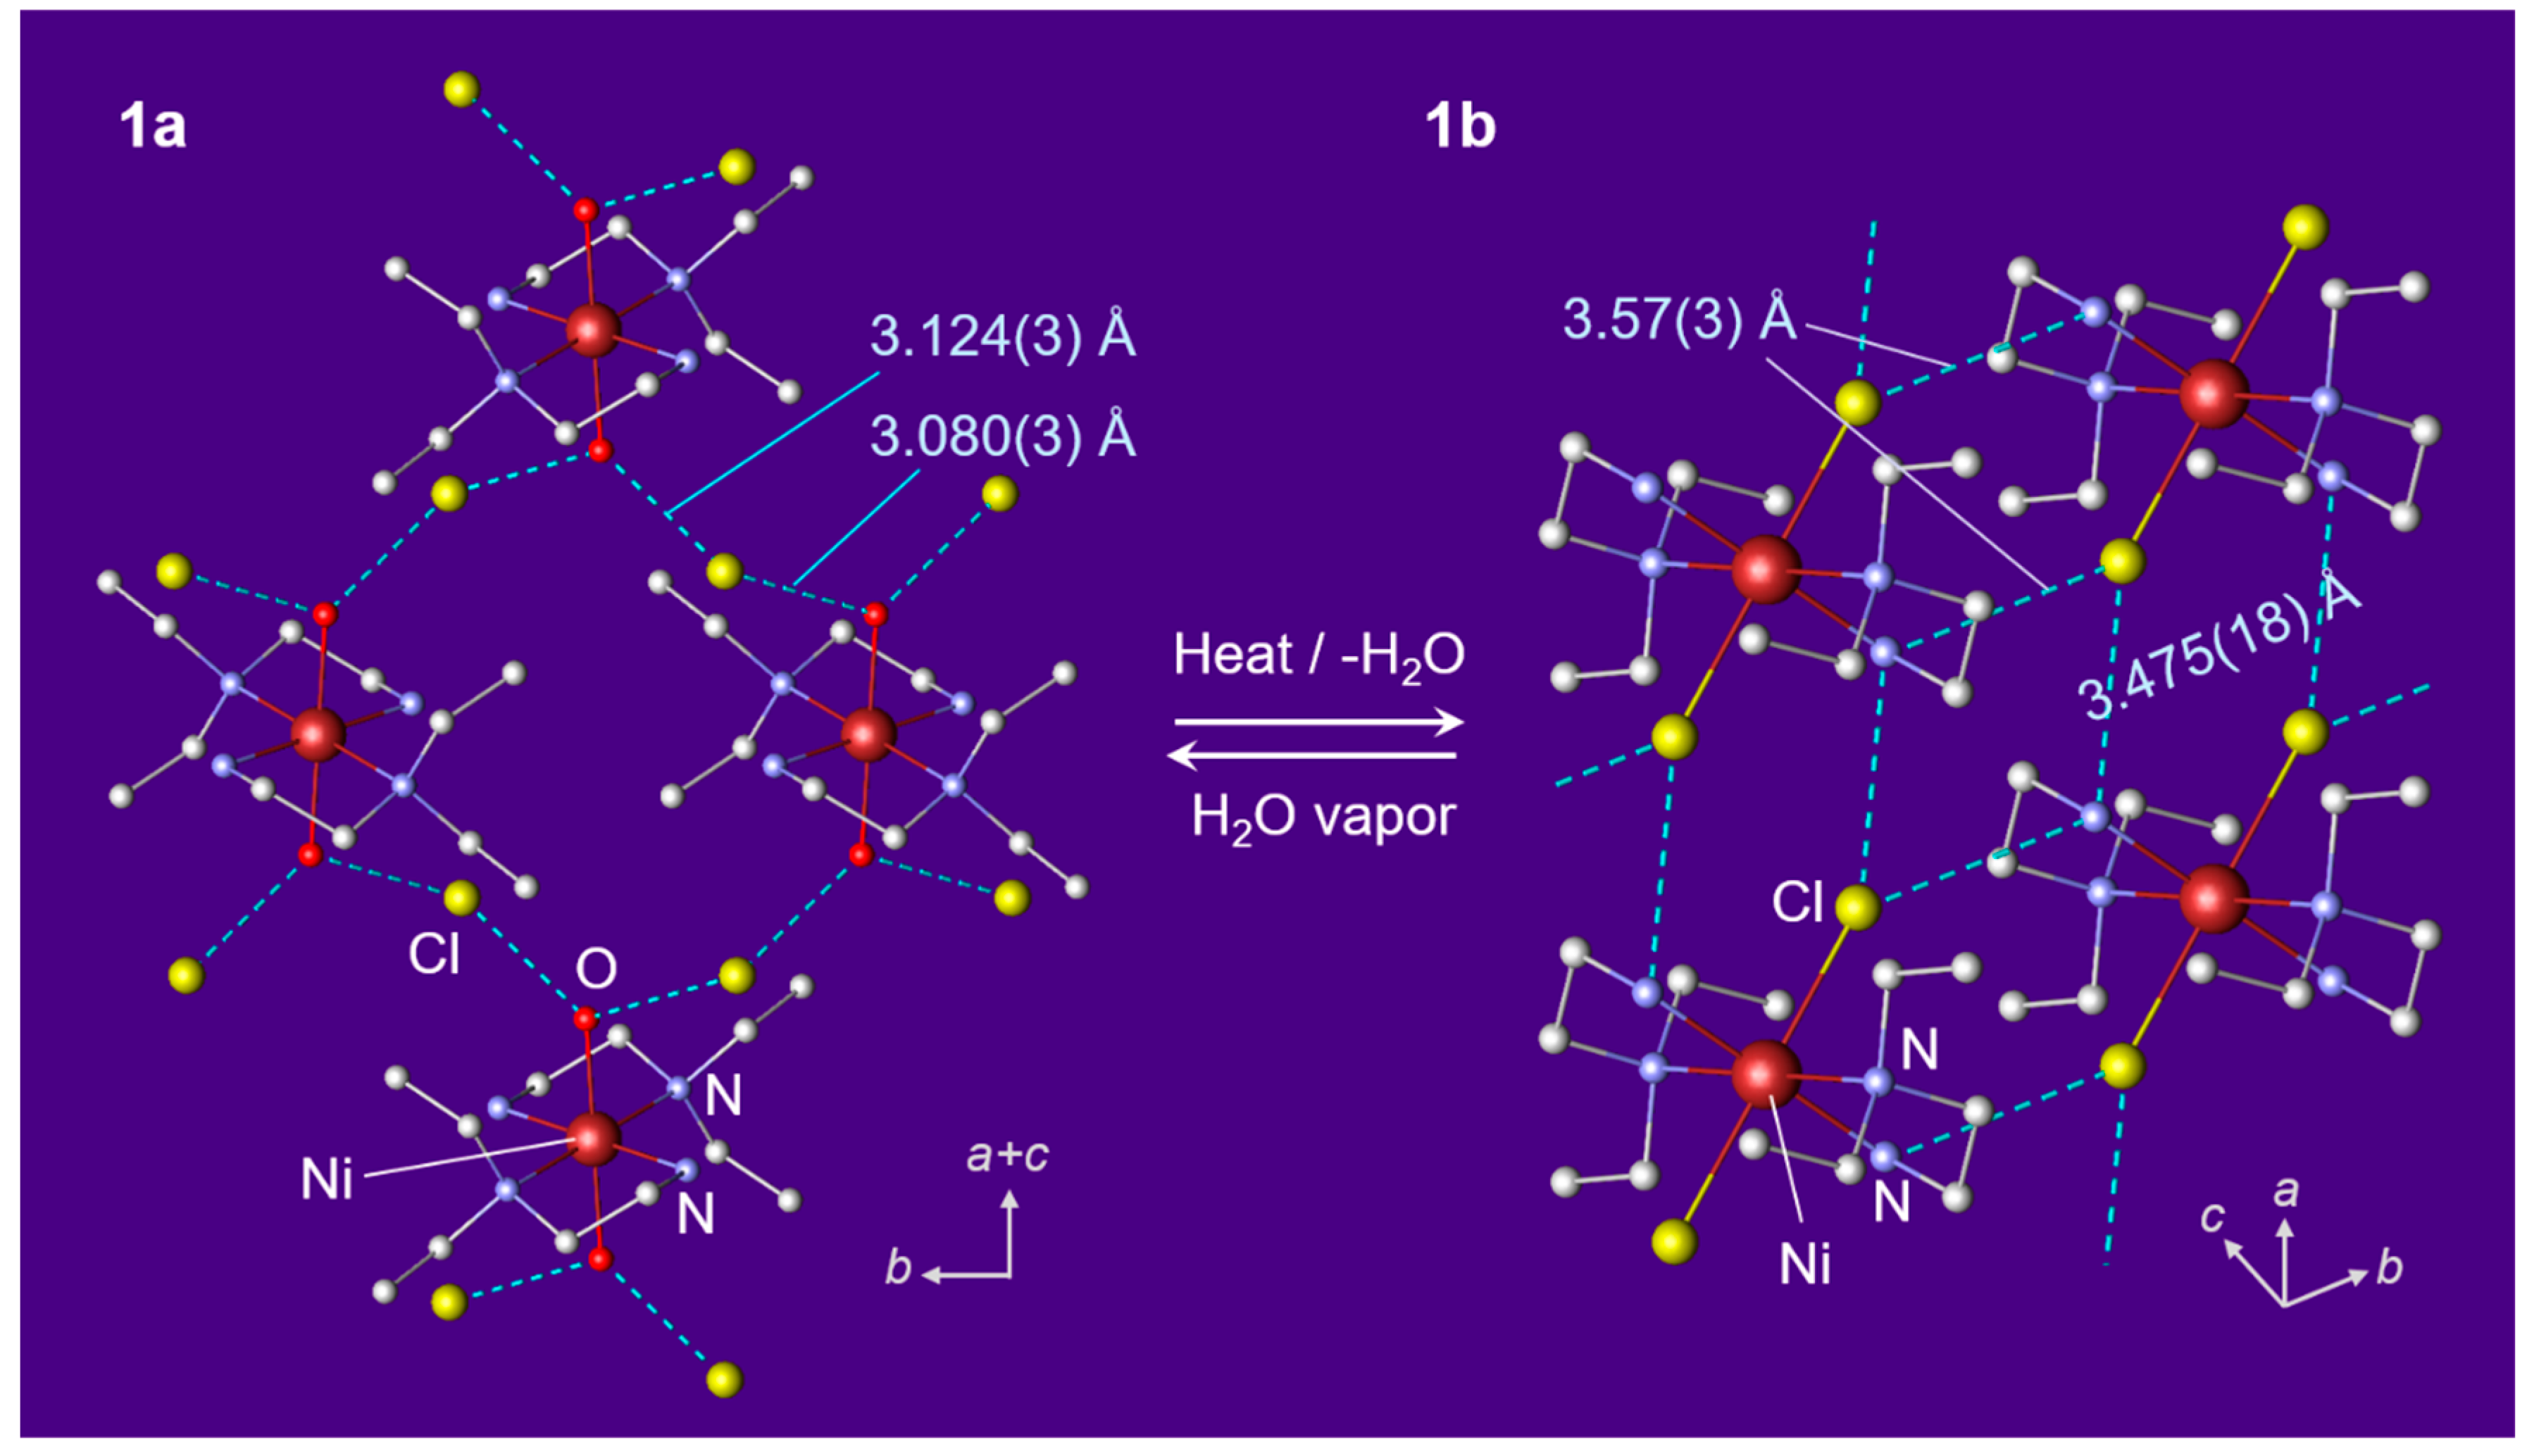
In the crystal structure of 1a (Figure 4), the water molecules are coordinated in the axial direction of the [Ni(Et2en)2]2+. Adjacent complex molecules were connected by hydrogen bonds via free chlorides and formed two-dimensional sheet structures. Here, the amino groups of the Et2en ligands were not involved in the hydrogen bond formation. In the crystal structure of 1b, chlorides were coordinated to the Ni (II) ions in place of water molecules. The complex molecules compose the two-dimensional sheet structures through hydrogen bonds between amino groups and chlorides of adjacent complex molecules.
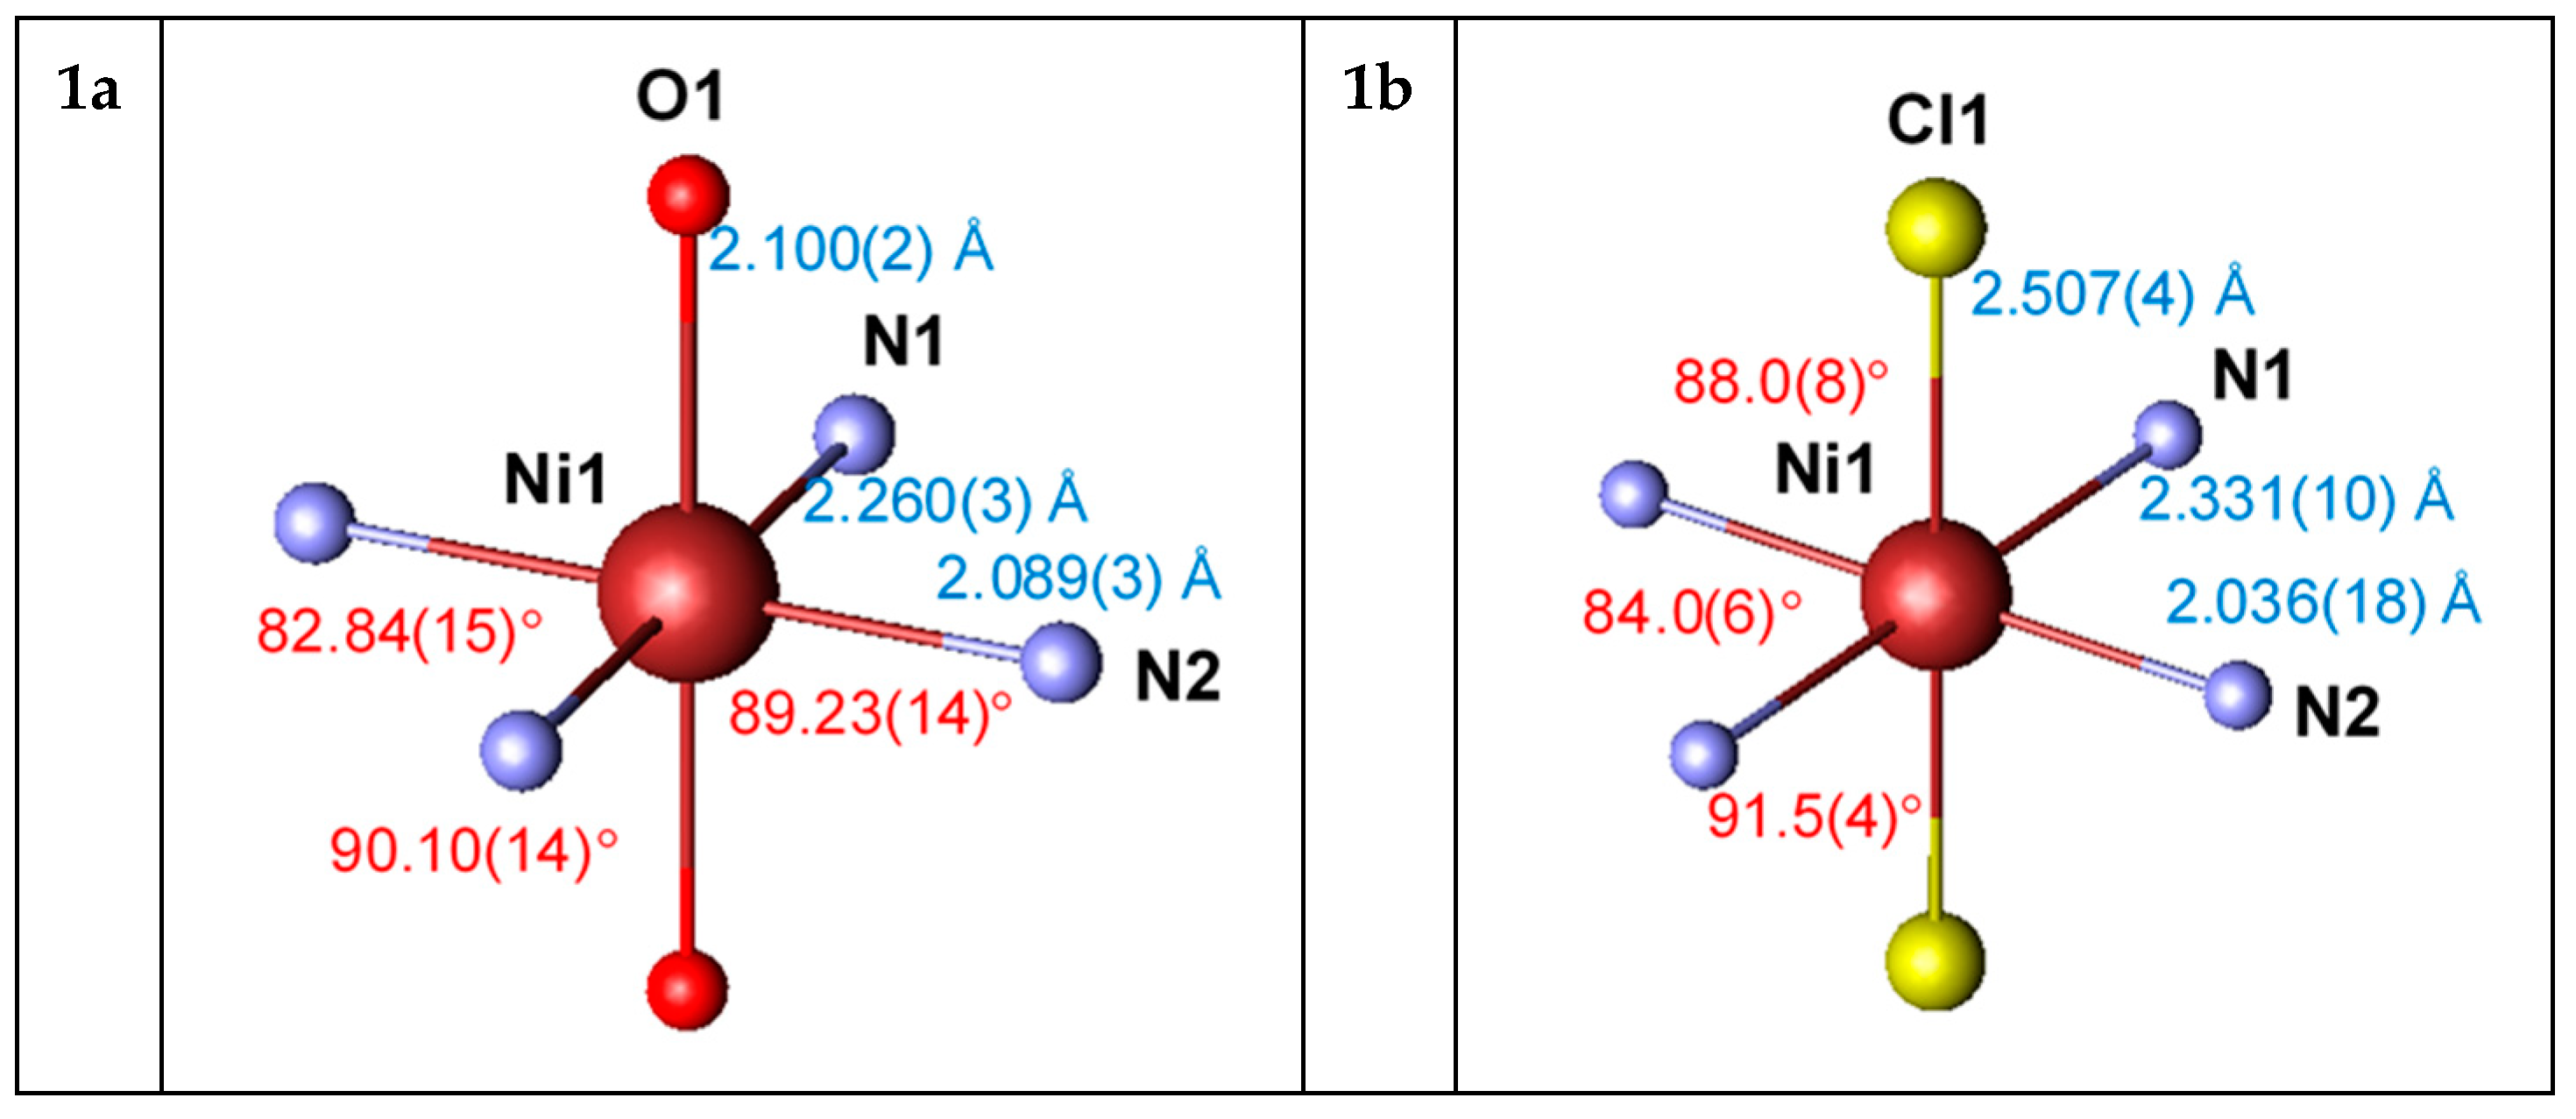
The distances and angles of bonds coordinated to the octahedral Ni(II) ion of 1a and 1b are shown in Figure 5. The Ni1-N1 distance is slightly longer than that of Ni1-N2 because the Ni1-N1 bond is electron-rich due to two electron-donating ethyl groups connected to the N1 atom. The N1-Ni1-N2 angle is significantly smaller than 90° because the N1 and N2 atoms are the members of the Et2en molecule. These structures are common in the Ni(II) complexes with Et2en ligands.
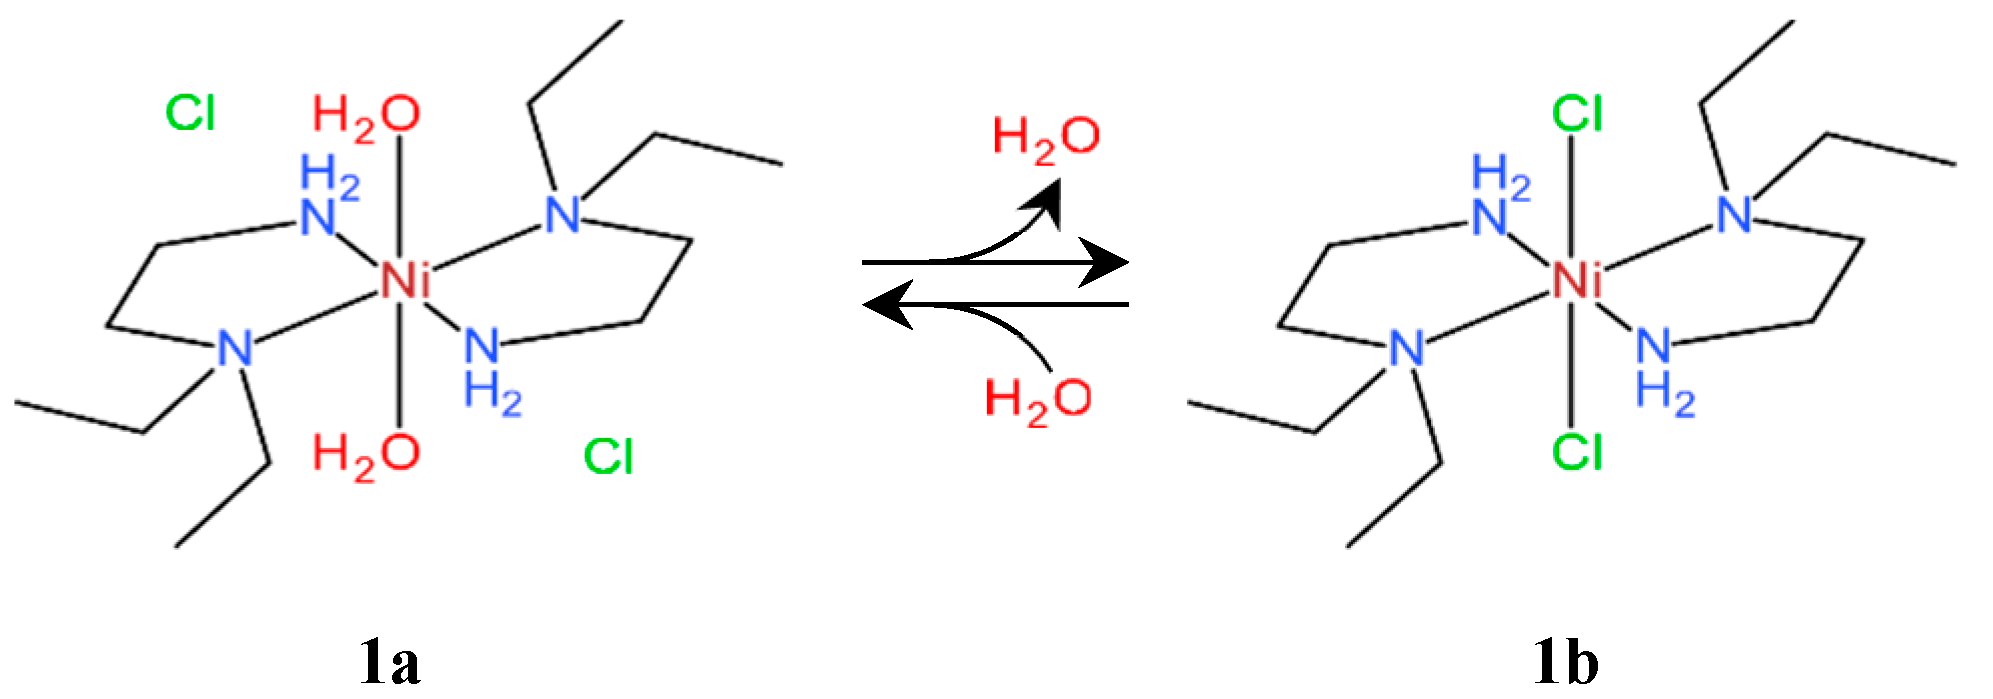
As illustrated in Figure 6, the light-blue chloride complex 1a, [Ni(Et2en)2(H2O)2]Cl2 is dehydrated by heating, and it is transformed into the dehydrated form 1b, [Ni(Et2en)2Cl2], accompanied with the endothermic reaction. Under the high humidity condition, the 1b is hydrated, and it is transformed into the original form, 1a. These structural phase transitions were confirmed to be reversible.
3.4. Crystal Structures of Bromide Complexes
Diffracted intensities for structure determinations and refinements of 2a-related forms were measured at a temperature of 300 K for 2a and 2b, 350 K for 2c, and 400 K for 2a’. In determining the crystal structures, a single-phase diffraction pattern was obta/ined for 2b, and direct methods could be applied to solve the crystal structure. As indicated in Figure 2, however, the 2c was coexisting with the 2a’. Then the profile intensity data, corresponding to the single phase of 2c, were obtained by subtracting the profile intensities of the 2a’ from the observed intensities of 2c + 2a’. The crystal structure of 2c could be derived from the intensity data, thus obtained, by applying the direct space method based on the parallel tempering (§2.3).
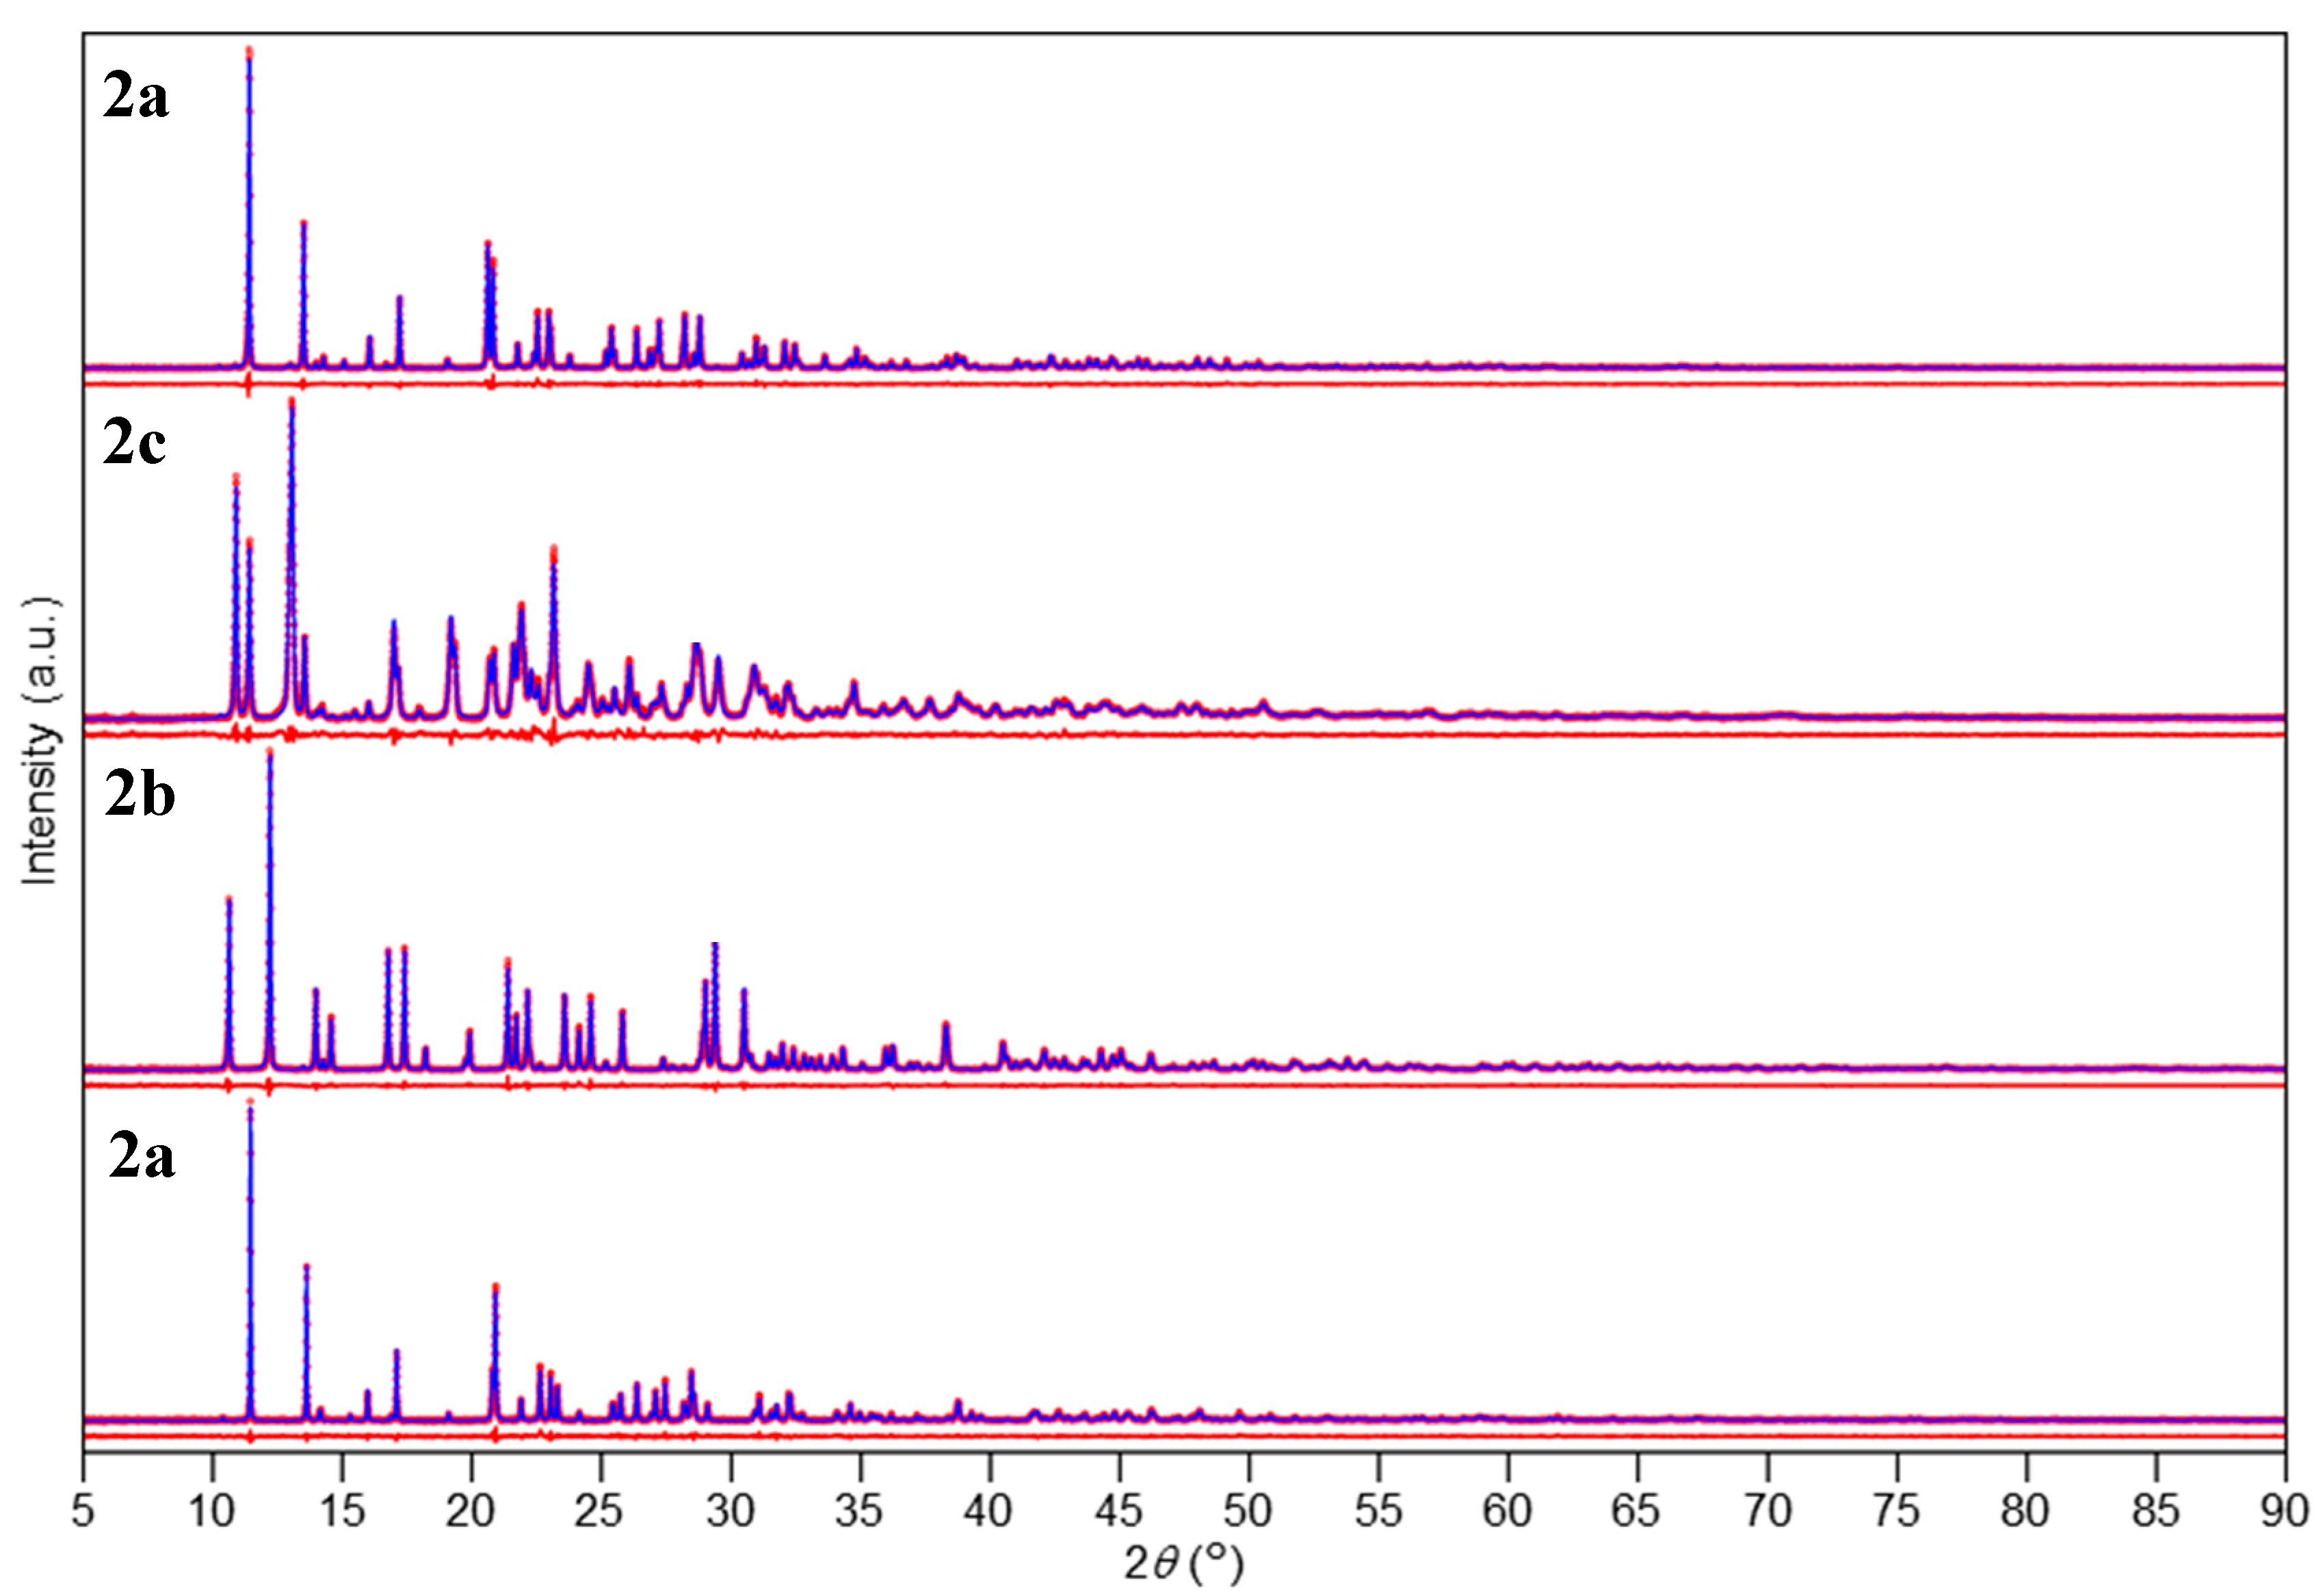
Figure 7 shows the final results of Rietveld refinements for 2a (Rp = 3.82%, Rwp = 5.02%, and S = 1.01), 2b (3.24%, 4.24%, and 1.16), 2c (3.27%, 4.21%, and 1.31), and 2a’ (4.30%, 5.57%, and 1.12). Table 2 gives crystallographic data derived after the Rietveld refinements. Figure 8 shows the refined crystal structures of 2a, 2b and 2c. The crystal structure of 2a is known to belong to the space group of C2/c in the monoclinic system [2]. The new forms of 2b and 2c have been elucidated to belong to the same space group of P21/n in the monoclinic system. The refined crystal structure of 2a’ has been shown to be identical to the 2a. The quantification of crystalline phases 2c and 2a’ in the mixture pattern resulted in 74:26 in a weight ratio after the Rietveld refinement.
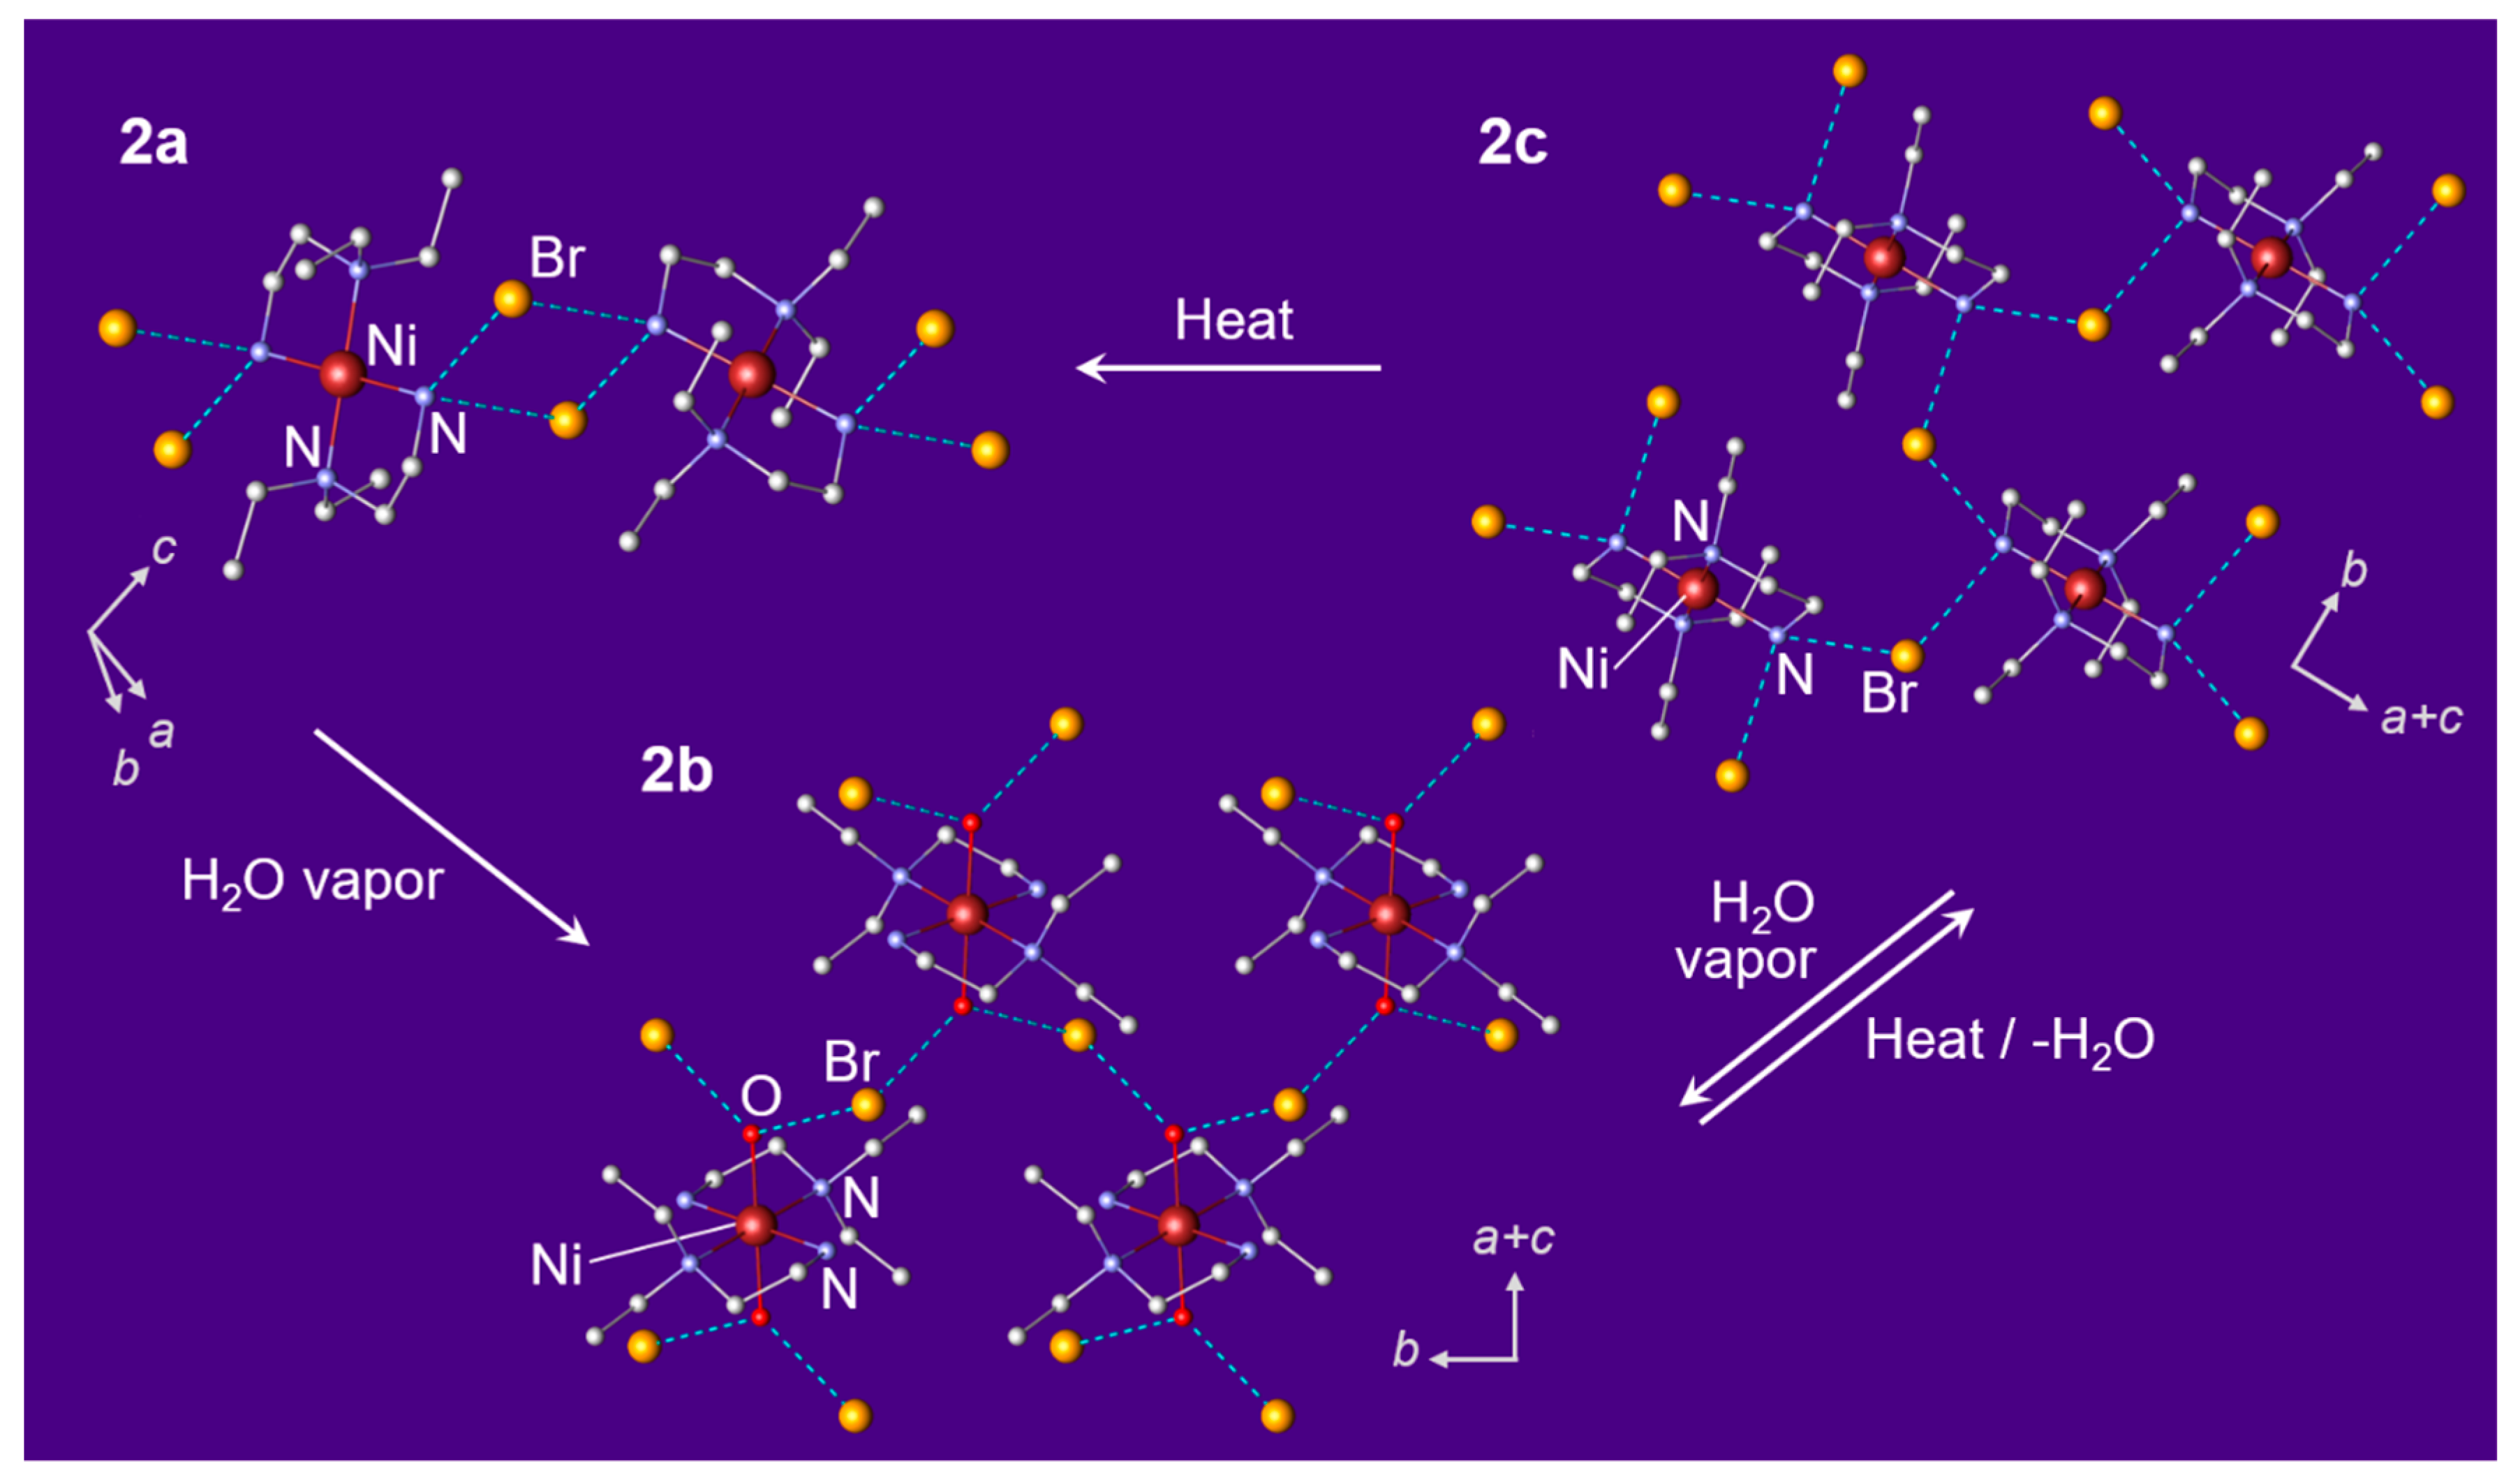
In the crystal structure of 2a (Figure 8), the Ni2+ ions form a square planar structure that has two Et2en molecules coordinated, but no bromides coordinated. Adjacent complex molecules were connected through hydrogen bonds via free bromides and formed one-dimensional chains. The 2a, generated after hydration transition by humidification, formed an octahedral structure where water molecules coordinated to the square planar Ni-Et2en complex in the axial direction. The 2b had a similar packing structure to that of the 1a, where the amino groups of the Et2en ligands were not involved in the hydrogen bonds, but the water molecules and bromide ions formed hydrogen bonds. The 2c, obtained by dehydration transition of the 2b, had a molecular structure, which is similar to that of the 2a but caused a very different hydrogen bond formation to produce a two-dimensional sheet structure.
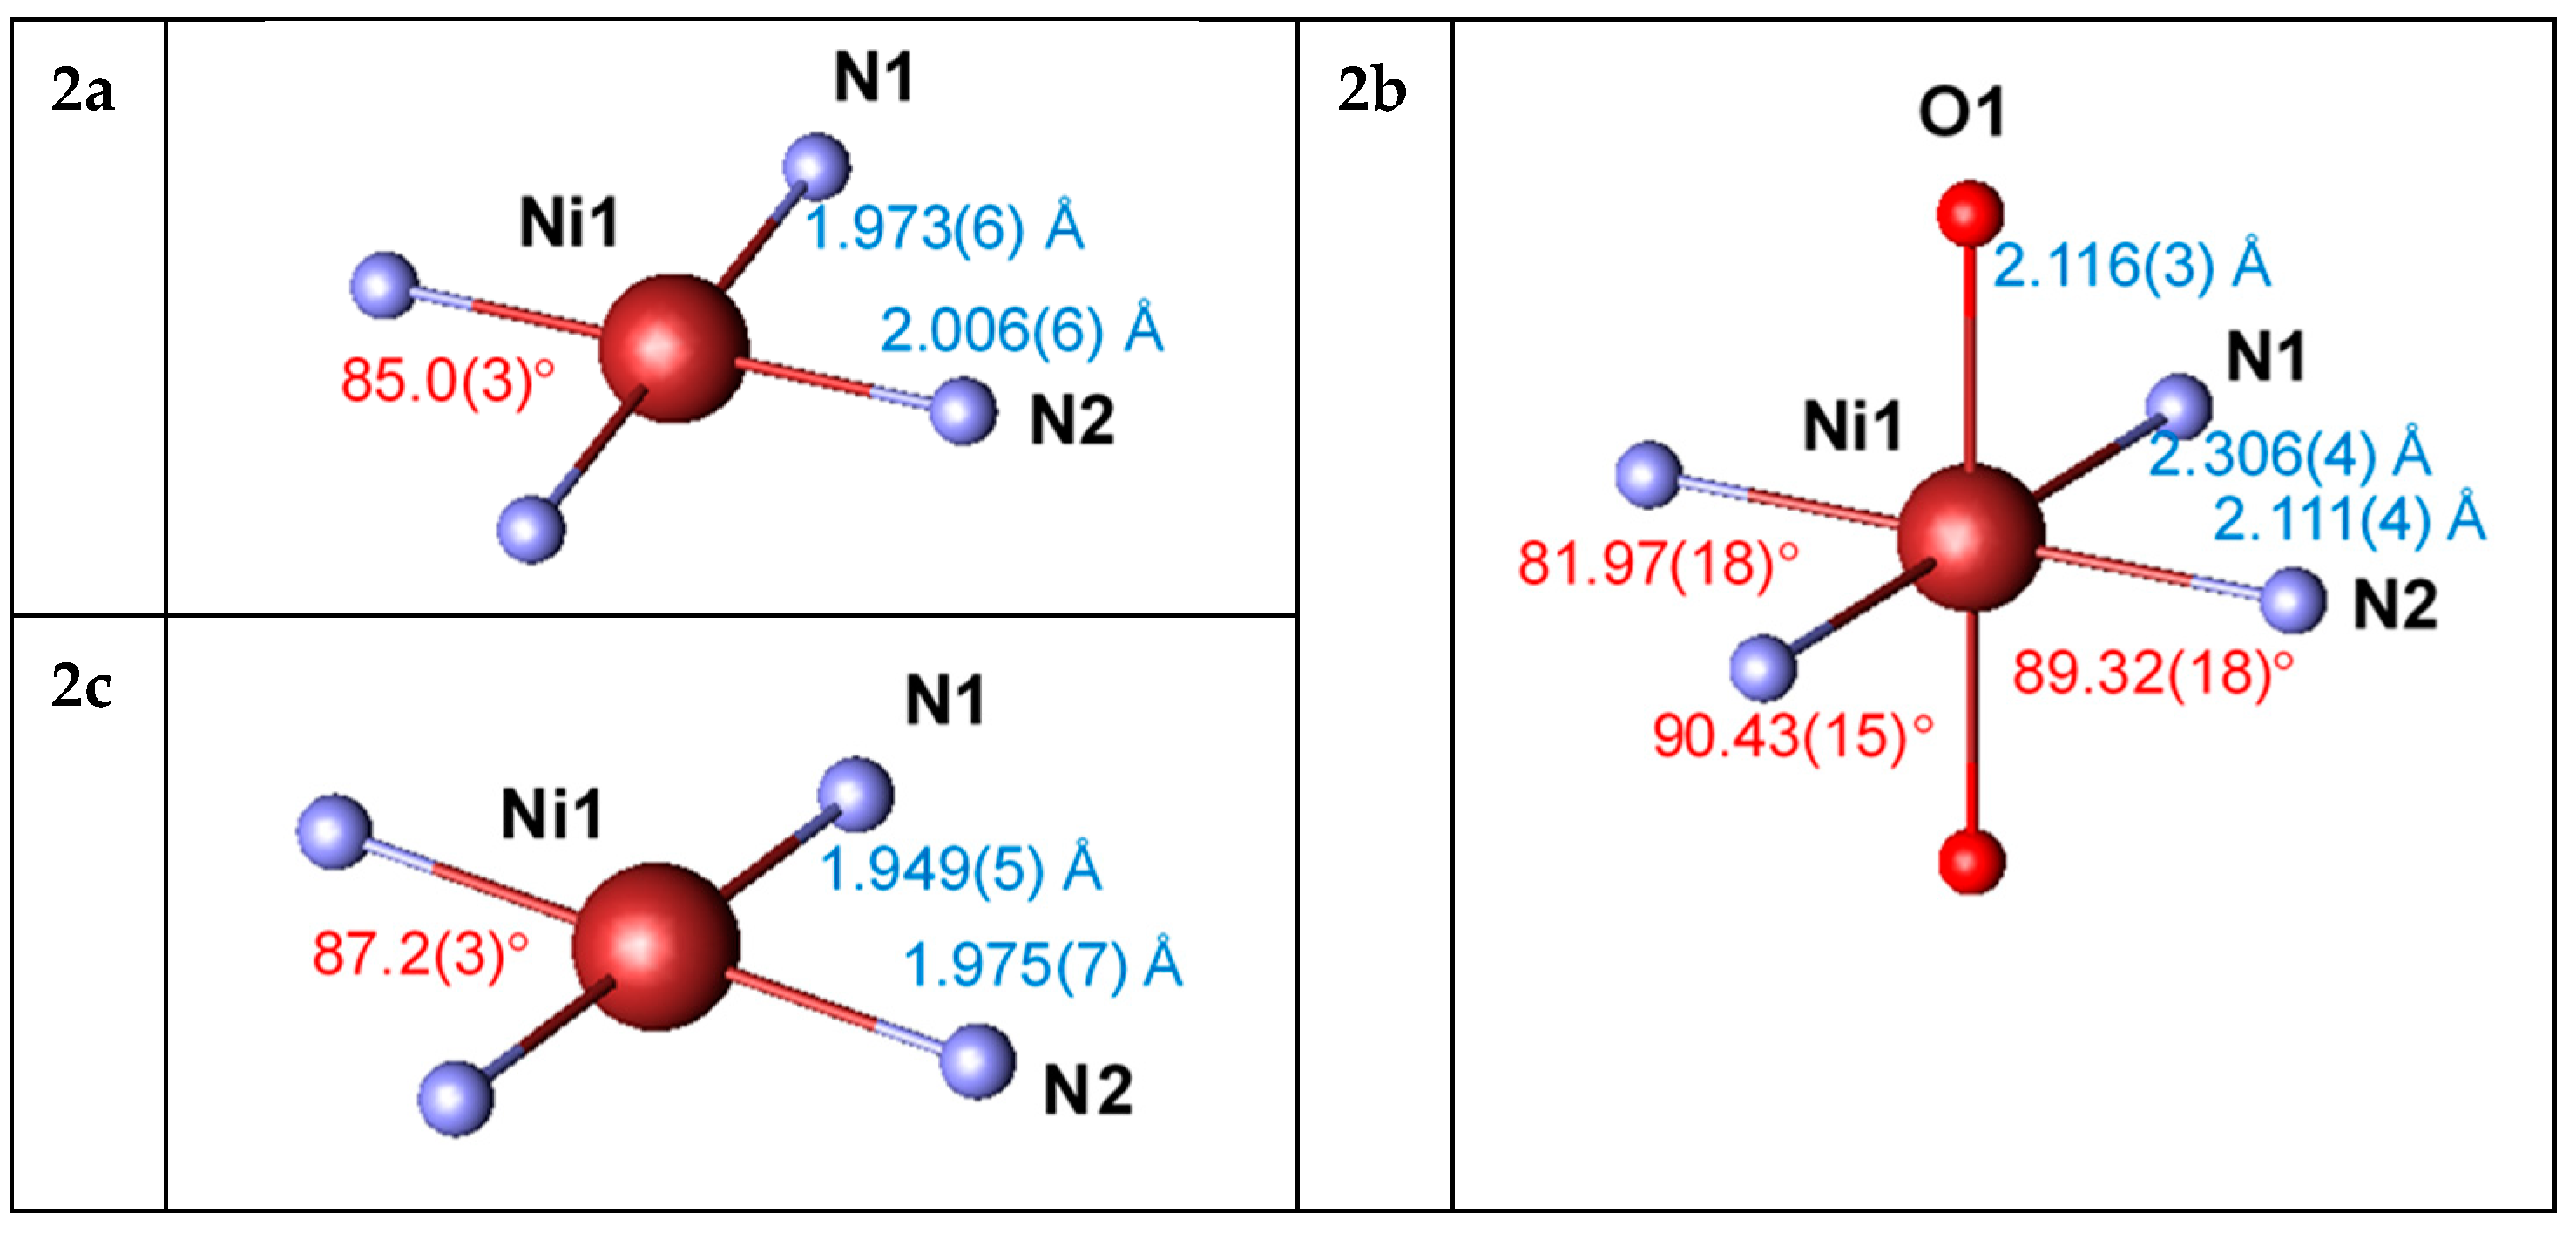
The distances and angles of bonds coordinated to the octahedral Ni(II) ion of 2a, 2b, and 2c are shown in Figure 9. Similar to the chloride complexes 1a and 1b, the Ni1-N1 distance is slightly longer than that of Ni1-N2 because the Ni1-N1 bond is electron-rich due to two electron-donating ethyl groups connected to the N1 atom. The N1-Ni1-N2 angle is significantly smaller than 90° because the N1 and N2 atoms are the members of the Et2en molecule.
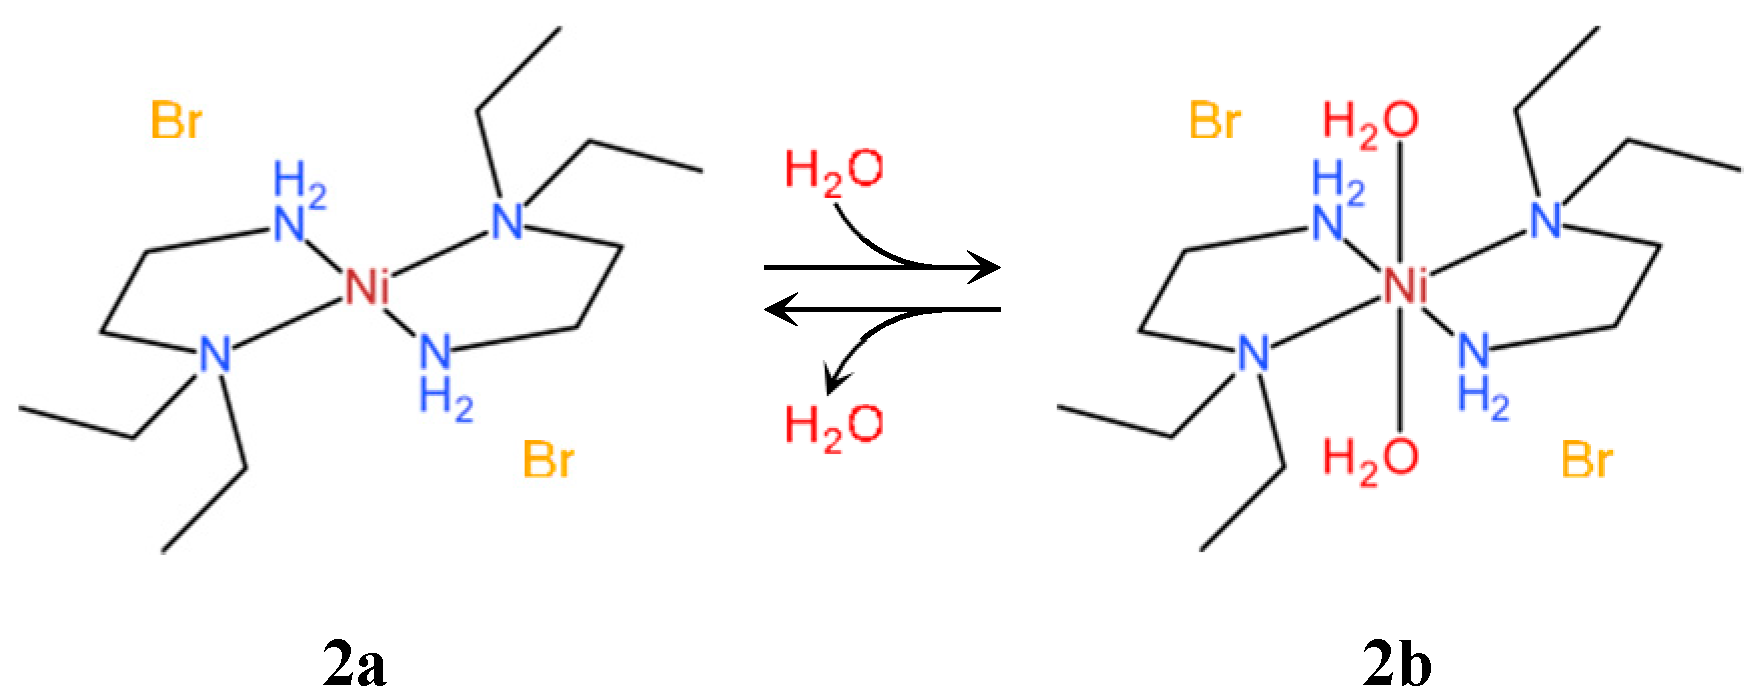
It is known that [Ni(Et2en)2]Br2 (2a) is transformed, under high humidity conditions, into a hydrated form [Ni(Et2en)2(H2O)2]Br2 (2b), where water molecules coordinate to Ni(II) by humidification as illustrated in Figure 10 [2]. In the present experiment, the 2a was converted to the 2b at 30% RH with exotherm at 300 K. Subsequent heating of the 2b from room temperature indicated an endothermic reaction at 344 K on DSC chart, and the 2b has been transformed into the new crystalline form 2c. In further heating, the 2c has been returned to the 2a in the temperature range from 390 K to 400 K as was clearly observed on the diffraction patterns (Figure 2) but without a conspicuous change in the DSC chart. The structural change from 2c to 2a’ (2a) is considered to occur with the rearrangement of hydrogen bonds between molecules but without changing the basic molecular conformation.
4. Summary
In this study, structural changes of the chloride and bromide complexes have been elucidated by the simultaneous XRD and DSC measurements under the temperature and humidity controls. The hydrate form of chloride complex 1a is transformed into the anhydrate form 1b, with increasing temperature, and the 1b has been reversibly returned to the original 1a by humidification. On the other hand, the anhydrate form of the bromide complex 2a has been first transformed into the hydrate form 2b. On heating, the 2b has been transformed to the intermediate form 2c by dehydration, and then it returned to the original form 2a. Since a series of reaction is proceeded via new phase 2c, and in that sense, the reaction process is not reversible.
The powder diffraction technique has been demonstrated to be very useful for the crystal structure determination when the single crystals suitable for single-crystal diffraction experiments are not available. The simultaneous measurements of XRD and DSC data are also useful for investigating the structural variations under the controls of environmental factors.
Author Contributions
Experiments, results and discussions, H.K.; writing, H.K.; review and editing, A.S. All authors have read and agreed to the published version of the manuscript.
Funding
This research received no external funding.
Conflicts of Interest
The authors declare no conflict of interest.
References
- Goodgame, D.M.L.; Venanzi, L.M. Diamine Complexes of Nickel(II). Part I. Complexes with NN-Diethylethylenediamine. J. Chem. Soc. 1963, 616–627. [Google Scholar] [CrossRef]
- Tsuchiya, R.; Joba, S.; Uehara, A.; Kyuno, E. Derivatographic Studies on Transition Metal Complexes. X. Thermal Octahedral-to-Square Planar Transformation of Ni(NN-deen)2X2·nH2O in Solid Phase. Bull. Chem. Soc. Jpn. 1973, 46, 1454–1456. [Google Scholar] [CrossRef] [Green Version]
- Fabbrizzi, L.; Micheloni, M.; Paoletti, P. Continuous and Discontinuous Thermochromism of Copper(II) and Nickel(II) Complexes with N,N-Diethylethylenediamine. Inorg. Chem. 1974, 13, 3019–3021. [Google Scholar] [CrossRef]
- Ferraro, J.R.; Basile, L.J.; G-Ineguez, L.R.; Paoletti, P.; Fabbrizzi, L. Concerning the Thermochromic Mechanism of Copper(II) and Nickel(II) Complexes of N,N-Diethylethylenediamine. Inorg. Chem. 1976, 15, 2342–2345. [Google Scholar] [CrossRef]
- Mitra, S.; De, G.; Chaudhuri, N.R. Thermal Investigation of Diamine Complexes of Nickel(II) in the Solid Phase. Thermochimica Acta 1983, 66, 187–195. [Google Scholar] [CrossRef]
- Ikeda, R.; Kotani, K.; Ohki, H.; Ishimaru, S.; Okamoto, K.; Ghosh, A. Studies on 2H NMR and single crystal X-ray diffraction of thermochromic bis(N,N-diethyl-1,2-ethanediamine) nickel(II) complexes with and without structural phase transitions. J. Mol. Struct. 1995, 345, 159–165. [Google Scholar] [CrossRef]
- Hayami, S.; Urakami, D.; Sato, S.; Kojima, Y.; Inoue, K.; Ohba, M. Structures and Dielectric Properties in Thermochromic Nickel(II) Compounds. Chem. Lett. 2009, 38, 490–491. [Google Scholar] [CrossRef]
- Ihara, Y.; Satake, Y.; Fujimoto, Y.; Senda, H.; Suzuki, M.; Uehara, A. X-Ray Crystal Structures of Octahedral Diaquabis(N,N-dialkylethylenediamine)nickel(II) Complexes Possessing Elongated Nickel(II)-Nitrogen Bonds along Axial Direction. Bull. Chem. Soc. Jpn. 1991, 64, 2349–2352. [Google Scholar] [CrossRef] [Green Version]
- Ferrara, S.J.; Mague, J.T.; Donahue, J.P. trans-Bis(N,N-diethylethylenediamine)-nickel(II) dibromide. Acta Cryst. 2011, E67, m48–m49. [Google Scholar] [CrossRef] [Green Version]
- Werner, P.-E.; Eriksson, L.; Westdahl, M. TREOR, a semi-exhaustive trial-and-erro poweder indexing program for all symmetries. J. Appl. Cryst. 1985, 18, 367–370. [Google Scholar] [CrossRef]
- Altomare, A.; Camalli, M.; Cuocci, C.; Giacovazzo, C.; Moliterni, A.; Rizzi, R. EXPO2009: Structure solution by powder data in direct and reciprocal space. J. Appl. Cryst. 2009, 42, 1197–1202. [Google Scholar] [CrossRef]
- Falcioni, M.; Deem, M.W. A biased Monte Carlo scheme for zeolite structure solution. J. Chem. Phys. 1999, 110, 1754–1766. [Google Scholar] [CrossRef] [Green Version]
- Rietveld, H.M. A profile refinement method for nuclear and magnetic structures. J. Appl. Cryst. 1969, 2, 65–71. [Google Scholar] [CrossRef]
- Sasaki, A.; Himeda, A.; Konaka, H.; Muroyama, N. Ab initio crystal structure analysis based on powder diffraction data using PDXL. Rigaku J. 2010, 26, 10–14. [Google Scholar]
Figure 1.
Results of XRD-DSC measurements: (a) during heating 1a (upper), (b) during humidifying 1b (lower).
Figure 1.
Results of XRD-DSC measurements: (a) during heating 1a (upper), (b) during humidifying 1b (lower).

Figure 2.
Results of XRD-DSC measurement: (a) during humidifying 2a (upper), (b) during heating 2b (lower).
Figure 2.
Results of XRD-DSC measurement: (a) during humidifying 2a (upper), (b) during heating 2b (lower).

Figure 3.
Results of Rietveld refinements for the crystal structures of 1a, 1b, and 1a’. Symbols (x) represent the observed profile intensities, blue lines represent the calculated profiles, and the differences between both intensities at the bottom of each pattern on the same intensity scale.
Figure 3.
Results of Rietveld refinements for the crystal structures of 1a, 1b, and 1a’. Symbols (x) represent the observed profile intensities, blue lines represent the calculated profiles, and the differences between both intensities at the bottom of each pattern on the same intensity scale.

Figure 4.
Crystal structure of 1a and 1b.

Figure 5.
Distances and angles of bonds around the Ni(ii) ion of 1a and 1b.

Figure 6.
Structural changes of 1a and 1b.

Figure 7.
Results of Rietveld refinements for the 2a, 2b, 2c, and 2a’. Data are plotted as in Figure 3.
Figure 7.
Results of Rietveld refinements for the 2a, 2b, 2c, and 2a’. Data are plotted as in Figure 3.

Figure 8.
Crystal structure of 2a, 2b, and 2c.

Figure 9.
Distances and angles of bonds around Ni(ii) ion of 2a, 2b, and 2c.

Figure 10.
Structural changes of 2a and 2b.


Table 1.
Crystallographic data of samples 1a, 1b, and 1a’.
| Sample | 1a | 1b | 1a’ |
|---|---|---|---|
| Crystal system | Monoclinic | Triclinic | Monoclinic |
| Space group | P21/n | P-1 | P21/n |
| a (Å) | 9.2046(1) | 6.5439(3) | 9.1783(1) |
| b (Å) | 8.7403(1) | 6.8553(3) | 8.7153(1) |
| c (Å) | 12.4664(1) | 10.7084(5) | 12.4321(2) |
| α (°) | 90 | 74.339(1) | 90 |
| β (°) | 104.4432(4) | 82.765(1) | 104.4694(4) |
| γ (°) | 90 | 77.643(2) | 90 |
| V (Å3) | 971.242(13) | 450.64(3) | 962.91(3) |
| Z | 2 | 1 | 2 |
| Z’ | 0.5 | 0.5 | 0.5 |
| Rp | 4.29% | 5.89% | 3.49% |
| Rwp | 5.99% | 8.21% | 4.51% |
| S | 1.39 | 1.28 | 1.08 |
Table 2.
Crystallographic data of samples of 2a, 2b, 2c, and 2a’.
| Sample | 2a | 2b | 2c | 2a’ |
|---|---|---|---|---|
| Crystal system | Monoclinic | Monoclinic | Monoclinic | Monoclinic |
| Space group | C2/c | P21/n | P21/n | C2/c |
| a (Å) | 13.0152(3) | 9.2587(2) | 9.3036(4) | 13.0882(3) |
| b (Å) | 11.5547(3) | 8.9071(2) | 8.0564(4) | 11.7373(2) |
| c (Å) | 12.9689(4) | 12.7873(2) | 12.6451(6) | 12.8290(3) |
| α (°) | 90 | 90 | 90 | 90 |
| β (°) | 105.7195(6) | 104.1356(4) | 100.1845(14) | 105.1115(4) |
| γ (°) | 90 | 90 | 90 | 90 |
| V (Å3) | 1877.41(9) | 1022.61(3) | 932.86(8) | 1902.63(7) |
| Z | 4 | 2 | 2 | 4 |
| Z’ | 0.5 | 0.5 | 0.5 | 0.5 |
| Rp | 3.82% | 3.24% | 3.27% | 4.30% |
| Rwp | 5.02% | 4.24% | 4.21% | 5.57% |
| S | 1.01 | 1.16 | 1.31 | 1.12 |
© 2020 by the authors. Licensee MDPI, Basel, Switzerland. This article is an open access article distributed under the terms and conditions of the Creative Commons Attribution (CC BY) license (http://creativecommons.org/licenses/by/4.0/).
Share and Cite
MDPI and ACS Style
Konaka, H.; Sasaki, A. Phase Transitions and Crystal Structures of Ni(II) Complexes Determined with X-ray Powder Diffraction Data. Crystals 2020, 10, 106. https://0-doi-org.brum.beds.ac.uk/10.3390/cryst10020106
AMA Style
Konaka H, Sasaki A. Phase Transitions and Crystal Structures of Ni(II) Complexes Determined with X-ray Powder Diffraction Data. Crystals. 2020; 10(2):106. https://0-doi-org.brum.beds.ac.uk/10.3390/cryst10020106
Chicago/Turabian StyleKonaka, Hisashi, and Akito Sasaki. 2020. "Phase Transitions and Crystal Structures of Ni(II) Complexes Determined with X-ray Powder Diffraction Data" Crystals 10, no. 2: 106. https://0-doi-org.brum.beds.ac.uk/10.3390/cryst10020106
Note that from the first issue of 2016, this journal uses article numbers instead of page numbers. See further details here.