Article

Scintillation and Energy-Storage Properties of Micro-Pulling-Down Grown Crystals of Sc3+- and La3+-Doped YAlO3 Perovskite

1
Institute of Nuclear Physics Polish Academy of Sciences, Radzikowskiego 152, PL31342 Krakow, Poland
2
Physical Faculty Ivan Franko National University in Lviv, Lomonosov 11, 79005 Lviv, Ukraine
3
Institute of Physics, Kazimierz Wielki University in Bydgoszcz, Powstańców Wielkopolskich 2, PL85090 Bydgoszcz, Poland
*
Author to whom correspondence should be addressed.
Submission received: 7 April 2020 / Revised: 3 May 2020 / Accepted: 7 May 2020 / Published: 8 May 2020
(This article belongs to the Section Inorganic Crystalline Materials)

Abstract

:
The scintillation and energy-storage properties of YAlO3 (YAP) crystals doped with Sc3+ and La3+ isoelectronic dopants were investigated in this work. The YAP:Sc and YAP:La crystals were grown from the melt with a nominal Sc and La content in the 0.2–5.0 mol.% range using the novel micro-pulling-down method. We found that the segregation coefficient of Sc ions in YAP:Sc (0.2–1.0 mol.%) crystals is about of 0.35–0.4 and decreases to around 0.2 at Sc content of 5.0 mol.% when the segregation coefficient of La ions in YAP:La (1.0–5.0 mol.%) crystals is 0.008–0.01. The scintillation and stimulated luminescence phenomena, like thermo- and photoluminescence, were utilized for the property characterization of the studied materials. The cathodoluminescence and X-ray-excited luminescence were used for the imitation of scintillation in the YAP:Sc and YAP:La crystals. The influence of Sc3+ and La3+ dopant concentration on the CL and RL emission spectra, as well as the shape of the measured thermoluminescence (TL) glow-curves, was also investigated. The measured emission spectra showed dominant emission of Sc3+ and La3+ ions in the UV range. For this reason, the YAP:Sc and YAP:La crystals can be considered for creation of ultraviolet (UV)-emitting scintillators. For the undoped YAlO3 crystals, the main TL emission peak occurs in a low-temperature range at 375 K. Meanwhile, even a small addition of dopants causes a strong suppression of luminescence of the YAP host and high-temperature peaks become dominant in the TL glow-curves of YAP:Sc and YAP:La crystals. Moreover, the amplitude of emission does not change monotonically with increasing dopant content. The kinetic parameters of emission were also evaluated, and the first-order behavior was confirmed in all cases. The dosimetric properties of investigated materials such as dose response, fading rate, and the lowest measurable dose are also discussed. The obtained results tend to suggest that the YAlO3 perovskite host, apart from its application for the development of efficient scintillators, may also be considered as a promising matrix for the creation of energy-storage phosphors for dosimetric applications.

1. Introduction

The micro-imaging technique utilizing X-ray sources for applications in biology, medicine, or industry needs the creation of efficient scintillation screens for micro-tomography image detectors with a spatial resolution in the μm range. During the last few years, new scintillation materials based on mixed oxide crystals of perovskite and garnet structure doped with rare-earth ions were developed for such a purpose. These materials showed advantageous properties as superior light yield (LY) and higher energy resolution [1,2,3]. Meanwhile, the oxide compounds (as garnets and perovskites) doped with Sc3+ and La3+ ions, with the most efficient luminescence emission in the ultraviolet (UV) range, attract the attention of many scientists due to their interesting scintillation properties. Sc3+- and La3+-doped garnets and perovskites are characterized by relatively fast emission decay, large light yield, and high energy resolution [4,5]. Taking into account that the spatial resolution of scintillating screens is primordial to the energy of their luminescence, the latter implies that the application of UV-emitting Sc3+- and La3+-doped scintillation materials to the micro-imaging technique can also improve the spatial resolution of the detector.
Scintillation properties of Sc3+- and La3+-doped YAlO3 (YAP) single crystalline films prepared using the liquid phase epitaxy (LPE) method were previously investigated by Zorenko et al. [6]. Meanwhile, the luminescent and scintillation properties of Sc3+- and La3+-doped YAlO3 crystals grown from the melt using a novel micro-pulling-down method are studied in this work for the first time.
It should be emphasized that mixed perovskite and garnet compounds are known as fast and efficient scintillators; thus, investigations are usually focused mainly on the scintillation properties. On the other hand, it should be noted that these materials also exhibit stimulated luminescence phenomena, such as thermoluminescence (TL) and optically stimulated luminescence (OSL). In such phenomena, the stage of trapping and storage of free charge carriers is also involved and plays a significant role in the scintillation properties as well. As mentioned above, scintillation and energy-storage properties of Sc3+- and La3+-doped YAP single crystals were never previously studied. Meanwhile, the evidence of the OSL emission in cerium-doped lutetium–aluminum garnet (LuAG) crystals was recently reported [7]. However, it should be noted that the possibilities of energy storage by mixed perovskite and garnet compounds were earlier suggested by our research group [8,9]. Apart from the scintillation properties, such an investigation indicates the potential and perspectives for dosimetric applications of investigated materials as well. Therefore, the combined measurements of both scintillating and energy-storage properties of the materials are a very important trend in the development of new phosphors regarding the better understanding of luminescence mechanisms and possible development of efficient radiation detectors [10,11,12].
Comparative studies of luminescent properties of YAP perovskite crystals doped with UV-emitting Sc3+ and La3+ isoelectronic impurities constitute the major aim of this work. We also show that the materials under study exhibit both scintillating and energy-storage properties. The latter is the primary importance of dosimetric applications. In this work, we want to refer to our previous paper [8], where luminescent and scintillating properties of Tb3+- and Eu3+-doped mixed perovskite crystals were investigated. In order to gain insight into the energy-storage mechanism of well-known YAP crystals, we also study some basic dosimetric properties, such as dose–response, fading, and the lowest measurable dose, as well as undertake the analysis of kinetic parameters. The latter was established using Tmax–Tstop and TL glow-curve deconvolution methods. The dependence of the number of single TL components and kinetic parameters on the different dopant concentrations in YAlO3 crystals is also discussed.

2. Materials and Methods

2.1. Sample Preparation

Sc3+- and La3+-doped YAP crystals with different dopant contents (0.2 mol.%, 1.0 mol.%, and 5.0 mol.%) were grown from the melt using the micro-pulling-down (µPD) method. The unique device manufactured by Cyberstar (France) and installed at the Institute of Nuclear Physics Polish Academy of Sciences (IFJ PAN) in Krakow, Poland was utilized. An inductive furnace powered by the 20-kW radio-frequency (RF) generator constitutes the major part of the system. The system is dedicated to the growth of single crystals of materials where melting points can reach or even exceed the value of 2000 °C (such temperatures can be easily achieved in the device). Initially, this device was designed only for the µPD method; however, after the recent upgrade, the system can also be used for crystal growth via the conventional Czochralski method. Both methods represent the melt-growth techniques where the crystals grow, in most cases, on a well-defined oriented crystallization seed.
The μPD method is a method of crystal growth where the main stage is based on pulling of the melted material in a downward direction through the micro-capillary channel performed at the bottom of a specially designed conductive metal crucible [13]. As compared to the conventional Czochralski method, the μPD method can be considered as an adequate tool for fast material screening. This is because the relative high pulling rates combined with the small amount of required starting materials make the μPD a fast and cheap method of achieving high-optical-quality crystal growth suitable for material research and crystals engineering [14]. Moreover, the possibility of shape-controlled crystal growth complicates mechanical machining, during which a large amount of the as-grown crystal is lost, which is not usually needed in this case.
Starting materials for crystal growth experiments were prepared by mixing the appropriate oxides in stoichiometric proportions. Yttrium(III) oxide (REacton®, 99.9% (REO)) and aluminum oxide (α-phase, 99.98% metal basis, <1 µm APS powder) powders were used as starting reagents. For doping the samples with Sc3+ and La3+, Sc2O3 and La2O3 oxides were utilized, respectively. The crystals were grown at the constant growth rate of 0.2 mm/min in an inert gas atmosphere (Ar). The obtained rod-shaped crystals were around 3 mm in diameter and up to several cm in length. For the measurements, the as-grown crystals were cut into slices of around 1.5 mm thickness. To minimize the differences in the signal intensities resulting from the different sizes of crystals, all investigated samples were weighted, and the signal intensity measured for a given sample was normalized to its mass.
The composition of the as-grown crystals was studied using a scanning electron microscope (SEM) SEM JEOL (JEOL, Tokyo, Japan) equipped with an energy-dispersive X-ray spectroscopy (EDS) detector YX. The crystals were coated with a thin graphite layer to facilitate conductivity. The X-ray diffraction analysis of crystals was performed using the modified DRON 4 diffractometer with the Cu X-ray source.

2.2. Luminescence Measurements

The luminescence properties of Sc3+- and La3+-doped YAP single crystals were investigated using cathodoluminescence (CL), X-ray excited luminescence (RL), and thermoluminescence (TL) methods. The CL spectra were measured at room temperature (RT) using an electron microscope SEM JEOL with 10-keV electron beam excitation coupled with a Stellar Net grating spectrometer (StellarNet Inc., Tampa, FL, USA) and TE-cooled charge-coupled device (CCD) detector working in the 200–1100 nm range. RL was measured using the set-up based on the FEU-10 photomultiplier and MDR grating monochromator under pulsed X-ray excitation with a pulse duration of 1 ns. It should be mentioned that e-beam-excited CL and X-ray-excited RL adequately imitate scintillation phenomena in the crystals under study. In CL and RL, the luminescence emission of the materials under study is directly excited by the 10-keV electron beam and 30-keV X-ray quanta. Meanwhile, similarly to the TL phenomenon, the stage of trapping and storage of free charge carriers by electron/hole traps is also very important in the scintillation performance of materials.
Thermoluminescence measurements were carried out using a Risø TL/OSL DA-20 reader (Risø DTU, Denmark). A bialkali photomultiplier tube (EMI 9235 QB) constitutes the major part of the DA-20 reader detection system. The Risø reader is also equipped with the irradiator holding a 90Sr/90Y beta source. A detailed description of the reader regarding high-dose high-temperature measurements was presented by Bilski et al. [15]. The readouts were performed using the U340 optical filter in a registration path. The filter transmits the light over the wavelength range from 250 to 400 nm; thus, it is the most suitable for the measurements of luminescence signal of UV-emitting elements as Sc3+ and La3+ investigated in this work. The measurements of TL were performed from room temperature to 673 K at a constant heating rate of 5 K/s. The glow-curves measured for investigated samples were next analyzed using dedicated GlowVIEW software [16]. For the dose–response evaluation, the measured glow-curves were integrated over the temperature range of 300–623 K. Where applicable, the non-radiation-induced background signal was subtracted using a novel two-point fitting procedure implemented in the GlowVIEW software [16].

2.3. The Lowest Measureable Dose and Fading Investigations

As the energy-storage property evaluation constitutes the major part of this research paper, the lowest measurable dose (LMD) and fading have to be deeply investigated. The LMD can be also considered as the detection threshold of the material for ionizing radiation. It also allows assessing if the material is suitable for a given application. For example, the material which has the LMD at the level of mGy is rather not suitable for applications in the environmental dosimetry, where µGy doses should be efficiently measured. On the other hand, this same material can be effectively utilized in the case of clinical dosimetry (e.g., in radiotherapy), where mGy doses are usually measured. Of course, other characteristics should also be taken into account when assessing the usability of the material for a given application. For the LMD evaluation, the luminescence signal of non-irradiated samples was measured ten times (utilizing the same temperature profile as described in Section 2.2). The LMD value was determined as three standard deviations from the signal of the unexposed sample recalculated to the absorbed dose in a given material based on the appropriately determined calibration value.
Fading is an extremely important feature considering the energy-storage properties of the material. Fading is defined as spontaneous loss of luminescent signal occurring even at RT without an additional thermal or optical stimulation of the sample. The charge carriers stored in the so-called shallow traps have the main contribution to fading. Shallow traps are reflected in low-temperature TL peaks appearing in the measured glow-curves. The low-temperature peaks are thermally unstable and tend to fade even at RT. Fading is a very undesirable phenomenon which has to be taken into account in all cases when the measurements are not conducted immediately after the irradiation. For fading analysis, all the crystal samples were irradiated with the dose of 20 Gy, and the readouts were undertaken after the different time periods, namely, 1 h, 5 h, 12 h, 24 h, 96 h, and 175 h after the irradiation.

2.4. Kinetics Parameters Evaluation

One of the applied methods to analyze kinetic parameters was Tmax–Tstop [17]. This method gives reliable information about a possible number of single TL components and the most probable temperature range of their maxima positions. In this method, the sample was irradiated with a dose of 10 Gy and preheated to a specific temperature Tstop with a constant heating rate of 5 K/s and cooled. Next, the remaining TL glow-curve was registered at the same heating profile. The position of the first glow-curve maximum (Tmax) was noted and, next, for the different Tstop values (changing by a 5-K step), the whole procedure was repeated. A plot of Tmax vs. Tstop reveals a “staircase”-shaped pattern where each flat region corresponds to the presence of an individual TL component. Nevertheless, one should remember that this method reveals only the most prominent peaks, as smaller ones remain hidden by the neighbors. Moreover, only estimates of the true peak positions are given, as the Tmax values are usually higher than the actual peak positions because of peak overlapping. The resolution of this method is estimated to be approximately 5 K [17]. The measured TL glow-curves were next deconvoluted into single components using the data provided by the Tmax–Tstop method. For glow-curve deconvolution, dedicated GlowFit software was utilized [18].

3. Results and Discussion

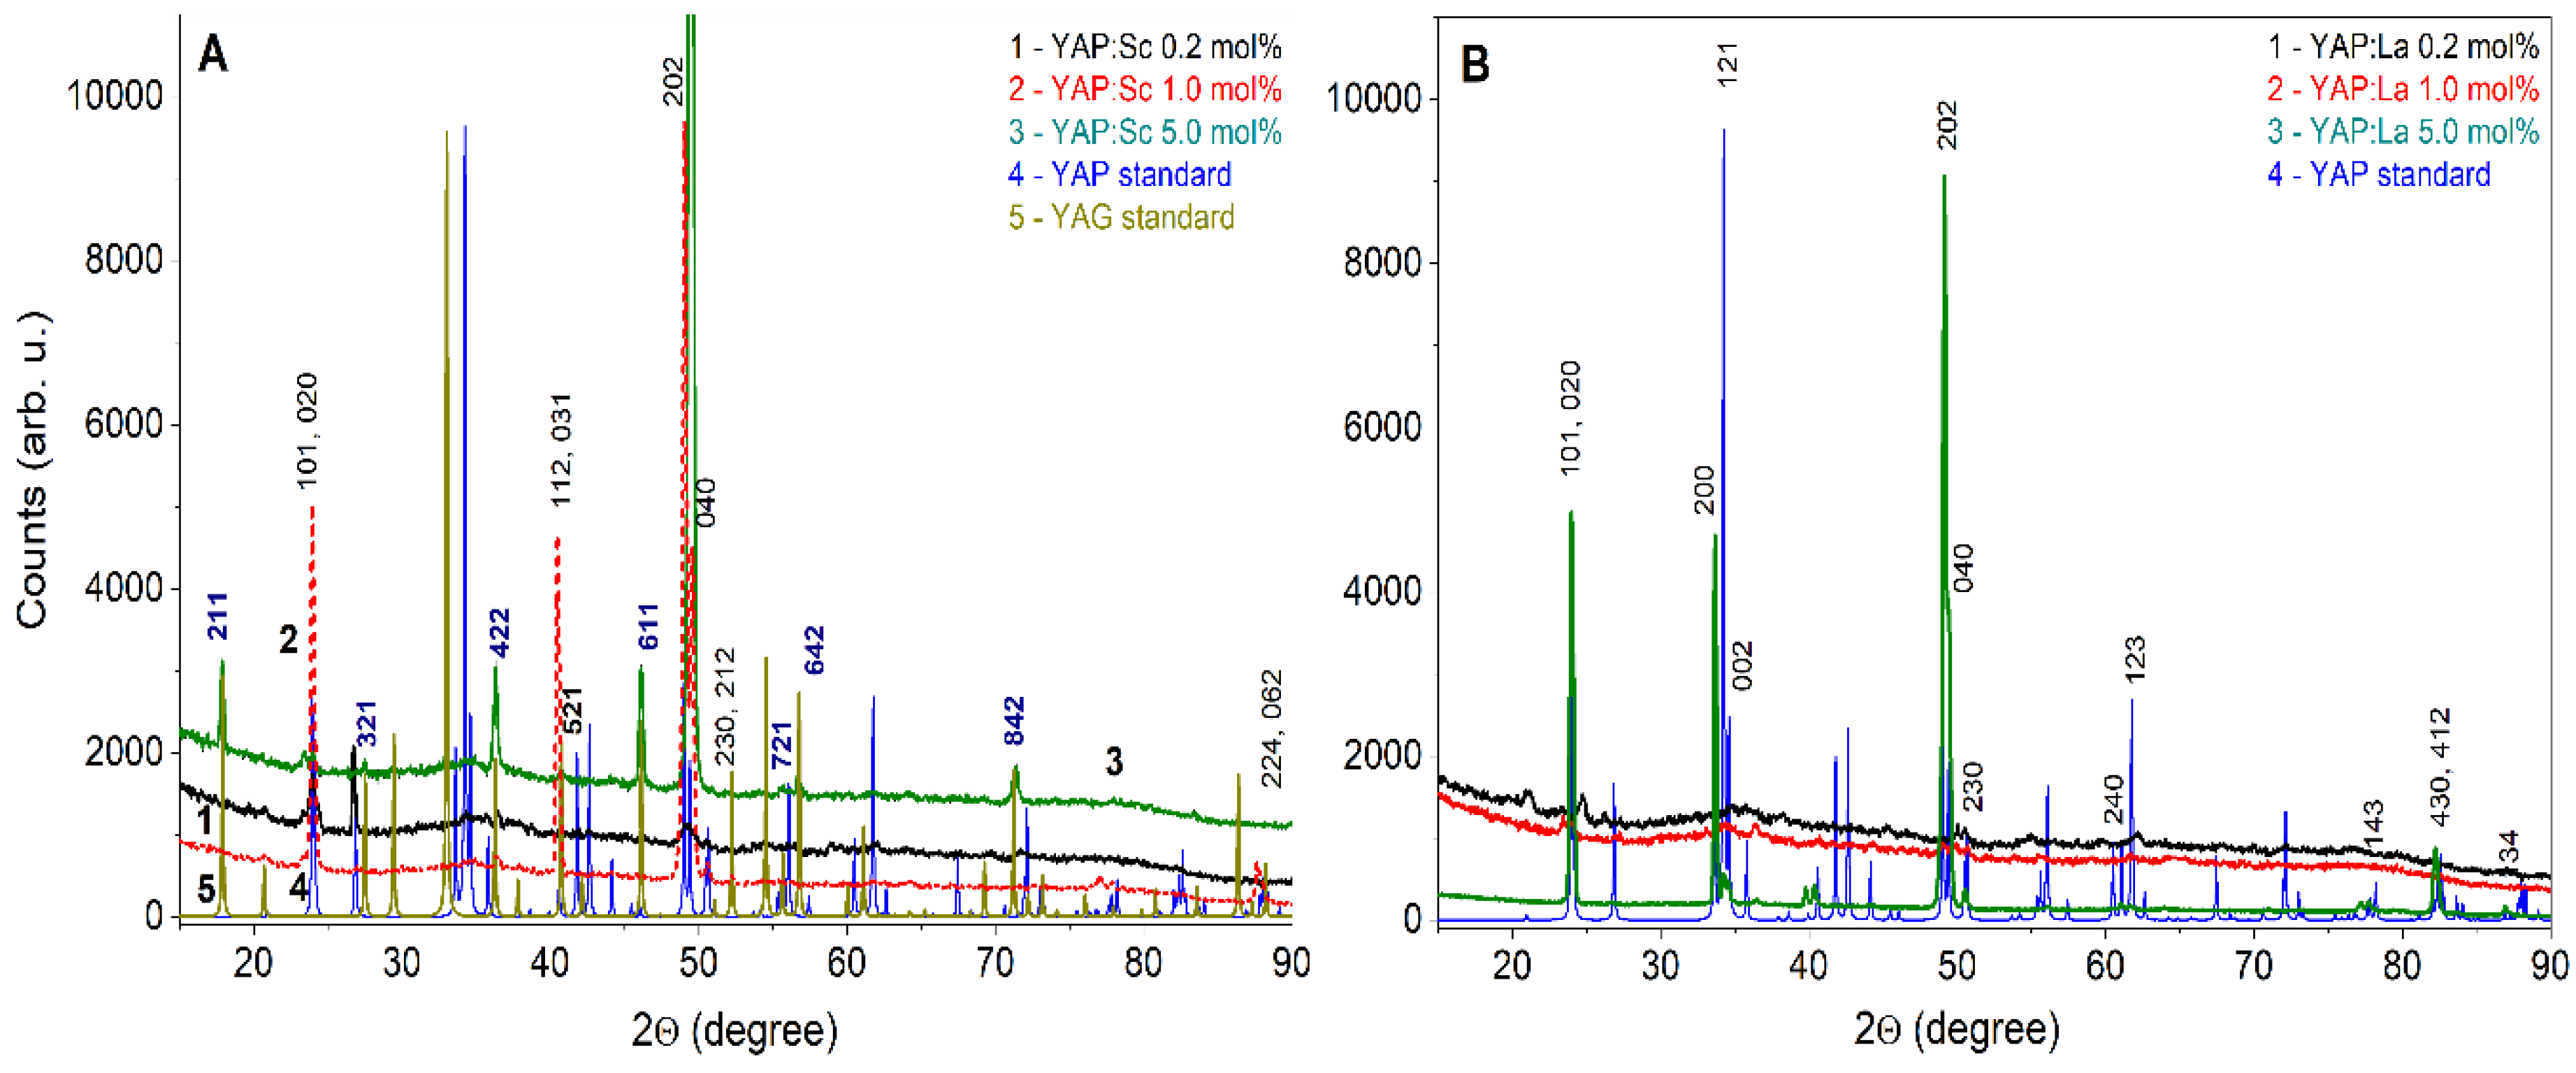
3.1. Composition Analysis

The µPD-grown YAP:Sc crystals with a nominal Sc concentration in the melt in 0.2–5.0 mol.% range showed the perovskite structure with a dominant (111) orientation (at Sc content of 0.2 mol.%) and (010) orientation (at Sc content of 5.0 mol.%) (see Figure 1A). The YAP:Sc (1.0 mol.%) sample presents the structure containing the three crystal blocks with dominant (101), (010), and (112) orientations. Meanwhile, the YAP:Sc (5.0 mol.%) crystals, apart from the main perovskite phase, also showed the presence of an yttrium aluminum garnet (YAG) garnet structure with a lattice constant of 12.1216 Å. It seems that a large Sc content (above 1.0 mol.%) shifts the conditions of growth from perovskite to garnet phase. The X-ray diffraction (XRD) spectra are shown in Figure 1
The µPD-grown YAP:La crystals with a nominal La concentration in the melt in 0.2–5.0 mol.% range showed only the perovskite structure, but with a large amount of polycrystalline amorphous phase. The best quality of crystals was observed for YAP:La (1.0 mol.%) and especially for YAP:La (5.0 mol.%) samples with a dominant (010) orientation (at La content of 1.0 mol.%) and (101) and (010) at La content of 5.0 mol.%.
The analyses of YAP:Sc samples content indicated that the segregation coefficient of Sc ions is about of 0.35–0.4 at nominal Sc concentration in the 0.2–1.0 mol.% range, and it strongly decreases to around 0.2 at an Sc content of 5.0 mol.%. The segregation coefficient of La ions in YAP:La crystals is very low and is equal to 0.008–0.01 at an La content of 1.0–5.0 mol.%. Meanwhile, due to the detection limit of the EDS analyses, the La content in the YAP:La 0.2 mol.% sample could not be determined.

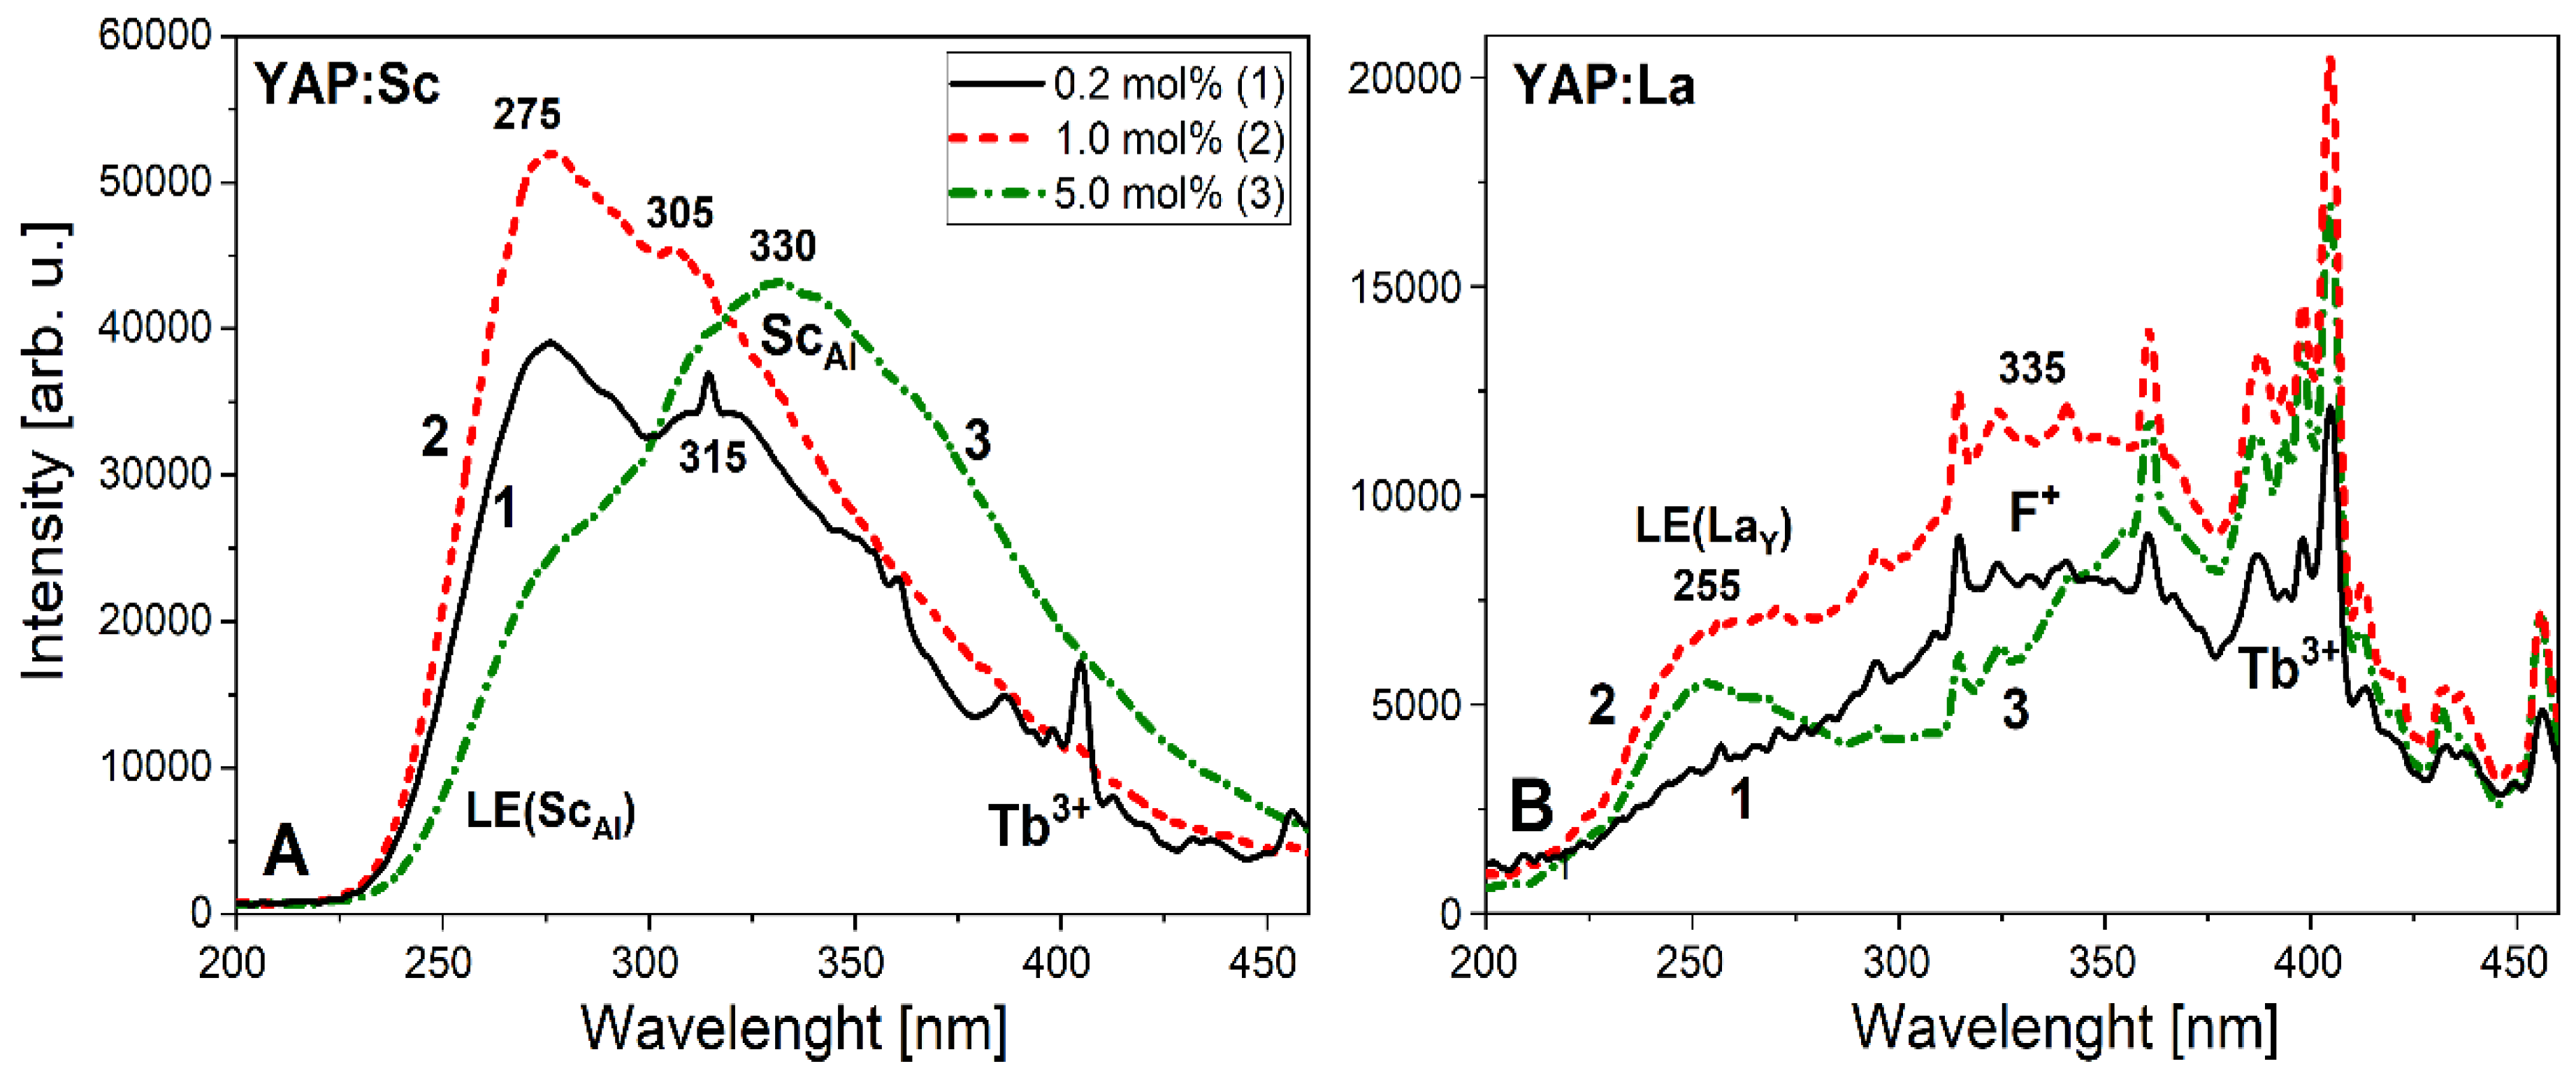
3.2. Cathodoluminescence Measurements

The CL spectra of YAlO3:Sc and YAlO3:La crystal samples with different dopant concentrations are shown in Figure 2A,B, respectively. The CL spectra of YAlO3:Sc consist of the Sc3+-related bands peaked at 275 nm and 315 nm (Figure 2A). The maximum intensity of Sc3+ centers was achieved at the Sc3+ concentration of 1 mol.%. Meanwhile, the increase in Sc3+ content from 1.0 to 5.0 mol.% led to the significant change of the spectrum form and the shift of the maximum of the main band up to 330 nm. Therefore, it is most probable that the Sc3+ dopant provides two types of emission centers in the UV range in the YAP host [6]. Following the interpretation presented in Reference [6], the emission in the band peaked at 275 and 315 nm can correspond to the luminescence of the excitons localized at and bound with Sc3+ isoelectronic dopant in Al sites of YAP host (LE(ScAl) and ScAl centers, respectively). Increasing the total Sc concentration in YAP:Sc crystals led to the distribution of intensity of these centers, and the emission of the second center was dominated at a nominal Sc3+ content of 5.0 mol.% (Figure 2A, curve 3).
In the case of YAlO3:La crystals (Figure 2B), La3+ ions provided new emission centers in the UV range in the band peaked at 255 nm. Most probably, this band was related to the luminescence of the excitons localized around La dopant (LE(LaY) centers), but the intensity of this emission band was very low. Specifically, the intensity of this band even in the highly doped YAP:La (1.0–5.0 mol.%) crystals was at least 10 times lower as compared to the intensity of Sc3+-related bands in YAP:Sc 1.0 mol.% crystals and comparable with the intensity of a wide band peaked at 335 nm that was most probably related to the luminescence of F+ centers in the YAP host [19]. The emission of investigated materials in the near-UV and visible ranges was probably caused by the trace impurities of Tb3+ ions. The emission bands of Tb3+ ions are assigned to the transitions from 5D3 level to 7FJ levels (J = 6–0) in the 380–490 nm range.

3.3. RL Spectra and Decay Kinetics

The RL emission spectra of YAP:Sc crystals with Sc concentration of 0.2 and 1.0 mol.% measured at RT are shown in Figure 3A. In general, the RL emission spectra of these crystals (Figure 3B) are well correlated with the CL spectra of respective samples (Figure 2A), except for the ratio between the total intensity of luminescence in the various emission bands due to the different size of samples and areas of excitation. The main emission band, related to the luminescence of the excitons localized around the Sc ions (LE(ScAl)) centers), was observed at 275 nm, while the other emission band, peaked at around 320 nm, related to the luminescence of the exciton bound with ScAl centers, was also well separated in these spectra.
The decay kinetics of RL of YAlO3:Sc crystals with an Sc concentration of 0.2 mol.% confirmed the above-mentioned assumptions. Indeed, the luminescence decay kinetics of two mentioned centers, registered in the vicinity of the respective emission bands at 275 and 320 nm, showed the typical shape of the decay curves corresponding to the creation of the triplet types of excitons (see References [6,20,21,22,23] for more details). The three-component approximation I = Σ Aiexp(−t/τi) of such decay curves gave the three decay components of luminescence of LE (ScAl) and ScAl centers with decay times being equal to t1 = 260 and 400 ns, t2 = 1325 and 1915 ns, and t3 = 3325 and 4950 ns. Meanwhile, due to the lower intensity of LaY centers, the investigation of RL in YAP:La crystals was not performed.

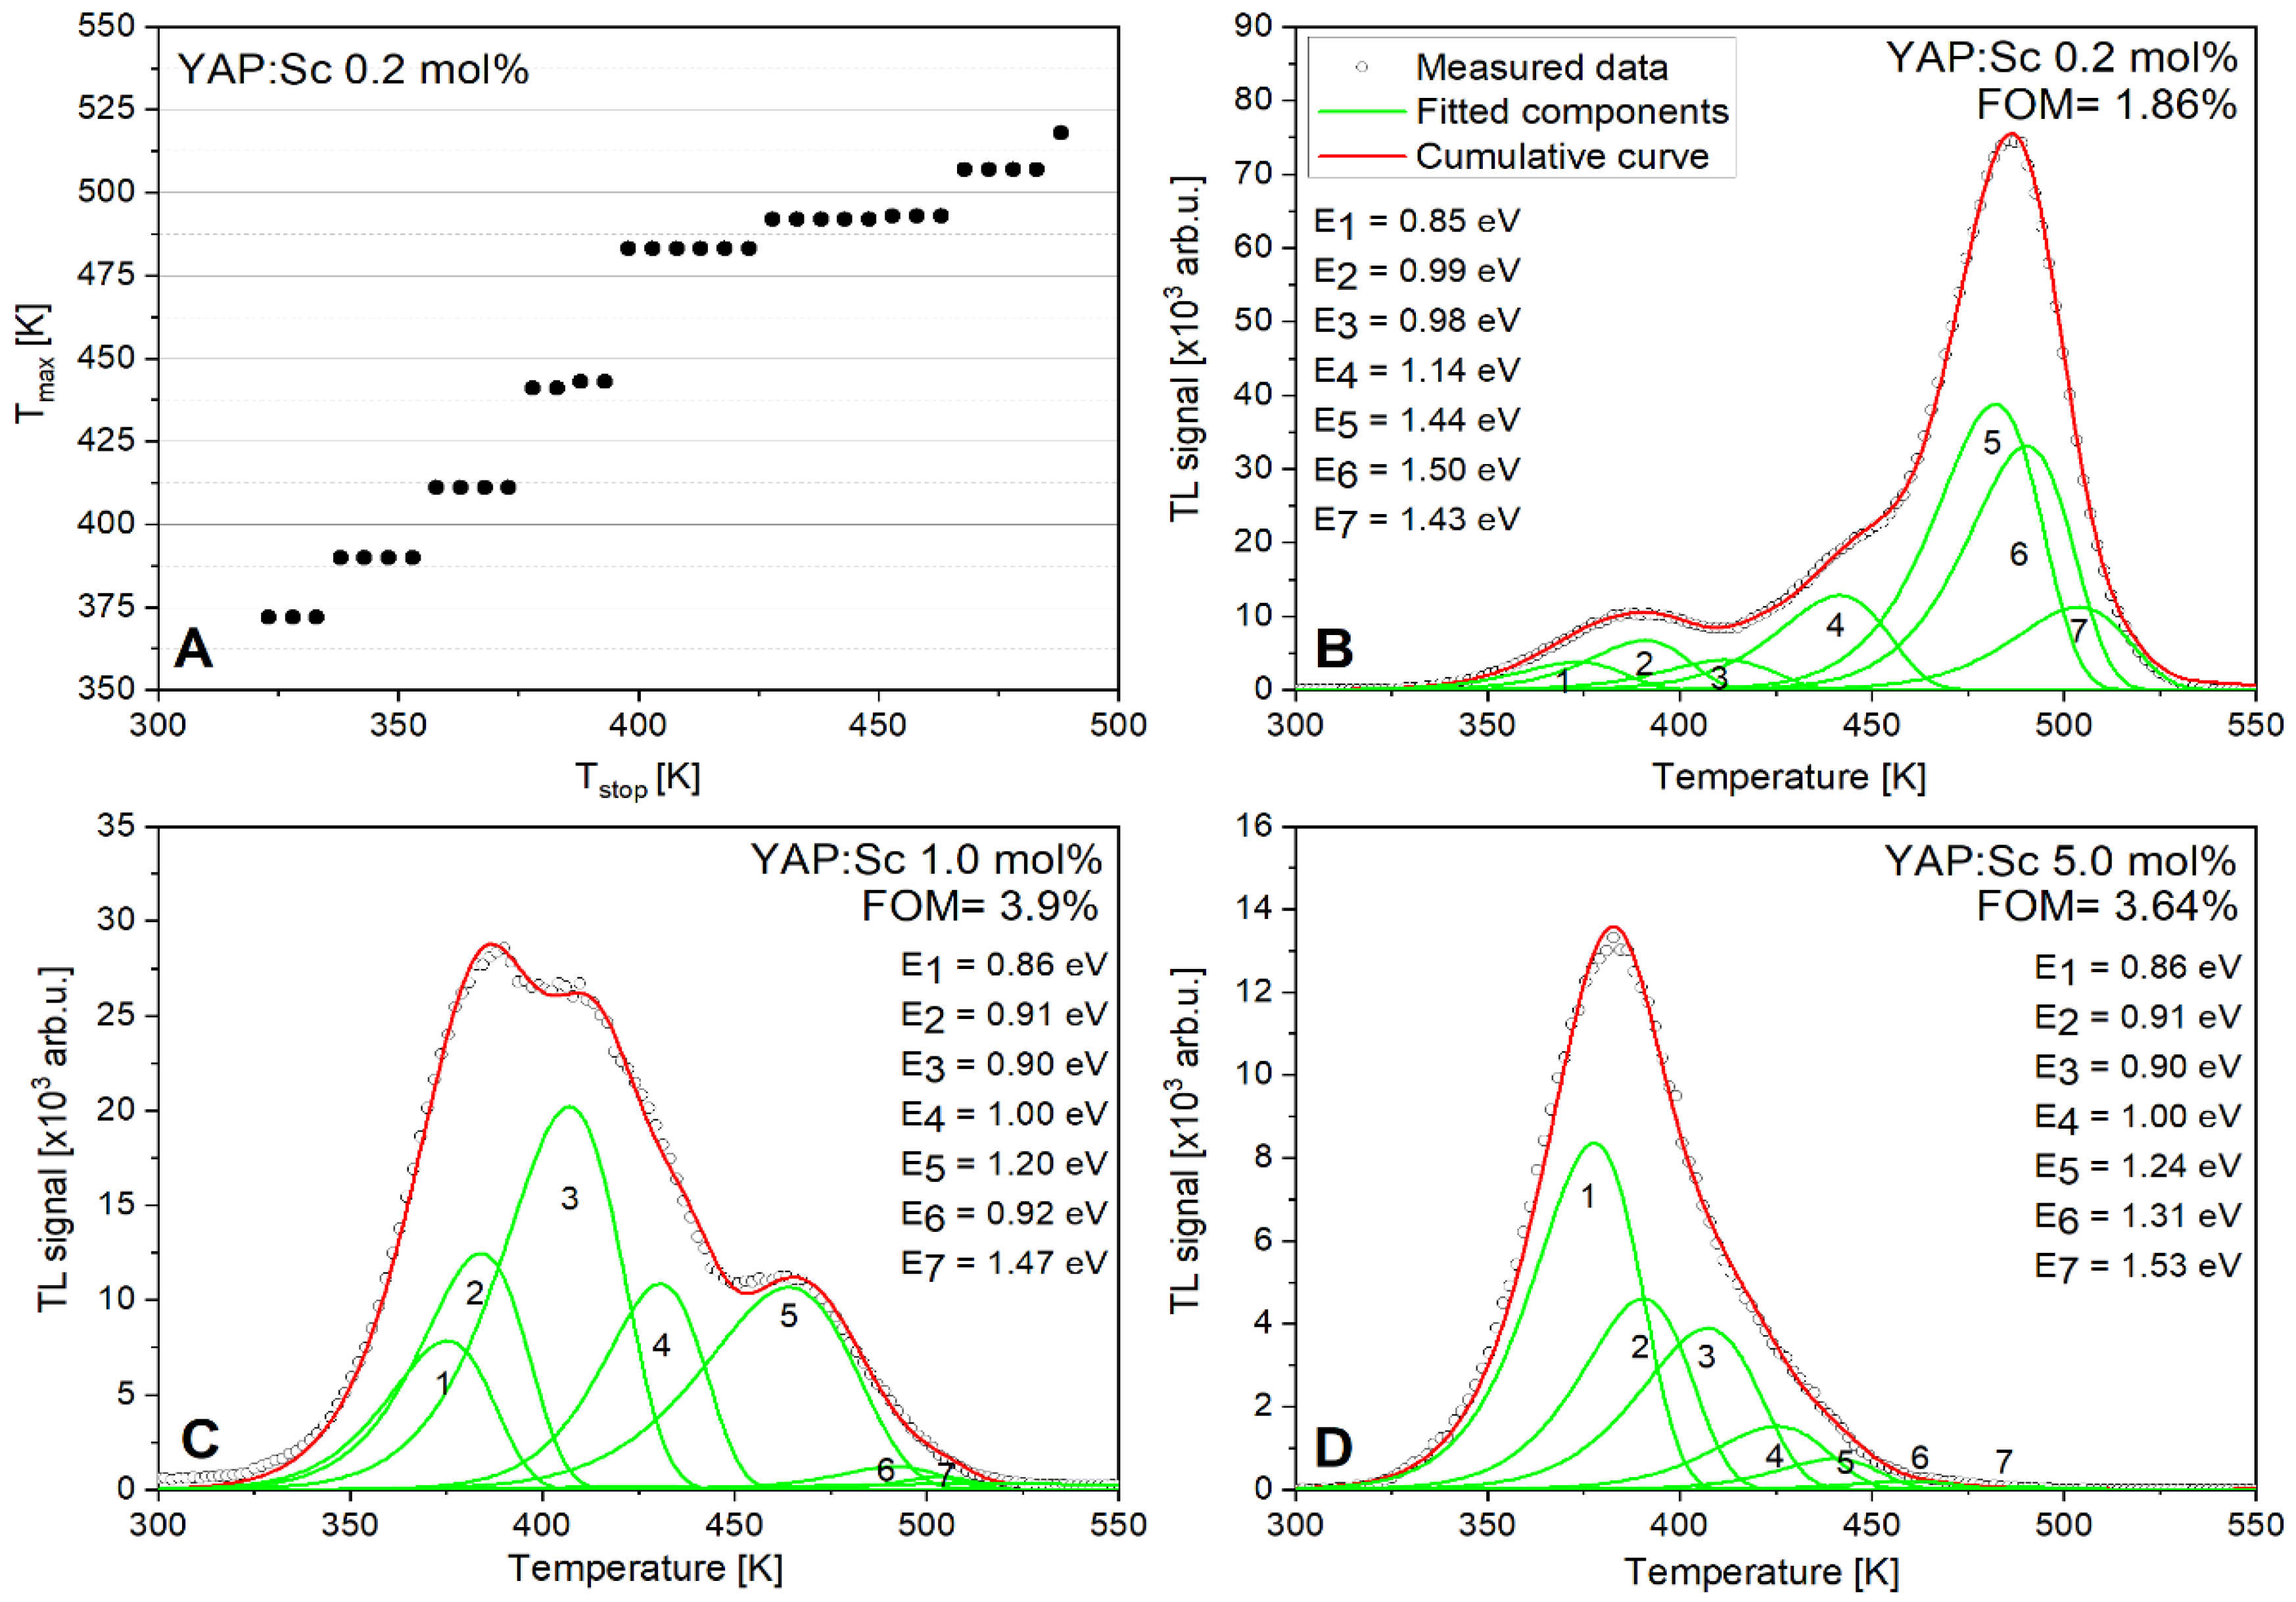
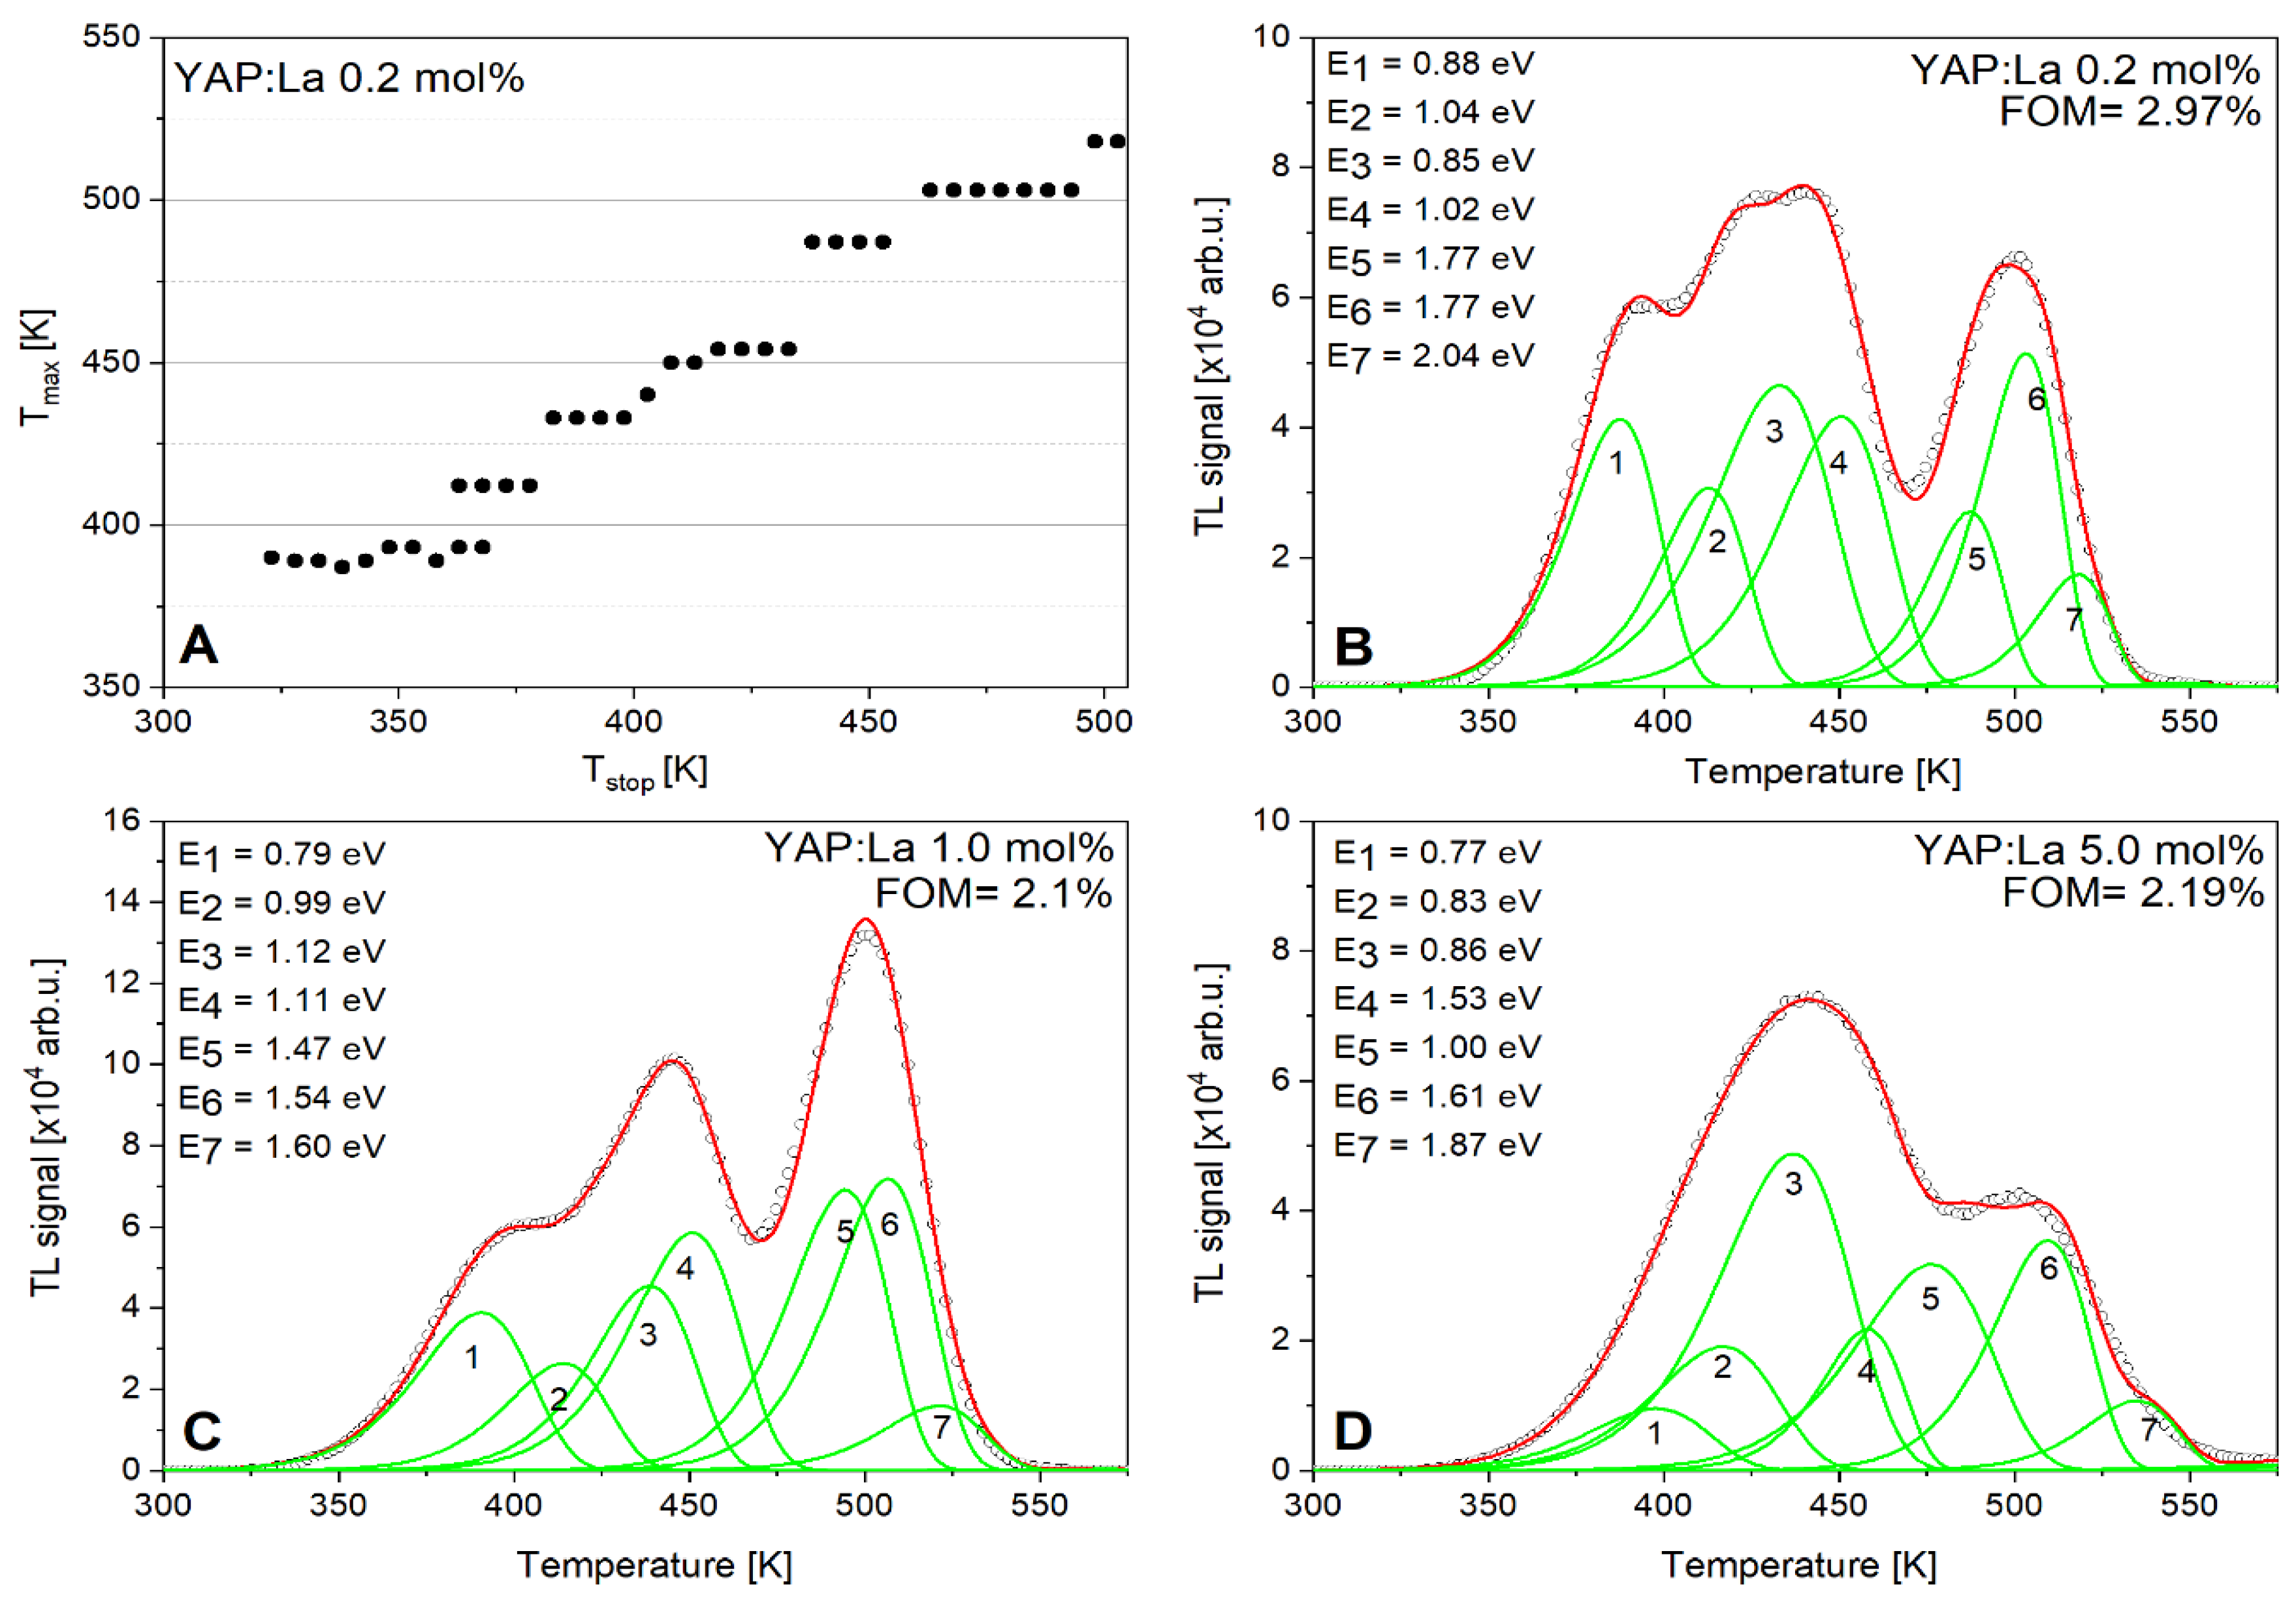
3.4. TL Glow-Curves Shape Analysis

The TL intensity of the undoped sample was the highest among the tested samples. Thus, it seems that the introduction of the Sc3+ dopant into the YAlO3 matrix causes a strong suppression of intrinsic luminescence of the host. The measured TL glow-curves consisted mainly of three broad peaks located at around 375 K, 430 K, and 490 K (denoted in Figure 4 as p1, p2, and p3, respectively). The influence of Sc3+ concentration on the TL emission is visible from Figure 4A. The most apparent feature is that the proportion between the TL components changed dramatically, although their temperature positions remained practically unchanged. The peak at around 490 K, which had the lowest intensity in the case of the undoped sample, became dominant for the 0.2 mol.% Sc3+ dopant concentration. This component (at around 490 K) was also the only one decreasing monotonically with increasing dopant concentration and, at 5.0 mol.% content, it became practically not visible. In the case of higher dopant concentrations (1.0 mol.% and 5.0 mol.%), the most intense components were located at around 380 K. However, the TL signal intensity of these TL components did not change monotonically with increasing dopant concentration. This characteristic is presented in Figure 5A. From Figure 4B, several conclusions can be drawn for La3+-activated YAlO3 crystal samples with different dopant concentrations. The amplitude of TL emission peaks changes dependently on the La3+ concentration and, compared to the undoped sample, it is significantly reduced. Unlike the Sc3+-doped samples, the intensity of the whole glow-curve measured for the La3+-doped crystals decreased monotonically with increasing dopant concentration. This characteristic is presented in Figure 4B. However, one should note that, although the intensity of the whole curve decreased monotonically with increasing dopant concentration, peak p3 seemed to be the least affected at the low dopant content. Specifically, at 0.2 and 1.0 mol.% of La3+ concentration, the intensity of peak p3 only slightly decreased, while, at only 5.0 mol.% of La3+, p3 was strongly reduced.
The origin of the observed changes in the shape of glow-curves of YAP:Sc and YAP:La crystals (Figure 4 and Figure 5) can be explained as follows: in the undoped YAP crystals, mainly the host defects (such as antisite defects, oxygen vacancies, and the trace impurities) are responsible for the creation of emission and trapping centers involving in the TL processes. Due to the Sc3+ and La3+ doping, changes in the balance of the electron–hole trapping centers occur in the YAP host. Specifically, in the case of YAP:Sc and YAP:La crystals, the ScAl and LaY centers can already play the role of the main emission centers (see Figure 2 and Figure 3). Therefore, the observed TL glow-peaks in these crystals can still correspond to the host defects. Meanwhile, such redistributions in the main type of emission centers lead to a decrease in the overall TL intensity of YAP:Sc and YAP:La crystals (Figure 4 and Figure 5).

3.5. Dose–Response Characteristics

The second step of investigations was devoted to determining the dose–response for the studied materials. Six different materials (one matrix, two dopants, three different concentrations) were analyzed. The dose–response characteristic was studied over the dose range of 0.2–200 Gy. The samples were irradiated with β radiation using a built-in source in the Risø reader. One should be reminded that, for the dose–response evaluation, the measured TL glow-curves were integrated over the temperature range of 300–623 K, as stated in Section 2.2. The results of linearity for all of the investigated dopant concentrations are shown in Figure 6. Dashed lines present a linear trend. The slope of data points presented in a log–log scale gives direct information about the (non)linear behavior concerning the radiation dose. Specifically, a slope = 1 indicates an ideal linear response, while a slope <1 or >1 indicates a sublinear and supralinear response, respectively.
The slope of the fit obtained for Sc3+-doped YAlO3 with 0.2, 1.0, and 5.0 mol.% dopant content was 0.87, 0.93, and 0.88, respectively, which indicates that the response of investigated samples concerning delivered radiation dose was sublinear. The situation looks a little bit different for La3+-doped YAlO3 crystals. For 0.2, 1.0, and 5.0 mol.% of dopant concentration, the obtained results were 1.02, 0.99, and 1.04, respectively; thus, it seems that the response of the La3+-doped crystal samples was practically linear concerning the delivered radiation dose. All these results can be found in Figure 6. A wide linear dose–response range measured for the La3+-doped YAlO3 crystals seems promising regarding their possible applications in ionizing radiation dosimetry. The materials based on differently doped LiF, which are currently the most commonly used in radiation dosimetry all over the world, show a linear dose–response range limited only to several Gy; thus, the results obtained in this work seem promising.

3.6. Fading and the Lowest Measureable Dose

As it was stated in Section 2, for fading analysis, all the crystal samples were irradiated with a dose of 20 Gy, and the readouts were performed after different time periods, namely, 1 h, 5 h, 12 h, 24 h, 96 h, and 175 h after the irradiation. The results are shown in Figure 7. As can be seen, the highest rate of signal loss occurred within the first several hours after the irradiation. This is rather common behavior for luminescent materials; therefore, the measured values are often compared to those measured 24 h after the irradiation. This is especially visible for Sc-doped YAP crystal samples, where the signal decreased during the first 24 h and became more or less stable for longer time periods. It is also interesting that a higher dopant content led to a greater loss of TL signal. Specifically, for the 0.2 mol.% content of Sc dopant, the signal stabilized at the level of around 75% 24 h after the irradiation, while, for 1.0 and 5.0 mol.% contents, it was only around 15% and 10%, respectively (see Figure 7A). This confirms that the addition of dopants strongly suppresses the luminescence emission of the host. Similar behavior was observed for La-doped samples. However, in this case, the loss of signal was smaller, especially for higher dopant contents. Specifically, for 0.2 mol.% content of La dopant, the signal stabilized at the level of around 75% 24 h after the irradiation, while, for 1.0 and 5.0 mol.% contents, it was around 50% and 35%, respectively (see Figure 7B). Although the initial (24 h) loss of TL signal was quite high in both cases, the most important feature for applications in radiation dosimetry is the fact that the signal stabilizes at a certain level and remains stable at this level for a longer time.
For the LMD evaluation, the luminescence signal of non-irradiated samples was measured 10 times (utilizing the same temperature profile as described in Section 2.2). The LMD value was determined as three standard deviations from the signal of the unexposed sample recalculated to the absorbed dose in a given material based on an appropriately determined calibration value. The instrumental background was also taken into account. The obtained LMD values are shown in Table 1. It is visible that, for increasing dopant content, the LMD value also increased, achieving around 12 and 18 mGy for La- and Sc-doped YAP crystals, respectively, for 5.0 mol.% dopant concentration. The repeatability of all analyzed crystal samples was at a similar level; however, the differences in radio-sensitivity (decreasing for increasing dopant concentration) caused an increase in the LMD value for increasing dopant concentration.

3.7. Kinetic Parameters

The next step of investigations was the determination of the kinetic parameters of luminescence processes occurring in the studied materials. In the beginning, the kinetic order was determined by a simple method of checking the TL peak temperature position at an increasing dose of radiation. It was noticed that the temperature position of TL peaks did not change with the increasing dose for all examined materials, which suggests first-order kinetics [24]. The Tmax–Tstop method was also used in an attempt to determine the possible number and approximated positions of individual TL components. It is rather common that TL glow-curves of dosimetric materials demonstrate a higher number of single TL components than could be expected based on the shape of the measured curve. This is because of peaks overlapping. The results obtained by the Tmax–Tstop method are presented in Figure 8 and Figure 9 for YAlO3:Sc and YAlO3:La, respectively. In panels B, C, and D of these figures, the results of glow-curve deconvolution are shown. The number of peaks for deconvolution was determined based on the Tmax–Tstop procedure. For both cases (Sc and La dopant) seven individual TL components were found (see Figure 8 and Figure 9, panels A). The peak positions and the values of the energy trap depth for all individual TL components at each dopant concentration are also shown in these figures.
In panels A of Figure 8 and Figure 9, the plots of Tmax versus Tstop are presented. It is visible that stepwise curves were obtained, where each flat region corresponds to the different trapping centers. All of the obtained curves showed flat regions that may probably suggest that the peak maxima were stable. Every flat staircase region may correspond to one single TL component of the glow-curve. This lets us suppose that the real number of single TL components was not less than seven. The figure of merit (FOM) parameter for the obtained deconvolution fits was less than 4.0% in most cases.

4. Conclusions

The aim of this work was a comparative study of the luminescence properties of the obtained YAlO3 crystals doped with isoelectronic impurities of Sc3+ and La3+. The crystals prepared from the melt via a micro-puling-down method were tested using CL, RL, and TL methods. Six different compositions (one matrix, two dopants, three dopant concentrations) were studied. The influence of dopant concentration on the luminescent properties of all samples was investigated as well. The CL and RL emission spectra showed a dominant emission of Sc3+- and La3+-related centers in the UV range. Presumably, the Sc3+ and La3+ dopants provide two types of emission centers in the UV range in the YAP host, connected with the luminescence of excitons localized and bound with the mentioned isoelectronic impurities. Meanwhile, the luminescence intensity of YAP:La crystals was much lower than in YAP:Sc crystals, most probably due to the very low segregation coefficient of La ions in the YAP host.
We showed the influence of different Sc3+ and La3+ concentrations on the TL glow-curve shape. The differences in shapes can be caused by different structural defects of the samples. For the undoped YAP crystals, the main emission occurred at the low-temperature range, and the luminescence at 375 K was dominant. It seems that even a small addition of dopants caused a strong suppression of the luminescence emission of the YAP host defects. Moreover, the amplitude of emission did not change monotonically with increasing dopant concentration.
We also observed a sublinear and linear response to dose in the case of Sc- and La-doped YAP crystals, respectively. In the case of fading measurements, the initial (24 h) loss of TL signal was quite high in both cases; however, the most important feature for applications in radiation dosimetry is the fact that the signal stabilizes at a certain level and remains stable at this level for a longer time. The LMD value increased with dopant content as expected considering the sensitivity differences (decreasing sensitivity for increasing dopant concentration) of the analyzed samples. First-order kinetics was determined for luminescence processes occurring within the studied materials. Performing the Tmax–Tstop analysis, seven single TL peaks and approximated temperatures of their maxima were evaluated. Every flat staircase region obtained by the Tmax–Tstop method can probably correspond to one single TL component of the glow-curve. The obtained results tend to suggest that the studied perovskites can be considered as promising energy-storage phosphors for dosimetric applications.

Author Contributions

Conceptualization, W.G.; methodology, W.G., P.B. and Y.Z.; formal analysis, W.G. and P.B.; investigation, A.M., V.V., A.V., K.P. and T.Z.; writing—original draft preparation, W.G.; writing—review and editing, W.G., P.B. and Y.Z.; visualization, W.G. and Y.Z.; supervision, P.B. All authors read and agreed to the published version of the manuscript.

Funding

This research was funded by the Polish National Science Center, grant number: 2016/21/B/ST8/03200.

Conflicts of Interest

The authors declare no conflicts of interest.

References

  1. Globus, M.; Grinyov, B.; Kim, J.K. Inorganic Scintillators for Modern and Traditional Applications; Institute for Single Crystals: Kharkiv, Ukraine, 2005. [Google Scholar]
  2. Nikl, M. Scintillation detectors for X-rays. Meas. Sci. Technol. 2006, 17, R37–R54. [Google Scholar] [CrossRef]
  3. Sidletskiy, O.; Gektin, A.; Belsky, A. Light-yield improvement trends in mixed scintillation crystals. Phys. Status Solidi A 2014, 211, 2384–2387. [Google Scholar] [CrossRef]
  4. Globus, M.; Grinyov, B.; Ratner, M.; Tarasov, V.; Lyubinskiy, V.; Vyadi, Y.; Ananenko, A.; Zorenko, Y.; Gorbenko, V.; Konstankevych, I. New type of scintillation detectors for biological, medical and radiation monitoring applications. IEEE Trans. Nucl. Sci. 2004, 51, 1297–1303. [Google Scholar] [CrossRef]
  5. Zorenko, Y.; Gorbenko, V.; Nikl, M.; Mares, J.A.; Martin, T.; Douissard, P.-A. Development of Novel UV Emitting Single Crystalline Film Scintillators. IEEE Trans. Nucl. Sci. 2010, 57, 1335. [Google Scholar] [CrossRef] [Green Version]
  6. Zorenko, Y.; Gorbenko, V.; Voznyak, T.; Zorenko, T.; Nikl, M.; Nejezchleb, K. Luminescence of La3+ and Sc3+ impurity centers in YAlO3 single-crystalline films. J. Lumin. 2008, 128, 595–602. [Google Scholar] [CrossRef] [Green Version]
  7. Gallo, S.; Veronese, L.; Vedda, A.; Fasoli, M. Evidence of Optically Stimulated Luminescence in Lu3Al5O12:Ce. Phys. Status Solidi A 2019, 216, 1900103. [Google Scholar] [CrossRef]
  8. Gieszczyk, W.; Bilski, P.; Kłosowski, M.; Mrozik, A.; Zorenko, T.; Witkiewicz, S.; Zorenko, Y. Luminescent properties of Tb and Eu activated AxB1-xAlO3 (A = Y, Lu, Gd; B = Lu; x = 0, 0.5, 1) mixed oxides crystals prepared by micro-pulling-down method. Radiat. Meas. 2019, 126, 106140. [Google Scholar] [CrossRef]
  9. Gieszczyk, W.; Bilski, P.; Kłosowski, M.; Mrozik, A.; Zorenko, Y.; Zorenko, T.; Paprocki, K. Luminescent properties of undoped and Ce3+ doped crystals in Y2O3 -Lu2O3―Al2O3 triple oxide system grown by micro-pulling-down method. Opt. Mater. 2019, 89, 408–413. [Google Scholar] [CrossRef]
  10. Yanagida, T. Ionizing radiation induced emission: Scintillation and storage-type luminescence. J. Lumin. 2016, 169, 544–548. [Google Scholar] [CrossRef] [Green Version]
  11. Kuro, T.; Nakauchi, D.; Okada, G.; Kawaguchi, N.; Yanagida, T. X-ray Induced Luminescence Properties of (Y,Eu)AlO3 Single Crystals. Opt. Mater. 2017, 64, 282–287. [Google Scholar] [CrossRef]
  12. Akatsuka, M.; Usui, Y.; Nakauchi, D.; Okada, G.; Kawaguchi, N.; Yanagida, T. Scintillation properties of (Lu,Y)AlO3 doped with Nd. Sens. Mater. 2018, 30, 1525–1532. [Google Scholar] [CrossRef] [Green Version]
  13. Yoshikawa, A.; Chani, V. Growth of optical crystals by the micro-pulling-down method. MRS Bull. 2009, 34, 266–270. [Google Scholar] [CrossRef]
  14. Dhanaraj, G.; Byrappa, K.; Prasad, V.; Dudley, M. Handbook of Crystal Growth; Springer: Berlin/Heidelberg, Germany, 2010. [Google Scholar]
  15. Bilski, P.; Gieszczyk, W.; Obryk, B.; Hodyr, K. Comparison of Commercial thermoluminescence readers regarding high-dose high-temperature Measurements. Radiat. Meas. 2014, 65, 8–13. [Google Scholar] [CrossRef] [Green Version]
  16. Gieszczyk, W.; Bilski, P. A simplified numerical approach to non-radiation induced high-temperature signals in thermoluminescence. GlowVIEW―A useful tool for a multiple glow-curve analysis. Radiat. Meas. 2017, 107, 102–110. [Google Scholar] [CrossRef]
  17. McKeever, S.W.S. On the analysis of complex thermoluminescence glow-curves: Resolution into individual peaks. Phys. Stat. Sol. A 1980, 62, 331–340. [Google Scholar] [CrossRef]
  18. Puchalska, M.; Bilski, P. GlowFit—A new tool for thermoluminescence glow-curve deconvolution. Radiat. Meas. 2006, 41, 659–664. [Google Scholar] [CrossRef]
  19. Zorenko, Y.; Voloshinovskii, A.S.; Konstankevych, I.V. Luminescence of F+ and F Centers in YAlO3. Opt. Spectrosc. 2004, 96, 532–537. [Google Scholar] [CrossRef]
  20. Zorenko, Y.; Voloshinovskii, A.; Savchyn, V.; Vozniak, T.; Nikl, M.; Nejezchleb, K.; Mikhailin, V.; Kolobanov, V.; Spassky, D. Exciton and antisite defect–related luminescence in Lu3Al5O12 and Y3Al5O12 garnets. Phys. Stat. Sol. B 2007, 244, 2180–2189. [Google Scholar] [CrossRef]
  21. Zorenko, Y.; Gorbenko, V.; Voloshinovskii, A.; Vistovskii, V.; Nikl, M.; Mihokova, E.; Nejezchleb, K. Intrinsic and Ce3+- related Luminescence of Single Crystals and Single Crystalline Films of YAP Perovskites: New Results. IEEE Trans. Nucl. Sci. 2008, 55, 1186–1191. [Google Scholar] [CrossRef]
  22. Zorenko, Y.; Gorbenko, V.; Voznyak, T.; Mikhailin, V.; Kolobanov, V.; Spassky, D.; Nikl, M. Intrinsic and Ce3+-Related Luminescence in Single Crystalline Films and Single Crystals of LuAP and LuAP:Ce Perovskites. IEEE Trans. Nucl. Sci. 2008, 55, 1192–1196. [Google Scholar] [CrossRef]
  23. Zorenko, T.; Gorbenko, V.; Petrosyan, A.; Gieszczyk, W.; Bilski, P.; Zorenko, Y. Intrinsic and defect-related luminescence of YAlO3 and LuAlO3 single crystals and films. Opt. Mat. 2018, 86, 376–381. [Google Scholar] [CrossRef]
  24. Bos, A.J.J. Theory of thermoluminescence. Radiat. Meas. 2007, 41, S45–S56. [Google Scholar] [CrossRef]
Figure 1. The X-ray diffraction (XRD) patterns of YAlO3 (YAP):Sc (A) and YAP:La (B) crystals with different dopant concentrations in comparison with YAP (A,B) and yttrium aluminum garnet (YAG) (A) standards.
Crystals 10 00385 g001
Figure 2. The cathodoluminescence (CL) spectra of YAlO3:Sc (A) and YAlO3:La (B) crystals with different Sc3+ and La3+ dopant concentrations measured at room temperature.
Crystals 10 00385 g002
Figure 3. The CL emission spectra (A) of YAlO3:Sc 0.2 mol.% (1) and YAP:Sc 1.0 mol.% (2) crystals and the decay kinetics of X-ray-excited luminescence (RL) of YAP:Sc 1.0 mol.% crystals (B) under pulsed X-ray excitation measured at room temperature (RT).
Crystals 10 00385 g003
Figure 4. The comparison of thermoluminescence (TL) glow-curve shapes of YAlO3:Sc (A) and YAlO3:La (B), with different dopant concentration. The TL glow-curves of the undoped YAlO3 are also shown.
Crystals 10 00385 g004
Figure 5. TL signal intensity dependence on the Sc3+ (A) and La3+ (B) dopant concentration for peaks p1, p2, and p3 as denoted in Figure 4.
Crystals 10 00385 g005
Figure 6. The dose–response characteristics for YAlO3:Sc (A) and YAlO3:La (B) crystals with different dopant concentrations. Each point was obtained by a glow-curve integration over the temperature range of 325–625 K. The standard deviation was at the level below 3%.
Crystals 10 00385 g006
Figure 7. Fading analysis for the studied YAP crystal samples doped with Sc (A) and La (B).
Crystals 10 00385 g007
Figure 8. (A) An exemplary result of the Tstop–Tmax procedure applied for the studied samples. (BD) The results of deconvolution performed for Sc3+-doped YAlO3 crystals with different dopant concentrations.
Crystals 10 00385 g008
Figure 9. (A) An exemplary result of the Tstop–Tmax procedure applied for the studied samples. (BD) The results of deconvolution performed for La3+-doped YAlO3 crystals with different dopant concentrations.
Crystals 10 00385 g009
Table 1. The lowest measurable dose values evaluated for the studied YAP crystal samples doped with Sc and La.
Dopant ContentThe Lowest Measurable Dose (mGy)
ScLa
0.20.75 ± 0.191.10 ± 0.12
1.03.63 ± 0.490.85 ± 0.28
5.017.42 ± 6.9911.68 ± 2.54

