
Study on Gemological Characteristics of Blue Sapphires from Baw-Mar Mine, Mogok, Myanmar


1
Faculty of Materials Science and Engineering, Kunming University of Science and Technology, Kunming 650093, China
2
School of Materials Science and Engineering, Qilu University of Technology (Shandong Academy of Sciences), Jinan 250353, China
3
Kunming Customs Technology Center, Kunming 650228, China
*
Author to whom correspondence should be addressed.
Crystals 2021, 11(11), 1275; https://0-doi-org.brum.beds.ac.uk/10.3390/cryst11111275
Submission received: 26 September 2021
/
Revised: 9 October 2021
/
Accepted: 14 October 2021
/
Published: 21 October 2021
(This article belongs to the Special Issue Gem Crystals)
Abstract
:This paper employs an X-ray powder crystal diffractometer (XRD), an X-ray fluorescence spectrometer (XRF), an ultraviolet-visible-near infrared spectrometer (UV-Vis-NIR), a Fourier infrared spectrometer (FTIR), and a laser Raman spectrometer to systematically investigate the gemological characteristics of blue sapphires from Baw-mar mine, Mogok, Myanmar. The results show that the FTIR spectra and UV-Vis-NIR spectra of the sapphire from this mine are significantly different from those of sapphires from other origins, which can be used to identify sapphires from this mine. The main crystal structure of the mineral sapphire from Baw-mar mine is corundum. The predominant chemical elements are Al and O, and the color-causing elements are Fe, Ti, V, and Ni. The characteristic ultraviolet absorption peak appears at 418 nm, which is mainly caused by the d-d transition of V3+ ions. The intensity change of the 946 nm ultraviolet absorption peak indicates that the presence of Ni2+ ions may aggravate the gray tone of sapphire and reduces its transparency. Compared with sapphires from other origins, sapphires from this mine have three characteristic infrared peaks of kaolinite at 930, 1025, and 1110 cm−1, of which the single peak at 930 cm−1 is attributed to -OH translation, and the double peaks at 1025 and 1110 cm−1 are attributed to the Si-O stretching vibration. The peaks at 369, 410, 437, 565, 633, and 739 cm−1 in the Raman spectra are attributed to [AlO6] octahedron vibration. Our work provides insight into detailed spectroscopy data of blue sapphires from this mine and the identification of sapphires from different origins through spectroscopic characteristics.
1. Introduction
Sapphire is one of the top five most precious gemstones in the world. In recent years, with the rapid development of the domestic colored gemstone market, sapphires from different origins and mines have emerged continuously, and prices vary greatly. Therefore, it is very important to conduct identification studies on sapphires from specific origins and mines.
X-ray diffraction acts as a powerful tool to analyze the crystallinity, crystal structure, and mineral phase of gemstones, as well as to calculate gem cell parameters. X-ray fluorescence spectroscopy is a powerful method to detect the types and contents of gem elements, and the analysis scope covers major elements and trace elements. Ultraviolet-visible absorption spectroscopy is mainly used to study the color-causing mechanism of gems, and to determine the types of color-causing ions in gems by absorption peak positions. Infrared spectroscopy can accurately reflect the molecular structure of gems and serve as an important tool for identifying hydroxyl, water and various functional groups in gems. Laser Raman spectroscopy is an effective method to investigate the molecular composition, molecular vibration frequency, and inclusion composition of gems, and it is a complementary technique to infrared spectroscopy [1]. These analytical methods are widely used in the identification and study of gemstones.
Sapphire is a mineral of the corundum group, which is mainly generated in igneous rocks, metamorphic rocks, and alluvial deposits. Different origins and mines will affect the various properties of gemstones, such as color, chemical composition, spectral characteristics and inclusions [2]. The alkaline basalt-type sapphires from Australia and China are predominately produced under reducing conditions, and all have an infrared absorption peak of 3310 cm−1 [3], which disappears when they undergo oxidative heating during transportation. Harlow and Bender [4] suggested that the abnormally enriched Si-Ca sapphire from Mogok mine usually has white mineral inclusions, and the contents of Ga, B, Sn, and Ni are also increased significantly based on an electron probe and a laser ablation-inductively coupled plasma mass spectrometer. Palanza et al. [5] applied Raman microscopy to study the inclusion and geographic origin of sapphires from Australia, Madagascar, Sri Lanka, Thailand, Tanzania, and Vietnam, and found that zircon can act as a clue to indicate the genesis of alkaline basalt, whereas diaspore, calcite, carbon dioxide, and sulfur are typical genetic inclusions in metamorphic deposits. Peucat et al. [6] proposed that the combined use of the Ga/Mg ratio and Fe concentration are effective tools for distinguishing metamorphic sapphire from magmatic blue sapphire. Sapphires with alkaline basalt origin in Southeast Asia, China, and Africa usually have a higher Fe content and a Ga/Mg ratio >10, while the metamorphic sapphires from Mogok and Sri Lanka have a lower Fe content and a Ga/Mg ratio <10.
This paper gives a brief overview of the geological information of the Baw-mar mine, and systematically studies the crystal structure, chemical compositions, and spectroscopic characteristics of the blue sapphire from this mine. The attributes of its spectral peaks were analyzed in detail, and the peak positions of sapphires from other famous origins were compared and distinguished to identify sapphires from this mine. Moreover, our study aims to present detailed identification data of blue sapphire from Baw-mar mine, which provides a scientific basis for the study of its mineralization environment and post-optimization processing.
2. Materials and Methods
2.1. Geological Background of the Baw-Mar Mine
The Baw-mar mine site is located in the northwest of Kyat Pyin west of Mogok, 12 miles away from Mogok (22°55′39.9″ N, 96°24′43″ E). The geology of the mine is complex, mainly composed of a series of high-grade regionally metamorphosed rocks, including granite, garnet-biotite gneiss, calcsilicate rocks, and graphite marble (Figure 1) [7,8]. Blue sapphires are formed in intrusive dykes, which are mainly composed of syenite. The main mineral of syenite is feldspar, which is an intrusive rock lacking quartz and has a high aluminum-silicon ratio. These syenites are formed in the exposed granite pockets and intrude into the weathered gneiss. After highly weathered and brecciated, the feldspar becomes kaolinite, and finally the sapphires are embedded in the clay pockets [9].
2.2. Materials
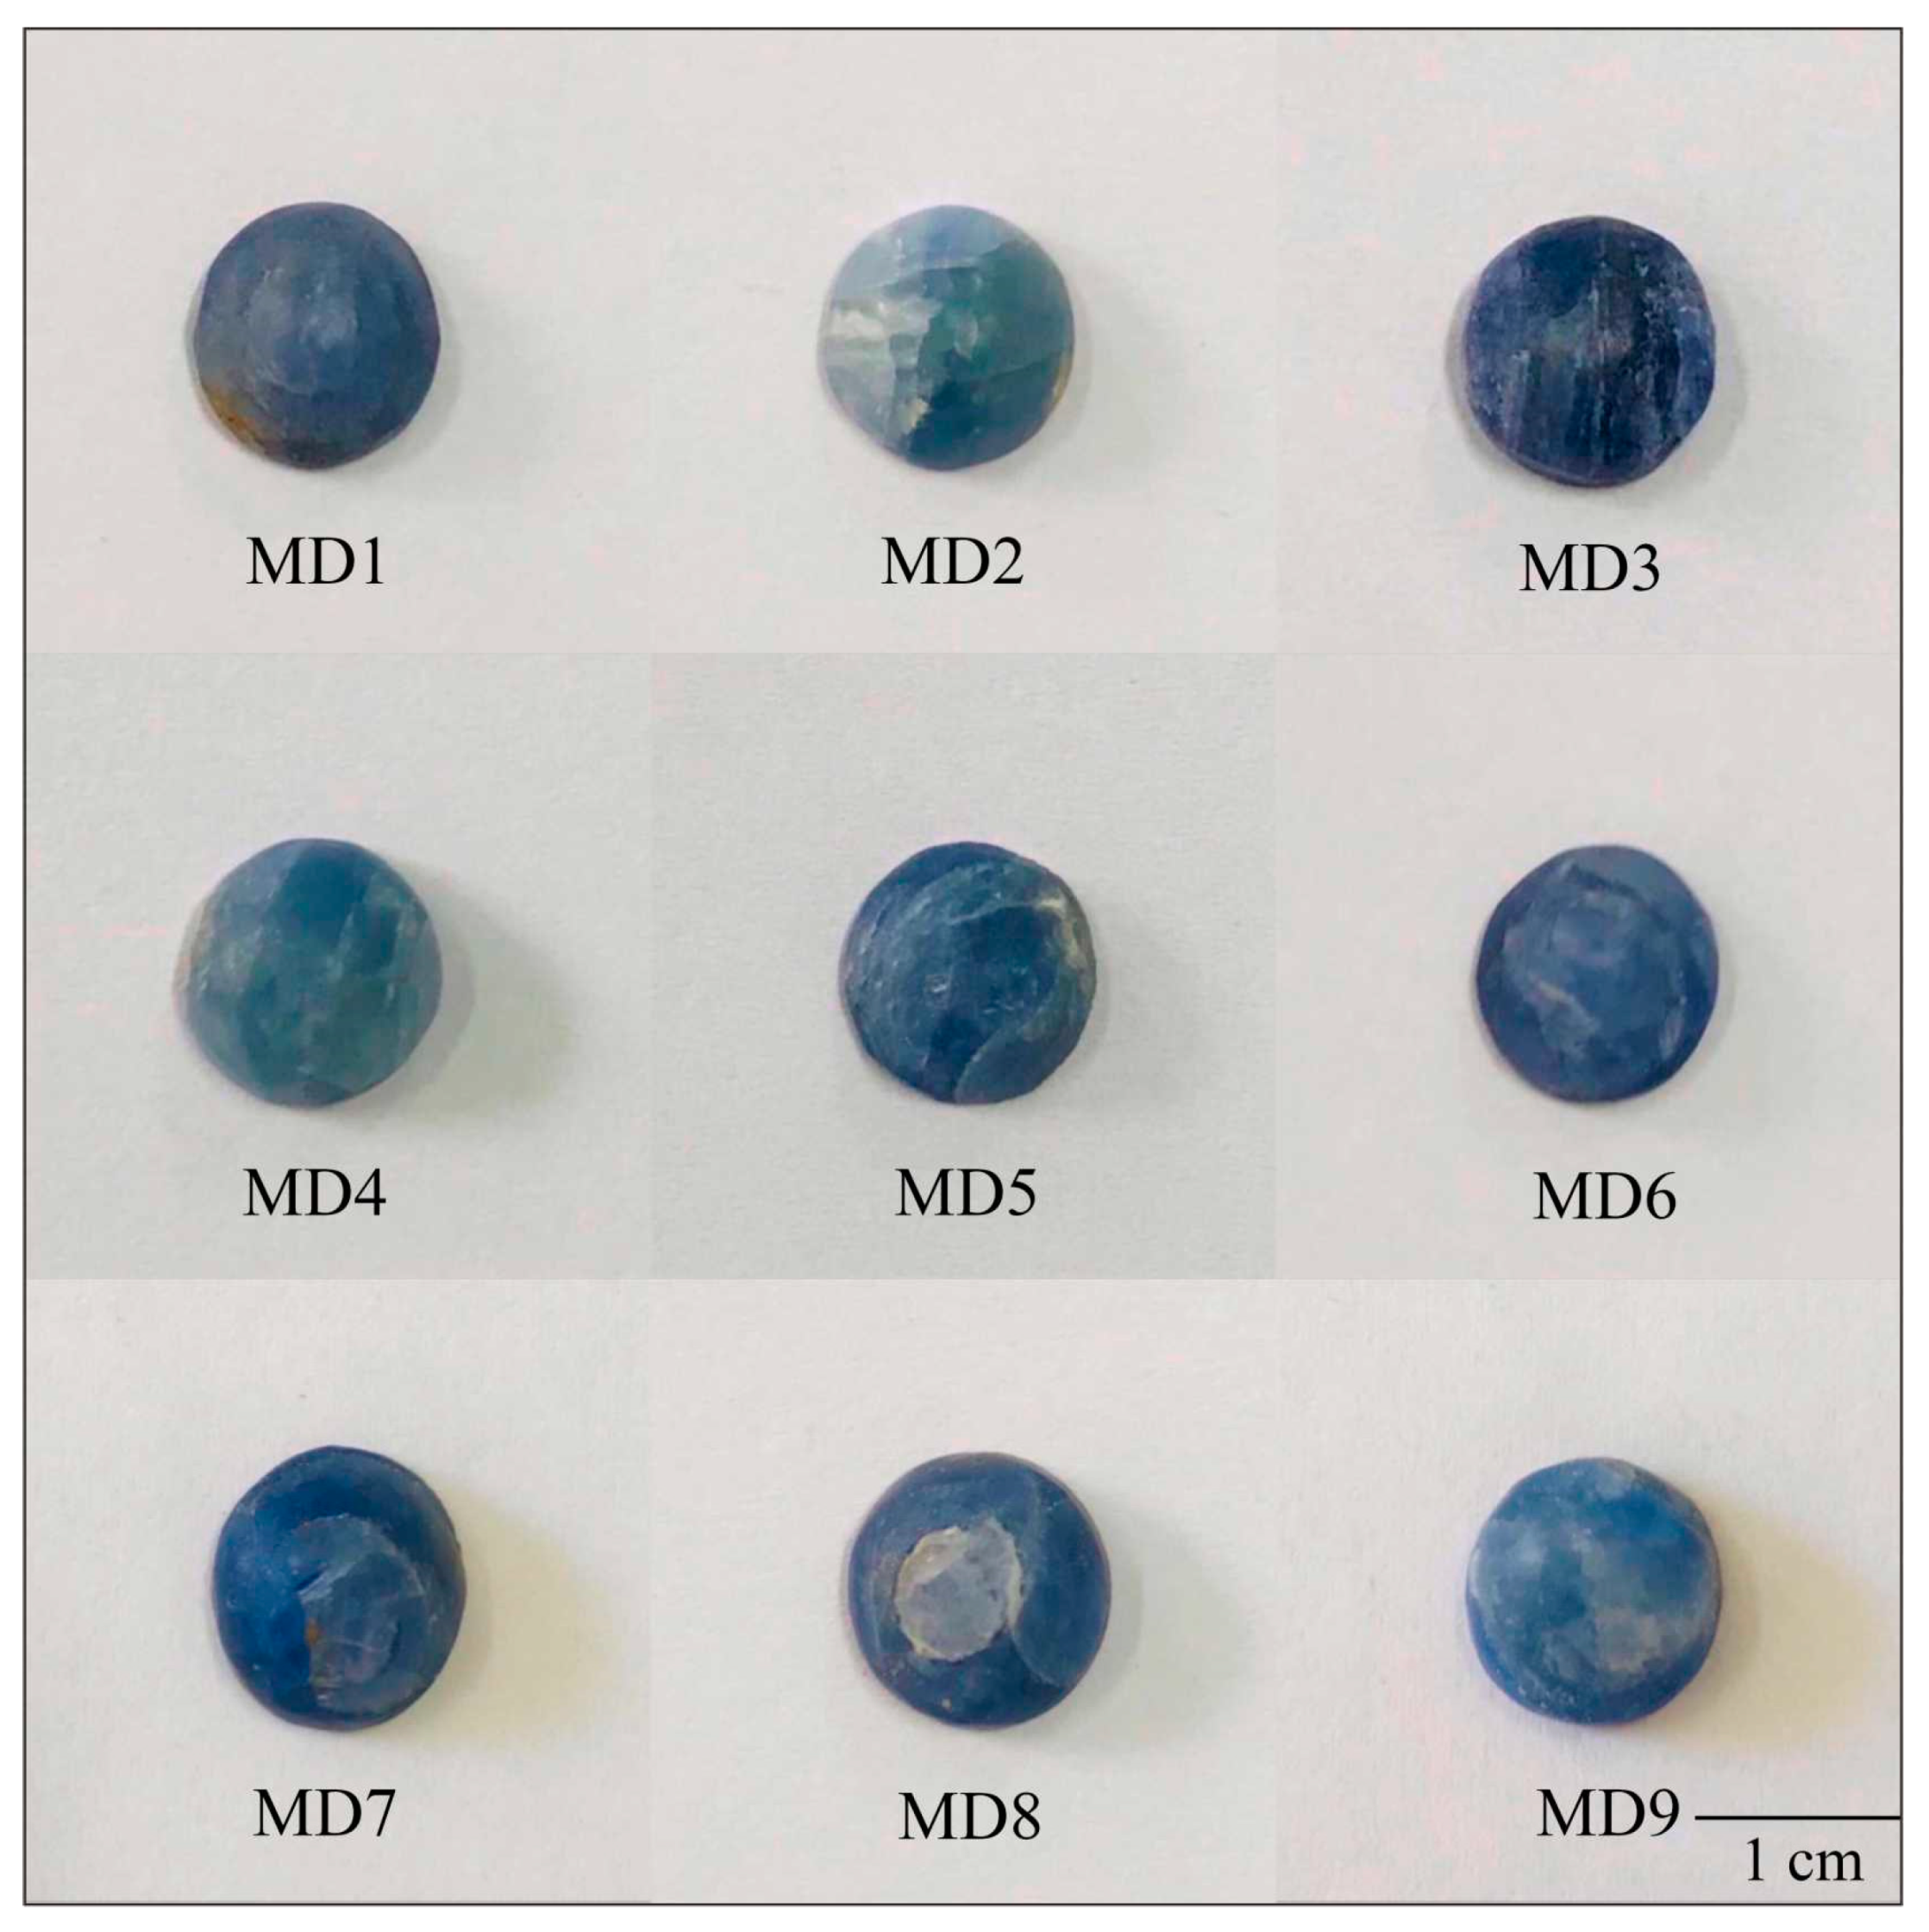
The experimental samples are 16 rough sapphire stones (samples labelled as M1 to M16) from the Baw-mar mine in Mogok, Myanmar. They are mainly massive and thick, with brownish yellow erosions and off-white materials on the surface. The colors are mostly light blue and gray blue with an uneven distribution. It can be observed that there are double crystals and hexagonal ribbons with developed cracks, and dark-colored impurities can also be observed in the cracks (Figure 2). In order to ensure the accuracy of the experimental results and exclude the influence of rough surface unevenness and altered minerals on the test results, another 9 rough stones were randomly selected and cut along the vertical c-axis into 9 curved samples (samples labelled as MD1 to MD9) with a size of approximately 9 mm × 7 mm × 4 mm (Figure 3). The samples were subjected to gemological and spectroscopical analysis.
2.3. Methods
The X-ray diffraction analysis was performed on the Rigaku Ultima IV series X-ray powder crystal diffractometer (Akishima-shi, Tokyo). We adopted Cu Kα rays, a Ni filter, a voltage of 200 V, a current of 20 A, continuous scanning, a scanning speed of 5°/min, a scanning range of 10°–90°, and angle measurement accuracy of 0.02°. The sample was ground into a powder of about 200 mesh with a corundum mortar. The X-ray fluorescence spectroscopy test was completed on the Axios (PW4400/40) instrument of PANalytical (Almelo, The Netherlands), using a Rh target X-ray tube, power 4 kW, with test element range Be4–U92. A powder sample of 200 mesh was also used. UV-Vis-NIR spectroscopy analysis was completed on the FUV-007 ultraviolet-visible-near infrared spectrometer in Shenzhen City, China. The test condition uses reflection, at a resolution of 1.5 nm, a signal-to-noise ratio > 1000:1, and a test range of 220–1000 nm. The infrared spectroscopy test was performed on the Germany Bruker TENSOR27 Fourier infrared spectrometer. Test conditions: test range 400~4000 cm−1, resolution 4 cm−1, scanning frequency 10 kHz, sample scanning time is 16 s. Collect multiple scans to improve accuracy. The laser Raman spectroscopy test was conducted on the American Thermo Fisher Scientific DXR Raman Microscope Raman spectrometer. The wavelength used was 785 nm, our instrument set allowed a spectral resolution of 4–8 cm−1. We used a scanning time of 20 s with a spectrum in an extending mode spanning 100–2000 cm−1. The spot size was 1.6 μm. Filters allowed us to set the laser power on the sample at around 20 mW. Before each session, the spectrometer was calibrated at 520 cm−1 with a silicon standard.
3. Results and Discussion
3.1. Gemological Characteristics
Nine specimens (MD1 to MD9) of curved surfaces that were cut and ground without being polished were selected for conventional gemological feature testing. The sample is different shades of blue with the uneven color distribution. The refractive index is 1.76, and the density is 3.97–4.03g/cm3. The samples are translucent-slightly transparent with developed fissures and have a light blue-light yellow or light blue-dark blue weak dichroism. The fluorescence is inert under long- and short-wave ultraviolet lamps. No solid inclusions were found under the gem microscope, but flat color bands and broken structures at the edges of cracks were occasionally observed.
3.2. X-ray Diffraction Analysis
Six curved samples corresponding to the remaining rough stones after cutting were randomly selected, and their edges were cut into small pieces and ground into 200-mesh powder with corundum mortar for XRD testing. The X-ray diffraction analysis results show that the sapphires from Mogok Baw-mar mine in Myanmar have strong diffraction peaks at 3.47, 2.55, 2.37, 2.08, 1.73, 1.60, 1.54, 1.51, 1.40, 1.37, and 1.23 Å, which are similar to the standard corundum diffraction peak position (PDF-2004 99-0036) (Figure 4a). Moreover, a characteristic peak at 6.10Å appears in the diffraction pattern. Combining the FTIR spectra and comparing the diffraction peak position of standard diaspore, it is inferred that it represents diaspore. The off-white material on the surface of the rough samples mainly exhibits strong diffraction peaks at 7.12, 4.97, 4.46, 3.56, 3.47, 3.35, 2.56, 2.34, 2.08, 1.99, 1.66, 1.60, 1.48, 1.40, and 1.37Å, which are similar to the standard kaolinite diffraction peak position (PDF-2004 78-2110) (Figure 4b), indicating that it is kaolinite.
3.3. X-ray Fluorescence Spectroscopy
The chemical composition results show (Table 1) that the predominant constituent elements of sapphires in the Baw-mar mine are Al and O, containing a small amount of Si, Fe, and Ti. The average content of Fe element is 0.266 Wt.%, and the average content of Ti element is 0.019 Wt.%, both of which are significantly higher than the content of Fe (0.014 Wt.%–0.082 Wt.%) and Ti (0.003 Wt.%–0.012 Wt.%) compared with other high-quality sapphires [8]. These sapphires also contain trace elements of V, Ga, Ni, and Cr. The samples MD1, MD2, MD4, and MD8 have high contents of impurities such as Ni and Cr elements, so the gray tone is obvious, with relatively poor transparency. The sapphires contain both Fe and Ti elements, leading to their blue color. A small amount of V has a certain effect on the color of sapphires, which is verified in the UV-Vis-NIR spectra.
3.4. UV-Vis-NIR Spectroscopy Analysis
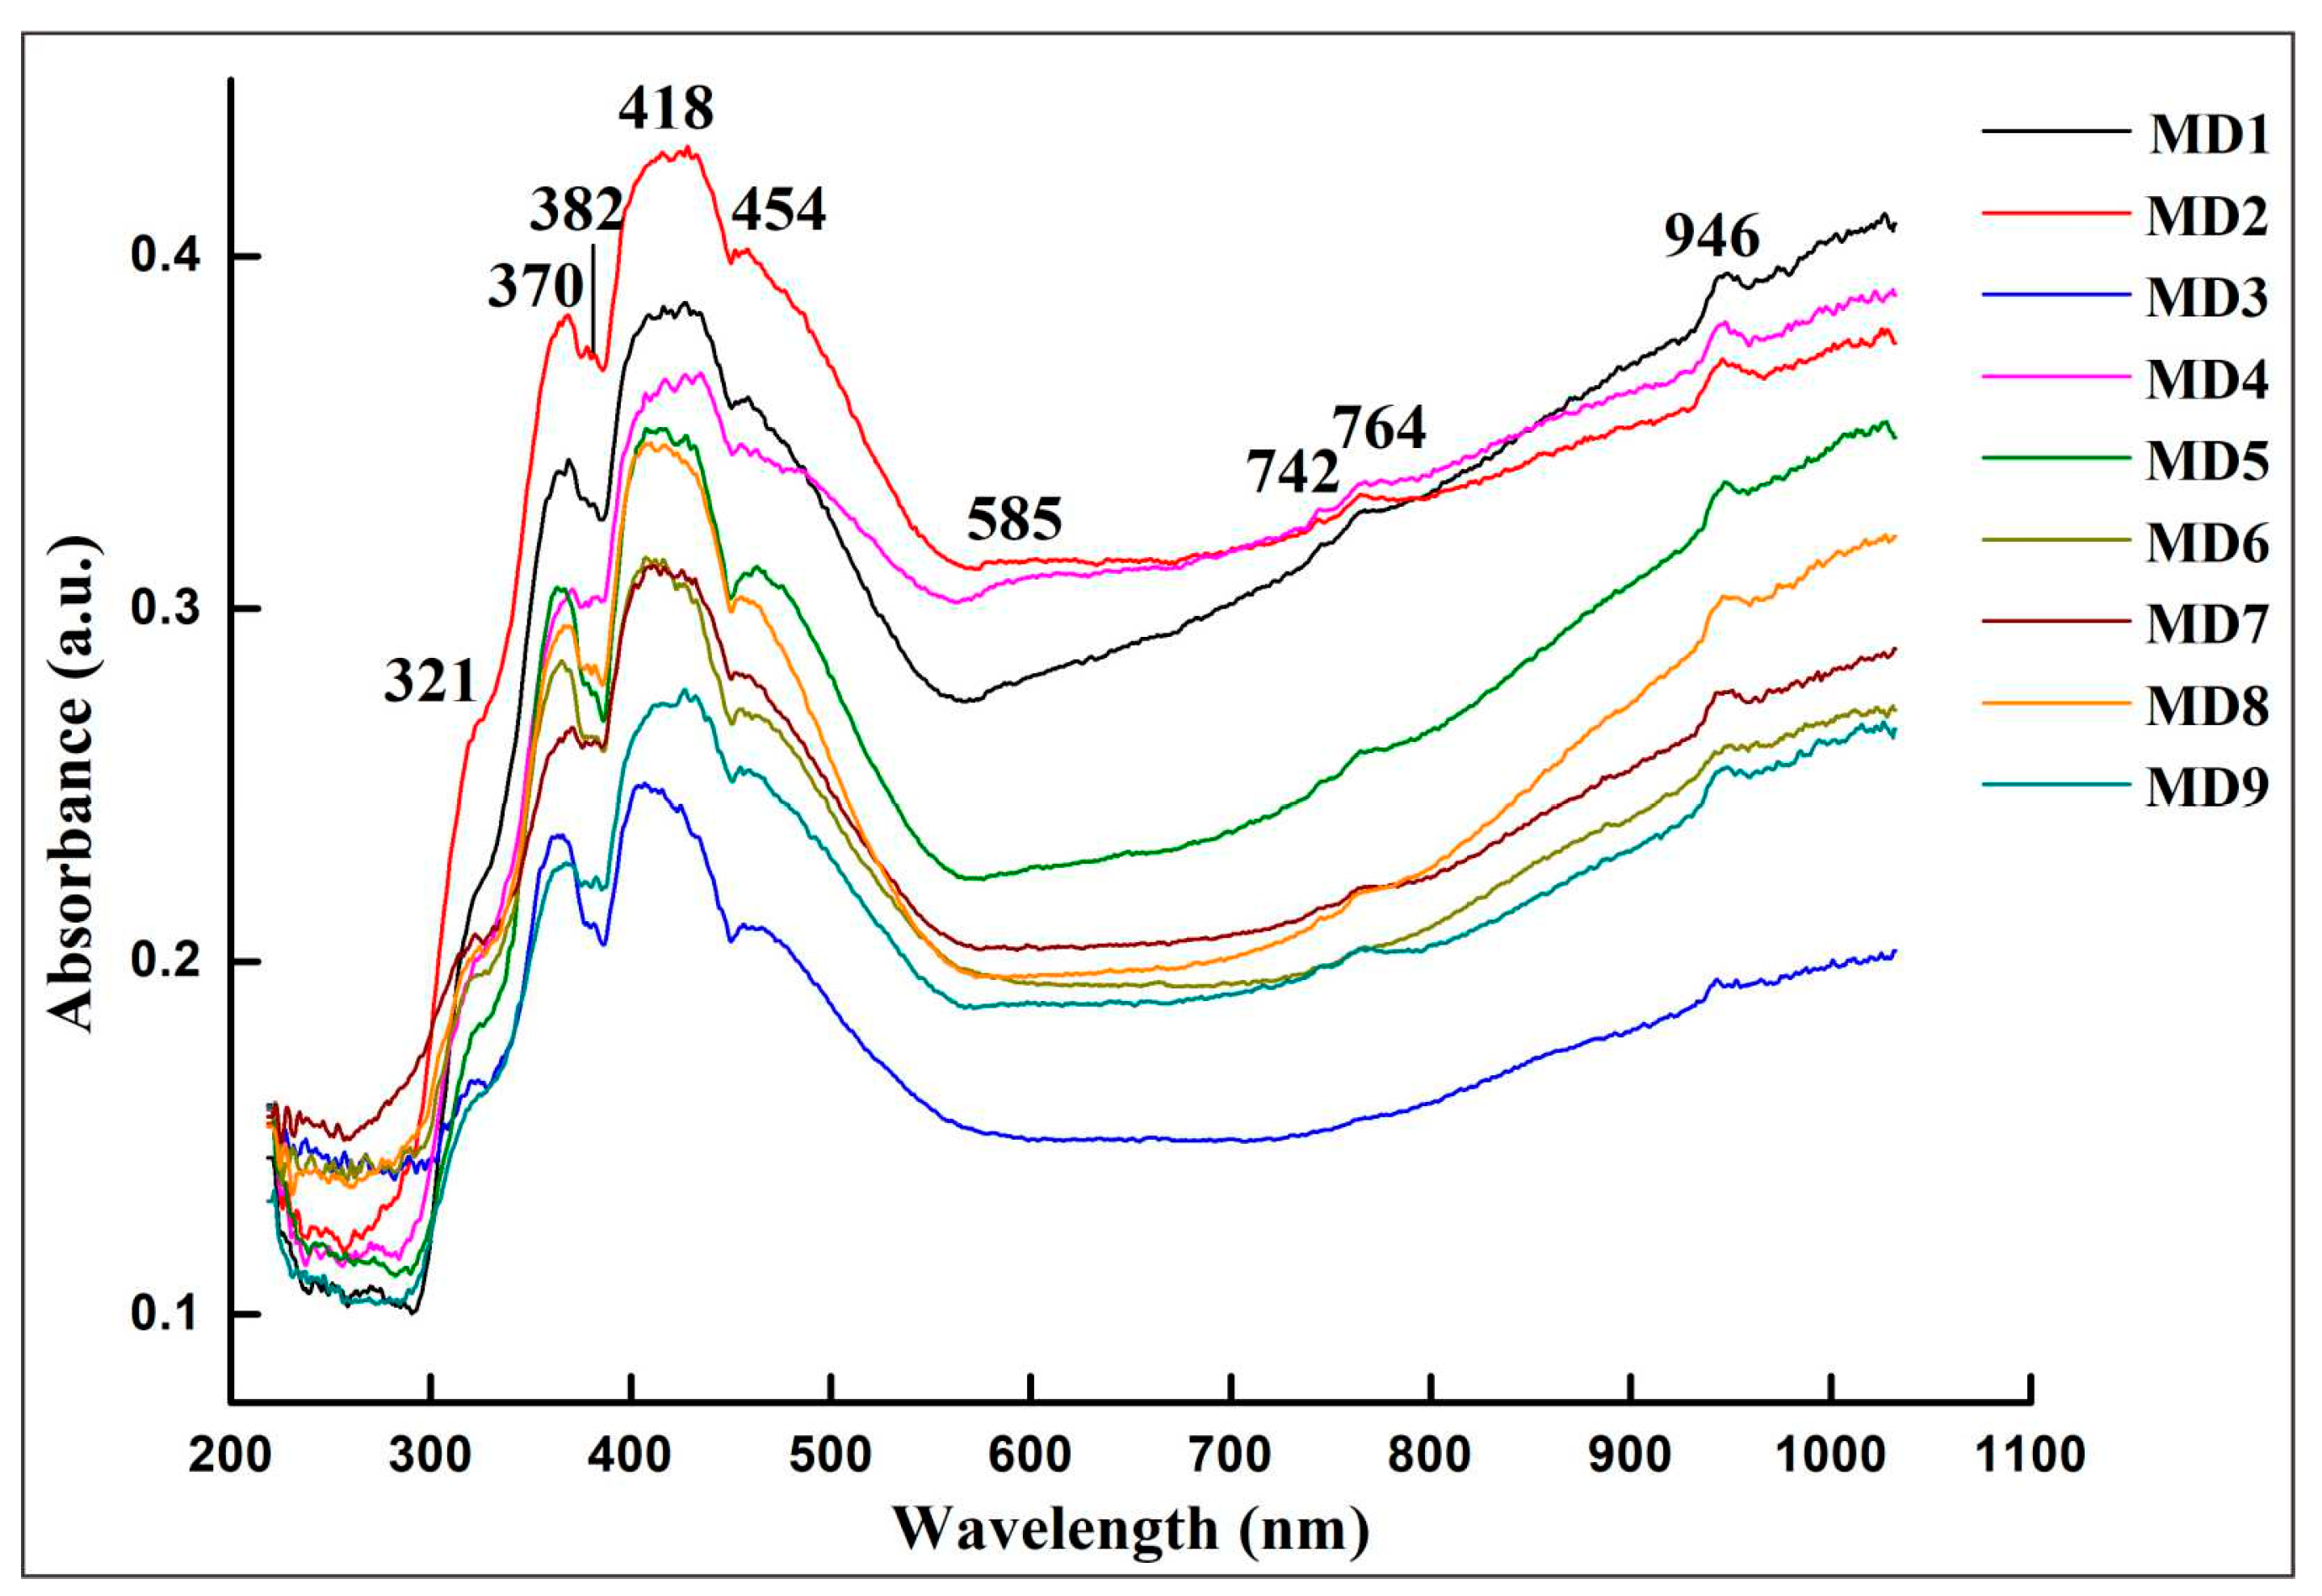
UV-Vis-NIR spectra shows (Figure 5) that the narrow absorption band of the sample at 321 nm is caused by O2−-Fe3+ charge transfer [10]. The absorption peak at 382 nm is attributed to the d-d transition of Fe3+ in the crystal field: 6A1→4T2 (4D). As the valence electrons of Fe3+ transition from the ground state to the excited state in the crystal field are spin forbidden, the absorption at 382 nm is weak [10]. The absorption peaks at 370 and 454 nm are caused by the Fe3+-Fe3+ ion pair. The pairing of Fe3+ will increase the absorption [11]. The narrow absorption band centered at 418 nm is attributed to the d-d transition of V3+ [12], resulting in a broad absorption near the purple region. The 500–600 nm absorption band centered at 585 nm is caused by Fe2+-Ti4+ ion pair charge transfer, which absorbs 2.11 eV energy and makes the sapphire blue [12]. As the sample’s blue tone increases, 585 nm absorption evidently increases. The 700–800 nm broad absorption band is attributed to the charge transfer of Fe2+-Ti4+ and Fe2+-Fe3+ ions, which causes the gray-blue hue of sapphire [13]. The gray-blue hue is more pronounced, and the absorption peaks at 746 nm and 764 nm are more obvious. The 946 nm absorption peak is related to the charge transfer of Fe2+-Fe3+ and Fe3+-Ni2+ ion pairs [14]. The peak intensity of samples MD1, MD2, and MD4 increases due to the relatively high Ni content.
Blue sapphires from other locations, such as Madagascar, Sri Lanka, Shandong, Thailand, and other origins, did not show the 418 nm V3+d-d transition absorption peak (Table 2). The absorption peak caused by Fe2+-Fe3+ charge transfer in the near-infrared region is mainly located near 860 nm, while the peak position of sapphires from Baw-mar mine usually appears at 946 nm. Therefore, it is inferred that the 418 nm absorption peak is the characteristic ultraviolet absorption peak of sapphires from Baw-mar mine. The near-infrared region shifts to the long-wave direction due to Ni participating in the color of Fe3+-Ni2+ charge transfer.
3.5. FTIR Spectroscopy Analysis
Eight samples of rough and curved samples were randomly selected for FTIR spectroscopy testing. The FTIR spectra results show (Figure 6) that the absorption peaks at 485, 519, and 633 cm−1 are attributed to the Al-O structural vibration and are characteristic peaks of Al2O3, consistent with the standard infrared peaks of corundum [15]. The 650–850 cm−1 absorption band splits into two weak absorption peaks of 729 and 803 cm−1, indicating that the corundum crystal structure is distorted when the impurity ion isomorphism replaces Al3+, leading to a decrease in symmetry and a splitting of the absorption band [15]. There are five weak peaks at 930, 1025, 1110, 3619, and 3696 cm−1 of the rough stone, and they are attributed to kaolinite, of which 930 cm−1 is attributed to kaolinite -OH translation, caused by internal hydroxyl groups. The peaks at 1025 and 1110 cm−1 are attributed to Si-O stretching vibration. The peaks at 3619 and 3696 cm−1 are attributed to -OH vibration, which belong to the absorption of outer and inner hydroxyl groups, respectively [16]. There are only two absorption peaks at 3619 and 3696 cm−1 in the curved sample, and the peak attribution is shown in Table 3. In the spectra of rough and curved samples, there are peaks at 1988 and 2123 cm−1, both attributed to diaspore hydroxyl frequency-doubled vibrations [16], indicating that these Myanmar Mogok sapphires originated in metamorphic or intrusive rocks. The crystallized sapphires experienced crustal movement or magma infusion, and reacted with water-rich hydrothermal fluid to eventually form diaspore [17].
The sapphires from Thailand, China, and Australia produced from alkaline basalt deposits have strong reducibility in their crystal growth environment, and -OH absorption peaks appear in the 3000–3500 cm−1 band of their FTIR spectra, with 3310 cm−1 being the strongest spectral feature [18]. Meanwhile, the sapphire from Baw-mar mine does not show this peak, which is speculated to be related to the genesis of the deposit. In addition, the characteristic absorption peaks of 930, 1025, and 1110 cm−1 kaolinite did not appear in sapphires from other famous origins.
3.6. Raman Spectroscopy
In the corundum crystal structure, O2− is the most densely packed hexagonal along the vertical cubic axis, Al3+ is filled in the voids formed by O2−, filling two-thirds of the octahedral voids, and [AlO6] octahedrons are connected in a coplanar direction along the optical axis, and connected in a coplanar direction perpendicular to the optical axis. According to group theory analysis, the normal vibration mode of corundum is: Tg = 2A1g + 3A2g + 5Eg + 2A1u + 2A2u + 4Eu, where 2A1g and 5Eg are Raman activities [19]. The Raman peaks of the curved samples at 369, 410, 437, 565, 633, and 739 cm−1 are characteristic Raman shifts of corundum, consistent with the XRD results. These Raman peaks are related to the vibration of the [AlO6] octahedron [20] (Figure 7), of which 410 and 633 cm−1 peaks are attributable to A1g, while peaks at 369, 437, 565, and 739 cm−1 are attributable to Eg [20]. The peaks at 369, 410, and 437 cm−1 are caused by the bending vibration of the [AlO6] group, and those at 565, 633, and 739 cm−1 are caused by the stretching vibration of the [AlO6] group [21]. There is no diaspore in the XRD test results and in the Raman spectra, which may be related to the different sample states used in the two test methods.
Compared with the sapphires from Sri Lanka, China, and Australia (Table 4), the Raman shifts of sapphires of different origins are basically consistent, indicating that Raman spectra have a limited effect on sapphire origin traceability and are more suitable for the identification of gem species.
4. Conclusions
The blue sapphires from Baw-mar mine in Mogok, Myanmar showed distinctly different characteristics from blue sapphires of other origins. The samples contain white clay minerals attached to the surface of their rough stones, which are confirmed to be kaolinite by XRD. They are usually free of solid inclusions. Both XRD and Raman spectroscopy indicate that the matrix’s composition is Al2O3. The content of Fe and Ti in the XRF test is significantly higher than that of high-quality sapphires. The UV-Vis-NIR spectra are different from those of sapphires of other origins. They contain the characteristic peak of V3+ d-d transition. When Ni2+ exists, it will transfer with Fe3+ to aggravate the gray tone of the sapphire. The IR spectra showed three characteristic peaks of kaolinite in the range of 900–1200cm−1, and confirmed the existence of diaspore. The characteristic peaks in UV-Vis-NIR spectra and IR spectra can be used to identify sapphires in this mine effectively. Based on the microscopic observation, chemical composition, and spectroscopic characteristics, the blue sapphires from Baw-mar mine can be distinguished from sapphires of other origins.
Author Contributions
Conceptualization, S.C. and E.Z.; methodology, S.C.; writing—original draft preparation, S.C., H.T., C.Z., Y.T. and E.Z.; writing—review and editing, S.C. and C.Z.; supervision, E.Z.; funding acquisition, H.T. All authors have read and agreed to the published version of the manuscript.
Funding
This research was supported by the National Natural Science Foundation of China. (Grant No. 51662023).
Data Availability Statement
Not applicable.
Acknowledgments
We are grateful to Editor-in-Chief Helmut Cölfen and Guest Editor Fei Liu for their efficient editorial handling, as well as two anonymous reviewers for their constructive comments and suggestions that greatly improve this manuscript. We appreciate Motai for providing the rough sapphire samples from the Baw-mar mine in Mogok, Myanmar.
Conflicts of Interest
The authors declare that they have no known competing financial interests or personal relationships that could have appeared to influence the work reported in this paper.
References
- Zhang, B.L. Systematic Gemology, 2nd ed.; Geological Publishing House: Beijing, China, 2006; pp. 124–125. [Google Scholar]
- Palke, A.C.; Wong, J.; Verdel, C.; Ávila, J.N. A common origin for Thai/Cambodian rubies and blue and violet sapphires from Yogo Gulch, Montana, USA? Am. Miner. 2018, 103, 469–479. [Google Scholar] [CrossRef]
- Chen, C.Y.; Huang, W.Z.; Shao, T. Study on UV-Visible Spectroscopy of Special Color-changing Sapphire. Spectrosc. Spectr. Anal. 2019, 39, 2470–2473, (In Chinese with English abstract). [Google Scholar]
- Harlow, G.E.; Bender, W. A study of ruby (corundum) compositions from the Mogok Belt, Myanmar: Searching for chemical fingerprints. Am. Miner. 2013, 98, 1120–1132. [Google Scholar] [CrossRef]
- Palanza, V.; Di Martino, D.; Paleari, A.; Spinolo, G.; Prosperi, L. Micro-Raman spectroscopy applied to the study of inclusions within sapphire. J. Raman Spectrosc. 2008, 39, 1007–1011. [Google Scholar] [CrossRef]
- Peucat, J.; Ruffault, P.; Fritsch, E.; Coz, M.B.-L.; Simonet, C.; Lasnier, B. Ga/Mg ratio as a new geochemical tool to differentiate magmatic from metamorphic blue sapphires. Lithos 2007, 98, 261–274. [Google Scholar] [CrossRef]
- Kan-Nyunt, H.-P.; Karampelas, S.; Link, K.; Thu, K.; Kiefert, L.; Hardy, P. Blue Sapphires from the Baw Mar Mine in Mogok. Gems Gemol. 2013, 49, 223–232. [Google Scholar] [CrossRef]
- Zaw, K.; Sutherland, L.; Yui, T.-F.; Meffre, S.; Thu, K. Vanadium-rich ruby and sapphire within Mogok Gemfield, Myanmar: Implications for gem color and genesis. Miner. Depos. 2014, 50, 25–39. [Google Scholar] [CrossRef]
- Soonthorntantikul, W.; Vertriest, W.; Raynaud-Flattot, V.L. An in-Depth Gemological Study of Blue Sapphires from the Baw Mar Mine (Mogok, Myanmar); GIA: Bangkok, Thailand, 2017. [Google Scholar]
- Qiu, C.J.; Wang, Y.Q.; Huang, Y.X. Study on color causes and improvement technology of low-quality sapphire in Madagascar. Prog. Laser Optoelectron. 2015, 52, 283–290, (In Chinese with English abstract). [Google Scholar]
- Han, X.Z.; Kang, Y.; Feng, X.Q. Research on the color-causing mechanism and color modification of African yellow sapphire. J. Chin. Ceram. Soc. 2019, 47, 990–994, (In Chinese with English abstract). [Google Scholar]
- Abduriyim, A. Determination of the origin of blue sapphire using laser ablation inductively coupled plasma mass spectrometry (LA-ICP-MS). J. Gemmol. 2006, 30, 23–36. [Google Scholar] [CrossRef]
- Fan, J.L. Research on Color Optimization and Fracture Filling Technology of Ruby and Sapphire. Ph.D. Thesis, East China University of Technology, Beijing, China, 2009; pp. 42–44, (In Chinese with English abstract). [Google Scholar]
- Mogmued, J.; Monarumit, N.; Won-In, K.; Satitkune, S. Spectroscopic properties for identifying sapphire samples from Ban Bo Kaew, Phrae Province, Thailand. J. Phys. Conf. Ser. 2017, 901, 12075. [Google Scholar] [CrossRef] [Green Version]
- Chen, T.; Yang, M.X. The gemological characteristics and identification of Be diffusion treatment, heat treatment and natural two-color Changle sapphire. Spectrosc. Spectr. Anal. 2012, 32, 651–654, (In Chinese with English abstract). [Google Scholar]
- Ding, J.; Li, Z.Y.; Li, S.P. Infrared spectroscopy analysis and discussion of Shandong sapphire. Metrol. Test. Technol. 2011, 38, 54–55. (In Chinese) [Google Scholar]
- Xu, Y.F. Study on Gemological Characteristics and Heat Treatment Color Modification Technology of Australian Sapphire. Master Thesis, China University of Geosciences, Wuhan, China, 2019; pp. 24–25, (In Chinese with English abstract). [Google Scholar]
- Ning, P.Y.; Zhang, T.Y.; Ma, H. Infrared spectroscopy-micro confocal laser Raman spectroscopy to study the characteristics of water-containing mineral inclusions in rubies and sapphires. Rock Miner. Test. 2019, 38, 640–648, (In Chinese with English abstract). [Google Scholar]
- Giuliani, G.; Dubessy, J.; Banks, D.A.; Lhomme, T.; Ohnenstetter, D. Fluid inclusions in ruby from Asian marble deposits: Genetic implications. Eur. J. Miner. 2015, 27, 393–404. [Google Scholar] [CrossRef]
- Zu, E.D.; Sun, Y.D.; Zhang, P.X. Raman spectral analysis of natural and synthetic rubies. Spectrosc. Spectr. Anal. 2010, 30, 2164–2166, (In Chinese with English abstract). [Google Scholar]
- Jin, Y.F. Heat treatment of milky sapphire in Sri Lanka. J. Miner. 2015, 35, 550–554, (In Chinese with English abstract). [Google Scholar]
Figure 1.
Regional geological map showing general distribution of the ruby/sapphire mine/workings and geological settings of the Mogok gemfield, Myanmar. The sampling location is shown by blue box (modified after [8]).
Figure 1.
Regional geological map showing general distribution of the ruby/sapphire mine/workings and geological settings of the Mogok gemfield, Myanmar. The sampling location is shown by blue box (modified after [8]).

Figure 2.
Rough sapphires from Baw-mar Mine.

Figure 3.
Cutting samples of sapphires from the Baw-mar mine.

Figure 4.
(a) Representative XRD diffraction pattern of white powder on sapphire and rough surface. (b) Off-white material on the surface of the rough sample.
Figure 4.
(a) Representative XRD diffraction pattern of white powder on sapphire and rough surface. (b) Off-white material on the surface of the rough sample.

Figure 5.
Representative UV-Vis-NIR spectra of sapphires.

Figure 6.
Representative FTIR spectra of sapphire. (a) FTIR spectra of rough samples. (b) FTIR spectra of curved samples.
Figure 6.
Representative FTIR spectra of sapphire. (a) FTIR spectra of rough samples. (b) FTIR spectra of curved samples.

Figure 7.
Representative Raman spectra of sapphire.


Table 1.
Chemical composition of sapphires from Baw-mar mine (Wt.%).
| Sample | Al | O | Si | Fe | Ti | V | Ni | Cr | Ga | Mg |
|---|---|---|---|---|---|---|---|---|---|---|
| MD1 | 50.770 | 46.864 | 0.159 | 0.313 | 0.015 | 0.003 | 0.024 | - | 0.005 | 0.030 |
| MD2 | 51.044 | 47.117 | 0.182 | 0.275 | 0.013 | 0.004 | 0.012 | 0.008 | 0.006 | - |
| MD3 | 50.741 | 46.838 | 0.128 | 0.403 | 0.025 | 0.002 | - | - | 0.004 | 0.010 |
| MD4 | 51.149 | 47.215 | 0.135 | 0.248 | 0.017 | 0.005 | 0.016 | 0.009 | 0.006 | - |
| MD5 | 51.003 | 47.079 | 0.158 | 0.215 | 0.016 | 0.003 | - | 0.006 | 0.004 | - |
| MD6 | 51.039 | 47.112 | 0.135 | 0.221 | 0.017 | 0.003 | 0.009 | - | 0.005 | 0.020 |
| MD7 | 50.723 | 46.821 | 0.140 | 0.266 | 0.031 | 0.003 | - | - | 0.004 | 0.020 |
| MD8 | 51.485 | 47.525 | 0.143 | 0.257 | 0.020 | 0.004 | 0.011 | 0.014 | 0.006 | - |
| MD9 | 51.156 | 47.221 | 0.175 | 0.200 | 0.016 | 0.004 | - | 0.007 | 0.005 | - |
| Average | - | - | - | 0.266 | 0.019 | 0.003 | - | - | - | - |
Table 2.
UV-Vis absorption peak frequency and attributes of sapphires in this study and other locations (nm).
Table 2.
UV-Vis absorption peak frequency and attributes of sapphires in this study and other locations (nm).
| Sapphire Varieties | Sapphire Curved Sample from Baw-Mar Mine | Madagascar [8] | Sri Lanka [10] | Shandong, China [11] | Thailand [12] |
|---|---|---|---|---|---|
| Fe3+d-d transition | 382 | 388 | 388 | 387 | 388 |
| V3+d-d transition | 418 | - | - | - | - |
| O2--Fe3+ charge transfer | 321 | - | - | - | - |
| Fe3+-Fe3+ charge transfer | 369, 454 | 377, 451 | 388, 451 | 377, 451 | 377, 450 |
| Fe2+-Ti4+ charge transfer | 585 | 579 | 565 | 589 | 575 |
| Fe2+-Ti4+ and Fe2+-Fe3+ charge transfer | 742, 765 | - | - | - | 710 |
| Fe2+-Fe3+ and Fe3+Ni2+ charget ransfer | 946 | - | - | 863 | 860 |
Table 3.
FTIR peak frequency and attribution of sapphire in this study (cm−1).
| Sample | Al-O Structure Vibration | Si-O Vibration | -OH Translation | -OH Vibration |
|---|---|---|---|---|
| Sapphire rough sample from Baw-mar mine | 484, 517, 631, 729, 800 | 1025, 1110 | 934 | 1986, 2120, 3619, 3680 |
| Sapphire curved sample from Baw-mar mine | 484, 515, 632, 725, 800 | - | - | 1984, 2120, 3619, 3700 |
| Thailand [12] | 385, 460, 600, 648, 805, 1100 | - | - | 3234, 3310, 3368 |
| Shandong [14] | 489, 517, 633 | - | - | 3309, 3622, 3695 |
| Australia [16] | 436, 454, 490, 519, 630 | - | - | 3186, 3233, 3310 |
Table 4.
Raman peak frequency and attribution of Sapphire. (cm−1).
| [AlO6] Group | Bending Vibration | Stretching Vibration | ||
|---|---|---|---|---|
| A1g | Eg | A1g | Eg | |
| Standard corundum Raman shift | 418 | 378, 432 | 645 | 578, 751 |
| Sapphire camber sample from Baw-mar mine | 411 | 368, 439 | 634 | 565, 740 |
| Shandong [15] | 415 | 376, 482 | 672 | 574, 748 |
| Australia [16] | - | 377, 429 | 642 | 750 |
| Sri Lanka [19] | 416 | 379, 434 | - | 557, 749 |
Publisher’s Note: MDPI stays neutral with regard to jurisdictional claims in published maps and institutional affiliations. |
© 2021 by the authors. Licensee MDPI, Basel, Switzerland. This article is an open access article distributed under the terms and conditions of the Creative Commons Attribution (CC BY) license (https://creativecommons.org/licenses/by/4.0/).
Share and Cite
MDPI and ACS Style
Chen, S.; Tan, H.; Zhang, C.; Teng, Y.; Zu, E. Study on Gemological Characteristics of Blue Sapphires from Baw-Mar Mine, Mogok, Myanmar. Crystals 2021, 11, 1275. https://0-doi-org.brum.beds.ac.uk/10.3390/cryst11111275
AMA Style
Chen S, Tan H, Zhang C, Teng Y, Zu E. Study on Gemological Characteristics of Blue Sapphires from Baw-Mar Mine, Mogok, Myanmar. Crystals. 2021; 11(11):1275. https://0-doi-org.brum.beds.ac.uk/10.3390/cryst11111275
Chicago/Turabian StyleChen, Siming, Honglin Tan, Cun Zhang, Yajun Teng, and Endong Zu. 2021. "Study on Gemological Characteristics of Blue Sapphires from Baw-Mar Mine, Mogok, Myanmar" Crystals 11, no. 11: 1275. https://0-doi-org.brum.beds.ac.uk/10.3390/cryst11111275
Note that from the first issue of 2016, this journal uses article numbers instead of page numbers. See further details here.