
In-Situ Infrared Spectra of OH in Pakistan Forsterite at High Temperature

1
State Key Laboratory of Lithospheric Evolution, Institute of Geology and Geophysics, Chinese Academy of Sciences, Beijing 100029, China
2
School of Gemmology, China University of Geosciences, Beijing 100083, China
*
Author to whom correspondence should be addressed.
Crystals 2021, 11(11), 1277; https://0-doi-org.brum.beds.ac.uk/10.3390/cryst11111277
Submission received: 30 September 2021
/
Revised: 15 October 2021
/
Accepted: 19 October 2021
/
Published: 21 October 2021
(This article belongs to the Special Issue Gem Crystals)
Abstract
:The hydroxyl of the gem-grade forsterite from Pakistan was measured by the polarized spectra at room temperature to 1000 °C, showing four unambiguous absorption bands at 3612, 3597, 3579, and 3566 cm−1. Here, we report angle-resolved polarized IR spectroscopy of the crystal-oriented forsterite, which were heated at 1 bar up to 1000 °C in situ to investigate the hydrogen diffusion character. The peak positions of the IR absorbance at 3579 cm−1, 3597 cm−1, and 3566 cm−1 of forsterite decreased linearly depending on the temperature, while the 3612 cm−1 is stable. We discuss that the dipole orientation of the hydroxyl is analyzed by a pleochroic scheme of the integrated absorbance vs. sample to polarizer angle. Our data suggest that the temperature effect cannot be ignored since the absorption coefficients and absorbance band positions of OH may alter.
1. Introduction
Nominally anhydrous minerals (NAMs) accommodate trace amounts of water in the crystal lattice defects in the form of structurally-bound hydroxyls groups [1,2,3]. The total amount of the hydrogen may be huge even with a deficient concentration because of the widespread existence of the host minerals on the crust and upper mantle [4,5,6]. The physical properties of the crust and upper mantle such as rheological behavior and seismic property may be affected remarkably by the concentration of structural hydrogen [3,7].
Infrared spectroscopy (IR) is becoming the most frequently used for the trace amounts of water concentration analysis in NAMs by calibration of Beer-Lambert’s law (The total absorbance is proportional to the concentration of the total hydrogen):
where A is the absorbance, ε is the molar absorption coefficient in L·mol−1 cm−2, t is the sample thickness in cm, and c is the absorber concentration in mol L−1, [2,8,9,10]. IR spectroscopy methods have kept improving over the past 20 years. A more precise water concentration was obtained benefit from the substitution of a constant molar absorption coefficient to a mineral-specific absorption coefficient [9,10,11,12,13]. Meanwhile, polarized IR was used not only for the accurate quantitative determination but also made it possible for the orientation of OH dipoles in anisotropic NAMs [14,15,16]. Simple but feasible quantification methods were developed based on the theoretical model of IR absorb character [15,16,17,18]. By applying a newly-introduced Photoinduced Force Microscopy technique, quantitative determination of the total amount of water in NAMs develops into a new era of nanometer-scale [19].
A = εtc
Olivine, (Mg, Fe)2SiO4, one of the most fundamental minerals of the Earth’s upper mantle, has an orthorhombic unit cell with a = 0.475 nm, b = 1.022 nm, and c = 0.599 nm. The oxygens were assembled as a hexagonal close-packing configuration with one-eighth of the tetrahedral interstices occupied by Si atoms and one-half of the octahedral interstices occupied by (Mg, Fe) atoms. The occupied octahedral interstices can be divided into two types, M1 and M2. The M1 position is located on the symmetry center and the M2 position is located on the symmetry plane. The oxygen atoms can be divided into three positions, named as the O1, O2, and O3 positions, respectively.
In general, four substitution mechanisms of structural OH in olivine, associated with (1) Si vacancies, (2) Mg vacancies, (3) Ti, or (4) trivalent cations, respectively, can be identified by their different IR absorption wavenumbers [20,21,22,23]. The OH bands related to Si4+ vacancies, located at 3428–3613 cm−1, had a significant influence on the hydrolytic weakening of the olivine through various temperatures depending on diffusion characteristics [21]. The Si4+ vacancy replacement by a cluster of four protons has been proposed as an important hydrogen incorporation mechanism of forsterite [24,25]. The total water content calculated by IR mineral-specific coefficients is inadequate for a more accurate IR-based total water evaluation [20]. Due to the anisotropic of the structural hydroxyl, the physical properties of forsterite are highly dependent on the crystal axis. Therefore, polarized IR was introduced into the research area of OH dipole orientation [26,27]. The hydrogen diffusion rates in synthetic forsterite vary by different types of host defect structure [24,28]. However, the temperature-induced diffusion of Si4+ vacancies-related OH of Pakistan forsterite was not well illustrated yet.
The in situ IR spectroscopic study at high temperatures is a powerful tool to verify the different incorporation mechanisms of hydrogen in olivine since the distinct temperatures of dehydrogenation of different types of OH. However, few papers have reported the in situ IR spectra of hydrogen in olivine at high temperatures to 1100 °C [21,29,30]. Yang and Keppler [21] suggested that hydrogen substituting for Si vacancies corresponding to the 3612 cm−1 band was not stable at high temperatures based on its disappearance during heating, which was challenged by the theoretical calculations on Fe-free forsterite [31,32]. Yang et al. [29] fingerprinted hydrogen storage sites in olivine at high temperatures and high pressures using in situ IR spectroscopy and characterized the spectroscopic variations under different temperatures. It was found that hydrogen does not transfer between storage sites with increasing temperature, but displays disordering at temperatures over 600 °C. In addition, in situ IR spectroscopic studies at high temperatures could indicate the OH sites in olivine at the proportionable temperature conditions of the upper mantle.
In this paper, hydroxyl stretching bands were distinguished based on their relative intensity from the polarized spectra. Polarized IR spectra were used to constrain the OH vector orientations. An in situ heating experiment was also applied to probe the dehydrogenation mechanism for forsterite under high temperature. Part dehydrogenation was designed in order to investigate the thermal behavior of the OH under the heating and cooling process.
2. Materials and Methods
2.1. Samples Description
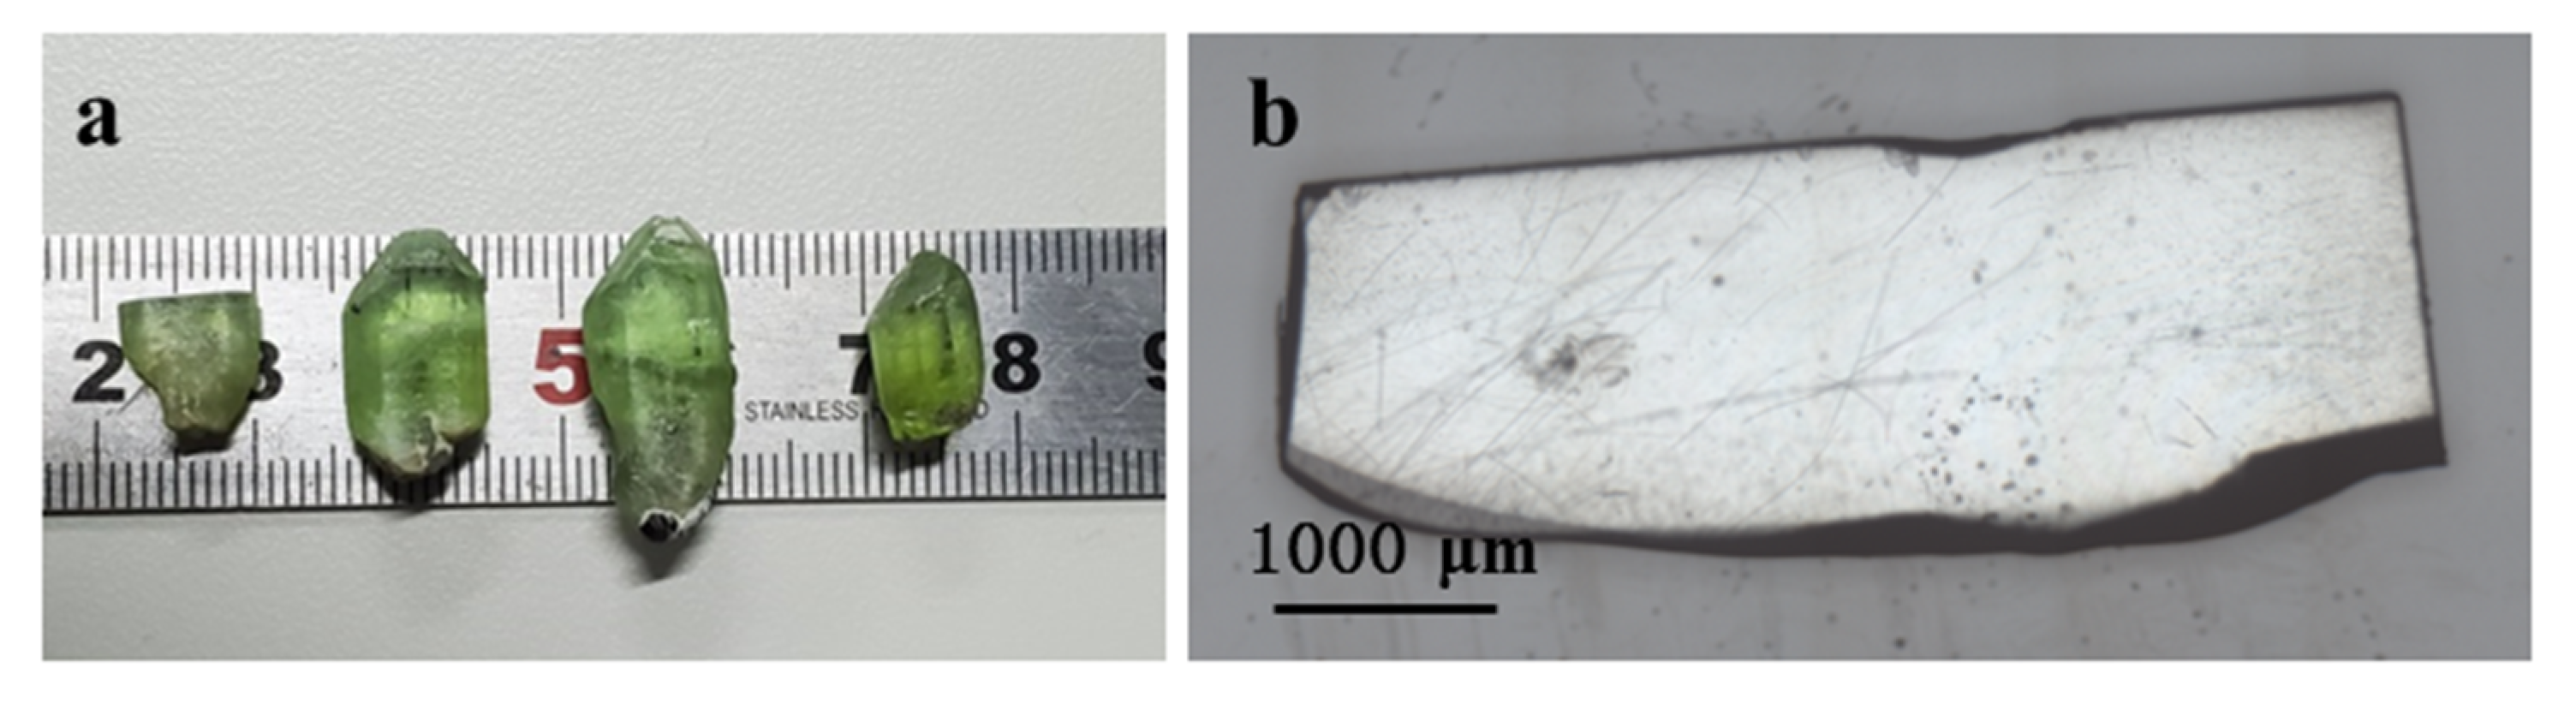
A gem-quality olivine crystal from Khyber Pakhtunkhwa Province, Pakistan, with a size of 4 × 8 × 13 mm was studied (Figure 1). The average compositions of the studied olivine are as follows: 42.4 wt% SiO2, 0.013 wt% Al2O3, 0.01 wt% CaO, 53.3 wt% MgO, 0.17 wt% MnO, 4.16 wt% FeO, 0.02 wt% Cr2O3, and 0.33 wt% NiO. The c axis of the forsterite crystals was first oriented by its crystallographic morphology and then SEM-EBSD was used to identify the (010) planes. The sample was oriented according to the crystal morphology parallel to (001). A (001) plane section was cut by a diamond wire cutting machine (Figure 1). Then, the other two platelets were cut perpendicular from each other from the sample. Crystal axis-oriented sections were cut by a diamond wire.
The test area covers a dimension of 50 × 50 μm and is without any optical impurities and inclusions. The orientation of the crystal sections was checked by the EBSD method. The thickness of the 3 sections, 366 μm, 377 μm, and 393 μm, respectively, were determined with a Sanliang machinist’s digital indicator, which is nominally accurate to within 2 μm.
2.2. Electron Microprobe
The chemical compositions of the studied olivine were determined using a JXA8100 electron microprobe at the Institute of Geology and Geophysics, Chinese Academy of Science (IGGCAS). The analyses were performed with a 15 kV accelerating voltage, 20 nA beam current and a 5 μm beam diameter.
2.3. Scanning Electron Microscope (SEM) and Electron Backscatter Diffraction (EBSD)
EBSD testing and analyses were performed on the vibro-polished section using an oxford EBSD system on an FEI Nova Nano450 field emission scanning electron microscope (FE-SEM) at the IGGCAS. The measurements were operated on a 70° tilted stage with an accelerating voltage of 20 kV and a spot size of 6 in a focused beam configuration. The EBSD patterns of the studied forsterite section suggest a plane close to (010) (Figure 2).
2.4. IR Spectroscopy
Fourier transform infrared (FTIR) spectroscopy analyses were carried out at the IGGCAS. A Hyperion 2000 IR microscope with an MCT detector cooled with liquid nitrogen was connected to a Bruker Vertex 70V FTIR spectrometer with a KBr beam splitter and globar source.
An MFP10-1500/5000 MIR polarizer with an extinction ratio of 1000:1 was used for linear polarized measurements. A square aperture with an edge length of −50 μm was used to gain a good signal-to-noise ratio. The study area is free of fluid hydrous inclusions as no characteristic broad water bands around 3400 cm−1 were obtained.
In order to correlate the polarized IR spectra with the crystal orientation, polarized measurements were collected after each 10° rotation electric vector (E) parallel to the Y-axis of the sample stage. The rotation axis of the sample stage was aligned along the actual crystallographic axis of the studied grains.
Spectra were recorded in the range of 650–4500 cm−1 with a resolution of 4 cm−1 by 32 or 64 scans. The atmospheric compensation tool and background subtraction were conducted by the OPUS software after acquiring the spectra.
The atmospheric compensation tool and background subtraction using the concave rubber band algorithm with 3 iterations of the OPUS software was used after acquisition.
2.5. Heating Experiments
The effect of temperature on the IR spectrum of the samples was investigated using a Linkam TS 1400 temperature stage (Linkam Scientific Instruments) with windows of ZnSe slices placed on the sample stage of the Hyperion 2000 IR microscope. The sample wafer was placed on a sapphire disc within a nitrogen-purged Linkam TS 1400 temperature stage. The upper window is made of zinc selenide and the lower window is quartz. In situ heating experiments were operated from 25 °C to 1000 °C in the air with a 50 °C interval. Every test was conducted after 5 min of temperature retention.
3. Results and Discussion
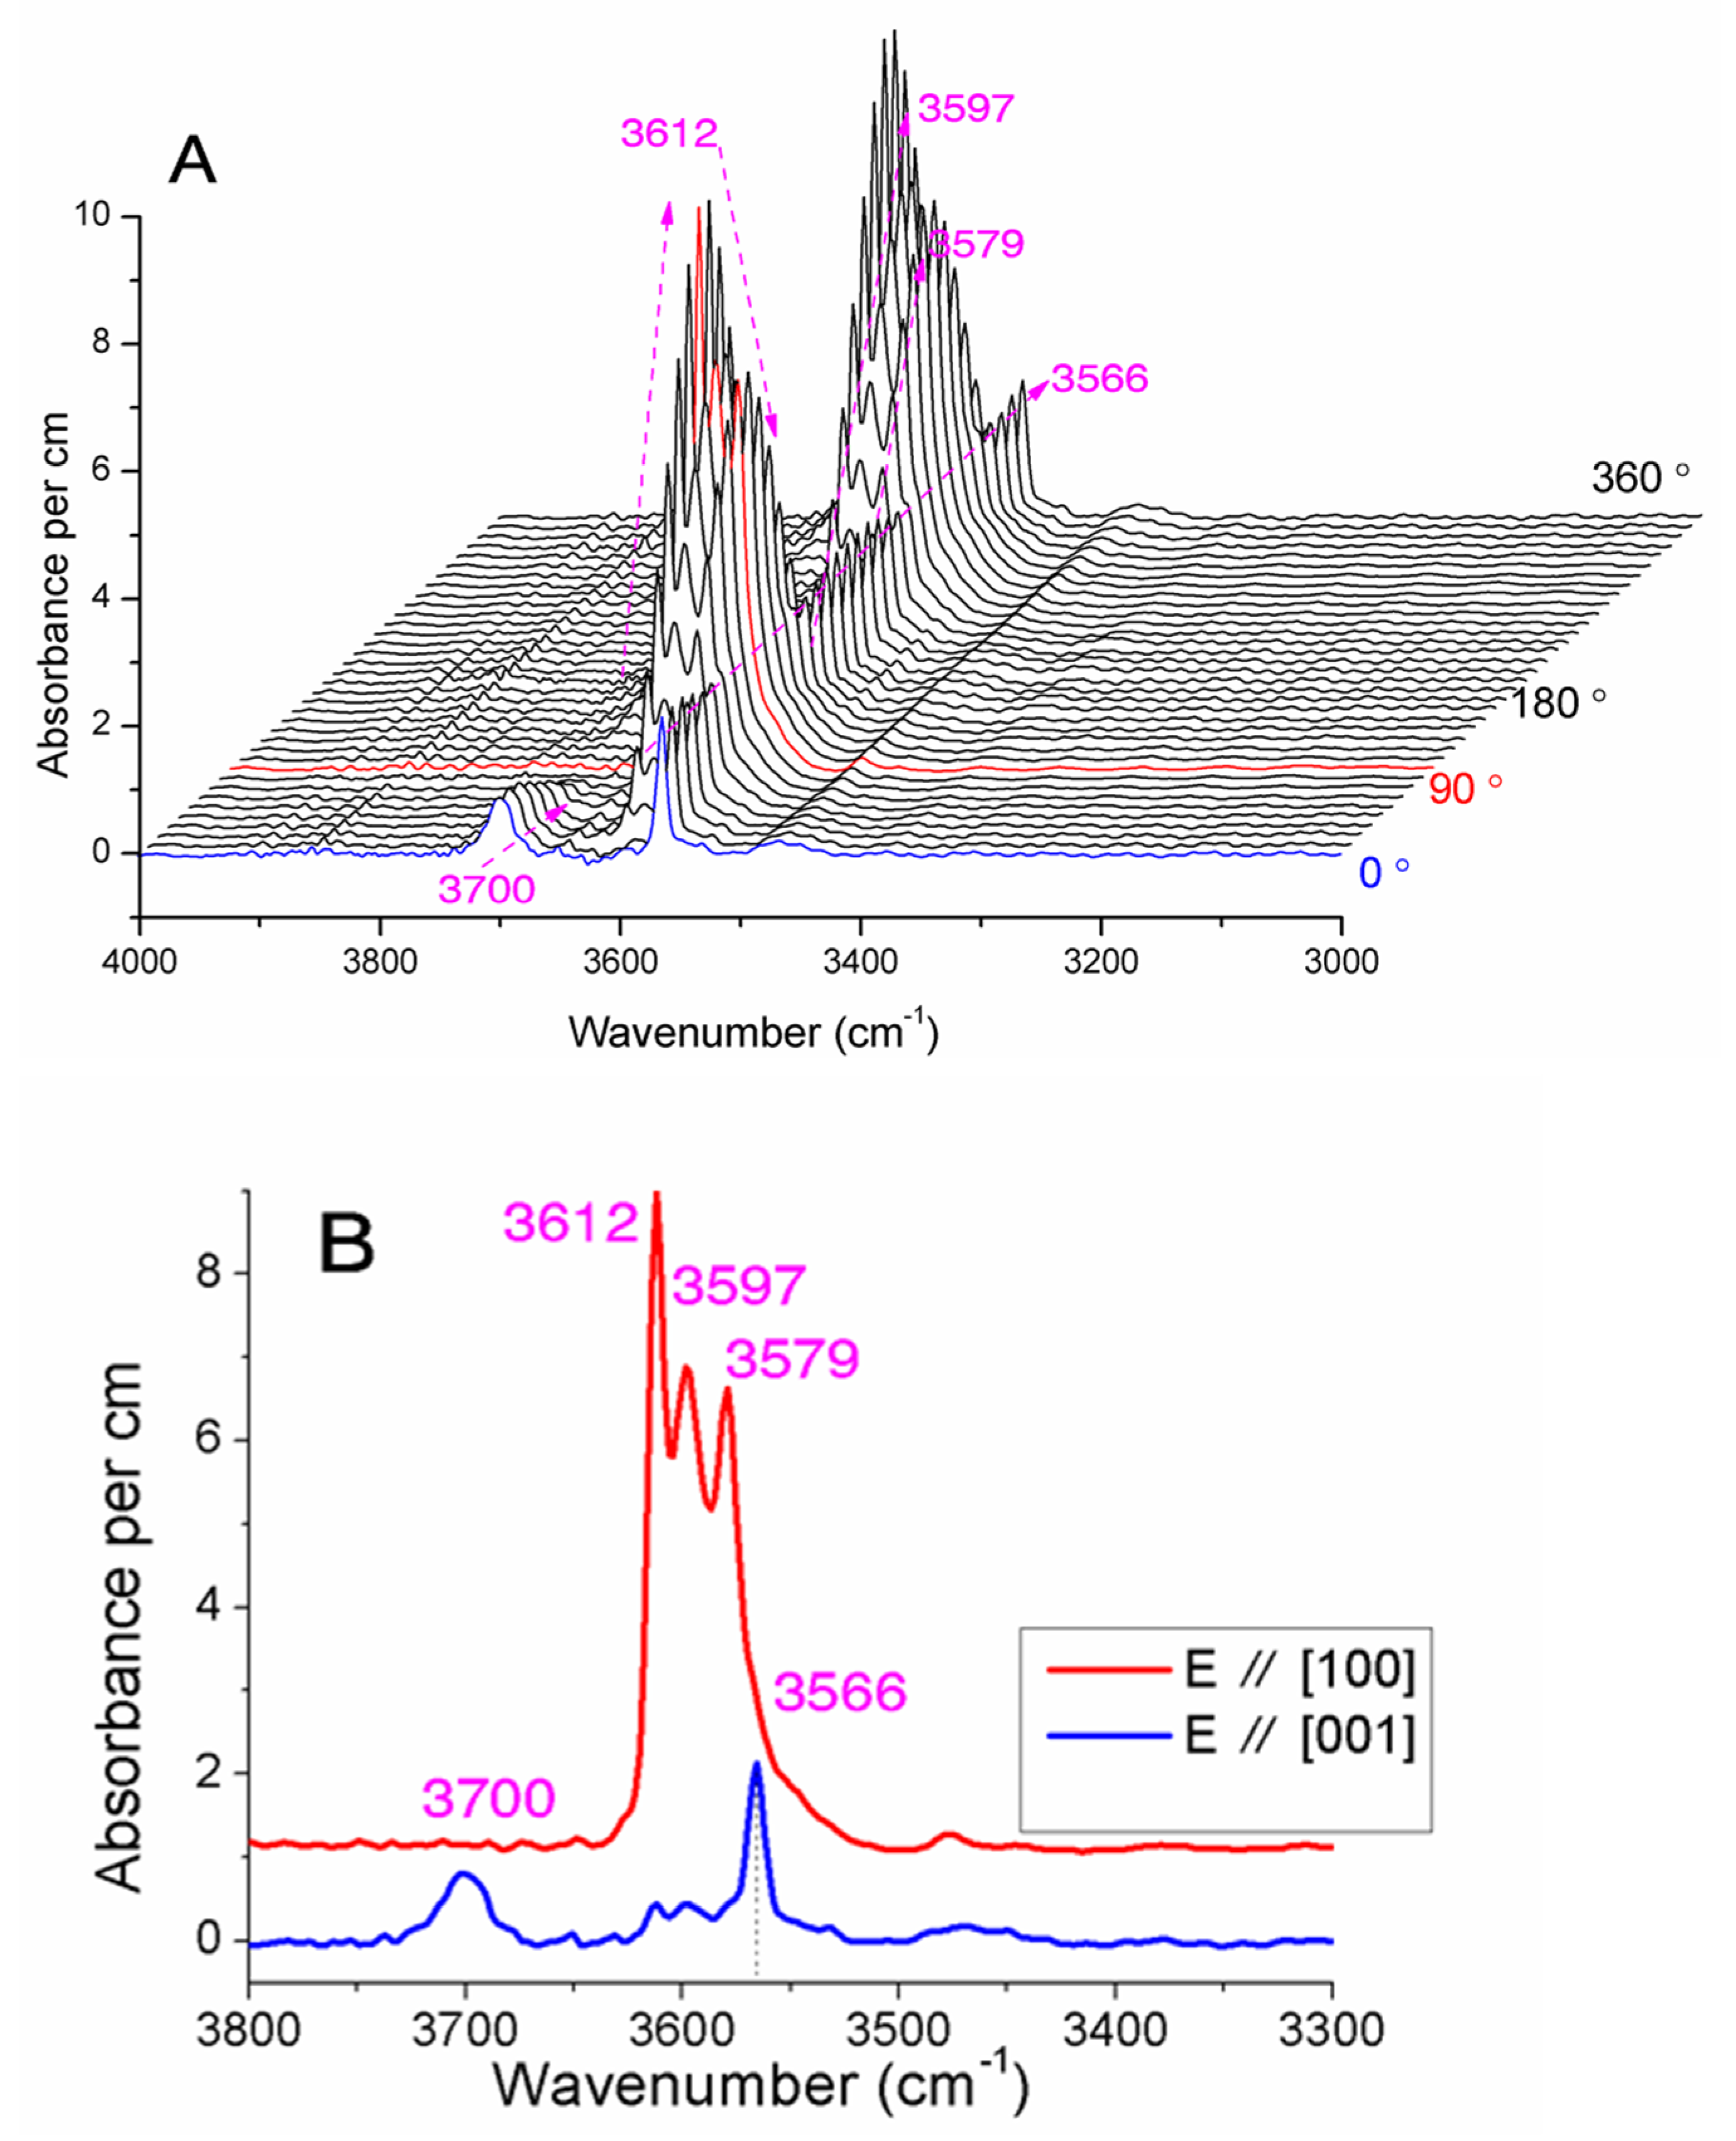
Angle-resolved polarized IR spectra were measured by altering the relative angles between the polarization direction of IR and crystal orientation to analyze the anisotropic IR response. Figure 3, Figure 4 and Figure 5 show an angular IR absorption OH stretching spectra of (001), (100), and (010) planes of forsterite with the IR vector of light vibrating perpendicular to the planes, respectively.
In general, four prominent bands at 3612 cm−1, 3597 cm−1, 3579 cm−1, 3566 cm−1, and a series of accompanied weak shoulder peaks at 3525–3560 cm−1 (Figure 3, Figure 4 and Figure 5), are assigned to the Si vacancies of structural OH in forsterite. The band at 3700 cm−1 is related to a hydrous phase such as brucite [33] or serpentine [34]. Figure 3 shows that the IR peaks in the perpendicular configuration exhibit a distinct dependence on θ. Within a period of 360°, the IR intensities for most of the OH show two maxima and minimum values, which means an absorption periodic of 180°. The 3597 cm−1 and 3579 cm−1 peaks exhibit the same trend no matter what polarization direction of the IR applied. The 3612 cm−1, 3597 cm−1, 3579 cm−1, 3566 cm−1 bands were chosen for pleochroic analysis. Figure 6, Figure 7 and Figure 8 show the pleochroic scheme of the OH stretching band intensity of the (010), (100), and (001) plane of forsterite. The labeled number 0° indicates the angle rotated of the sample from the original direction of [001], [001], and [100], respectively.
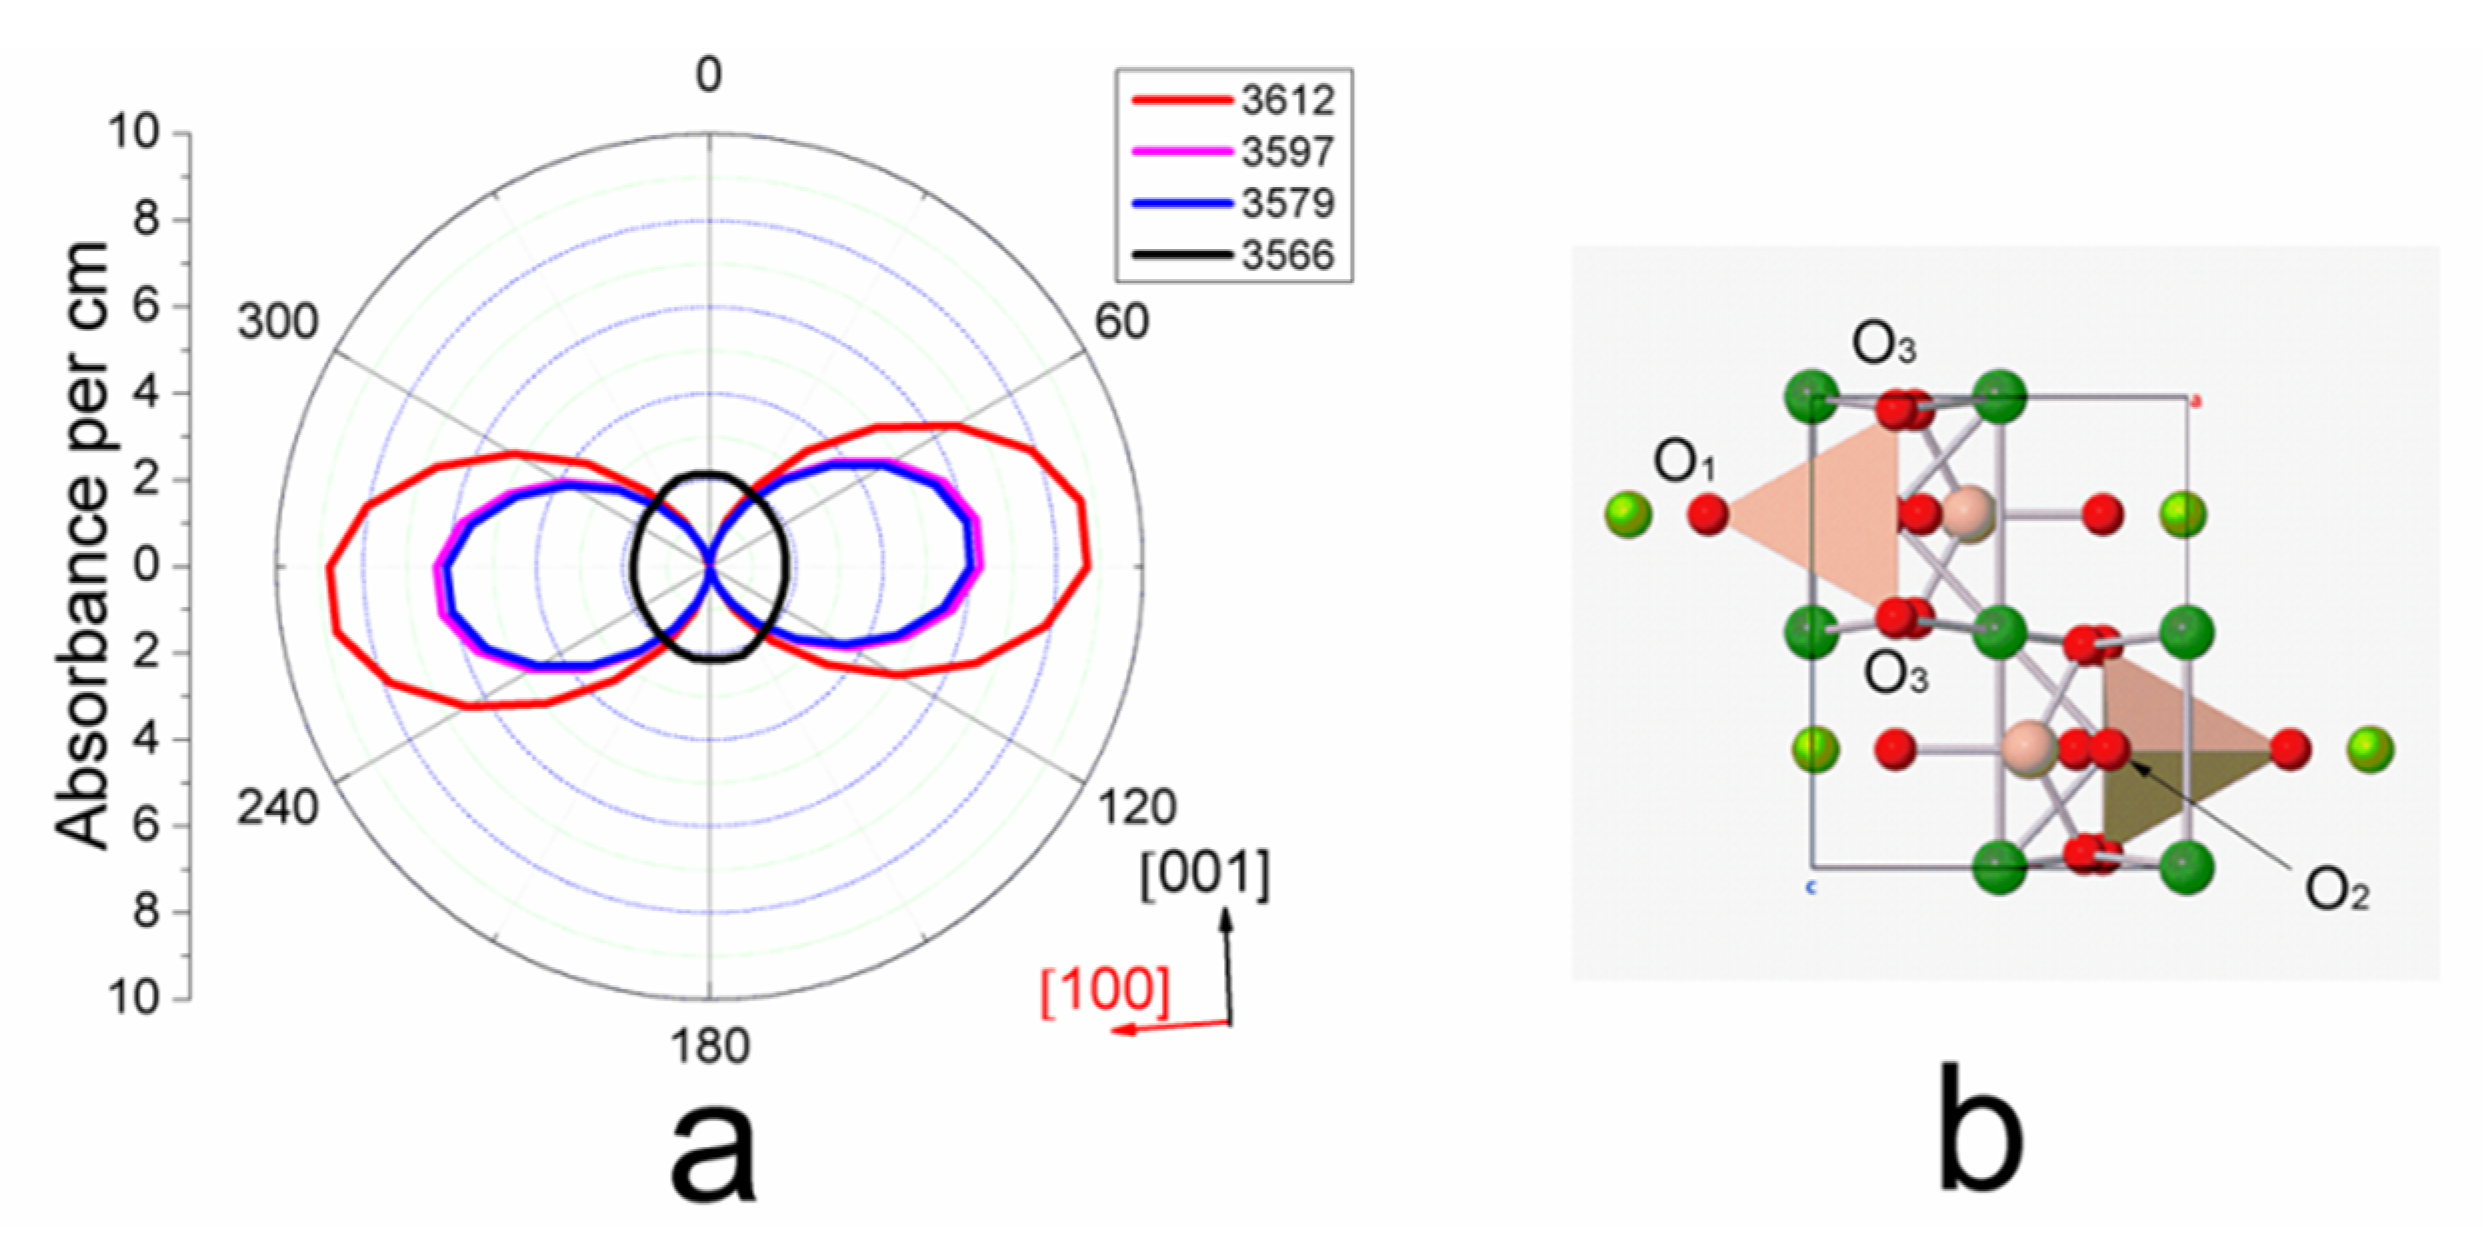
For an ideal polarizer, the theoretical absorbance is zero if the absorber dipole direction is perpendicular to the polarization vector. The IR band intensity is higher when the polarization direction of the incident laser is parallel to the stretching directions of the hydroxyls. Based on Malus‘s Law [35], the dipole orientation of the hydroxyl dipole direction can be identified from the top view of the atomic structure in Figure 6, Figure 7 and Figure 8. The intensity of 3612 cm−1 parallel to [100] is zero and thus indicates an OH dipole orientation parallel to the a axis. The extremely strong pleochroism of the band at 3597 cm−1 and 3579 cm−1 in (100) and (010) plane (Figure 3 and Figure 4) indicates that a strong orientation of the OH dipole is perpendicular to the c crystal axis.
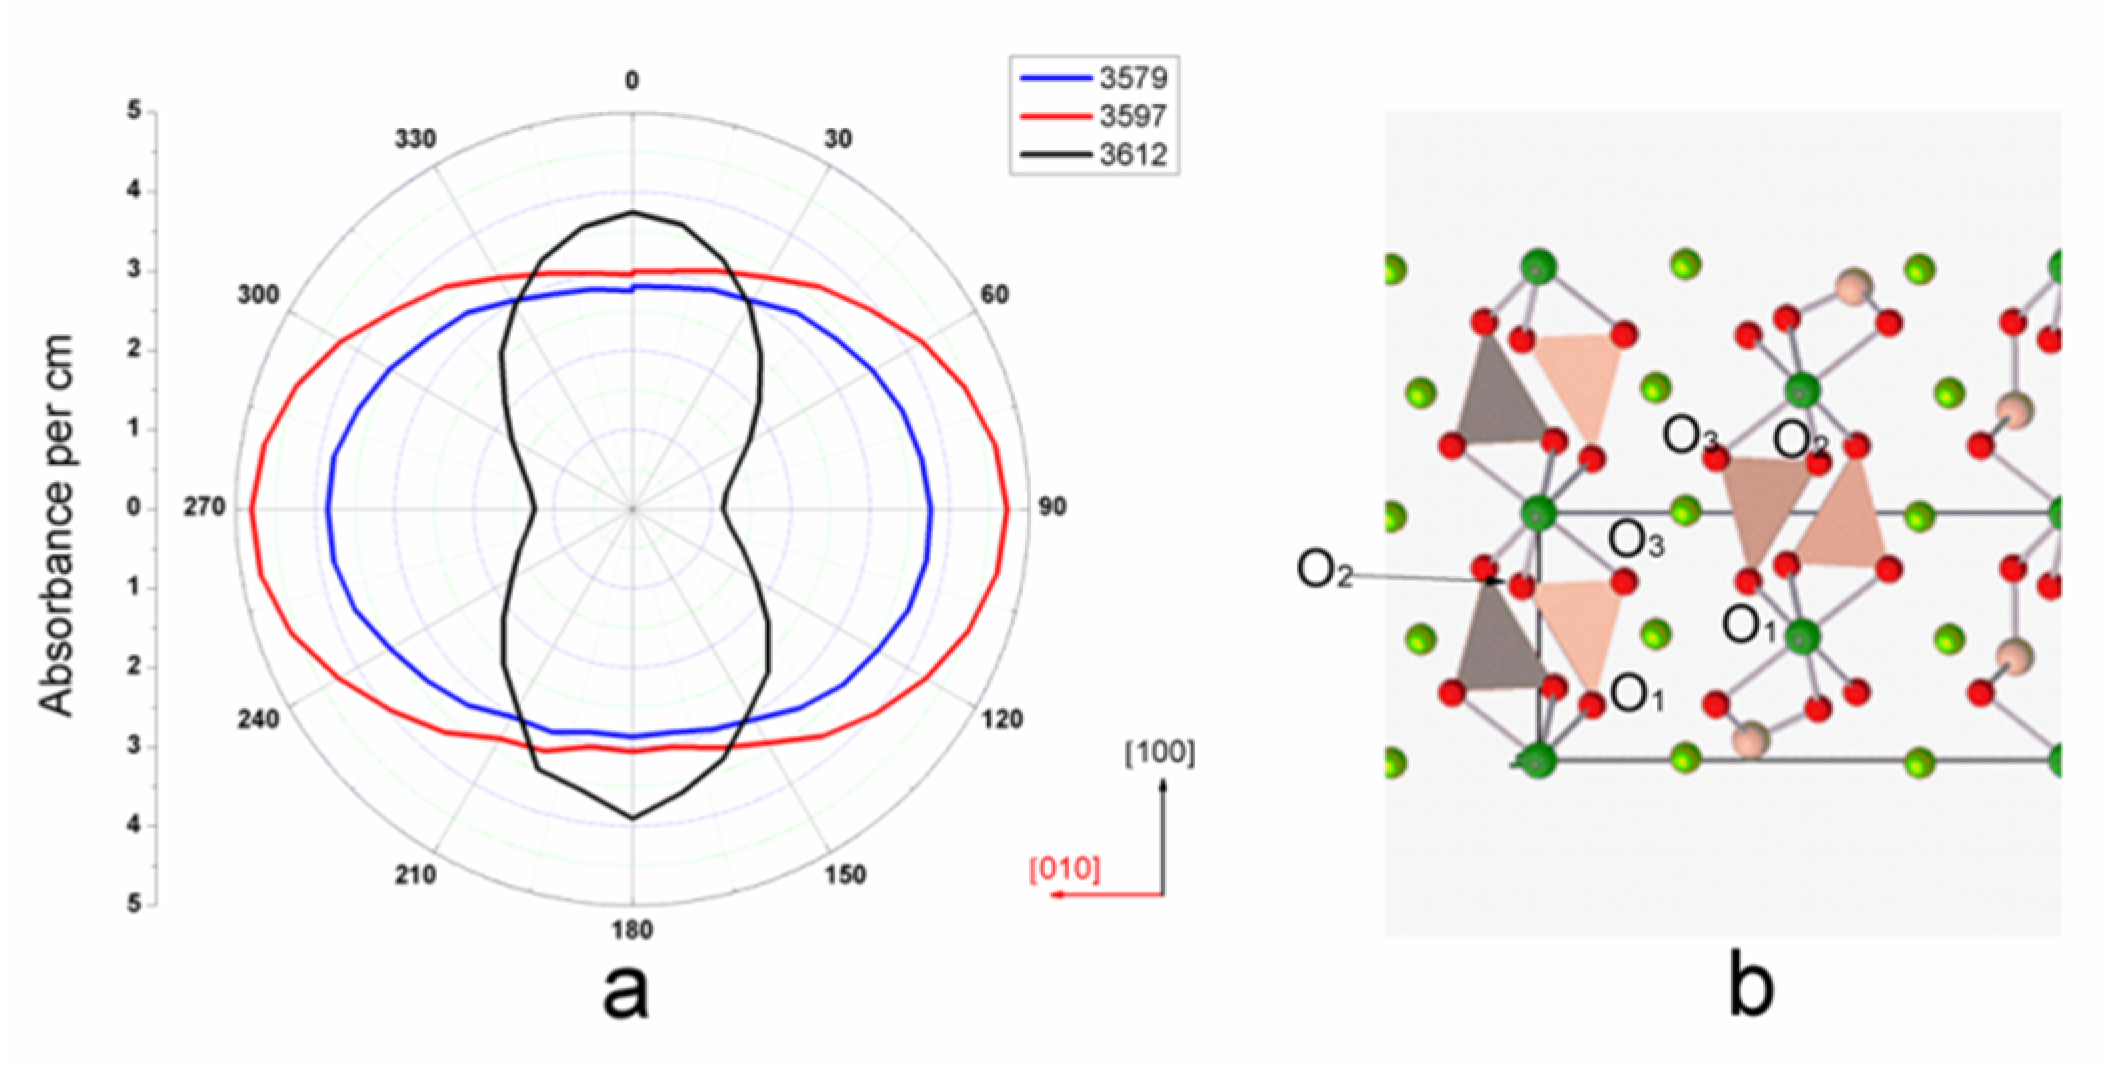
The dipole direction of the 3612 cm−1 band is perpendicular to the (010) plane, while the 3566 cm−1 band is located at a direction along [001]. However, the 3597 cm−1 and 3579 cm−1 bands exhibit similar pleochroic cycles, which indicate a perpendicular vector to the [001] direction. The absorption band at 3566 cm−1 shows slight pleochroism in (010) and (100), indicating that the absorbance intensity may be affected by the shoulder bands of 3579 cm−1. These are in good agreement with the previous studies [25]. For the (001) plane, the maxima of 3597 cm−1 and 3579 cm−1 are in the directions parallel to [010], and the minimum is perpendicular to [010] with absorbance intensity values of 3.0 and 2.8, respectively. The minimum of the 3612 cm−1 band occurs at the direction of [010]. Differing from the (010) and (100) planes, the minimum of 3597 cm−1 and 3579cm−1 bands in the (001) plane (Figure 5 and Figure 8) did not reach a zero value, however, it allowed us to narrow down the direction of the angled hydroxyl dipole and crystal orientation to specific directions. By the equation:
where A is the integration area or intensity of the band, θ is the angle between the hydroxyl dipole and crystal orientation.
The calculated angle is 11° between the 3597 cm−1 and 3579 cm−1 hydroxyl dipole and the [100] direction. A 9° angle is obtained for the 3612 cm−1 hydroxyl dipole tilted from the [010]. The lack of the 3612 cm−1 absorbance band parallel to the [001] and [010] indicates an OH vector orientation in the (010) plane.
The maximum of the band at 3612 cm−1 occurs in the [100] spectrum. A 9° angle was obtained from the polychroism polarization results of ⊥(001), indicating that the band is assigned to the direction from O1 to the center of the Si polyhedra in the structure of forsterite. The 3597 cm−1 and 3579 cm−1 bands of the E//[010] spectrum are obviously more intense than those of the E//[100] direction (Figure 5). Similarly, the 3597 cm−1 and 3579 cm−1 bands can be assigned as O1-O2 directions based on the crystal structure (Figure 6).
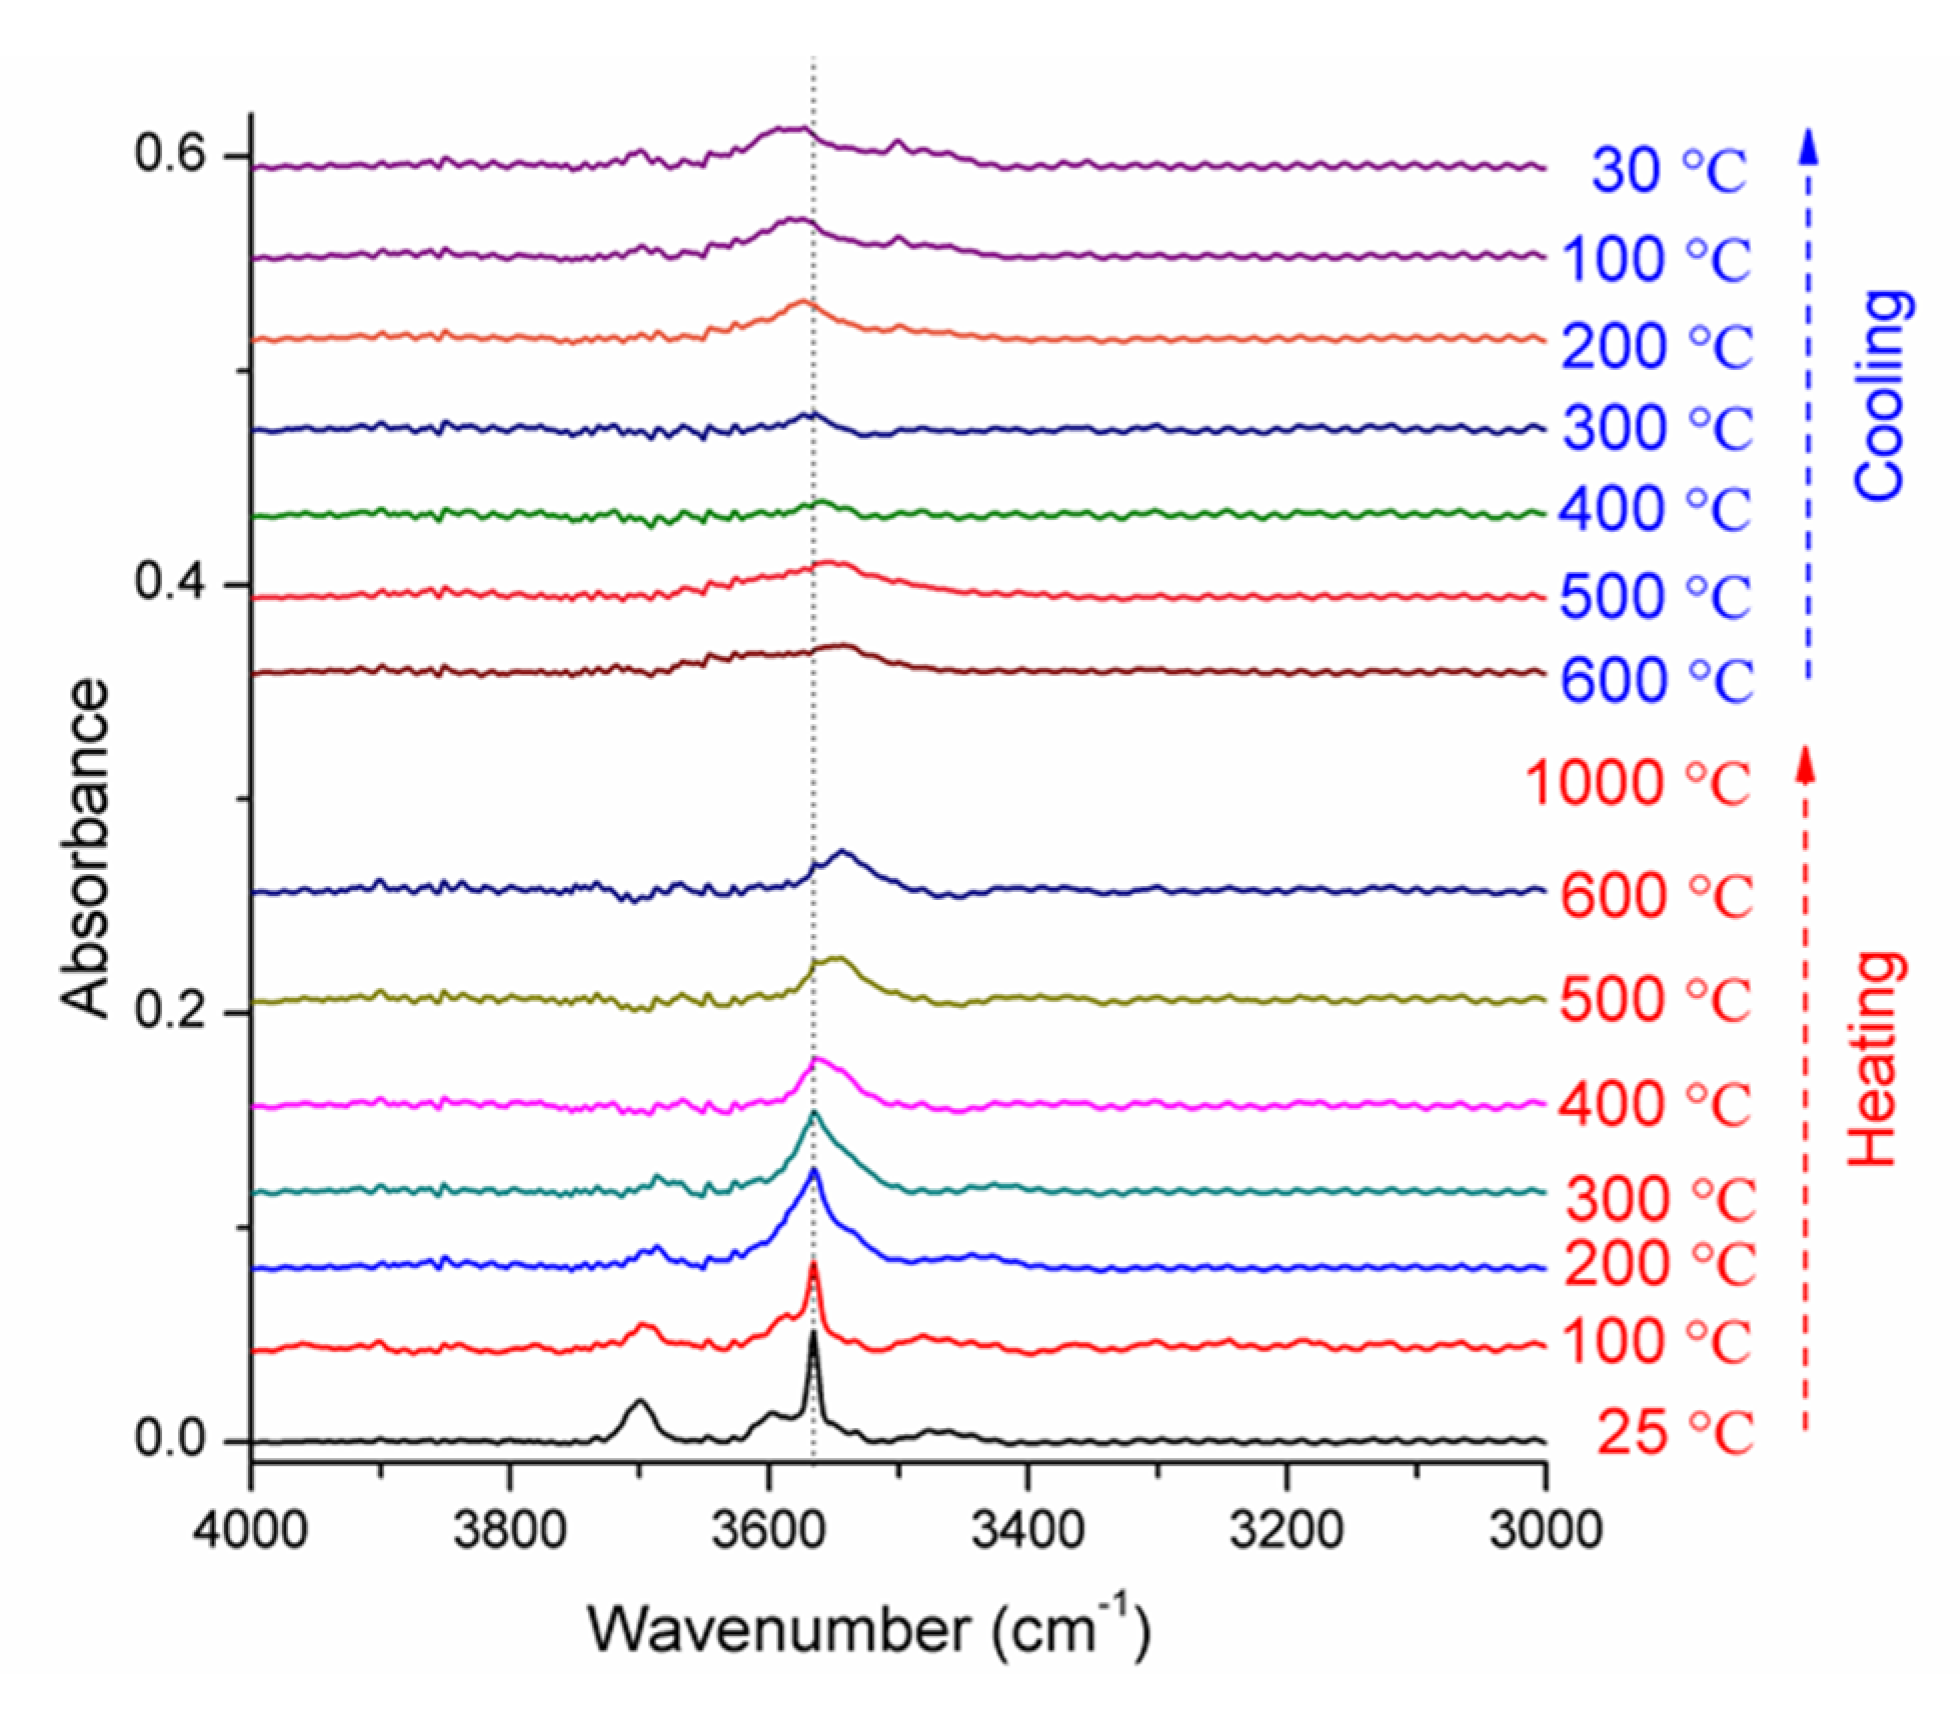
Figure 9, Figure 10 and Figure 11 show the typical temperature evolution of the IR bands of the hydroxyl under specific polarization configurations. The spectra upon 600 °C were not shown because of their relatively noisy background. After cooling down to 30 °C, the OH absorbance bands showed lower intensity compared with the spectra of the unheated samples. These phenomena indicate that part dehydrogenation was implemented in all the three experiments (Figure 9, Figure 10 and Figure 11). The peak positions of the 3597 and 3579 cm−1 bands and the affiliated peaks at 3500–3570 cm−1 redshift at the same rate with the exception of the peak positions at 3612 cm−1, which keep constant (Figure 12). With increasing temperature, the OH band located at 3612 cm−1 weakened as a result of dehydrogenation without the change of the peak position. The temperature-dependent trend of the wavenumber of the 3597 and 3579 cm−1 bands can be described as the following equations:
where υ is the wavenumber, t is the temperature in °C.
υ(3597) = 3597.2 − 0.0943t
υ(3579) = 3587.5 − 0.0782t
The OH bands 3597, 3579, and 3566 cm−1 in forsterite at room temperature shifted to 3541, 3539, and 3545 cm−1 at 600 °C, respectively. It is worth noting that the 3566 cm−1, keeps steady at temperatures below 300 °C, with the same decrease rate when the temperature is above 300 °C. Three different types of hydroxyl groups, the 3612 cm−1 band, 3597 and 3579 cm−1 band and 3566 cm−1 band can be clearly distinguished by in situ heating experiments. The dehydrogenation mechanism of the 3612 cm−1 and 3566 cm−1 is different from the 3597 and 3579 cm−1 groups.
The relatively minor OH absorbance integration detected at high temperatures should be interpreted as an occurrence of a dehydrogenation and temperature effect [36,37]. The 3612 cm−1 band of a hydrous San Carlos olivine crystal weakened at 100 °C and nearly disappears at 300 °C, suggesting the absorbance peak comes from an unstable structural OH [21]. However, in our experiments, the 3612 cm−1 band remains by heating at 1000 °C for 5 min.
Moreover, several weak but new bands appear between 3450 cm−1 and 3580 cm−1 after a 1000 °C heating process, which was assigned to the vibrations of the Si4+ vacancy related OH, indicating a multistep dehydrogenation. In general, the OH stretching frequencies move towards lower frequencies with a decrease of the bond lengths [38]. Therefore, a relatively lower absorbance frequency is related to the temperature-induced distortion of the vacancy structure, indicating a high temperature modification of the forsterite. Therefore, when analyzing the OH of the olivine, we should pay attention to whether there are IR bands around the range of 3450 cm−1 and 3580 cm−1, which may indicate a possible temperature modification process.
4. Conclusions
Angle-resolved polarized IR spectroscopy is potentially helpful for the OH dipole orientation in NAMs. Polarized IR spectra of (001), (010), and (100) planes of the forsterite show the same pleochroism but a different distribution of their intensities, which leads us to a possible way to identify the orientation of the OH dipoles. The bands at 3612, 3597, 3579, and 3566 cm−1 are associated with Si4+-vacancies. The 3612 cm−1 band is attributed to OH dipoles oriented parallel to O1 to the center of the Si polyhedra, which is close to [100] with an angle of 9°. The results of the orientation-dependent absorption of the doublet bands centered at 3597 cm−1, 3579 cm−1, and its shoulder bands show the dipole direction parallel with the vector of O1 to O2. The pleochroism of the 3566 cm−1 band, although overlapped by the shoulder bands of 3579 cm−1, exhibits an O3 to O3 orientation in the same Si polyhedra.
The OH peak positions of 3597, 3579, and 3566 cm−1 decrease linearly with the temperature at a similar rate. The 3597 cm−1 and 3579 cm−1 bands shift 44 cm−1 linearly towards lower wavenumbers, while the 3612 cm−1 exhibits no prominent shift. The 3566 cm−1 band in forsterite exhibits a constant peak position under 25 to 300 °C and decreases linearly above.
Different types of structural hydroxyl may affect their electrical and mechanical properties. The replacement mode occurs in 1000 °C temperature-treated crystal and evidently represents a more stable OH defect position. When conducting related research, we should not only consider the overall water content, but also consider the type of structural hydroxyl groups and their relationship with the crystal orientation.
Author Contributions
Formal analysis, Y.-Y.Z. and X.-G.L.; Funding acquisition, X.-G.L.; Investigation, Y.-Y.Z.; Methodology, X.-G.L.; Supervision, W.S.; Writing—original draft, X.-G.L.; Writing—review & editing, X.-Y.Y. All authors have read and agreed to the published version of the manuscript.
Funding
Experimental Technology Innovation Fund of the Institute of Geology and Geophysics, Chinese Academy of Sciences, Grant NO.E0518504.
Data Availability Statement
The data presented in this study are available within the article.
Acknowledgments
The authors would like to thank Xu Tang for EBSD measurement and the data analysis. We thank the reviewers for their fruitful comments.
Conflicts of Interest
The authors declare no conflict of interest.
References
- Bell, D.R.; Rossman, G.R. Water in Earth’s mantle: The role of nominally anhydrous minerals. Science 1992, 255, 1391–1397. [Google Scholar] [CrossRef]
- Bell, D.R.; Ihinger, P.D.; Rossman, G.R. Quantitative analysis of trace OH in garnet and pyroxenes. Am. Mineral. 1995, 80, 465–474. [Google Scholar] [CrossRef]
- Demouchy, S.; Bolfan-Casanova, N. Distribution and transport of hydrogen in the lithospheric mantle: A review. Lithos 2016, 240, 402–425. [Google Scholar] [CrossRef]
- Murakami, M.; Hirose, K.; Yurimoto, H.; Nakashima, S.; Takafuji, N. Water in Earth’s lower mantle. Science 2002, 295, 1885–1887. [Google Scholar] [CrossRef] [PubMed] [Green Version]
- Peslier, A.H.; Luhr, J.F.; Post, J. Low water contents in pyroxenes from spinel-peridotites of the oxidized, sub-arc mantle wedge. Earth Planet. Sci. Lett. 2002, 201, 69–86. [Google Scholar] [CrossRef]
- Beran, A.; Libowitzky, E. Water in natural mantle minerals ii: Olivine, garnet and accessory minerals. Rev. Mineral. Geochem. 2006, 62, 169–191. [Google Scholar] [CrossRef]
- Chen, S.; Guo, X.; Yoshino, T.; Jin, Z.; Li, P. Dehydration of phengite inferred by electrical conductivity measurements: Implication for the high conductivity anomalies relevant to the subduction zones. Geology 2018, 46, 11–14. [Google Scholar] [CrossRef]
- Paterson, M. The determination of hydroxyl by infrared absorption in quartz, silicate glasses and similar materials. Bull. Miner. 1982, 105, 20–29. [Google Scholar] [CrossRef]
- Aines, R.D.; Rossman, G.R. Water in minerals? A peak in the infrared. J. Geophys. Res. Solid Earth 1984, 89, 4059–4071. [Google Scholar] [CrossRef]
- Libowitzky, E.; Rossman, G.R. An IR absorption calibration for water in minerals. Am. Mineral. 1997, 82, 1111–1115. [Google Scholar] [CrossRef]
- Ohlhorst, S.; Behrens, H.; Holtz, F. Compositional dependence of molar absorptivities of near-infrared OH− and H2O bands in rhyolitic to basaltic glasses. Chem. Geol. 2001, 174, 5–20. [Google Scholar] [CrossRef]
- Mandeville, C.W.; Webster, J.D.; Rutherford, M.J.; Taylor, B.E.; Timbal, A.; Faure, K. Determination of molar absorptivities for infrared absorption bands of H2O in andesitic glasses. Am. Mineral. 2002, 87, 813–821. [Google Scholar] [CrossRef]
- Bell, D.R.; Rossman, G.R.; Maldener, J.; Endisch, D.; Rauch, F. Hydroxide in olivine: A quantitative determination of the absolute amount and calibration of the IR spectrum. J. Geophys. Res. Solid Earth 2003, 108, 2105. [Google Scholar] [CrossRef] [Green Version]
- Libowitzky, E.; Rossman, G.R. Principles of quantitative absorbance measurements in anisotropic crystals. Phys. Chem. Miner. 1996, 23, 319–327. [Google Scholar] [CrossRef]
- Asimow, P.D.; Stein, L.C.; Mosenfelder, J.L.; Rossman, G.R. Quantitative polarized infrared analysis of trace OH in populations of randomly oriented mineral grains. Am. Mineral. 2006, 91, 278–284. [Google Scholar] [CrossRef]
- Sambridge, M.; Gerald, J.F.; Kovács, I.; O’Neill, H.S.C.; Hermann, J.R. Quantitative absorbance spectroscopy with unpolarized light: Part I. Physical and mathematical development. Am. Mineral. 2008, 93, 751–764. [Google Scholar] [CrossRef]
- Balan, E.; Refson, K.; Blanchard, M.; Delattre, S.; Lazzeri, M.; Ingrin, J.; Mauri, F.; Wright, K.; Winkler, B. Theoretical infrared absorption coefficient of OH groups in minerals. Am. Mineral. 2008, 93, 950–953. [Google Scholar] [CrossRef]
- Costa, F.; Dohmen, R.; Chakraborty, S. Time scales of magmatic processes from modeling the zoning patterns of crystals. Rev. Mineral. Geochem. 2008, 69, 545–594. [Google Scholar] [CrossRef]
- Machida, S.; Guégan, R.; Sugahara, Y. A kaolinite-tetrabutylphosphonium bromide intercalation compound as an effective intermediate for intercalation of bulky organophosphonium salts. Appl. Clay Sci. 2021, 206, 106038. [Google Scholar] [CrossRef]
- Kovács, I.; O’Neill, H.S.C.; Hermann, J.R.; Hauri, E.H. Site-specific infrared OH absorption coefficients for water substitution into olivine. Am. Mineral. 2010, 95, 292–299. [Google Scholar] [CrossRef]
- Yang, X.-z.; Keppler, H. In-situ infrared spectra of OH in olivine to 1100 °C. Am. Mineral. 2011, 96, 451–454. [Google Scholar] [CrossRef]
- Kudoh, Y.; Kuribayashi, T.; Kagi, H.; Inoue, T. Cation vacancy and possible hydrogen positions in hydrous forsterite, Mg(1.985)Si(0.993)H(0.06) O4, synthesized at 13.5 GPa and 1300 °C. J. Mineral. Petrol. Sci. 2006, 101, 265–269. [Google Scholar] [CrossRef]
- Berry, A.J.; O’Neill, H.S.C.; Hermann, J.; Scott, D.R. The infrared signature of water associated with trivalent cations in olivine. Earth Planet. Sci. Lett. 2007, 261, 134–142. [Google Scholar] [CrossRef]
- Demouchy, S.; Mackwell, S. Water diffusion in synthetic iron-free forsterite. Phys. Chem. Miner. 2003, 30, 486–494. [Google Scholar] [CrossRef]
- Lemaire, C.; Kohn, S.; Brooker, R. The effect of silica activity on the incorporation mechanisms of water in synthetic forsterite: A polarised infrared spectroscopic study. Contrib. Mineral. Petrol. 2004, 147, 48–57. [Google Scholar]
- Libowitzky, E.; Beran, A. OH defects in forsterite. Phys. Chem. Miner. 1995, 22, 387–392. [Google Scholar] [CrossRef]
- Crépisson, C.; Blanchard, M.; Bureau, H.; Sanloup, C.; Withers, A.C.; Khodja, H.; Surblé, S.; Raepsaet, C.; Béneut, K.; Leroy, C.; et al. Clumped fluoride-hydroxyl defects in forsterite: Implications for the upper-mantle. Earth Planet. Sci. Lett. 2014, 390, 287–295. [Google Scholar] [CrossRef] [Green Version]
- Padrón-Navarta, J.A.; Hermann, J.; O’Neill, H.S.C. Site-specific hydrogen diffusion rates in forsterite. Earth Planet. Sci. Lett. 2014, 392, 100–112. [Google Scholar] [CrossRef]
- Yang, Y.; Liu, W.; Qi, Z.; Wang, Z.; Smyth, J.R.; Xia, Q. Re-configuration and interaction of hydrogen sites in olivine at high temperature and high pressure. Am. Mineral. 2019, 104, 878–889. [Google Scholar] [CrossRef]
- Liu, D.; Wang, S.; Smyth, J.R.; Zhang, J.; Wang, X.; Zhu, X.; Ye, Y. In situ infrared spectra for hydrous forsterite up to 1243 k: Hydration effect on thermodynamic properties. Minerals 2019, 9, 512. [Google Scholar] [CrossRef] [Green Version]
- Balan, E.; Blanchard, M.; Lazzeri, M.; Ingrin, J. Theoretical Raman spectrum and anharmonicity of tetrahedral OH defects in hydrous forsterite. Eur. J. Mineral. 2017, 29, 201–212. [Google Scholar] [CrossRef] [Green Version]
- Qin, T.; Wentzcovitch, R.M.; Umemoto, K.; Hirschmann, M.M.; Kohlstedt, D.L. Ab initio study of water speciation in forsterite: Importance of the entropic effect. Am. Mineral. 2018, 103, 692–699. [Google Scholar] [CrossRef]
- Joachim, B.; Wohlers, A.; Norberg, N.; Gardés, E.; Petrishcheva, E.; Abart, R. Diffusion and solubility of hydrogen and water in periclase. Phys. Chem. Miner. 2013, 40, 19–27. [Google Scholar] [CrossRef]
- Miller, G.H.; Rossman, G.R.; Harlow, G.E. The natural occurrence of hydroxide in olivine. Phys. Chem. Miner. 1987, 14, 461–472. [Google Scholar] [CrossRef]
- Kahr, B.; Claborn, K. The Lives of Malus and His Bicentennial Law. ChemPhysChem 2008, 9, 43–58. [Google Scholar] [CrossRef] [PubMed]
- Zhang, M.; Salje, E.K.; Carpenter, M.A.; Wang, J.Y.; Groat, L.A.; Lager, G.A.; Wang, L.; Beran, A.; Bismayer, U. Temperature dependence of IR absorption of hydrous/hydroxyl species in minerals and synthetic materials. Am. Mineral. 2007, 92, 1502–1517. [Google Scholar] [CrossRef]
- Geiger, C.A.; Rossman, G.R. Micro- and nano-size hydrogrossular-like clusters in pyrope crystals from ultra-high-pressure rocks of the Dora-Maira Massif, western Alps. Contrib. Mineral. Petrol. 2020, 175, 57. [Google Scholar] [CrossRef]
- Libowitzky, E. Correlation of O–H stretching frequencies and O–H. O hydrogen bond lengths in minerals. Mon. Für Chem./Chem. Mon. 1999, 130, 1047–1059. [Google Scholar] [CrossRef]
Figure 1.
Optical images of (a) the studied forsterite crystals and (b) one example of the axis-oriented section.
Figure 1.
Optical images of (a) the studied forsterite crystals and (b) one example of the axis-oriented section.

Figure 2.
EBSD map of the axis-oriented sections of (010) plane.

Figure 3.
(A) IR absorption spectra of polarized IR propagating vector ⊥ (100) plane of forsterite, (E vector of light vibrating parallel to the c axis was labeled as 0°) show the angle between IR light vibrating vector and the original directions (360° in total with a 10° interval). (B) The IR absorption spectra of the [001] and [010] direction.

Figure 4.
(A) IR absorption spectra of polarized IR propagating vector ⊥ (010) plane of forsterite, (E vector of light vibrating parallel to the c axis was labeled as 0°) show the angle between IR light vibrating vector and the original directions (360° in total with a 10° interval). (B) The IR absorption spectra of the [100] and [001] direction.

Figure 5.
(A) IR absorption spectra of polarized IR propagating vector ⊥ (001) plane of forsterite, (E vector of light vibrating parallel to the a axis was labeled as 0°) show the angle between IR light vibrating vector and the original directions (360° in total with a 10° interval). (B) The IR absorption spectra of the [100] and [010] direction.

Figure 6.
(a) The pleochroic scheme of the OH stretching band of the (100) plane of the studied forsterite (absorbance intensity vs. sample to polarizer angle) (b) Top view of the atomic structure of the (010) plane of forsterite crystals.
Figure 6.
(a) The pleochroic scheme of the OH stretching band of the (100) plane of the studied forsterite (absorbance intensity vs. sample to polarizer angle) (b) Top view of the atomic structure of the (010) plane of forsterite crystals.

Figure 7.
(a) The pleochroic scheme of the OH stretching band of the (010) plane of forsterite (absorbance intensity vs. sample to polarizer angle) (b) Top view of the atomic structure of the (100) plane of forsterite crystals.
Figure 7.
(a) The pleochroic scheme of the OH stretching band of the (010) plane of forsterite (absorbance intensity vs. sample to polarizer angle) (b) Top view of the atomic structure of the (100) plane of forsterite crystals.

Figure 8.
(a) The pleochroic scheme of the OH stretching band of the (001) plane of forsterite (absorbance intensity vs. sample to polarizer angle) (b) Top view of the atomic structure of the (001) plane of forsterite crystals.
Figure 8.
(a) The pleochroic scheme of the OH stretching band of the (001) plane of forsterite (absorbance intensity vs. sample to polarizer angle) (b) Top view of the atomic structure of the (001) plane of forsterite crystals.

Figure 9.
IR spectra change in shape and position of the OH absorptions with temperature (infrared light perpendicular to (100), electric vector E of the light wave is parallel to [001]).
Figure 9.
IR spectra change in shape and position of the OH absorptions with temperature (infrared light perpendicular to (100), electric vector E of the light wave is parallel to [001]).

Figure 10.
IR spectra change in shape and position of the OH absorptions with temperature (infrared light perpendicular to (100), electric vector E of the light wave is parallel to [010]).
Figure 10.
IR spectra change in shape and position of the OH absorptions with temperature (infrared light perpendicular to (100), electric vector E of the light wave is parallel to [010]).

Figure 11.
IR spectra change in shape and position of the OH absorptions with temperature (infrared light perpendicular to (010), electric vector E of the light wave is parallel to [100]).
Figure 11.
IR spectra change in shape and position of the OH absorptions with temperature (infrared light perpendicular to (010), electric vector E of the light wave is parallel to [100]).

Figure 12.
Temperature dependence of peak position of the four types of structural OH of forsterite.
Figure 12.
Temperature dependence of peak position of the four types of structural OH of forsterite.

Publisher’s Note: MDPI stays neutral with regard to jurisdictional claims in published maps and institutional affiliations. |
© 2021 by the authors. Licensee MDPI, Basel, Switzerland. This article is an open access article distributed under the terms and conditions of the Creative Commons Attribution (CC BY) license (https://creativecommons.org/licenses/by/4.0/).
Share and Cite
MDPI and ACS Style
Li, X.-G.; Su, W.; Zheng, Y.-Y.; Yu, X.-Y. In-Situ Infrared Spectra of OH in Pakistan Forsterite at High Temperature. Crystals 2021, 11, 1277. https://0-doi-org.brum.beds.ac.uk/10.3390/cryst11111277
AMA Style
Li X-G, Su W, Zheng Y-Y, Yu X-Y. In-Situ Infrared Spectra of OH in Pakistan Forsterite at High Temperature. Crystals. 2021; 11(11):1277. https://0-doi-org.brum.beds.ac.uk/10.3390/cryst11111277
Chicago/Turabian StyleLi, Xiao-Guang, Wen Su, Yu-Yu Zheng, and Xiao-Yan Yu. 2021. "In-Situ Infrared Spectra of OH in Pakistan Forsterite at High Temperature" Crystals 11, no. 11: 1277. https://0-doi-org.brum.beds.ac.uk/10.3390/cryst11111277
Note that from the first issue of 2016, this journal uses article numbers instead of page numbers. See further details here.