Article

One-Step Formation of Reduced Graphene Oxide from Insulating Polymers Induced by Laser Writing Method

1
Department of Materials Science and Engineering, Centennial Campus, North Carolina State University, Raleigh, NC 27695-7907, USA
2
Department of Polymers for Alternative Energy and Environmental Protection, Institute of Polymers, Bulgarian Academy of Sciences, Bulgarian Academy of Sciences, 1113 Sofia, Bulgaria
3
Joint Department of Biomedical Engineering, Centennial Campus, North Carolina State University, Raleigh, NC 27695-7115, USA
*
Author to whom correspondence should be addressed.
Submission received: 5 October 2021 / Revised: 25 October 2021 / Accepted: 25 October 2021 / Published: 27 October 2021
(This article belongs to the Special Issue Confined Crystals, Quantum Dots, and Nano Crystals)

Abstract

:
Finding a low-cost and effective method at low temperatures for producing reduced graphene oxide (rGO) has been the focus of many efforts in the research community for almost two decades. Overall, rGO is a promising candidate for use in supercapacitors, batteries, biosensors, photovoltaic devices, corrosion inhibitors, and optical devices. Herein, we report the formation of rGO from two electrically insulating polymers, polytetrafluoroethylene (PTFE) and meta-polybenzimidazole fiber (m-PBI), using an excimer pulsed laser annealing (PLA) method. The results from X-ray diffraction, scanning electron microscopy, electron backscattered diffraction, Raman spectroscopy, and Fourier-transform infrared spectroscopy confirm the successful generation of rGO with the formation of a multilayered structure. We investigated the mechanisms for the transformation of PTFE and PBI into rGO. The PTFE transition occurs by both a photochemical mechanism and a photothermal mechanism. The transition of PBI is dominated by a photo-oxidation mechanism and stepwise thermal degradation. After degradation and degassing procedures, both the polymers leave behind free molten carbon with some oxygen and hydrogen content. The free molten carbon undergoes an undercooling process with a regrowth velocity (<4 m·s−1) that is necessary for the formation of rGO structures. This approach has the potential for use in creating future selective polymer-written electronics.

Graphical Abstract

1. Introduction

Ever since graphene was discovered in 2004 by using the Scotch-tape method [1], researchers have investigated various methods for the production of bulk defect-free graphene. The well-known method of mechanical exfoliation (Scotch tape) [1] is unsuitable for roll-to-roll graphene production. Alternatively, graphene has been formed by liquid-phase exfoliation [2,3], annealing SiC substrates [4,5], chemical vapor deposition (CVD) [6,7,8], unzipping of carbon nanotubes (CNTs) [9], and bottom-up chemical synthesis [10]. However, these methods suffer from low production rates [11], high thermal budget, and/or contamination [12,13,14,15] (especially oxygen contamination); these issues limit the straightforward large-scale synthesis of pure graphene. Graphene oxide, on the other hand, can be synthesized at a large scale [16], without concern for oxygen contamination. This material was discovered long before graphene [17] and was often preferred for patterning graphene-based electronics [18]. Regardless of these advantages, the oxygen component of the graphene oxide disturbs its conjugated structure and scavenges the π-electrons [19]. The oxygen diminishes the electron mobility, the carrier concentration, and the electrical conductivity of the pristine graphene [19]. Pure graphene, as a single layer of densely packed sp2 carbon atoms, exhibits zero band gap with an excellent carrier mobility of 2.5 × 105 cm2·V−1·s−1 at room temperature [20,21]. The zero band gap implies that the charge current inside graphene can be directed but cannot be switched on and off for applications such as information-storage purposes [18]. In contrast, graphene oxide is electrically insulating; oxygen incorporation can be used to modulate the bandgap of graphene. Thus, reducing graphene oxide plays a leading role in carbon-based electronics, since it overcomes the aforementioned obstacles.
Reduced graphene oxide (rGO) shows a great deal of potential for use in supercapacitors [22], batteries [23], biosensors [24], photovoltaics [25], corrosion inhibitors [26], and optical devices [27]. Moreover, rGO has been prepared by thermal reduction methods (e.g., thermal annealing [28] and microwave irradiation [29]) and by chemical reduction methods, such as chemical reagent reduction [30], photocatalyst reduction [31], electrochemical reduction [32], and solvothermal reduction [33]. However, these methods are not compatible with semiconductor device fabrication [34]; in particular, they cannot directly covert the original materials into rGO and/or affect the whole material (usually under extreme conditions) with no local transformation. Meanwhile, conventional semiconductor technology is struggling with the requirement for numerous processing steps; the challenge is exacerbated by the trend of miniaturization in semiconductor devices. Therefore, it is imperative to utilize a one-step processing method that delivers high spatial resolution and does not require high temperatures or solution contamination. The laser writing approach is appropriate for converting carbon-source materials into rGO directly and in a single step with high spatial resolution and without affecting the properties of the adjacent materials. Moreover, this method is agile, cost-effective, and well-suited for mass production. The laser-annealing approach is a rapid non-equilibrium process that utilizes rapid kinetics to overcome the limitations associated with thermodynamics via equilibrium routes. In the laser-annealing approach, various structures can be generated under near-ambient conditions by controlling the undercooling factor [35]. We have previously produced and comprehensibly investigated various carbon structures, including rGO and quenched-carbon (Q-carbon), from amorphous carbon via laser annealing of carbon [36,37,38].
The laser-annealing method has been shown to transform the following polymers into graphene: polyimide (Kapton®, McMaster-Carr, IL, USA) tape, using a CO2 infrared laser [39]; polytetrafluoroethylene (PTFE), using a CO2 infrared laser [40]; phenolic resin, using a visible light laser [41]; and sulfonated poly(ether ether ketone) (SPEEK), using a CO2 infrared laser [42]. The CO2 infrared laser was the main laser-annealing tool used in the previous investigations; however, the infrared laser is not a practical tool for some polymer materials. PTFE suffers from a low absorption coefficient in the infrared region; hence, a CO2 laser is not efficient for PTFE conversion into graphene [43]. In addition, a large number of shots (~ 500) is necessary for the CO2 laser to perform PTFE conversion into rGO [40]. There are no currently available polymers capable of rGO production (with flexibility in solubility, functionalization, and doping) to expand the laser-induced graphene method to the semiconductor device industry.
Here, we show the direct conversion of polytetrafluoroethylene (PTFE, (C2F4)n) into rGO, using the laser-annealing method (ArF excimer laser, λ = 193 nm), in which laser-solid interaction coupling is strong. We also provide a new polymer source, meta-polybenzimidazole electrospun fibers (PBI, poly[2,2′-(m-phenylen)-5,5′-bisbenzimidazole]; (C20H12N4)n), for the production of rGO by the ArF excimer laser-writing method. These polymers are promising for rGO production, particularly for direct doping of rGO with various types of functionalization. PBI demonstrates a high ablation threshold under excimer laser irradiation that is appropriate for electronic-device fabrication [44]. PTFE can directly generate fluorinated rGO without the extra step of doping [40]. Both PTFE and PBI are very insulating, with electrical conductivity values of >10−18 Ω −1·cm−1 and 1.5 × 10⁻¹³ Ω −1·cm−1, respectively [44,45]. The excimer pulsed laser annealing (PLA) method allows for direct rGO formation with a high yield and with no need for the extra step of reduction. The structure and bonding characteristics of the rGO structures from both PTFE and PBI were evaluated. Finally, the possible mechanisms for the conversion of the two polymers into rGO are proposed.

2. Materials and Methods

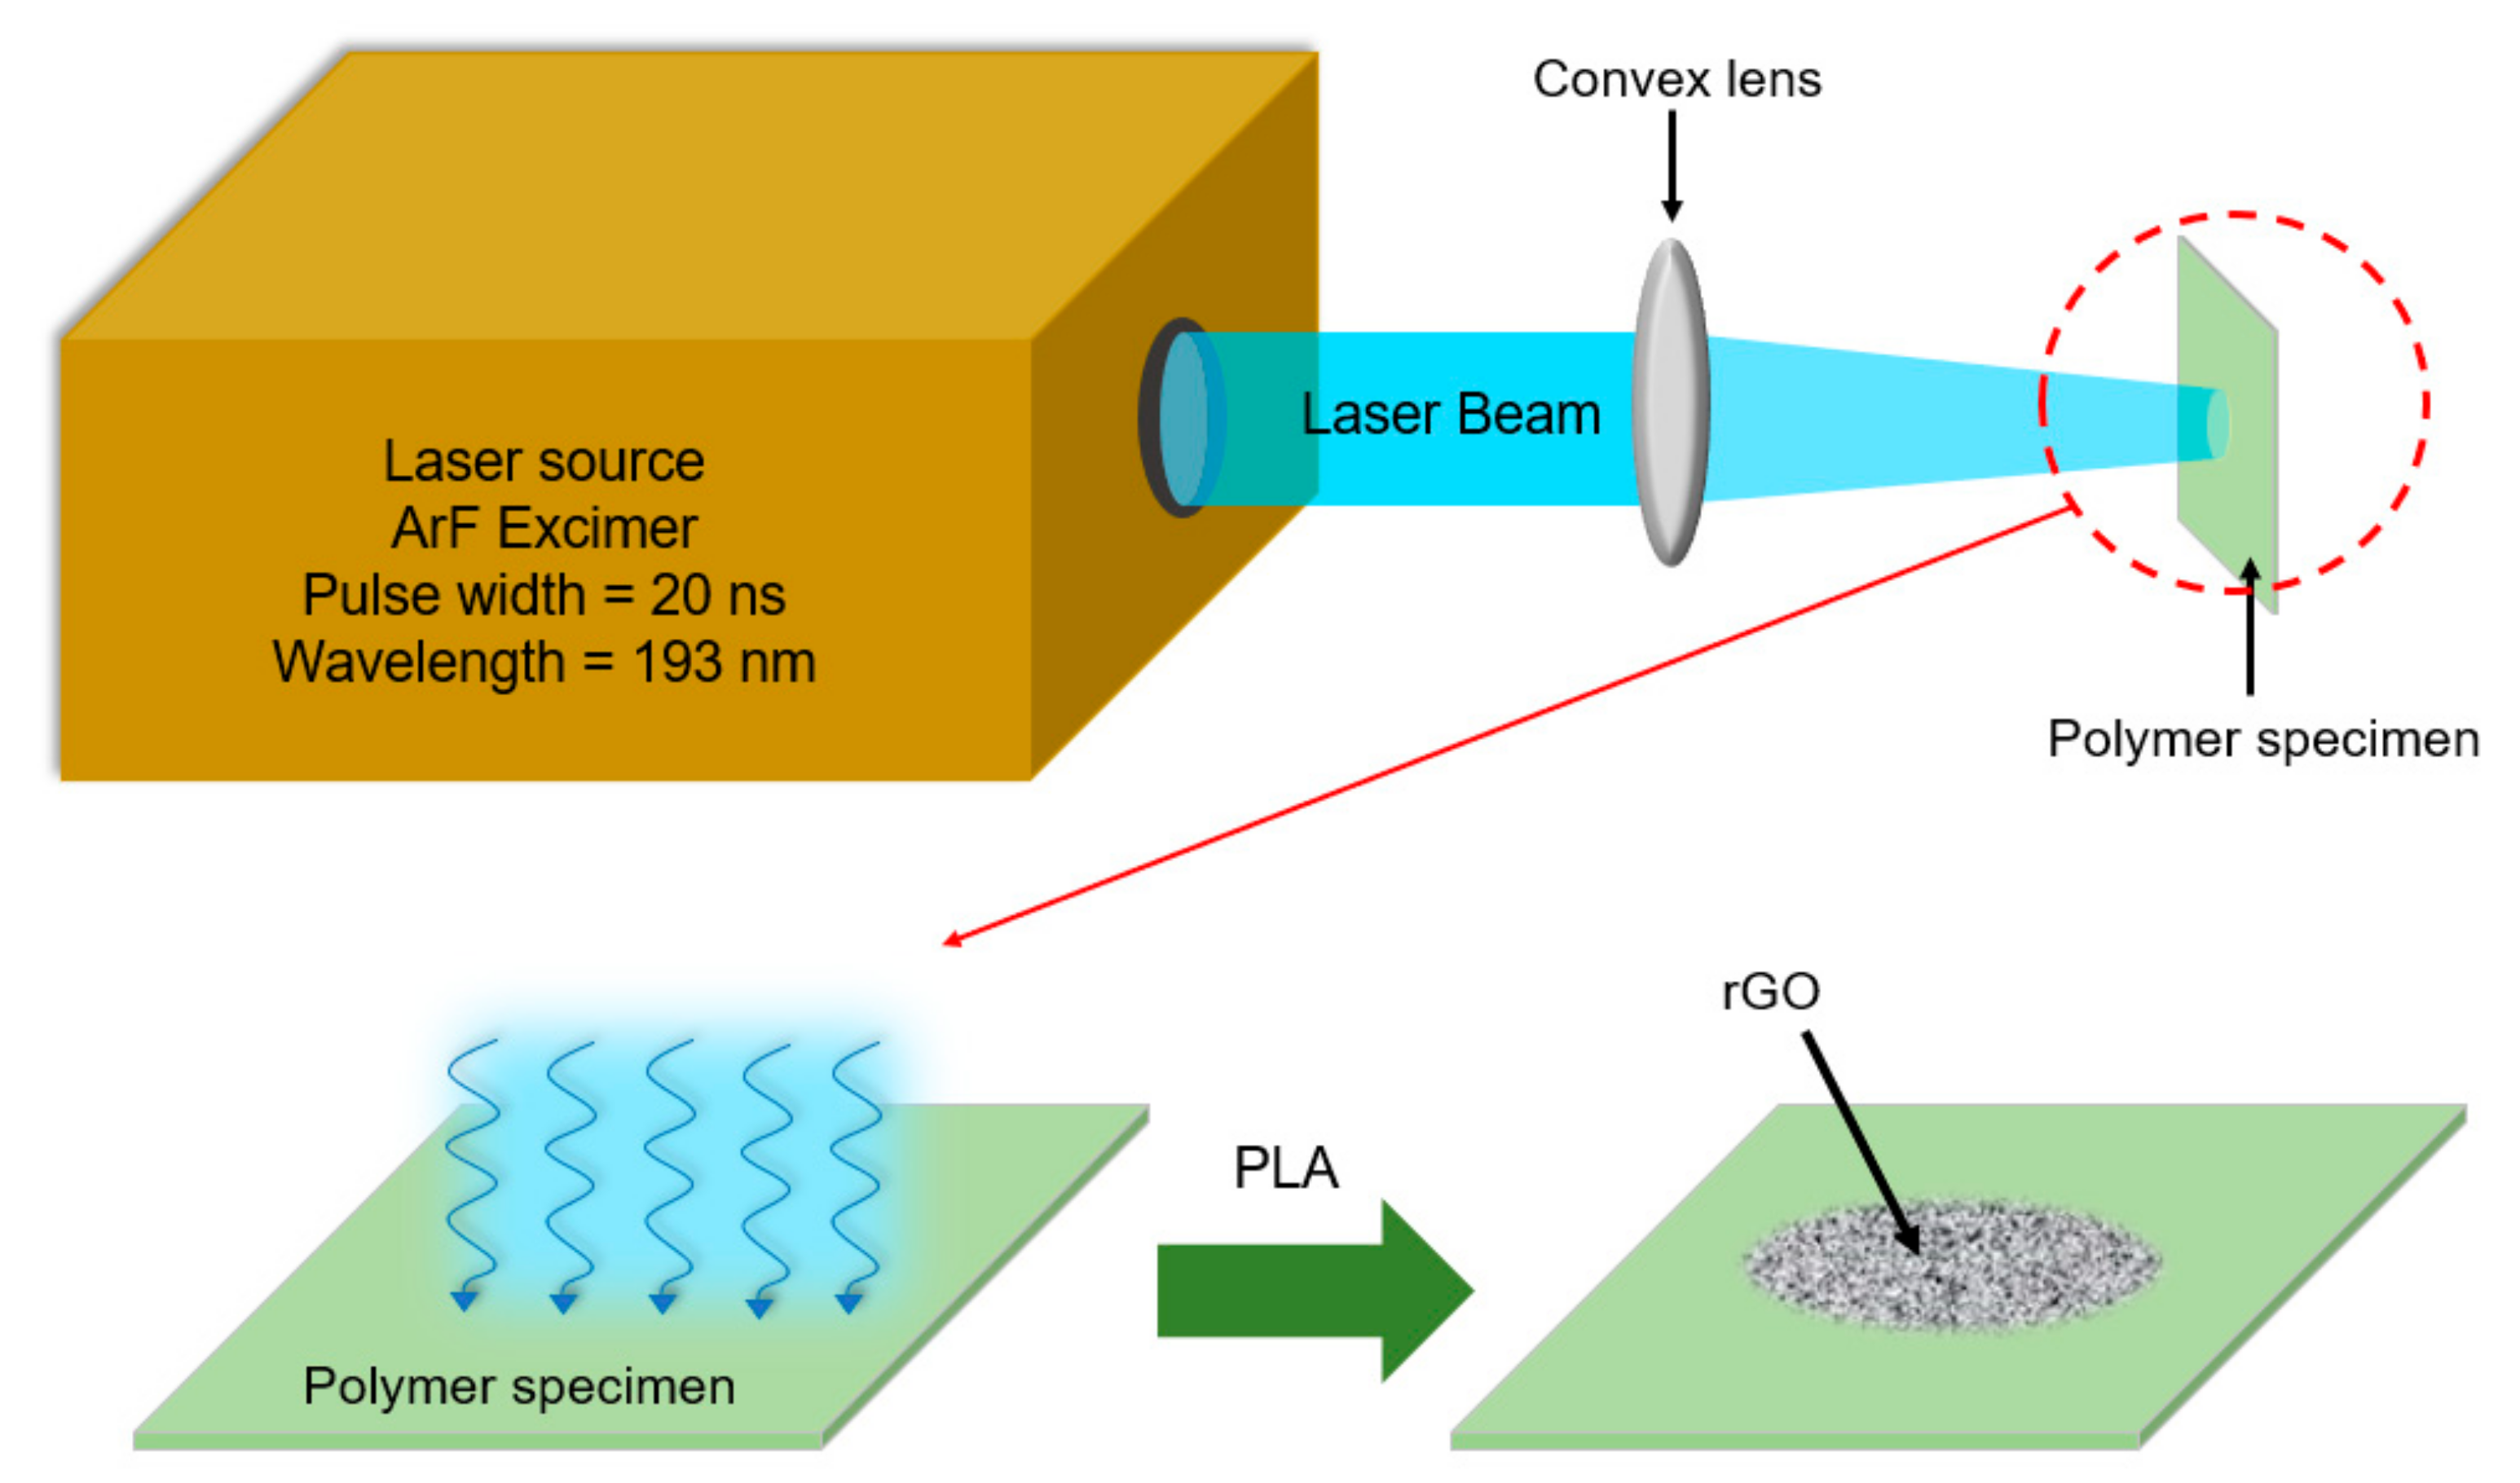
2.1. rGo from PLA Procedure for Conversion of the Polymers into rGO

Two polymer samples were used in this work: (1) white PTFE tape on an <0001> Al2O3 substrate and (2) electrospun PBI fibers deposited on a glass substrate obtained from alkali-ethanol solution as previously described [46]. The laser annealing of the polymer samples was carried out by using an argon fluoride (ArF) excimer laser with a pulse width of 20 ns and a wavelength of 193 nm (Lambda Physik LPX-300, Coherent, Santa Clara, CA, USA). A convex lens was used for focusing the laser beam on the samples; the samples were located in front of the laser beam, as depicted in Figure 1. The laser energy density was measured by using an energy meter (Energy MAX 400, Molectron, San Diego, CA, USA). The convex lens distributes the laser energy with a Gaussian distribution on the sample. Therefore, the energy was measured on different spots over the entire area of the laser-beam interaction with the samples; the average energy was calculated from these data. Subsequently, the laser-energy density in J·cm−2 was calculated by measuring the size of the laser-beam interacting with the samples. The laser annealing of PTFE was conducted under ambient conditions, using 30 shots of the ArF laser with a laser fluence of 0.9 ± 0.1 J·cm−2. In the case of the PBI electrospun fibers, laser annealing was performed by using 15 shots of the ArF laser with a laser fluence of 0.7 ± 0.1 J·cm−2 in air.

2.2. Characterization

The structure of the polymers and the rGO formation after the laser annealing of the polymers were examined via X-Ray Diffraction (XRD, Rigaku SmartLab, The Woodlands, TX, USA) in a Bragg–Brentano θ–2θ geometry, using a Cu Kα radiation source. For investigating the vibrational modes and structure of the polymers before and after laser annealing, Raman spectroscopy (WITec alpha300 M, Ulm, Germany) was performed. The source of WITec laser was a solid-state green light laser (λ = 532 nm) with a spot size of approximately 2 µm diameter. A UHTS 300 spectrometer and a grating size of 600 I/mm were utilized to obtain the Raman spectra. The calibration of the Raman instrument was conducted by using the characteristic peak of the silicon wafer at 520.6 cm−1. For surface characterization and morphology analysis of the polymers before and after PLA, a field-emission scanning electron microscopy instrument (FESEM, Verios 460L, FEI, Waltham, MA, USA) with a resolution of 0.6 nm was utilized. Electron backscattered diffraction (EBSD) patterns tilted at 70° in the backscattering diffraction (BKD) mode were acquired for phase identification. Fourier-transform infrared spectroscopy (FTIR, Bruker ALPHA) was carried out in the absorbance mode, with a resolution of 4 cm−1 and in the range of 500–4000 cm−1; background subtraction was performed.

3. Results and Discussion

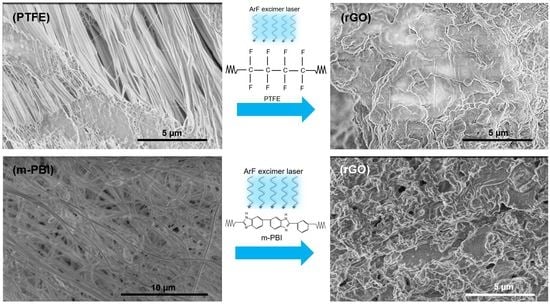
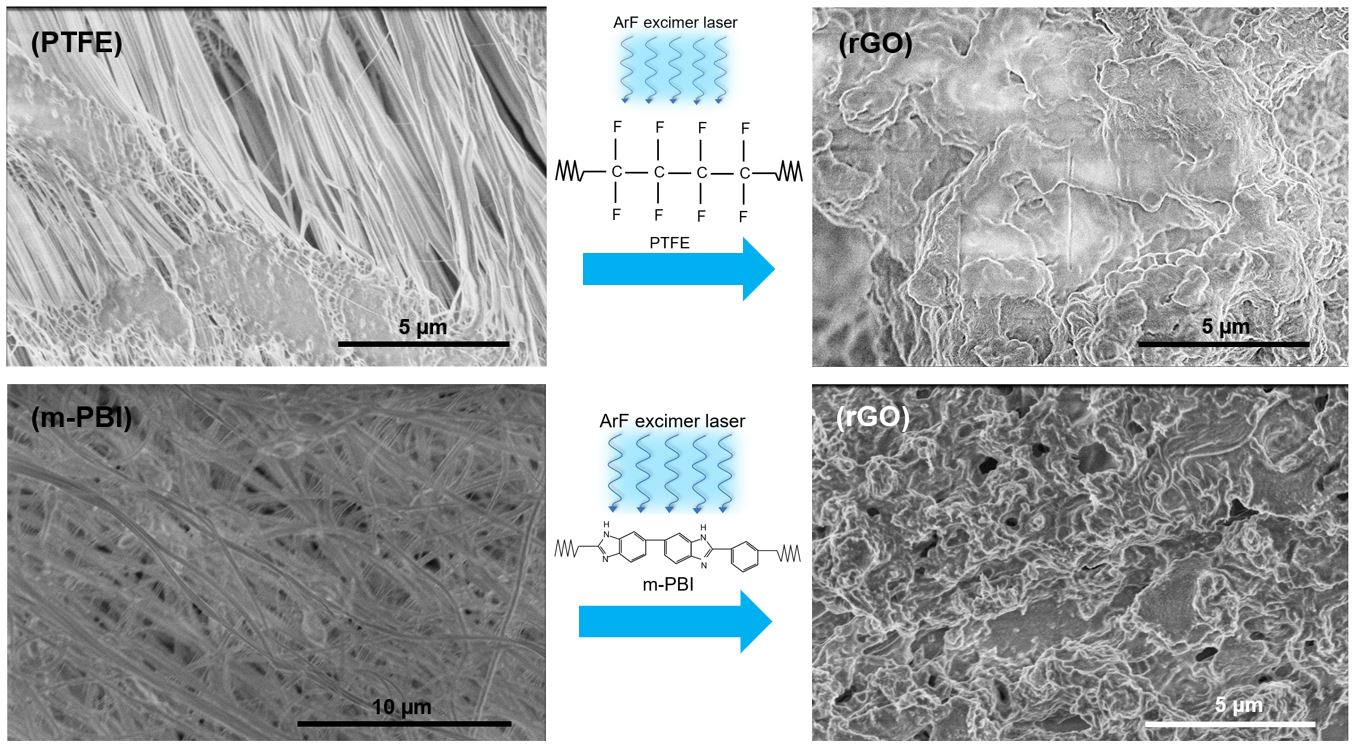
3.1. PTFE Conversion into rGO

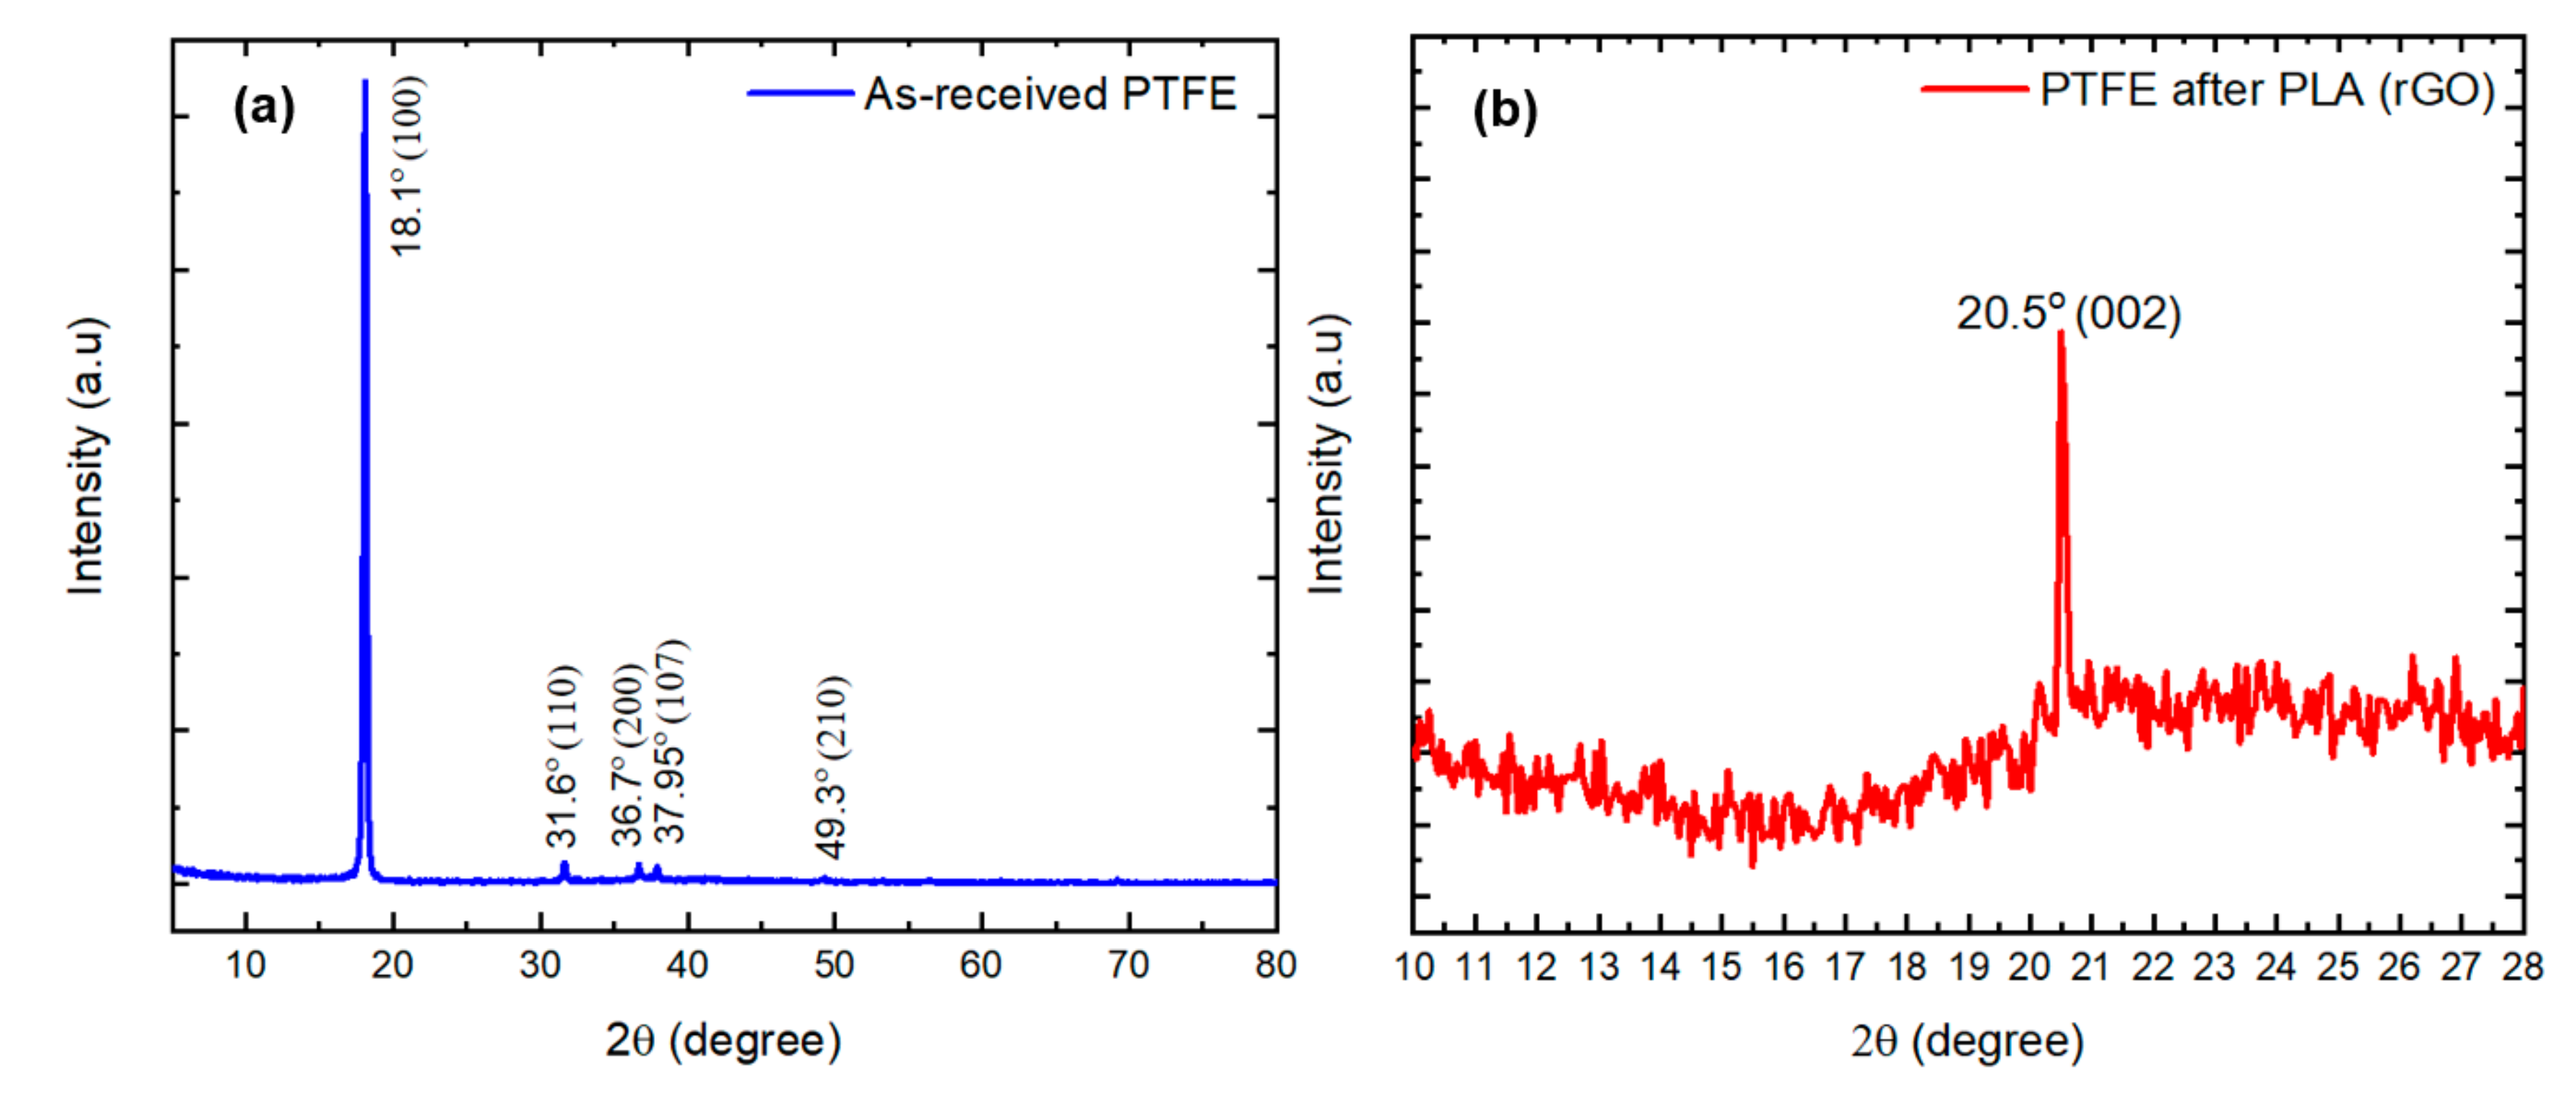
3.1.1. X-Ray Diffraction

The crystalline structure of the PTFE tape was investigated prior to PLA. As shown in Figure 2a, the XRD results are consistent with typical characteristics of PTFE. Based on the XRD database (ICDD PDF-4+ #54-1595), the peaks at 2θ equal to 18.1°, 31.6°, 36.7°, 37.95°, and 49.3° are attributed to the (100), (110), (200), (107), and (210) peaks of PTFE, respectively [47,48,49]. The crystallinity of PTFE can be calculated from its XRD pattern by using the Hermans–Weidinger method [50], using the following equation [51]:
X c = I c I c + 1.8 I a × 100 %
where Xc is the crystallinity of PTFE, Ic is the integral intensity of the crystalline area, and Ia is the integral intensity of the amorphous area. Using the XRD pattern of PTFE shown in Figure 2a, we calculated the crystallinity degree of PTFE to be 64.5 ± 6%.
After the interaction of the laser with PTFE (with a laser energy density of 0.9 ± 0.1 J·cm−2 and 30 laser shots), the XRD pattern of the specimen entirely changed. As evident in Figure 2b, none of the PTFE peaks appeared in the XRD spectrum after laser annealing of the specimen; a new peak at 2θ = 20.5° appeared in the spectrum. These changes in the XRD pattern of PTFE after PLA reveal fundamental changes in the structure of PTFE and the evolution of a new structure. The XRD pattern of graphite exhibits a characteristic peak at 2θ ≈ 26.5° for the (002) plane, with a d(002) ≈ 0.34 nm [52,53,54]. In graphene oxide, owing to oxygen incorporation between the graphene oxide sheets, the planar spacing increases to ~ 0.82 nm (2θ = 10.9°) [52]. However, by reducing the graphene oxide, the (002) planar spacing decreases again close to the d(002) of graphite [55,56]. The XRD pattern (Figure 2b) matches very well with the XRD pattern of rGO. The peak at 2θ = 20.5° corresponds to 0.43 nm for (002) planar spacing in the reduced graphene oxide.

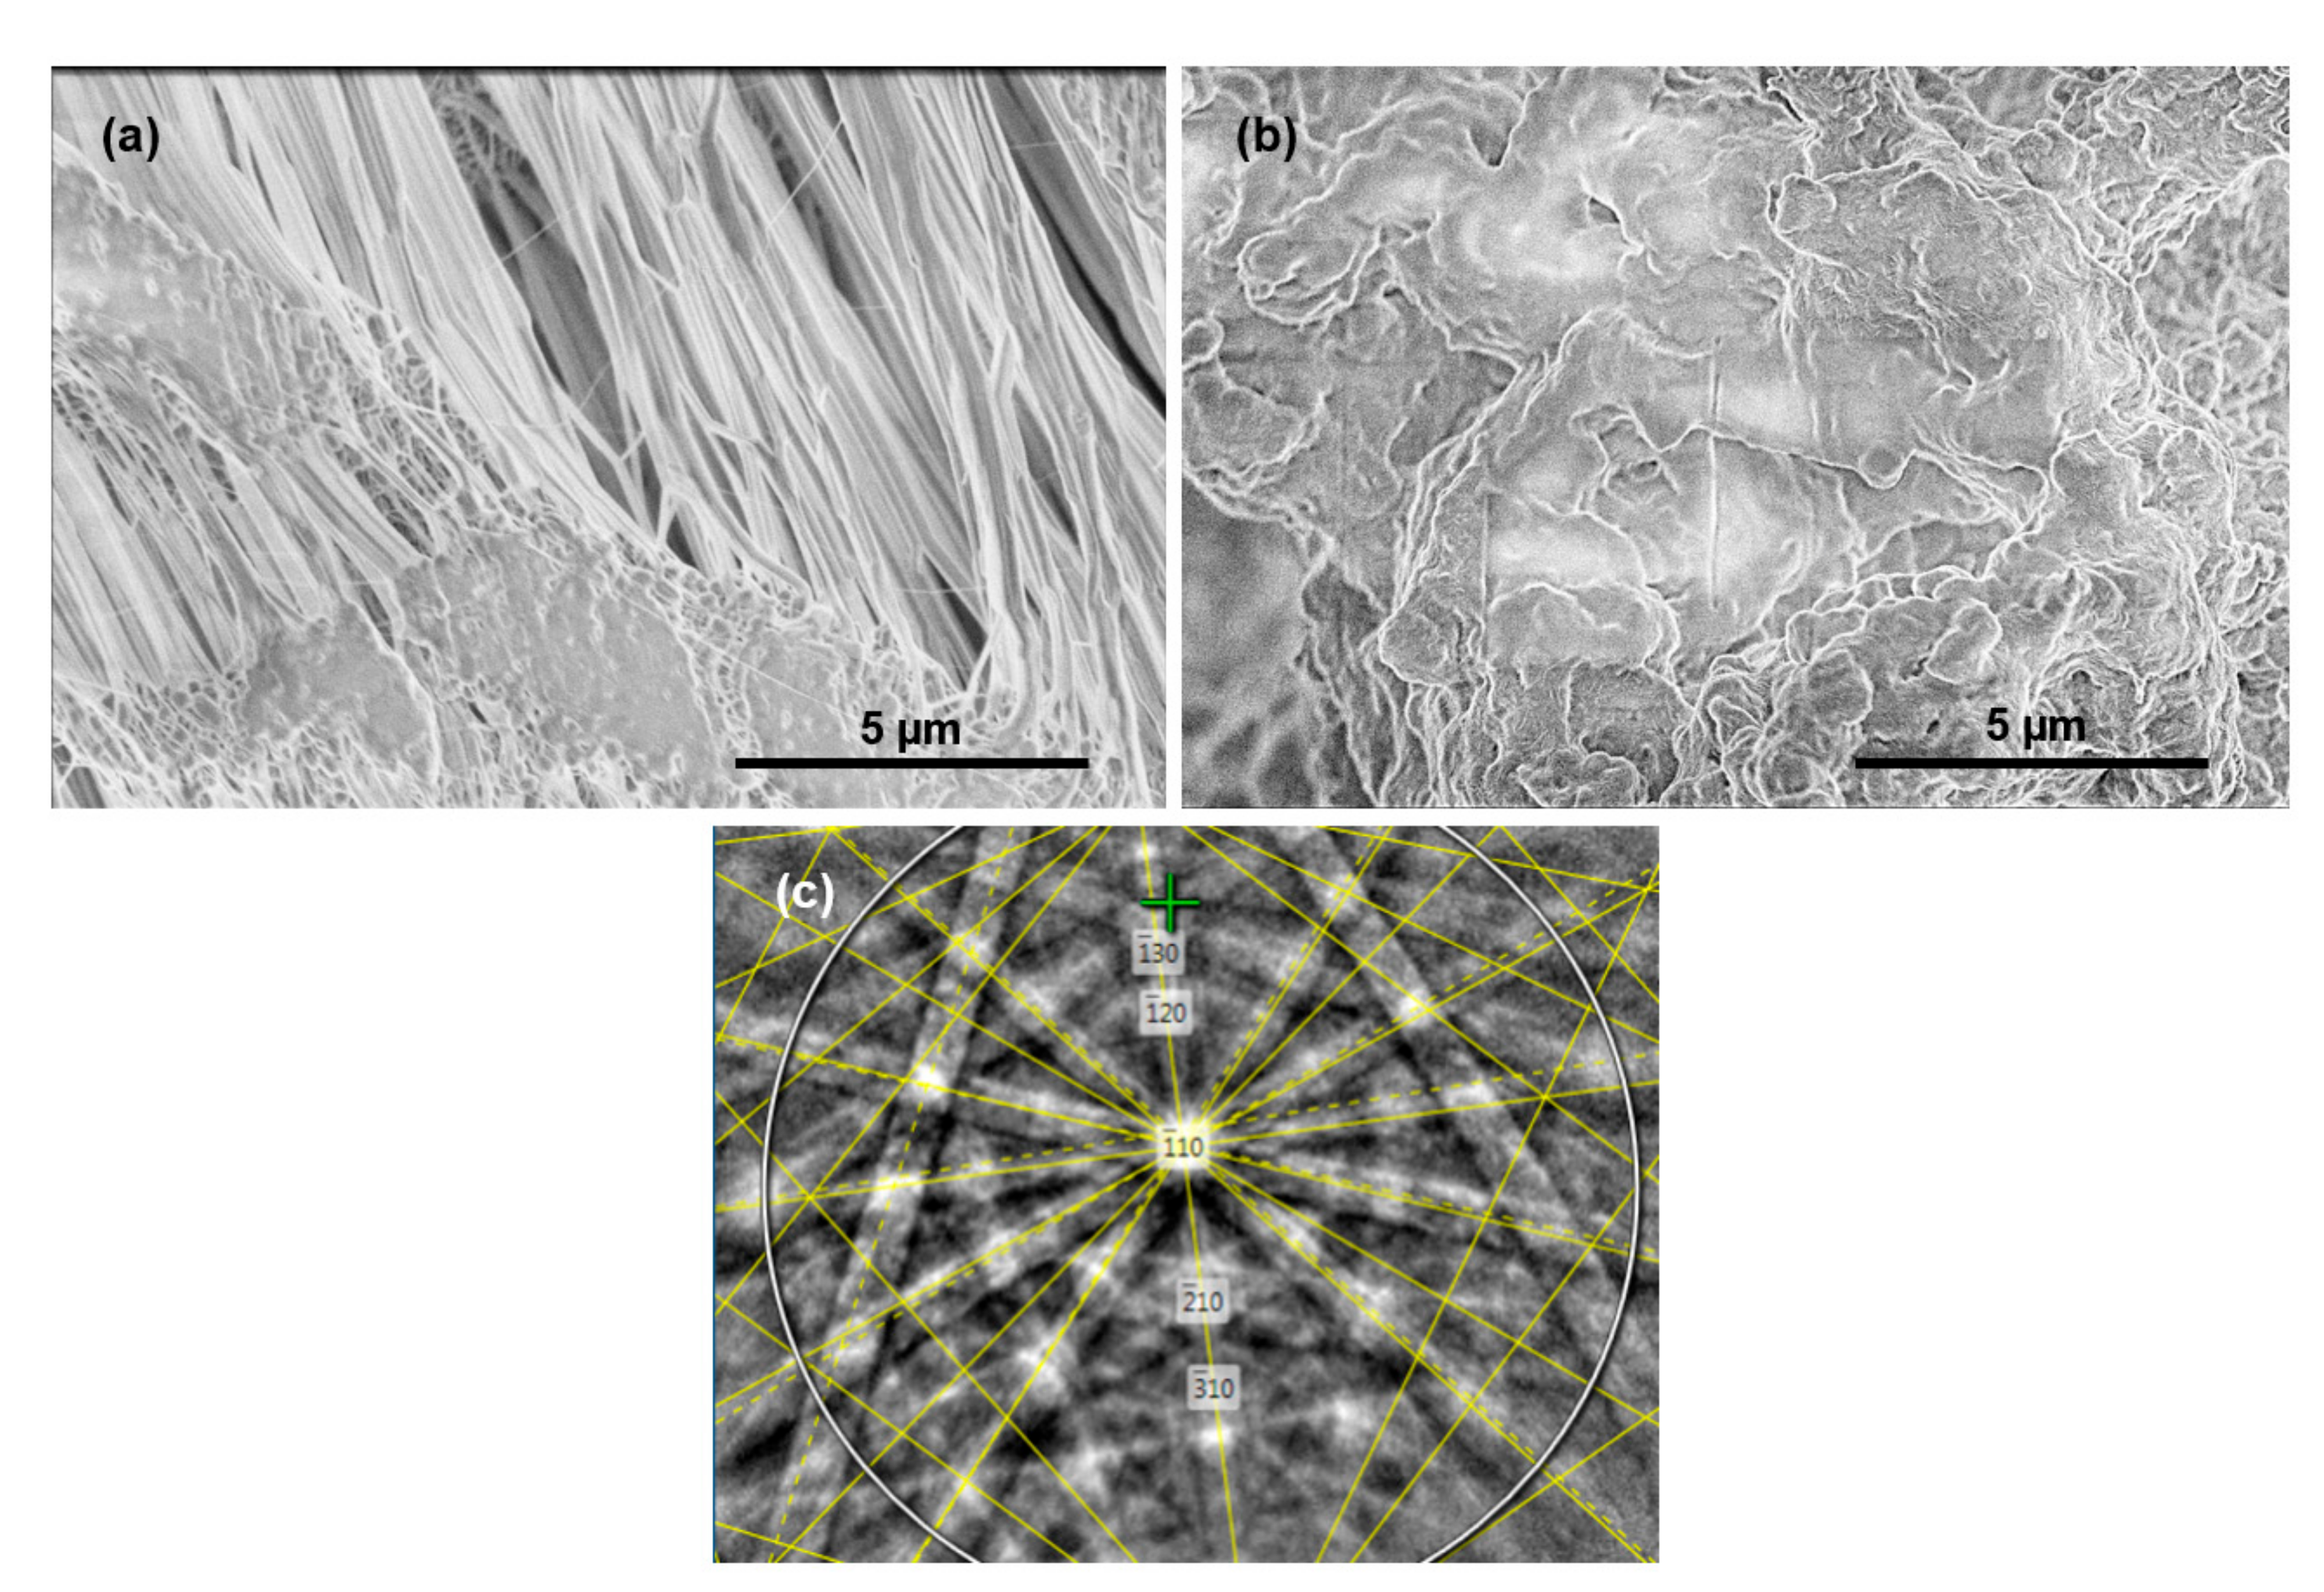
3.1.2. Scanning Electron Microscopy and Electron Backscattered Diffraction

To confirm the results from the XRD experiment, further characterization of the material was performed. Figure 3a,b shows the FESEM micrographs of PTFE before and after laser processing at a laser energy density of 0.9 ± 0.1 J·cm−2. Prior to laser annealing (Figure 3a), the as-received PTFE exhibited a fiber structure, with amorphous and crystalline regions distributed next to each other [57]. After laser annealing at 0.9 ± 0.1 J·cm−2, ultrafast melting and the subsequent ultrafast quenching culminated in profound changes in the structure of PTFE and rearrangement of the carbon atoms in form of a rGO sheet structure (Figure 3b). In Figure 3b, the wrinkled structure of the rGO sheets was observed. The EBSD analysis in Figure 3c from the laser-annealed PTFE confirmed the formation of rGO. Figure 3c revealed the EBSD (Kikuchi pattern) and the rGO orientation obtained from the PLA of PTFE. The EBSD profile showed the (0001) crystalline structure of rGO. The Kikuchi bands of the sample after PLA match those of rGO and do not match those of PTFE.

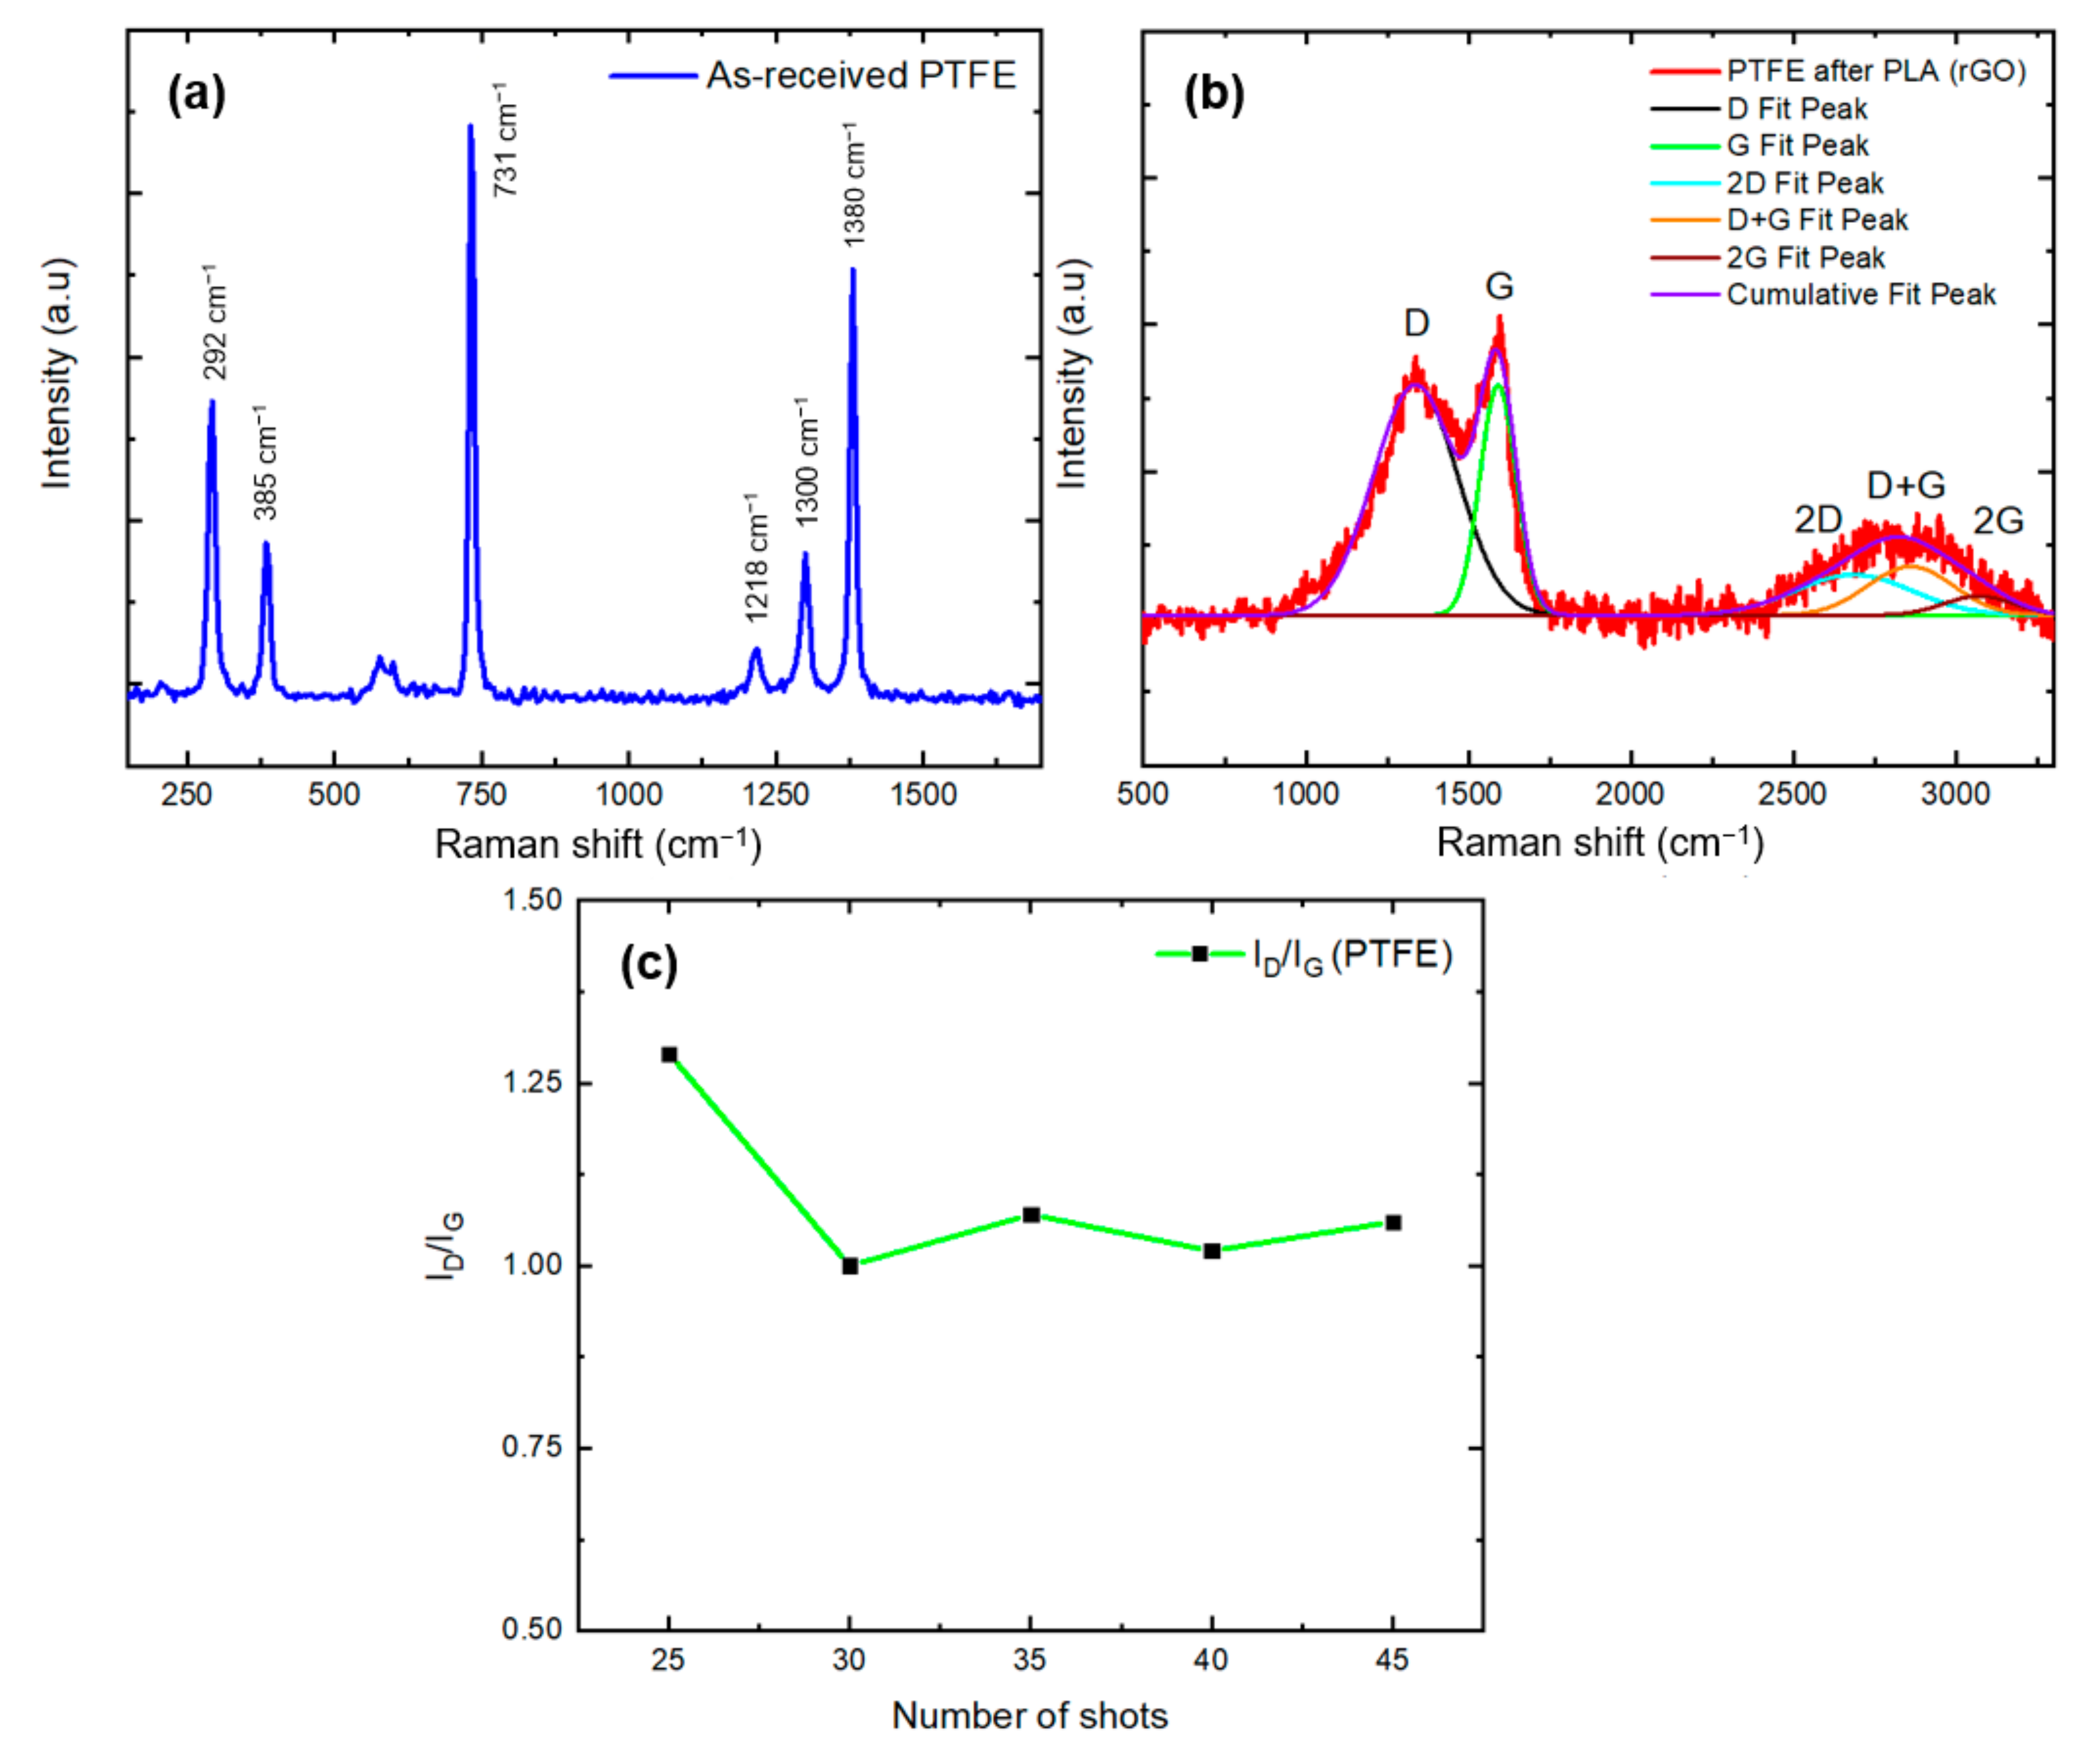
3.1.3. Raman Spectroscopy

Raman spectroscopy is a powerful tool for determining the bonding characteristics of various carbon structures [58]. As shown in Figure 4a, PTFE exhibits vibrational peaks at 292, 385, 731, 1218, 1300, and 1380 cm−1. The peak at 292 cm−1 originates from the superposition of the A1 mode with the E2 mode of the CF2 bond [59]. The torsional activity and deformation in CF2 give rise to the vibrations at 385 cm−1 [60]. The peak at 731 cm−1 is attributed to CF2 bond stretching [61]. The asymmetric stretching of CF2 bonds with the E2 mode is associated with the vibrational peak at 1218 cm−1 [62]. The peaks at 1300 and 1380 cm−1 are assigned to the A1 mode stretching of C–C bonds [59,60].
After the irradiation of PTFE with 30 shots of the ArF laser, the vibrational peaks of PTFE disappeared; new peaks that are characteristic of rGO structures appeared (Figure 4b). The Raman spectrum of rGO comprises three main characteristic peaks of the D band, the G band, and the 2D (or G′) band (as shown in Figure 4b) [63,64]. The D band (usually centered at 1320–1350 cm−1 for the green laser) is assigned to the symmetric out-of-plane breathing mode (A1g) of sp2 atoms; the G peak (usually centered at 1580–1605 cm−1 for the green laser) originates from the center of the Brillion zone with E2g symmetry [65,66,67]. The G band is common for any carbon structure having sp2 carbon–carbon content, and the D band is common to any sp2 carbon–carbon disorders or defects [68]. Therefore, the intensity ratio of the two peaks (ID/IG) is a criterion for the level of defects present in the graphitic structures. The 2D or G′ band (usually centered at 2640–2700 cm−1 for the green laser) is the “second-order overtone” located in the second-order region of the Raman spectrum. The 2D band is produced by the double-resonance phenomenon (with a mechanism similar to D band generation); the difference is that two inelastic scattered phonons are involved [64,67,69]. The shape and peak position of the 2D band can be used to determine the number of layers present in rGO [70]. Usually, the 2D band of single-layer rGO appears at 2679 cm−1 with a Lorentzian distribution; the 2D band of multilayer rGO shifts to a higher wavenumber value and the peak becomes broader [67]. The other second-order bands are D + G and 2G. The D + G band is the combination of the D and G band overtone, and the 2G band is the G band overtone [71]. The fitting results from the rGO spectrum shown in Figure 4b indicate that the peaks positioned at 1337, 1591, 2685, 2860, and 3070 cm−1 can be attributed to the D, G, 2D, D + G, and 2G peaks, respectively. The intensity ratio of the D and G peaks (ID/IG) is 1. Typically, the ID/IG for graphene oxide is above 1 due to the grafting of oxygen functional moieties between the graphitic planes [72]. By reducing graphene oxide, the ID/IG value decreases. The value of ID/IG = 1 from Figure 4b is consistent with that of reduced graphene oxide structures and is in agreement with the XRD results. In addition, the ID/IG value provides the information about the average crystallite size of the sp2 domains (La), using the Tuinstra–Koenig relation [73]:
L a nm = 2.4 × 10 10 λ 4 × I D I G 1
where La is the average crystallite size, and λ is the laser wavelength (532 nm). The average crystallite size of the sp2 domains was calculated to be 19.2 nm. The 2D band at 2685 cm−1 in Figure 4b is very broad with a full width at half maximum (FWHM) of 426 cm−1, confirming the multilayer structure of reduced graphene oxide [74]. The changes in the ID/IG values versus the increase in the number of laser shots are presented in Figure 4c. After the transformation of PTFE into graphitic structures, it is observed that, with 25 shots of the UV laser, the ID/IG value is higher than 1. With an increase in the number of shots, the ID/IG value decreases to 1 and remains at approximately 1 with a further increase in the number of laser shots. The decrease in the ID/IG value after 25 shots can be attributed to the variation of the defects that are present in the structure. After 25 shots, the structure starts to form a reduced graphene structure, with a lower amount of defects in the structure.

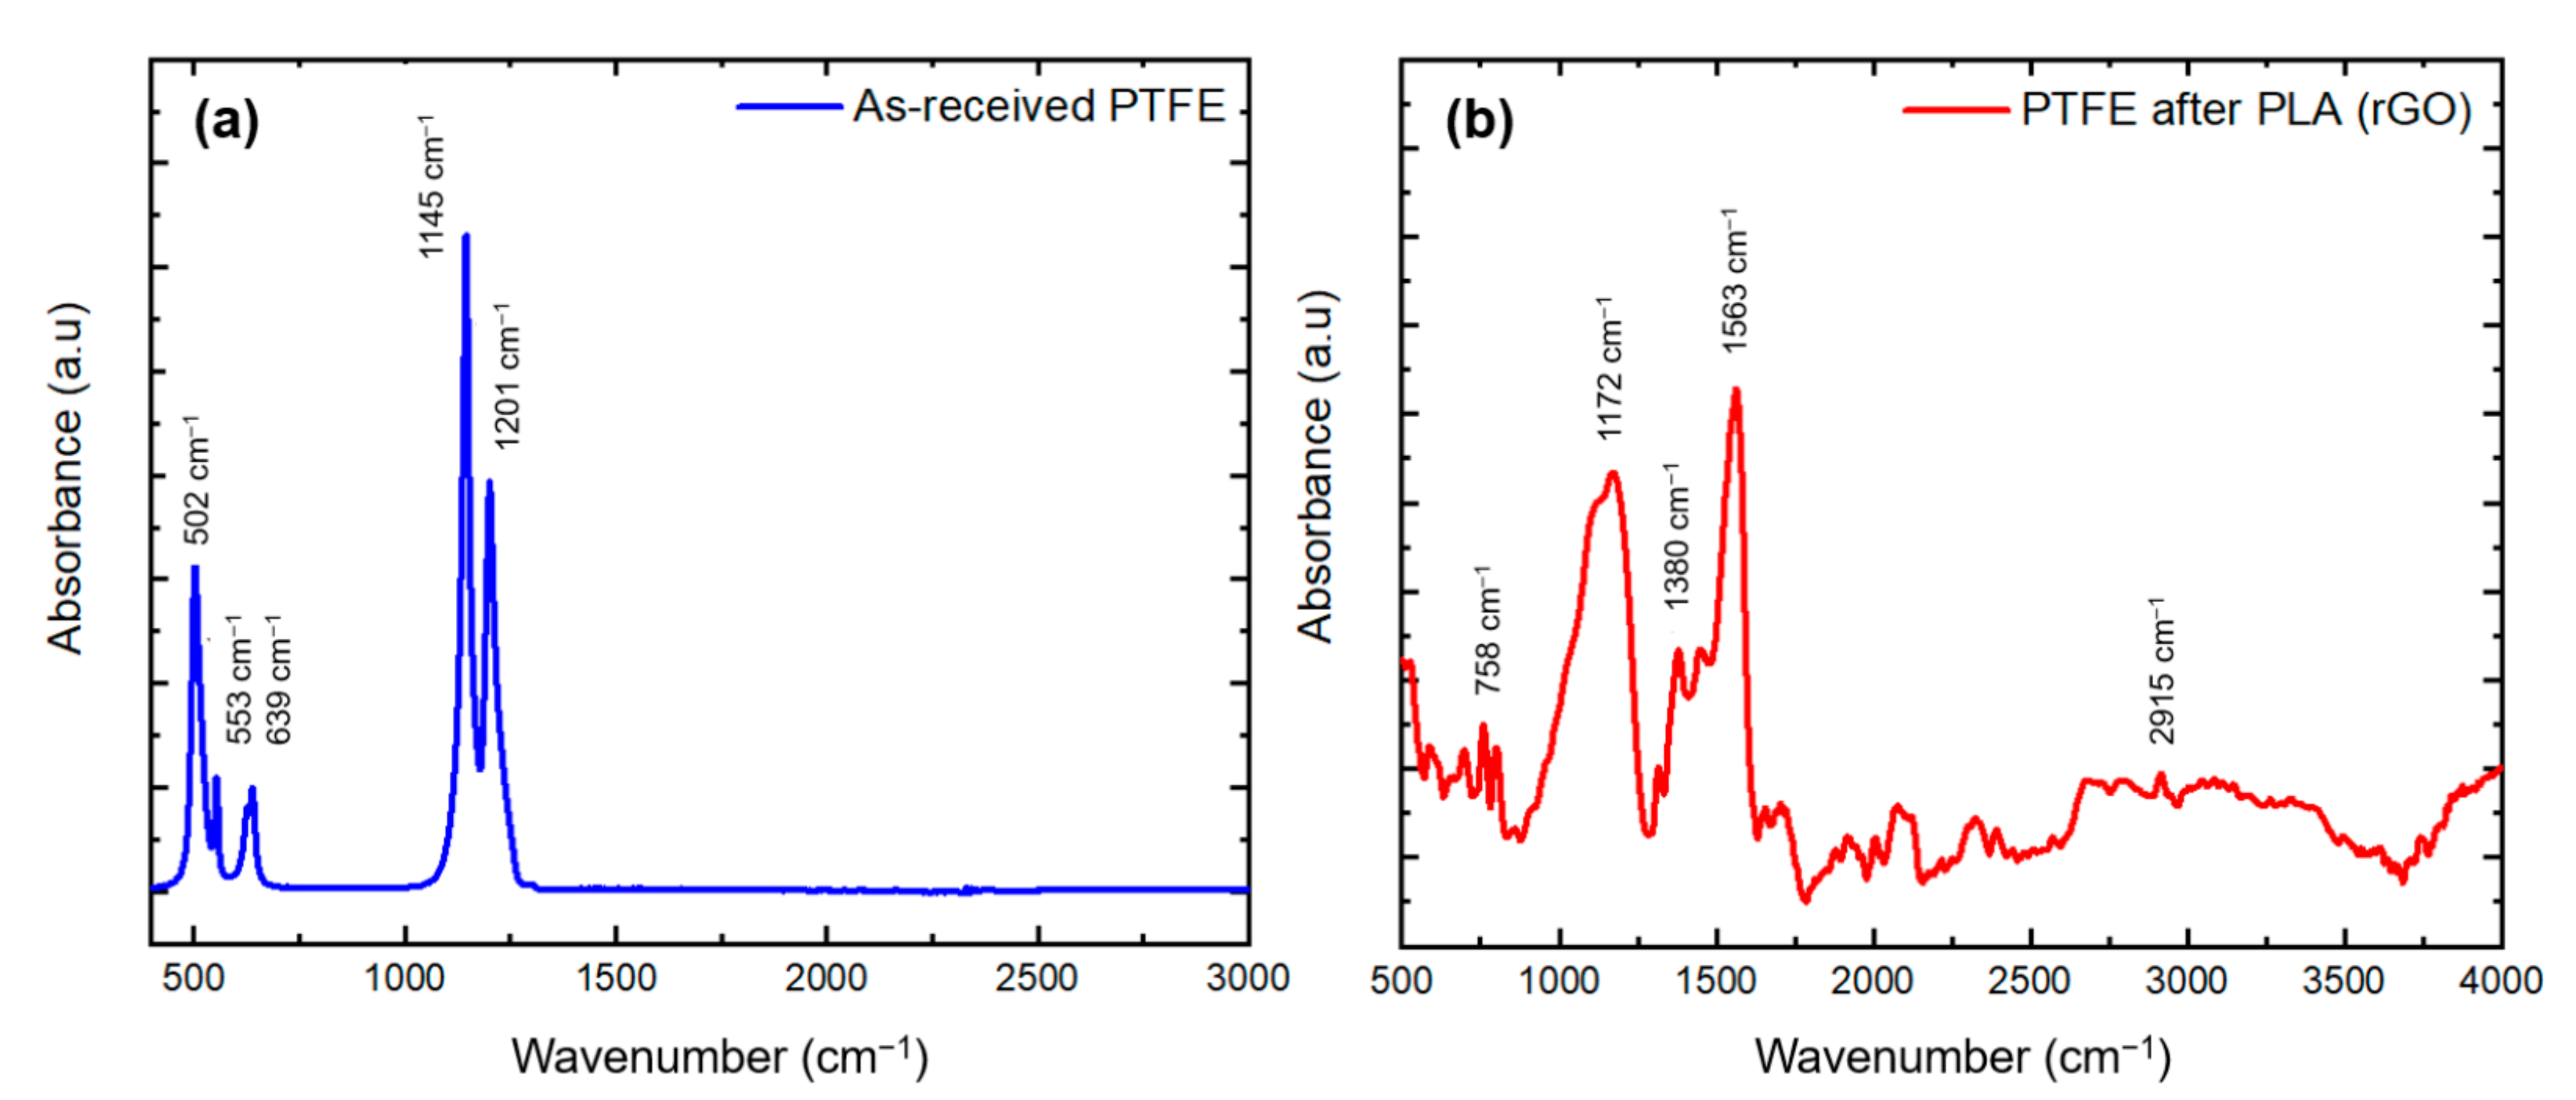
3.1.4. Fourier-Transform Infrared Spectroscopy

Further evidence for the successful conversion of PTFE into rGO was provided by FTIR spectroscopy. FTIR spectroscopy is a practical characterization method to detect the chemical bonding in polymers and graphene structures. Figure 5a illustrates the FTIR spectrum of PTFE before laser annealing. The peaks at 502, 553, and 639 cm−1 originate from the rocking, bending, and wagging of CF2 bonds, respectively [75,76]. The peak positioned at 1145 cm−1 is attributed to the symmetrical stretching of CF2 bonds [75,77]. The asymmetric stretching of CF2 bonds culminates in the appearance of a 1201 cm−1 peak in PTFE [75,77]. All of the mentioned peaks disappear after the PLA of PTFE; new bonds form, which are evidence for rearrangement in the chemical structure (Figure 5b). The strong peak at 1563 cm−1 belongs to the sp2-hybridized C=C bonds. The second strong band at 1172 cm−1 is assigned to the asymmetric stretching of C–O–C bonds [78]; it has been observed in rGO structures after reduction [79]. The peak at 1380 cm−1 is attributed to C–OH stretching [80]. The weak peaks at 758 and 2915 cm−1 are related to O–H bending and aromatic C–H stretching, respectively [81,82]. The absence or weak presence of oxygen-containing groups, which are characteristic of graphene oxide, confirms the formation of reduced graphene oxide. These GO characteristic peaks are located at ~1723 cm−1 (C=O carbonyl stretching) and ~3412 cm−1 (hydroxyl group stretching), as well as ~2915 cm−1, ~758, and ~599 cm−1 (OH out-of-plane bending) [82,83].

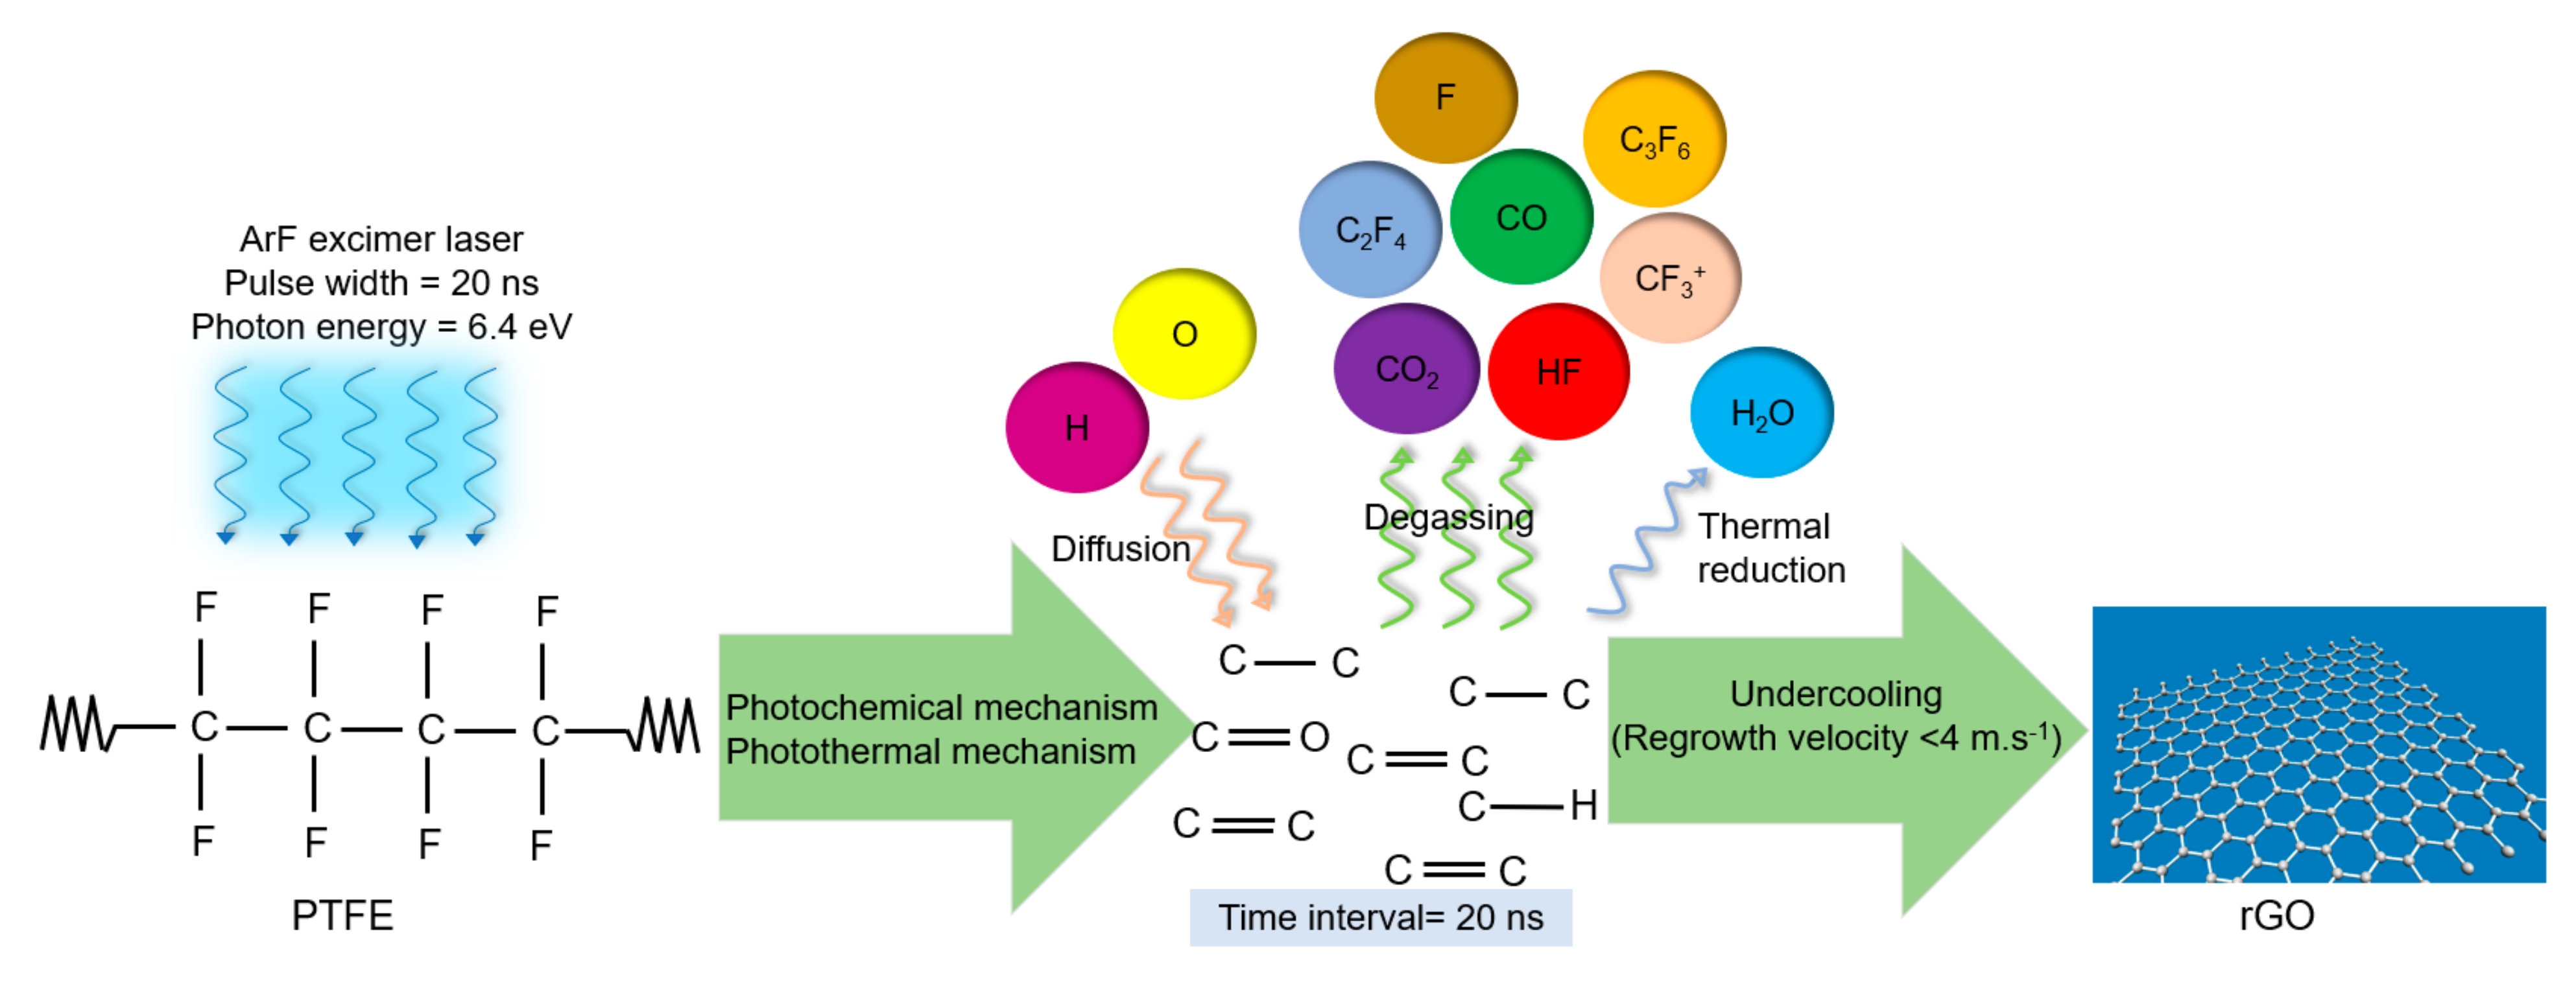
3.1.5. Mechanism of Conversion of PTFE into rGO by the PLA Method

The laser annealing of PTFE involves the application of 30 shots of the ArF excimer laser with a photon energy of 6.4 eV, a pulse width of 20 ns, a pulse frequency of 10 Hz, and a laser-energy density of 0.9 ± 0.1 J·cm−2 to PTFE, which exhibits a bandgap of 6.0 eV [84]. Since the laser-energy density threshold for the ablation of PTFE is ~ 1.6 J·cm−2 [43], ablation of PTFE will not occur during ArF-laser annealing with a fluence of 0.9 ± 0.1 J·cm−2.
Since the photon energy of the ArF laser is higher than the PTFE bandgap, the laser energy will be absorbed by PTFE. Owing to the high bandgap of PTFE, the absorption process will initially commence through the two-photon absorption phenomenon by virtue of the mid-gap energy states present in PTFE [85]. The absorption coefficient of PTFE is enhanced following an increase in the number of laser shots (N) [85]:
α eff = α 0 + N α i
where αeff is the effective absorption coefficient, α0 is the initial PTFE absorption coefficient, and αi is the absorption coefficient of PTFE after the first shot. After a sufficient enhancement in the absorption coefficient of PTFE, single-photon absorption will dominate the process [85].
Over a time interval of 20 ns, the energy of the laser is transferred to the PTFE chains by the excitation of photons (the photochemical mechanism) and the excitation of phonons (the photothermal mechanism) [86].
In the photochemical mechanism, the laser photons dissociate the bonds in the PTFE chains. During the photodegradation of PTFE, the polymer backbone (C–C) experiences scission [87]. Similarly, during the photochemical degradation of PTFE by 6.4 eV ArF laser irradiation, the C–C bonds (~ 3.6 eV) and C–F bonds (~ 5 eV) undergo breakage. It has also been confirmed that the major process of releasing F atoms occurs by the desorption of CF3+ ions [87]. C=C bonds are not generated during the photodegradation of PTFE at room temperature [87,88]. Therefore, it is more likely that the formation of carbon bonds is a photothermal-assisted process.
In the photothermal mechanism, with an increase in the number of laser shots, the strongly absorbing PTFE will rapidly experience a rise in temperature during each 20 ns time interval. The energy from the electronic structure is transferred to the lattice phonons within 1 ps (10−12 s). Therefore, the excitation of phonons leads to the generation of a significant amount of heat within 20 ns. We have previously shown that the 20 ns pulse duration is sufficient for PTFE to be heated and melted [48]. When PTFE is heated to 470 °C in air, volatilization of C2F4, C3F6, HF, CO2, and CO occurs [89]. As PTFE is interacting with the ArF laser and is melted, oxygen and hydrogen diffuse (as suggested by the FTIR results) below the surface and provide the origin of the HF, CO2, and CO degassing and also formation of the C–H, C–OH, C=O, and OH bonds in the resultant rGO. The monomer yield of PTFE during thermal degradation is 100%; once the thermal factor triggers the unzipping of the monomers, it proceeds to the rest of the molecule [89]. When the liberation of HF and other gases takes place, the double C=C bonds form at the expense of C–C bond breakage. Therefore, the overall photothermal and photochemical mechanism of PTFE involves melting, volatilization of different gases, breakage of the backbone of PTFE (C–C), and formation of C=C. Meanwhile, the laser-annealing causes the dehydration and reduction (thermal reduction) of some of the absorbed oxygen-containing groups, as follows [90]:
CH C OH + H + H e a t C = C + H 2 O
The free carbons with some residual C–H, C–OH, C=O, and OH bonds from the absorption of oxygen and hydrogen at the surface will undergo an undercooling process once the laser pulse terminates. We have previously shown that the undercooling determines the regrowth velocity of solidification [89]. The thermodynamically stable graphitic structures require a low undercooling and a low regrowth velocity of < 4 m·s−1; in comparison, a velocity of 4–6 m·s−1 is associated with diamond nucleation, and a velocity of > 16 m·s−1 is associated with pure Q-carbon formation [89]. For our system (PTFE tape on Al2O3 substrate), we have calculated that a laser-energy density of 0.8 to 1 J·cm−2 provides the appropriate undercooling for the formation of rGO from PTFE [48]. Figure 6 highlights the procedure for the direct conversion of PTFE into rGO.

3.2. PBI Conversion into rGO

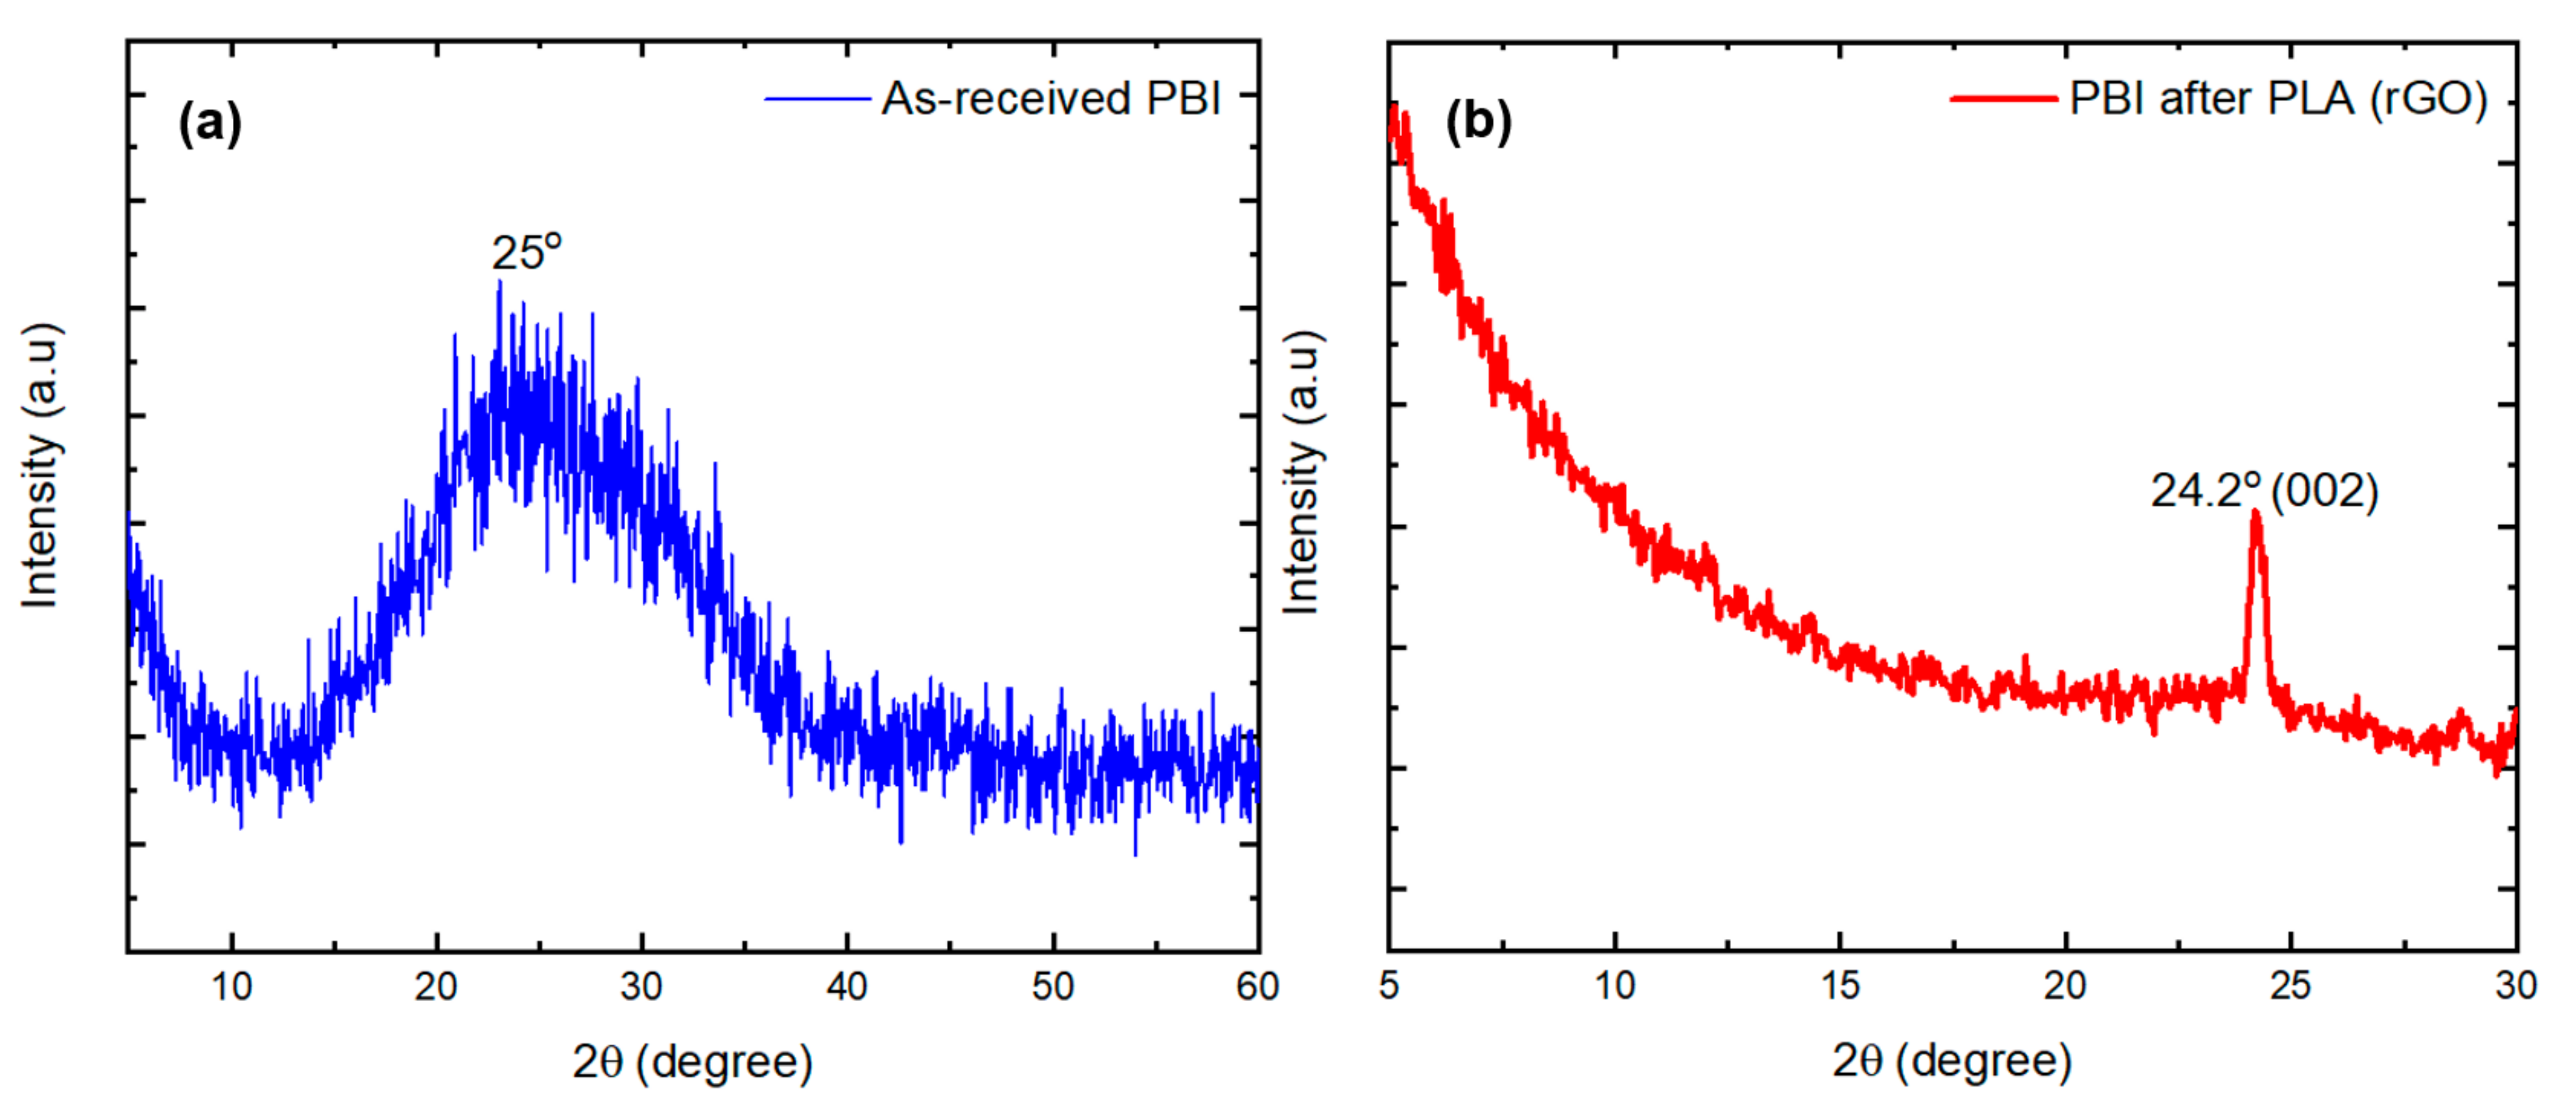
3.2.1. X-ray Diffraction

The XRD pattern of the water-washed electrospun PBI fibers (in order to remove the KOH content) was obtained to understand its crystal structure. Figure 7a shows a broad peak centered at 2θ ≈ 25°. This peak is assigned to the amorphous domains in the meta-PBI structure and is related to the π–π stacking of the aromatic rings in the molecular structure of PBI. PBI structures with some degree of crystallinity also exhibit two sharp peaks at 2θ = 9.5° and 2θ = 12.2° [91,92,93]. The absence of these two peaks in the XRD pattern of PBI indicates the amorphous nature of the PBI used in this study, and this may be attributed to the electrospinning conditions and the ethanolic KOH solvent interactions. After laser annealing of the PBI fibers with an energy density of 0.7 ± 0.1 J·cm−2, the amorphous halo at 2θ ≈ 25° disappeared and a new sharp peak at 2θ = 24.2° formed (Figure 7b). The spectrum in Figure 7b aligns with the XRD pattern of reduced graphene oxide. The lack of a peak at 2θ = 10.9° rules out the formation of graphene oxide, and the absence of a peak at 2θ ≈ 26.5° excludes the presence of graphite after laser annealing. The observed peak at 2θ = 24.2° is attributed to (002) planes, with a 0.37 nm planar spacing in the obtained rGO structure.

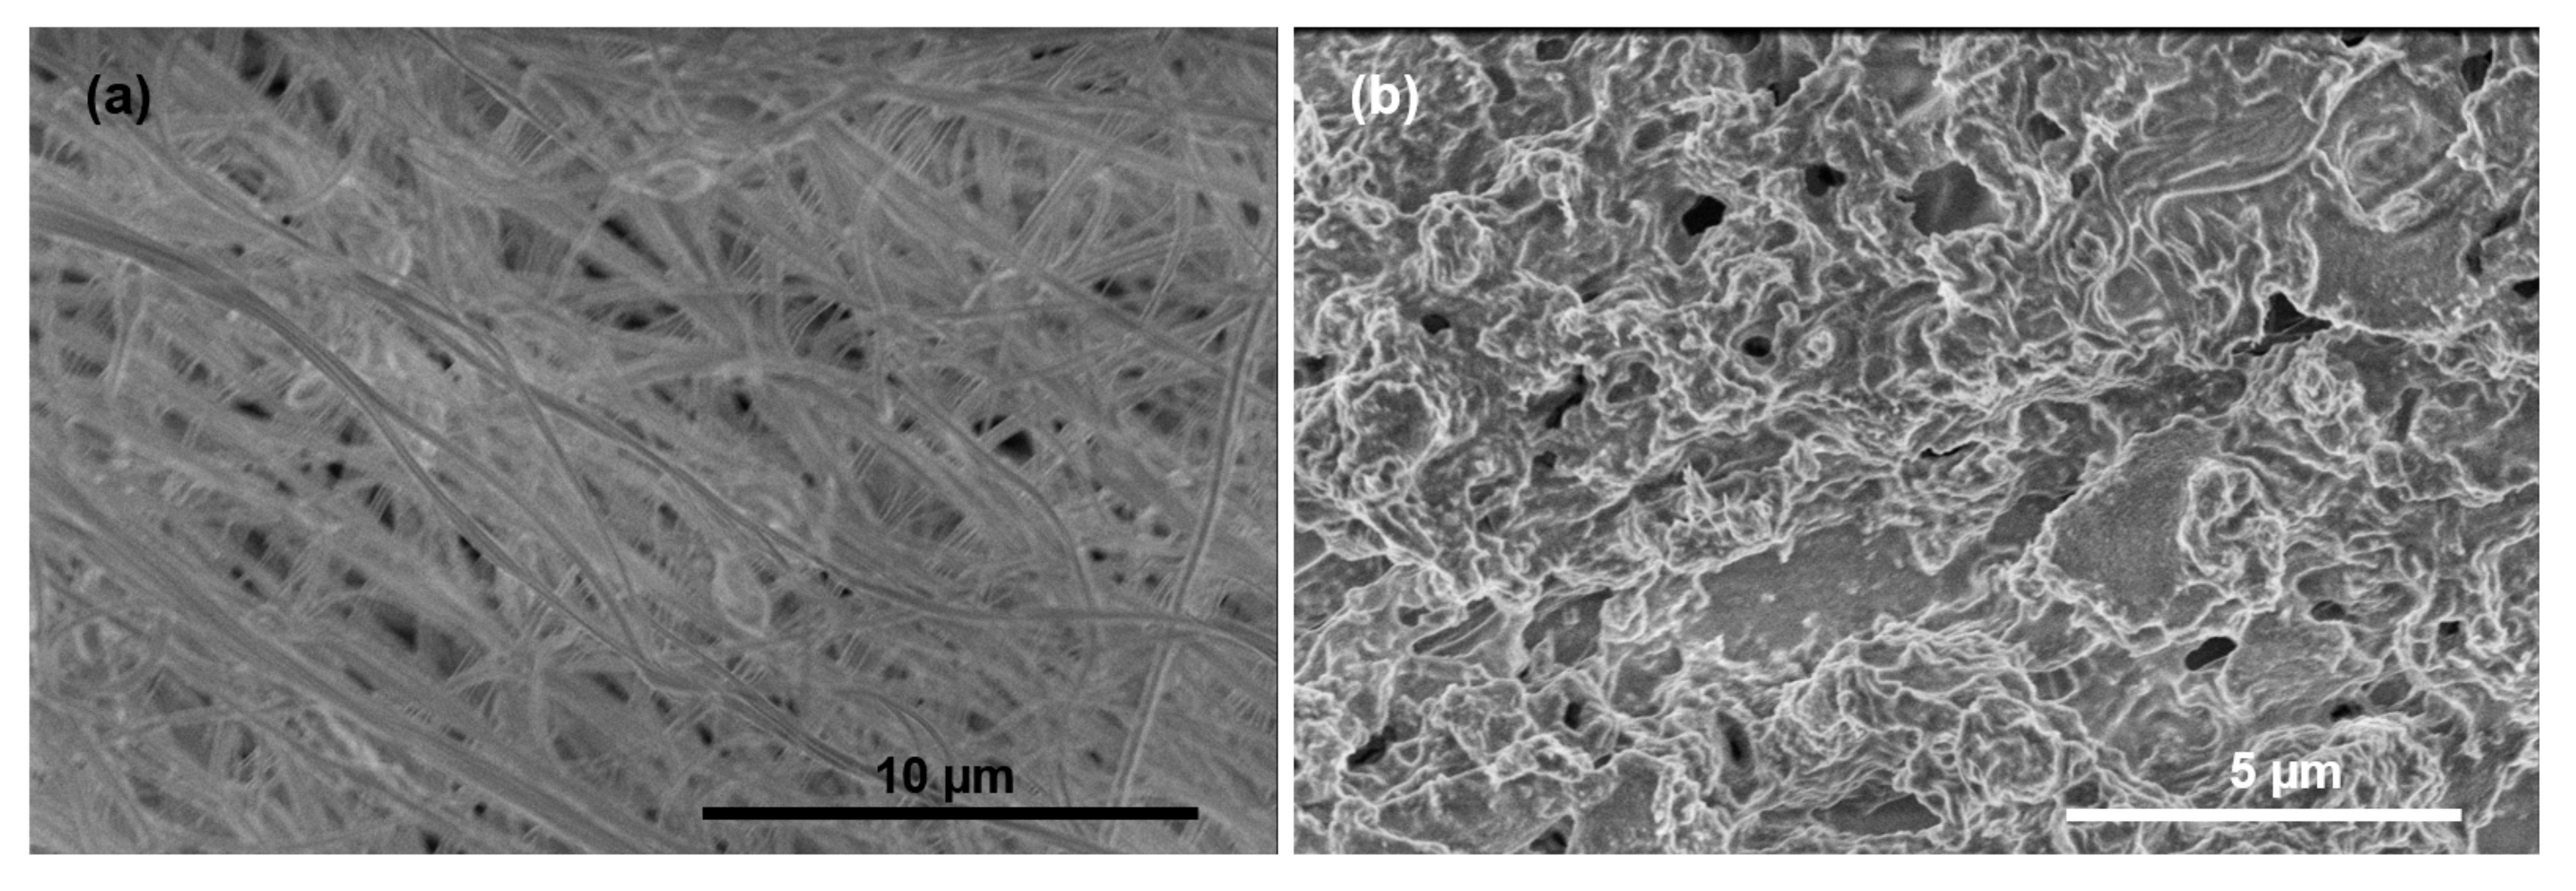
3.2.2. Scanning Electron Microscopy

The FESEM micrograph of as-received PBI in Figure 8a shows the structural features of the PBI fibers. The PBI fibers exhibited an average diameter of 250 nm. After the laser-annealing process, changes in the morphology of PBI occurred (Figure 8b); the fibers were replaced with layers of rGO. The volume of PBI was considerably reduced after the laser-annealing process. The shrinkage in volume was correlated with the degassing process during heating of PBI by the UV laser.

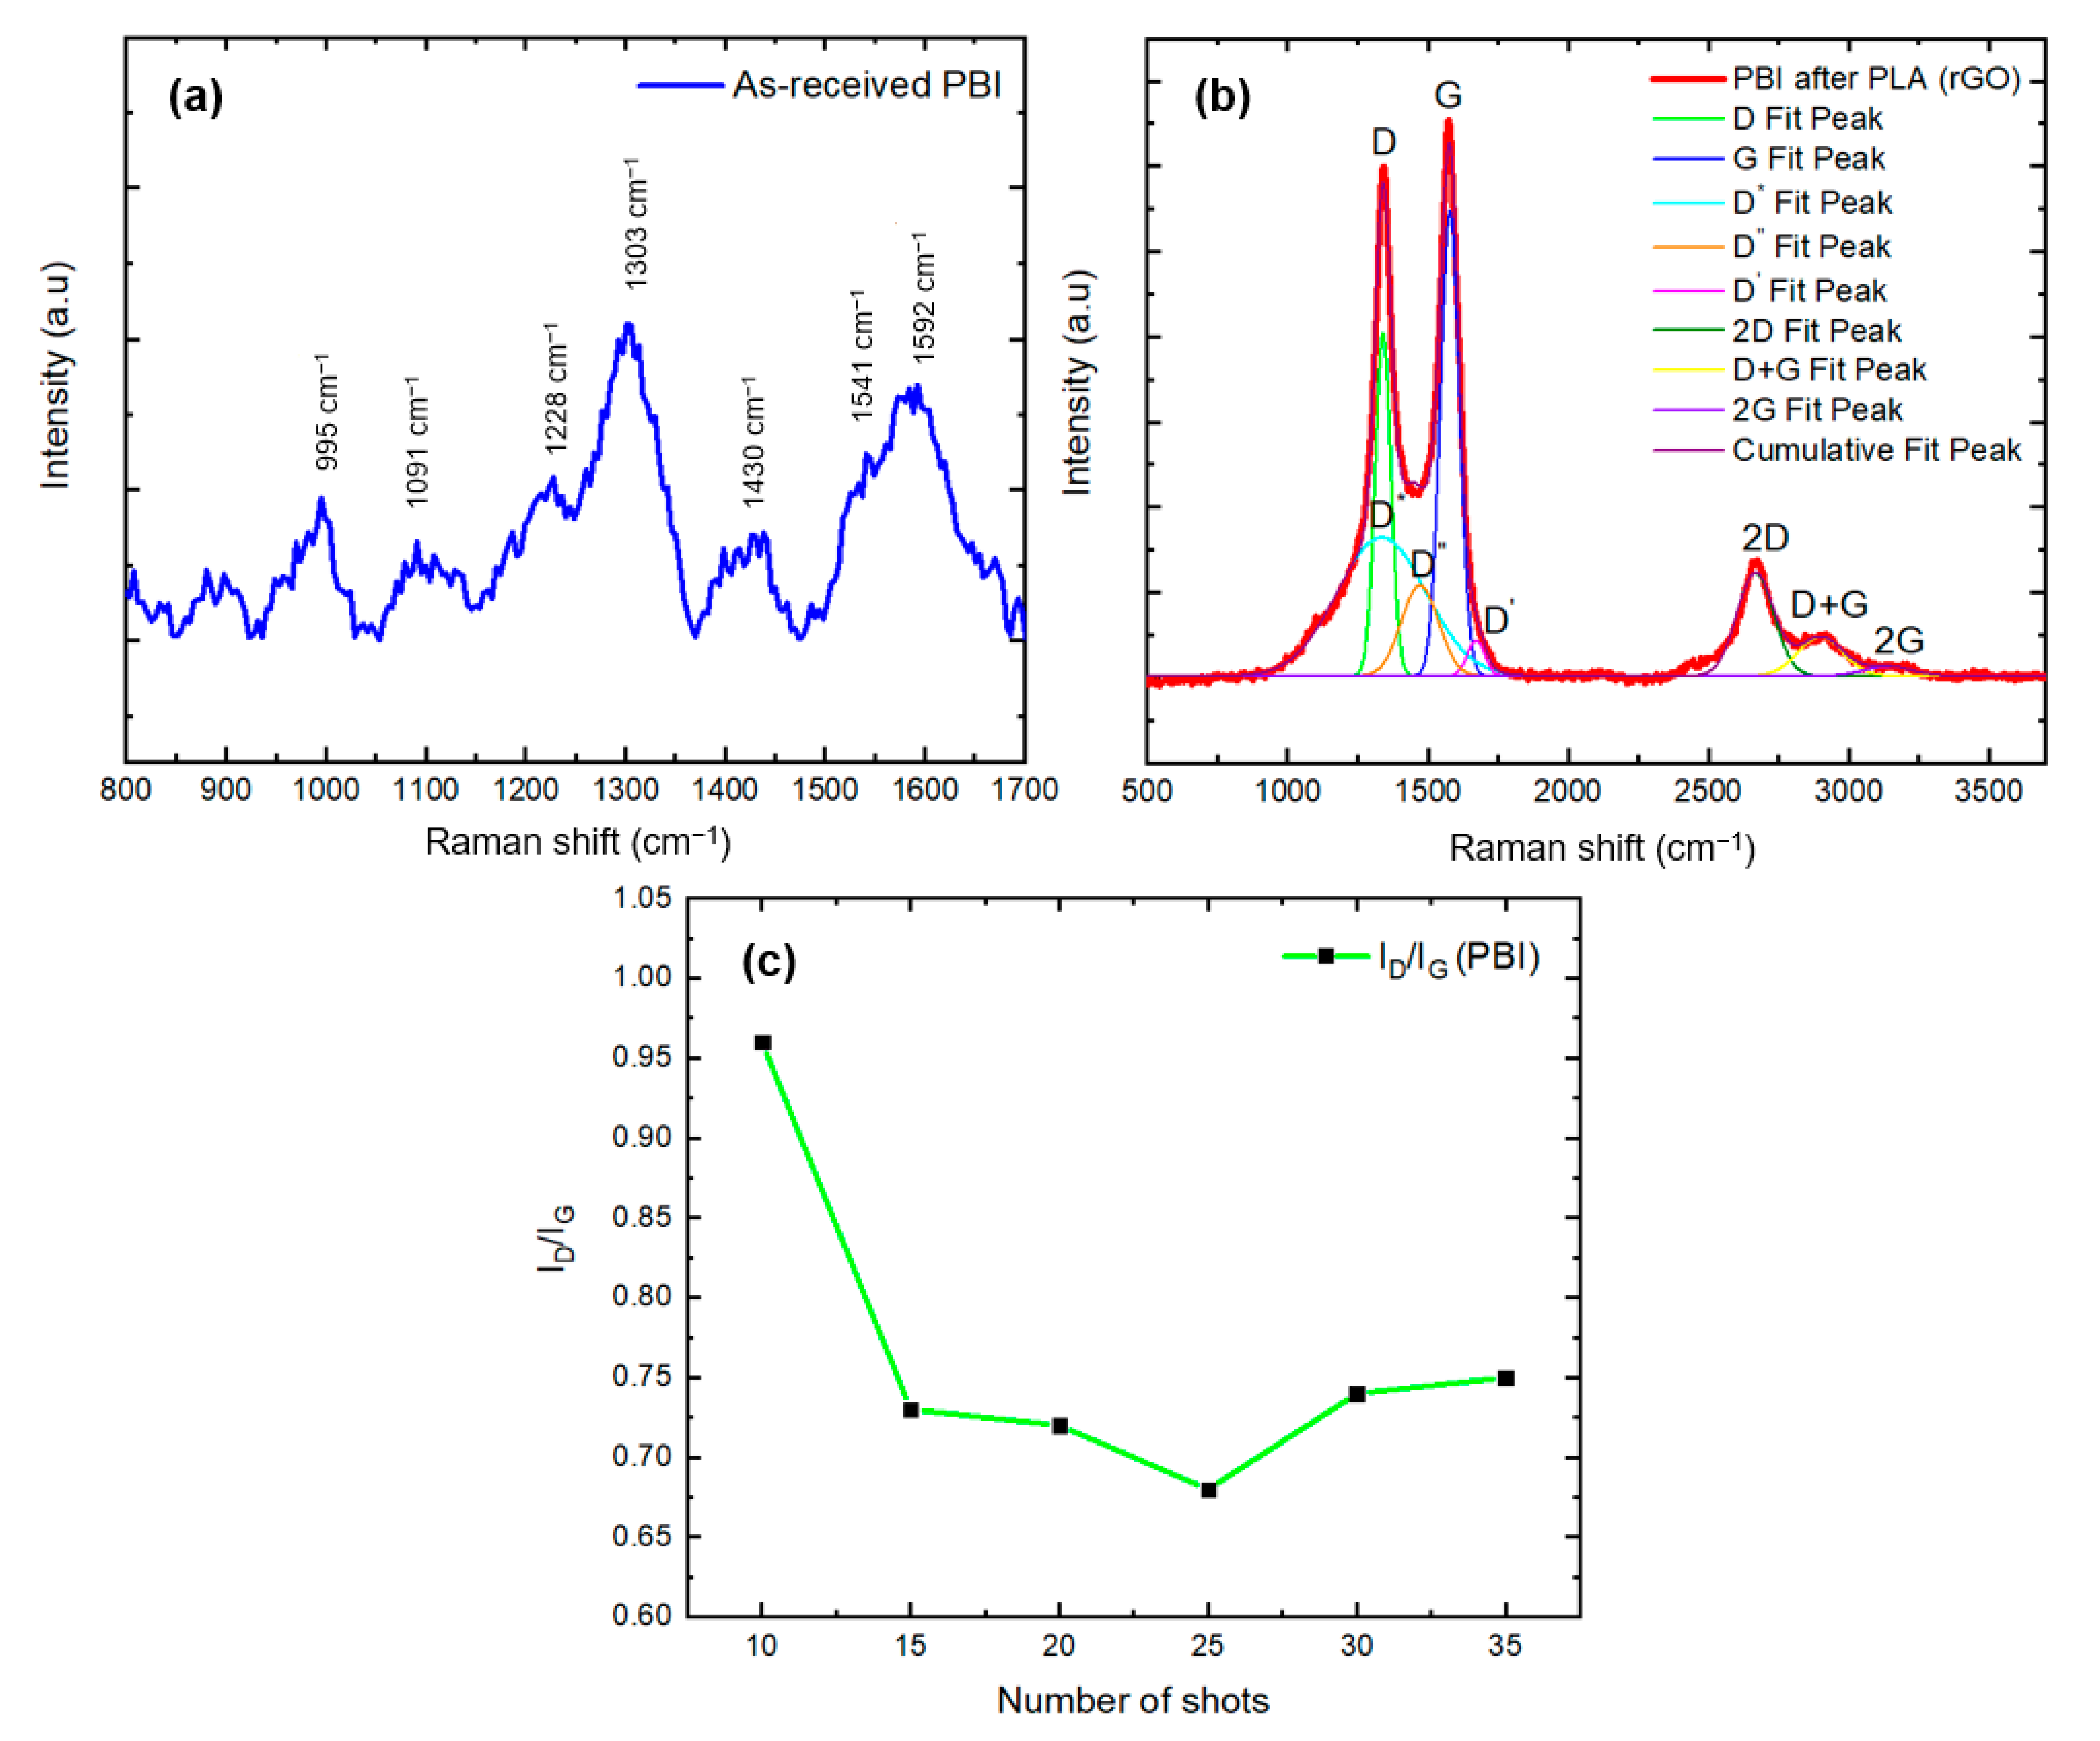
3.2.3. Raman Spectroscopy

Figure 9a shows the Raman spectrum of the PBI fibers before exposure to ArF laser annealing. The two peaks located at 1592 and 1541 cm−1 were assigned to the stretching of benzimidazole rings (C=N and C=C) [94,95]. The broad band at approximately 1430 cm−1 also originated from the benzimidazole ring stretch. The strong peak at 1303 cm−1 and the shoulder peak at 1228 cm−1 are consistent with in-plane vibration of the C–H bonds. The peaks at 1091 and 995 cm−1 correspond to the deformation of benzene trigonal rings or breathing of benzene rings [94,95]. As is evident from Figure 9b, exposure to multiple shots of the UV laser converted the PBI structure to the rGO structure. Similar to previous findings [96,97], the first-order region may be fitted by using five peaks, namely D, G, D*, D′′, and D. The D* peak is related to the disorder in the graphitic lattice structure from both sp2 and sp3 bonds [98]. The D′′ peak is attributed to amorphous phases that are observed in carbon structures, and the D peak is activated by crystal defects [64,96,99,100]. The results of Gaussian fitting show that the D, G, D*, D′′, D′, 2D, D + G, and 2G peaks are centered at 1339, 1577, 1333, 1470, 1670, 2666, 2898, and 3139 cm−1, respectively. The low intensities of the D*, D′′, and D peaks imply a low amount of lattice disorders, lattice defects, and amorphous phases in the rGO structure. The intensity ratio of ID/IG = 0.73 confirms the reduced structure of the rGO and aligns with the XRD results. Using Equation (2), the average crystallite size of the sp2 domains is estimated to be 26 nm. The 2D band located at 2666 cm−1 is broad, indicating the multilayer structure of rGO. Figure 9c shows the changes in the ID/IG values versus the number of laser shots during laser annealing. The initial decrease in the ID/IG value implies a decrease in the defects that are present in the structure, which remains constant up to 35 shots.

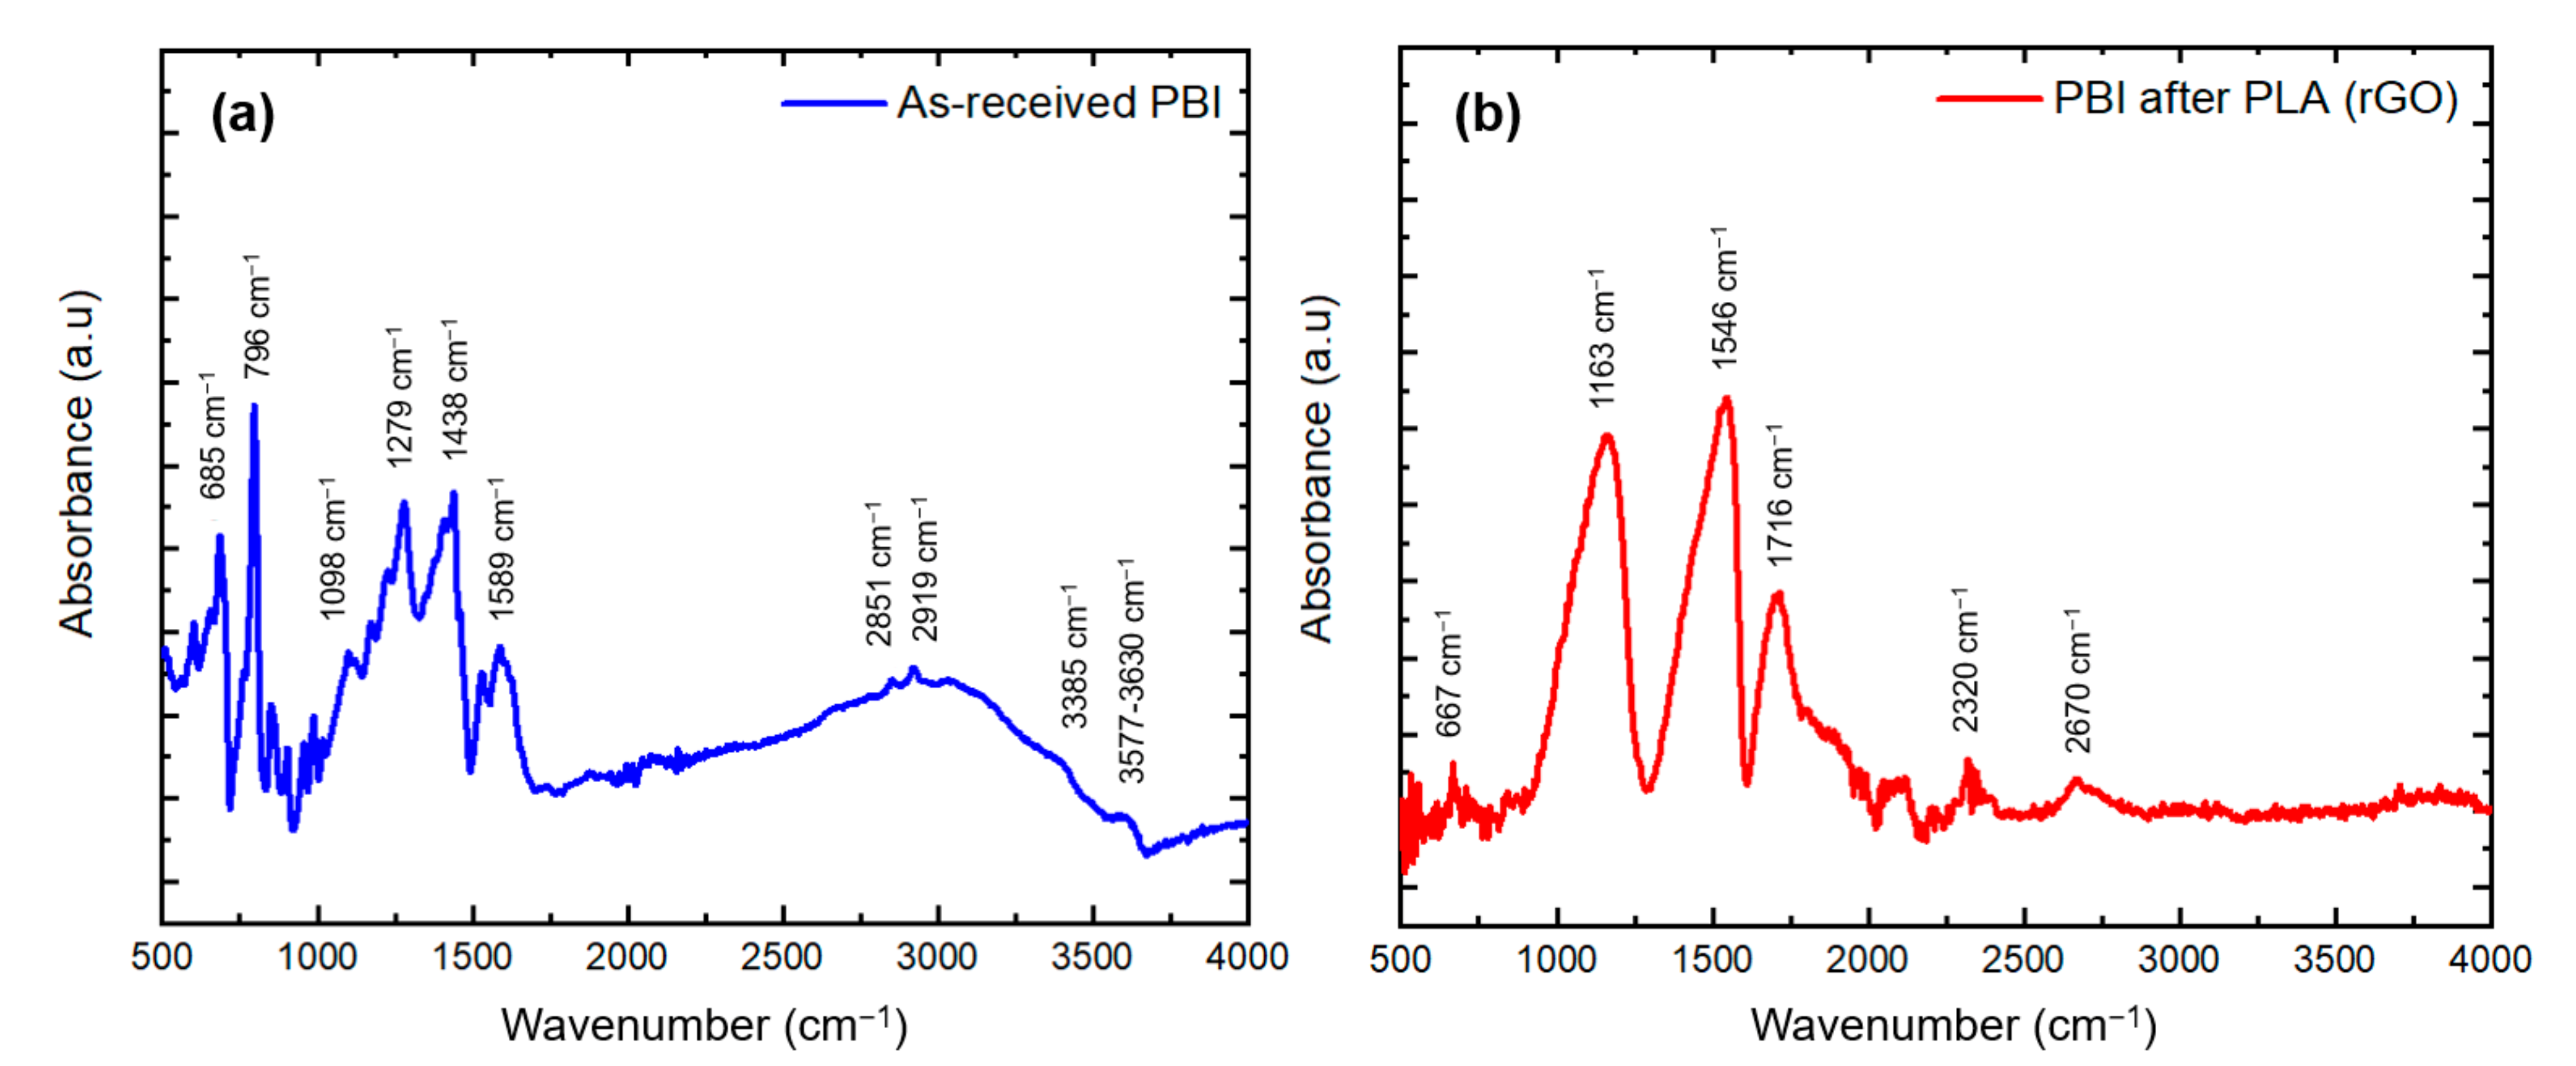
3.2.4. Fourier-Transform Infrared Spectroscopy

Utilizing FTIR spectroscopy, we explored the disappearance of bonds associated with PBI and the formation of new bonds by laser annealing. Figure 10a shows the chemical bonding in PBI. The peaks in the region of 680 to 852 cm−1 (685 and 796 cm−1) are associated with the out of plane bending of the aromatic C–H bonds [101]. The peak at 1098 cm−1 is assigned to the C–H bonds in imidazole [102]. The peaks in the 1279 cm−1 region are associated with C–N stretching and benzimidazole breathing [103]. At 1438 cm−1, the vibrations from the in-plane deformation of imidazole rings are activated [104]. The peak at 1589 cm−1 is derived from C=C and C=N stretching. The broad band in the region of 2800 to 3500 m−1 is ascribed to the N–H stretching vibrations [104]. Finally, the peak at ~3577 cm−1 correlates with the O–H stretching and is related to the moisture absorbed by the PBI structure [103]. Generally, the broad band in the region of 2400–4000 cm−1 reflects the absorption of moisture by PBI [105]. After laser processing, the structure shows features that are associated with rGO (Figure 10b). The strong peak at 1546 cm−1 is attributed to the C=C bonds in rGO [106,107]. The peak at 1163 cm−1 is related to C–O–H bonding [106]. The peak at 1716 cm−1 is associated with the stretching of C=O bonds [108]. The weak peaks at 667, 2320, and 2670 cm−1 correspond to the out of plane bending of OH, CO2, and C–H stretching, respectively [82]. Similar to the rGO structure obtained from PTFE, the peaks associated with GO at 3412 cm−1 (hydroxyl group stretching), 2915, ~758, 667, and ~599 cm−1 (OH out-of-plane bending) are either very weak or absent [82,83].

3.2.5. Mechanism of Conversion of PBI into rGO by PLA Method

For the successful conversion of a material into rGO, it is essential that the threshold fluence of laser ablation is higher than the threshold fluence of laser annealing. PBI exhibits a very high threshold of UV ablation fluence; as such, it is suitable for the laser-annealing process [44]. PBI structures have a propensity to absorb moisture when exposed to air [105]. PBI structures exhibit an intense UV absorption, which is attributed to the presence of aromatic units; the high UV absorption rate enables the fast photodegradation of this material. The degradation of PBI (with a bandgap of 3.13–3.25 eV) [109] via UV laser exposure is dominated by the photo-oxidation procedure; oxygen attacks the benzimidazole subunits and imide rings [110,111]. Photo-oxidative degradation leads to the oxidation of the benzenoid and imidazole rings and the production of C=O groups, which in turn is associated with the presence of the peak at 1716 cm−1 in the FTIR spectrum [105]. Moreover, it causes the scission of benzimidazole rings. Consequently, volatile oxygen-containing products are produced which immediately decompose to CO, CO2, N2, NO2, and H2O [105,111].
Meanwhile, extreme heat is locally generated by the UV laser, which leads to a stepwise thermal degradation of PBI. At 300 to 570 °C, NH3 is liberated; afterwards, CH4 is released at 570 to 700 °C. At 700 °C, arylnitrile-containing units degrade and form HCN and H2. Finally, the decomposition of oxygen-containing residues liberates N2, CO2, and H2O at high temperatures [111]. All of the dehydration processes are responsible for the disappearance of the broad band in the region of 2400–4000 cm−1 in the FTIR spectrum of PBI after laser annealing [105].
Finally, the residual free carbon with some oxygen and hydrogen content will reach the melting point of carbon. The mixture will experience ultrafast undercooling. The undercooling speed is adjusted through the appropriate selection of laser fluence for the PBI system (0.7 ± 0.1 J·cm−2). The regrowth velocity of <4 m·s−1 is achieved, and the formation of rGO with σ and π carbon bonds is facilitated.

4. Conclusions

The transformation of PTFE and PBI polymers into rGO structures was performed. The driving force for this transformation is the non-equilibrium method of PLA. The ArF excimer laser with a photon energy of 6.4 eV and a pulse width of 20 ns is an appropriate choice for PLA that involves ultrafast melting and controlled undercooling. The UV absorption of PTFE increases with each laser shot. PBI exhibits UV absorption with a high laser ablation threshold. In both polymers, the XRD results confirm the formation (002) planar spacing and a d(002) corresponding to the reduced planar spacing in rGO structures. Raman spectroscopy indicates the presence of a multilayered structure in the rGO structures. The evolution of bonds related to rGO structures was identified in both laser-annealed polymers, using FTIR spectroscopy. The transition of PTFE to rGO is assisted by both the photochemical and photothermal mechanisms, in which diffusion of oxygen and hydrogen, degassing of byproducts, and thermal reduction culminate in molten free carbons. The molten free carbons go through an appropriate undercooling process that is adjusted by the laser fluence, which leads to the formation of rGO. In PBI, the transition is assisted by a photo-oxidation process and is accompanied by stepwise thermal degradation. The residual molten carbons rearrange in the form of rGO structures during the undercooling process.

Author Contributions

Experimentation, P.R.R. and P.J.; resources, H.P., J.N., and R.J.N.; writing—original draft preparation, P.R.R.; writing—review and editing, P.R.R., P.J., J.N., H.P. and R.J.N.; supervision, J.N. and R.J.N.; funding acquisition, R.J.N. All authors have read and agreed to the published version of the manuscript.

Funding

The authors would like to acknowledge the support of the National Science Foundation Award #1836767. This work was performed in part at the Analytical Instrumentation Facility (AIF) at North Carolina State University, which is supported by the state of North Carolina and the National Science Foundation (award number ECCS-2025064). The PBI fiber preparation was partially performed with materials and equipment included in the National Infrastructure NI SEVE supported by the Bulgarian Ministry of Education and Science under grant agreement N° DO1-385/15.12.2020, as well the financial and equipment support to project N° BG05M2OP001-1.002-0014 “Center of competence HITMOBIL—Technologies and systems for generation, storage and consumption of clean energy,” funded by Operational Programme “Science and Education For Smart Growth” 2014-2020, co-funded by the EU from the European Regional Development Fund is kindly acknowledged.

Institutional Review Board Statement

Not applicable.

Informed Consent Statement

Not applicable.

Data Availability Statement

The datasets generated during and/or analyzed during the current study are available from the corresponding author on reasonable request.

Conflicts of Interest

The authors declare no conflict of interest. The funders had no role in the design of the study, or in the collection, analyses, or interpretation of data.

References

  1. Novoselov, K.S.; Geim, A.K.; Morozov, S.V.; Jiang, D.; Zhang, Y.; Dubonos, S.V.; Grigorieva, I.V.; Firsov, A.A. Electric Field Effect in Atomically Thin Carbon Films. Science 2016, 306, 666–669. [Google Scholar] [CrossRef] [Green Version]
  2. Coleman, J.N. Liquid-phase exfoliation of nanotubes and graphene. Adv. Funct. Mater. 2009, 19, 3680–3695. [Google Scholar] [CrossRef]
  3. Hernandez, Y.; Nicolosi, V.; Lotya, M.; Blighe, F.M.; Sun, Z.; De, S.; McGovern, I.T.; Holland, B.; Byrne, M.; Gun’ko, Y.K.; et al. High-yield production of graphene by liquid-phase exfoliation of graphite. Nat. Nanotechnol. 2008, 3, 563–568. [Google Scholar] [CrossRef] [Green Version]
  4. Berger, C.; Song, Z.; Li, X.; Wu, X.; Brown, N.; Naud, C.; Mayou, D.; Li, T.; Hass, J.; Marchenkov, A.N.; et al. Electronic Confinement and. Science 2006, 312, 1191–1196. [Google Scholar] [CrossRef] [Green Version]
  5. Berger, C.; Song, Z.; Li, T.; Li, X.; Ogbazghi, A.Y.; Feng, R.; Dai, Z.; Alexei, N.; Conrad, M.E.H.; First, P.N.; et al. Ultrathin epitaxial graphite: 2D electron gas properties and a route toward graphene-based nanoelectronics. J. Phys. Chem. B 2004, 108, 19912–19916. [Google Scholar] [CrossRef] [Green Version]
  6. Rümmeli, M.H.; Bachmatiuk, A.; Scott, A.; Börrnert, F.; Warner, J.H.; Hoffman, V.; Lin, J.H.; Cuniberti, G.; Büchner, B. Direct low-temperature nanographene cvd synthesis over a dielectric insulator. ACS Nano 2010, 4, 4206–4210. [Google Scholar] [CrossRef] [Green Version]
  7. Bae, S.; Kim, H.; Lee, Y.; Xu, X.; Park, J.S.; Zheng, Y.; Balakrishnan, J.; Lei, T.; Ri Kim, H.; Song, Y., II; et al. Roll-to-roll production of 30-inch graphene films for transparent electrodes. Nat. Nanotechnol. 2010, 5, 574–578. [Google Scholar] [CrossRef] [PubMed] [Green Version]
  8. Wang, X.; You, H.; Liu, F.; Li, M.; Wan, L.; Li, S.; Li, Q.; Xu, Y.; Tian, R.; Yu, Z.; et al. Large-scale synthesis of few-layered graphene using CVD. Chem. Vap. Depos. 2009, 15, 53–56. [Google Scholar] [CrossRef]
  9. Jiao, L.; Zhang, L.; Wang, X.; Diankov, G.; Dai, H. Narrow graphene nanoribbons from carbon nanotubes. Nature 2009, 458, 877–880. [Google Scholar] [CrossRef]
  10. Cai, J.; Ruffieux, P.; Jaafar, R.; Bieri, M.; Braun, T.; Blankenburg, S.; Muoth, M.; Seitsonen, A.P.; Saleh, M.; Feng, X.; et al. Atomically precise bottom-up fabrication of graphene nanoribbons. Nature 2010, 466, 470–473. [Google Scholar] [CrossRef]
  11. Whitener, K.E.; Sheehan, P.E. Graphene synthesis. Diam. Relat. Mater. 2014, 46, 25–34. [Google Scholar] [CrossRef]
  12. Lin, L.S.; Bin-Tay, W.; Li, Y.R.; Aslam, Z.; Westwood, A.; Brydson, R. A practical characterisation protocol for liquid-phase synthesised heterogeneous graphene. Carbon N. Y. 2020, 167, 307–321. [Google Scholar] [CrossRef]
  13. Yang, X.; Yan, M. Removing contaminants from transferred CVD graphene. Nano Res. 2020, 13, 599–610. [Google Scholar] [CrossRef]
  14. Dan, Y.; Lu, Y.; Kybert, N.J.; Luo, Z.; Johnson, A.T.C. Intrinsic response of graphene vapor sensors. Nano Lett. 2009, 9, 1472–1475. [Google Scholar] [CrossRef] [PubMed] [Green Version]
  15. Yazdi, G.R.; Akhtar, F.; Ivanov, I.G.; Schmidt, S.; Shtepliuk, I.; Zakharov, A.; Iakimov, T.; Yakimova, R. Effect of epitaxial graphene morphology on adsorption of ambient species. Appl. Surf. Sci. 2019, 486, 239–248. [Google Scholar] [CrossRef]
  16. Paredes, J.I.; Villar-Rodil, S.; Martínez-Alonso, A.; Tascón, J.M.D. Graphene oxide dispersions in organic solvents. Langmuir 2008, 24, 10560–10564. [Google Scholar] [CrossRef]
  17. Hummers, W.S.; Offeman, R.E. Preparation of Graphitic Oxide. J. Am. Chem. Soc. 1958, 80, 1339. [Google Scholar] [CrossRef]
  18. El-Kady, M.F.; Kaner, R.B. Direct laser writing of graphene electronics. ACS Nano 2014, 8, 8725–8729. [Google Scholar] [CrossRef] [PubMed]
  19. Spilarewicz-Stanek, K.; Kisielewska, A.; Ginter, J.; Bałuszyńska, K.; Piwoński, I. Elucidation of the function of oxygen moieties on graphene oxide and reduced graphene oxide in the nucleation and growth of silver nanoparticles. RSC Adv. 2016, 6, 60056–60067. [Google Scholar] [CrossRef] [Green Version]
  20. Orlita, M.; Faugeras, C.; Plochocka, P.; Neugebauer, P.; Martinez, G.; Maude, D.K.; Barra, A.L.; Sprinkle, M.; Berger, C.; De Heer, W.A.; et al. Approaching the dirac point in high-mobility multilayer epitaxial graphene. Phys. Rev. Lett. 2008, 101, 1–4. [Google Scholar] [CrossRef] [PubMed] [Green Version]
  21. Riley, P.R.; Narayan, R.J. Recent advances in carbon nanomaterials for biomedical applications: A review. Curr. Opin. Biomed. Eng. 2021, 17, 100262. [Google Scholar] [CrossRef]
  22. Sheng, K.; Sun, Y.; Li, C.; Yuan, W.; Shi, G. Ultrahigh-rate supercapacitors based on eletrochemically reduced graphene oxide for ac line-filtering. Sci. Rep. 2012, 2, 3–7. [Google Scholar] [CrossRef]
  23. Fu, C.; Zhao, G.; Zhang, H.; Li, S. Evaluation and characterization of reduced graphene oxide nanosheets as anode materials for lithium-ion batteries. Int. J. Electrochem. Sci. 2013, 8, 6269–6280. [Google Scholar]
  24. Zhou, M.; Zhai, Y.; Dong, S. Electrochemical sensing and biosensing platform based on chemically reduced graphene oxide. Anal. Chem. 2009, 81, 5603–5613. [Google Scholar] [CrossRef]
  25. Yin, Z.; Sun, S.; Salim, T.; Wu, S.; Huang, X.; He, Q.; Lam, Y.M.; Zhang, H. Organic photovoltaic devices using highly flexible reduced graphene oxide films as transparent electrodes. ACS Nano 2010, 4, 5263–5268. [Google Scholar] [CrossRef] [PubMed]
  26. Chauhan, D.S.; Quraishi, M.A.; Ansari, K.R.; Saleh, T.A. Graphene and graphene oxide as new class of materials for corrosion control and protection: Present status and future scenario. Prog. Org. Coatings 2020, 147, 105741. [Google Scholar] [CrossRef]
  27. Abid; Sehrawat, P.; Islam, S.S.; Mishra, P.; Ahmad, S. Reduced graphene oxide (rGO) based wideband optical sensor and the role of Temperature, Defect States and Quantum Efficiency. Sci. Rep. 2018, 8, 1–13. [Google Scholar] [CrossRef] [Green Version]
  28. Kim, J.M.; Hong, W.G.; Lee, S.M.; Chang, S.J.; Jun, Y.; Kim, B.H.; Kim, H.J. Energy storage of thermally reduced graphene oxide. Int. J. Hydrogen Energy 2014, 39, 3799–3804. [Google Scholar] [CrossRef]
  29. Iskandar, F.; Hikmah, U.; Stavila, E.; Aimon, A.H. Microwave-assisted reduction method under nitrogen atmosphere for synthesis and electrical conductivity improvement of reduced graphene oxide (rGO). RSC Adv. 2017, 7, 52391–52397. [Google Scholar] [CrossRef] [Green Version]
  30. Park, S.; An, J.; Potts, J.R.; Velamakanni, A.; Murali, S.; Ruoff, R.S. Hydrazine-reduction of graphite- and graphene oxide. Carbon 2011, 49, 3019–3023. [Google Scholar] [CrossRef]
  31. Williams, G.; Seger, B.; Kamt, P.V. TiO2-graphene nanocomposites. UV-assisted photocatalytic reduction of graphene oxide. ACS Nano 2008, 2, 1487–1491. [Google Scholar] [CrossRef]
  32. Feng, X.; Chen, W.; Yan, L. Electrochemical reduction of bulk graphene oxide materials. RSC Adv. 2016, 6, 80106–80113. [Google Scholar] [CrossRef]
  33. Pousa Soares, C.P.; de Lacerda Baptista, R.; Cesar, D.V. Solvothermal reduction of graphite oxide using alcohols. Mater. Res. 2018, 21, 20170726. [Google Scholar] [CrossRef] [Green Version]
  34. You, R.; Liu, Y.Q.; Hao, Y.L.; Han, D.D.; Zhang, Y.L.; You, Z. Laser Fabrication of Graphene-Based Flexible Electronics. Adv. Mater. 2020, 32, 1–22. [Google Scholar] [CrossRef]
  35. Narayan, J.; White, C.W. Pulsed laser melting of amorphous silicon layers. Appl. Phys. Lett. 1984, 44, 35–37. [Google Scholar] [CrossRef]
  36. Gupta, S. Structural Evolution of Novel Nonequilibrium Phases in Carbon and Boron Nitride via Liquid Phase Ultrafast Regrowth; North Carolina State University: Raleigh, NC, USA, 2020. [Google Scholar]
  37. Narayan, J.; Bhaumik, A.; Gupta, S.; Joshi, P.; Riley, P.; Narayan, R.J. Formation of self-organized nano- and micro-diamond rings. Mater. Res. Lett. 2021, 9, 300–307. [Google Scholar] [CrossRef]
  38. Narayan, J.; Bhaumik, A.; Gupta, S.; Joshi, P.; Riley, P.; Narayan, R.J. Role of Q-carbon in nucleation and formation of continuous diamond film. Carbon N. Y. 2021, 176, 558–568. [Google Scholar] [CrossRef]
  39. Lin, J.; Peng, Z.; Liu, Y.; Ruiz-Zepeda, F.; Ye, R.; Samuel, E.L.G.; Yacaman, M.J.; Yakobson, B.I.; Tour, J.M. Laser-induced porous graphene films from commercial polymers. Nat. Commun. 2014, 5, 5–12. [Google Scholar] [CrossRef]
  40. Ye, R.; Han, X.; Kosynkin, D.V.; Li, Y.; Zhang, C.; Jiang, B.; Martí, A.A.; Tour, J.M. Laser-Induced Conversion of Teflon into Fluorinated Nanodiamonds or Fluorinated Graphene. ACS Nano 2018, 12, 1083–1088. [Google Scholar] [CrossRef]
  41. Zhang, Z.; Song, M.; Hao, J.; Wu, K.; Li, C.; Hu, C. Visible light laser-induced graphene from phenolic resin: A new approach for directly writing graphene-based electrochemical devices on various substrates. Carbon N. Y. 2018, 127, 287–296. [Google Scholar] [CrossRef]
  42. Lamberti, A.; Serrapede, M.; Ferraro, G.; Fontana, M.; Perrucci, F.; Bianco, S.; Chiolerio, A.; Bocchini, S. All-SPEEK flexible supercapacitor exploiting Laser-induced graphenization. 2D Mater. 2017, 4, 035012. [Google Scholar] [CrossRef]
  43. Joshi, P.; Riley, P.; Gupta, S.; Narayan, R.J.; Narayan, J. Advances in laser-assisted conversion of polymeric and graphitic carbon into nanodiamond films. Nanotechnology 2021, 32, 432001. [Google Scholar] [CrossRef]
  44. Schumann, M.; Sauerbrey, R.; Smayling, M.C. Permanent increase of the electrical conductivity of polymers induced by ultraviolet laser radiation. Appl. Phys. Lett. 1991, 58, 428–430. [Google Scholar] [CrossRef]
  45. Ptfe, T.; Teflon PTFE®. rjchase.com. Deels Teflon—PTFE | Deels. Available online: http://www.rjchase.com/ptfe_handbook.pdf (accessed on 23 September 2021).
  46. Penchev, H.; Ublekov, F.; Budurova, D.; Sinigersky, V. Novel electrospun polybenzimidazole fibers and yarns from ethanol/potassium hydroxide solution. Mater. Lett. 2017, 187, 89–93. [Google Scholar] [CrossRef]
  47. Surmenev, R.A.; Surmeneva, M.A.; Grubova, I.Y.; Chernozem, R.V.; Krause, B.; Baumbach, T.; Loza, K.; Epple, M. RF magnetron sputtering of a hydroxyapatite target: A comparison study on polytetrafluorethylene and titanium substrates. Appl. Surf. Sci. 2017, 414, 335–344. [Google Scholar] [CrossRef]
  48. Joshi, P.; Gupta, S.; Riley, P.R.; Narayan, R.J.; Narayan, J. Liquid phase regrowth of 〈110〉 nanodiamond film by UV laser annealing of PTFE to generate dense CVD microdiamond film. Diam. Relat. Mater. 2021, 117, 108481. [Google Scholar] [CrossRef]
  49. Lebedev, Y.A.; Korolev, Y.M.; Polikarpov, V.M.; Ignat’ev, L.N.; Antipov, E.M. X-Ray powder diffraction study of polytetrafluoroethylene. Crystallogr. Rep. 2010, 55, 609–614. [Google Scholar] [CrossRef]
  50. Hermans, P.H.; Weidinger, A. On the determination of the crystalline fraction of polyethylenes from X-ray diffraction. Die Makromol. Chem. 1961, 44, 24–36. [Google Scholar] [CrossRef]
  51. Sperati, C.A.; Starkweather, H.W. Fluorine-containing polymers. II. Polytetrafluoroethylene. In Fortschritte Der Hochpolymeren-Forschung 1961; Springer: Berlin/Heidelberg, Germany, 1961; pp. 465–495. [Google Scholar] [CrossRef]
  52. Saleem, H.; Haneef, M.; Abbasi, H.Y. Synthesis route of reduced graphene oxide via thermal reduction of chemically exfoliated graphene oxide. Mater. Chem. Phys. 2018, 204, 1–7. [Google Scholar] [CrossRef]
  53. Al-Gaashani, R.; Najjar, A.; Zakaria, Y.; Mansour, S.; Atieh, M.A. XPS and structural studies of high quality graphene oxide and reduced graphene oxide prepared by different chemical oxidation methods. Ceram. Int. 2019, 45, 14439–14448. [Google Scholar] [CrossRef]
  54. Siburian, R.; Sihotang, H.; Lumban Raja, S.; Supeno, M.; Simanjuntak, C. New route to synthesize of graphene nano sheets. Orient. J. Chem. 2018, 34, 182–187. [Google Scholar] [CrossRef] [Green Version]
  55. Stobinski, L.; Lesiak, B.; Malolepszy, A.; Mazurkiewicz, M.; Mierzwa, B.; Zemek, J.; Jiricek, P.; Bieloshapka, I. Graphene oxide and reduced graphene oxide studied by the XRD, TEM and electron spectroscopy methods. J. Electron Spectros. Relat. Phenomena 2014, 195, 145–154. [Google Scholar] [CrossRef]
  56. Boukhoubza, I.; Khenfouch, M.; Achehboune, M.; Mothudi, B.M.; Zorkani, I.; Jorio, A. X-ray diffraction investigations of nanostructured ZnO coated with reduced graphene oxide. J. Phys. Conf. Ser. 2019, 1292, 012011. [Google Scholar] [CrossRef]
  57. Ouederni, M. Polymers in textiles. In Polymer Science and Innovative Applications; Elsevier: Amsterdam, The Netherlands, 2020; pp. 331–363. [Google Scholar]
  58. Bokobza, L.; Bruneel, J.L.; Couzi, M. Raman spectroscopy as a tool for the analysis of carbon-based materials (highly oriented pyrolitic graphite, multilayer graphene and multiwall carbon nanotubes) and of some of their elastomeric composites. Vib. Spectrosc. 2014, 74, 57–63. [Google Scholar] [CrossRef]
  59. Koenig, J.L.; Boerio, F.J. Raman scattering and band assignments in polytetrafluoroethylene. J. Chem. Phys. 1969, 50, 2823–2829. [Google Scholar] [CrossRef]
  60. Schmälzlin, E.; Moralejo, B.; Rutowska, M.; Monreal-Ibero, A.; Sandin, C.; Tarcea, N.; Popp, J.; Roth, M.M. Raman imaging with a fiber-coupled multichannel spectrograph. Sensors (Switz.) 2014, 14, 21968–21980. [Google Scholar] [CrossRef] [Green Version]
  61. Shen, J.T.; Pei, Y.T.; De Hosson, J.T.M. Structural changes in polytetrafluoroethylene molecular chains upon sliding against steel. J. Mater. Sci. 2014, 49, 1484–1493. [Google Scholar] [CrossRef]
  62. Lehnert, R.J.; Hendra, P.J.; Everall, N. Crystallinity of poly(tetrafluoroethylene) using Raman spectroscopy. Polymer 1995, 36, 2473–2476. [Google Scholar] [CrossRef]
  63. Kaniyoor, A.; Ramaprabhu, S. A Raman spectroscopic investigation of graphite oxide derived graphene. AIP Adv. 2012, 2. [Google Scholar] [CrossRef] [Green Version]
  64. Ma, B.; Rodriguez, R.D.; Ruban, A.; Pavlov, S.; Sheremet, E. The correlation between electrical conductivity and second-order Raman modes of laser-reduced graphene oxide. Phys. Chem. Chem. Phys. 2019, 21, 10125–10134. [Google Scholar] [CrossRef]
  65. Tuinstra, F. Koenig Jl Raman spectrum of graphite. J. Chem. Phys. 1970, 53, 1126–1130. [Google Scholar] [CrossRef] [Green Version]
  66. Nemanich, R.J.; Solin, S.A. First- and second-order Raman scattering from finite-size crystals of graphite. Phys. Rev. B 1979, 20, 392–401. [Google Scholar] [CrossRef]
  67. Hu, M.; Yao, Z.; Wang, X. Characterization techniques for graphene-based materials in catalysis. AIMS Mater. Sci. 2017, 4, 755–788. [Google Scholar] [CrossRef]
  68. Brown, S.D.M.; Souza Filho, A.G.; Lieber, C.M.; Dresselhaus, m·s.; Pimenta, M.A.; Jorio, A.; Dresselhaus, G.; Hafner, J.H.; Saito, R. Diameter dependence of the Raman (formula presented)-band in isolated single-wall carbon nanotubes. Phys. Rev. B—Condens. Matter Mater. Phys. 2001, 64, 041401. [Google Scholar] [CrossRef]
  69. Haque, A.; Gupta, S.; Narayan, J. Characteristics of diamond deposition on Al2O3, diamond-like carbon, and Q-carbon. ACS Appl. Electron. Mater. 2020, 2, 1323–1334. [Google Scholar] [CrossRef]
  70. Shen, J.; Li, T.; Long, Y.; Shi, M.; Li, N.; Ye, M. One-step solid state preparation of reduced graphene oxide. Carbon N. Y. 2012, 50, 2134–2140. [Google Scholar] [CrossRef]
  71. Vollebregt, S.; Ishihara, R.; Tichelaar, F.D.; Hou, Y.; Beenakker, C.I.M. Influence of the growth temperature on the first and second-order Raman band ratios and widths of carbon nanotubes and fibers. Carbon N. Y. 2012, 50, 3542–3554. [Google Scholar] [CrossRef]
  72. Perumbilavil, S.; Sankar, P.; Priya Rose, T.; Philip, R. White light Z-scan measurements of ultrafast optical nonlinearity in reduced graphene oxide nanosheets in the 400-700 nm region. Appl. Phys. Lett. 2015, 107, 051104. [Google Scholar] [CrossRef]
  73. Tuinstra, F.; Koenig, J.L. Characterization of Graphite Fiber Surfaces with Raman Spectroscopy. J. Compos. Mater. 1970, 4, 492–499. [Google Scholar] [CrossRef]
  74. Ferrari, A.C.; Meyer, J.C.; Scardaci, V.; Casiraghi, C.; Lazzeri, M.; Mauri, F.; Piscanec, S.; Jiang, D.; Novoselov, K.S.; Roth, S.; et al. Raman spectrum of graphene and graphene layers. Phys. Rev. Lett. 2006, 97, 187401. [Google Scholar] [CrossRef] [PubMed] [Green Version]
  75. Wang, H.; Wen, Y.; Peng, H.; Zheng, C.; Li, Y.; Wang, S.; Sun, S.; Xie, X.; Zhou, X. Grafting polytetrafluoroethylene micropowder via in situ electron beam irradiation-induced polymerization. Polymers 2018, 10, 503. [Google Scholar] [CrossRef] [Green Version]
  76. Yamauchi, K.; Yao, Y.; Ochiai, T.; Sakai, M.; Kubota, Y.; Yamauchi, G. Antibacterial activity of hydrophobic composite materials containing a visible-light-sensitive photocatalyst. J. Nanotechnol. 2011, 2011, 380979. [Google Scholar] [CrossRef] [Green Version]
  77. Piwowarczyk, J.; Jedrzejewski, R.; Moszyński, D.; Kwiatkowski, K.; Niemczyk, A.; Baranowska, J. XPS and FTIR studies of polytetrafluoroethylene thin films obtained by physical methods. Polymers 2019, 11, 1629. [Google Scholar] [CrossRef] [PubMed] [Green Version]
  78. Talonen, P.; Sundholm, G.; Li, W.H.; Floate, S.; Nichols, R.J. A combined in situ infrared spectroscopy and scanning tunnelling microscopy study of ethyl xanthate adsorption on Au(111). Phys. Chem. Chem. Phys. 1999, 1, 3661–3666. [Google Scholar] [CrossRef]
  79. Lu, J.; Li, Y.; Li, S.; Jiang, S.P. Self-assembled platinum nanoparticles on sulfonic acid-grafted graphene as effective electrocatalysts for methanol oxidation in direct methanol fuel cells. Sci. Rep. 2016, 6, 1–12. [Google Scholar] [CrossRef] [PubMed]
  80. Tien, H.N.; Hur, S.H. One-step synthesis of a highly conductive graphene-polypyrrole nanofiber composite using a redox reaction and its use in gas sensors. Phys. Status Solidi—Rapid Res. Lett. 2012, 6, 379–381. [Google Scholar] [CrossRef]
  81. Bora, C.; Bharali, P.; Baglari, S.; Dolui, S.K.; Konwar, B.K. Strong and conductive reduced graphene oxide/polyester resin composite films with improved mechanical strength, thermal stability and its antibacterial activity. Compos. Sci. Technol. 2013, 87, 1–7. [Google Scholar] [CrossRef]
  82. Faniyi, I.O.; Fasakin, O.; Olofinjana, B.; Adekunle, A.S.; Oluwasusi, T.V.; Eleruja, M.A.; Ajayi, E.O.B. The comparative analyses of reduced graphene oxide (RGO) prepared via green, mild and chemical approaches. SN Appl. Sci. 2019, 1, 1–7. [Google Scholar] [CrossRef] [Green Version]
  83. Sharma, V.; Jain, Y.; Kumari, M.; Gupta, R.; Sharma, S.K.; Sachdev, K. Synthesis and Characterization of Graphene Oxide (GO) and Reduced Graphene Oxide (rGO) for Gas Sensing Application. Macromol. Symp. 2017, 376. [Google Scholar] [CrossRef]
  84. Dake, S.B.; Rajopadhye, N.R.; Bhoraskar, S. V Evaluation and characterisation of chemically modified polymers as secondary electron emitters. J. Phys. D Appl. Phys. 1987, 20, 1631–1636. [Google Scholar] [CrossRef]
  85. Herman, P.R.; Chen, B.; Moore, D.J. Vacuum ultraviolet laser ablation of Teflon (PTFE). In Proceedings of the Materials Research Society Symposium Proceedings; Cambridge University Press: Cambridge, UK, 1993; Volume 285, pp. 163–168. [Google Scholar]
  86. Bidin, N.; Ab Razak, S.N. ArF Excimer Laser Annealing of Polycrystalline Silicon Thin Film. In Crystallization—Science and Technology; InTech: London, UK, 2012. [Google Scholar]
  87. Ono, M.; Yamane, H.; Fukagawa, H.; Kera, S.; Yoshimura, D.; Okudaira, K.K.; Morikawa, E.; Seki, K.; Ueno, N. UPS study of VUV-photodegradation of polytetrafluoroethylene (PTFE) ultrathin film by using synchrotron radiation. Nucl. Instrum. Methods Phys. Res. Sect. B Beam Interact. Mater. At. 2005, 236, 377–382. [Google Scholar] [CrossRef]
  88. Adami, M.; Guzman, L.; Man, B.Y.; Miotello, A.; Ossi, P.M. High temperature ion beam erosion of polytetrafluoroethylene. Thin Solid Films 2004, 459, 318–322. [Google Scholar] [CrossRef]
  89. Madorsky, S.I.; Hart, V.; Straus, S.; Sedlak, V.A. Thermal degradation of tetrafluoroethylene and hydrofluoroethylene polymers in a vacuum. J. Res. Natl. Bur. Stand. 1953, 51, 327. [Google Scholar] [CrossRef]
  90. Longo, A.; Verucchi, R.; Aversa, L.; Tatti, R.; Ambrosio, A.; Orabona, E.; Coscia, U.; Carotenuto, G.; Maddalena, P. Graphene oxide prepared by graphene nanoplatelets and reduced by laser treatment. Nanotechnology 2017, 28, 224002. [Google Scholar] [CrossRef] [PubMed]
  91. Sun, P.; Li, Z.; Jin, L.; Yang, Y.; Wang, S.; Yin, X.; Wang, Y. Pre-Oxidized Acrylic Fiber Reinforced Ferric Sulfophenyl Phosphate-Doped Polybenzimidazole-Based high-temperature proton exchange membrane. Macromol. Mater. Eng. 2017, 302. [Google Scholar] [CrossRef]
  92. Asadi Tashvigh, A.; Chung, T.S. Robust polybenzimidazole (PBI) hollow fiber membranes for organic solvent nanofiltration. J. Memb. Sci. 2019, 572, 580–587. [Google Scholar] [CrossRef]
  93. Sun, G.; Zhang, M.; Chen, N.; Niu, H.; Qi, S.; Wu, D. Fabrication of ultrahigh-strength polybenzimidazole fibers via a novel and green integrated liquid crystal spinning process. Macromol. Mater. Eng. 2020, 305, 1900717. [Google Scholar] [CrossRef]
  94. Daletou, M.K.; Geormezi, M.; Vogli, E.; Voyiatzis, G.A.; Neophytides, S.G. The interaction of H3PO4 and steam with PBI and TPS polymeric membranes. A TGA and Raman study. J. Mater. Chem. A 2014, 2, 1117–1127. [Google Scholar] [CrossRef]
  95. Conti, F.; Majerus, A.; Di Noto, V.; Korte, C.; Lehnert, W.; Stolten, D. Raman study of the polybenzimidazole-phosphoric acid interactions in membranes for fuel cells. Phys. Chem. Chem. Phys. 2012, 14, 10022–10026. [Google Scholar] [CrossRef] [Green Version]
  96. Claramunt, S.; Varea, A.; López-Díaz, D.; Velázquez, M.M.; Cornet, A.; Cirera, A. The importance of interbands on the interpretation of the raman spectrum of graphene oxide. J. Phys. Chem. C 2015, 119, 10123–10129. [Google Scholar] [CrossRef]
  97. López-Díaz, D.; López Holgado, M.; García-Fierro, J.L.; Velázquez, M.M. Evolution of the raman spectrum with the chemical composition of graphene oxide. J. Phys. Chem. C 2017, 121, 20489–20497. [Google Scholar] [CrossRef]
  98. Ferrari, A.C.; Robertson, J. Resonant Raman spectroscopy of disordered, amorphous, and diamondlike carbon. Phys. Rev. B—Condens. Matter Mater. Phys. 2001, 64, 075414. [Google Scholar] [CrossRef] [Green Version]
  99. Riley, P.R.; Joshi, P.; Azizi Machekposhti, S.; Sachan, R.; Narayan, J.; Narayan, R.J. Enhanced Vapor Transmission Barrier Properties via Silicon-Incorporated Diamond-Like Carbon Coating. Polymers 2021, 13, 3543. [Google Scholar] [CrossRef] [PubMed]
  100. Joshi, P.; Haque, A.; Gupta, S.; Narayan, R.J.; Narayan, J. Synthesis of multifunctional microdiamonds on stainless steel substrates by chemical vapor deposition. Carbon N. Y. 2021, 171, 739–749. [Google Scholar] [CrossRef]
  101. Anandhan, S.; Ponprapakaran, K.; Senthil, T.; George, G. Parametric study of manufacturing ultrafine polybenzimidazole fibers by electrospinning. Int. J. Plast. Technol. 2012, 16, 101–116. [Google Scholar] [CrossRef]
  102. Jean-Fulcrand, A.; Masen, M.A.; Bremner, T.; Wong, J.S.S. Effect of temperature on tribological performance of polyetheretherketone-polybenzimidazole blend. Tribol. Int. 2019, 129, 5–15. [Google Scholar] [CrossRef]
  103. Kumar, V.V.; Kumar, C.R.; Suresh, A.; Jayalakshmi, S.; Mudali, U.K.; Sivaraman, N. Evaluation of polybenzimidazole-based polymers for the removal of uranium, thorium and palladium from aqueous medium. R. Soc. Open Sci. 2018, 5, 171701. [Google Scholar] [CrossRef] [Green Version]
  104. Fei, M.; Lin, R.; Deng, Y.; Xian, H.; Bian, R.; Zhang, X.; Cheng, J.; Xu, C.; Cai, D. Polybenzimidazole/Mxene composite membranes for intermediate temperature polymer electrolyte membrane fuel cells. Nanotechnology 2018, 29, 035403. [Google Scholar] [CrossRef] [PubMed]
  105. Kushwaha, O.S.; Avadhani, C.V.; Singh, R.P. Photo-oxidative degradation of polybenzimidazole derivative membrane. Adv. Mater. Lett. 2013, 4, 762–768. [Google Scholar] [CrossRef]
  106. Ossonon, B.D.; Bélanger, D. Synthesis and characterization of sulfophenyl-functionalized reduced graphene oxide sheets. RSC Adv. 2017, 7, 27224–27234. [Google Scholar] [CrossRef] [Green Version]
  107. Riley, P.R.; Joshi, P.; Narayan, J.; Narayan, R.J. Enhanced nucleation and large-scale growth of CVD diamond via surface-modification of silicon-incorporated diamond-like carbon thin films. Diam. Relat. Mater. 2021, 120, 108630. [Google Scholar] [CrossRef]
  108. Gong, Y.; Li, D.; Fu, Q.; Pan, C. Influence of graphene microstructures on electrochemical performance for supercapacitors. Prog. Nat. Sci. Mater. Int. 2015, 25, 379–385. [Google Scholar] [CrossRef] [Green Version]
  109. Anand, S.; Muthusamy, A.; Dineshkumar, S.; Kannapiran, N. Synthesis, characterization, optical, thermal and electrical properties of polybenzimidazoles. J. Macromol. Sci. Part A Pure Appl. Chem. 2018, 55, 243–252. [Google Scholar] [CrossRef]
  110. Brown, J.R.; Burchill, P.J.; George, G.A.; Power, A.J. The photodegradation of poly 2,2′-(m-phenylene)-5,5′-bibenzimidazole. J. Polym. Sci. Polym. Symp. 2007, 49, 239–247. [Google Scholar] [CrossRef]
  111. Chatfield, D.A.; Einhorn, I.N. Stepwise thermal degradation of a polybenzimidazole foam. J. Polym. Sci. A 1981, 19, 601–618. [Google Scholar] [CrossRef]
Figure 1. Schematic of the PLA procedure used in the experiment.
Crystals 11 01308 g001
Figure 2. XRD pattern of (a) neat PTFE and (b) after laser annealing of PTFE.
Crystals 11 01308 g002
Figure 3. FESEM images of (a) as-received PTFE and (b) PTFE after laser annealing (rGO). (c) EBSD Kikuchi pattern from rGO, exhibiting the characteristic rGO pattern.
Crystals 11 01308 g003
Figure 4. Raman spectra of (a) PTFE before PLA and (b) PTFE after 30 shots of the ArF laser at 0.9 ± 0.1 J·cm−2. (c) ID/IG values versus the number of laser shots.
Crystals 11 01308 g004
Figure 5. FTIR spectra of (a) as-received PTFE and (b) PTFE after the laser-annealing process.
Crystals 11 01308 g005
Figure 6. Schematic showing the direct conversion of PTFE into rGO, using ArF-laser annealing.
Crystals 11 01308 g006
Figure 7. XRD pattern of (a) as-received PBI and (b) after laser annealing of PBI.
Crystals 11 01308 g007
Figure 8. FESEM images of (a) as-received PBI and (b) PBI after the laser annealing (rGO).
Crystals 11 01308 g008
Figure 9. Raman spectra of (a) PBI before PLA and (b) PBI after exposure to multiple shots of the ArF laser at 0.7 ± 0.1 J·cm−2. (c) ID/IG ratio versus the number of laser shots.
Crystals 11 01308 g009
Figure 10. FTIR spectra of (a) non-processed PBI and (b) rGO after laser processing of PBI.
Crystals 11 01308 g010
Publisher’s Note: MDPI stays neutral with regard to jurisdictional claims in published maps and institutional affiliations.

