
A Method for Determining the Workability Diagram by Varying Friction Conditions in the Upsetting of a Cylinder between Flat Dies

 , ,
, ,  ,
,  and
and
Abstract
:1. Introduction
2. Theoretical Basis
3. Design of Experiment
4. Experimental Results
5. Workability Diagram
6. Conclusions
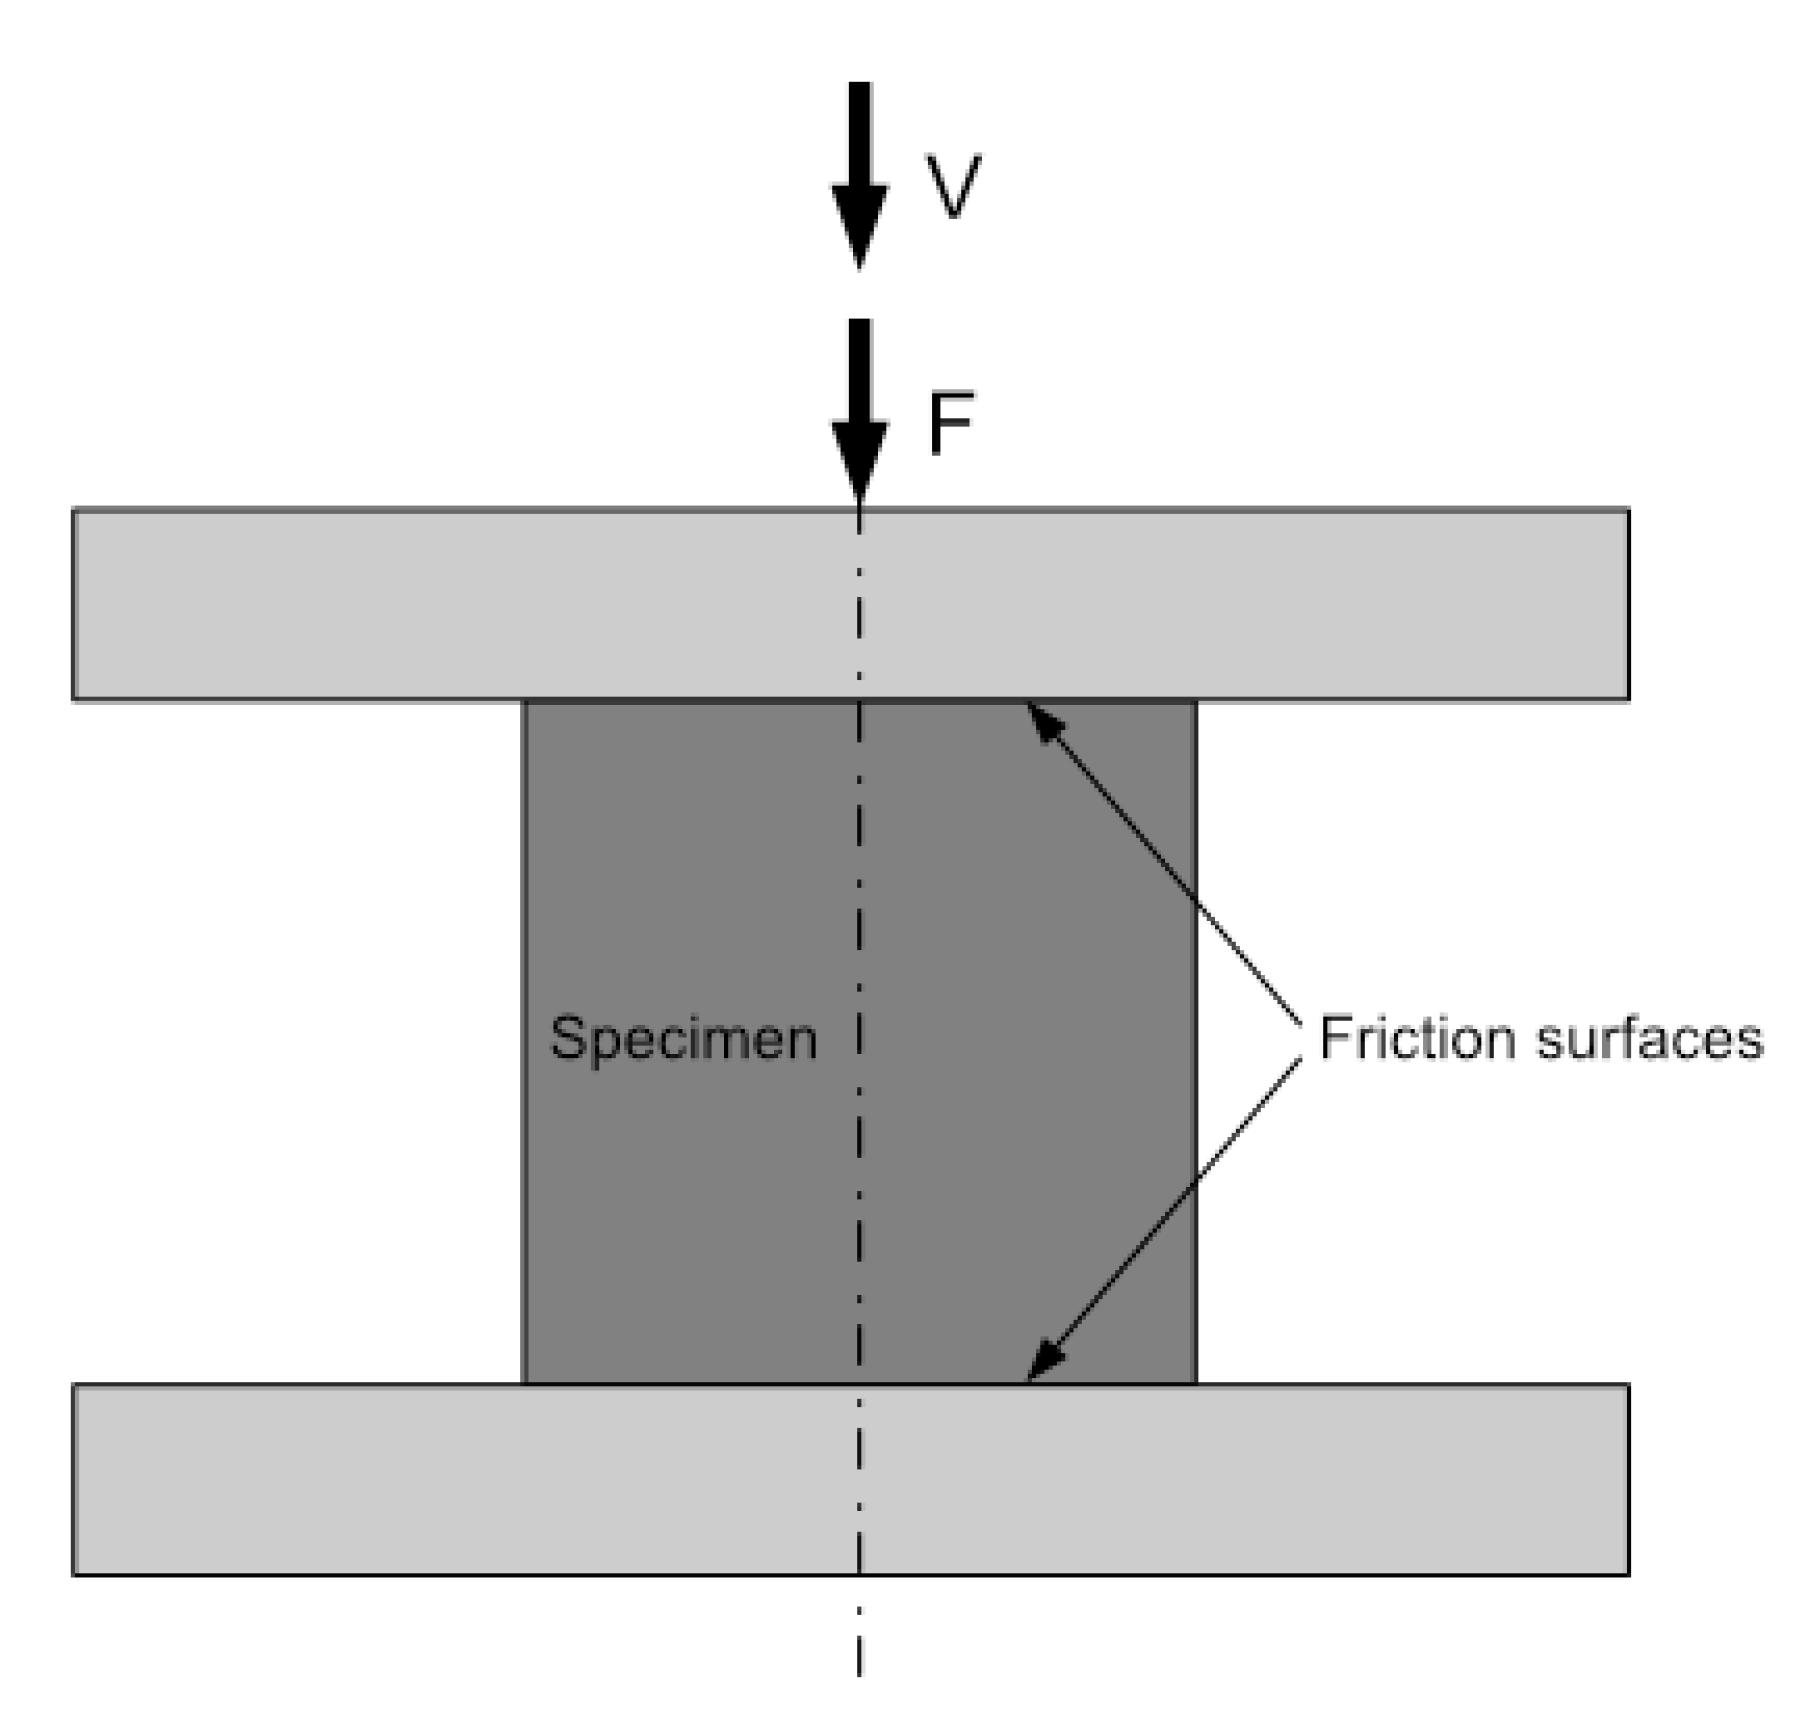
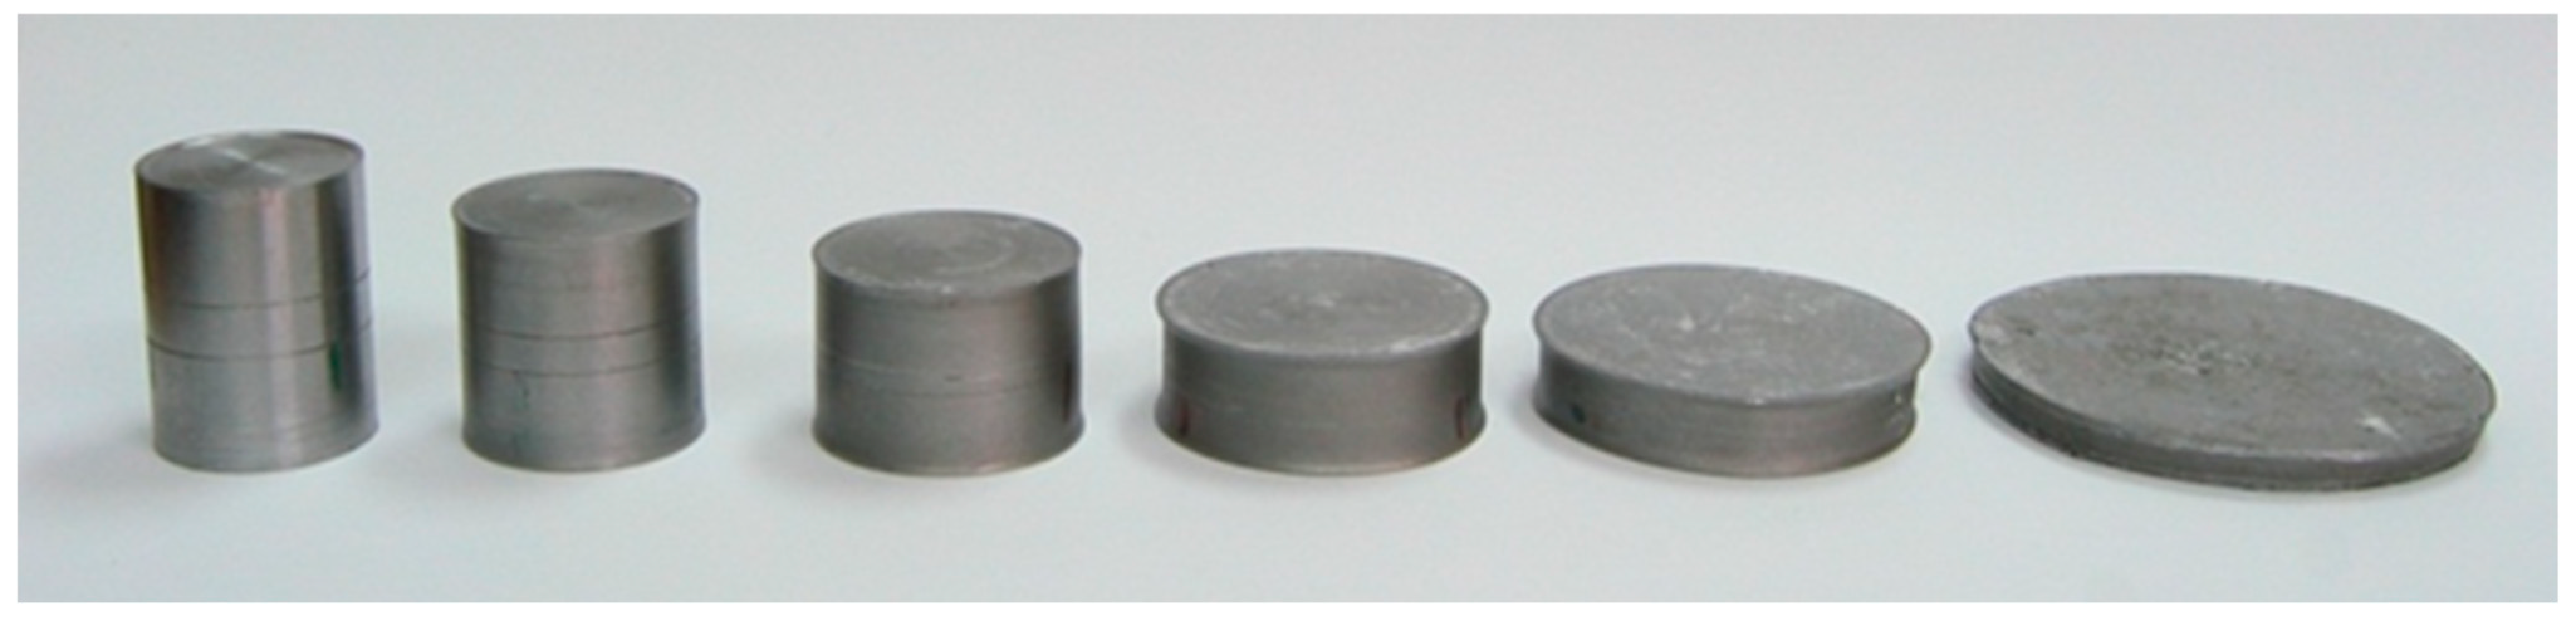
- Compared to other methods, the new method requires specimens of very simple shape (circular cylinders) and very simple dies (flat dies);
- Neither experimental nor numerical determination of stress components is required at the site of ductile fracture initiation;
- The friction law’s formulation is not required, though the friction stress is the agent for varying the state of stress and strain at the site of ductile fracture initiation;
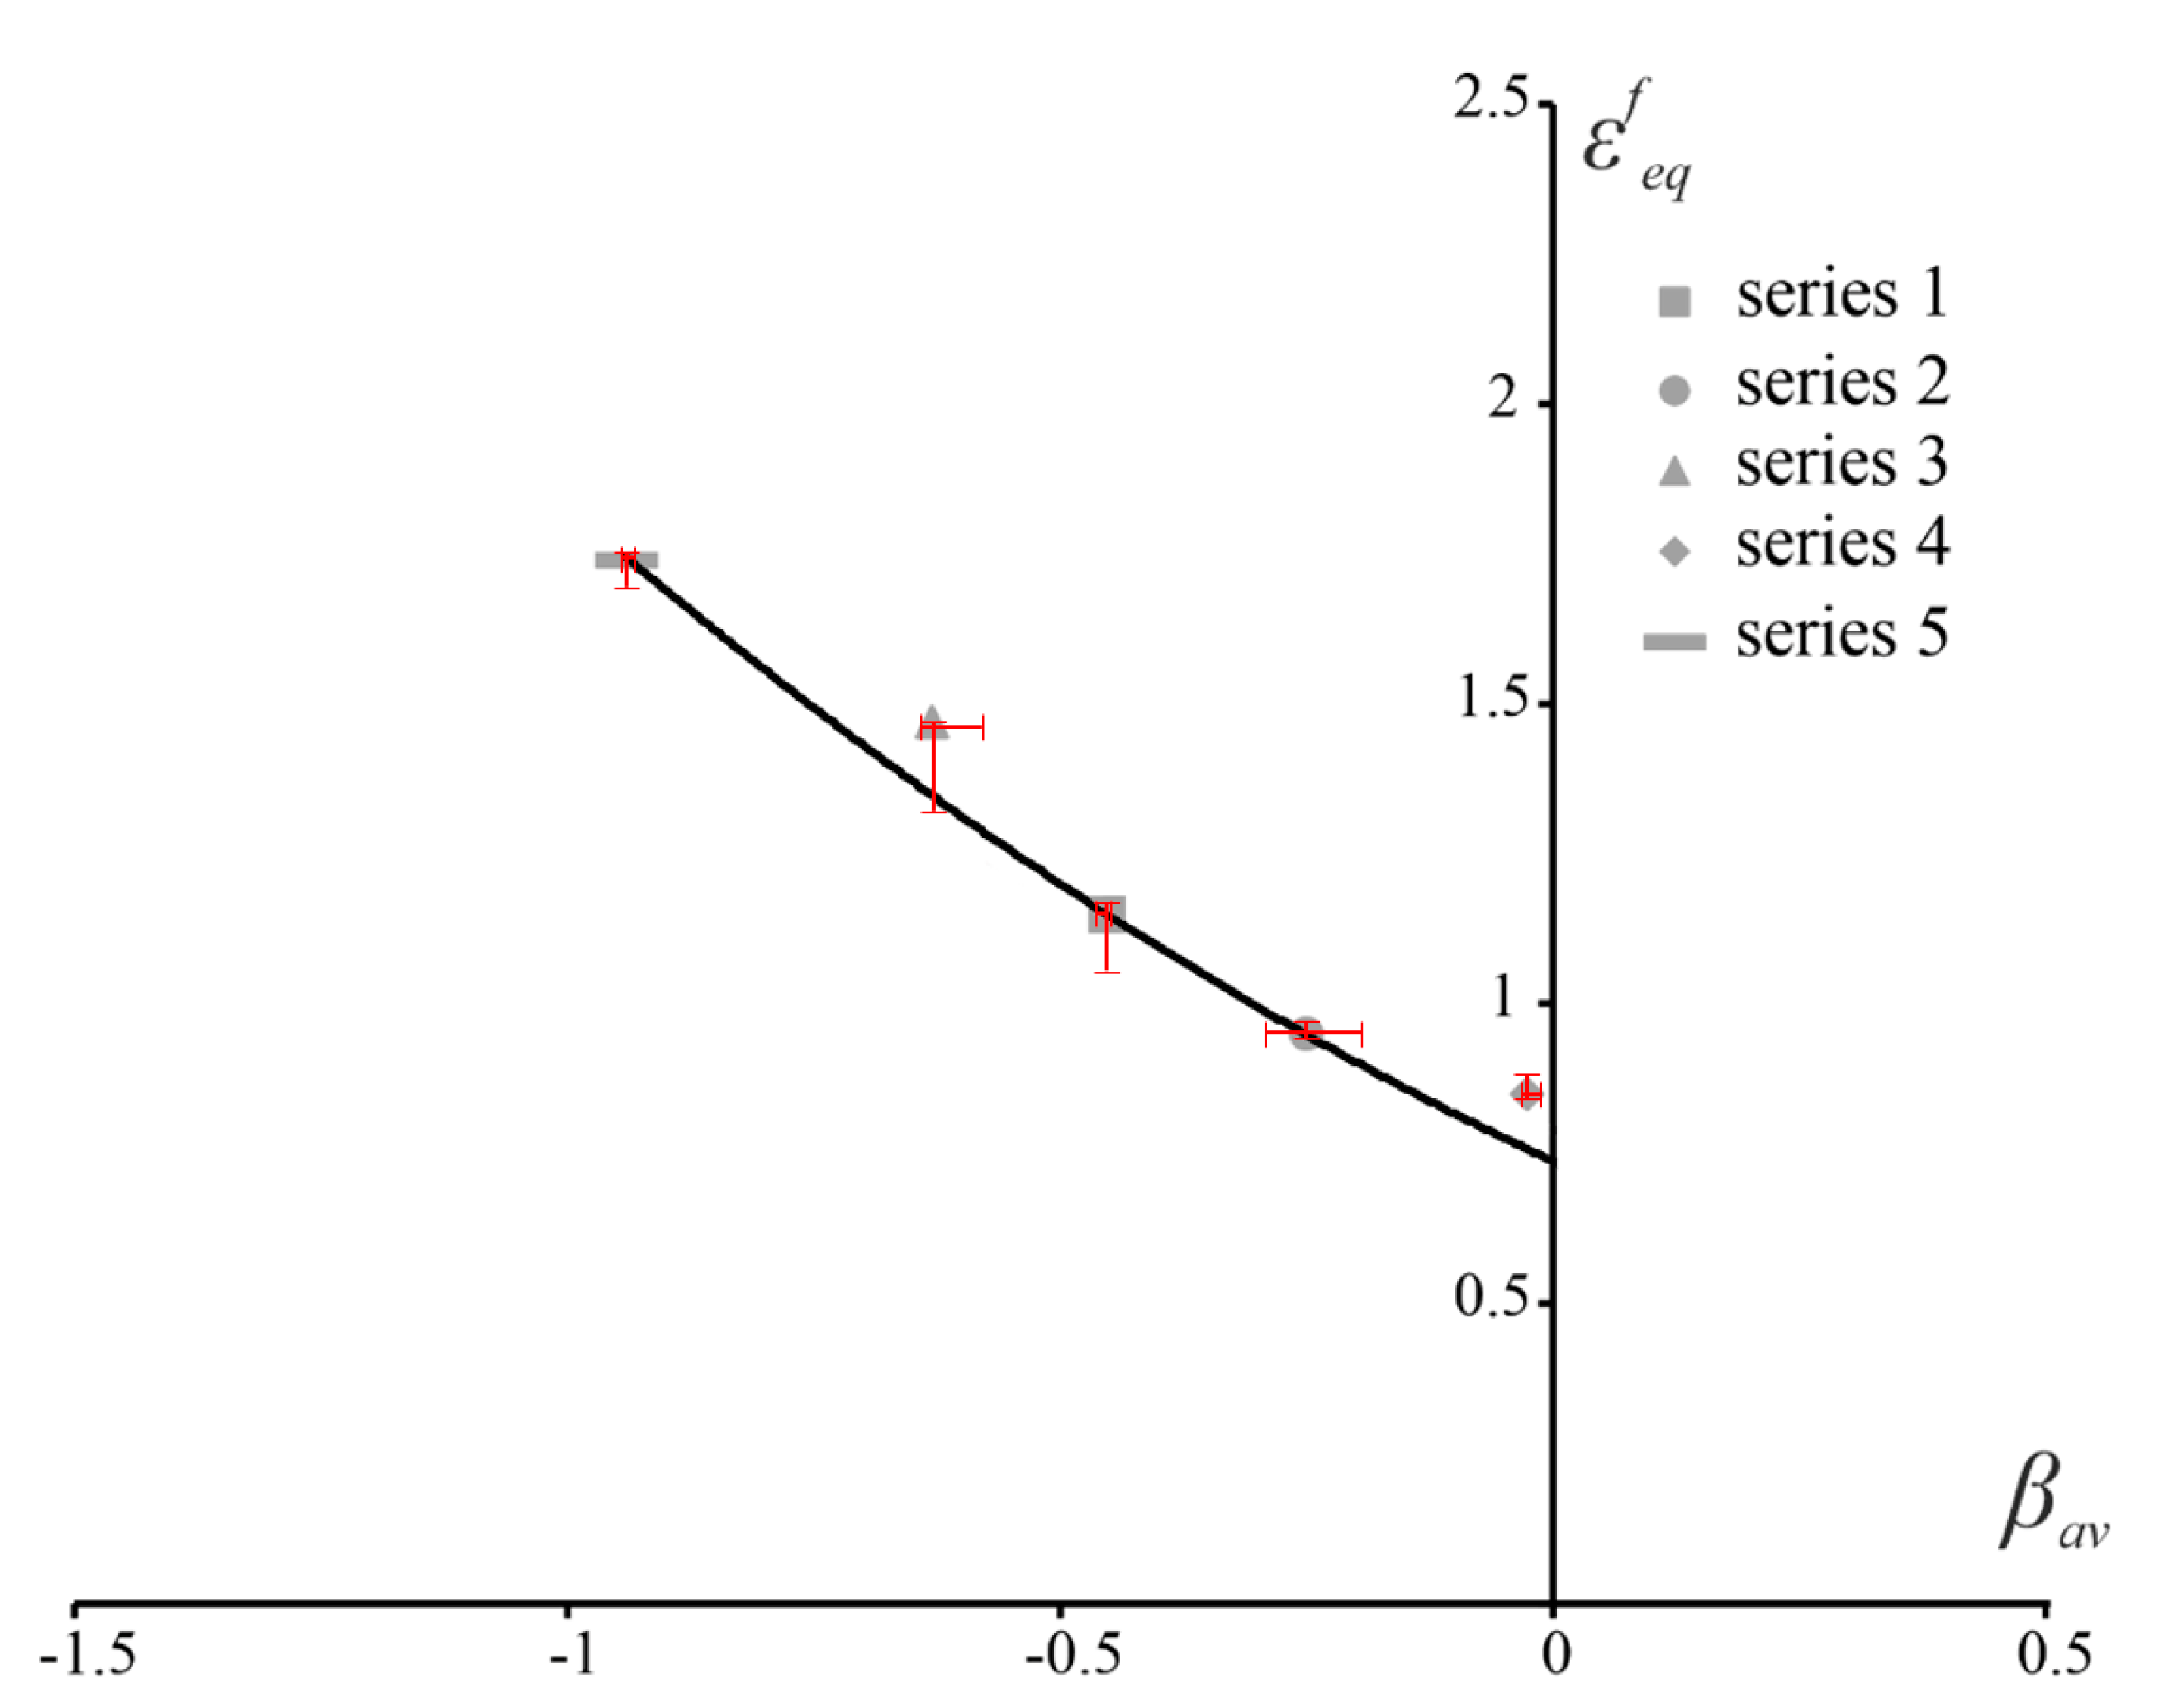
- It has been confirmed by comparing the workability diagrams available from the literature and determined in the present paper that the new method is reliable (Figure 6);
- The new method covers the range of the average stress triaxiality between −1 to 0, approximately (Figure 6). It can be combined with specimens of various geometric shapes to extend this range. This will be the subject of a subsequent investigation.
Author Contributions
Funding
Conflicts of Interest
References
- Cockcroft, M.G.; Latham, D.J. Ductility and the Workability of Metals. J. Inst. Met. 1968, 96, 33–39. [Google Scholar]
- Oyane, M.; Sato, T.; Okimoto, K.; Shima, S. Criteria for ductile fracture and their applications. J. Mech. Work. Technol. 1980, 4, 65–81. [Google Scholar] [CrossRef]
- Atkins, A.G. Fracture in forming. J. Mater. Process. Technol. 1996, 56, 609–618. [Google Scholar] [CrossRef]
- Yang, Z.; Zhao, C.; Dong, G.; Chen, Z.; Sun, Y.; Jia, X. Forming limit prediction of AA7075-T6 sheet based on ductile fracture criterion and the error analysis of parameters calibration. Int. J. Mater. Form. 2021, 14, 341–359. [Google Scholar] [CrossRef]
- Li, X.; Yang, W.; Xu, D.; Ju, K.; Chen, J. A new ductile fracture criterion considering both shear and tension mechanisms on void coalescence. Int. J. Damage Mech. 2021, 30, 374–398. [Google Scholar] [CrossRef]
- Bao, Y.; Wierzbicki, T. A Comparative Study on Various Ductile Crack Formation Criteria. J. Eng. Mater. Technol. Trans. 2004, 126, 314–324. [Google Scholar] [CrossRef]
- Wierzbicki, T.; Bao, Y.; Lee, Y.-W.; Bai, Y. Calibration and evaluation of seven fracture models. Int. J. Mech. Sci. 2005, 47, 719–743. [Google Scholar] [CrossRef]
- Vilotic, D.; Alexandrov, S.; Ivanisevic, A.; Milutinovic, M. Reducibility of Stress-Based Workability Diagram to Strain-Based Workability Diagram. Int. J. Appl. Mech. 2016, 8, 1–10. [Google Scholar] [CrossRef]
- Reiss, W.; Pöhlandt, K. The Rastegaev upset test—A method to compress large material volumes homogeneously. Exp. Tech. 1986, 10, 20–24. [Google Scholar] [CrossRef]
- Alexandrov, S.; Vilotic, D.; Konjovic, Z.; Vilotic, M. An Improved Experimental Method for Determining the Workability Diagram. Exp. Mech. 2013, 53, 699–711. [Google Scholar] [CrossRef]
- Sljapic, V.; Hartley, P.; Pillinger, I. Observations on fracture in axi-symmetric and three-dimensional cold upsetting of brass. J. Mater. Process. Technol. 2002, 125–126, 267–274. [Google Scholar] [CrossRef]
- Sivaraman, A.; Chakkingal, U. Investigations on workability of commercial purity aluminum processed by equal channel angular pressing. J. Mater. Process. Technol. 2008, 202, 543–548. [Google Scholar] [CrossRef]
- Wang, Y.; Yang, S.; Zhou, T.; Hou, L.; Ba, L.; Fautrelle, Y.; Ren, Z.; Zhu, Y.; Li, Z.; Li, X. Microstructure evolution and mechanical behavior of Ni-rich Ni-Mn-Ga alloys under compressive and tensile stresses. J. Mater. Sci. Technol. 2022, 97, 113–122. [Google Scholar] [CrossRef]
- Kubík, P.; Šebek, F.; Petruška, J. Notched specimen under compression for ductile failure criteria. Mech. Mater. 2018, 125, 94–109. [Google Scholar] [CrossRef]
- Šebek, F.; Park, N.; Kubík, P.; Petruška, J.; Zapletal, J. Ductile fracture predictions in small punch testing of cold-rolled aluminium alloy. Eng. Fract. Mech. 2019, 206, 509–525. [Google Scholar] [CrossRef]
- Alexandrov, S.; Vilotić, D. A study on an effect of geometric singularities on ductile fracture. Eng. Fract. Mech. 2009, 76, 2309–2315. [Google Scholar] [CrossRef]
- Vilotic, D.; Alexandrov, S.; Plancak, M.; Movrin, D.; Ivanisevic, A.; Vilotic, M. Material formability at upsetting by V-shape dies. In Proceedings of the 11th International Conference on the Technology of Plasticity 2011, Aachen, Germany, 25–30 September 2011; Steel Research International: New York, NY, USA, 2011; pp. 923–928. [Google Scholar]
- Vilotic, D.; Alexandrov, S.; Plancak, M.; Vilotic, M.; Ivanisevic, A.; Kacmarcik, I. Material Formability at Upsetting by Cylin-drical and Flat Dies. In Proceedings of the 14th Metal Forming International Conference, Kraków, Poland, 16–19 September 2012; Steel Research International: New York, NY, USA, 2012; pp. 1175–1178. [Google Scholar]
- Alexandrov, S.E.; Vilotic, D.; Lyamina, E.A. Effect of a geometric singularity on a surface on ductile fracture. Russ. Met. 2014, 2014, 44–48. [Google Scholar] [CrossRef]
- Kacem, A.; Laurent, H.; Thuillier, S. Influence of experimental boundary conditions on the calibration of a ductile fracture criterion. Eng. Fract. Mech. 2021, 248, 107686. [Google Scholar] [CrossRef]
- Silva, C.M.A.; Alves, L.M.; Nielsen, C.V.; Atkins, A.G.; Martins, P.A.F. Failure by fracture in bulk metal forming. J. Mater. Process. Technol. 2015, 215, 287–298. [Google Scholar] [CrossRef]
- Vilotić, D.; Plančk, M.; Grbić, S.; Alexandrov, S.; Chikanova, N. An approach to determining the workability diagram based on upsetting tests. Fatigue Fract. Eng. Mater. Struct. 2003, 26, 305–310. [Google Scholar] [CrossRef]
- Mai, B.V.; Hancock, G.J.; Nguyen, G.D.; Pham, C.H. Shear yielding and failure of cold-reduced G450 sheet steel. J. Constr. Steel Res. 2021, 185, 106844. [Google Scholar] [CrossRef]
- Martins, P.A.F.; Bay, N.; Tekkaya, A.E.; Atkins, A.G. Characterization of fracture loci in metal forming. Int. J. Mech. Sci. 2014, 83, 112–123. [Google Scholar] [CrossRef]
- Martínez-Donaire, A.J.; Borrego, M.; Morales-Palma, D.; Centeno, G.; Vallellano, C. Analysis of the influence of stress triaxiality on formability of hole-flanging by single-stage SPIF. Int. J. Mech. Sci. 2019, 151, 76–84. [Google Scholar] [CrossRef]
- López-Fernández, J.A.; Centeno, G.; Martínez-Donaire, A.J.; Morales-Palma, D.; Vallellano, C. Stretch-flanging of AA2024-T3 sheet by single-stage SPIF. Thin-Walled Struct. 2021, 160, 107338. [Google Scholar] [CrossRef]
- Vujović, V.; Shabaik, A.H. A New Workability Criterion for Ductile Metals. J. Eng. Mater. Technol. 1986, 108, 245–249. [Google Scholar] [CrossRef]


| Series | Initial Geometry | Geometric Parameters | Tribological Conditions | |
|---|---|---|---|---|
| Lubrication | Surface | |||
| 1 |   | d0 = 20 mm h0 = 24 mm z0 = 4 mm | Mineral oil | Turned |
| 2 | Mineral oil | Ground | ||
| 3 | Teflon (polytetrafluoroethylene PTFE) | Turned | ||
| 4 | No lubrication | Turned | ||
| 5 |   | d0 = 20 mm h0 = 26 mm u = 0.6 mm t = 0.3 mm z0 = 4 mm | Stearin | Turned |
| Chemical Element | C | Si | Mn | P | S | Cr | Mo | Ni | Cu |
|---|---|---|---|---|---|---|---|---|---|
| Content (%) | 0.46 | 0.23 | 0.64 | 0.008 | 0.022 | 0.18 | 0.02 | 0.08 | 0.17 |
| Series | 1 | 2 | 3 | 4 | 5 |
|---|---|---|---|---|---|
| 0.82 | 0.752 | 0.961 | 0.725 | 0.92 | |
| −1.082 | −0.867 | −1.426 | −0.735 | −1.74 |
| Series | 1 | 2 | 3 | 4 | 5 |
|---|---|---|---|---|---|
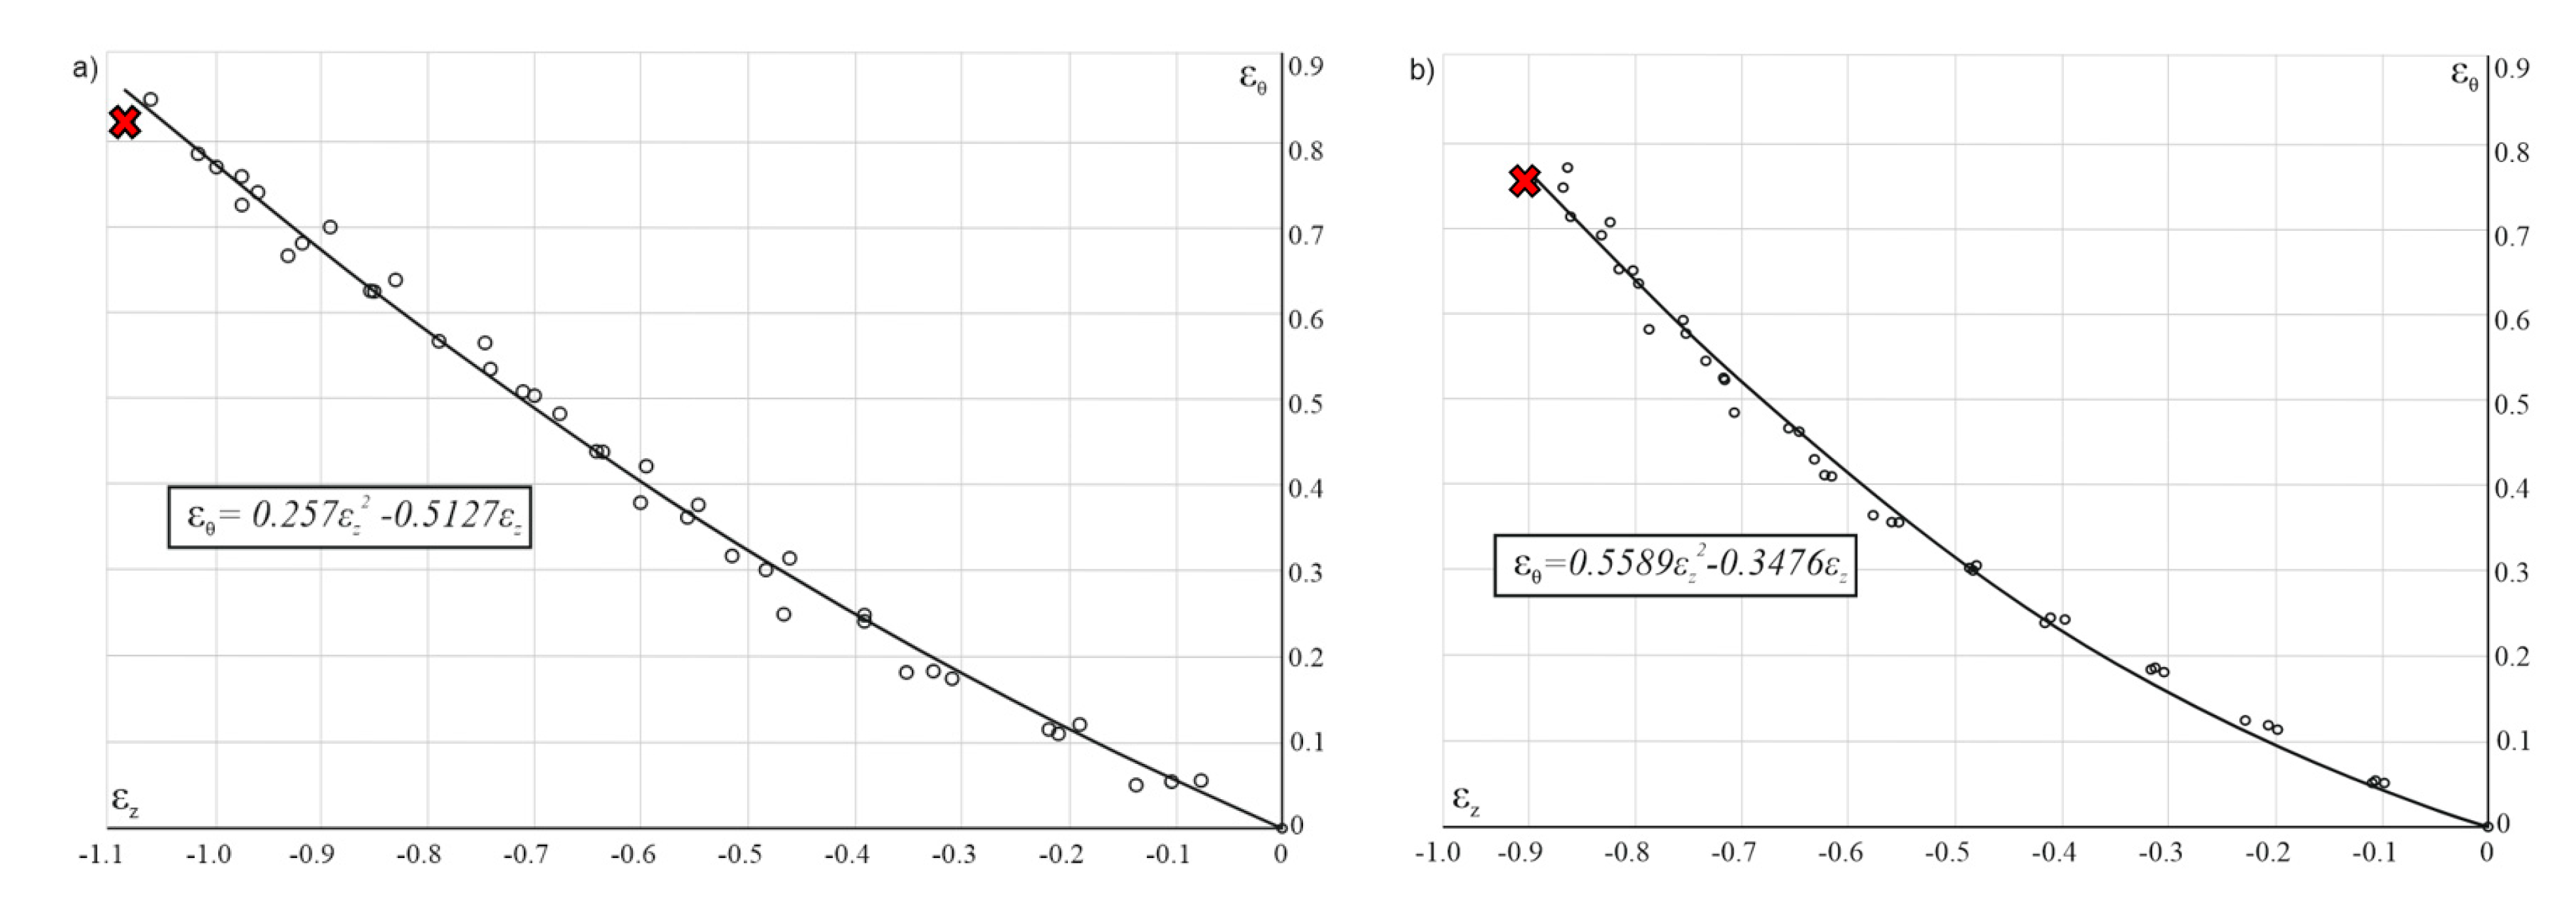
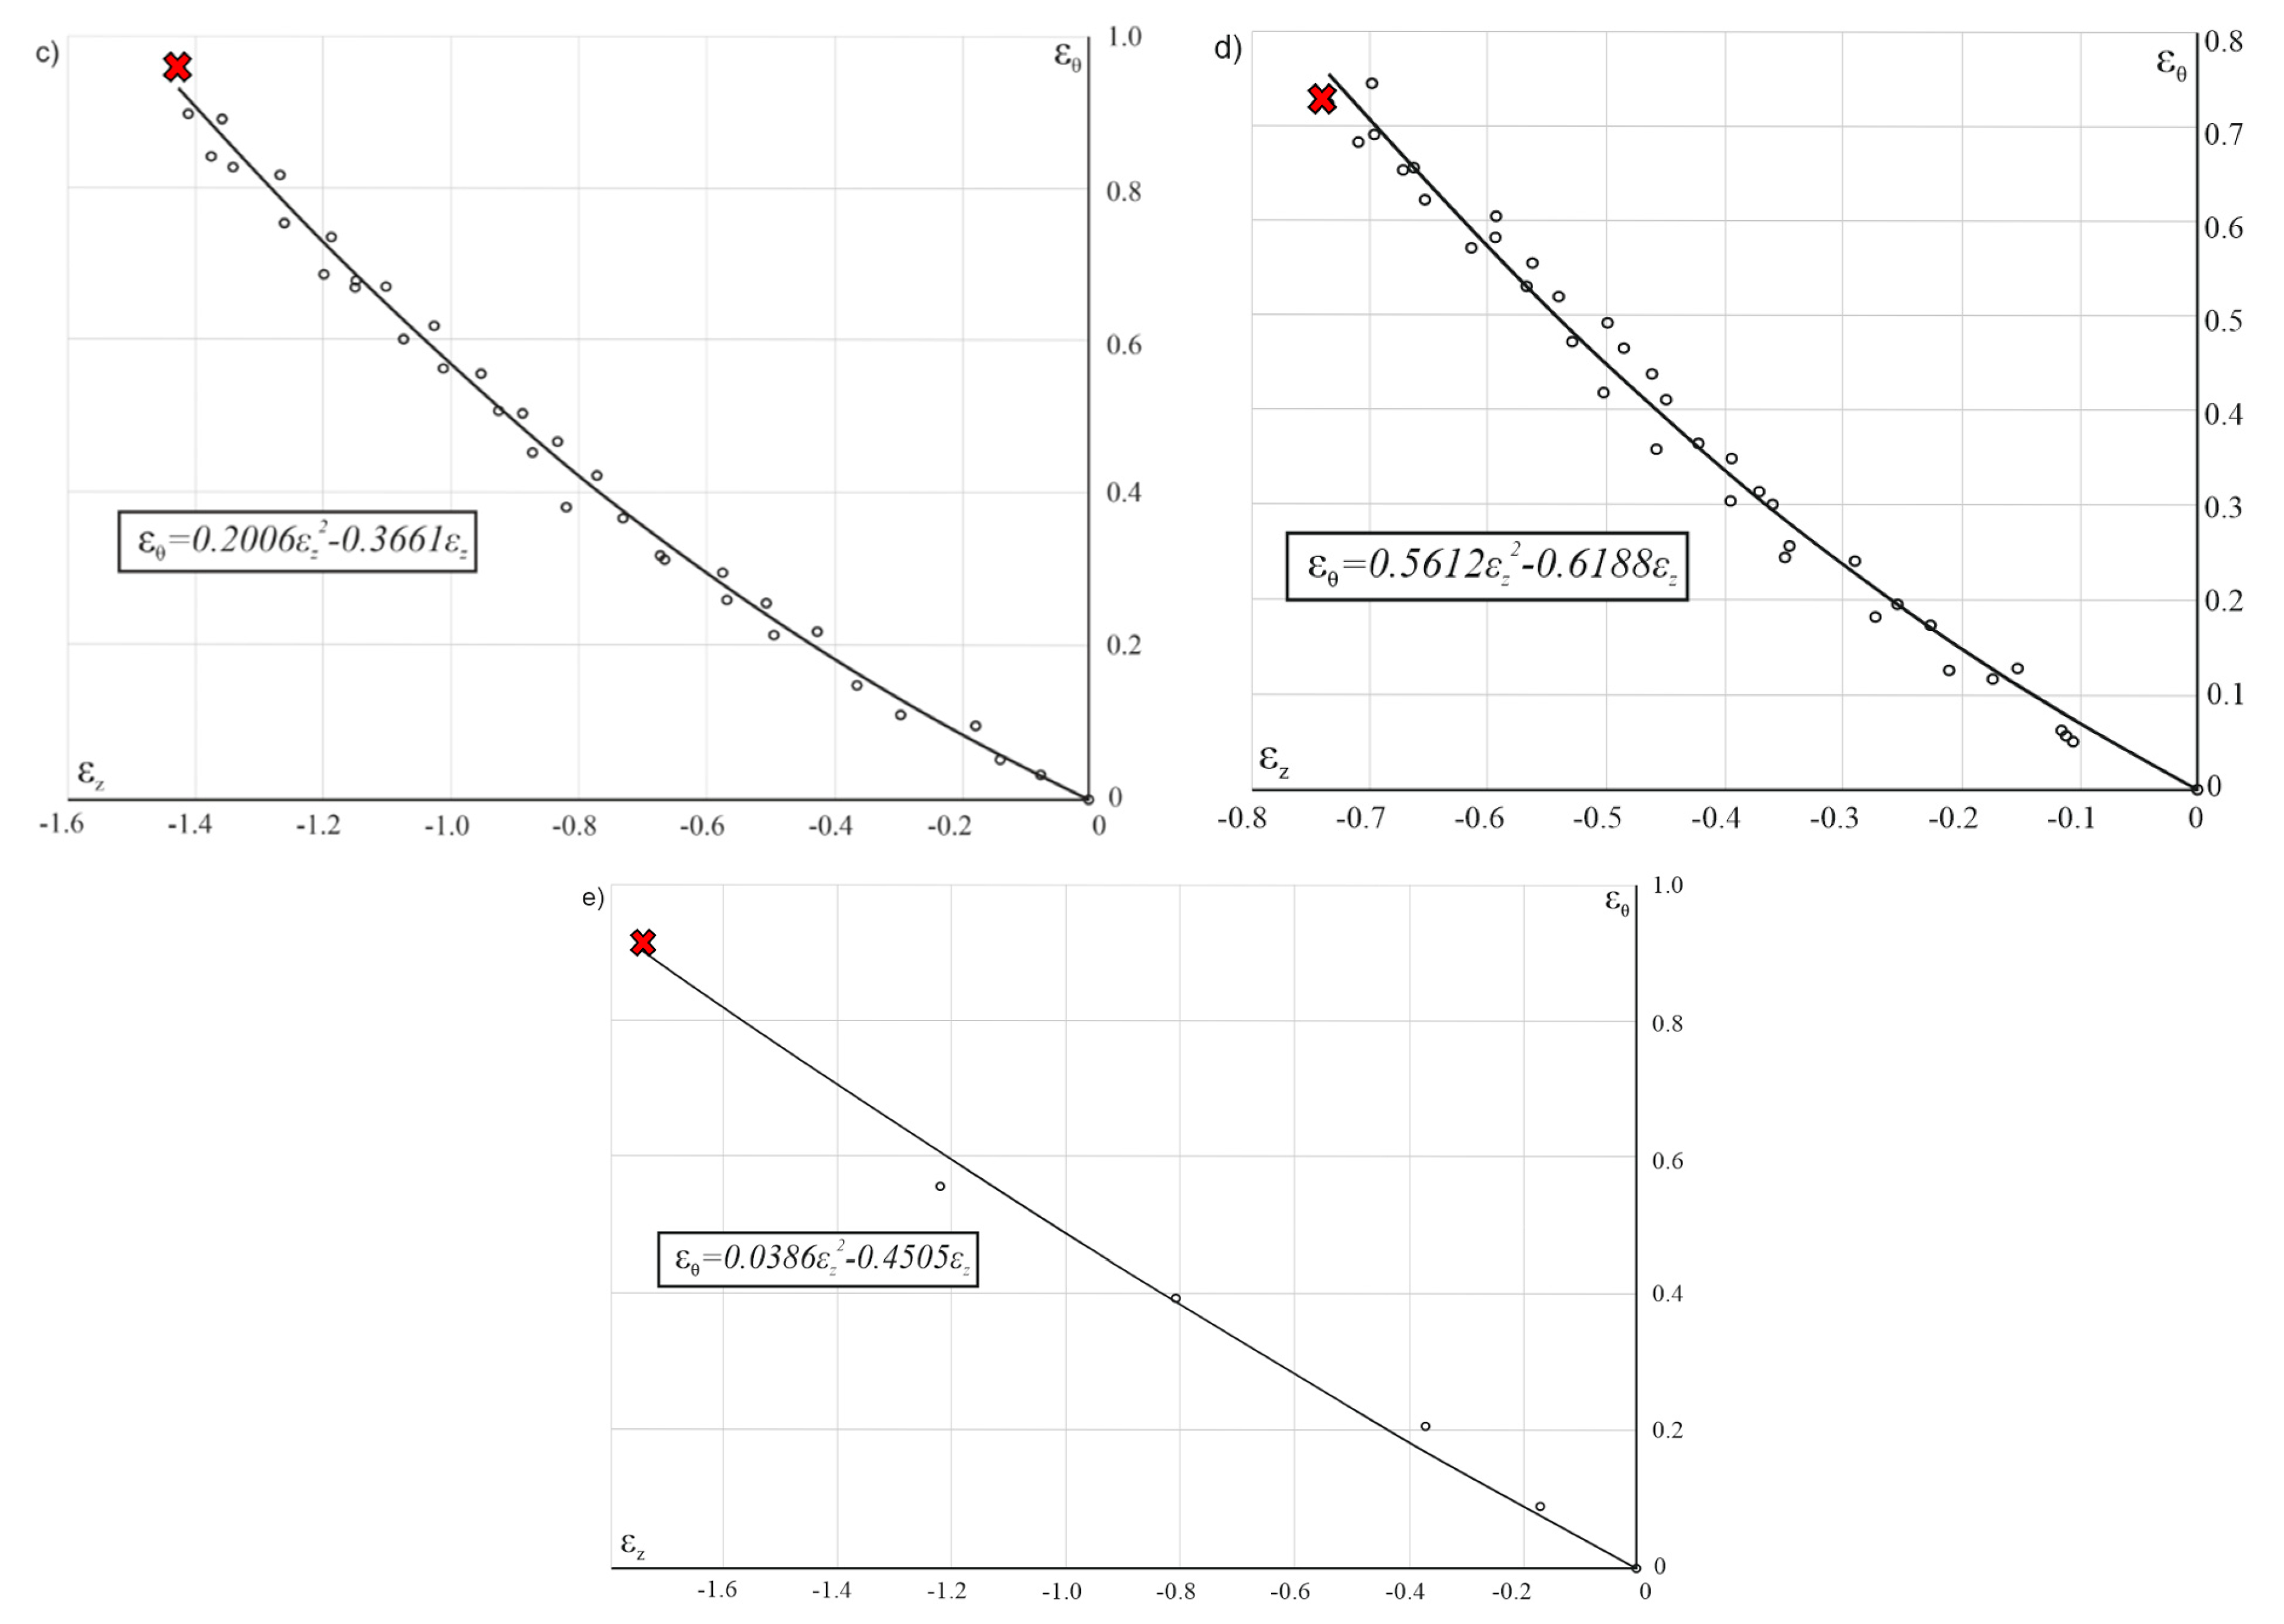
| A | −0.5127 | −0.3476 | −0.3661 | −0.6188 | −0.4505 |
| B | 0.257 | 0.5589 | 0.2006 | 0.5612 | 0.0386 |
| Series | 1 | 2 | 3 | 4 | 5 |
|---|---|---|---|---|---|
| 1.15 | 0.95 | 1.47 | 0.85 | 1.74 |
Publisher’s Note: MDPI stays neutral with regard to jurisdictional claims in published maps and institutional affiliations. |
© 2021 by the authors. Licensee MDPI, Basel, Switzerland. This article is an open access article distributed under the terms and conditions of the Creative Commons Attribution (CC BY) license (https://creativecommons.org/licenses/by/4.0/).
Share and Cite
Movrin, D.; Milutinovic, M.; Vilotic, M.; Alexandrov, S.; Lang, L. A Method for Determining the Workability Diagram by Varying Friction Conditions in the Upsetting of a Cylinder between Flat Dies. Crystals 2021, 11, 1411. https://0-doi-org.brum.beds.ac.uk/10.3390/cryst11111411
Movrin D, Milutinovic M, Vilotic M, Alexandrov S, Lang L. A Method for Determining the Workability Diagram by Varying Friction Conditions in the Upsetting of a Cylinder between Flat Dies. Crystals. 2021; 11(11):1411. https://0-doi-org.brum.beds.ac.uk/10.3390/cryst11111411
Chicago/Turabian StyleMovrin, Dejan, Mladomir Milutinovic, Marko Vilotic, Sergei Alexandrov, and Lihui Lang. 2021. "A Method for Determining the Workability Diagram by Varying Friction Conditions in the Upsetting of a Cylinder between Flat Dies" Crystals 11, no. 11: 1411. https://0-doi-org.brum.beds.ac.uk/10.3390/cryst11111411