Article

Microstructure Study of Phase Transformation of Quartz in Potassium Silicate Glass at 900 °C and 1000 °C

1
State Grid Hunan Electric Power Company Limited Research Institute, Changsha 410004, China
2
School of Materials Science and Engineering, Dongguan University of Technology, 1 Daxue Road, Dongguan 523808, China
3
Hunan Xiangdian Test & Research Institute Co., Ltd., Changsha 410029, China
4
Institute of Advanced Wear & Corrosion Resistant and Functional Material, Jinan University, West Huangpu Road 601#, Guangzhou 510632, China
5
Laboratory for Corrosion and Protection, Institute of Metal Research, Chinese Academy of Sciences, Wencui Road 62#, Shenyang 110016, China
*
Author to whom correspondence should be addressed.
Submission received: 4 November 2021 / Revised: 22 November 2021 / Accepted: 24 November 2021 / Published: 29 November 2021
(This article belongs to the Special Issue Nanocrystalline Coating Alloy)

Abstract

:
Interfacial reaction between quartz and potassium silicate glass was studied at both 900 °C and 1000 °C. The results showed that no phase transformation was observed for the pure quartz at 900 °C or 1000 °C. Instead, for quartz particles in K2O-SiO2 glass, the transformation from quartz to cristobalite occurred at the quartz/glass interface at first, and then the cristobalite crystals transformed into tridymite. The tridymite formed at the interface between particles and glass became the site of heterogeneous nucleation, which induces plenty of tridymite precipitation in potassium silicate glass. The influential mechanism of firing temperature and size of quartz particles on transformation rate was discussed.

1. Introduction

Silica is one of the most abundant species on the earth’s crust. This polycrystalline mineral has entered several rock compositions, which makes it the most common compound on the earth. However, silica is a substance with various polymorphs, namely quartz, cristobalite and tridymite [1,2,3]. As a result, with the variation of mole temperature and pressure, phase transformation often occurs, which most likely affects the deformation, thermoelastic and strength properties of rocks at different depths [4,5,6].
quartz 870   ° C tridymite 1470   ° C cristobalite
In fact, the phase transformation of silica has stimulated a long history of experimental and theoretical investigations. At the beginning of last century, Finner [7] used Na2WO4 as a flux, and assuming that it would act as a catalyst, determined the following stability relations among quartz, cristobalite and tridymite.
According to Fenner’s results, the reversible phase transitions of quartz to tridymite and tridymite to cristobalite occur at 870 °C and 1470 °C, respectively. This classical study on the stability relationship among three polymorphs of silica is considered as the foundation of silicate system for nearly half a century. However, this relationship was repeatedly challenged by many researchers, especially in the 1950s. Buerger [8] first suggested that the tridymite, which possesses more open structure than quartz, actually requires the presence of impurities, such as sodium and potassium, for stability. In 1956, Flörke et al. [9] removed the impurities, such as Na, Ca, and Al, in synthetic tridymite by method of electrolysis and found that the tridymite turned into quartz below 1050 °C and cristobalite above 1050 °C. Moreover, they contended [10,11] that tridymite is a real phase in SiO2 system only when impurities, such as foreign ions exist. Tuttle and England [12] demonstrated that formation of tridymite occurs in the presence of impurities except water. However, in a parallel study, Hill and Roy [13] prepared tridymite using only pure H2O or D2O as a flux. Holmquist [14] systemically studied the transformation of quartz and found tridymite could not form without the presence of alkali oxide. In addition, cristobalite formed first as an intermediate phase during the conversion from quartz to tridymite with the presence of an alkali oxide.
At the end of last century, Hand and Stevens [15,16] restudied the transformation of quartz by XRD and thermal analysis and reported that a flux or mineralizer, such as sodium carbonate or potassium carbonate, is required for tridymite formation and even in this case cristobalite is produced before any tridymite is observed. Nowadays, although there are some reports about the formation of tridymite without the presence of mineralizer, it is generally accepted that tridymite exists only if a small amount of impurities, such as alkali oxides, is present [17,18].
Silica is often used as filler for enamel, glass-ceramics and potassium silicate coatings. In these coatings, alkali metal flux, such as K2O, is often added to assist the coating sintering at relatively low temperature. In the presence of these fluxes, the phase transition mechanism of silica crystal is still unclear, but of crucial importance is the phase transition of silica to the high temperature service behavior of these coatings. For example, the volume change caused by the transformation of quartz to tridymite may cause the coating to fail to expand. However, the microstructure evolution along with this phase transformation is still unclear. The morphology of each polymorph of silica is absent in the open literature. Therefore, it is necessary to study the microstructure evolution of silica phase transition, and to the clarify growth mechanism of tridymite and cristobalite in the phase transition process.
In this work, aqueous solution of potassium silicate was used as the mineralizer. Interaction between quartz and potassium silicate glass after exposing at 900 °C and 1000 °C for different time periods was studied by scanning electron microscope (SEM). Special attention was focused on comparing and discussing the microstructure evolution of quartz during high temperature exposure.

2. Experimental Procedure

The aqueous solution of 40 wt.% potassium silicate (Dayang Chemical Plant, Dalian, China) was used as the source of potassium silicate glass, the ratio of the SiO2 to K2O in the solution is about 3:1. The content of impurities in the solution: Fe < 0.03 wt.%, S < 0.03 wt.%, p < 0.03 wt.%. Two kinds of quartz powders of different size were used, shown in Figure 1. The diameter of the coarser quartz powders is 10–40 μm (Sinopharm Chemical Reagent Co., Ltd., Shanghai, China). The finer powders were 1~10 μm in size, which were prepared by ball milling the coarser quartz powders in an agate mortar. The quartz powders are analytical reagent, the composition of the quartz powder is shown in the Table 1.
The process to prepare the specimen is as follows: (1) quartz powder is added into potassium silicate aqueous solution, and slurry is formed by ball milling (the weight ratio of quartz to aqueous solution in the slurry is about 1:2); (2) dumping the dispersed slurry into a die made by polytetrafluoroethylene (PTFE) and solidifying in air at room temperature for 72 h; (3) baking the solidified specimens in an oven for 24 h at 70 °C, 12 h at 120 °C and then 12 h at 260 °C to eliminate the water in the specimens.
The high temperature exposure of the above specimens was conducted in muffle furnace, whose temperature has been elevated to 900 °C or 1000 °C. In order to investigate the effect of potassium silicate on the phase transformation of quartz, pure coarser quartz powders were also fired at 900 °C and 1000 °C. After exposure at high temperature for a certain time, the specimens were taken out of the furnace and cooled down to room temperature in air.
Each exposed specimen was cut into two parts, one was ground and polished to observe the microstructure by SEM (FEI INSPECT F 50, FEI, Hillsboro, Oregon, USA) with an EDS (OXFORD X-Max, Oxford Instruments, Oxford, UK). And the other part was milled into powders by mortar, and then analyzed by X-ray diffraction (Panalytical X’ Pert PRO, Cu Ka radiation at 40 KV, PA Analytical, Almelo, The Netherlands). The step-scanning mode was used with a step size of 0.02°.

3. Results

3.1. Phase Evolution of Quartz and Potassium Silicate Glass at 1000 °C

The XRD patterns for the quartz powders during exposure at 1000 °C are shown in Figure 2. It can be noted that quartz is the only phase observed in the XRD patterns even after exposure for 96 h, which means no transformation occurring for pure quartz powder. Similar results were reported by Stevens [19], where they found quartz is a relatively stable phase in the pure silica system at 1000 °C. XRD pattern for the potassium silicate after holding at 1000 °C for 96 h is shown in Figure 3. Broad peak appearing around 20–30° could be well indexed to the existence of amorphous phase. Except for this broad peak, no other obvious peaks were found, indicating the good stability of potassium silicate glass at this temperature.

3.2. Phase and Microstructure Evolution of the Coarse Quartz-Potassium Silicate Glass Composites at 1000 °C and 900 °C

The XRD patterns of the coarse quartz-potassium silicate glass composite during exposure at 1000 °C and the relationship between the relative content of each phase (analyzed by XRD data) and exposure time are shown in Figure 4. With the extension of exposing time, the diffraction peaks of quartz became weaker gradually and totally disappeared after 96 h. The peaks of cristobalite were observed after exposing for 3 h and became stronger in the following 2 h. However, the cristobalite started to diminish after exposing for 10 h and no peaks of cristobalite could be observed after 48 h. In comparison, the peaks of tridymite appeared after exposing for 5 h and their intensity kept increasing. When the exposure time extended up to 96 h, tridymite was the only crystal in the specimen.
Figure 5 shows the back scattered electron images of the coarser quartz-potassium silicate glass composite during exposure at 1000 °C for different times. Three phases with different contrast were observed in the Figure 5a,b. According to the EDS analysis, the phase A is composed of 63 at.% O, 27 at.% Si and 10 at.% K, so it should be the potassium silicate glass, which is transformed by the aqueous solution of potassium silicate. Phase B and C are composed of 66 at.% O and 33 at.% Si, which corresponds to either quartz or cristobalite as indicated by the XRD patterns. As the density of quartz (2.65 g/cm3) is higher than that of cristobalite (2.34 g/cm3) [20], the morphology of quartz should be higher in brightness and contrast. Therefore, it is safe to induce that the higher brightness phase C is quartz and phase B is cristobalite.
For the amplified image in Figure 5b, it should be noted that cristobalite mainly surrounds the glass/quartz interface, especially for the small quartz particle. With the extension of exposing time, the area of cristobalite expands while the area of quartz shrinks, which means parts of quartz particles have transformed into cristobalite already after exposure at 1000 °C for 5 h. However, residual quartz can still be observed at the center of cristobalite. Additionally, rod-shaped crystallites connecting to the cristobalite particles are observed (Figure 5d), which displays the composition of silica. Moreover, tridymite is a new phase after exposing for 5 h according to XRD patterns. Therefore, these rod-shaped crystallites must be tridymite. The size and number of rod-shaped crystallites grow in the following exposure (Figure 5e,f), which proves tridymite again as the intensity also becomes stronger in the XRD patterns. It should be noted that tridymite was also present in the large area continuous glass phase, in which there were no quartz particles, as indicated by the arrow in Figure 5f. This meant that not all of tridymite was transformed from the original quartz particles, and many of them were precipitated from the glass. At the same time, most of the tridymite precipitated from the glass phase was connected with the transformed quartz particles at one end.
When exposing lasts for 24 h (Figure 6a,b), the crystalline in the specimen was mainly rod-shaped tridymite, indicating most quartz particles have completed their transformation. The magnified image shows that the core-hull structure, corresponding to the residual quartz and cristobalite, still exists after exposing for 24 h (Figure 6b). In addition, the amount of tridymite precipitated from the glass increased. For the specimens exposed for 96 h, all quartz particles had completely transformed into dense and dispersed tridymite.
In comparison with quartz powder and glass, the existence of potassium silicate glass promotes the phase transformation from quartz to cristobalite and tridymite. In turn, the phase transformation of quartz also stimulated the precipitation of tridymite from glass. The microstructure evolution of quartz during exposing shows that phase transformation firstly occurs at the quartz/glass interface, and then the cristobalite transformed into tridymite with the presence of K2O. Therefore, the metastable cristobalite acts as an intermediate phase during the transformation from quartz to tridymite, which is in agreement with the proposal of Holmquist [14].

3.3. Phase and Microstructure Evolution of the Coarse Quartz-Potassium Silicate Glass Composite at 900 °C

The XRD patterns of coarse quartz-potassium silicate glass composite during exposure at 900 °C and the relationship between the relative content of each phase (analyzed by XRD data) and exposure time are shown in Figure 7. Similarly, the intensity of diffraction peaks of quartz decreases gradually. Weak diffraction peaks of cristobalite appear after exposing for 24 h. They become stronger after 240 h and then weaker gradually. The peaks of tridymite appear after 120 h and their intensity increases gradually. Tridymite is the exclusive phase until the exposing continued to 1440 h. Comparing the phase evolution at 1000 °C, phase transformation at 900 °C is much slower.
The back-scattered electron images of coarse quartz-potassium silicate glass composite during exposure at 900 °C are shown in the Figure 8 and Figure 9. Even though trace amount of cristobalite has been detected in the XRD patterns after firing for 24 h, one can distinguish them hardly from the quartz particles in the back-scattered electron images (Figure 8a,b). After exposing for 120 h, thread-like tridymite can be observed (Figure 8c,d) and its amount increased in the following exposure. The high magnification image shows that the large quartz particles are still surrounded by cristobalite (Figure 8f). It is more obvious that part of the tridymite precipitates from the glass rather than directly transforms from quartz at this temperature. Compared with tridymite formed at 1000 °C, the tridymite formed at 900 °C is much thinner and longer.
With the extension of exposure, tridymite becomes the main crystalline phase, as shown in Figure 9. Only a little residual quartz particle presents, and it is surrounded by tridymite. Quartz totally disappears after exposing for 1440 h and only rod-shaped tridymite can be observed in the specimen. However, compared with the tridymite after exposure for 480 h, tridymite after 1440 h is thicker, which means the tridymite grains grow up after the accomplishment of the phase transformation.

3.4. Phase Evolution of the Fine Quartz-Potassium Silicate Glass Composite at 1000 °C and 900 °C

In order to study the effect of particle size on the phase transformation, the transformation of fine quartz-potassium silicate glass composite was studied. The XRD patterns during exposure at 1000 °C and 900 °C and the relationship between the relative content of each phase (analyzed by XRD data) and exposure time are shown in Figure 10 and Figure 11, respectively. Tridymite appears after exposing for 3 h, which is earlier than that of coarse quartz. Moreover, the peaks of quartz and cristobalite disappear much earlier. The phase evolution during 900 °C shows that phase transformation from quartz to tridymite completes after exposing for 500 h. These results indicate that the transformation of the small quartz particles is faster than the large quartz particles.

4. Discussion

4.1. Phase Transformation of Quartz-Potassium Silicate Glass Composite

The schematic illustration of phase transformation of quartz-potassium silicate glass composite is shown in Figure 12. The phase transition of composites will be discussed in the following two aspects:

4.1.1. The Existence of Glass Favors Phase Transition of Quartz

For quartz, there is no phase transition when it is kept in air at 900 or 1000 °C for a long period of time, which is consistent with other reports [21]. However, when it is mixed with potassium silicate glass, as shown in the broken line diagrams in Figure 4, Figure 7, Figure 10 and Figure 11, obvious phase transition occurs: quartz particles first transform into cristobalite, and then into tridymite. Cristobalite is preferentially formed at the interface between quartz and glass, forming a cristobalite@quartz core-shell structure, and then cristobalite constantly phagocytes quartz inward until quartz completely disappears. At the same time, cristobalite, as a metastable phase, will further transform into tridymite, which is almost synchronous with the transformation of quartz. This can be proved by the obvious increase of cristobalite content in the line diagrams in Figure 4, Figure 7 and Figure 10 in the early stage, followed by a sharp decrease of cristobalite content, accompanied by the significant increase of tridymite content.
The phase transformation of quartz particles is mainly affected by K+ ions in glass. For SiO2, potassium oxide is a powerful mineralizer, which reacts with silica to activate the crystal lattice, thus enhancing the reaction ability and promoting the solid state reaction of quartz to cristobalite. Cristobalite appears after exposure for a certain time, which confirms further the mineralization that the cristobalite is not a stable phase in the pure silica system [19,22]. It is similar to the result of Fenner’s [1], where Na2WO4 was used as the flux. But they regarded that the flux only acts as catalyst. According to the results in the current study, the impurity also stabilizes the tridymite with open structure.
There are two reasons why quartz first transforms into cristobalite, and then into tridymite: 1. From the point of view of crystal structure, when quartz transforms into cristobalite, it only needs to change the bond angle to complete the phase transformation [23]. However, when quartz transforms into tridymite, it is more difficult to change the bond angle and rotate the [SiO4] tetrahedron around the axis at the same time than to change the bond angle only. 2. Tridymite is not a pure SiO2, in which alkali metal is needed to coordinate. The K+ ions in potassium silicate glass diffuse slowly into the second phase particles, which gives time for quartz to transform into cristobalite. However, driving by chemical potential gradient, K+ ions will continuously invade into the particles, and eventually all quartz/cristobalite will be transformed into tridymite.

4.1.2. The Phase Transformation of Quartz Promotes the Precipitation of Tridymite in Glass

Glass promotes the phase transformation of quartz, and the products of quartz phase transformation also favor the precipitation of tridymite in glass. The modulus of potassium silicate aqueous solution used in the experiment is as high as 3:1. The high content of [SiO4] tetrahedron and a large amount of K+ ions provide precursors for the precipitation of tridymite. However, without crystal seeds, it is difficult to uniformly nucleate and precipitate crystals by relying on the concentration fluctuation and structure fluctuation of glass itself. This is also the reason why the pure potassium silicate glass does not precipitate tridymite when it is kept at 1000 °C for a long time. However, the quartz particles added as the second phase are transformed into tridymite under the action of K+ ions, and become the core of nonuniform nucleation. The silica in the region close to the second phase particles in the glass will be rearranged preferentially according to the structure of tridymite, so that the tridymite in the glass grows continuously. This is also proven by the fact that one end of most tridymite are attached to the second phase particles.

4.2. The Effect of Temperature on the Phase Transformation of Quartz-Potassium Silicate Glass Composite

Phase transformation of quartz with presence of in potassium silicate glass at 1000 °C is faster than that at 900 °C, which agrees with the conclusion proposed by Pagliari [24]. This lies in the promotion effect of high temperature. Moreover, once a layer of cristobalite has formed at the glass/quartz interface, the K2O has to diffuse through the cristobalite layer and then induce the transformation of quartz, so the diffusion of K2O becomes the key step of transformation. The higher the temperature, the higher the diffusion rate. Therefore, increasing the firing temperature can accelerate the transformation.
It is widely accepted that highly ordered cristobalite only form at higher temperatures while disordered cristobalite forms in the lower temperature range where tridymite is stable [13,22]. The cristobalite crystallites forms at 900 °C and 1000 °C in this study, which is much lower than the stable temperature of crystallites reported in the literature. Therefore, the obtained cristobalite may be disordered and probably contain K+ ions but a further investigation is needed.

4.3. Size Effect of Quartz Particles on the Phase Transformation

Interestingly, the phase transformation for the fine size quartz particle is faster. The combination of the results of XRD reveals there are two reasons that should be accounted for. Firstly, the small quartz particles can supply larger glass/quartz interface area because of their higher specific surface area than the larger quartz particles. It means larger interface area can be offered by the finer particle to provide more reaction interface area at the initial stage [25]. Therefore, a higher density of cristobalite or tridymite nuclei forms at the same time, and thus improves the transformation rate. Secondly, large quartz particle is inclined to form a core-hull structure (residual quartz surrounded by the metastable cristobalite or dense dispersed tridymite). The surrounding cristobalite or tridymite hindered the diffusion of K+ ions, thus, prolonging the transformation greatly. For the small quartz particles, although the core-hull structure also formed, the surrounding cristobalite is thin and the cristobalite is easily formed to separate tridymite, thus, it is relatively easy for the K+ ions to diffuse through the cristobalite, and the transformation of quartz can be completed in a relatively short time.

5. Conclusions

The phase transformation of pure quartz and quartz-potassium silicate glass composite were studied at both 900 °C and 1000 °C by XRD and SEM. Based on the experimental results and discussion, the following conclusion can be drawn:
(1)
Quartz without impurity is the stable polymorph of silica at 1000 °C;
(2)
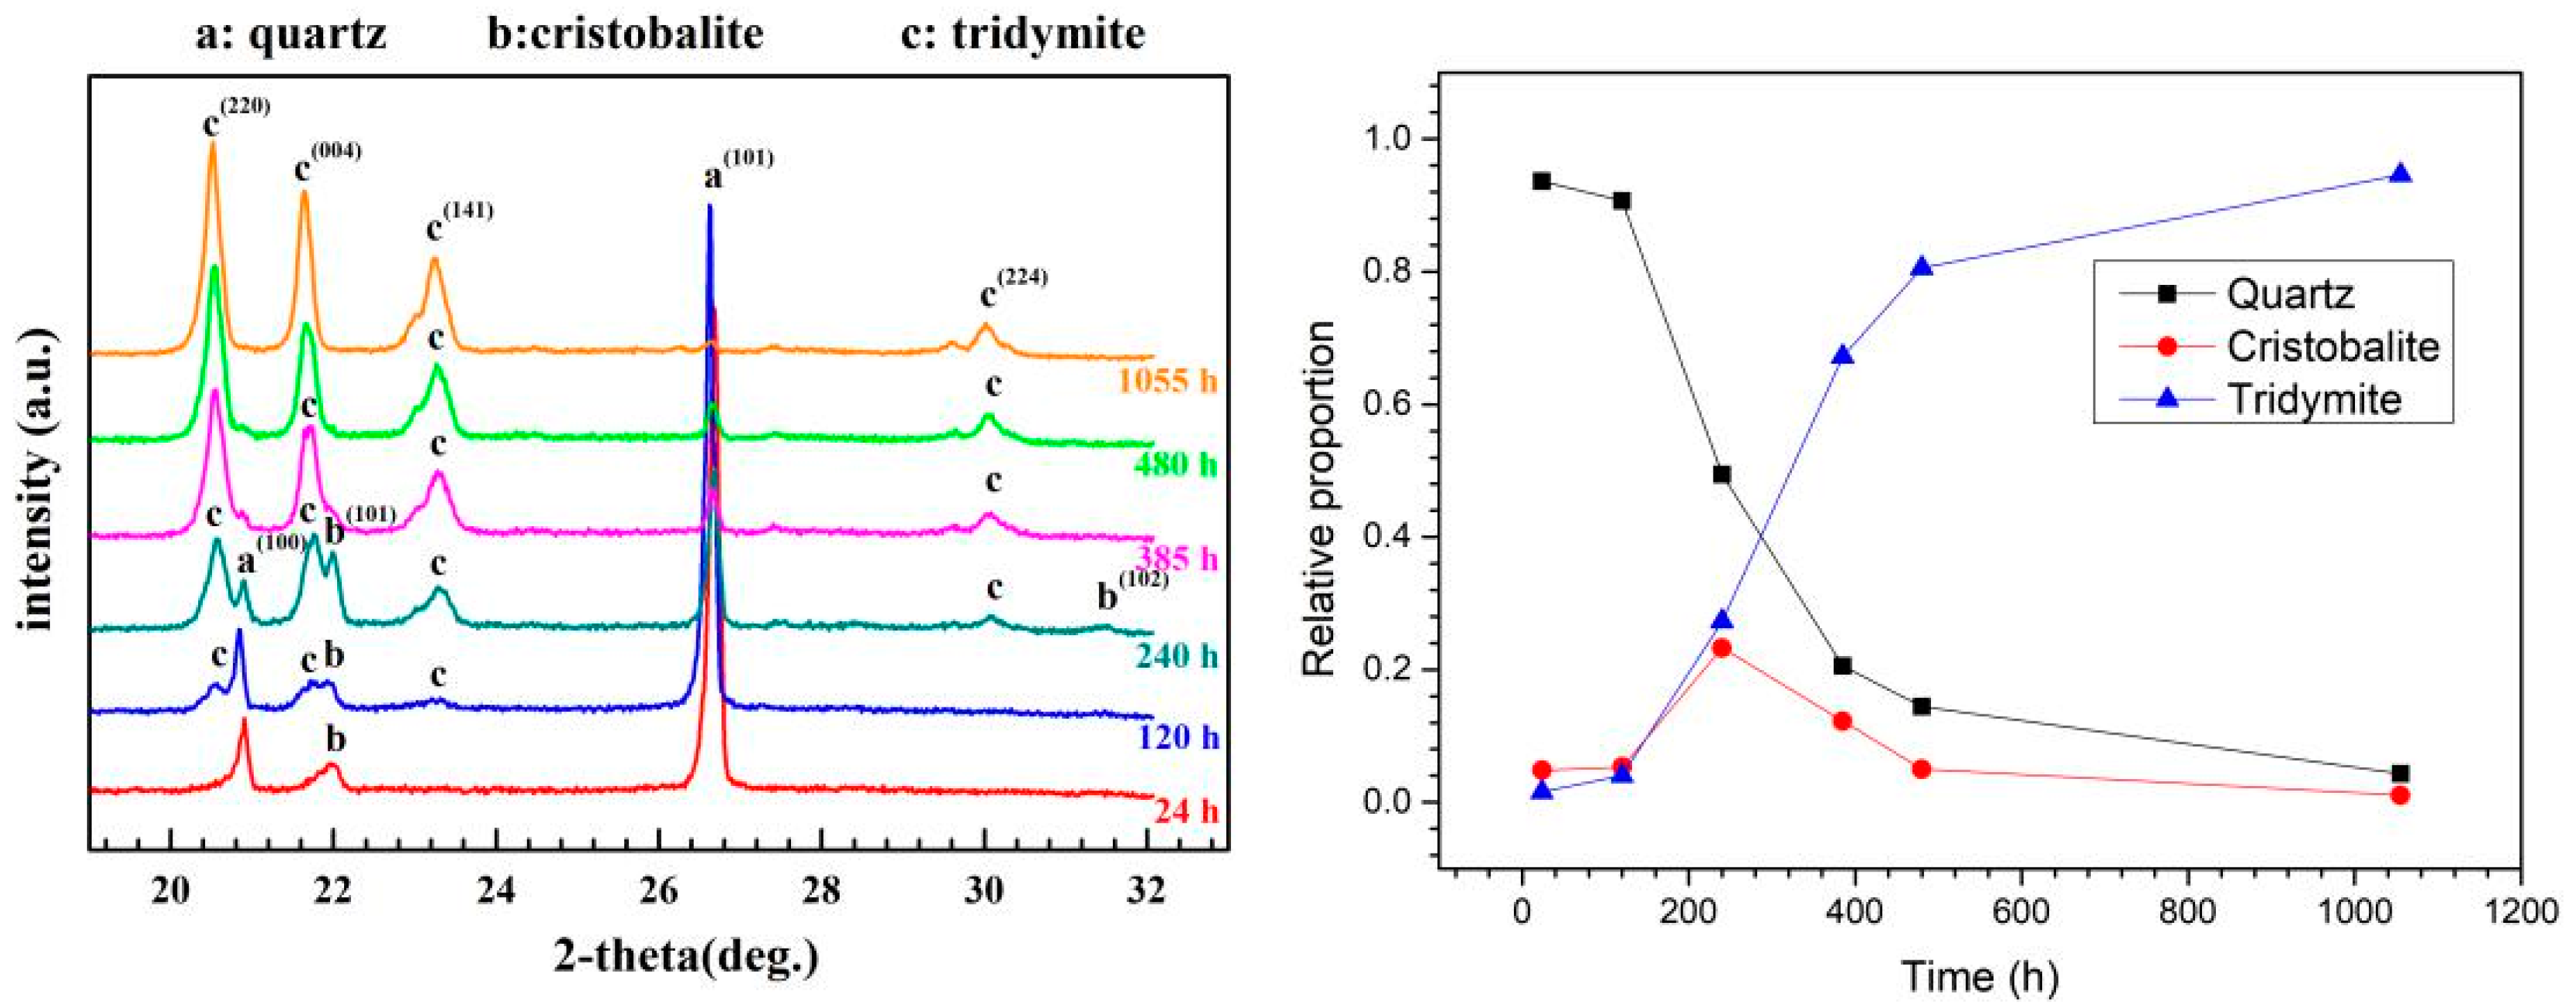
With the presence of K2O, the transformation of quartz starts at the quartz/glass interface by formation of cristobalite. But cristobalite is a metastable phase at both 900 °C and 1000 °C and transforms into tridymite;
(3)
The phase transformation rate can be accelerated with increasing temperature and/or decreasing size of the quartz particles, implying that the quartz → cristobalite → tridymite transformation may be associated with the diffusion of potassium in quartz and cristobalite.

Author Contributions

All persons who have made substantial contributions to the work reported in the manuscript. W.L. carried out most of the work. K.C., C.X. and Y.Y. helped to analyze the results and revised the manuscript. L.L. and A.X. helped to analyze the results and provide advice for improvement of the work. S.Z. provided project design for the work. All authors have read and agreed to the published version of the manuscript.

Funding

This research was funded by [National Natural Science Foundation of China] grant number [52001064], [Guangdong Basic and Applied Basic Research Foundation] grant number [2019A1515110913], [Research Start-up Funds of DGUT] grant number [211135064] and [Science and technology reseach project of Hunan Electric Power Co., Ltd.] grant number [5216A5200006].

Data Availability Statement

Data is contained within the article.

Conflicts of Interest

The authors declare no conflict of interest.

References

  1. Thompson, A.B.; Wennemer, M. Heat capacities and inversions in tridymite, cristobalite, and tridymite-cristobalite mixed phases. Am. Miner. 1979, 64, 1018–1026. [Google Scholar]
  2. Chaklader, A.C.D.; Roberts, A.L. Transformation of Quartz to Cristobalite. J. Am. Ceram. Soc. 1961, 44, 35–41. [Google Scholar] [CrossRef]
  3. Nabil, M.; Mahmoud, K.R.; El-Shaer, A.; Nayber, H.A. Preparation of crystalline silica (quartz, cristobalite, and tridymite) and amorphous silica powder (one step). J. Phys. Chem. Solids 2018, 121, 22–26. [Google Scholar] [CrossRef]
  4. Jones, J.B.; Segnit, E.R. Genesis of cristobalite and tridymite at low temperatures. J. Geol. Soc. Aust. 1972, 18, 419–422. [Google Scholar] [CrossRef]
  5. Ilkhechi, N.N.; Kaleji, B.K. Temperature Stability and Photocatalytic Activity of Nanocrystalline Cristobalite Powders with Cu Dopant. Silicon 2017, 9, 943–948. [Google Scholar] [CrossRef]
  6. Evgenii, K.; Wolfram, T. The role of quartz in the origin of optical activity on earth. Orig. Life Evol. Biosph. 2000, 30, 431–434. [Google Scholar] [CrossRef] [PubMed]
  7. Fenner, C.N. The stability relations of the silica minerals. Am. J. Sci. 1913, s4-36, 331–384. [Google Scholar] [CrossRef] [Green Version]
  8. Buerger, M.J. The stuffed derivatives of the silica structures. Am. Miner. 1954, 39, 600–614. [Google Scholar]
  9. Flörke, O.W. Über das Einstoffsystem SiO2. Naturwissenschaften 1956, 43, 419–420. [Google Scholar] [CrossRef]
  10. Graetsch, H.; Flörke, O.W.; Miehe, G. Structural defects in microcrystalline silica. Phys. Chem. Miner. 1987, 14, 249–257. [Google Scholar] [CrossRef]
  11. Schneider, H.; Flörke, O. High-temperature transformation of tridymite single crystals to cristobalite. Z. Krist. Cryst. Mater. 1986, 175, 165–176. [Google Scholar]
  12. Tuttle, O.F.; England, J.L. Preliminary report on the system SiO2-H2O. Geol. Soc. Am. Bull. 1955, 66, 149–152. [Google Scholar] [CrossRef]
  13. Hill, V.; Roy, R. Silica structure studies VI. On tridymites. Trans. Br. Ceram. Soc. 1958, 57, 496. [Google Scholar]
  14. Holmquist, S.B. Conversion of Quartz to Tridymite. J. Am. Ceram. Soc. 1961, 44, 82–86. [Google Scholar] [CrossRef]
  15. Stevens, S.J.; Hand, R.J.; Sharp, J.H. Polymorphism of silica. J. Mater. Sci. 1997, 32, 2929–2935. [Google Scholar] [CrossRef]
  16. Hand, R.; Stevens, S.; Sharp, J. Characterisation of fired silicas. Thermochim. Acta 1998, 318, 115–123. [Google Scholar] [CrossRef]
  17. Wu, S.W.; Wong, D.S.H.; Lu, S.Y. Size Effects on Silica Polymorphism. J. Am. Ceram. Soc. 2002, 85, 2590–2592. [Google Scholar] [CrossRef]
  18. Haastrup, S.; Yu, D.; Yue, Y. Impact of surface impurity on phase transitions in amorphous micro silica. J. Non-Cryst. Solids 2016, 450, 42–47. [Google Scholar] [CrossRef]
  19. Stevens, S.; Hand, R.; Sharp, J. Temperature dependence of the cristobalite α-β inversion. J. Therm. Anal. Calorim. 1997, 49, 1409–1415. [Google Scholar] [CrossRef]
  20. Li, Y.P.; Ching, W.Y. Band structures of all polycrystalline forms of silicon dioxide. Phys. Rev. B 1985, 31, 2172–2179. [Google Scholar] [CrossRef] [PubMed]
  21. Wang, Q.; Edalati, K.; Fujita, I.; Watanabe, M.; Ishihara, T.; Horita, Z. High-pressure torsion of SiO2 quartz sand: Phase transformation, optical properties, and significance in geology. J. Am. Ceram. Soc. 2020, 103, 6594–6602. [Google Scholar] [CrossRef]
  22. Di Febo, R.; Casas, L.; del Campo, Á.A.; Rius, J.; Vallcorba, O.; Melgarejo, J.C.; Capelli, C. Recognizing and understanding silica-polymorph microcrystals in ceramic glazes. J. Eur. Ceram. Soc. 2020, 40, 6188–6199. [Google Scholar] [CrossRef]
  23. Richter, B.; Stünitz, H.; Heilbronner, R. Stresses and pressures at the quartz-to-coesite phase transformation in shear deformation experiments. J. Geophys. Res. Solid Earth 2016, 121, 8015–8033. [Google Scholar] [CrossRef] [Green Version]
  24. Pagliari, L.; Dapiaggi, M.; Pavese, A.; Francescon, F. A kinetic study of the quartz–cristobalite phase transition. J. Eur. Ceram. Soc. 2013, 33, 3403–3410. [Google Scholar] [CrossRef]
  25. Wang, J.; Chen, M.; Yang, L.; Sun, W.; Zhu, S.; Wang, F. Nanocrystalline coatings on superalloys against high temperature oxidation: A review. Corros. Commun. 2021, 1, 58–69. [Google Scholar] [CrossRef]
Figure 1. Morphologies of the original quartz powders (a) coarse powders with diameter of 10–40 μm and (b) fine powders with diameter of 1–10 μm.
Crystals 11 01481 g001
Figure 2. XRD patterns for the quartz powders after holding at 1000 °C for different time.
Crystals 11 01481 g002
Figure 3. XRD pattern for the potassium silicate after holding at 1000 °C for 96 h.
Crystals 11 01481 g003
Figure 4. Phase evolution of coarse quartz—potassium silicate glass composites after holding at 1000 °C for different time.
Crystals 11 01481 g004
Figure 5. Microstructure of the coarse quartz—potassium silicate glass composites after holding at 1000 °C for different time: 3 h (a,b), 5 h (c,d) and 10 h (e,f).
Crystals 11 01481 g005
Figure 6. Microstructure of the coarse quartz—potassium silicate glass composites after holding at 1000 °C for different time: 24 h (a,b), 48 h (c,d) and 96 h (e,f).
Crystals 11 01481 g006
Figure 7. Phase evolution of coarse quartz—potassium silicate glass composites after holding at 900 °C for different time.
Crystals 11 01481 g007
Figure 8. Microstructure of the coarse quartz—potassium silicate glass composites after holding at 900 °C for different time: 24 h (a,b), 120 h (c,d) and 240 h (e,f).
Crystals 11 01481 g008
Figure 9. Microstructure of the coarse quartz—potassium silicate glass composites after holding at 900 °C for different time: 384 h (a,b), 480 h (c,d) and 1440 h (e,f).
Crystals 11 01481 g009
Figure 10. Phase evolution of fine quartz—potassium silicate glass composites after holding at 1000 °C for different time.
Crystals 11 01481 g010
Figure 11. Phase evolution of fine quartz—potassium silicate glass composites after holding at 900 °C for different time.
Crystals 11 01481 g011
Figure 12. Schematic illustration of phase transformation of quartz-potassium silicate glass composite.
Crystals 11 01481 g012
Table 1. Impurity levels in the quartz powders (data provided by supplier, wt.%).
ImpurityClSO4PbCaMg
amount≤0.005%≤0.005%≤0.005%≤0.005%≤0.005%
Publisher’s Note: MDPI stays neutral with regard to jurisdictional claims in published maps and institutional affiliations.

