
Oxidation and Microstructural Behaviors of Ni-Based Alloys Strengthened by (Ta, Hf)C Carbides at 1250 °C in Air


1
Centre National de la Recherche Scientifique, Institut Jean Lamour, Université de Lorraine, F-54000 Nancy, France
2
Faculté des Sciences et Technologies, Université de Lorraine, F-54500 Vandoeuvre-lès-Nancy, France
*
Author to whom correspondence should be addressed.
Crystals 2021, 11(2), 159; https://0-doi-org.brum.beds.ac.uk/10.3390/cryst11020159
Submission received: 23 December 2020
/
Revised: 25 January 2021
/
Accepted: 31 January 2021
/
Published: 5 February 2021
(This article belongs to the Special Issue Recent Advances in Metallurgy and Properties of Superalloys)
Abstract
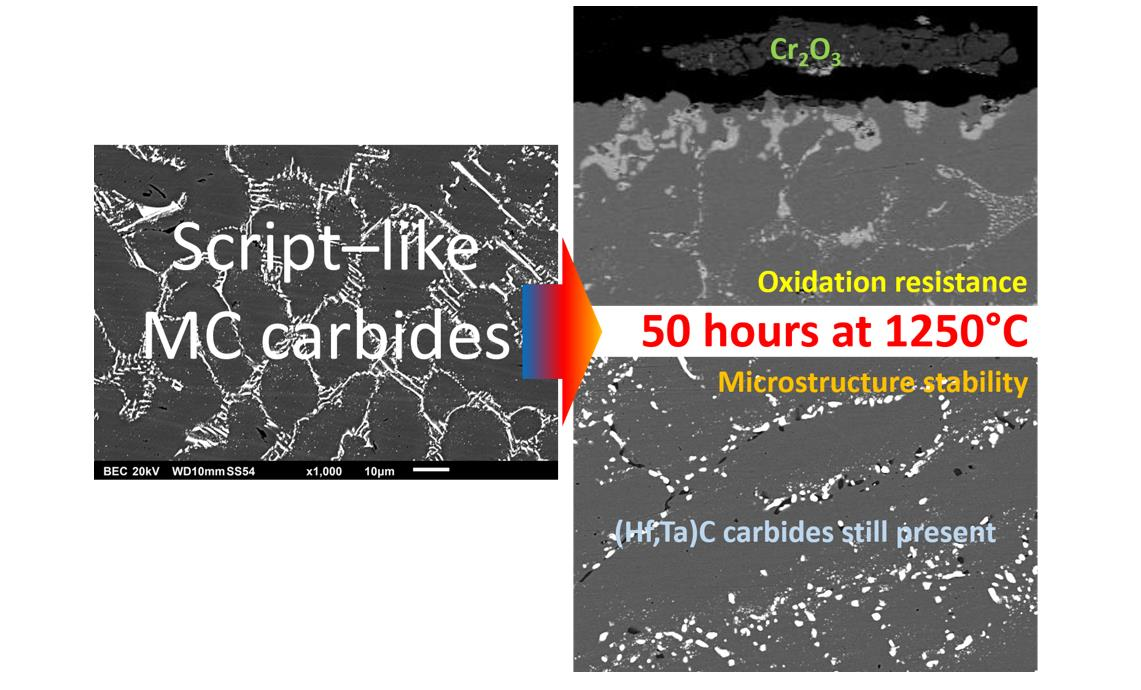
:Two alloys based on nickel and designed to be reinforced by MC carbides thanks to the presence of Hf and Ta were produced by casting. They were subjected to 50 h-long isothermal exposure at 1250 °C in synthetic air with thermogravimetric monitoring of the oxidation progress. In the as-cast state, they contain both significant quantities of (Hf,Ta)C carbides. Their verified melting start temperatures, close to 1300 °C, allowed performing the planned oxidation test. The two alloys demonstrated a chromia-forming behavior with limited mass gain rates. However, they also showed a rather low resistance to oxide spallation at cooling, which is in proportion with the Ta/Hf ratio. After 50 h at 1250 °C, the morphology of the carbides had significantly evolved, from their initial script-like shape to a fragmented and coalesced state. The results are promising, but the use of these alloys at 1250 °C needs further improvements on the mechanical level.

1. Introduction
Some processes involving particularly high temperatures (1200 °C and more) have a critical need of metallic alloys able first to resist oxidation and mechanical stresses at these temperatures, and second to be shaped for obtaining geometrically complex hot pieces. This is a problematic factor which can be encountered, for example, in the glass industry where some particular glass compositions, which can to very high melting points, are required to work in very hot conditions. Superalloys may represent solutions: complex shaping possible by solidification (contrarily to refractory alloys based on W, Mo and even Nb) and capacity to be resistant enough in service, mechanically and chemically.
The superalloys which are the most suitable are certainly the Ni-based ones which are too rich in aluminum to be particularly resistant against high temperature creep, thanks to gamma prime precipitation [1], as well as against hot oxidation, thanks to the development of external alumina scales [2]. For the concerned particular uses (e.g., shaping of molten glasses), chromium may to be preferred for resisting hot corrosion. The problem is that, while this element must be present at high contents, the concerned Ni-based superalloys cannot be efficiently reinforced by gamma prime precipitates. Fortunately, there are other metallurgical ways potentially exploitable to meet these needs: nickel bases associated to high chromium contents for efficiently developing a very protective oxide barrier of chromia (fast Cr diffusion in nickel) and structural strengthening by particles other than γ’: carbides. Primary MC-type carbides are particularly interesting for cast superalloys since they are rather stable at elevated temperatures in term of morphology and volume fraction. This is true for TaC, certainly the most popular MC carbide, but other MC, particularly stable at high elevated temperatures, can be more efficient for alloy mechanical reinforcement in hot conditions. This is the case for HfC. Used for several decades in some alloys based on refractory metals (such tungsten [3]), hafnium monocarbides may be currently found in ceramics [4,5] and high temperature composites [6,7]. Recently used as efficient reinforcing particles in nickel-based superalloys [8], HfC must be present in high quantities to lead to an interesting creep resistance [9], and this may lead to high production costs if such alloys must be produced at an industrial scale. Instead, basing creep resistance on MC carbides involving exclusively Hf, mixing Hf and another MC-former element may lead to interesting results. Tantalum may be an interesting element to do that. For instance, carbides involving Hf and Ta simultaneously were earlier considered for ceramic coatings [10,11]. Thus, a potentially very interesting technical-economical solution for industrial geometrically complex tools destined to work at 1200 °C and higher in conditions of oxidation and applied stresses may be cast chromium-rich nickel-based superalloys containing MC carbides involving Hf and Ta together.
In the present work, this new metallurgical principle of superalloys was explored by the mean of two compositions of nickel-based alloys, which were designed to obtain chromia-forming alloys reinforced by MC carbides in which Hf and Ta co-exist. The objective was to observe the microstructures that one can obtain by classical casting and determine how these microstructures may behave at elevated temperatures, for anticipating the possibly resulting creep resistance. Since the oxidation resistance is also of importance, thermogravimetric tests were, thus, performed to get oxidation data about mass gain kinetic and surface phenomena as well as data concerning the microstructure evolution in bulk. For the study of their oxidation resistance and their microstructure behavior, we chose to fix the investigations temperature to 1250 °C. This value globally represents the maximal reasonable temperature level which can be imagined for using polycrystalline alloys based on nickel and, in addition, this is the highest limit for the hottest zones in the concerned industrial processes, such as glass forming ones.
2. Materials and Methods
2.1. Design of the Alloys
The chemical compositions chosen for the two alloys obeyed the following criteria:
- − Based on nickel instead of cobalt or iron for favoring a good oxidation behavior;
- − More than 20 wt.%Cr for the same reason as above;
- − Around 0.5 wt.%C for obtaining an interdendritic carbide network dense enough for an efficient mechanical reinforcement but not interconnected to preserve good toughness and ductility;
- − Amounts in Ta and Hf to obtain molar fractions in MC-former metals rated to the chosen C one.
The choice was, finally, (wt.%): Ni(bal.) –25Cr–0.4C–6M with M = 2/3 Ta and 1/3 Hf for one alloy (named “T alloy”) or M = 2/3 Hf and 1/3 Ta for the second alloy (named “H alloy”). This supposes the introduction of hafnium with unusually high concentrations (2 and 4 wt.% Hf), compared to other Ni-based superalloys [12,13], nickel aluminides [14], single crystals [15], Nb-based refractory alloys [16,17] or HEAs (High Entropy Alloys) [18,19,20].
2.2. Syntheses of the Alloys
The two alloys resulted from the melting of pure elements (Alfa Aesar, purity > 99.9%) in a high frequency induction furnace (CELES, France). Heating was achieved until total melting by increasing the input voltage up to 5 kV, for a frequency of about 100 kHz. To avoid oxidation of the most reactive elements as well as any risk of vaporization, the internal atmosphere was composed of 400 mbars of pure argon. After chemical homogenization in the liquid state at about 1600 °C for 5 min, helped by the induced electromagnetic stirring, cooling and solidification and cooling controlled by the decrease in voltage. Two ovoid ingots, weighing 40 g, were obtained. They were cut in several parts using a Buelher metallographic saw.
2.3. Chemical and Metallographic Control of the Obtained Alloys
For each alloy, a part was embedded in resin, ground (SiC papers from #240 to #1200), long rinsed and polished (textile disk with 1 µm hard particles). This led to a metallographic sample with a mirror-like state ready to observe with microscope.
The microstructures were examined with a Scanning Electron Microscope JEOL JSM 6010LA (tungsten filament, 20 kV, Back Scattered Electrons mode) at different magnifications. The chemical compositions were estimated using the Energy Dispersion Spectrometer attached to the electron microscope.
2.4. Measurement of the Melting Temperatures
Prior to exposure to 1250 °C—a particularly high temperature for cast Ni-based superalloys reinforced by eutectic carbides—Differential Thermal Analysis was carried out to verify that both alloys were solid at this temperature. A double thermal cycle was successively applied to a 2 × 2 × 6 mm3 parallelepiped placed in a small alumina crucible. The first one was to re-melt and homogenize the alloys, and the second one to determine the temperatures of solid → liquid and liquid → solid transformations. Each cycle was composed of a +20 °C min−1 heating up to 1200 °C, +5°C min−1 from 1200 to 1500 °C, a −5 °C min−1 cooling down to 1200 °C and a −20 °C min−1 down to ambient temperature.
2.5. Exposures to High Temperature
For each alloy a parallelepiped, with dimensions equal to 3 × 3 × 10 mm3 and with faces ground/edges and corners smoothed, by polishing, was suspended in a device made of alumina-sheathed platinum wires, in the hot zone of the resistive furnace of a thermobalance (TGA92, SETARAM, Caluire-et-Cuire, France). The applied thermal cycle was composed of a heating at +20 °C min−1 up to 1250 °C, followed by a 50 h-long isothermal stage at this maximal temperature, and of a cooling at −5 °C min−1 down to ambient temperature. The sample was exposed to a continuous 1.5 L h−1 flow of dry synthetic air (80%N2–20%O2) the entire time. This test was applied for one sample per alloy.
2.6. Determination of the Kinetic Constants
The isothermal mass gain curves were plotted to have a look to their shapes. In case of parabolic shape demonstrating that oxidation may obey the Wagner’s law, the parabolic and chromia volatilization constants were determined, according to the procedure described in an earlier work [21]. The heating and cooling parts of the mass variation curves plotted according to the {mass variation versus temperature} scheme, which allowed, additionally, analyzing the start of oxidation and the possible oxide spallation, respectively [22]. This was done after having corrected the mass gain files from the mass variations artificially induced by the air buoyancy variations, using a method described and used in [22].
2.7. Oxides Analysis Prior to Cutting
The oxidized alloys were carefully removed from the alumina-sheathed platinum suspension and subjected to X-Ray Diffraction (D8 Advance, BRUKER, USA) to identify the oxides formed externally (and also internally close to the surface) that remained on the surface after returning to room temperature and handling.
An extra-thin gold layer, deposited using a cathodic pulverization device (JFC-1200, JEOL, Japan), allowed obtaining oxidized surfaces that were electrolytically conductive. These ones were observed with an electron microscope in Secondary Electrons mode. Afterwards, the oxidized samples were covered all around with a metallic shell formed by electrolytic deposition of nickel in a Watt’s bath heated at 50 °C (1.6 A/dm2 for 2 h).
2.8. Oxides and Alloys Analysis after Cutting and Metallographic Preparation
Protected by a nickel shell, the oxidized samples were sectioned, again using the Buelher metallographic saw. The two halves were embedded in resin (ESCIL resin and hardener), ground (SiC papers from 240 grit to 1200 grit), ultrasonically washed and rinsed and polished with a rotating textile disk supporting hard particles (granulometry: 1 µm). The obtained mirror-like metallographic samples were thereafter subjected to cross-sectional observation of the external and internal oxides, in Back Scattered Electrons mode. Energy Dispersion Spectrometry spot analyses were performed to specify the oxides natures and the chemical composition in the most external part of the alloys. The bulk microstructures were also observed and chemically analyzed to characterize the consequences of the exposure at 1250 °C.
3. Results and Discussion
3.1. Characteristics of the Obtained Alloys
Examination of the two alloys showed outward evidence of complete melting. Cross-sectional examination did not show any unmelted regions. The embedded, ground and polished as-cast samples were then first observed and analyzed using the scanning electron microscope (SEM) in back scattered electrons mode (BSE) and its energy dispersive spectrometer (EDS).
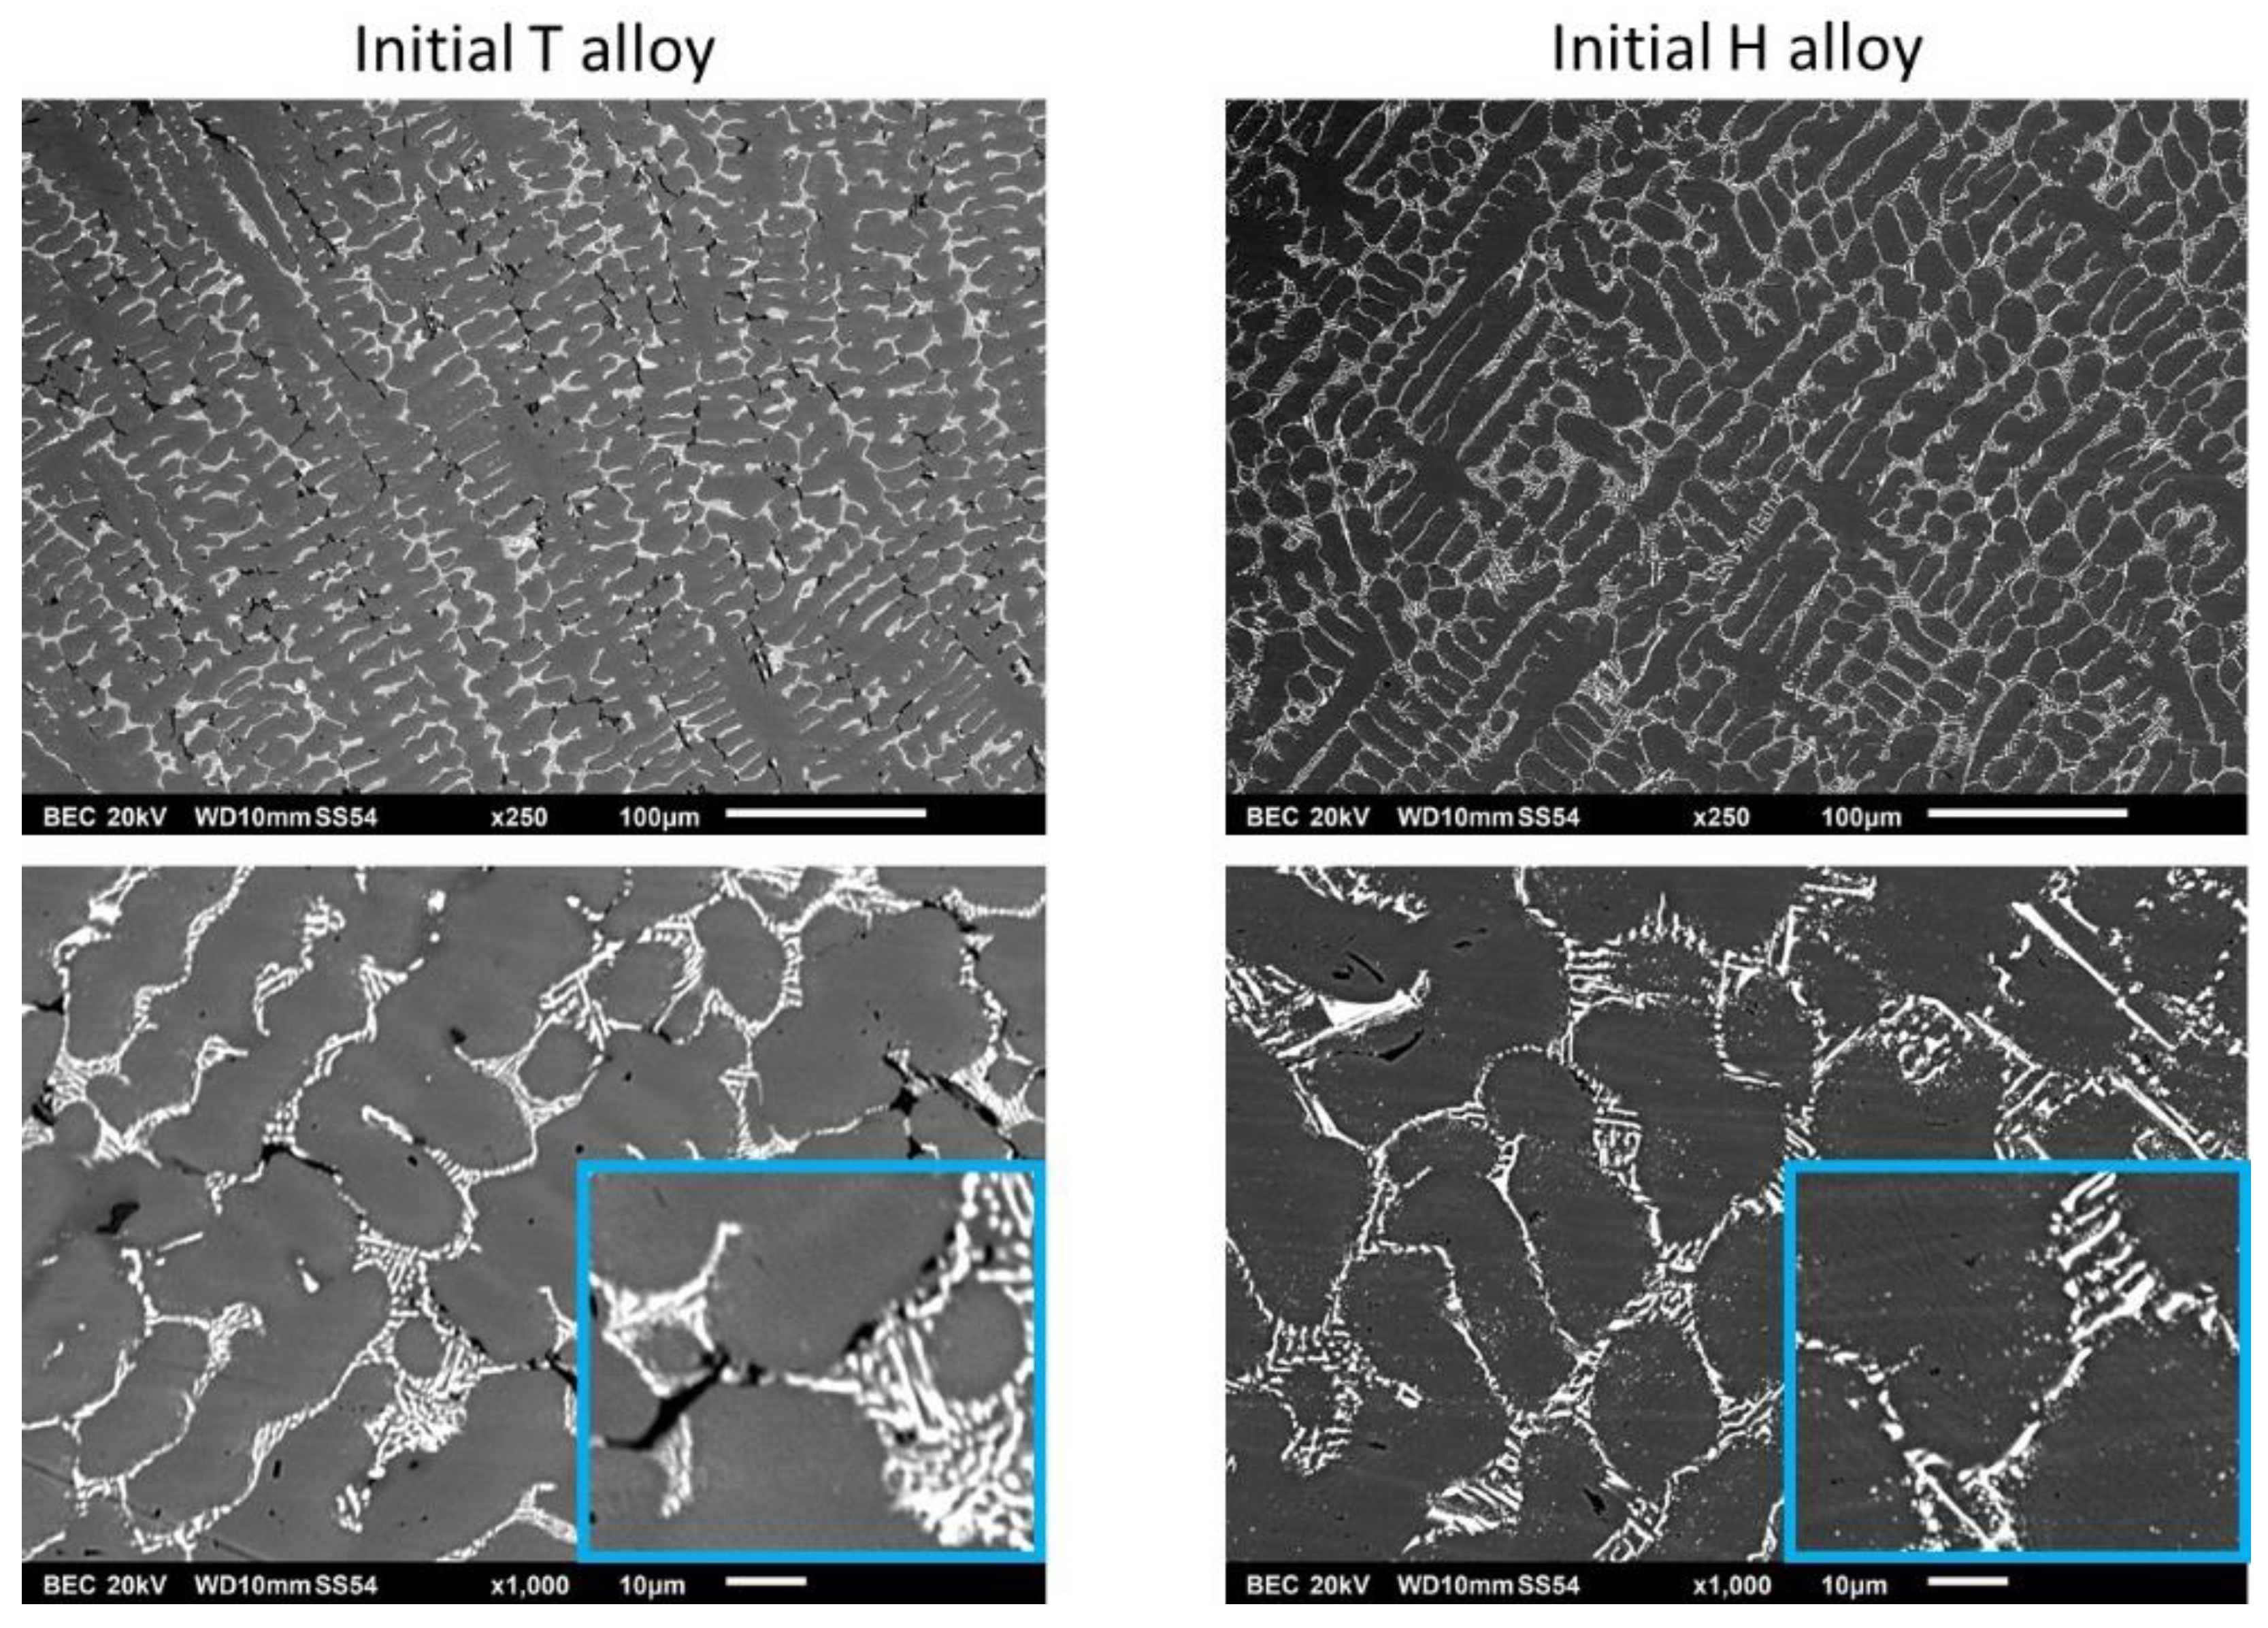
The microstructures of the two alloys are illustrated in Figure 1, with, for each of them, a ×250 BSE image for a general view accompanied by a ×1000 BSE one for better seeing the different phased and particles. On the general one, it can be seen that the matrixes of both alloys are dendritic and seemingly free of other possible pre-eutectic particles. In addition to the matrix, other phases are present, interdendritically. Obviously, the T alloy contains two other phases than matrix, a white one and a black one, at a lower quantity than the brighter one. In contrast, the H alloy only contains the white phase. The ×1000 images allow identifying the white phase as being probably one of the two components of a eutectic compound since it is closely imbricated with the outermost parts of the matrix dendrites. Moreover, the script-like shape of these particles suggests MC carbides. For both alloys, the spot EDS analyses performed on the coarsest particles of the metallographic sample surface evidenced high concentrations in Hf, Ta and C in the white phase and high concentrations in Cr and C in the black ones, demonstrating that they are carbides of hafnium and tantalum simultaneously and chromium carbides, respectively. More precisely, it seems that the atomic Hf and Ta contents in the white carbides present in the as-cast T alloy are similar to one another, and that their sum is similar to the carbon content. The composition of the white carbides present in the as-cast H alloy is different: the Hf contents in this phase is twice that of Ta. The black carbides present in the T alloy only contains two times more chromium than carbon: they are obviously Cr7C3 carbides.
Concerning the matrix, its chemical composition is not the same for the two alloys. The T alloy’s matrix contains 0.5 wt.%Cr less than the H alloy’s one (25.2 against 25.7 wt.%Cr), but its Ta content is two times higher than the H alloy matrix (3.5 against 1.7 wt.%Ta). It must be also noted that, in both cases, Hf is totally absent from the matrix.
The general chemical compositions of both alloys were, of course, also controlled. They are displayed in Table 1. The chromium contents are well respected (very close to the targeted ones). This is not really the case of the Ta and Hf elements, the contents of which are in excess by comparison to what was introduced. Taking into account that the masses obtained for the ingots were exactly the same as the total mass of all the elements introduced in the crucible of the furnace, and taking also into account the very high melting points of Hf and Ta (in comparison with those of nickel and chromium) as well as their much higher sensitivity to oxidation (by the oxygen traces necessarily present in the pure argon), it is clear that the contents in Hf and Ta are also well respected, despite their contents being curiously higher than desired. The overestimation of these heavy strong carbide-forming elements is classical when they are present in a dense carbides network emerging on the mirror-like surface. Concerning carbon, even though it is analyzable by EDS in coarse carbides, the content of this light element in a low carbon metallic alloy cannot be specified. By considering the rather dense carbide networks which were obtained, one can guess that its content is also well respected.
Concerning the chemical compositions of the matrixes of these two alloys in their as-cast states (spot analyses, Table 1), one can see that the Ta content in the T alloy’s matrix is twice the one in the H alloy matrix, showing almost the same ratio as for the whole alloys (the T alloy contains two times more Ta than the H alloy). It is noticeable that Hf is totally absent from the matrix; consequently, it is only present as carbides. The carbides were more difficult to analyze because of their small sizes. However, spot analyses carried out on the coarsest ones existing in the samples allowed observing that the MC carbides present in the T alloy were almost exclusively of the TaxHfxC type (with x = 0.5), while the ones present in the H alloy were TayHfzC (with y = 0.3 and z = 0.7). It appears too that the chromium carbides additionally present in the T alloy are Cr7C3.
To summarize, the two alloys were, thus, successfully obtained by the applied casting procedure and they seem to be potentially efficiently reinforced by carbides, which are present in great quantities, mixed with the periphery of the dendrites of matrix. A first difference between the microstructures of the two alloys is that more Hf and less Ta—for a same total quantity—seems to further promote the MC carbides while excluding chromium carbides. The composition of the MC carbides also seems to be governed by the Hf/Ta ratio, as well as the chemical composition of the matrix (particularly its Ta content). Hf appears as a stronger carbide-former than tantalum. It tends to impose itself as the priority metal in carbide and tantalum must be shared between the remaining place available in the carbide phase and the matrix solid solution (in which Hf does not enter, obviously). The presence of the little quantity of chromium carbides in the T alloy is responsible of a slightly lower Cr content in the matrix. However, these chromium carbides are much less present (and MC carbides much more present) than in an earlier studied Ni-based alloy with similar composition except the absence of hafnium (Ni(bal.)–30Cr–0.4C–6Ta) [23], which contained more Cr7C3 carbides than TaC carbides: the MC-promoting effect of hafnium, visible here between the two alloys of the present work, also induced the MC enrichment of the T alloy by comparison to this Hf-free older alloy.
3.2. Preliminary Thermal Analysis of the Two Alloys
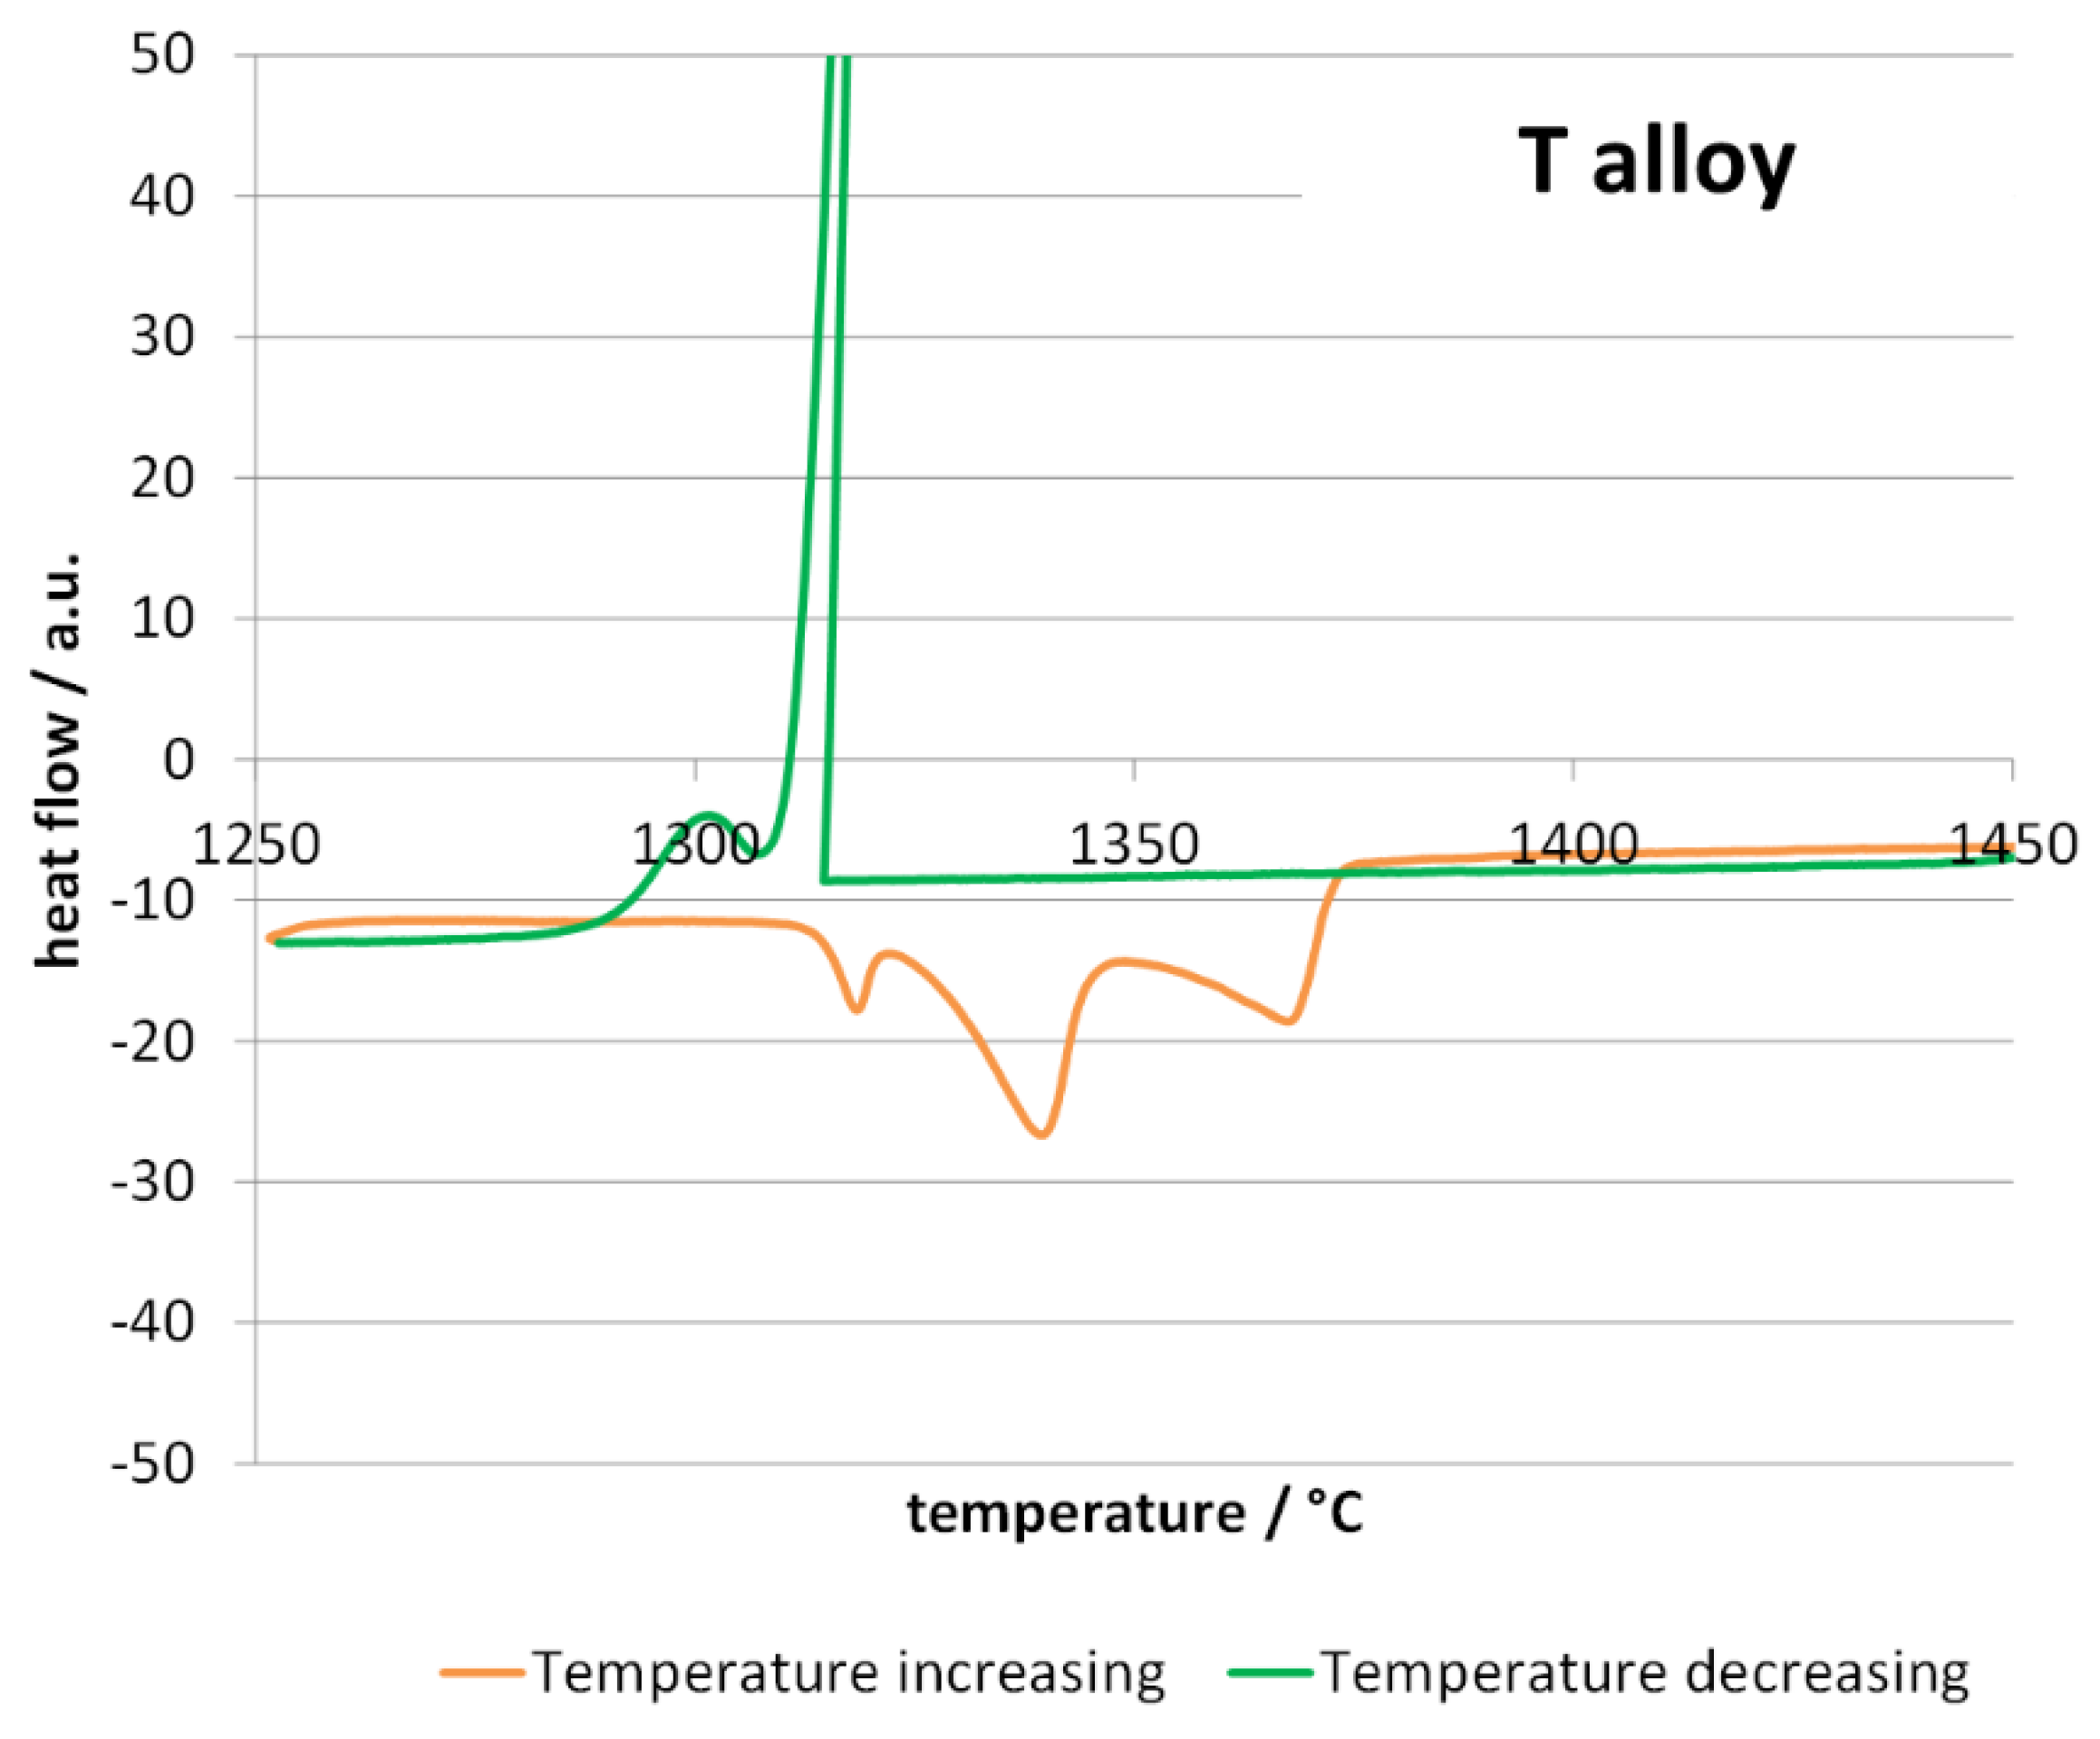
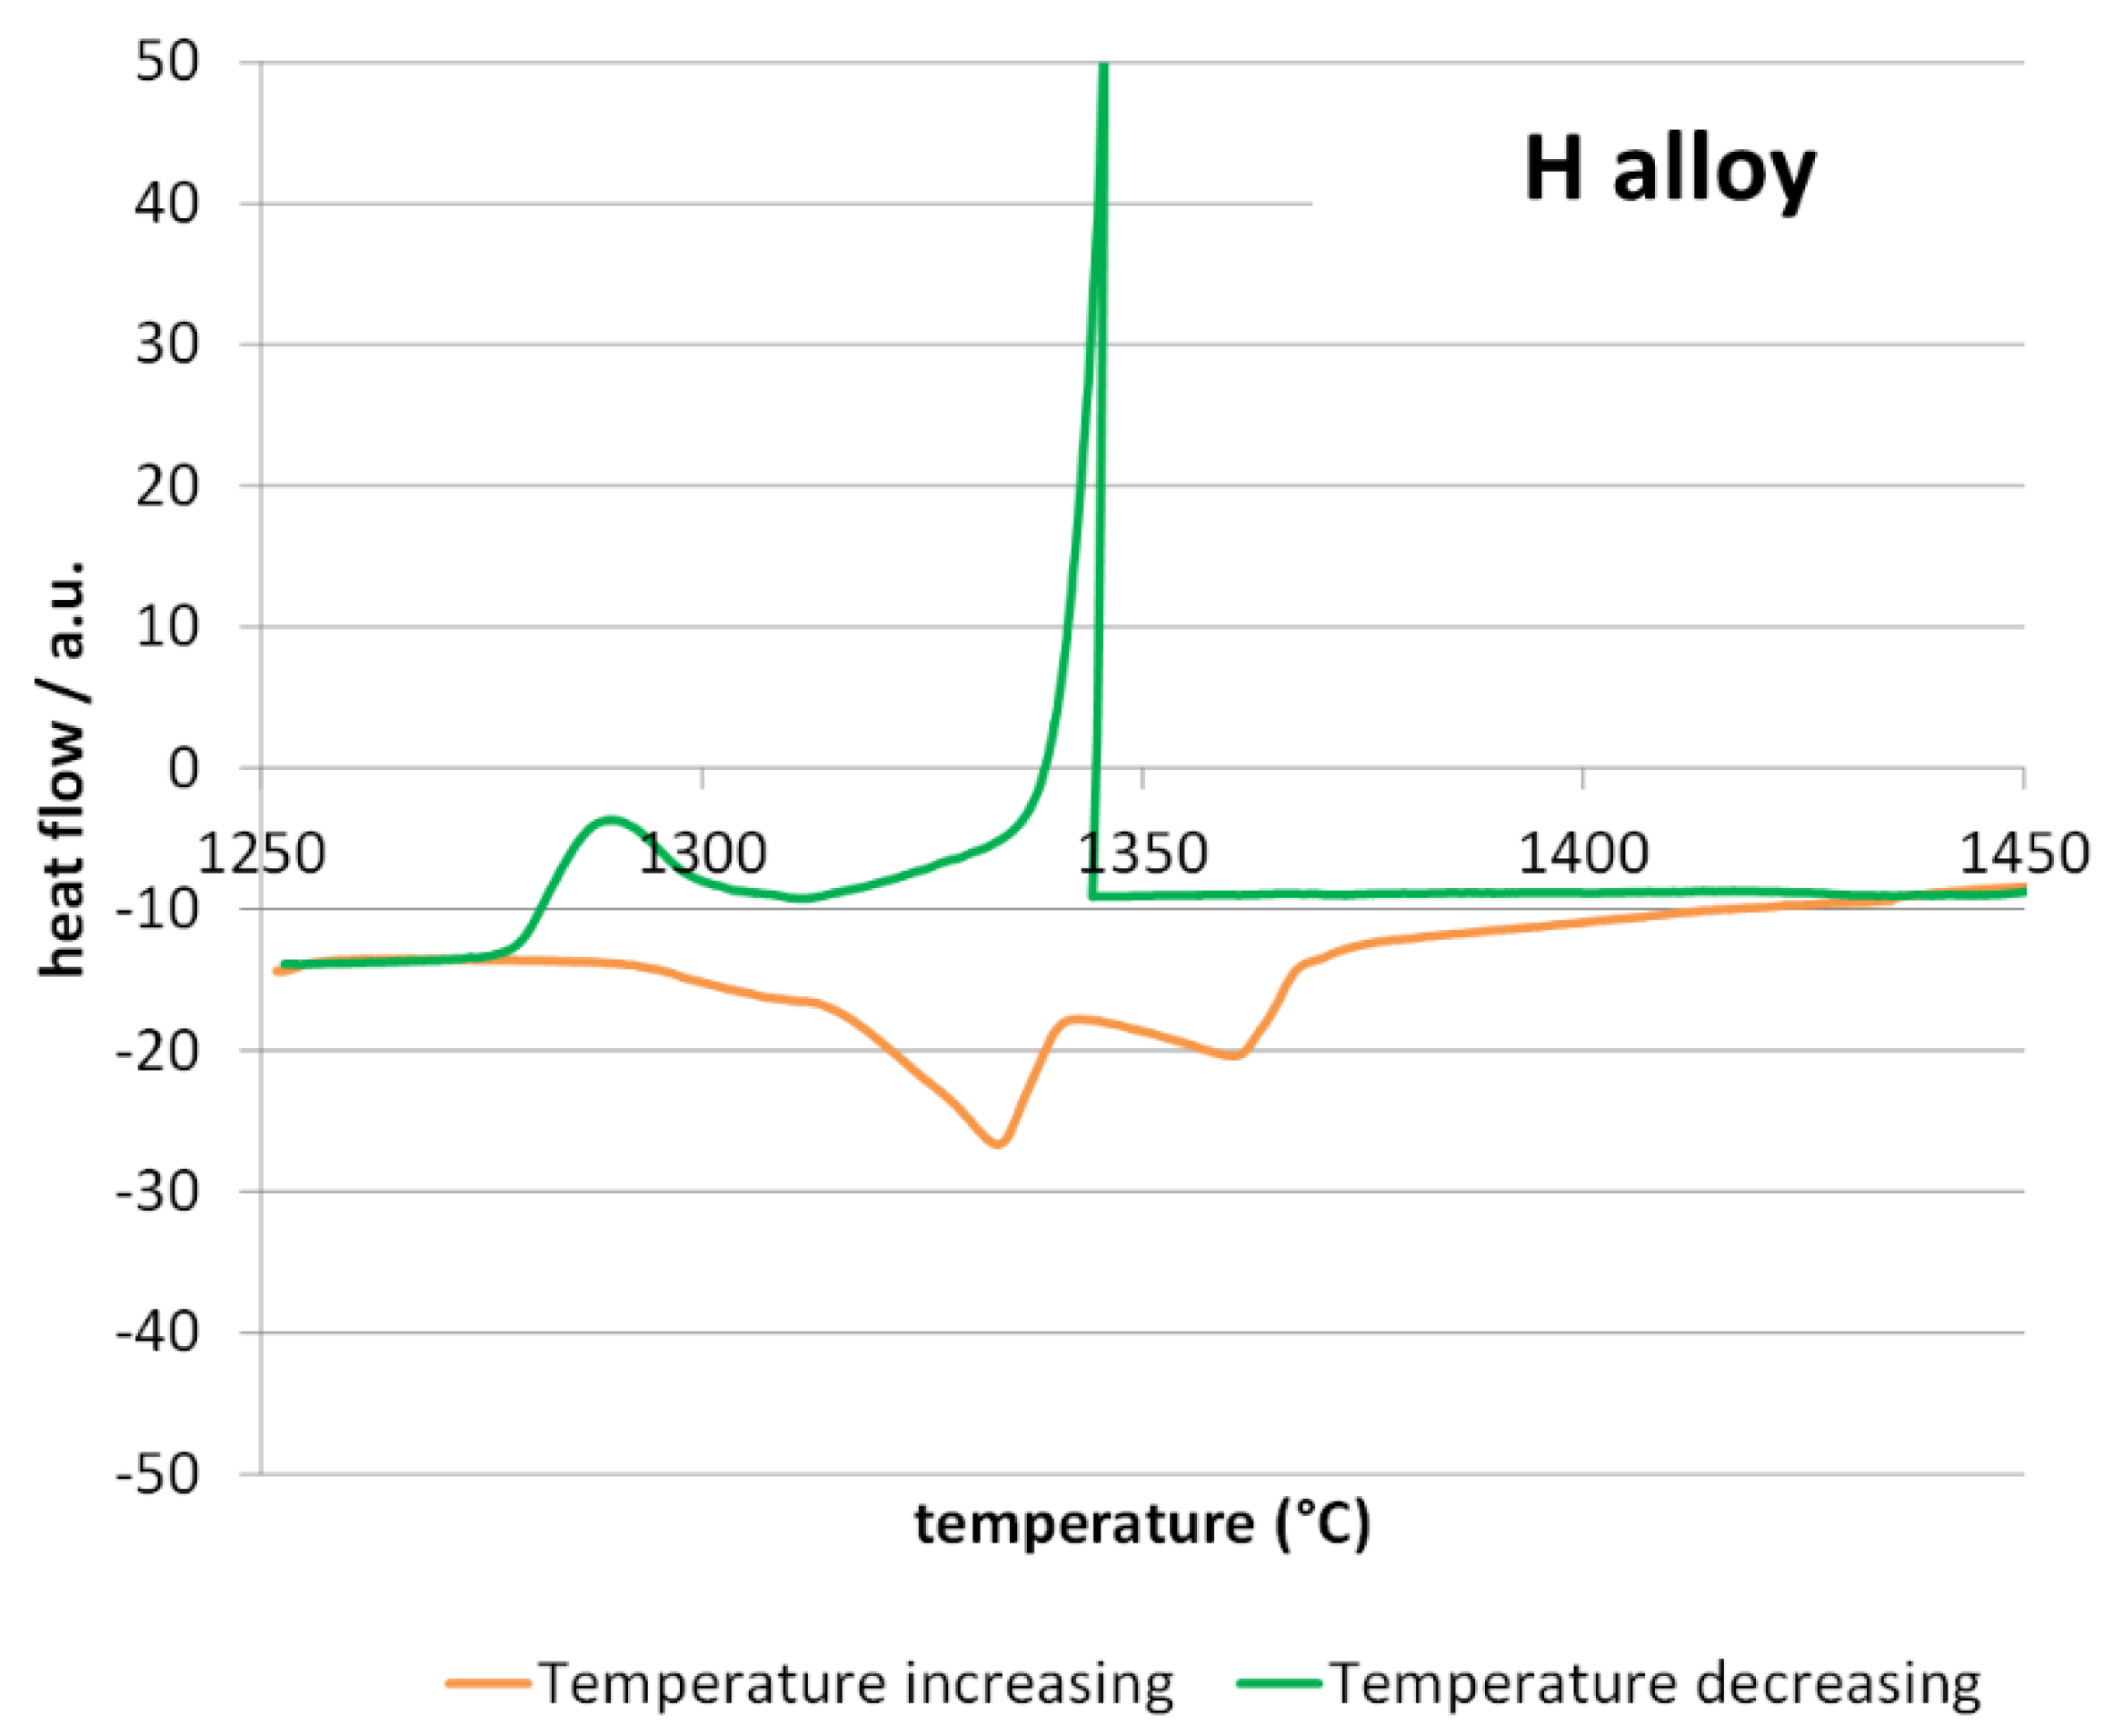
Before performing the oxidation tests at 1250 °C differential thermal analysis (DTA) runs were carried out on samples coming from the two ingots. The high temperature parts of the DTA curves are plotted in Figure 2 for the T alloy, and in Figure 3 for the H alloy. The melting of the T alloy (Figure 2) was achieved with three steps (three endothermic peaks in the orange heating curve), while only two exothermic peaks appeared on the green cooling curve. Similar features are encountered for the DTA curve of the H alloy, except that the first endothermic peak is very discrete and enlarged. As usually observed, the peaks observed in the heating part and the ones observed in the cooling parts for the inverse alloy transformations are staggered from one another, due to the delay of nucleation of the new phases (particularly for the start of solidification).
One can guess that the first endothermic peak (evident for the T alloy, almost invisible for the H alloy) corresponds to the melting of the {matrix and Cr7C3}-eutectic. The second one and the third one certainly correspond to the melting of the {matrix and MC}-eutectic and the pre-eutectic matrix. Concerning the exothermic peaks observed in the cooling parts of the DTA curves, the first one corresponds to the crystallization of the matrix dendrites and the second one to the two eutectics obviously precipitating more or less simultaneously. The sharpness of the first exothermic reaction evidences a possible difficult nucleation of the matrix.
All the temperatures of start and end of melting and solidification that can be deduced from the exploitation of the two DTA curves are displayed in Table 2. In this table, an estimation of the solidus and liquidus temperature is done from these measured temperatures. Logically, none of the two alloys melt at a temperature lower than 1250 °C and the planned oxidation/HT exposure tests ought to be driven without risk of melting of the alloys. However, the solidus temperatures are not much higher than 1250 °C, and it can be feared that these alloys are not really suitable for service at this temperature when significantly intense stresses are applied.
3.3. Oxidation Tests: Mass Variation Kinetics
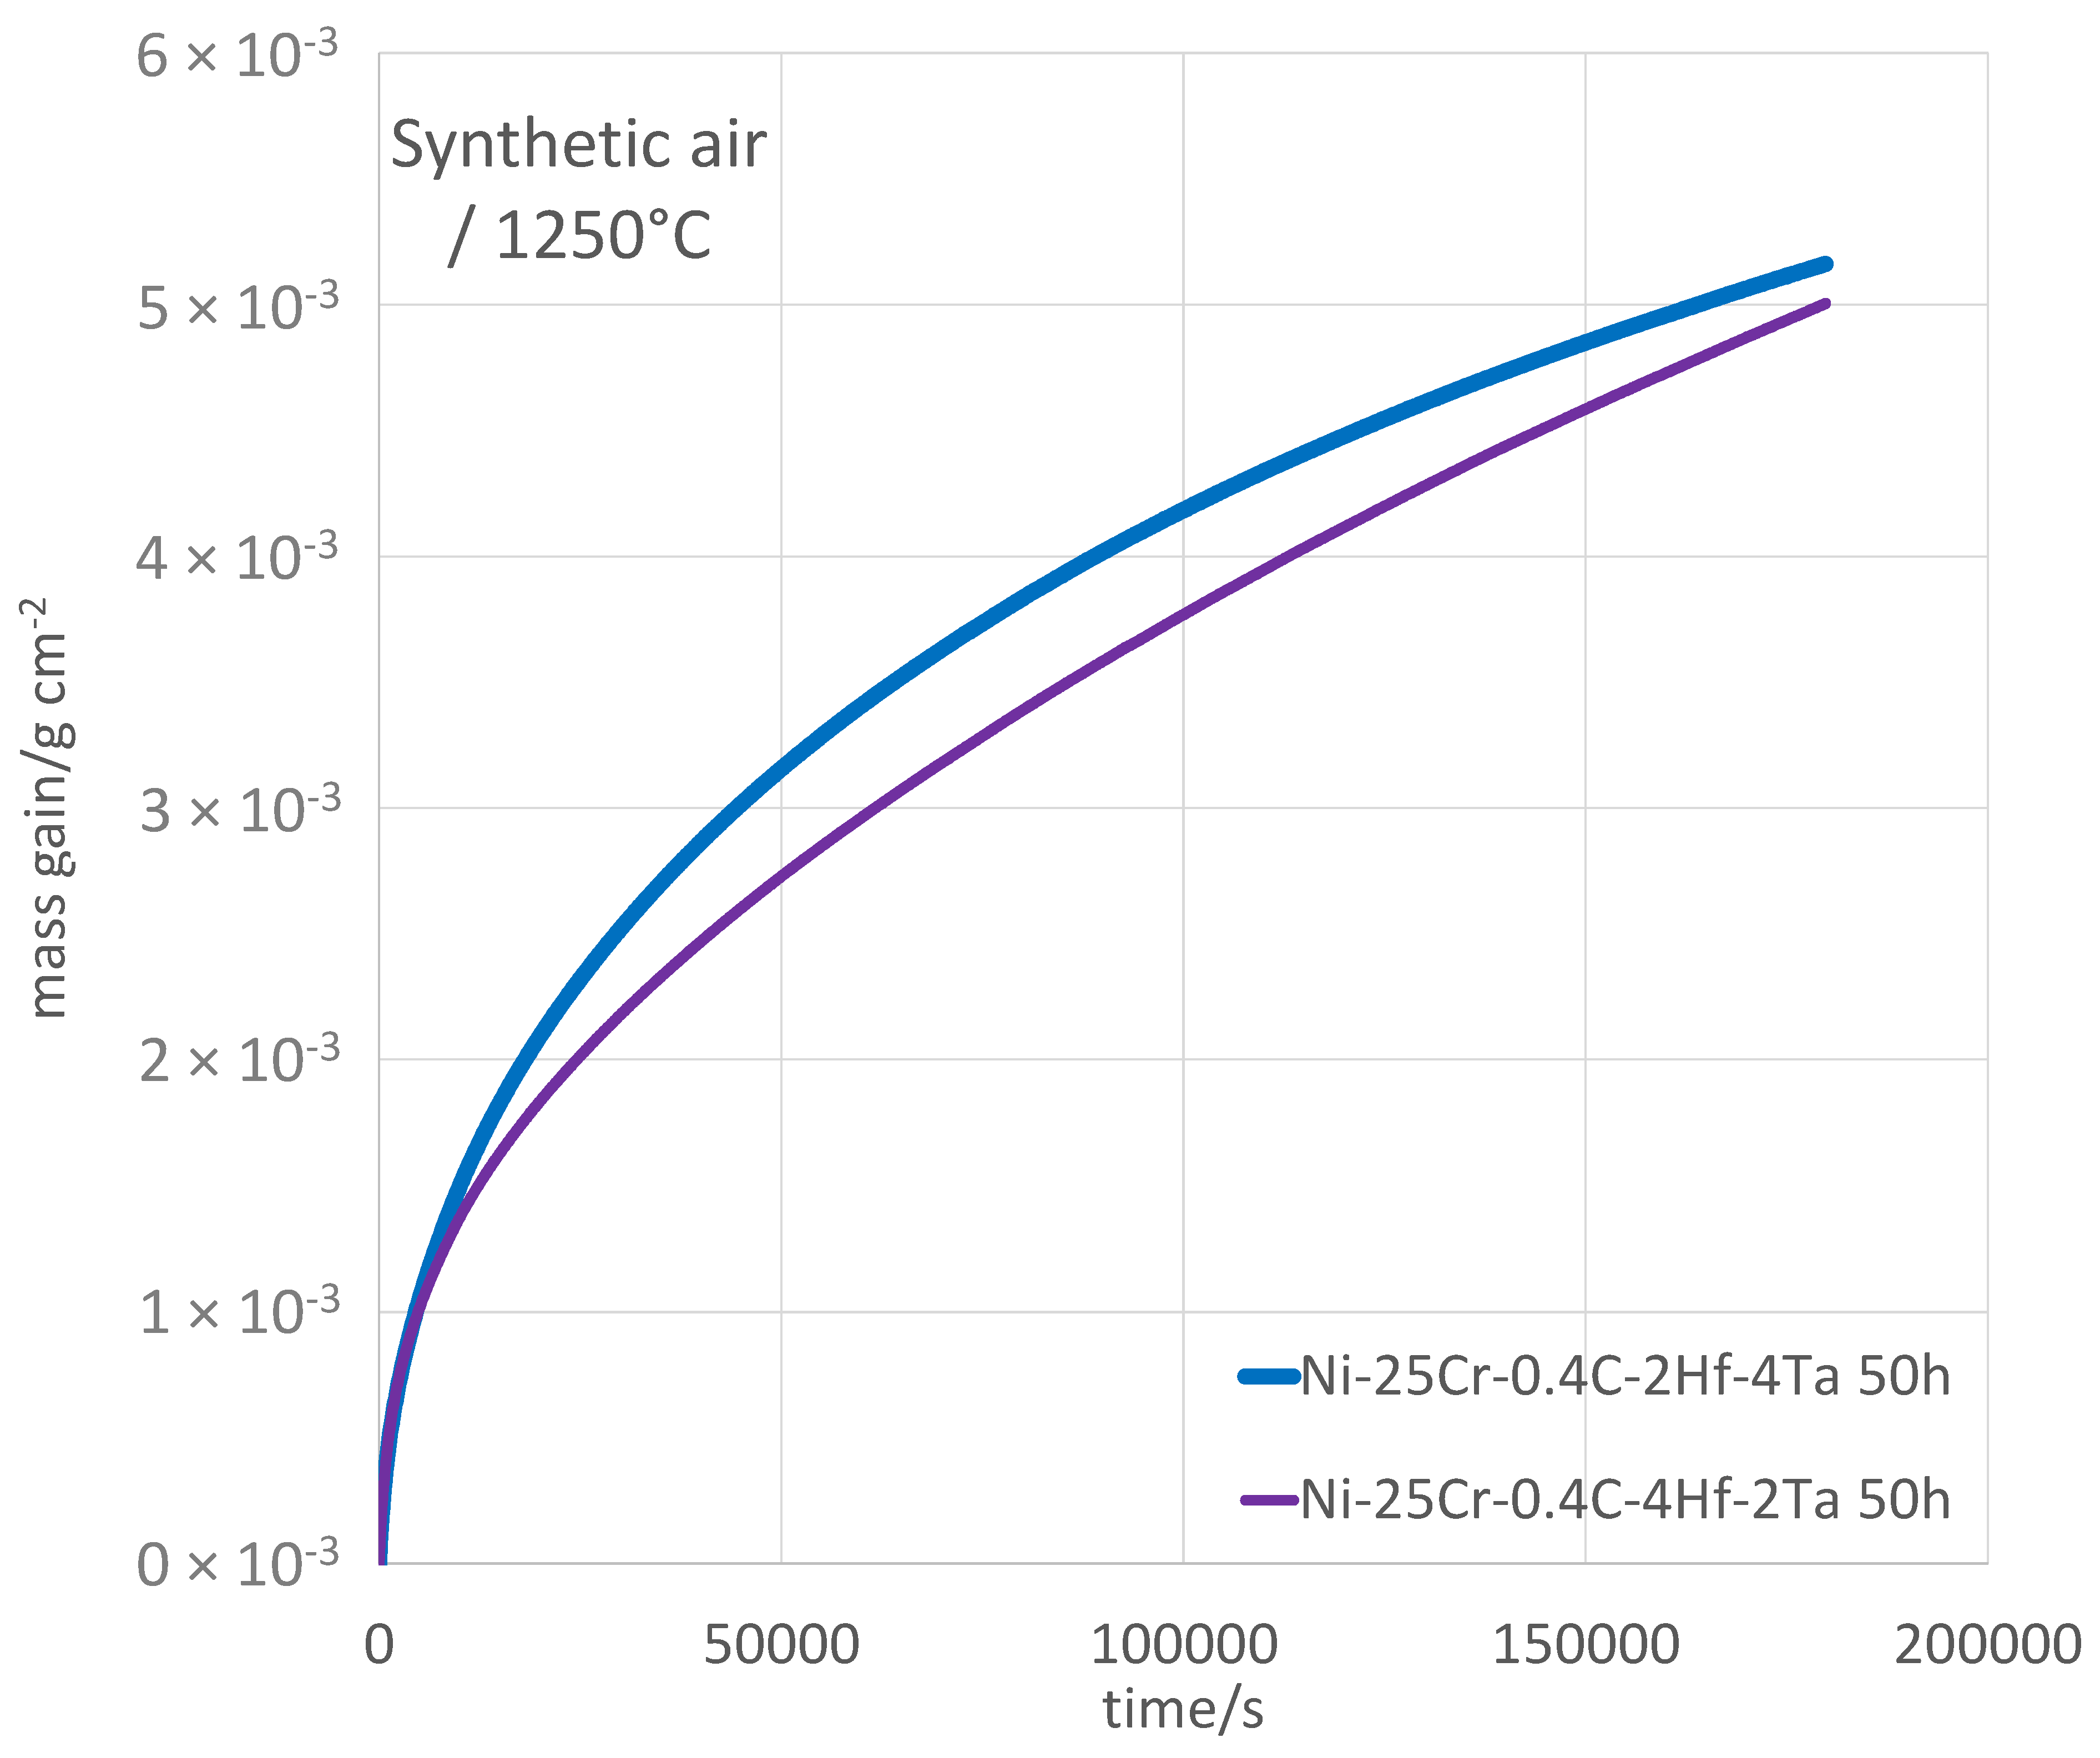
Plotting the isothermal mass gain versus time (Figure 4) shows that the two alloys certainly developed a protective chromia scale. First, the two kinetics are globally parabolic, and thus, show that the oxidation rate is controlled by the diffusion of species through a continuous oxide scale. Second, by observing that the mass gains achieved after 50 h are rather moderate taking into account the exceptionally high temperature level, one can guess that this oxide scale is composed of chromia essentially. One can observe that the mass gain curve for the T alloy rises less frankly than for the H alloy. Consequently, one can suspect a faster linear mass loss by chromia volatilization for the first alloy. In any case, one can say that these two curves—only one per alloy as we must remind—suggest that the oxidation kinetic is of the parabolic type for both alloys. One can also notice the absence of any jumps in the mass gain curves, which would reveal unsticking of the external oxide scales under the effect of growth compressive stresses. This is rather remarkable since such phenomenon tends to be favored by thick scales, as what one can expect at such high temperatures.
The exploitation of these curves led to the values of the different types of kinetic constants which are displayed in Table 3. One can first notice that the linear kinetic constant Kl, which describes the oxidation speed at the beginning of the isothermal stage and which is estimated as the slope of the tangent to the start of the isothermal oxidation mass gain curve, is globally the same for the two alloys. Its value—80 × 10−8 g/cm2/s— is logically comprised between the two Kl values earlier determined for a chromia-forming Ni-30Cr alloy at 1200 °C (30 × 10−8 g/cm2/s) and at 1300 °C (125 × 10−8 g/cm2/s) [21]. This is the same for the parabolic constant if this one is classically determined from the slope of the {mass gain versus square root of time}-plot: 80 × 10−12 g2/cm4/s for both alloys, comprising the two Kp values earlier determined classically for a chromia-forming Ni-30Cr alloy at 1200 °C [21]. Note that the real values of Kp and the ones of Kv issued for this Ni-30Cr alloy from the {m × dm/dt = f(m)}-plot (m representing the mass gain per surface unit area) were Kp = 67 × 10−12 g2/cm4/s at 1200 °C and 245 × 10−12 g2/cm4/s at 1300 °C [21]. Here, at 1250 °C, with 174 × 10−12 g2/cm4/s for the T alloy and 87 × 10−12 g2/cm4/s for the H alloy, one can see that all the results are consistent, but also that the H alloy seems to oxidize slower than the T alloy and even than the Ni-30Cr alloy for an equivalent temperature. A look at the volatilization constants of the alloys of this study shows that the results are consistent for the T alloy and the Ni-30Cr alloy, since the values obtained for at 1250 °C for the T alloy (224 × 10−10 g/cm2/s) is between the Kv values 157 × 10−10 g/cm2/s (1200 °C) and 276 × 10−10 g/cm2/s (1300 °C). In contrast, the volatilization rate of the H alloy (27 × 10−10 g/cm2/s) appears to be remarkably low in comparison with the two other alloys.
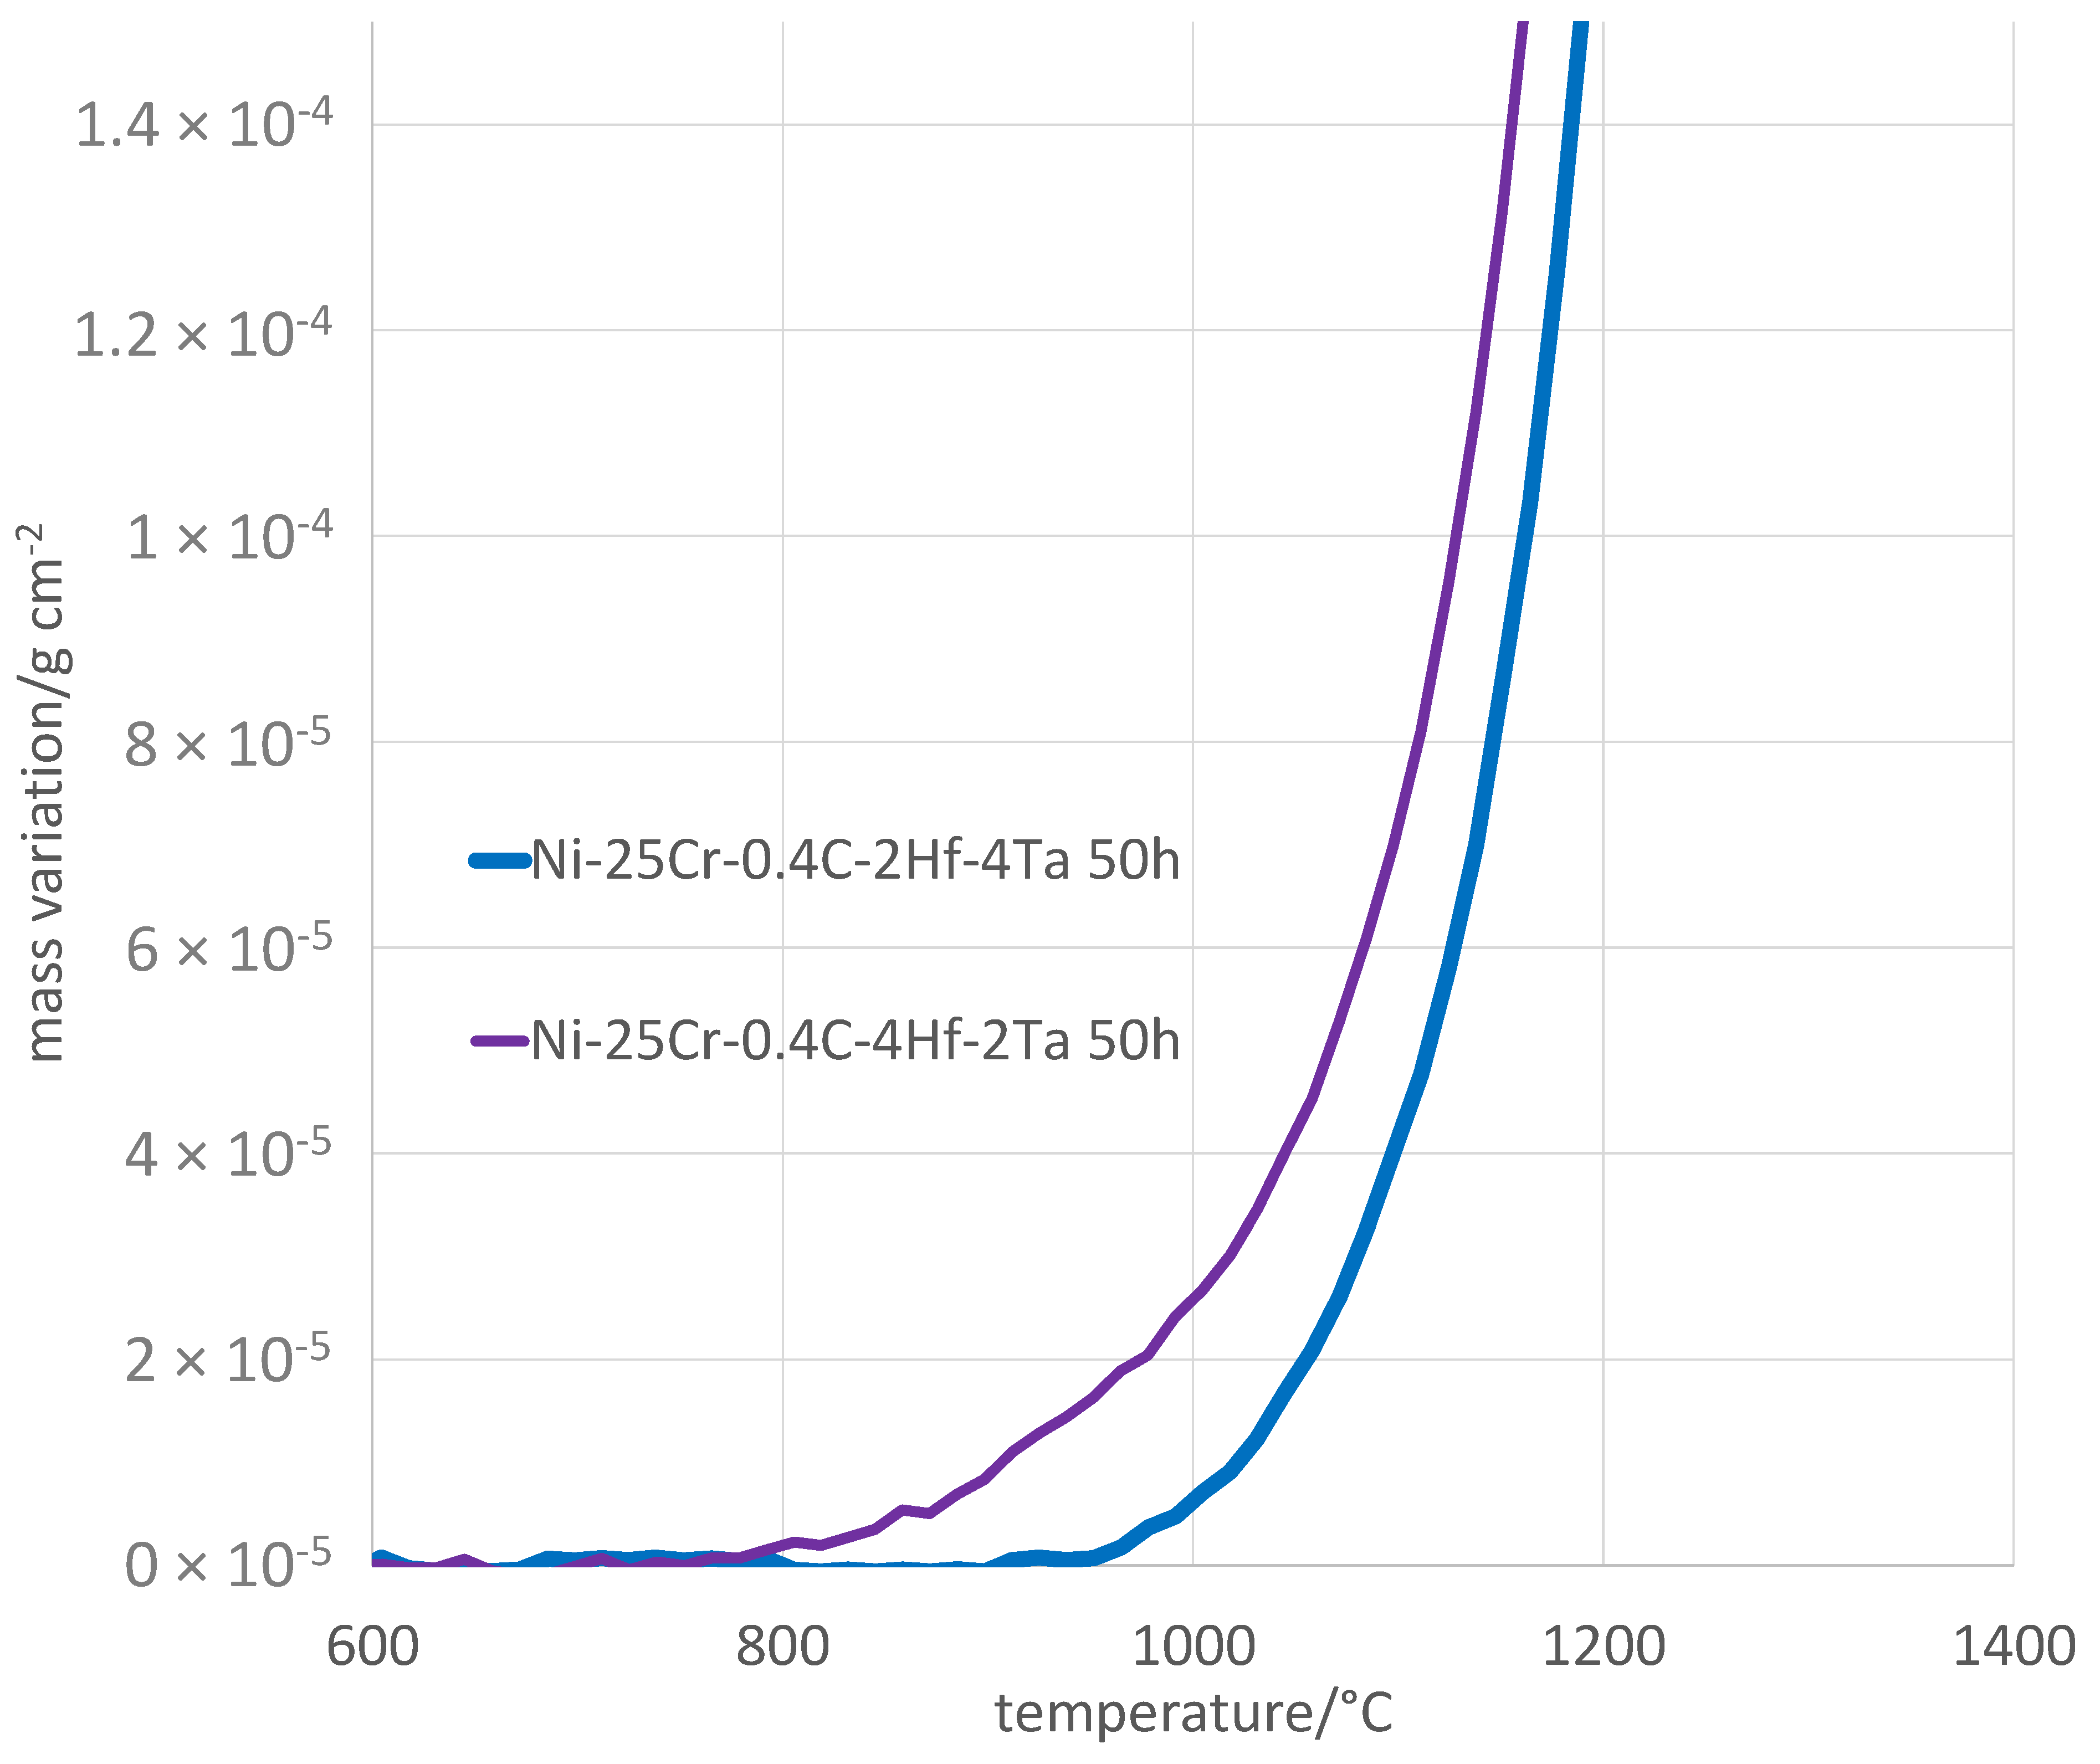
By plotting the mass gain, no longer versus time but versus temperature, one can access additional information concerning oxidation [22]. Preliminarily, it is compulsory to correct the values from the air buoyancy variation, which can be done as described in an earlier work [22]. This type of plotting allows first observing how oxidation started during heating. The enlargement of the high temperature part of the heating mass gain curves shows that the H alloy started oxidizing sooner than the T alloy (Figure 5), when the temperature was still just below 800 °C, while mass gain detection was effective 140 °C higher for the T alloy (Table 4). Consequently, the mass gain achieved for the H alloy was greater than for the T alloy when the stage temperature was reached (430 against 350 µg/cm2). In contrast, the transient oxidation rate was sensibly the same for the two alloys (almost 1 µg/cm2/s), close to the values of Kl in Table 3.
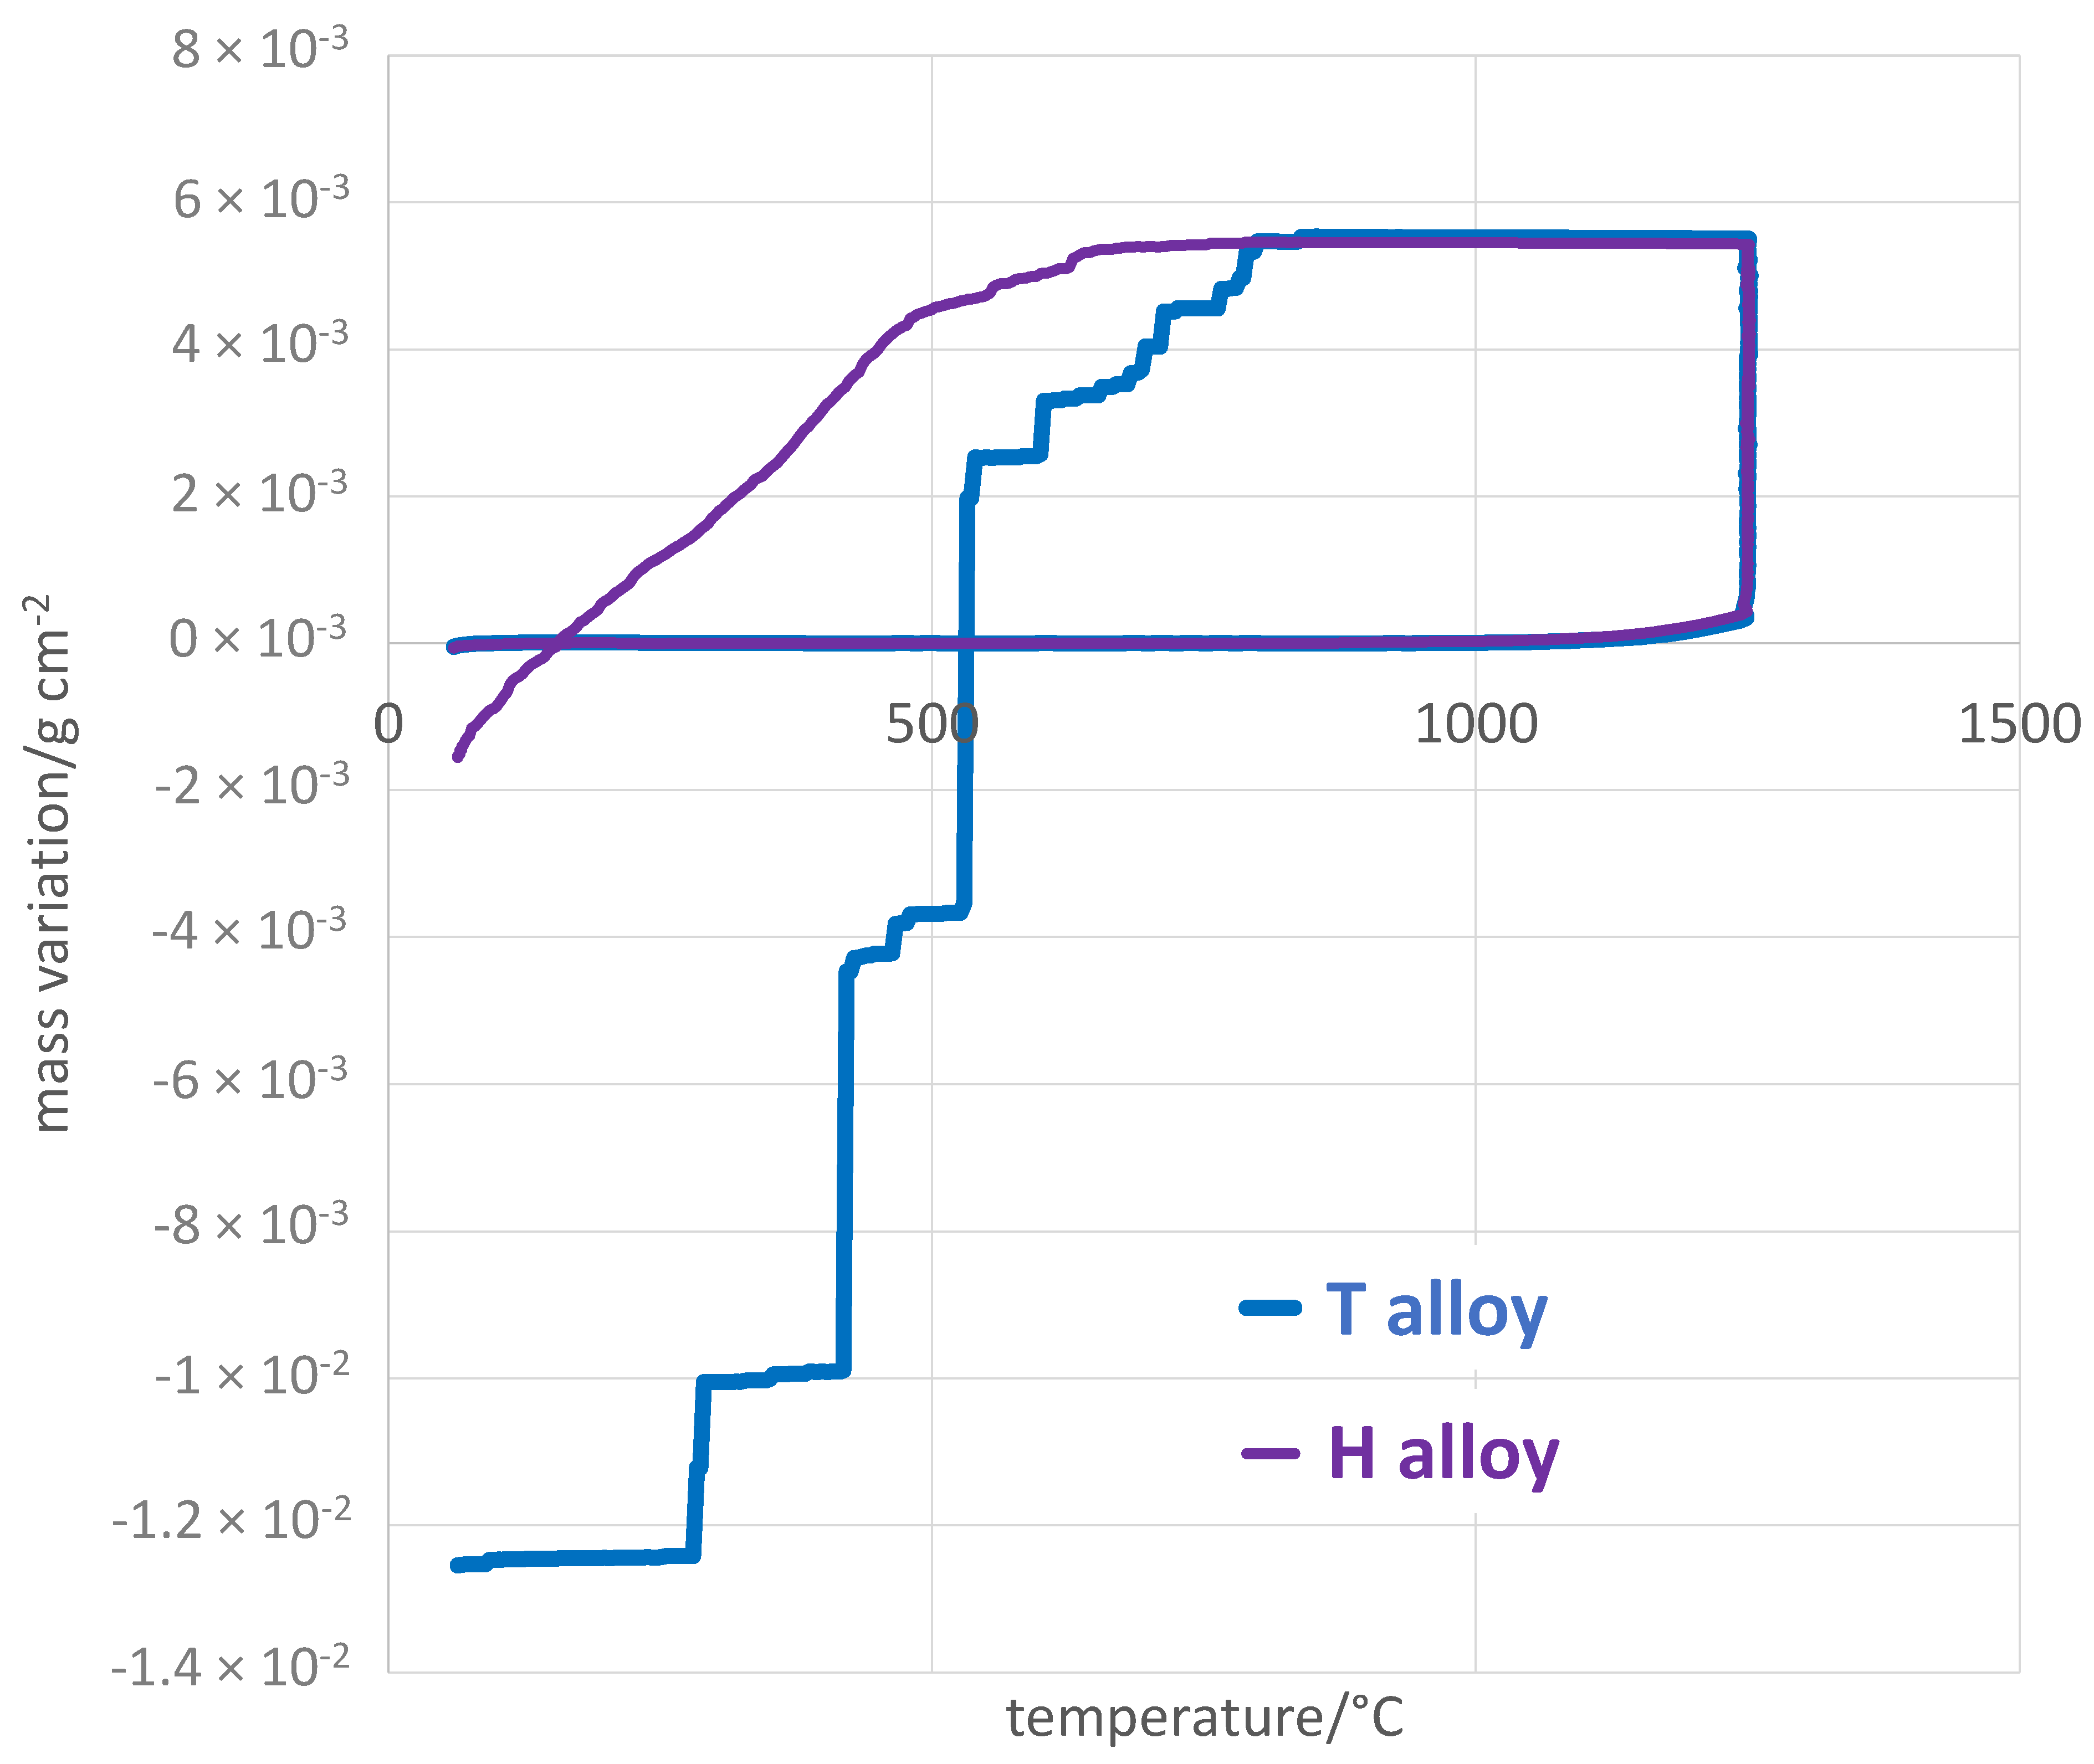
The last exploitation of the mass variation files concerns the cooling part. By plotting the mass variation versus temperature when temperature decreases after the end of the isothermal stage, one can detect the possible loss of the oxide scale part by the observation of mass loss (Figure 6). For both alloys, cooling from 1250 °C is accompanied, when done for the first time, by the absence of variation of the mass of the oxidized sample, since the measures were corrected from air buoyancy variation. However, after about 400 °C of cooling of the T alloy and more than 500 °C of cooling of the H alloy, mass losses start manifesting. The mass change shows step-wise decreases, indicating significant spallation of the outer oxide was occurring. This spallation phenomenon also occurred for the H alloy, but much more regularly and with much more limited losses. Consequently, the total mass variation all along the total thermal cycle was negative and with a much greater amplitude for the T alloy than for the H alloy (Table 5). Obviously, the resistance of the T alloy against oxide spallation at cooling T alloy was catastrophic while the H alloy resisted much better to this phenomenon.
Thus, the kinetic behaviors of the two alloys in oxidation at 1250 °C are globally good, but contrasted when the alloys are compared to one another. An important point is that they both clearly behave as chromia-forming alloys, which will be confirmed in the next paragraph. This results in isothermal oxidation rates which are rather slow, taking into account the very high temperature of the test. However, it seems that the conditions of re-oxidation of chromia in gaseous CrO3 are not the same between the two alloys. The Hf-richest one seems to be less affected by the volatilization of chromia than the other alloy. This is maybe a consequence of the higher presence of Hf in the H alloy—an element particularly susceptible to oxidation—the oxidation of which may bring a mass contribution which does not allow the used treatment method [21] to correctly determine the two constants, Kp and Kv. Hf surely plays a particular role in the reactivity of the alloy, as shown, for example, on the heating part of the thermogravimetric curve. Indeed, one can see a start of detectable mass gain significantly earlier for the H alloy than for the T alloy, which is maybe due to the more direct exposure of Hf to hot air (more present in and exclusive to carbides). The fact that the Hf-containing alloy was rich in carbides which emerged on the surface facilitated its oxidation, even at medium temperatures during the heating. In contrast, as soon as chromia developed (mainly during the isothermal stage), the differences between the two alloys were smoothed. However, the initial oxidation of hafnium during heating may have generated oxides which had an influence on chromia volatilization.
The hafnium oxides very likely played a major role during the cooling, by favoring the adherence of chromia on the alloy surface, which resulted in a much better oxide spallation behavior of the H alloy. The resistance of the T alloy against oxide spallation was clearly worse; however, it was better than the one of the Hf-free Ni–30Cr–0.4C–6Ta alloy earlier studied [24], for which the development of the sub-surfacic CrTaO4 oxide between the chromia and alloy suppressed the adhesion of the scale on the substrate. Here, the addition of 2 wt.%Hf (T alloy) allowed a limited inhibition of this scale spallation, and the addition of another 2 wt.%Hf (H alloy) significantly improved the scale adherence further. To finish with this point, the reader is reminded that a Ta-free Ni–25Cr–0.5C–6Hf alloy retained its chromia external scale after almost 50 h at 1200 °C, cooled at the same rate as in this study [25].
3.4. Oxidation Tests: Characterization of the Oxidized States
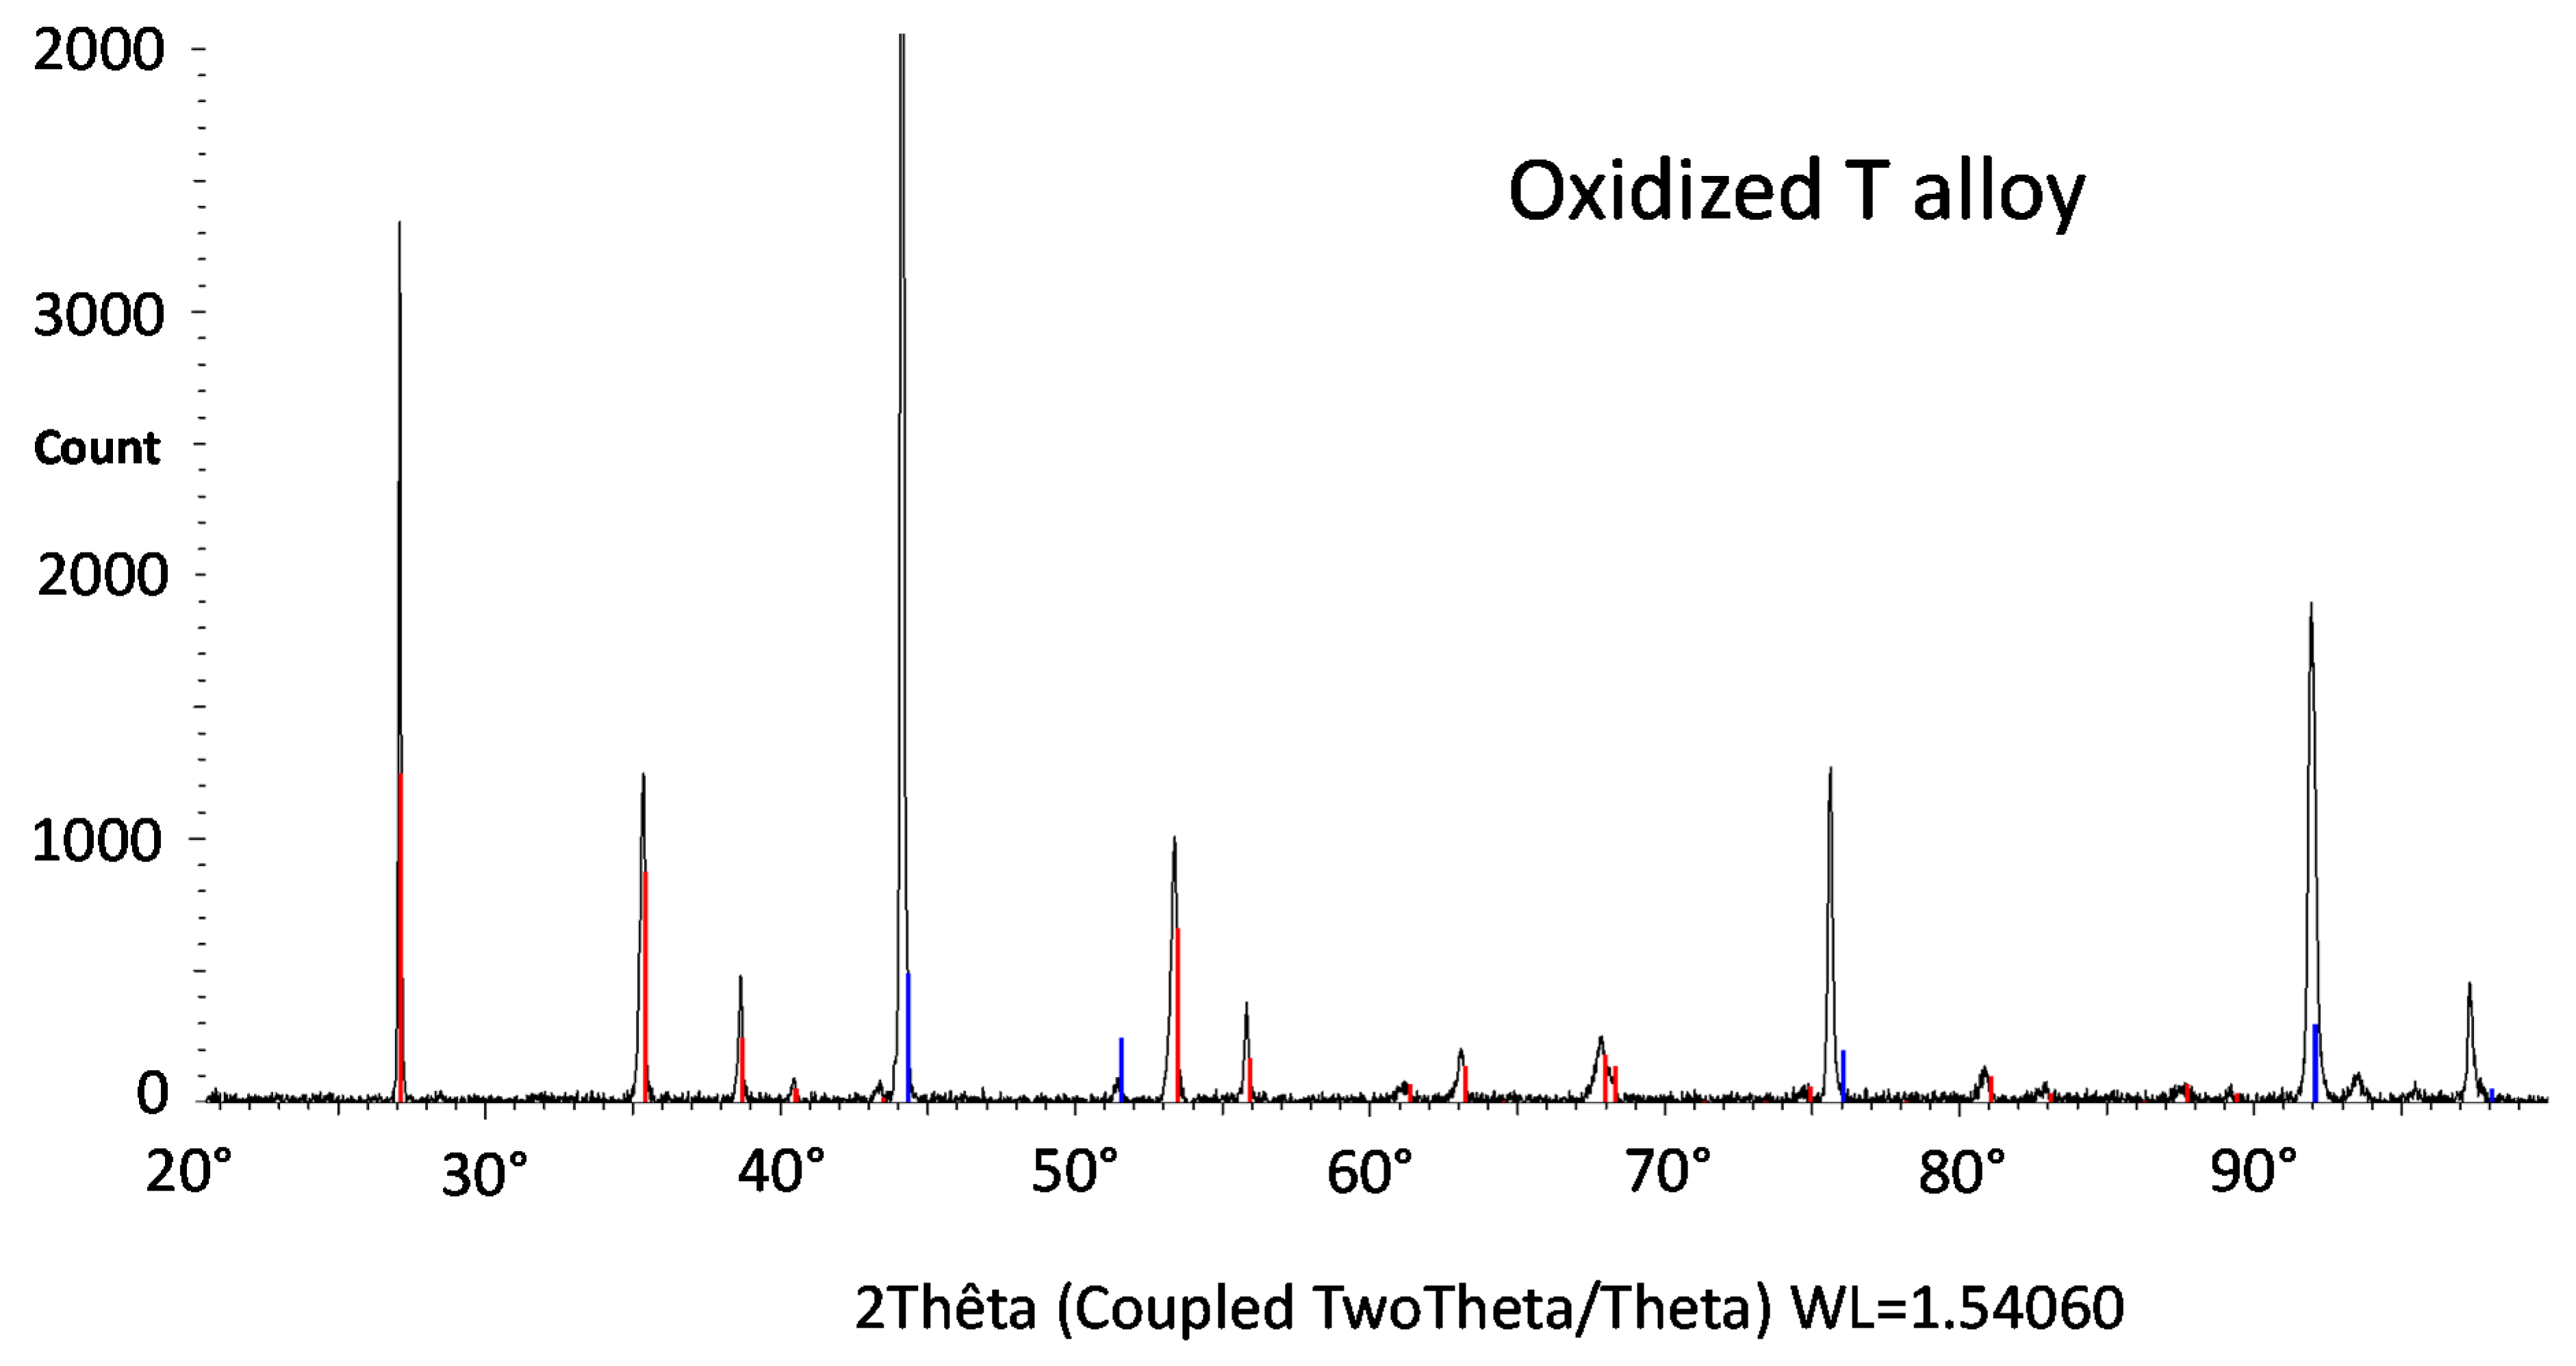
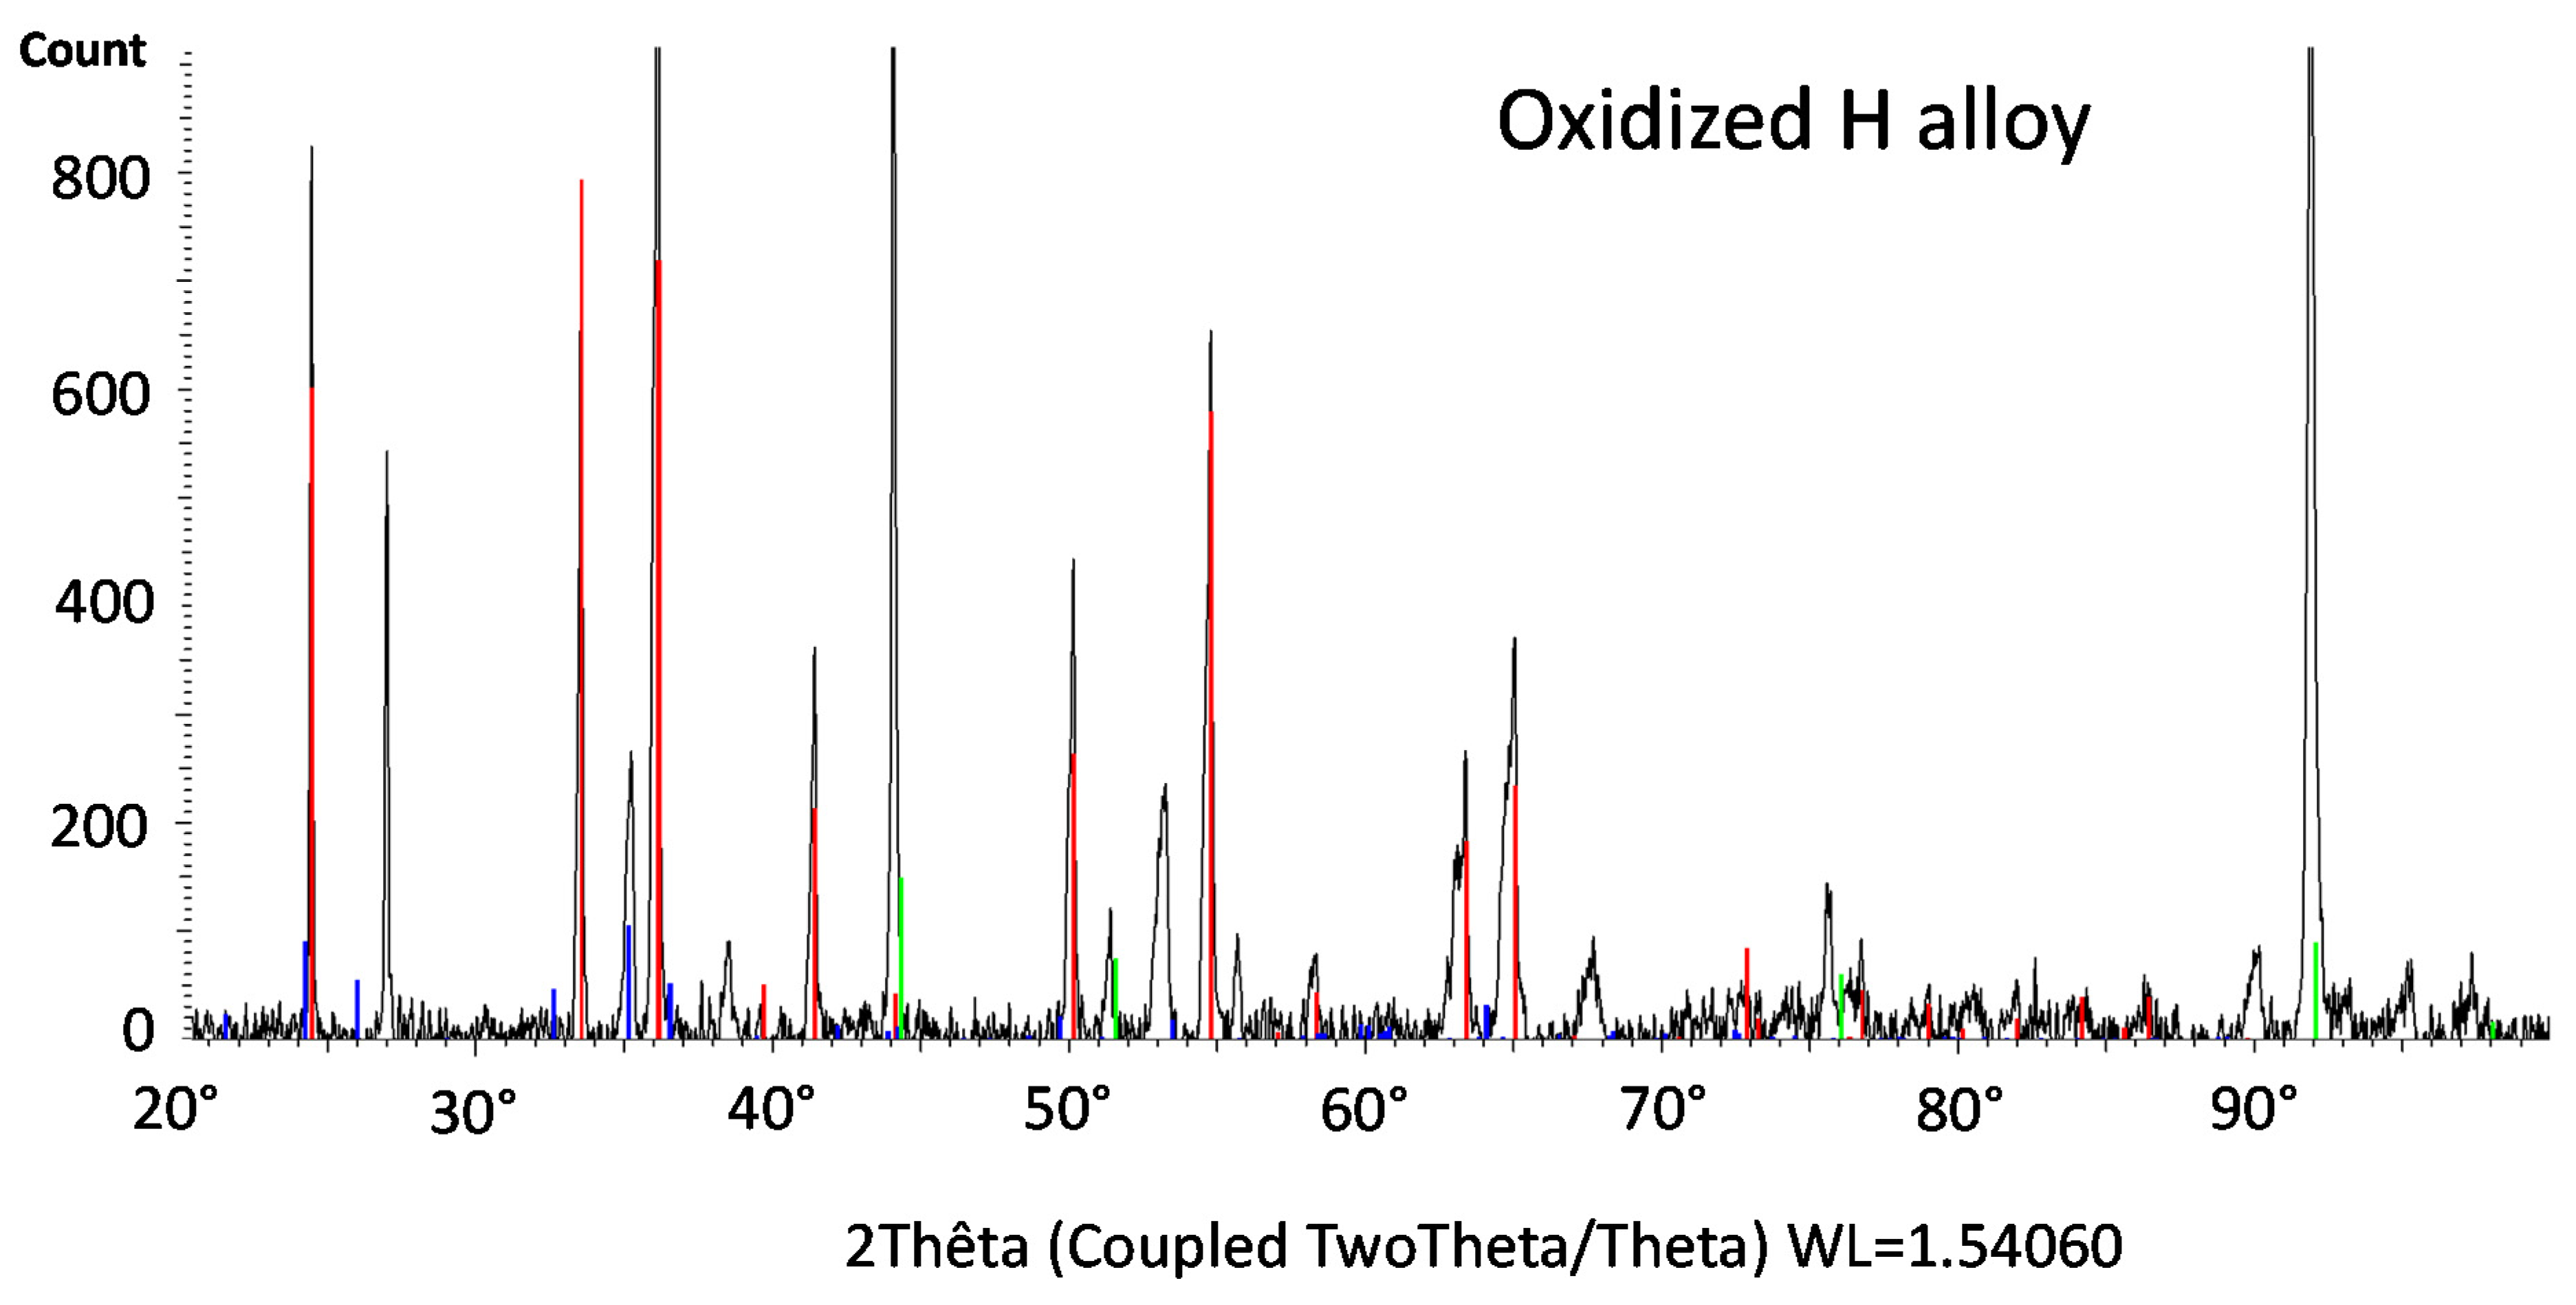
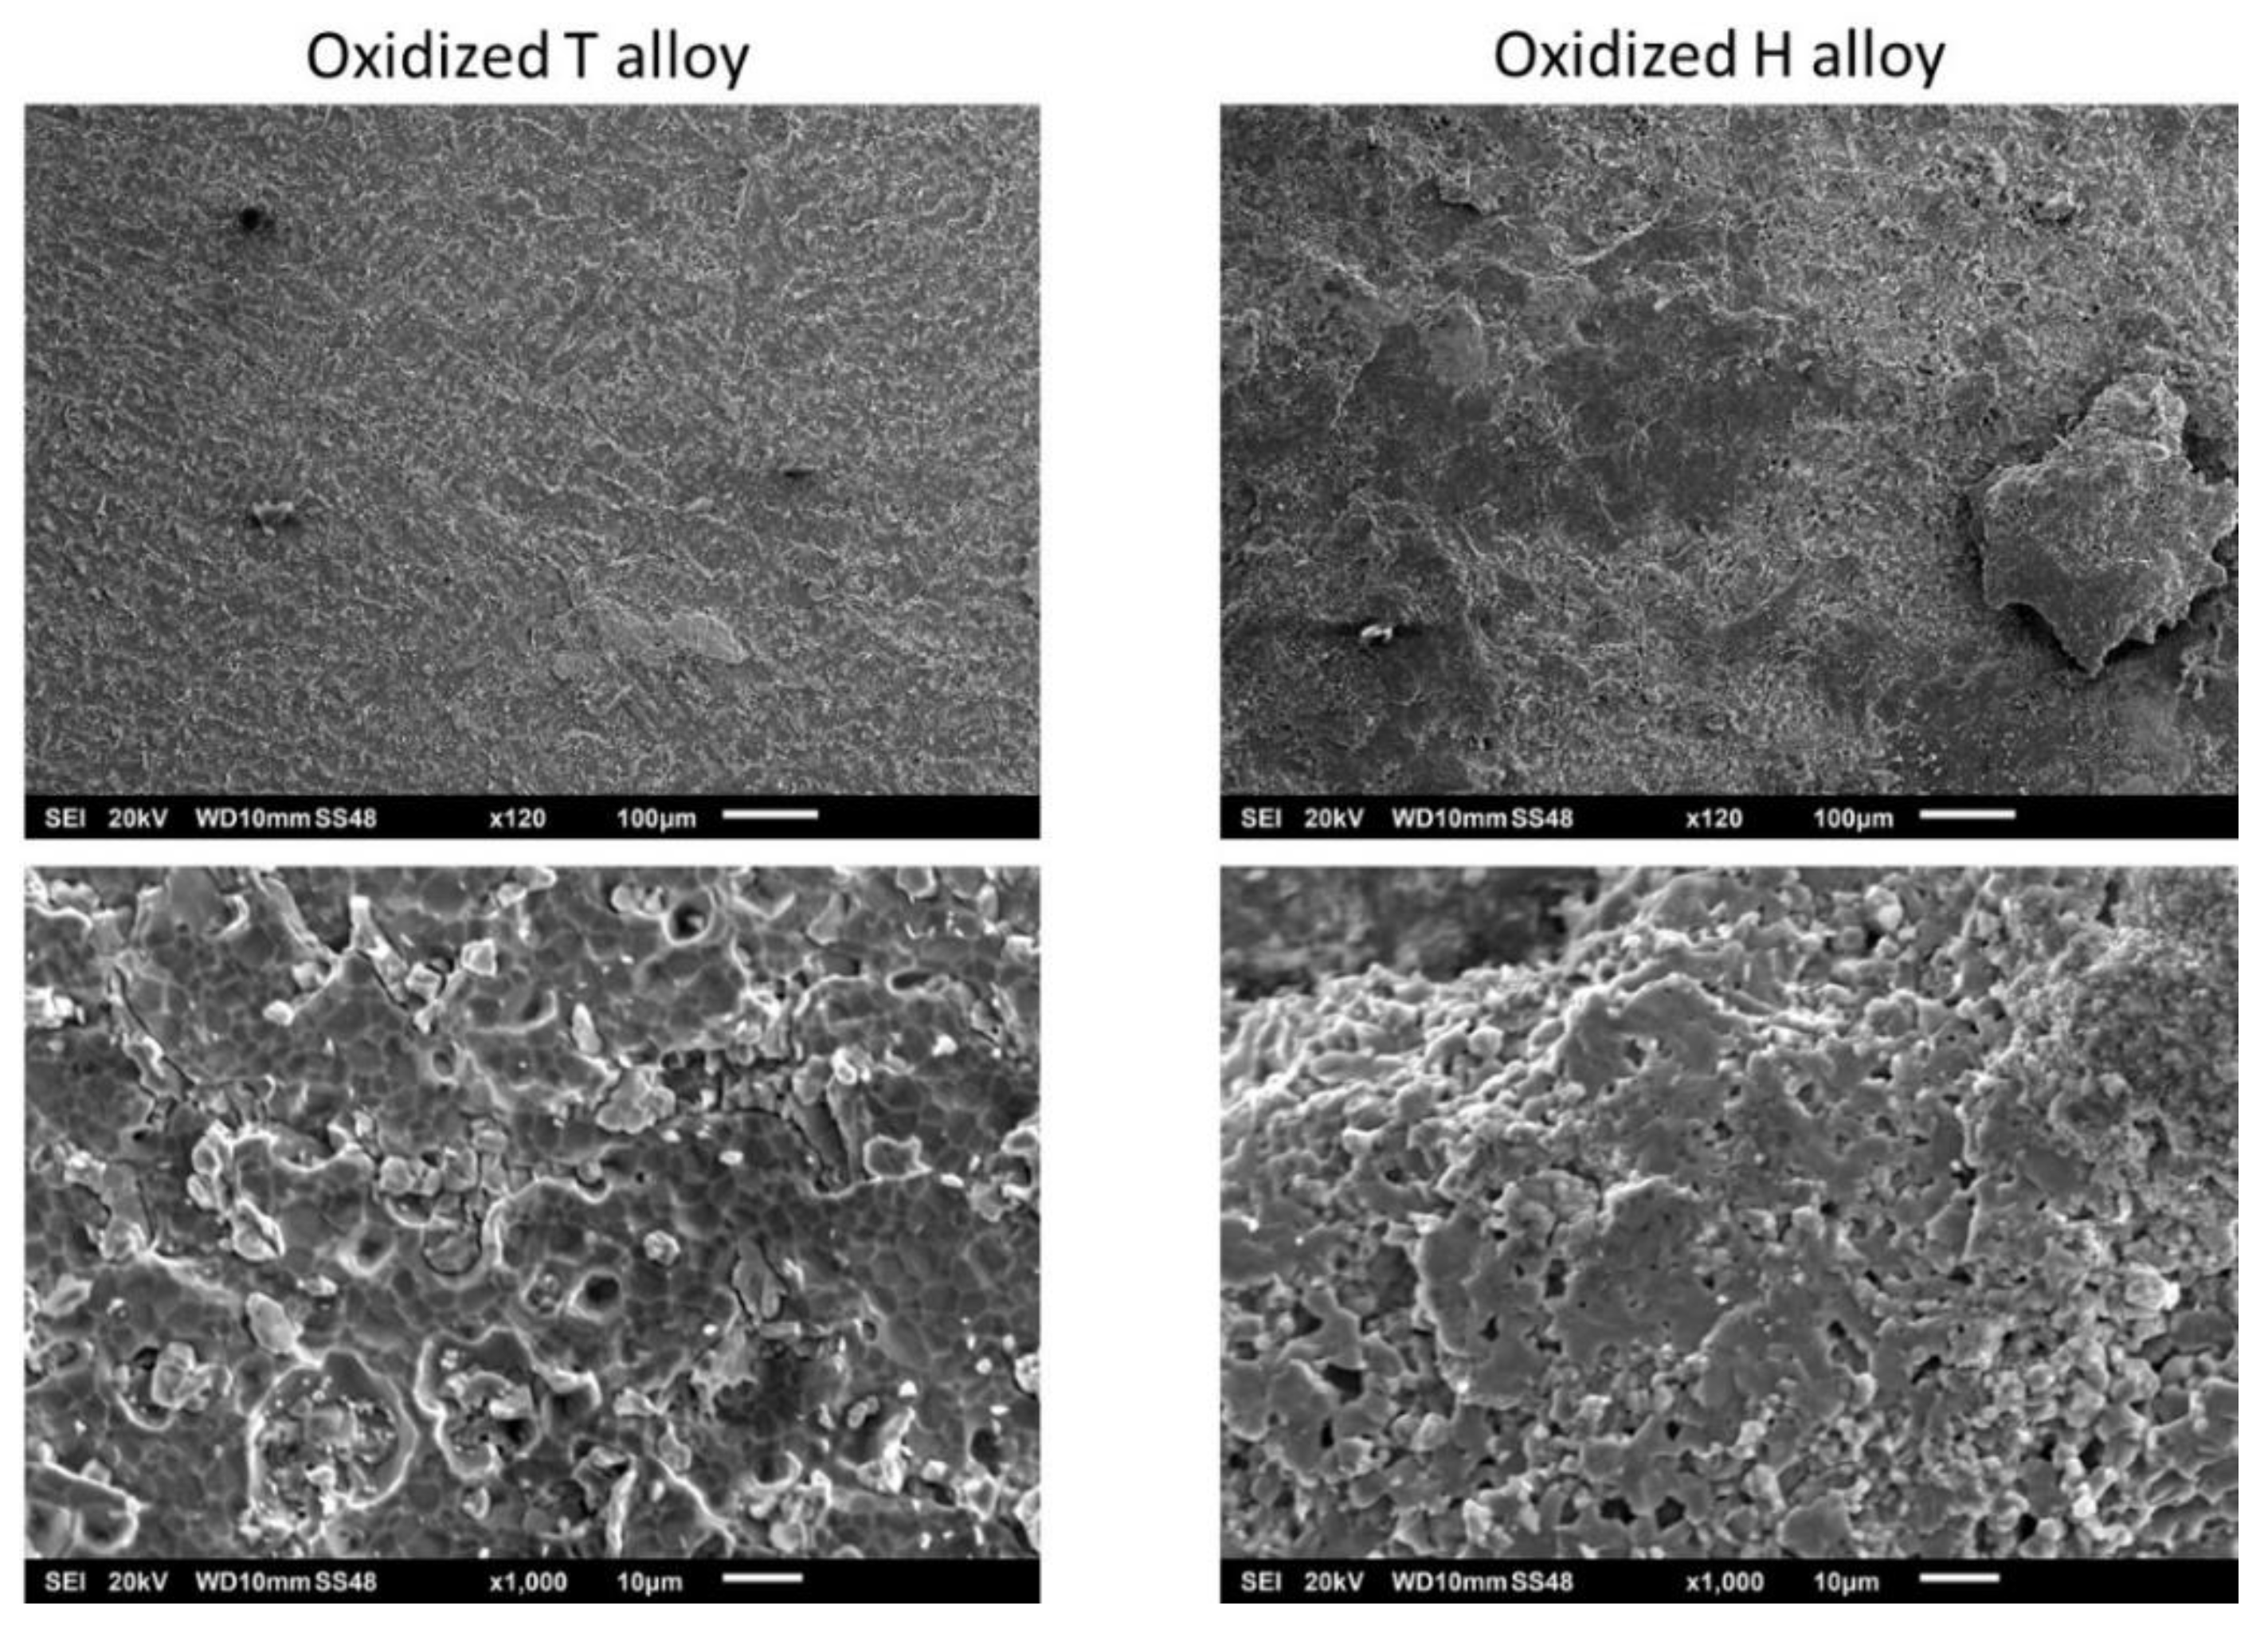
The X-ray diffraction runs (XRD) led to the spectra presented in Figure 7 for the T alloy and in Figure 8 for the H alloy. The spectrum acquired on the oxidized surface of the T alloy (Figure 7) did not show the presence of chromia, obviously totally lost as illustrated by the images obtained using the scanning electron microscope (SEM) in secondary electrons mode (SE) in Figure 9. The single oxide shown by the XRD peaks is the mixed oxide of chromium and tantalum (CrTaO4). In contrast, chromia was still significantly present on the surface of the oxidized H alloy (Figure 8), and one can also notice the presence of NiCr2O4 spinel oxide. This is consistent with the SE micrographs taken with the SEM on the oxidized surface of the H alloy in Figure 9.
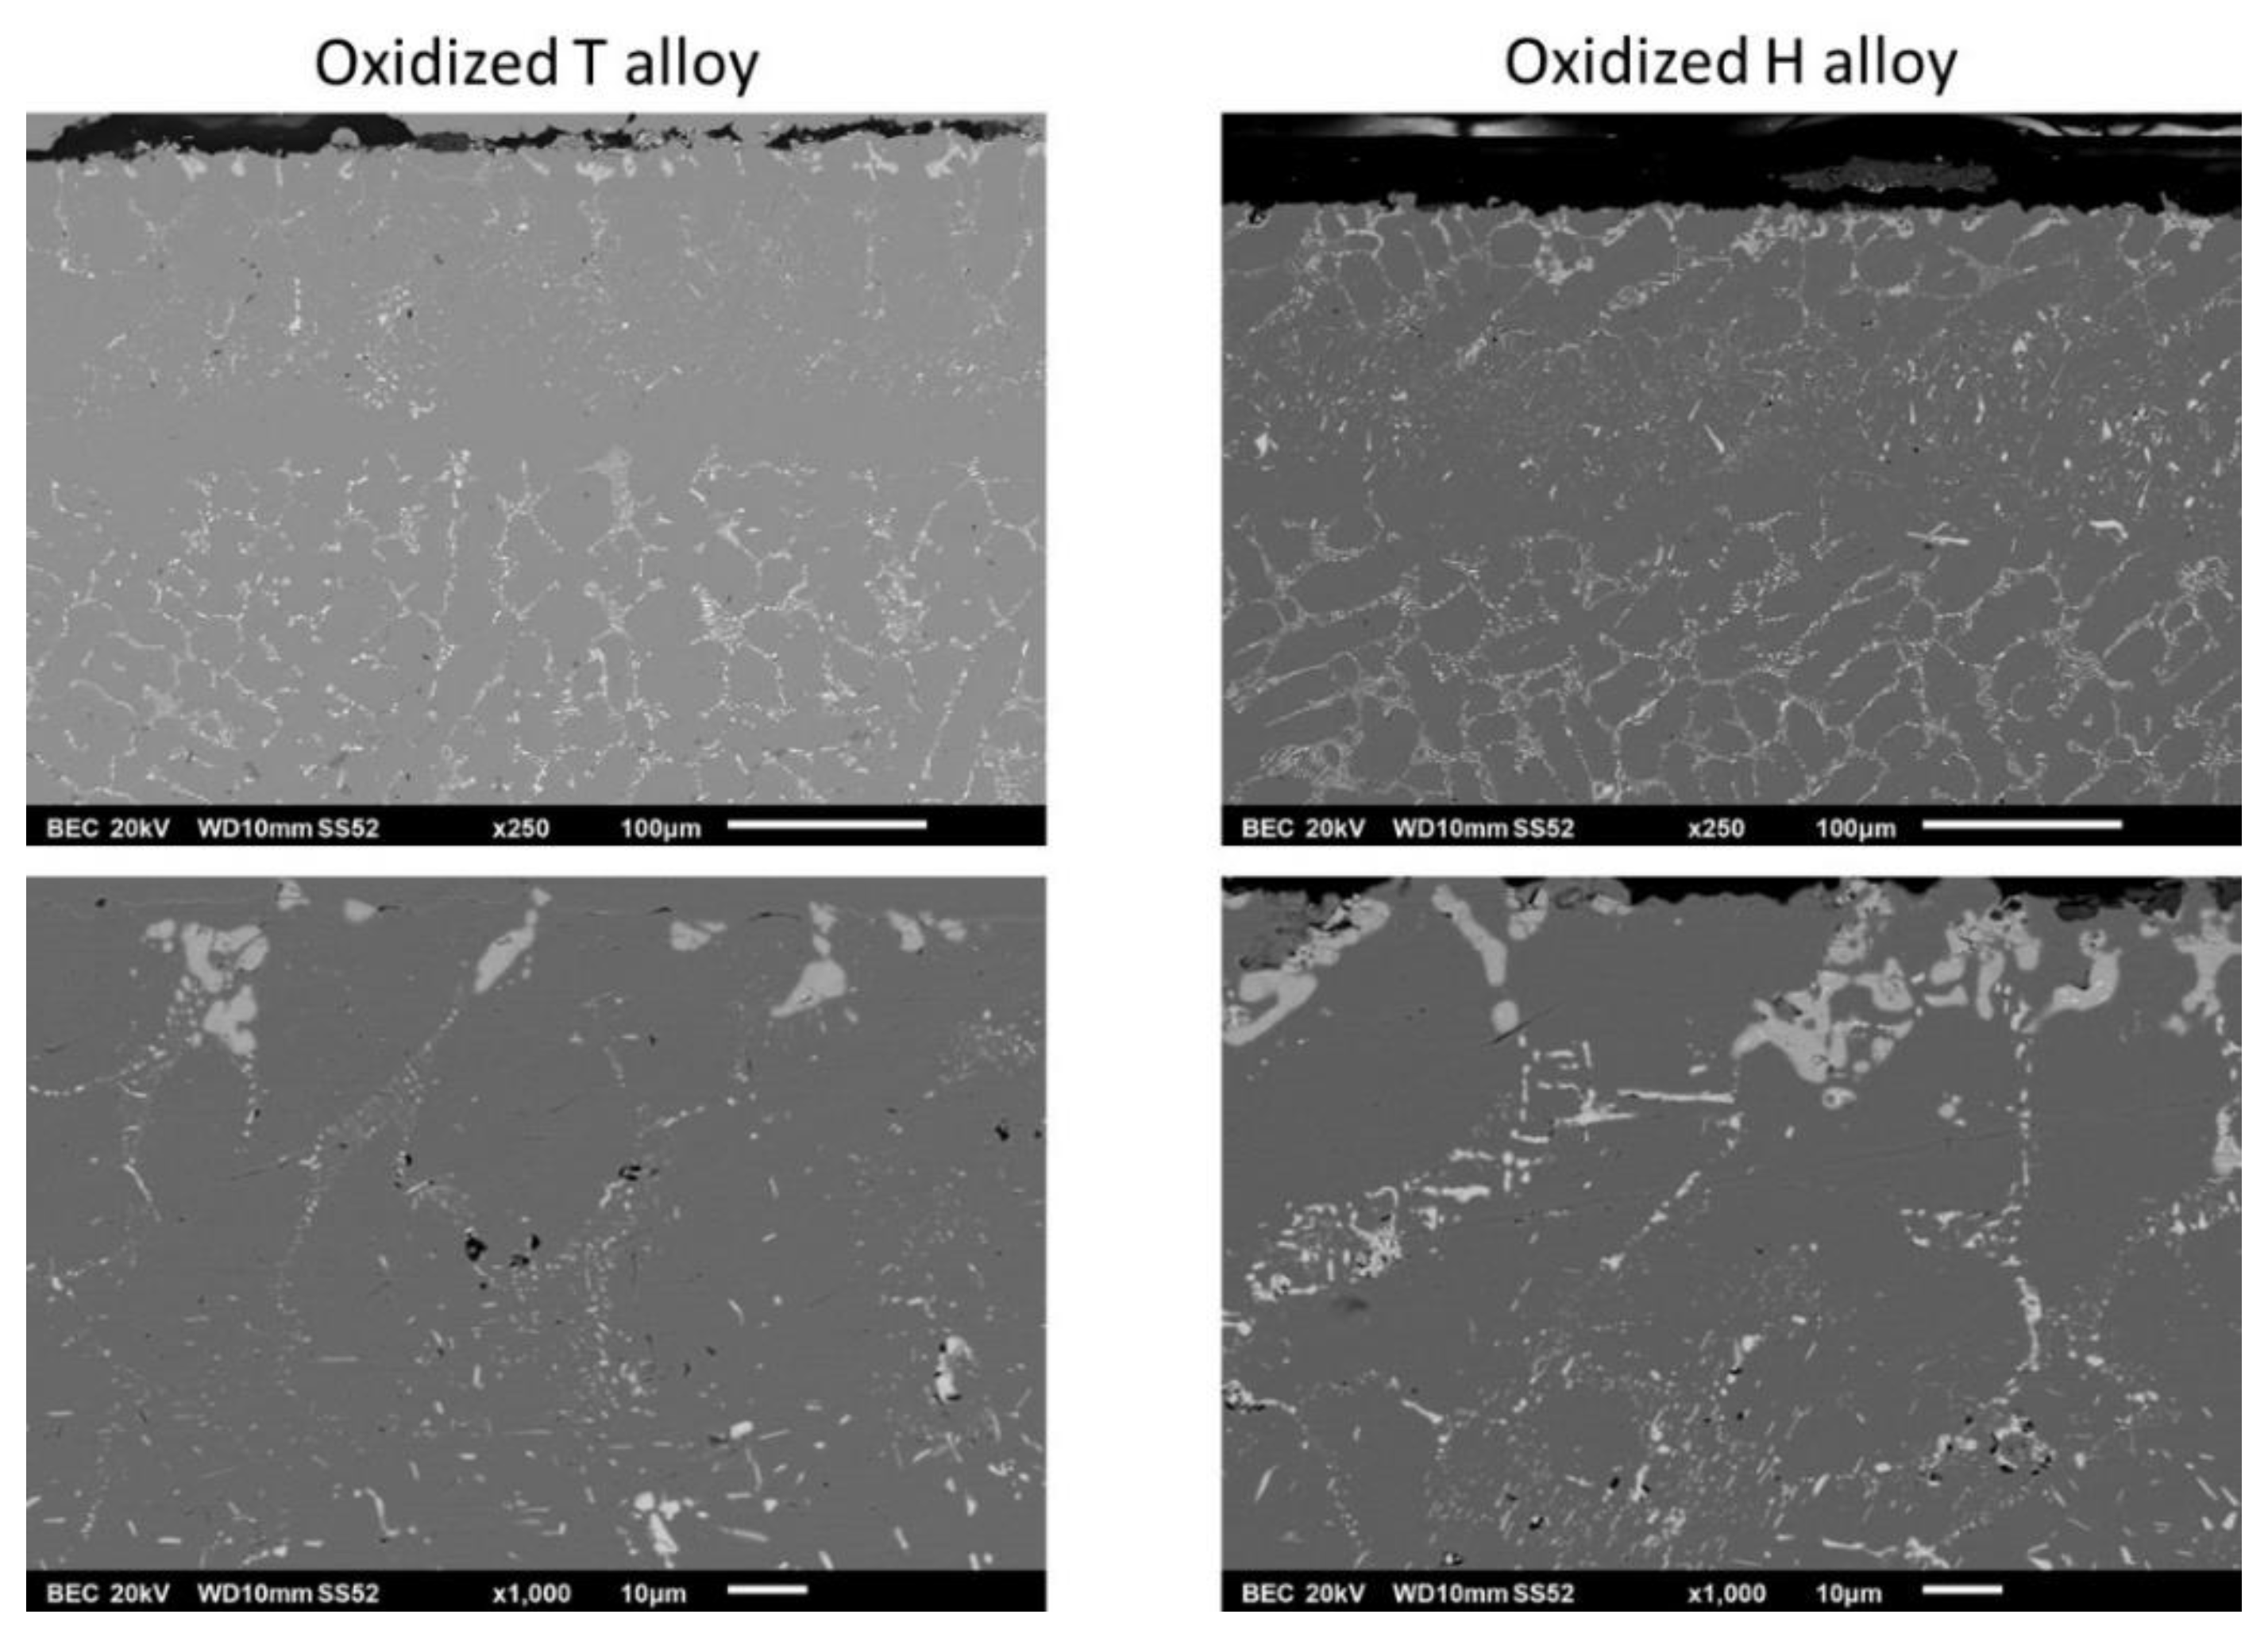
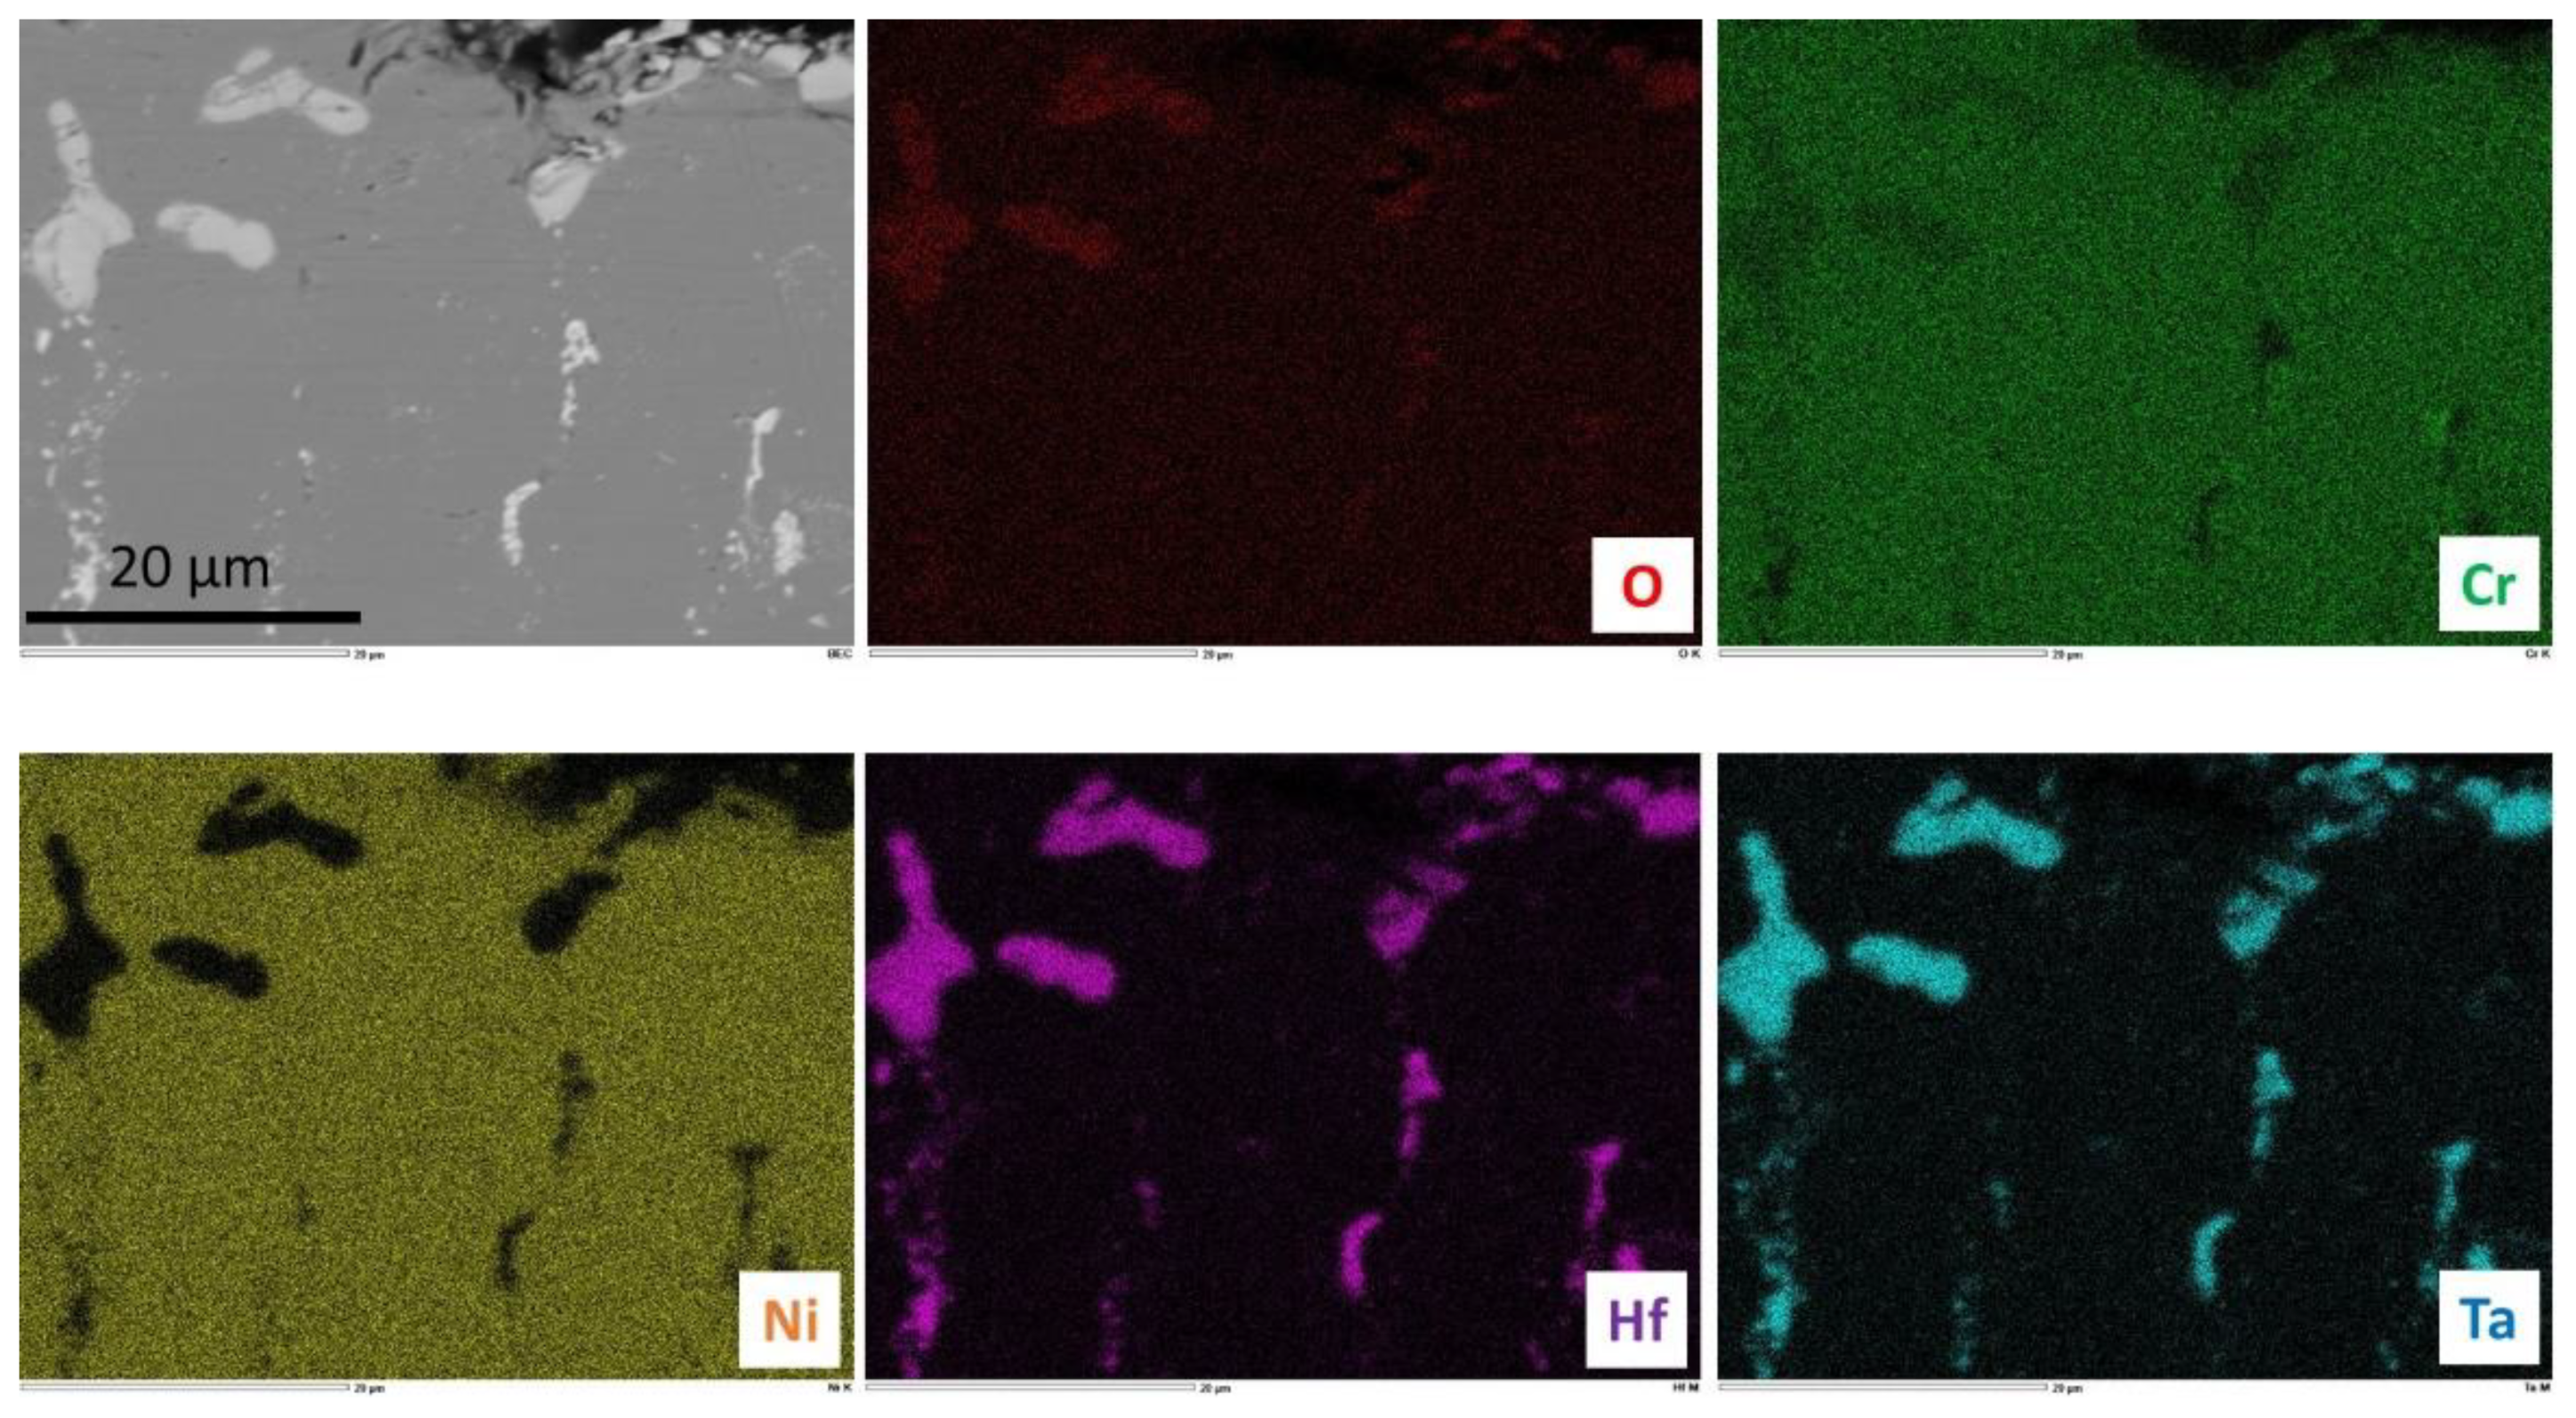
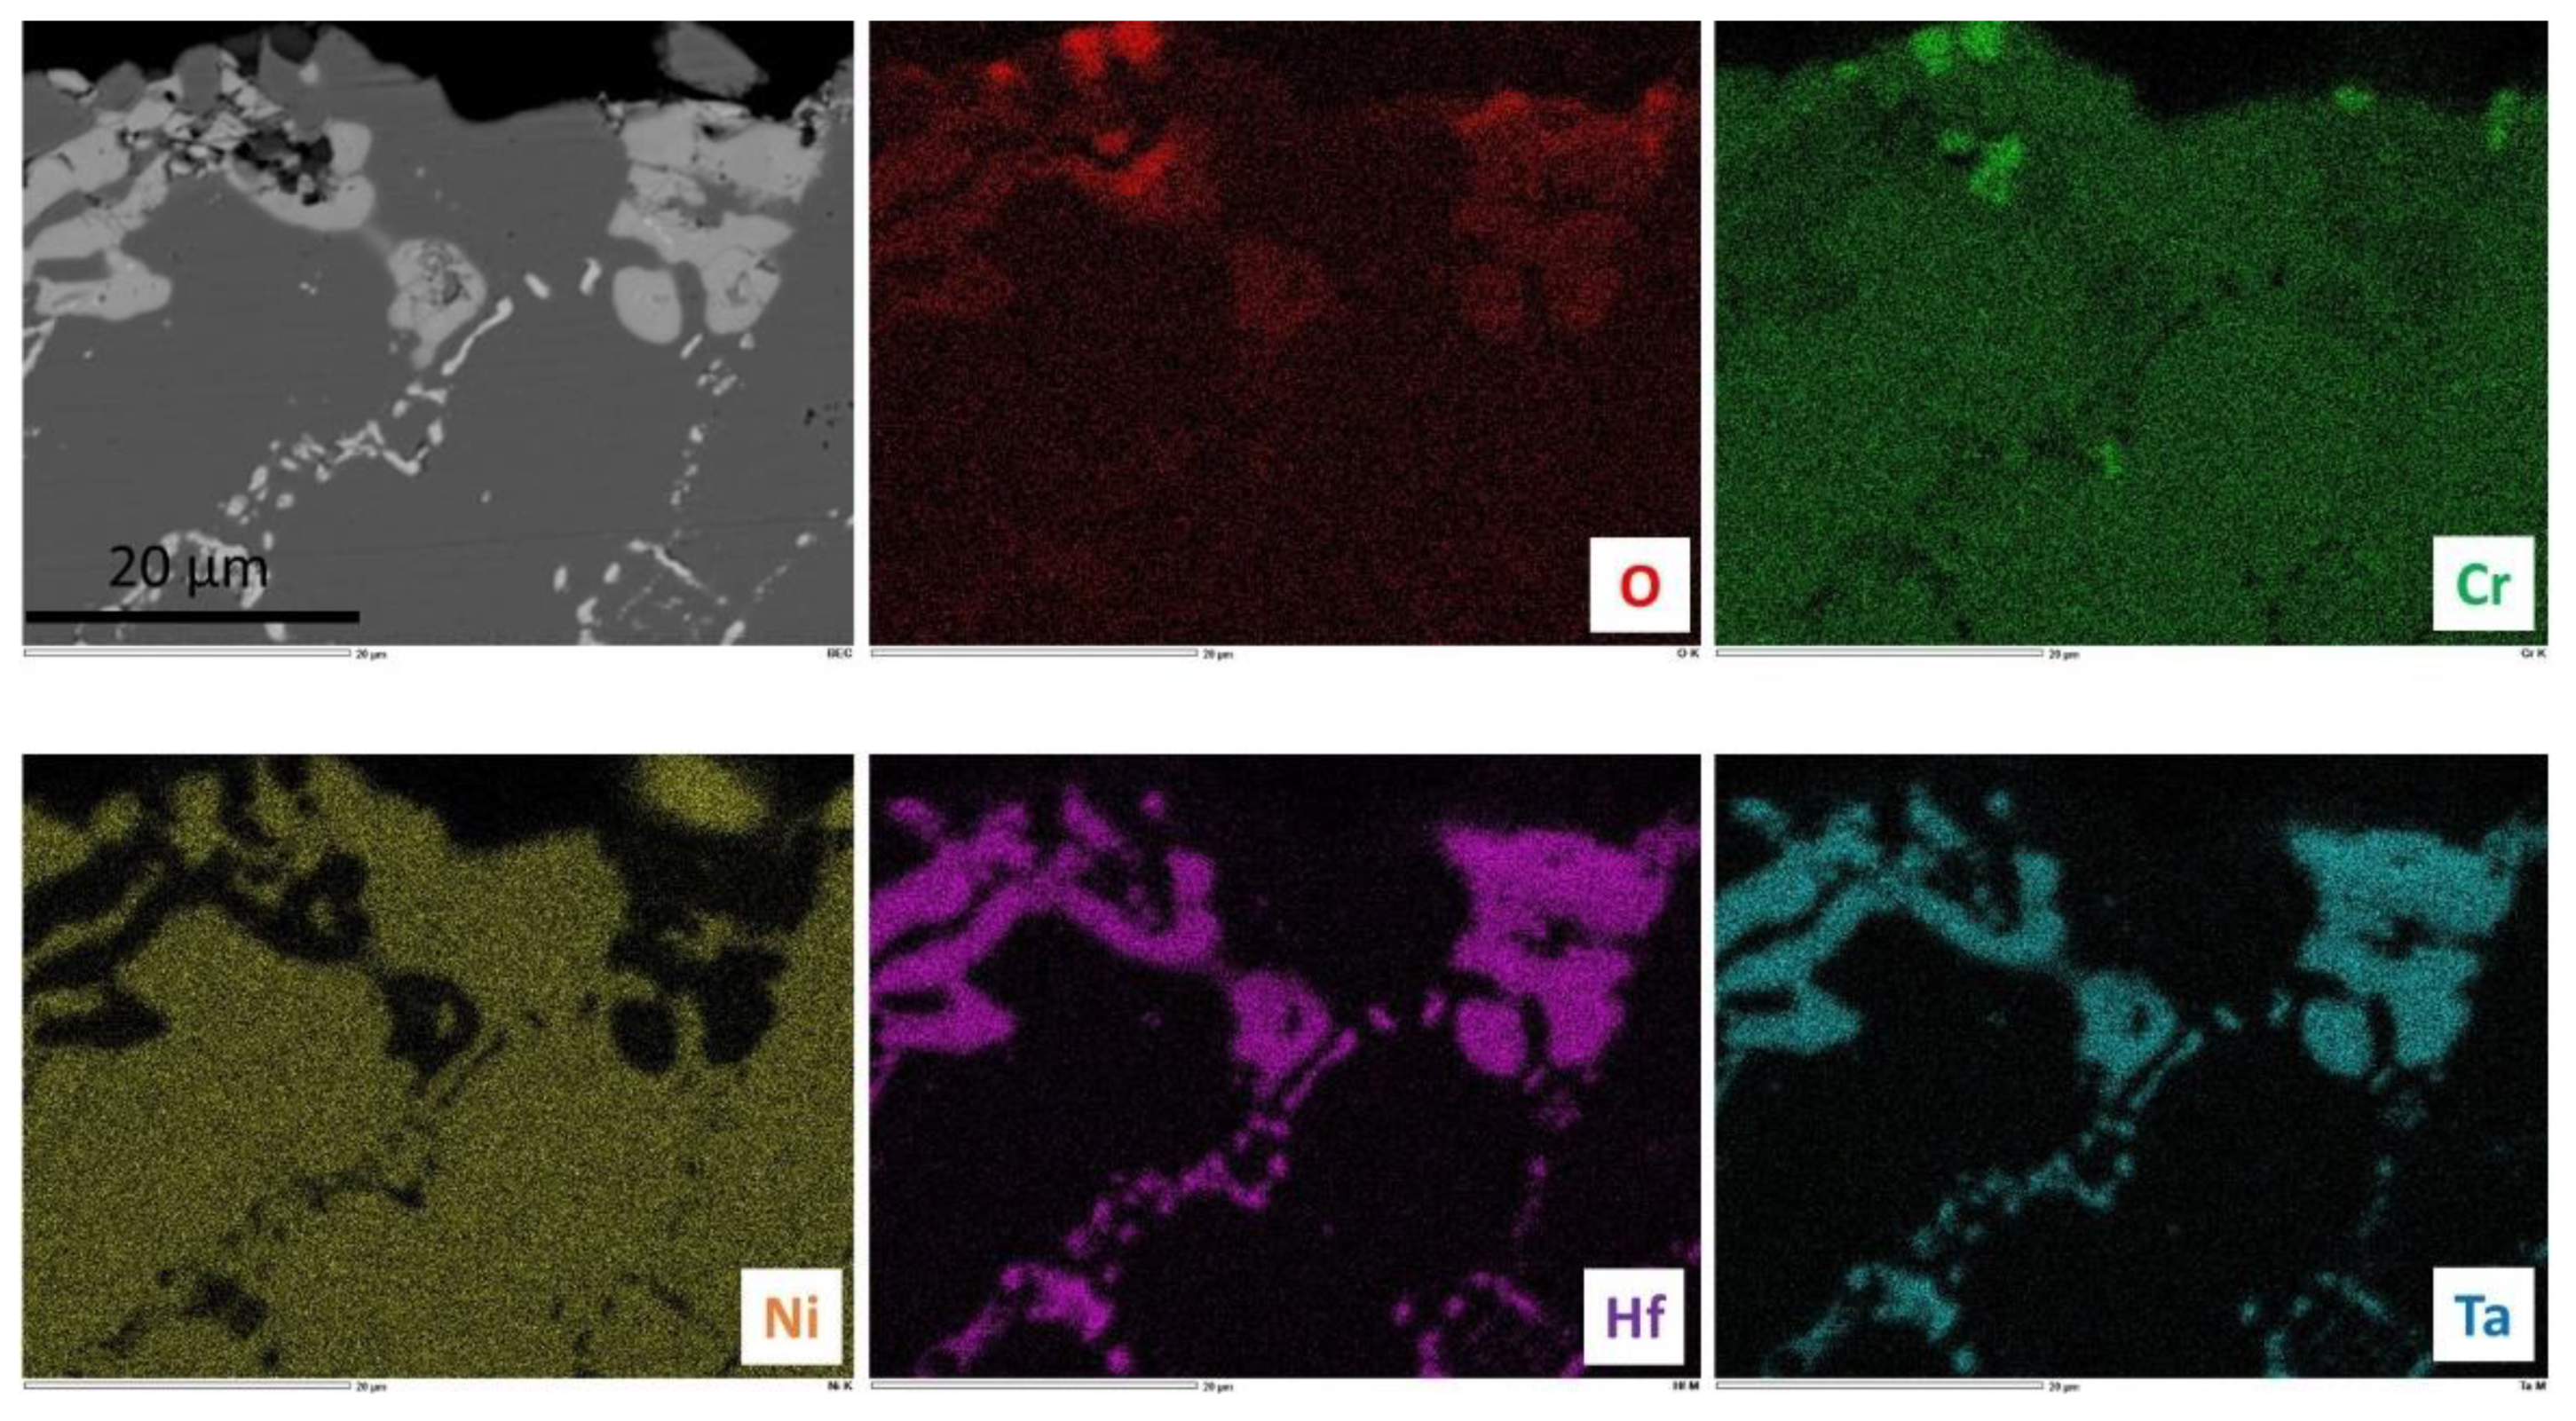
After cross-sectional preparation, the two oxidized alloys were observed with the SEM in BSE mode (Figure 10). The external oxides were difficult to observe since cutting, grinding and polishing have obviously induced the loss of many parts of the external scales in the case of the H alloy (these oxides have been lost earlier for the T alloy, during cooling). The two alloys are obviously affected by oxidation over a depth of about 150 µm from the extreme surface. In this zone, it seems that the initial carbides have disappeared and that small carbides seem having precipitated in the same location thereafter. This dissolution–re-precipitation seems to have been more intense in the subsurface of the T alloy than in the H alloy. Close to the extreme surface, complex oxides of Cr, Hf and Ta are present in the two alloys, as seen by EDS spot analysis. The X-maps presented in Figure 11 for the T alloy and in Figure 12 for the H alloy illustrate this description.
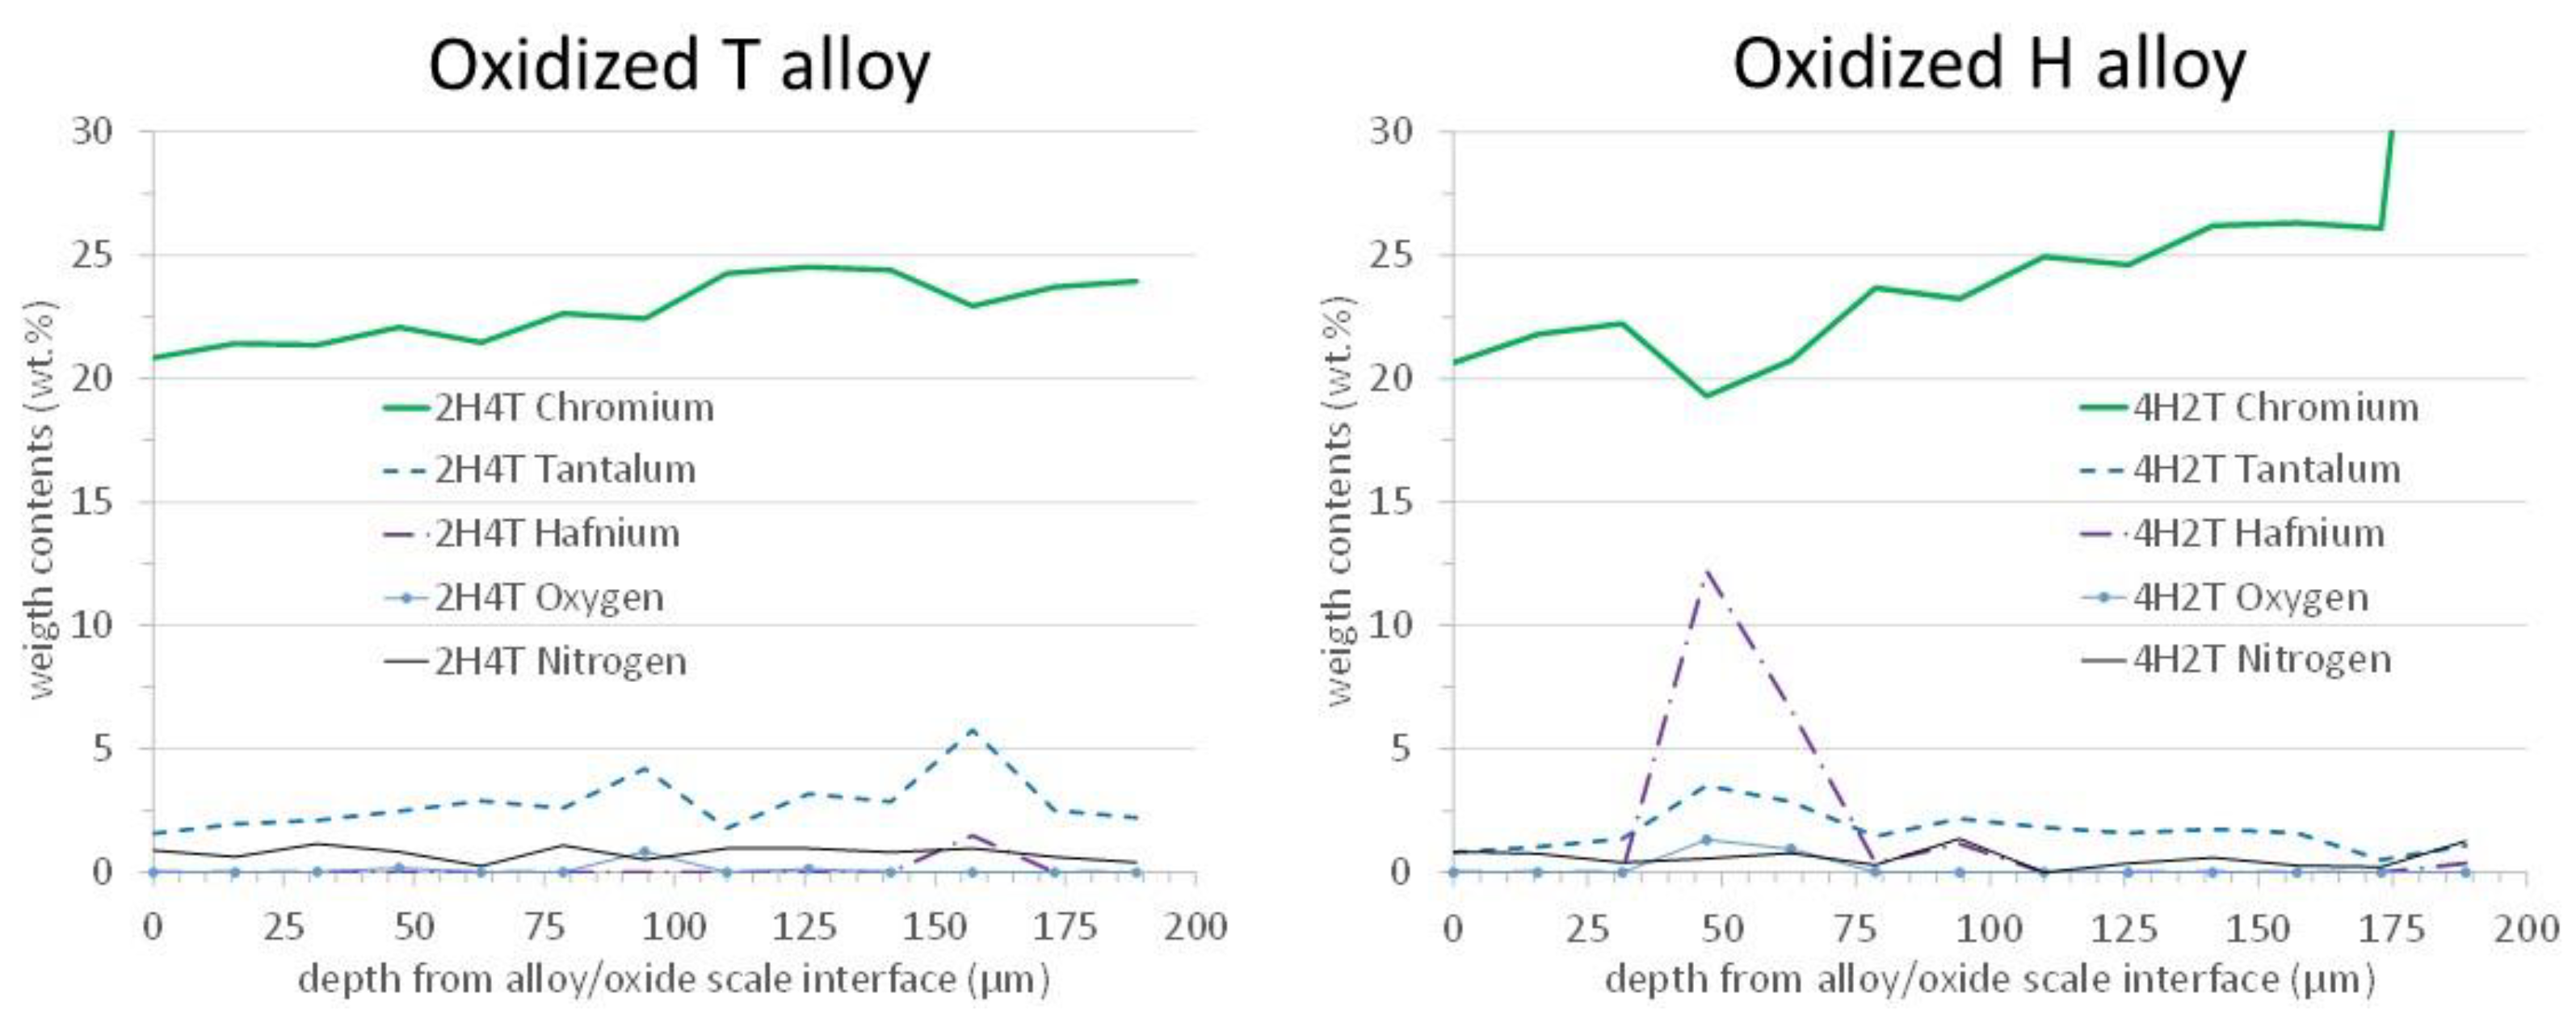
Concentration profiles were acquired across these sub-surfacic zones affected by oxidation. Two examples of the obtained profiles are presented in Figure 13, one per alloy. One can see that these zones, which are microstructurally affected by oxidation, coincide with the chromium-depleted zones visible in the concentration profiles. Indeed, the depths of chromium depletion are approximately 150 µm too. In addition, these zones are slightly depleted in tantalum. An important point is that the chromium on the extreme surface is still high, by 20 wt.%Cr. The chromia-forming behavior is not threatened by this limited impoverishment in chromium.
The difference of oxide spallation behavior was, thus, confirmed by the metallographic characterization of the oxidized samples. The XRD runs and SEM/SE observations showed that chromia had spalled from the surface of the T alloy while it remained partially over the H alloy. The presence of many CrTaO4 oxides close to the outer surface of the T alloy and the absence of this oxide in the case of the H alloy may explain this difference of behavior, as it may also explain the difference in spallation behavior between a Hf-free Ni–30Cr–0.4C–6Ta alloy (total spallation) [24] and a Ta-free Ni–25Cr–0.5C–6Ta alloy (no spallation) [25]. Cross-sectional observations also revealed the presence of mixed oxides involving hafnium in the two alloys, with about the same amount. In fact, one can suspect that the Ta in excess in the T alloy, in comparison to the H alloy, was more mobile and diffused more to the oxidation front to form a surface scale of Ta and Cr, deteriorating more of the {oxide scale on substrate} adhesion. In the case of the H alloy, the outer formation of oxide rich in Ta and Cr is much more limited. This explanation (less surface CrTaO4 oxides and more subsurface (Cr, Ta, Hf) oxides) can be at the origin of the better resistance of the H alloy to scale spallation than the one of the T alloy, rather than being a pegging effect of hafnium oxides on the chromia layer.
3.5. Oxidation Tests: Evolution of the Microstructures in the Bulk
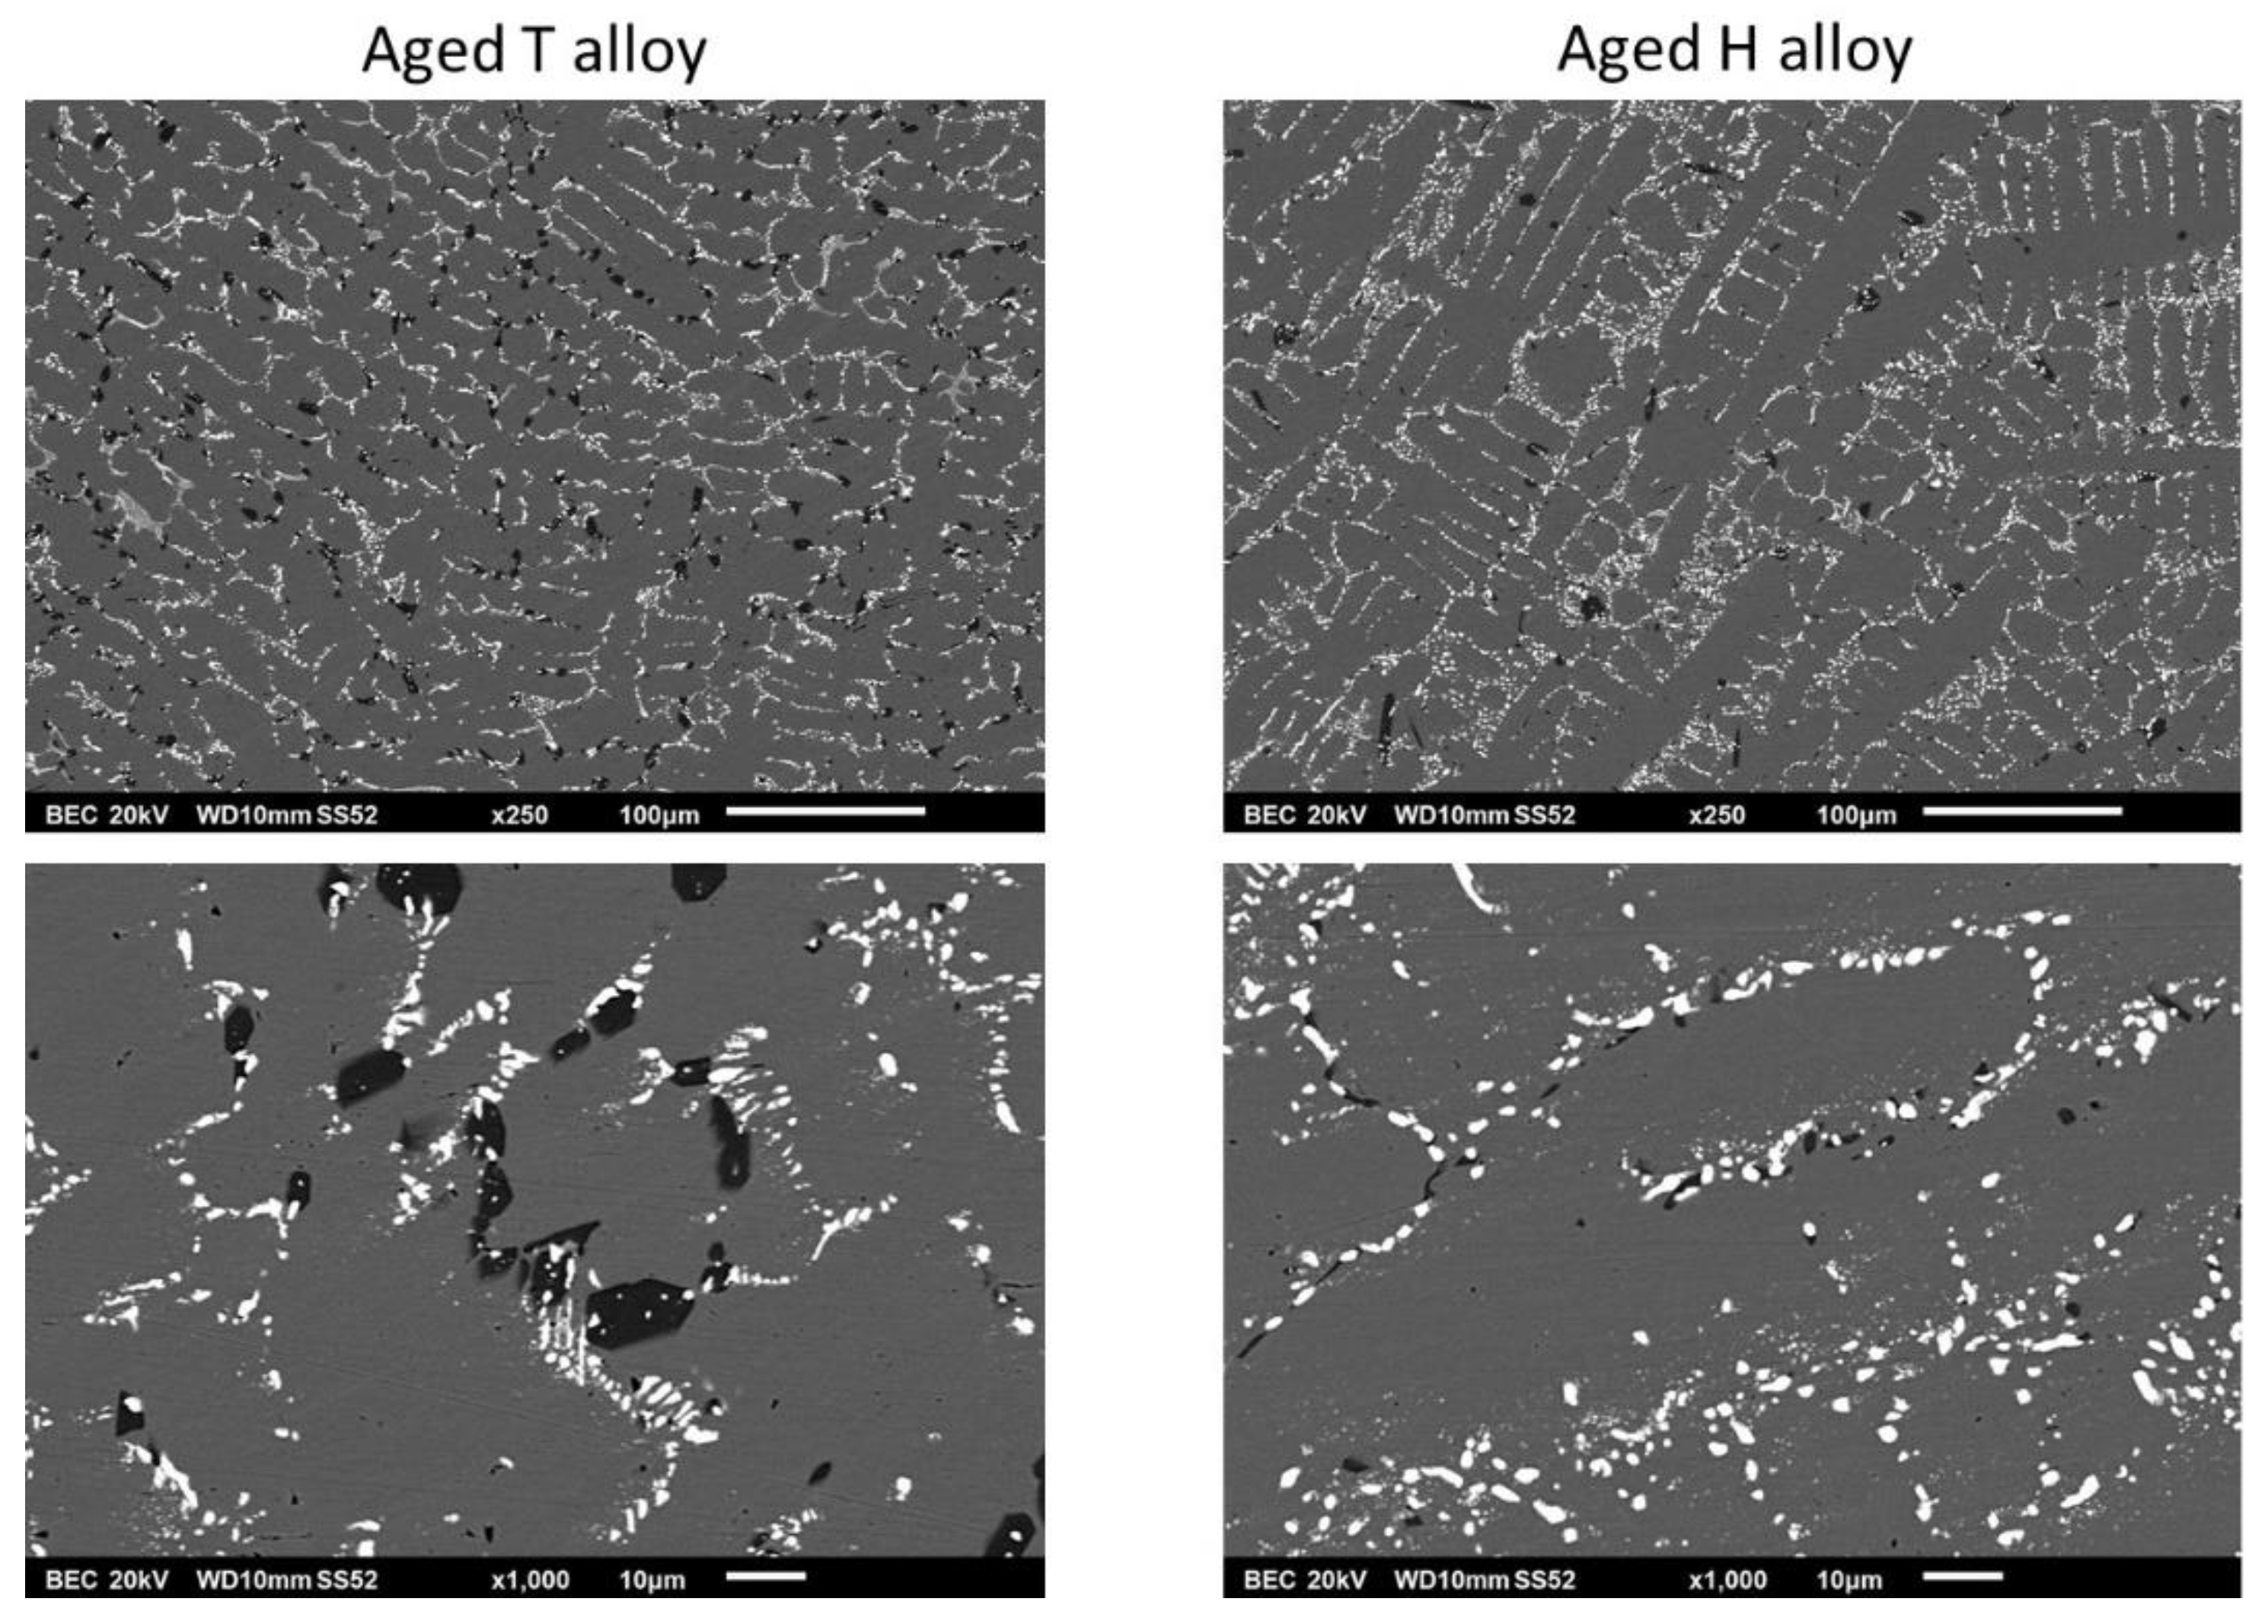
As illustrated in Figure 14, exposure at 1250 °C over 50 h led to significant consequences on the microstructures in zones far enough from surface to not be influenced by oxidation. The chromium carbides have coalesced and coarsened in the T alloy to become blocky particles. The MC carbides in both alloys have suffered fragmentation. However, the degree of the morphologic degradation of the MC carbides is comparable to the one of the HfC carbides in the Ni–25Cr–0.5C–6Hf alloy after almost 50 h at 1200 °C [8], and thus, it is not catastrophic.
Beside these morphologic changes—certainly disadvantaging the mechanical resistance—the volume fractions are thermodynamically stabilized at 1250 °C after this long isothermal exposure. The homogenized matrix composition can be estimated by EDS spot analyses (Table 6) and the differences between the Hf and Ta contents in alloy and the contents in Hf and Ta in measured in the matrix can be exploited to estimate the volume fractions of the MC carbides. After conversion using the volume masses of matrix (average with chromium carbides if any; about 9 g/cm3) and of the MC carbides (13 g/cm3), one can obtain the corresponding volume fractions. All these values are displayed in Table 7. One can see that the volume fractions of the MC carbides are greater in the H alloy than in the T alloy. In both cases, they are seemingly still significant for producing significant strengthening; however, it is unfortunately also clear that the loss of their initial morphology risks being detrimental for maintaining good mechanical performance. However, this progressive mechanical weakening during service that can be induced by the morphological evolution of the MC carbides may be less of a problem for applications such as glass forming processes, for which moderate stresses result from operation, as compared to producing turbine disks or blades, for which stresses may sometimes reach high levels.
4. Conclusions
Despite the more or less extended partial replacement of Hf by Ta by comparison with an alloy containing Hf exclusively, and therefore, reinforced by HfC carbides, the two alloys studied in this work showed honorable behaviors in refractoriness, oxidation resistance and microstructural stability. Necessarily less expensive than alloys containing exclusively HfC carbides, these alloys containing a similar interdendritic carbide network but made of (Hf,Ta)C, are potentially able to demonstrate good properties at elevated temperatures (under moderate stresses). Their resistance to creep deformation at 1250 °C will be investigated soon, to complete the studies recently carried out at 1100 °C, which showed an interesting creep resistance. These quinary alloys can be the point of departure of the development of more complex alloys, for example benefiting additional solid solution strengthening (e.g., the addition of tungsten or rhenium).
Author Contributions
Conceptualization, P.B.; methodology, P.B. and L.A.; validation, P.B. and L.A.; formal analysis, P.B. and D.A.K.; investigation, D.A.K., L.A. and P.B.; resources, L.A.; data curation, P.B., D.A.K. and L.A.; writing—original draft preparation, P.B.; writing—review and editing, P.B.; visualization, P.B.; supervision, P.B.; project administration, P.B. All authors have read and agreed to the published version of the manuscript.
Funding
This research received no external funding.
Conflicts of Interest
The authors declare no conflict of interest.
References
- Donachie, M.S.; Donachie, S.J. Superalloys: A Technical Guide, 2nd ed.; ASM International: Russell, OH, USA, 2002. [Google Scholar]
- Young, D.J. High Temperature Oxidation and Corrosion of Metals; Elsevier: Amsterdam, The Netherlands, 2008. [Google Scholar]
- Luo, A.; Shin, K.S.; Jacobson, D.L. Hafnium carbide strengthening in a tungsten-rhenium matrix at ultrahigh temperatures. Acta Metall. Mater. 1992, 40, 2225–2232. [Google Scholar] [CrossRef]
- Seong, Y.H.; Baek, C.; Kim, J.H.; Kong, J.H.; Kim, D.S.; Lee, S.H.; Kim, D.K. Evaluation of oxidation behaviors of HfC-SiC ultra-high temperature ceramics at above 2500 °C via oxyacetylene torch. Ceram. Int. 2018, 44, 8505–8513. [Google Scholar] [CrossRef]
- Kim, H.S.; Kang, B.R.; Choi, S.M. Microstructure and mechanical properties of vacuum plasma sprayed HfC, TiC, and HfC/TiC ultra-high temperature ceramic coatings. Materials 2020, 13, 124. [Google Scholar] [CrossRef] [Green Version]
- Cheng, J.; Wang, J.; Wang, X.; Wang, H. Preparation and high-temperature performance of HfC-based nanocomposites derived from precursor with Hf-(O,N) bonds. Ceram. Int. 2017, 43, 7159–7165. [Google Scholar] [CrossRef]
- Wen, Q.; Yu, Z.; Riedel, R.; Ionescu, E. Significant improvement of high-temperature oxidation resistance of HfC/SiC ceramic nanocomposites with the incorporation of a small amount of boron. J. Eur. Ceram. Soc. 2020, 40, 3499–3508. [Google Scholar] [CrossRef]
- Berthod, P.; Conrath, E. Microstructure evolution in bulk and surface states of chromium rich nickel based cast alloys reinforced by hafnium carbides after exposure to high temperature air. Mater. High Temp. 2014, 31, 266–273. [Google Scholar] [CrossRef] [Green Version]
- Berthod, P.; Conrath, E. Creep and oxidation kinetics at 1100 °C of nickel-base alloys reinforced by hafnium carbides. Mater. Des. 2016, 104, 27–36. [Google Scholar] [CrossRef] [Green Version]
- Gu, X.; Yang, L.; Ma, X.; Dai, X.; Wang, J.; Wen, M.; Zhang, K. Ta addition effects on the structure, mechanical and thermal properties of sputtered Hf-Ta-C film. Ceram. Int. 2019, 45, 15596–15602. [Google Scholar] [CrossRef]
- Zhang, J.; Wang, S.; Li, W.; Yu, Y.; Jiang, J. Understanding the oxidation behavior of Ta-Hf-C ternary ceramics at high temperature. Corros. Sci. 2020, 164, 108348. [Google Scholar] [CrossRef]
- Smoła, G.; Jedliński, J.; Gleeson, B.; Hayashi, S.; Grosseau Poussard, J.L.; Bonnet, G.; Nocuń, M. On the early stages of scale development on Ni-22Al-30Pt with and without Hf additions at 1150 °C. Mater. High Temp. 2012, 29, 70–80. [Google Scholar] [CrossRef]
- Mataveli Suave, L.; Cormier, J.; Villechaise, P.; Bertheau, D.; Benoit, G.; Cailletaud, G.; Marcin, L. Anisotropy in creep properties of DS200 + Hf alloy. Mater. High Temp. 2016, 33, 361–371. [Google Scholar] [CrossRef]
- Yan, K.; Guo, H.; Gong, S. High-temperature oxidation behavior of minor Hf doped NiAl alloy in dry and humid atmospheres. Corros. Sci. 2013, 75, 337–344. [Google Scholar] [CrossRef]
- Yan, K.; He, J.; Gong, H.B. High-temperature oxidation behaviour of minor Hf-doped β-NiAl single crystals in dry and humid atmospheres. Rare Met. 2018. [Google Scholar] [CrossRef]
- Ding, R.; Jones, I.P.; Jiao, H. The role of Hf and TiC additions in the mechanical properties and microstructure of NbAlV alloys. Mater. Sci. Eng. A Struct. Mater. Prop. Microstruct. Process. A 2009, 516, 65–72. [Google Scholar] [CrossRef]
- Vazquez, A.; Varma, S.K. High-temperature oxidation behavior of Nb-Si-Cr alloys with Hf additions. J. Alloys Compd. 2011, 509, 7027–7033. [Google Scholar] [CrossRef]
- Yang, X.; Sha, J.; Zhang, H. Property responses in Nb-Si-Hf-Ti-Al-W-B-Cr alloys for high-temperature applications. Mater. Sci. Forum 2010, 654–656, 468–471. [Google Scholar] [CrossRef]
- Wu, W.; Ni, S.; Liu, Y.; Song, M. Effects of cold rolling and subsequent annealing on the microstructure of a HfNbTaTiZr high-entropy alloy. J. Mater. Res. 2016, 31, 3815–3823. [Google Scholar] [CrossRef]
- Lu, J.; Chen, Y.; Zhang, H.; Li, L.; Fu, L.; Zhao, X.; Guo, F.; Xiao, P. Effect of Al content on the oxidation behavior of Y/Hf-doped AlCoCrFeNi high-entropy alloy. Corros. Sci. 2020, 170, 108691. [Google Scholar] [CrossRef]
- Berthod, P. Kinetics of High Temperature Oxidation and Chromia Volatilization for a Binary Ni–Cr Alloy. Oxid. Met. 2005, 64, 235–252. [Google Scholar] [CrossRef] [Green Version]
- Berthod, P. Thermogravimetric Study of Oxide Spallation for Chromium-Rich Cast Cobalt-Based and Iron-Based Alloys Oxidized at High Temperature. Open Corros. J. 2009, 2, 61–70. [Google Scholar] [CrossRef]
- Berthod, P.; Aranda, L.; Vébert, C.; Michon, S. Experimental and thermodynamic study of the high temperature microstructure of tantalum containing nickel-based alloys. Calphad 2004, 28, 159–166. [Google Scholar] [CrossRef] [Green Version]
- Berthod, P.; Vébert, C. Effect of dendritic orientation on the high temperature oxidation kinetic of tantalum-containing nickel-base alloys. J. Mater. Sci. 2007, 42, 352–362. [Google Scholar] [CrossRef] [Green Version]
- Conrath, E.; Berthod, P. Kinetics of High Temperature Oxidation and Chromia Volatilization for HfC-Containing Nickel-Based Alloys. Oxid. Met. 2014, 81, 393–405. [Google Scholar] [CrossRef] [Green Version]
Figure 1.
As-cast microstructures of the two alloys just after their elaboration by high frequency induction melting and solidification (left: T alloy, right: H alloy, top: general view at ×250, bottom: detailed view at ×1000, bottom right corners: more detailed views at ×2000).
Figure 1.
As-cast microstructures of the two alloys just after their elaboration by high frequency induction melting and solidification (left: T alloy, right: H alloy, top: general view at ×250, bottom: detailed view at ×1000, bottom right corners: more detailed views at ×2000).

Figure 2.
Differential thermal analysis (DTA) curve obtained for the T alloy.

Figure 3.
DTA curve obtained for the H alloy.

Figure 4.
The two {m vs. T}-plotted isothermal mass gain curves obtained for the two alloys.

Figure 5.
The two {m vs. t}-plotted curves of mass gain at heating for the two alloys.

Figure 6.
The two {m vs. t}-plotted curves of mass variation at cooling for the two alloys.

Figure 7.
XRD spectrum obtained on the oxidized surface of the T alloy (blue peaks: Ni-based matrix, red peaks: CrTaO4).
Figure 7.
XRD spectrum obtained on the oxidized surface of the T alloy (blue peaks: Ni-based matrix, red peaks: CrTaO4).

Figure 8.
XRD spectrum obtained on the oxidized surface of the H alloy (green peaks: Ni-based matrix, blue peaks: NiCr2O4 spinel oxide, red peaks: Cr2O3).
Figure 8.
XRD spectrum obtained on the oxidized surface of the H alloy (green peaks: Ni-based matrix, blue peaks: NiCr2O4 spinel oxide, red peaks: Cr2O3).

Figure 9.
Aspects of the oxidized surfaces of the two alloys (left: T alloy, right: H alloy, top: general view, bottom: detailed view).
Figure 9.
Aspects of the oxidized surfaces of the two alloys (left: T alloy, right: H alloy, top: general view, bottom: detailed view).

Figure 10.
Cross-sectional observation of the surfaces and sub-surfaces affected by oxidation for the two alloys (left: T alloy, right: H alloy, top: general view, bottom: detailed view).
Figure 10.
Cross-sectional observation of the surfaces and sub-surfaces affected by oxidation for the two alloys (left: T alloy, right: H alloy, top: general view, bottom: detailed view).

Figure 11.
X-maps showing the elemental repartition in the subsurface of the oxidized T alloy.

Figure 12.
X-maps showing the elemental repartition in the subsurface of the oxidized H alloy.

Figure 13.
Concentration profiles acquired from the external surface into the alloy (left: T alloy, right: H alloy).
Figure 13.
Concentration profiles acquired from the external surface into the alloy (left: T alloy, right: H alloy).

Figure 14.
Microstructures in the bulk after exposure at 1250 °C for 50 h (left: T alloy, right: H alloy, top: general view, bottom: detailed view).
Figure 14.
Microstructures in the bulk after exposure at 1250 °C for 50 h (left: T alloy, right: H alloy, top: general view, bottom: detailed view).


Table 1.
Chemical compositions of the two as-cast alloys (wt.%, SEM/EDS; five ×250 full frame analyses, that is to say about 5 × 600 µm2) and of their matrixes (wt.%, SEM/EDS; five spot analyses).
Table 1.
Chemical compositions of the two as-cast alloys (wt.%, SEM/EDS; five ×250 full frame analyses, that is to say about 5 × 600 µm2) and of their matrixes (wt.%, SEM/EDS; five spot analyses).
| WHOLE ALLOY | ||||
| Elements: | Wt.% | Cr | Ta | Hf |
| T alloy | Average | 25.78 | 6.20 | 3.53 |
| Standard deviation | 0.46 | 0.63 | 0.49 | |
| H alloy | Average | 24.83 | 3.67 | 7.62 |
| Standard deviation | 0.47 | 0.28 | 0.58 | |
| MATRIX ONLY | ||||
| Elements: | Wt.% | Cr | Ta | Hf |
| T alloy | Average | 25.19 | 3.51 | 0.00 |
| Standard deviation | 0.31 | 0.43 | 0.00 | |
| H alloy | Average | 25.68 | 1.72 | 0.22 |
| Standard deviation | 0.31 | 0.06 | 0.19 | |
Table 2.
Temperatures of start and end of melting and solidification (DTA at +5 and −5 K min−1); estimation of the solidus and liquidus temperatures for the two alloys.
Table 2.
Temperatures of start and end of melting and solidification (DTA at +5 and −5 K min−1); estimation of the solidus and liquidus temperatures for the two alloys.
| HEATING Curve | T Alloy | H Alloy |
| Melting start at: | 1308 °C | 1291 °C |
| Melting end at: | 1378 °C | 1371 °C |
| COOLING Curve | T Alloy | H Alloy |
| Solidification start at: | 1317 °C | 1346 °C |
| Solidification end at: | 1284 °C | 1279 °C |
| Mushy Zone Limites | T Alloy | H Alloy |
| Liquidus estimation: | 1348 °C | 1359 °C |
| Solidus estimation: | 1296 °C | 1285 °C |
Table 3.
Temperatures of start and end of melting and solidification (DTA at +5 and −5 K min−1); estimation of the solidus and liquidus temperatures for the two alloys.
Table 3.
Temperatures of start and end of melting and solidification (DTA at +5 and −5 K min−1); estimation of the solidus and liquidus temperatures for the two alloys.
| ISOTHERMAL Stage (1250 °C) | T Alloy | H Alloy |
|---|---|---|
| Initial linear mass gain rate Kl | 75 × 10−8 g/cm2/s | 83 × 10−8 g/cm2/s |
| Classical parabolic constant Kp | 80 × 10−12 g2/cm4/s | 78 × 10−12 g2/cm4/s |
| Chromia volatilization—corrected Kp: Kpcorr volat | 174 × 10−12 g2/cm4/s | 87 × 10−12 g2/cm4/s |
| Chromia volatilization constant Kv | 224 × 10−10 g/cm2/s | 27 × 10−10 g/cm2/s |
| Mass gain at isoth. stage end | 5.2 mg/cm2 | 5.0 mg/cm2 |
Table 4.
Values of various parameters characterizing the oxidation during heating for the two alloys.
Table 4.
Values of various parameters characterizing the oxidation during heating for the two alloys.
| HEATING from Room Temperature to 1250 °C | T Alloy | H Alloy |
|---|---|---|
| T oxidation start @ heating | 938 °C | 792 °C |
| Mass gain @ heating end | 346 µg/cm2 | 428 µg/cm2 |
| Mass gain instantaneous rate when reaching the isothermal stage | 0.86 µg/cm2/s | 0.97 µg/cm2/s |
| Activation energy of linear rate (end of heating) | 237 kJ/mol | 195 kJ/mol |
Table 5.
Values of various parameters characterizing the spallation behavior during cooling for the two alloys.
Table 5.
Values of various parameters characterizing the spallation behavior during cooling for the two alloys.
| COOLING from 1250 °C to Room Temperature | T Alloy | H Alloy |
|---|---|---|
| T oxide spallation start @ cooling | 826 °C | 666 °C |
| Whole cycle total mass variation | −12.5 mg/cm2 | −1.5 mg/cm2 |
Table 6.
Chemical composition of the matrixes of the two alloys after exposure at 1250 °C for 50 h.
| Elements: | Wt.% | Cr | Ta | Hf |
|---|---|---|---|---|
| T alloy | Average | 25.41 | 2.48 | 0.00 |
| Standard deviation | 0.49 | 0.32 | 0.00 | |
| H alloy | Average | 26.50 | 1.00 | 0.21 |
| Standard deviation | 0.35 | 0.29 | 0.23 |
Table 7.
Mass and volume fractions of the MC carbides in the two alloys after exposure at 1250 °C for 50 h.
Table 7.
Mass and volume fractions of the MC carbides in the two alloys after exposure at 1250 °C for 50 h.
| ALLOYS | Mass.% MC (min) | Mass.% MC (average) | Mass.% MC (max) | Vol.% MC (min) | Vol.% MC (average) | Vol.% MC (max) |
|---|---|---|---|---|---|---|
| T alloy | 3.52 | 3.86 | 4.19 | 2.49 | 2.69 | 2.92 |
| H alloy | 4.63 | 5.17 | 5.70 | 3.23 | 3.61 | 3.99 |
Publisher’s Note: MDPI stays neutral with regard to jurisdictional claims in published maps and institutional affiliations. |
© 2021 by the authors. Licensee MDPI, Basel, Switzerland. This article is an open access article distributed under the terms and conditions of the Creative Commons Attribution (CC BY) license (http://creativecommons.org/licenses/by/4.0/).
Share and Cite
MDPI and ACS Style
Berthod, P.; Kane, D.A.; Aranda, L. Oxidation and Microstructural Behaviors of Ni-Based Alloys Strengthened by (Ta, Hf)C Carbides at 1250 °C in Air. Crystals 2021, 11, 159. https://0-doi-org.brum.beds.ac.uk/10.3390/cryst11020159
AMA Style
Berthod P, Kane DA, Aranda L. Oxidation and Microstructural Behaviors of Ni-Based Alloys Strengthened by (Ta, Hf)C Carbides at 1250 °C in Air. Crystals. 2021; 11(2):159. https://0-doi-org.brum.beds.ac.uk/10.3390/cryst11020159
Chicago/Turabian StyleBerthod, Patrice, Dame Assane Kane, and Lionel Aranda. 2021. "Oxidation and Microstructural Behaviors of Ni-Based Alloys Strengthened by (Ta, Hf)C Carbides at 1250 °C in Air" Crystals 11, no. 2: 159. https://0-doi-org.brum.beds.ac.uk/10.3390/cryst11020159
Note that from the first issue of 2016, this journal uses article numbers instead of page numbers. See further details here.