
Mechanical Properties of Commercial Purity Aluminum Modified by Zirconium Micro-Additives


1
Department of Mechanical Engineering, Tafila Technical University, Tafila 66110, Jordan
2
Department of Industrial Engineering, University of Jordan, Amman 11942, Jordan
*
Author to whom correspondence should be addressed.
Crystals 2021, 11(3), 270; https://0-doi-org.brum.beds.ac.uk/10.3390/cryst11030270
Submission received: 1 March 2021
/
Revised: 6 March 2021
/
Accepted: 8 March 2021
/
Published: 9 March 2021
(This article belongs to the Special Issue Properties of Transition Metals and Their Compounds at Extreme Conditions)
Abstract
:The mechanical properties and the fractured surfaces of commercial purity aluminum modified by zirconium micro-additives were investigated by means of experimental examination. A commercial purity Al specimen was used as a reference material and seven Al-Zr alloys in the 0.02–0.14 wt.% Zr composition range (with 0.02 wt.% Zr step) were prepared by microalloying methods. Optical microscopy was used to examine the microstructures and to calculate the grain sizes of the prepared specimens. The phase assemblage diagrams were plotted and the relative amounts of solid phases were calculated at room temperature using FactSage thermochemical software and databases. Proof stress, strength coefficient and strain hardening exponent were measured from the stress-strain curves obtained from tensile experiments and Charpy impact energy was calculated for all specimens. The experiments showed that the grain size of commercial purity Al was reduced by adding any Zr concentration in the investigated composition range, which could be due to the nucleation of new grains at Al3Zr particle sites. Accordingly, the microhardness number, tensile properties and Charpy impact energy were improved, owing to the large grain-boundary areas resulted from the refining effect of Zr, which can limit the movement of dislocations in the refined samples. The basic fracture mode in all specimens was ductile, because Al has an FCC structure and remains ductile even at low temperatures. The ductile fractures took place in a transgranular manner as could be concluded from the fractured surface features, which include voids, ridges and cavitation.
1. Introduction
Characterizing the mechanical properties of metals and alloys is fundamental for multiple technological applications. It is essential to depict the responses of structural components to external mechanical loadings [1,2]. Of particular interest, the investigation of titanium [3] and aluminum [4] alloys’ behaviors is essential, because they are broadly used by the aerospace industry. Aluminum and its alloys are among the most in demand engineering materials for structural applications in many industries, because of their various positive attributes, such as high strength-to-weight ratio, good corrosion resistance and excellent thermal and electrical conductivities [5]. Aluminum properties are governed by the grain size, which is one of the important microstructural features as described by the Hall–Petch [6,7] relationship. Fine-grained structures usually show high yield strength, high toughness, good formability, improved machinability and uniform distribution of the secondary phases [8,9]. One way to modify the Al grain structure is by introducing small amounts of alloying elements, the so-called grain refiners, such as rare earth elements, transition metals and binary alloys (Ti+B) [5,10]. The main role of the grain refiners is to develop fine equiaxed Al solid solution (FCC_Al) grains in the cast structure either by increasing the number of nucleation sites or by grain multiplications [11]. The addition of transition metals, such as Zr [12], can modify the cast Al structure effectively by forming the Al3Zr primary phase particles [13,14]. It has been reported that the grain refinement effect on the parent metal is often associated with peritectic systems [14,15]. According to Murray et al. [16] and Wang et al. [17], FCC_Al solid solution solidifies from the liquid by L + Al3Zr ↔ FCC_Al peritectic reaction at 660.8 °C and 0.28 wt.% (0.083 at.%) Zr. The maximum liquid solubility of Zr in Al was reported as 0.11 wt.% (0.030 at.%) Zr at 661 °C [18]. The refinement occurs during the cooling of the primary phase crystals, which react peritectically with the liquid. Upon further cooling, the peritectic reaction progresses and transforms the primary crystals into secondary phase crystals, which then act as nuclei for solidification of the remaining melt [15]. The role of the new nucleation sites is to block the grain boundary or sub-boundary migration, which refine the cast grain structure [19,20].
The effect of Zr on the mechanical properties of commercial purity Al [12] and other Al alloys [13,20,21,22] has been investigated. Gao et al. [12] found that addition of Zr with 0.2 wt.% to commercial purity Al refined the cast structure significantly by precipitating L12 structured Al3Zr primary phase. Furthermore, the hardness and peak stress of Al-0.2Zr alloy were increased by 20% and 15.6%, respectively, as compared to that of pure Al. By adding ~0.12 wt.% Zr, Toschi et al. [13] noticed an increase in the tensile strength (TS) and yield strength (YS) of age hardenable aluminum alloy containing magnesium and copper (AA2618) at room temperature (by 7% and 22%, respectively) and after aging at 250 °C (by 10% and 12%, respectively). The improved tensile properties were due to the presence Al3Zr primary phase particles. In an attempt to stabilize the fine-grained structure and improve the superplasticity behavior, Duan et al. [20] added 0.1 wt.% Zr to Al-Zn-Mg alloys. Seyed Ebrahimi et al. [21] found that addition of 0.3 wt.% Zr to the new super high strength Al–12.24Zn–3.25Mg–2.46Cu alloy decreased the average grain size by 20% and enhanced the tensile strength, yield strength and elongation values by 34%, 25% and 1850%, respectively.
The abovementioned literature data showed that Zr has significantly improved the microstructural features and mechanical behaviors of commercial purity Al and its alloys due to the formation of Al3Zr primary phase. However, the wt.% Zr was varying from one study to another. This work aims at investigating the effects of minor Zr additives in the 0.02–0.14 wt.% Zr range (with 0.02 wt.% Zr step) on the microstructure, microhardness, tensile properties, and Charpy impact energy of commercial purity aluminum. Microalloying technique was used to control the chemical composition of different Al-Zr alloys.
2. Materials and Methods
Commercial purity aluminum of about 99.8 wt.% was used as a reference material and as a major component in the master alloys and microalloys. Seven microalloys with different Zr concentrations (0.02, 0.04, 0.06, 0.08, 0.10, 0.12 and 0.14 wt.%) were prepared by diluting the binary Al-5.73Zr wt.% master alloy in a commercial purity aluminum. The chemical compositions of the commercial purity Al is listed in Table 1.
The Al-5.73Zr wt.% master alloy was prepared by melting the predetermined quantity of Al in a graphite crucible at 850 °C for 15 min with a cryolite flux on the melt top to prevent oxidation. The furnace temperature was raised up to 1000 °C and a capsule of a pure zirconium powder wrapped in an Al foil was added to the melt. The melt was stirred for 30 s using a graphite rod and kept inside the furnace for another 5 min. The melt was then poured in a brass die with a cylindrical cavity.
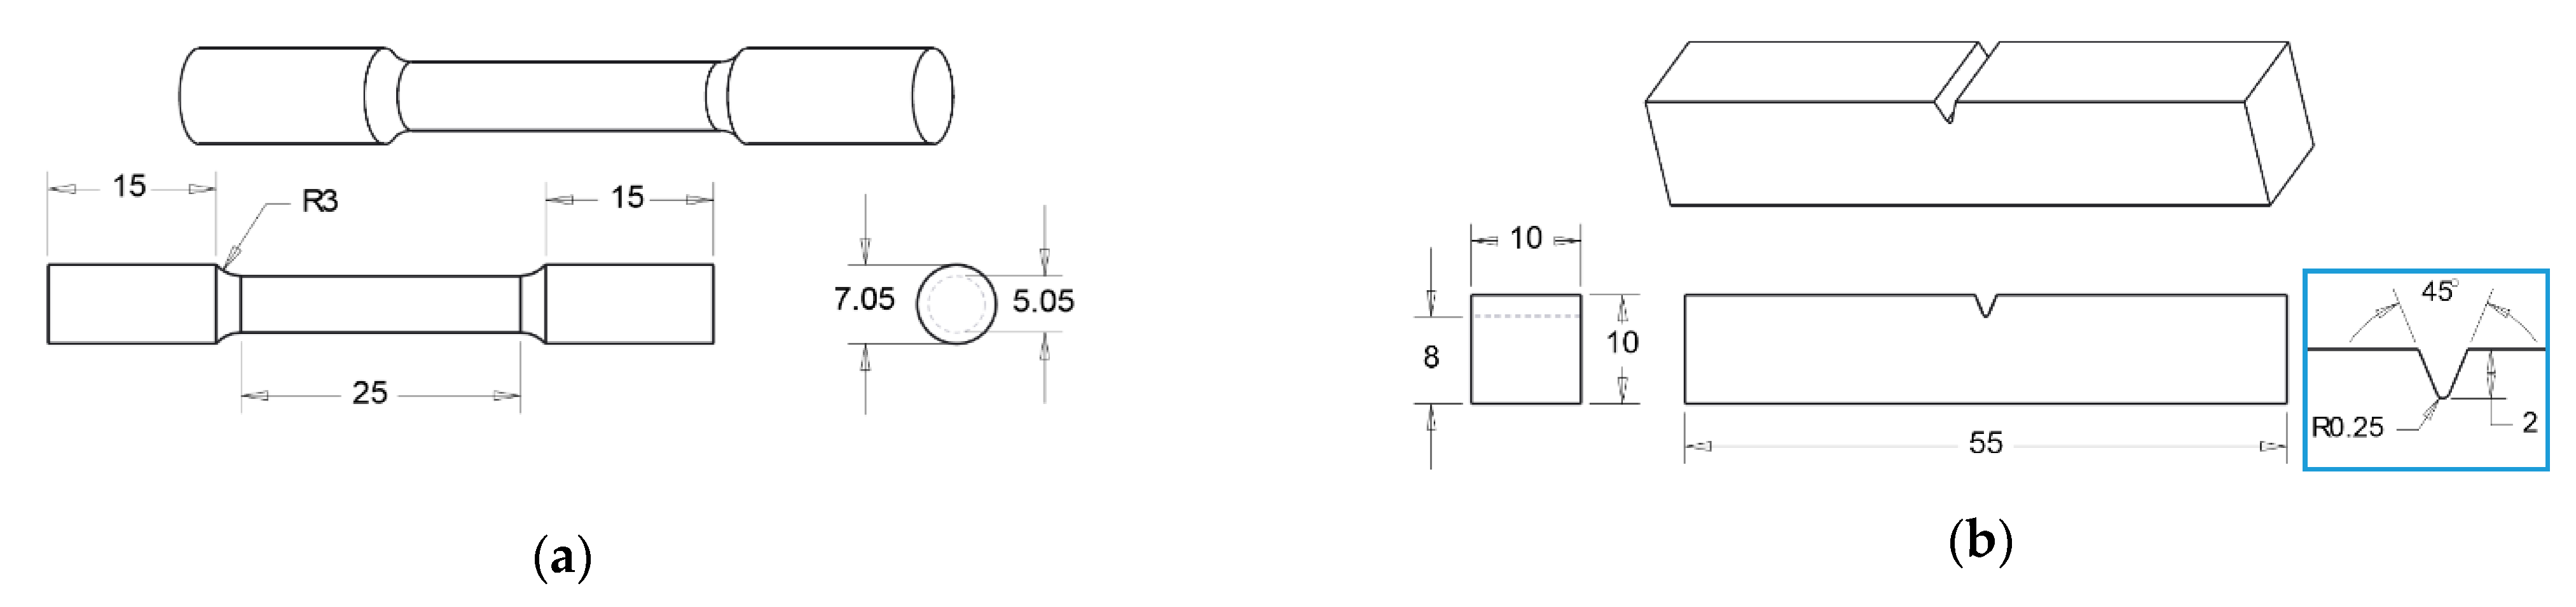
The microalloys were prepared similarly by adding the predetermined quantities of Al and master alloy in a graphite crucible and melted at 800 °C for 15 min with the cryolite flux. The melt was stirred for 30 s to enhance mixing the master alloy with the parent metal and solidified inside brass dies of two forms. The first form was a 10 mm diameter and 100 mm long cylinder for making the tensile test specimens according to ASTM 557-15 [23] standard shown in Figure 1a. The other form was to prepare the 10 mm × 10 mm × 100 mm impact test specimens according to ASTM E23-18 [24] standard shown in Figure 1b.
Slices from the prepared microalloys were taken using a slow cutting machine in order to minimize heat generated during cutting process and to prevent any microstructural changes. The slices were mounted in cold epoxy blocks, ground gradually from 240 up to 1200 grit using SiC sand papers and polished using 1 µm diamond paste. The polished specimens were chemically etched using a solution of 1.5% HF + 2% HNO3 + 1.5% HCl + 95% distilled water for 90 s and cleaned under running water to perform metallurgical examination. A Quanta 200 scanning electron microscope (SEM, FEI, Hillsboro, OR, USA) equipped with an energy dispersive X-ray spectrometer (EDS) was used to determine the chemical composition of the master alloy and to examine the features of the fractured surfaces.
Microhardness tests were carried out using a HWDM-3 Vickers hardness tester (TTS Unlimited Inc., Kita-Ku, Osaka, Japan) equipped with a pyramid head indenter of 136° angle between each face and 100 g force. Seven different values were taken at different locations on each specimen, from which the average HV number for each alloy was determined. The grain sizes were measured according to the standard test methods for determining average grain size using the intercept method (ASTM E112-13) [25]. Five lines at different directions were used and the average grain size was determined for each specimen.
Tensile properties were acquired using a 250 KN capacity universal testing machine (Shimadzu, Kyoto, Japan) at a cross head speed of 10 mm/min. The tensile test was performed on circular samples, shown in Figure 1a, with a gradual axial loading until failure. The load-extension data were recorded by a data acquisition system in order to evaluate true stress-strain data. The impact toughness was determined with a Charpy impact test, also known as the CVN test [26]. The Charpy test allows an estimation of the total impact work needed for crack initiation and the work necessary for crack propagation from a V-notched specimen shown in Figure 1b. The energy absorbed versus Zr concentration relationship was plotted.
3. Results and Discussion
3.1. Microstructure and Grain Size Analyses
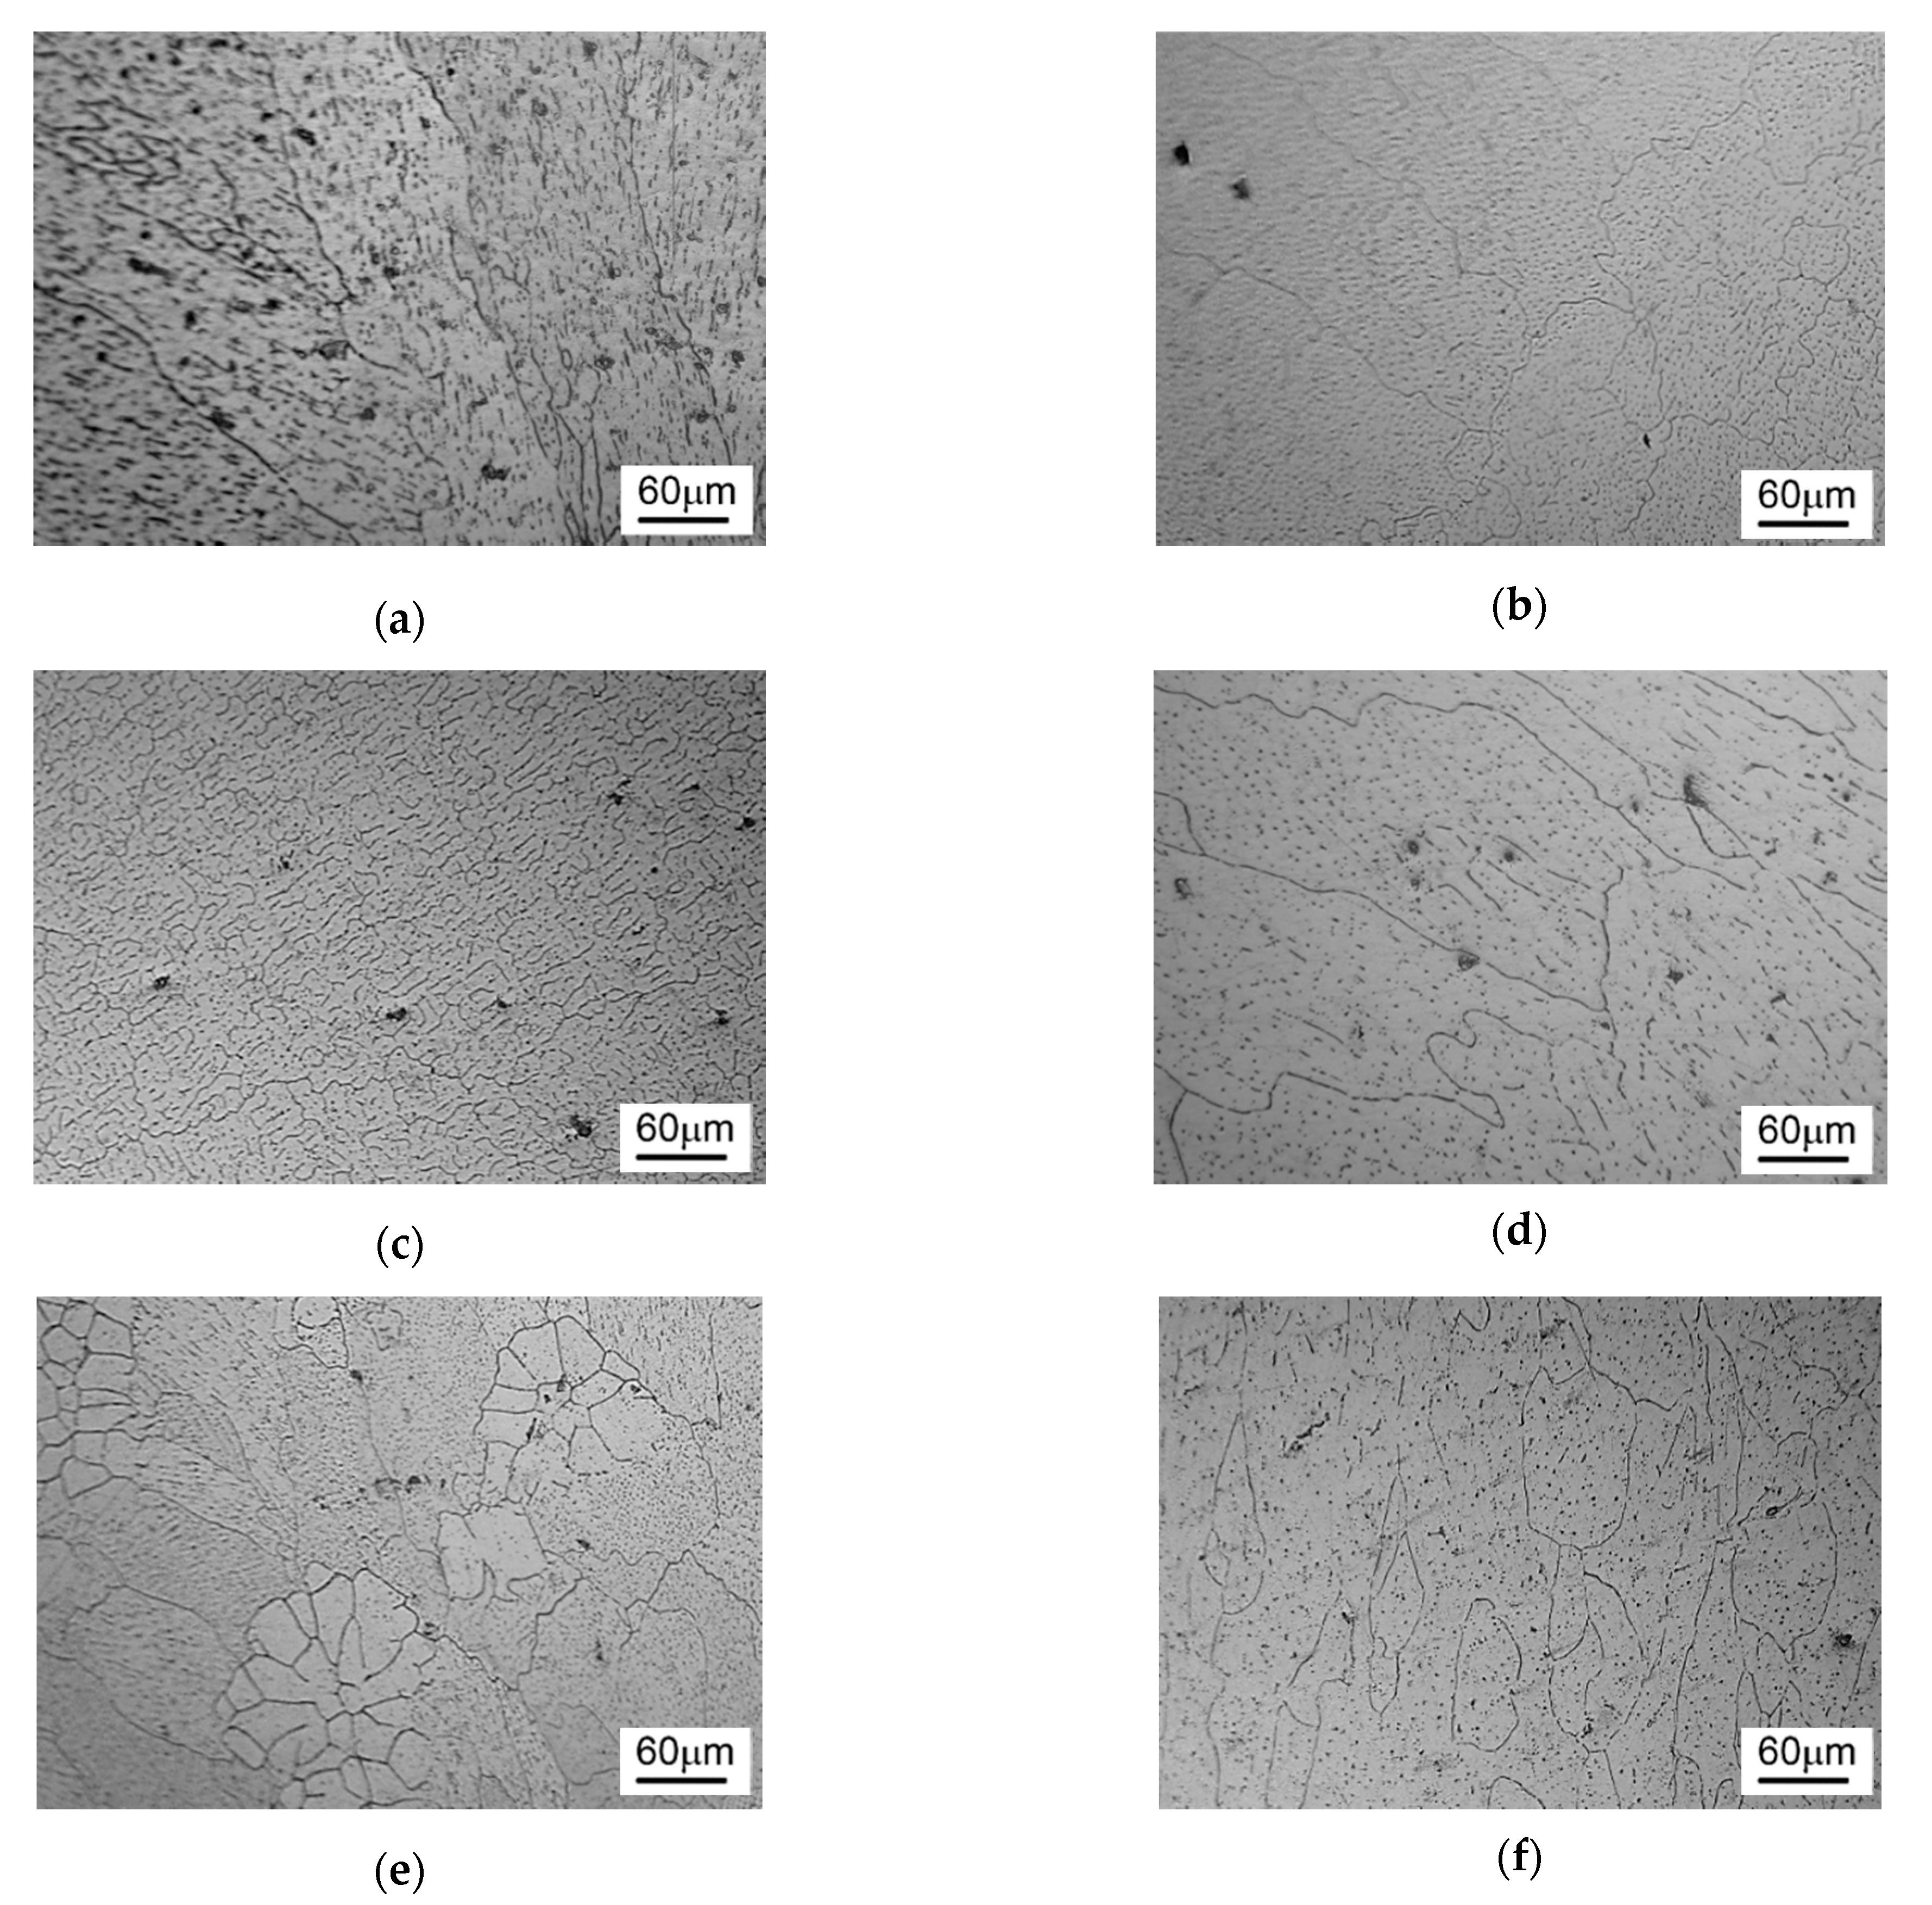
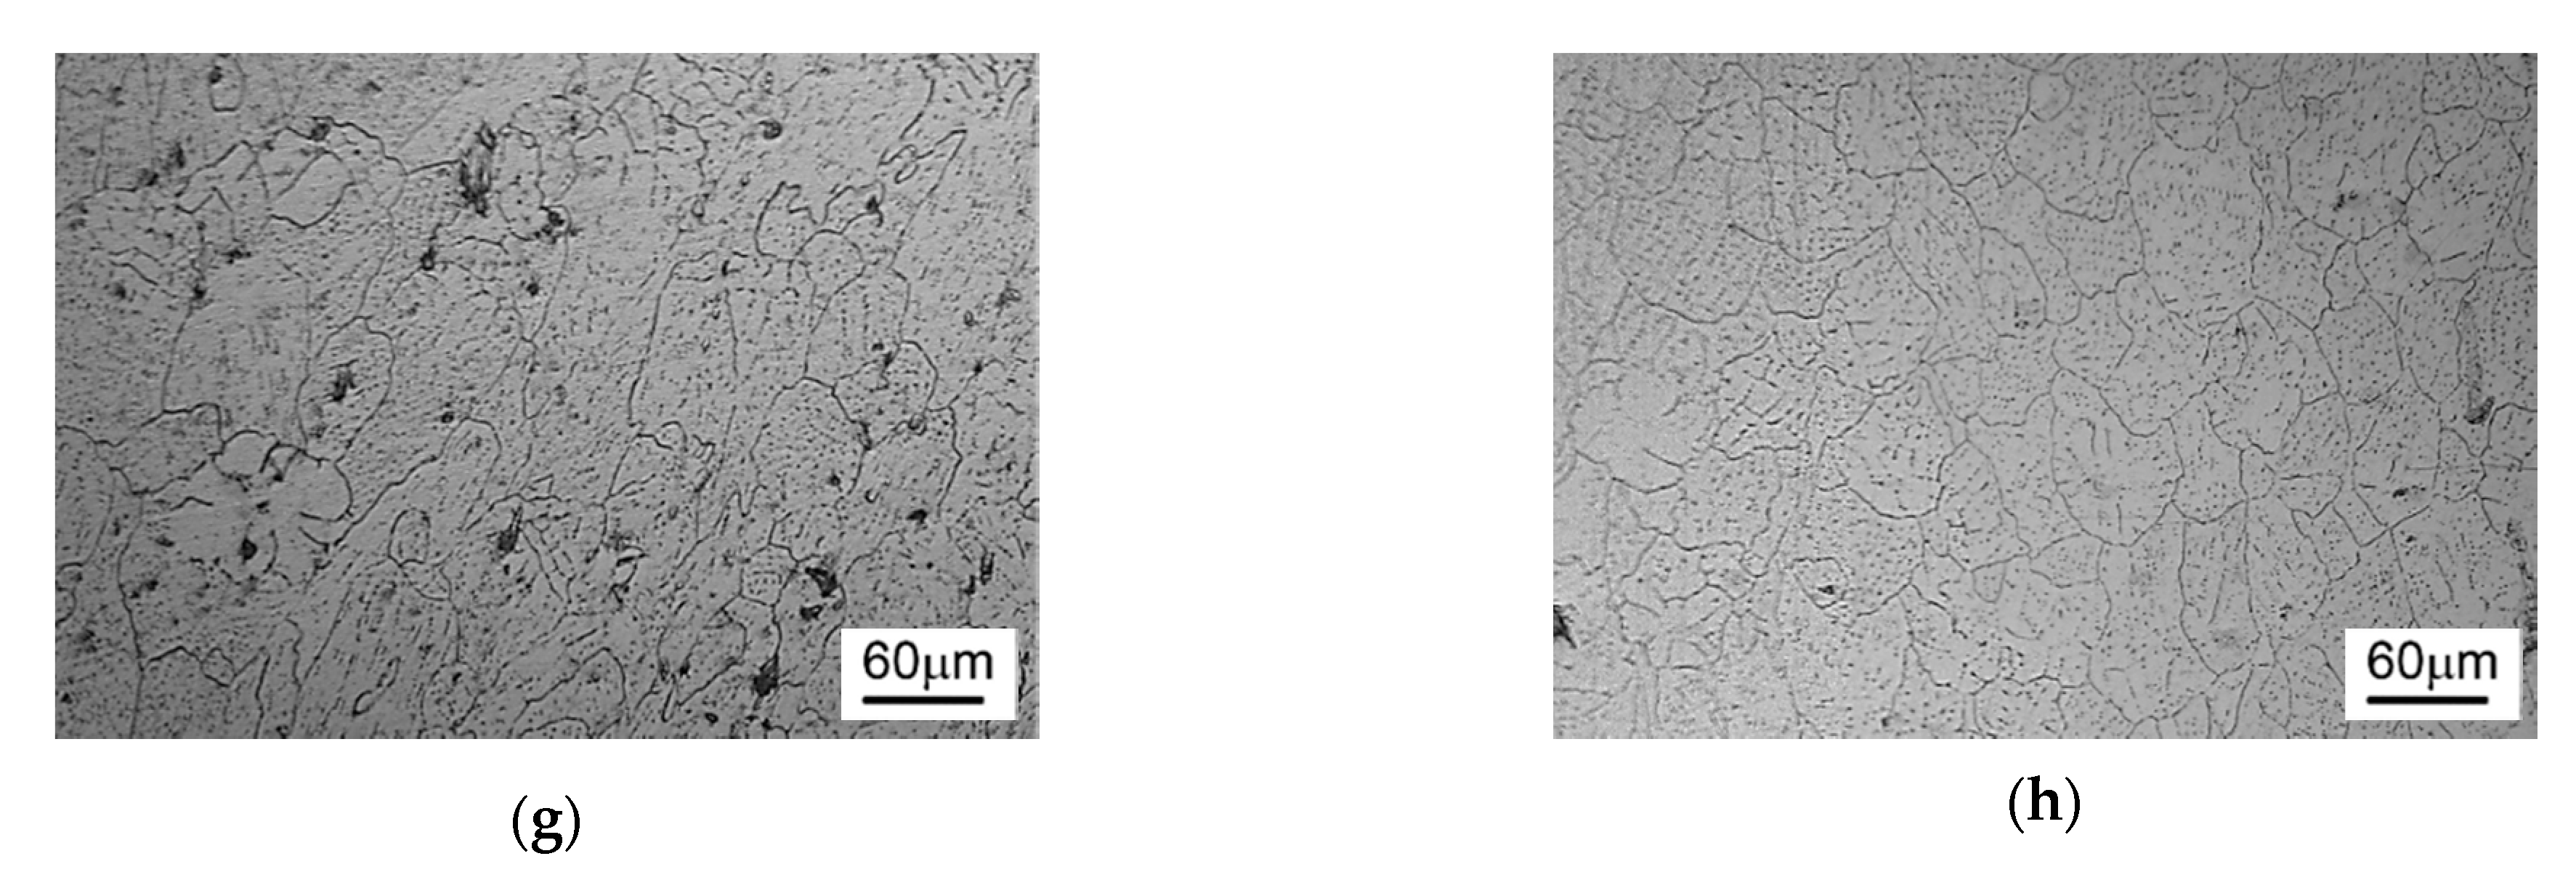
The optical micrographs of the commercial purity Al and modified alloys with different Zr concentrations are shown in Figure 2. It can be seen that the microstructure of reference material was dramatically changes by adding different Zr wt.% concentrations. In Figure 2a, commercial purity Al shows a mixture of grain structures dominated by large columnar grains. The columnar structure in Al was altered after adding Zr element and other grain and sub-grain structures were formed. Figure 2b,c illustrate the microstructure of Al-0.02Zr and Al-0.04Zr microalloys, respectively, which contain grains with determined boundaries and internal sub-grains colonized by the main grain boundaries. The grain boundaries in Figure 2b are well defined and the sub-grain boundaries are small. On the other hand, the main grain boundaries are less defined in Figure 2c due to the growth of sub-grains. In case of Al-0.06Zr microalloy, it seems that the sub-grains grew more than that in Al-0.04Zr microalloy and thus the Al columnar microstructure turned into large equiaxed grains, shown in Figure 2d, due to the merge grains along boundaries. Figure 2e shows a unique microstructure, differs than others, where the sub grains clustered within the equiaxed primary grain structure after adding 0.08 wt.% Zr. The increased Zr concentration leads to precipitate more of Al3Zr second phase upon cooling, which breaks the coarse structure, seen in Al-0.06Zr microalloy, into smaller grains by nucleating several sub-grains. Evidence of the refining effect of high Zr concentrations (up to 0.14 wt.%) could be seen in Figure 2f–h. The grains are becoming more resistant to coarsening if the diffusivity and solubility of the added metal are small [27]. Among the transition metals, Zr has the smallest diffusion flux [28] and low solubility in Al.
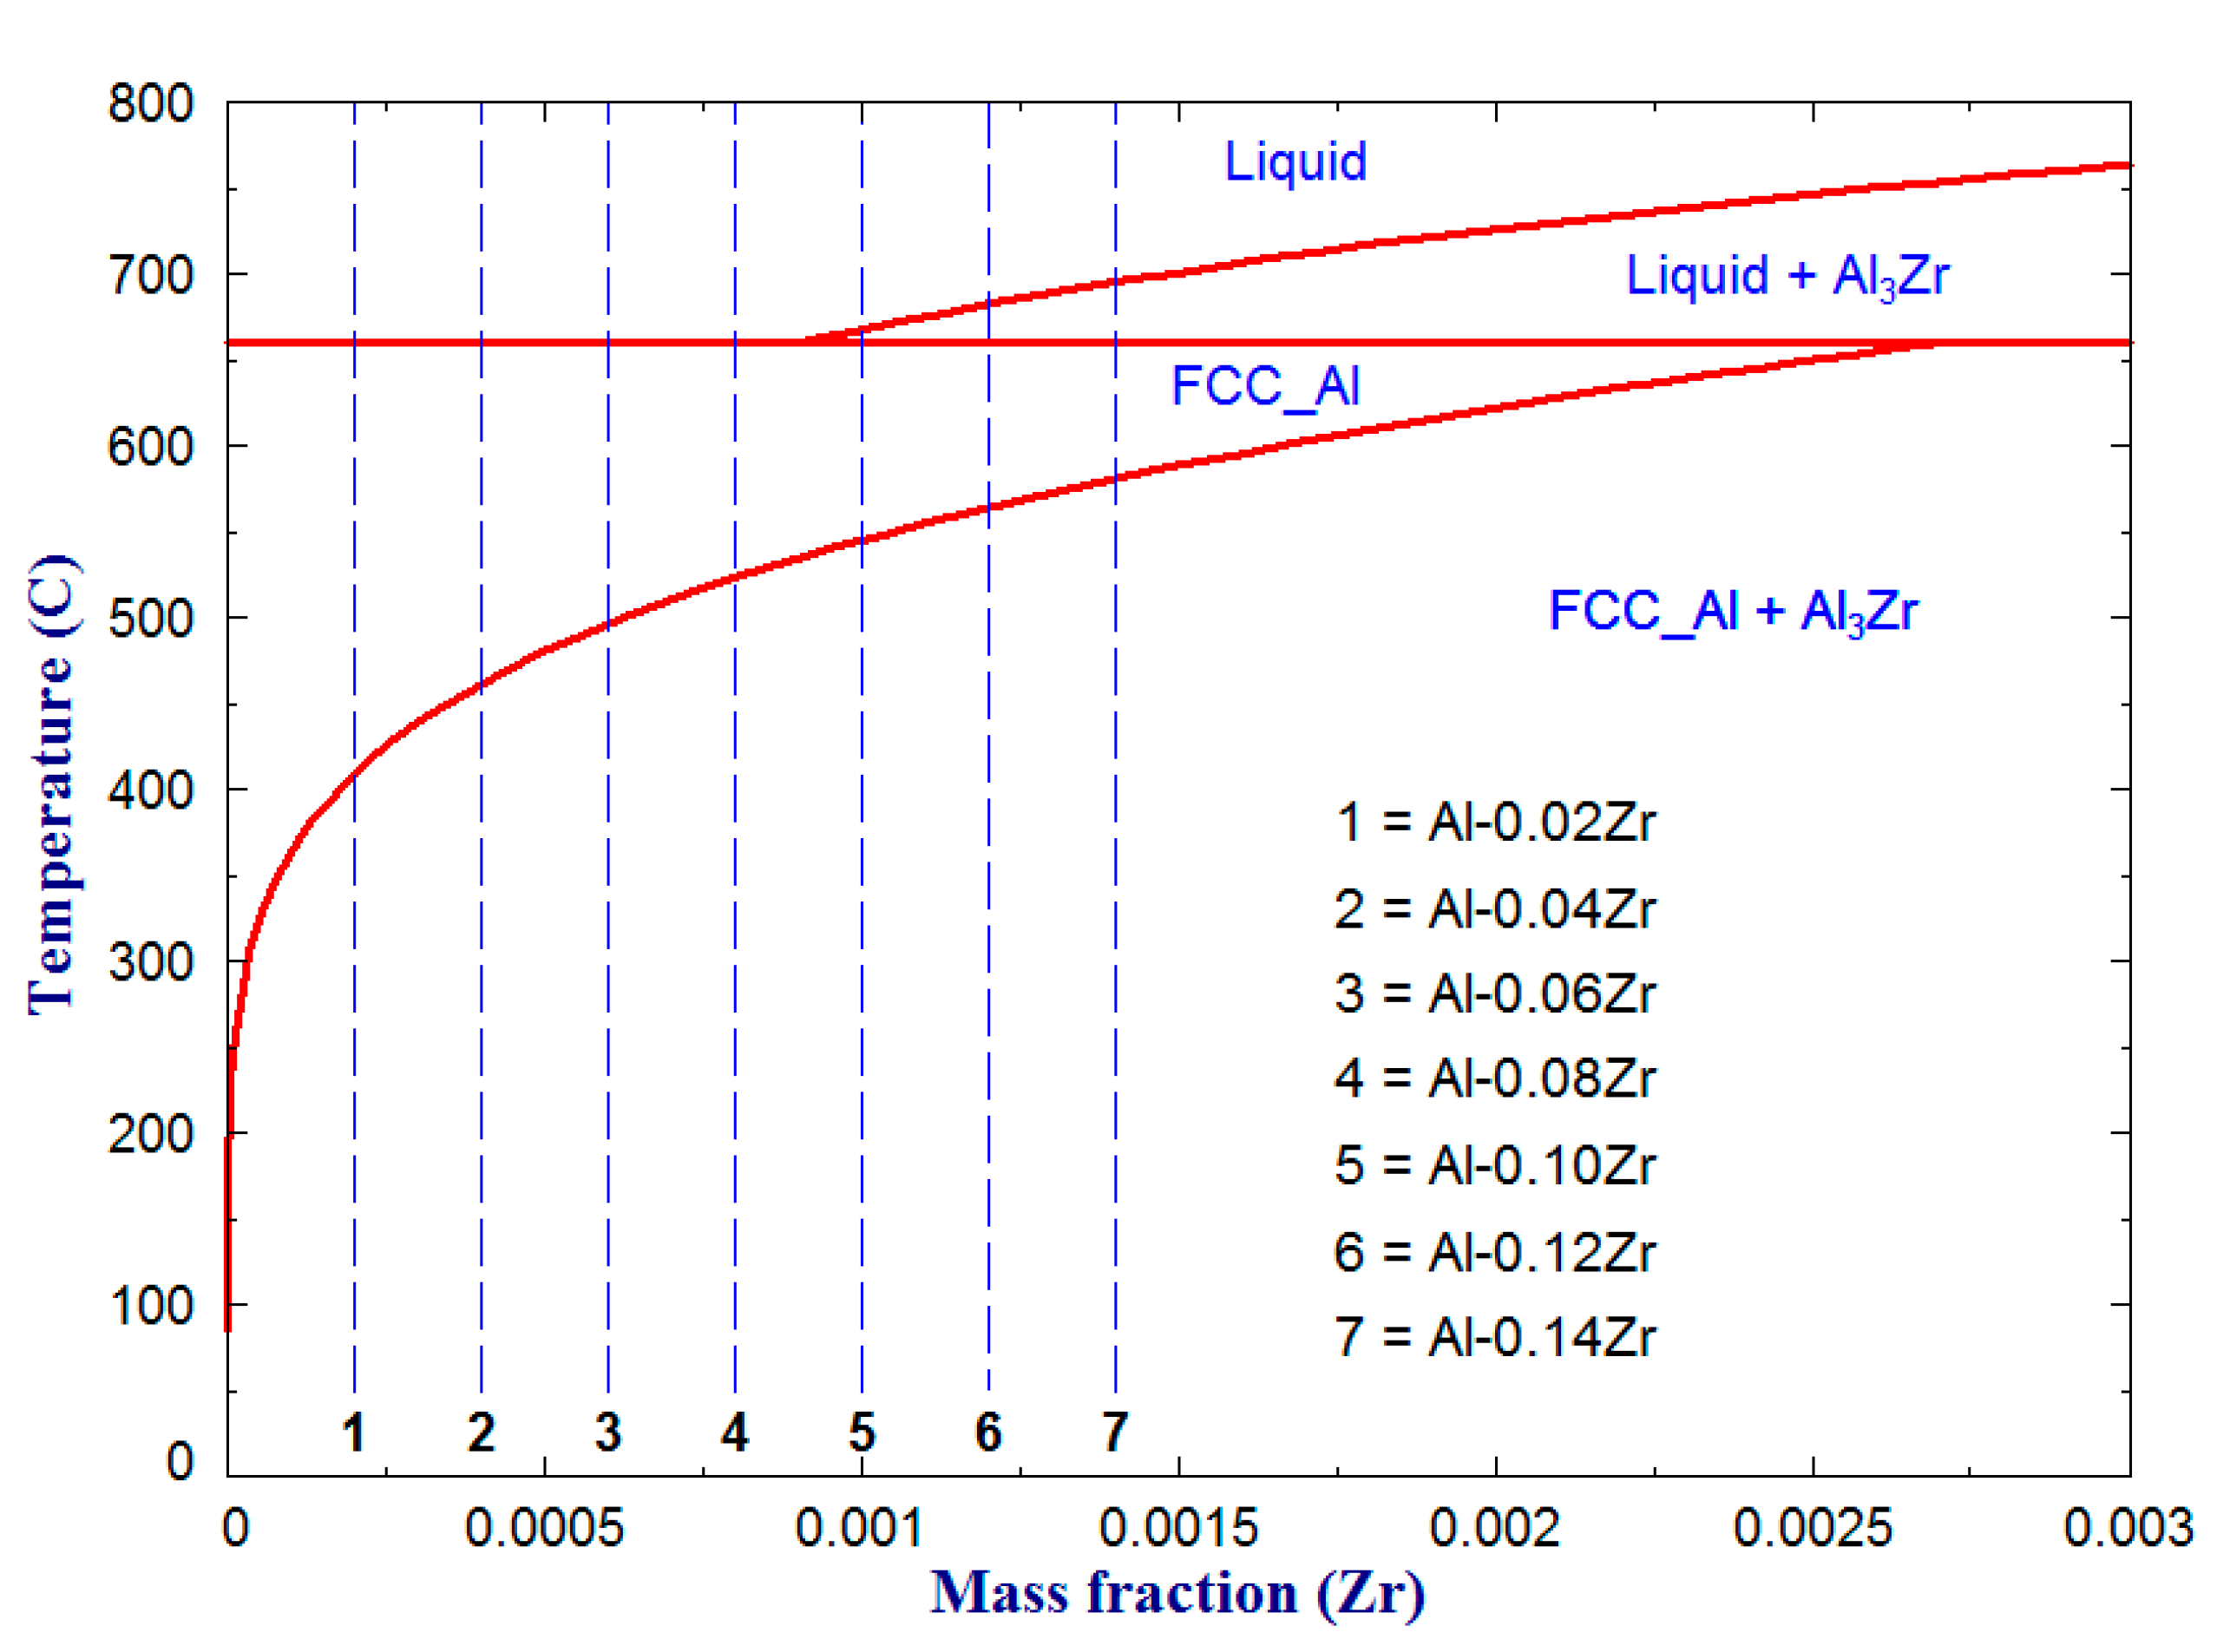
The Al-rich side of the Al-Zr binary phase diagram in Figure 3 was calculated using the FactSage thermochemical software and database [25] to better understand the relationship between the alloy composition and the microstructure. The dashed lines represent the composition of Al-Zr microalloys prepared in this study. It can be noted that Al3Zr forms in 0.10, 0.12 and 0.14 wt.% Zr microalloys during cooling when the solidification path crosses the L + Al3Zr two-phase field. The amount of Al3Zr precipitates increase by increasing the Zr concentration and thus more nucleation sites in the melt are expected. The remaining liquid solidifies upon cooling, in the 550–661 °C temperature range, to form FCC_Al solid solution according to L + Al3Zr ↔ FCC_Al peritectic reaction. At room temperature, Al3Zr solute particles precipitate from the super saturated FCC_Al solid solution and disperse in FCC_Al matrix. This explains the formation of a uniform fine structures in 0.10–0.14 wt.% Zr microalloys.
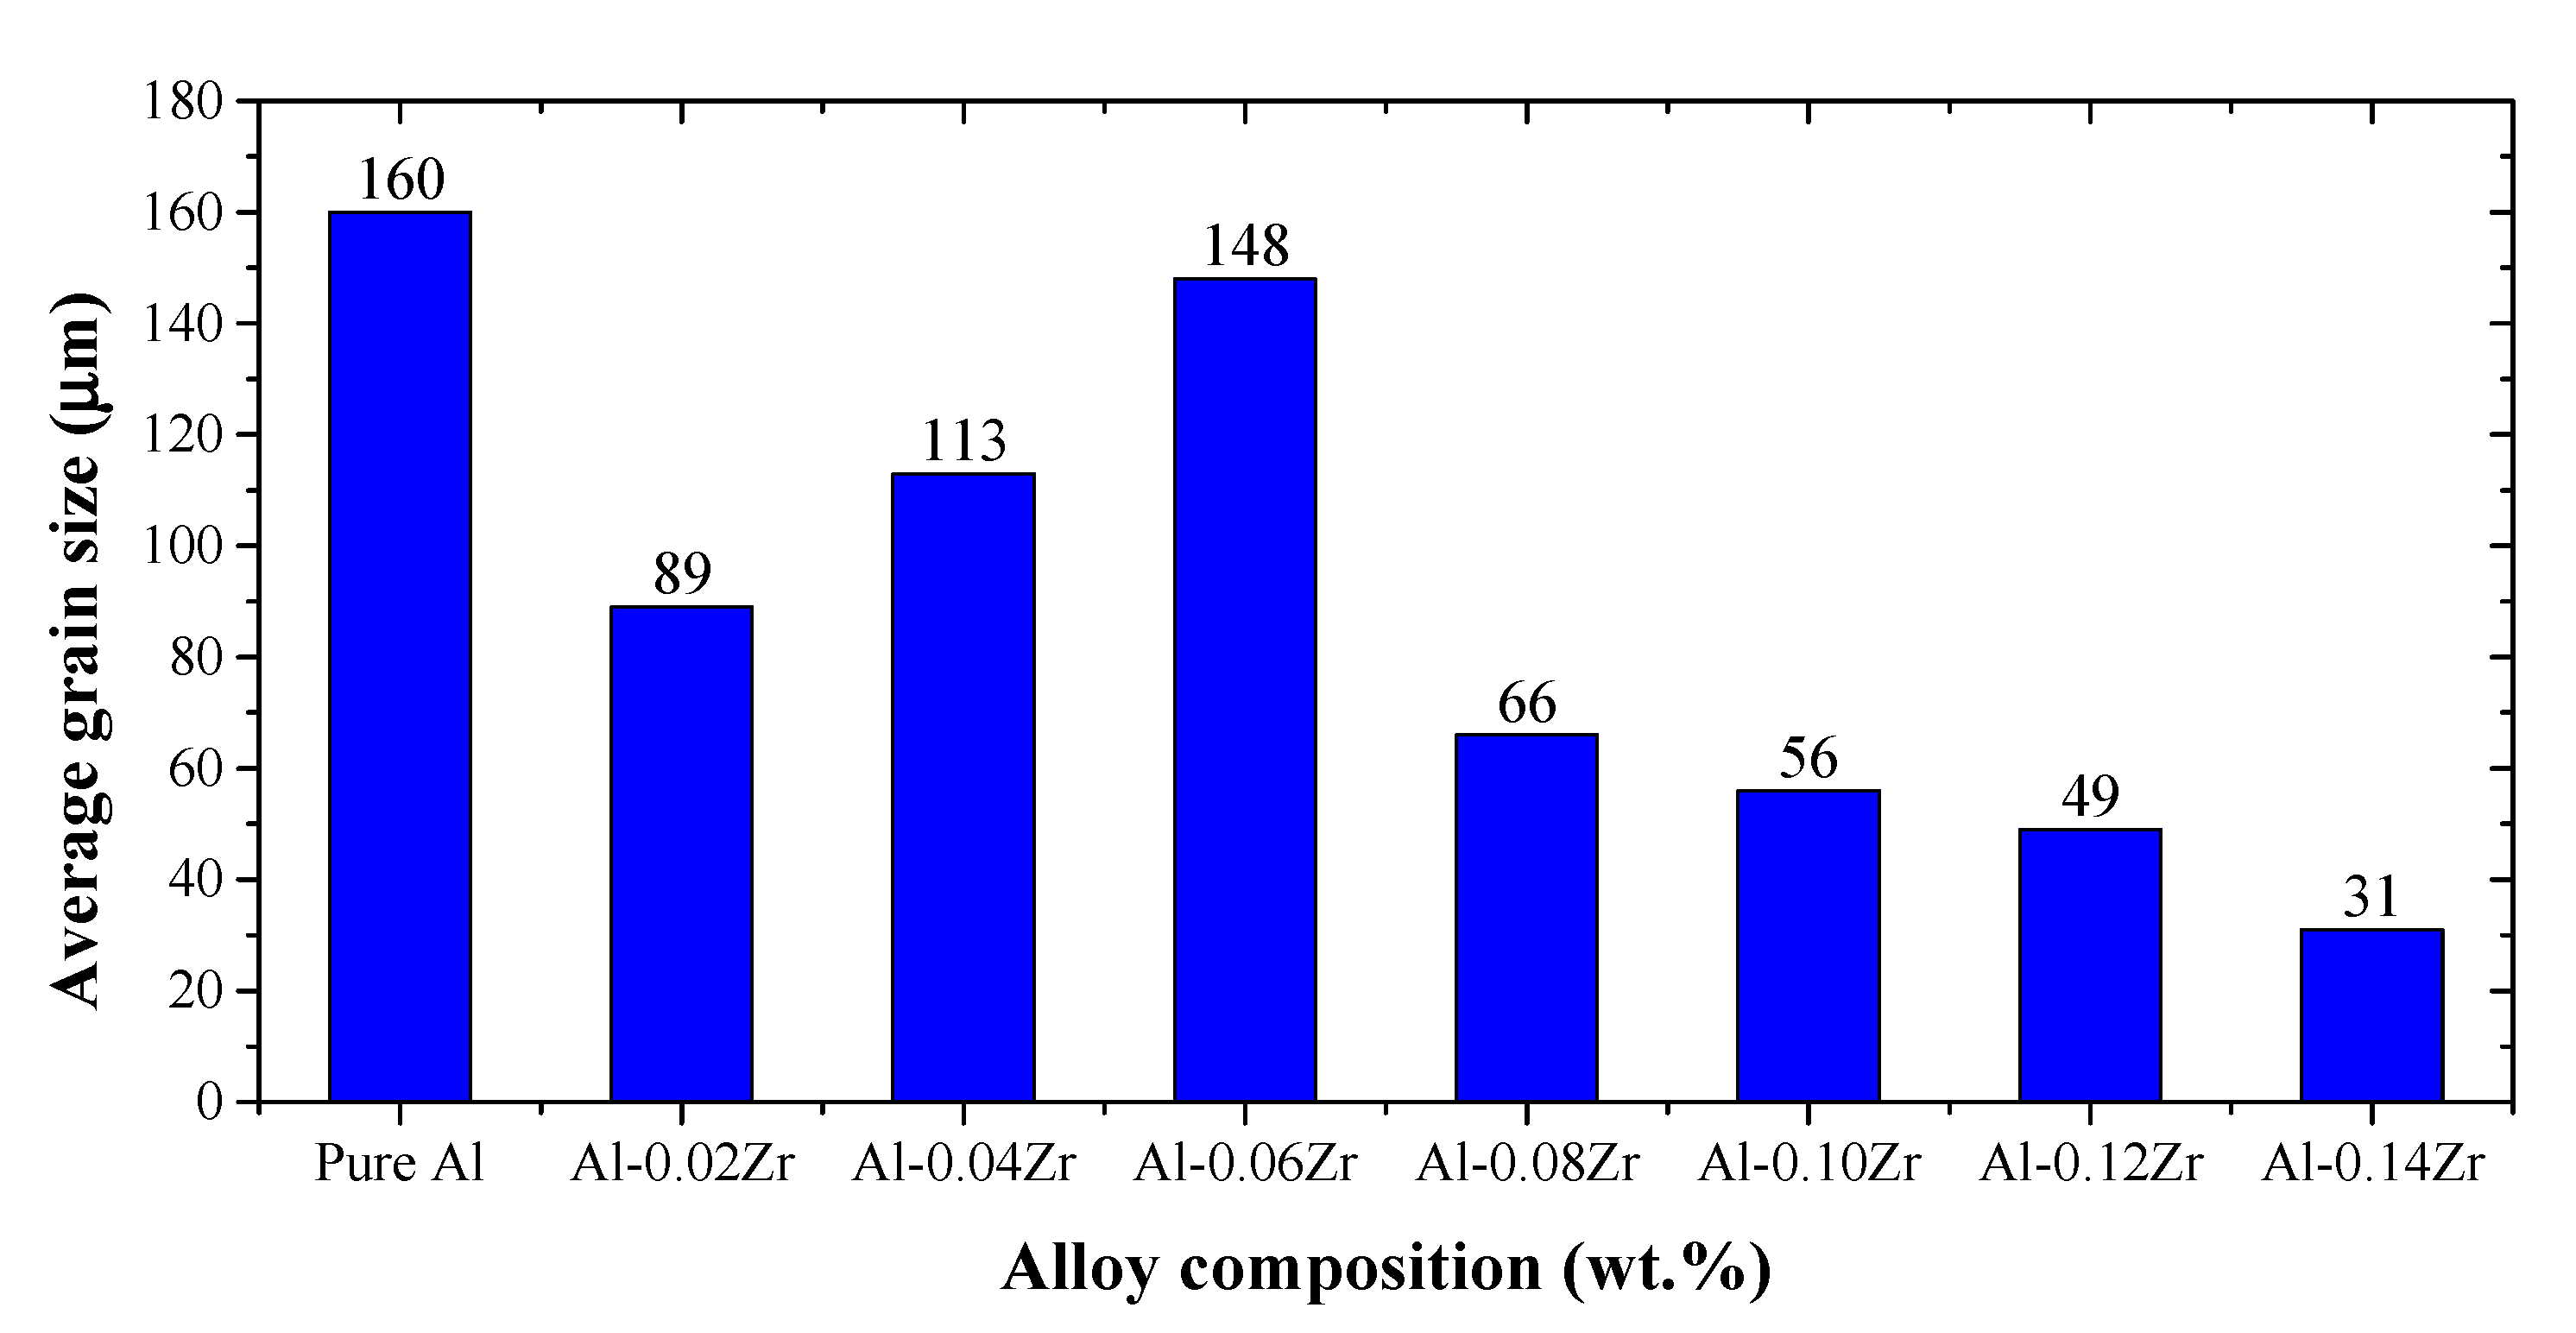
The corresponding average grain size versus Zr wt.% concentration in commercial purity Al relationship is plotted in Figure 4. The grain size of pure aluminum specimen was measured by taking the equivalent diameter of equiaxed grains to be 160.3μm. It is noted that the average grain size of commercial purity aluminum has been reduced after 0.02–0.14 wt.% Zr addition. The average grain size has dropped from 160.3 μm to 88.8 μm after 0.02 wt.% Zr addition and then gradually increased up to 148.4 μm when 0.06 wt.% Zr was added. Another drop in the average grain size, down to 66.1 μm, was observed after adding 0.08 wt.% Zr, which later gradually reduced down to 31.4 μm when 0.14 wt.% Zr was added. Gao et al. [12] observed the grain refinement effect of Zr on Al when the large Al dendrites were altered to fine equiaxed grains after adding 0.2 wt.% Zr.
Mahmoud et al. [29] added 0.1 to 0.3 wt.% Zr (with 0.05 wt.% Zr step) to pure Al and found that the grain structure has been refined in the experimental range. However, further Zr addition (>0.3 wt.%) slightly increased the average grain size, whereas excess Zr addition did not show any considerable effect on the Al structure [29].
It was reported by Rohrer [30] that precipitation of a second phase is one mechanism that can occur to partition excess solute in the microstructure. The more solute on the grain boundary increases the grain boundaries and thus finer grain structures may result. It is mentioned earlier in this work that the maximum solid solubility of Zr in Al at 660.8 °C was reported as 0.28 wt.%. However, the amount of Zr solute in Al reduces when the alloy cools down to room temperature. Under such condition, the alloy becomes supersaturated with Zr solute and Al3Zr primary phase precipitates peritectically [27]. The higher the Zr concentration in the alloy contains the more Al3Zr phase particle precipitates.
Table 2 summarizes the relative amounts of solid phases (in gram) for each microalloy composition at room temperature. The primary Al3Zr phase serves as an effective heterogeneous nuclei for Al and refine the grains, because of the lattice parameter mismatch between L12 structured Al3Zr and FCC_Al matrix [31].
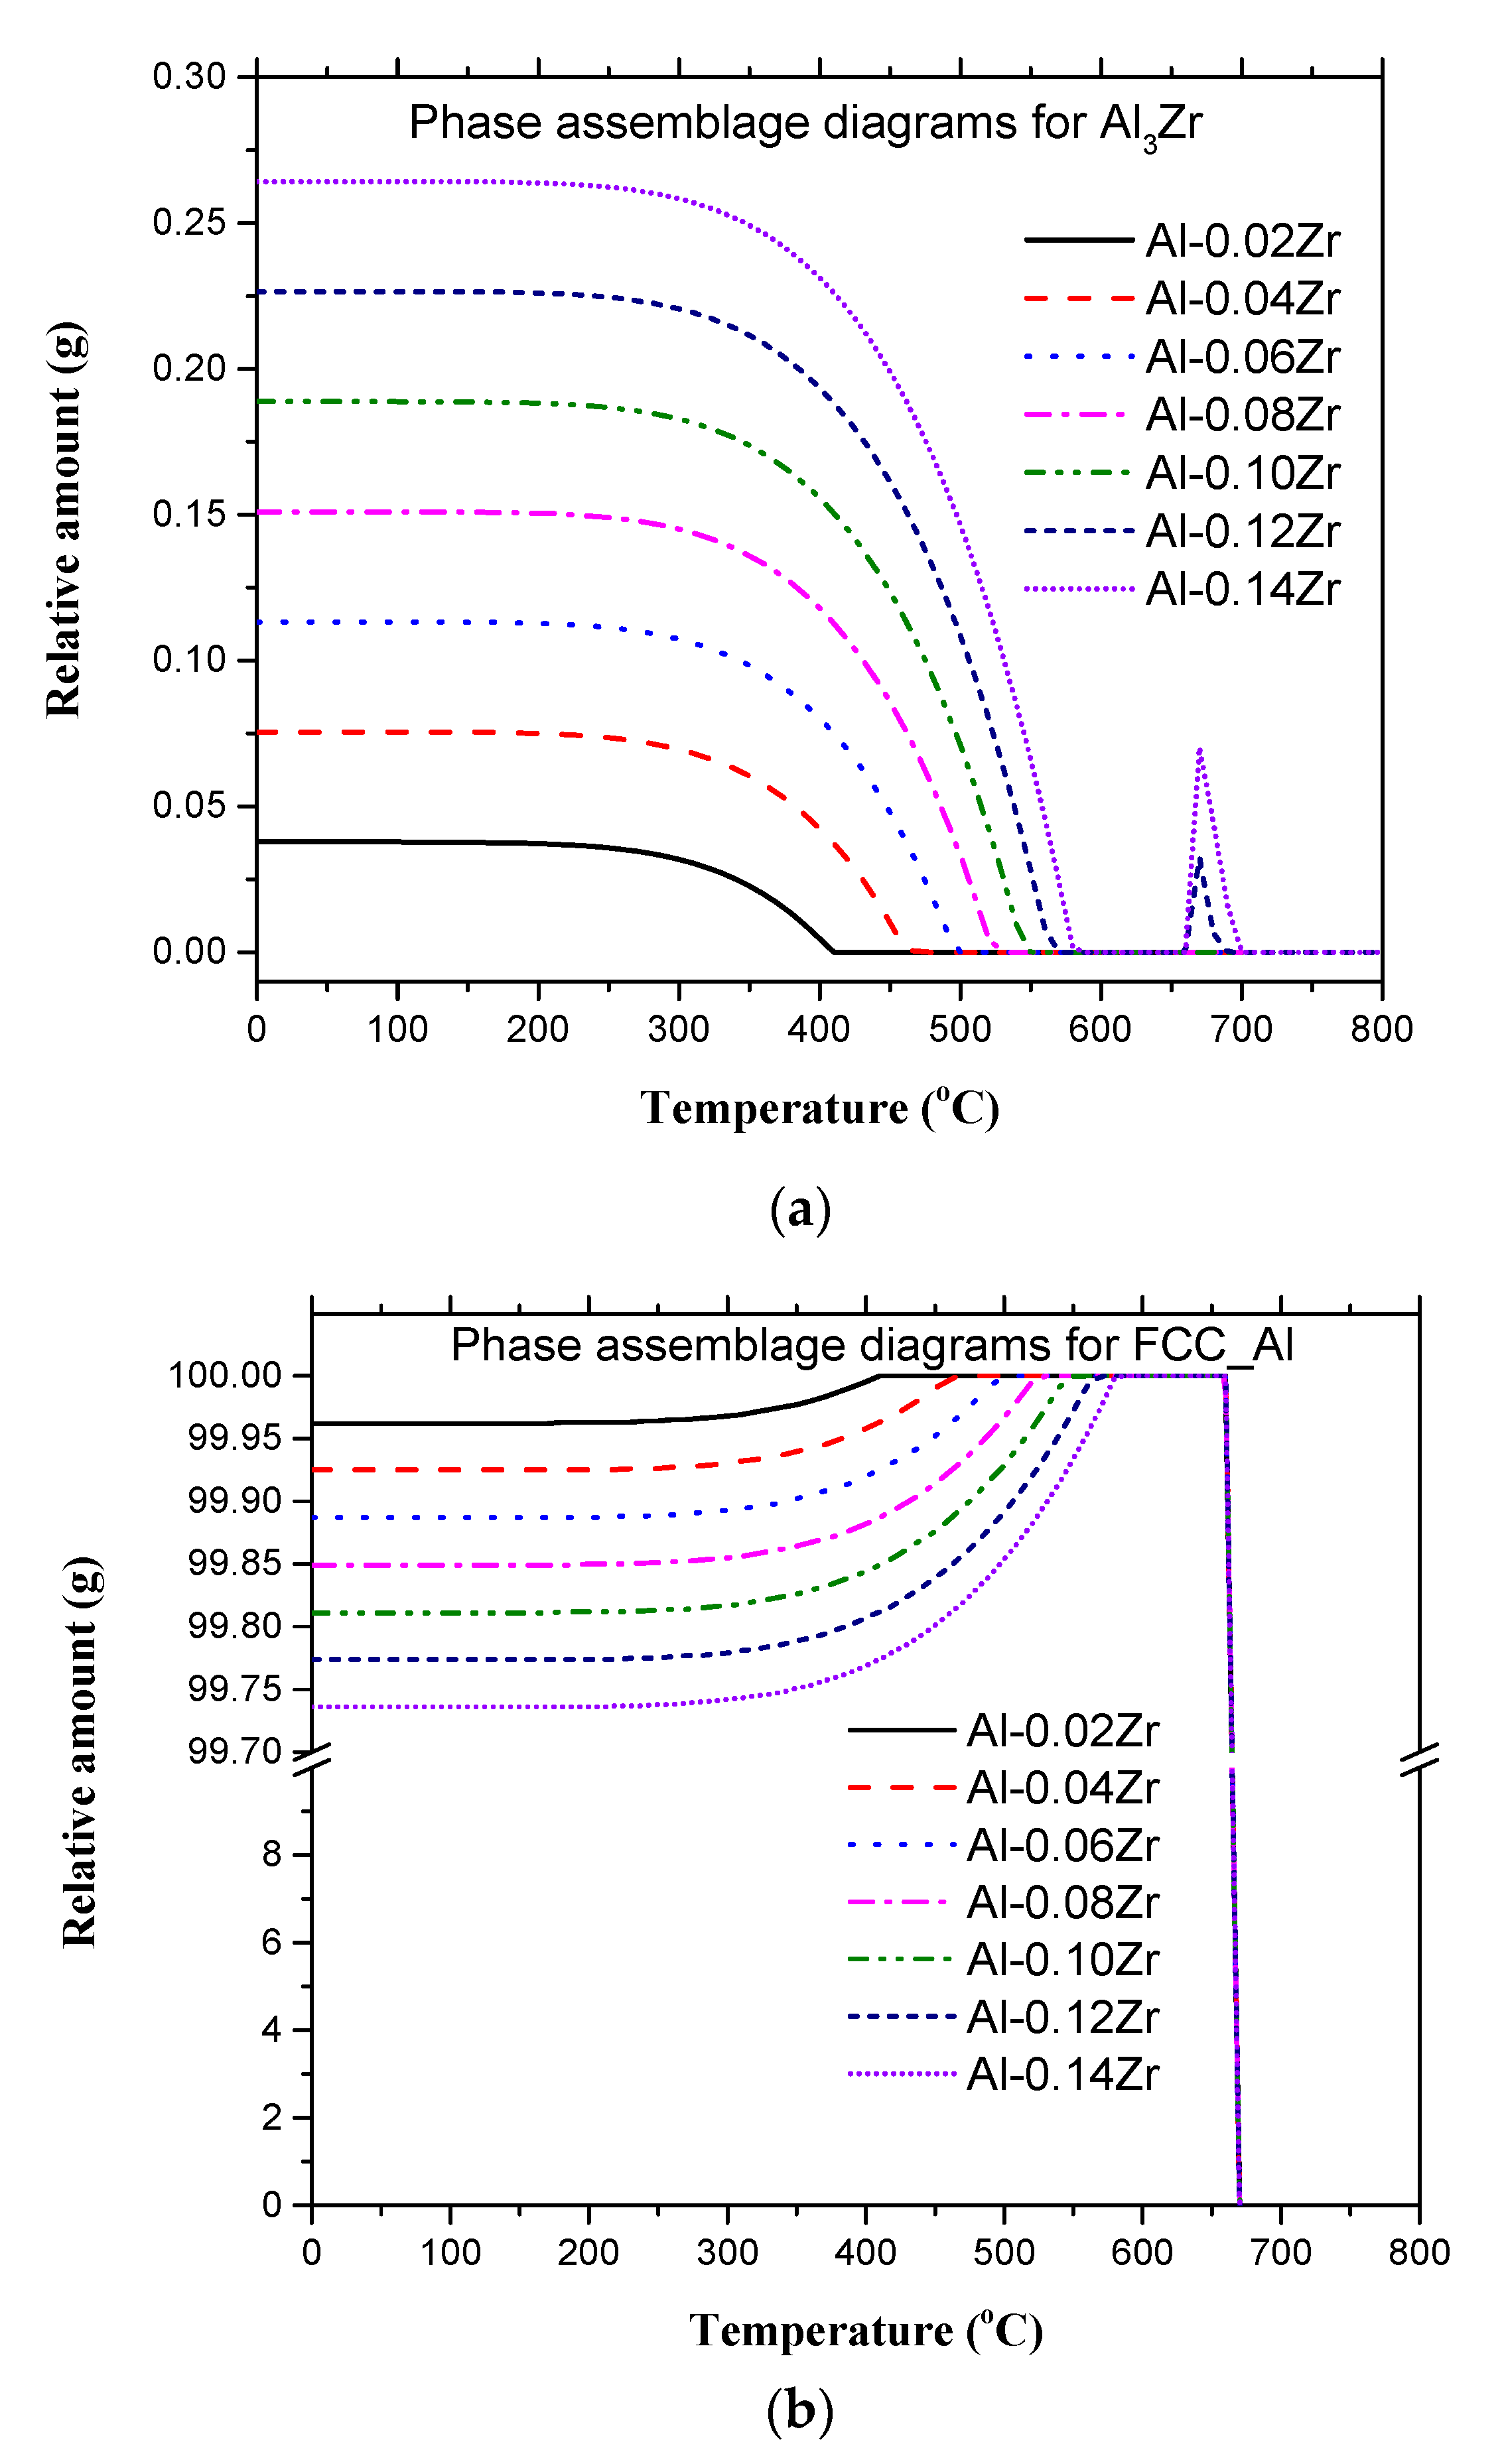
The FactSage thermochemical software and database [32] was also used to calculate the relative amounts of solid phases (in gram) through plotting the phase assemblage diagram for each microalloy composition as illustrated in Figure 5.
It is important to mention that the phase assemblage diagrams are also used to determine the phase formation and/or decomposition temperatures. For instance, FCC_Al decomposes at 410, 470, 500, 530, 550, 570 and 580 °C to form Al3Zr solid phase in Al-0.02Zr, Al-0.04Zr, Al-0.06Zr, Al-0.08Zr, Al-0.10Zr, Al-0.12Zr and Al-0.14Zr microalloys, respectively. The jumps in Al3Zr amounts appeared in Figure 5a, at 650–700 °C temperature range, correspond to Al-0.12Zr and Al-0.14Zr microalloys and represent the precipitation of Al3Zr phase from liquid in the Liquid + Al3Zr two-phase field. The amount dropped down to zero again, because both Al3Zr and the remaining liquid were consumed to form FCC_Al solid solution by the Liquid+Al3Zr ↔ FCC_Al peritectic reaction. The uniform dispersion of Al3Zr solid particles in the liquid explains the occurrence of fine equiaxed grains shown in Figure 2g,h.
3.2. Microhardness Analysis
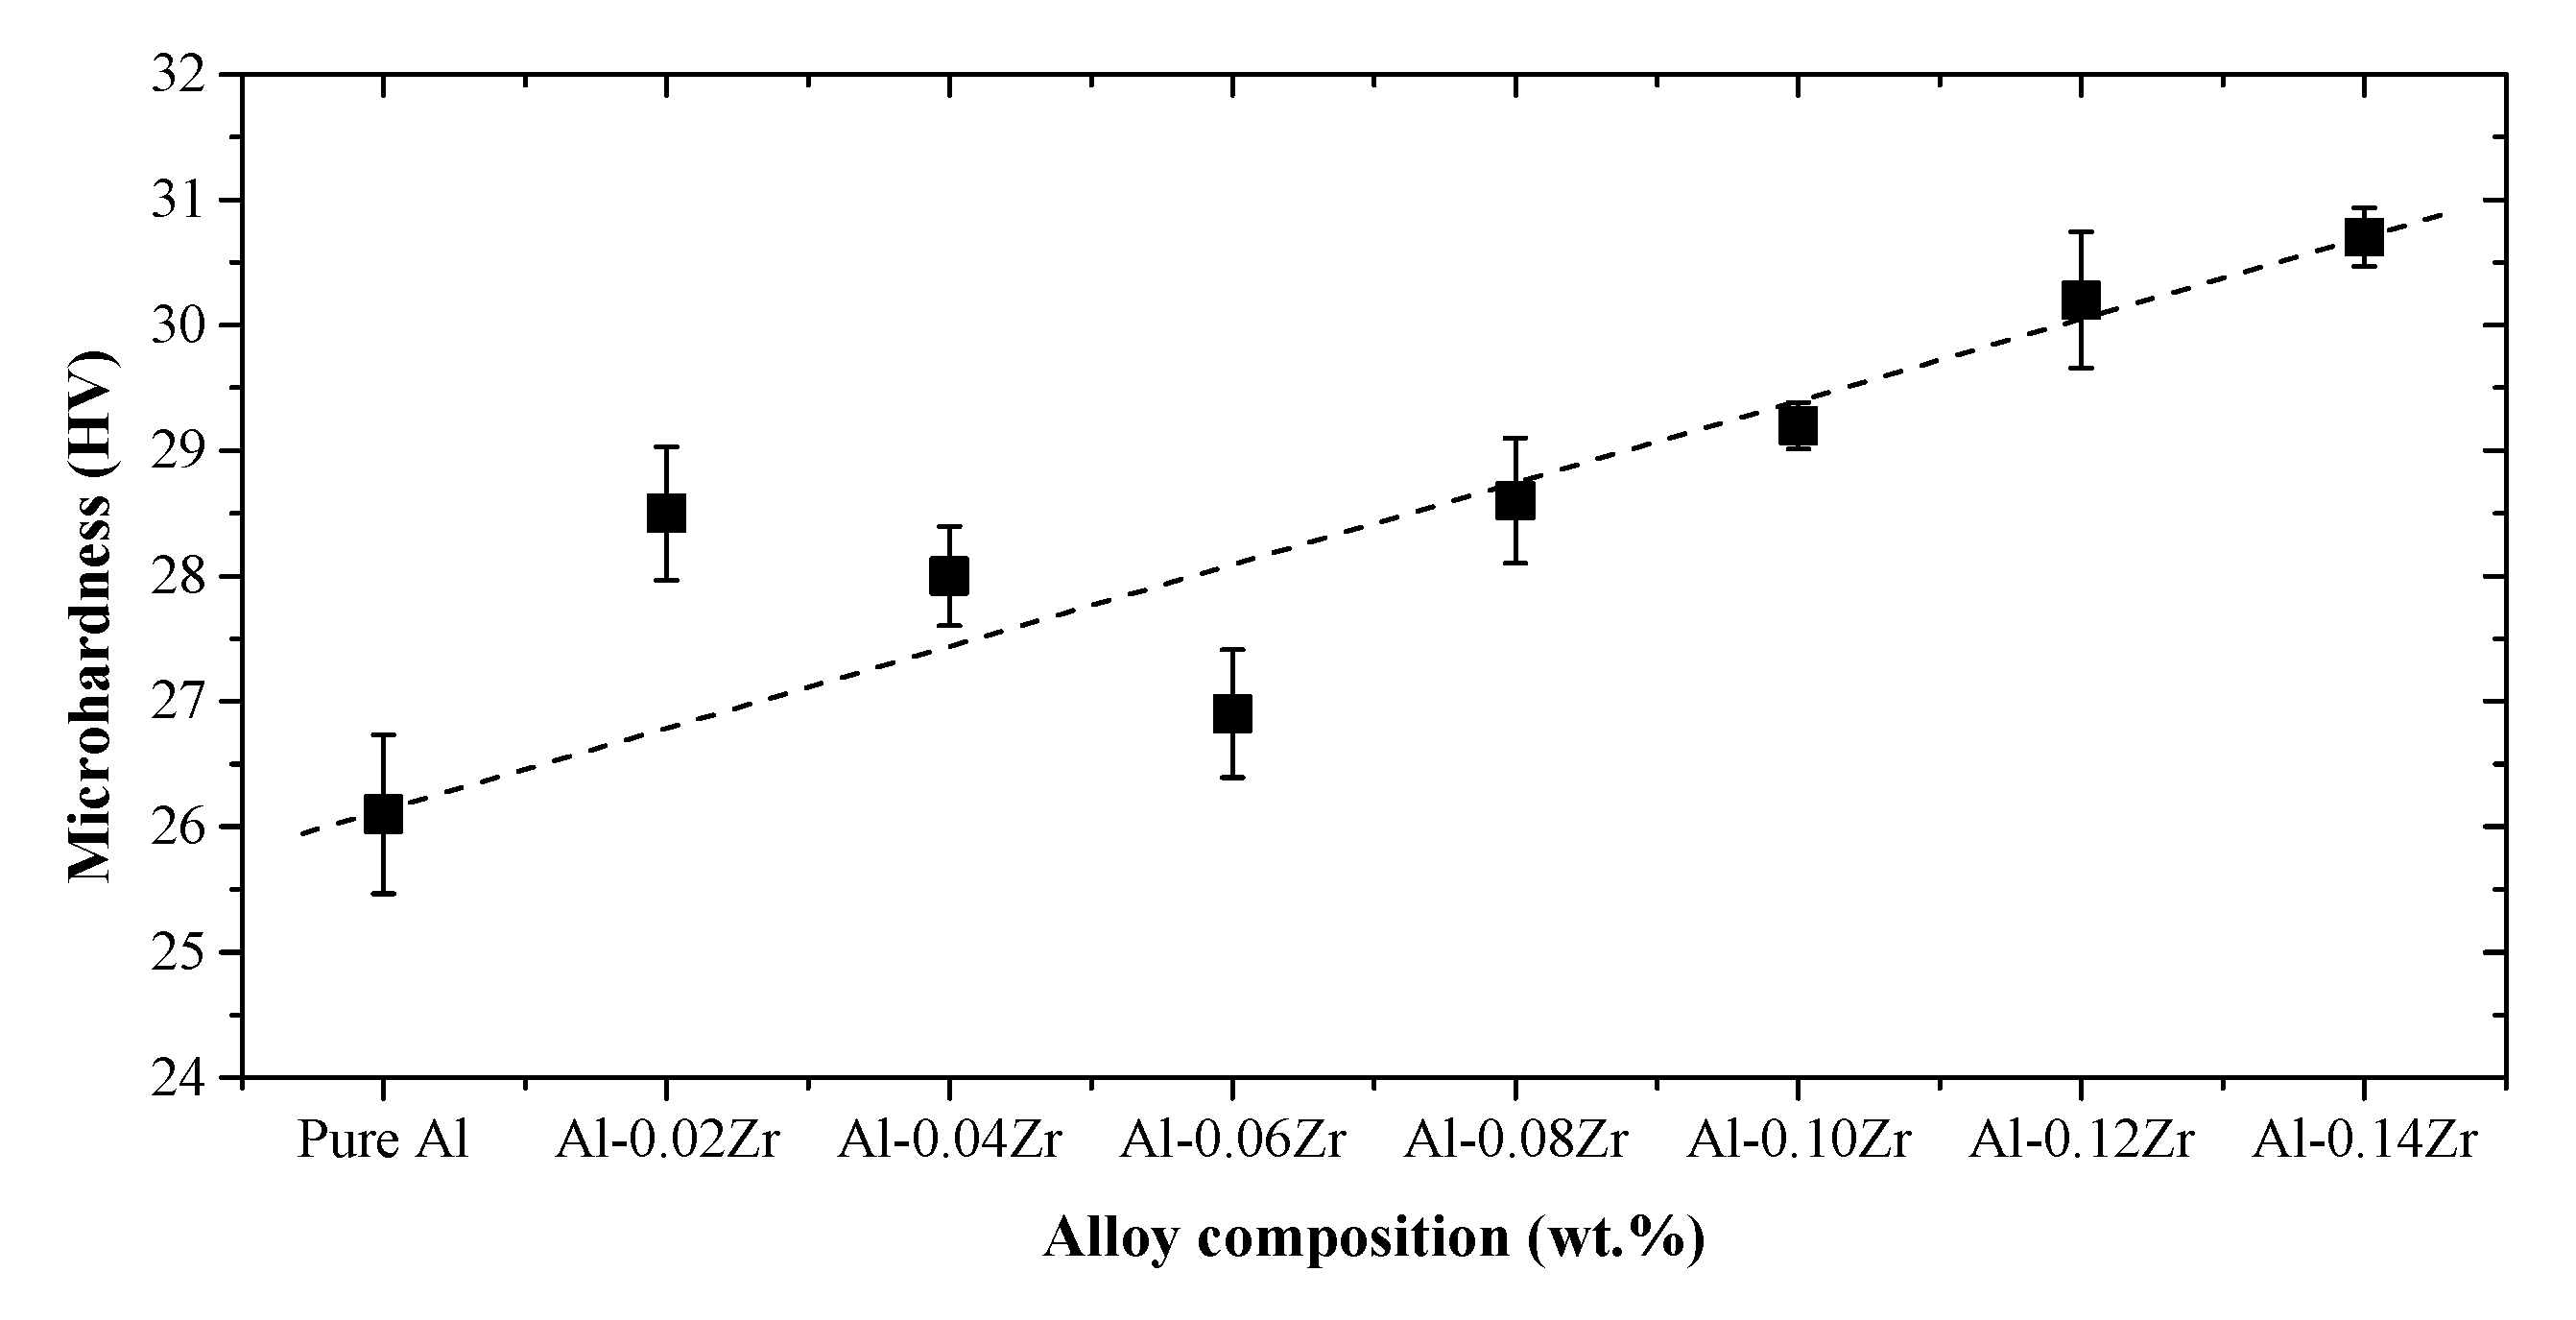
Figure 6 shows the average microhardness number for commercial purity Al and Al-Zr microalloys. The values varied from one composition to another, which clearly show an increasing trend with increased Zr concentration. It is remarkable that the microhardness numbers are inversely proportional to the grain size results, illustrated in Figure 4, where the hardness increases with decreasing the grain size. The average microhardness number obtained for pure Al was about 26.1 HV and increased up to 30.7 HV for Al-0.14Zr microalloy. In the work of Souza et al. [33], the microhardness number of both cast 0.22 and 0.32 wt.% Zr alloys was about 25.5 HV and increased up to 30 and 40 HV, respectively, after aging for 10 h. The alloys in the current work were slowly cooled in a brass die and thus aging was highly probable to occur.
The improved microhardness of Al-Zr microalloys stems from the formation of thermally stable second phase on the grain boundaries such as Al3Zr [34]. The chemical driving force for Al3Zr precipitation becomes higher for alloys with high Zr concentrations, because they have high solute contents as discussed in Section 3.1. The microhardness number may also increase due to the increased grain boundary areas in Al-Zr microalloys, which can limit the movement of dislocations in the refined samples [11,21].
3.3. Tensile Characteristics
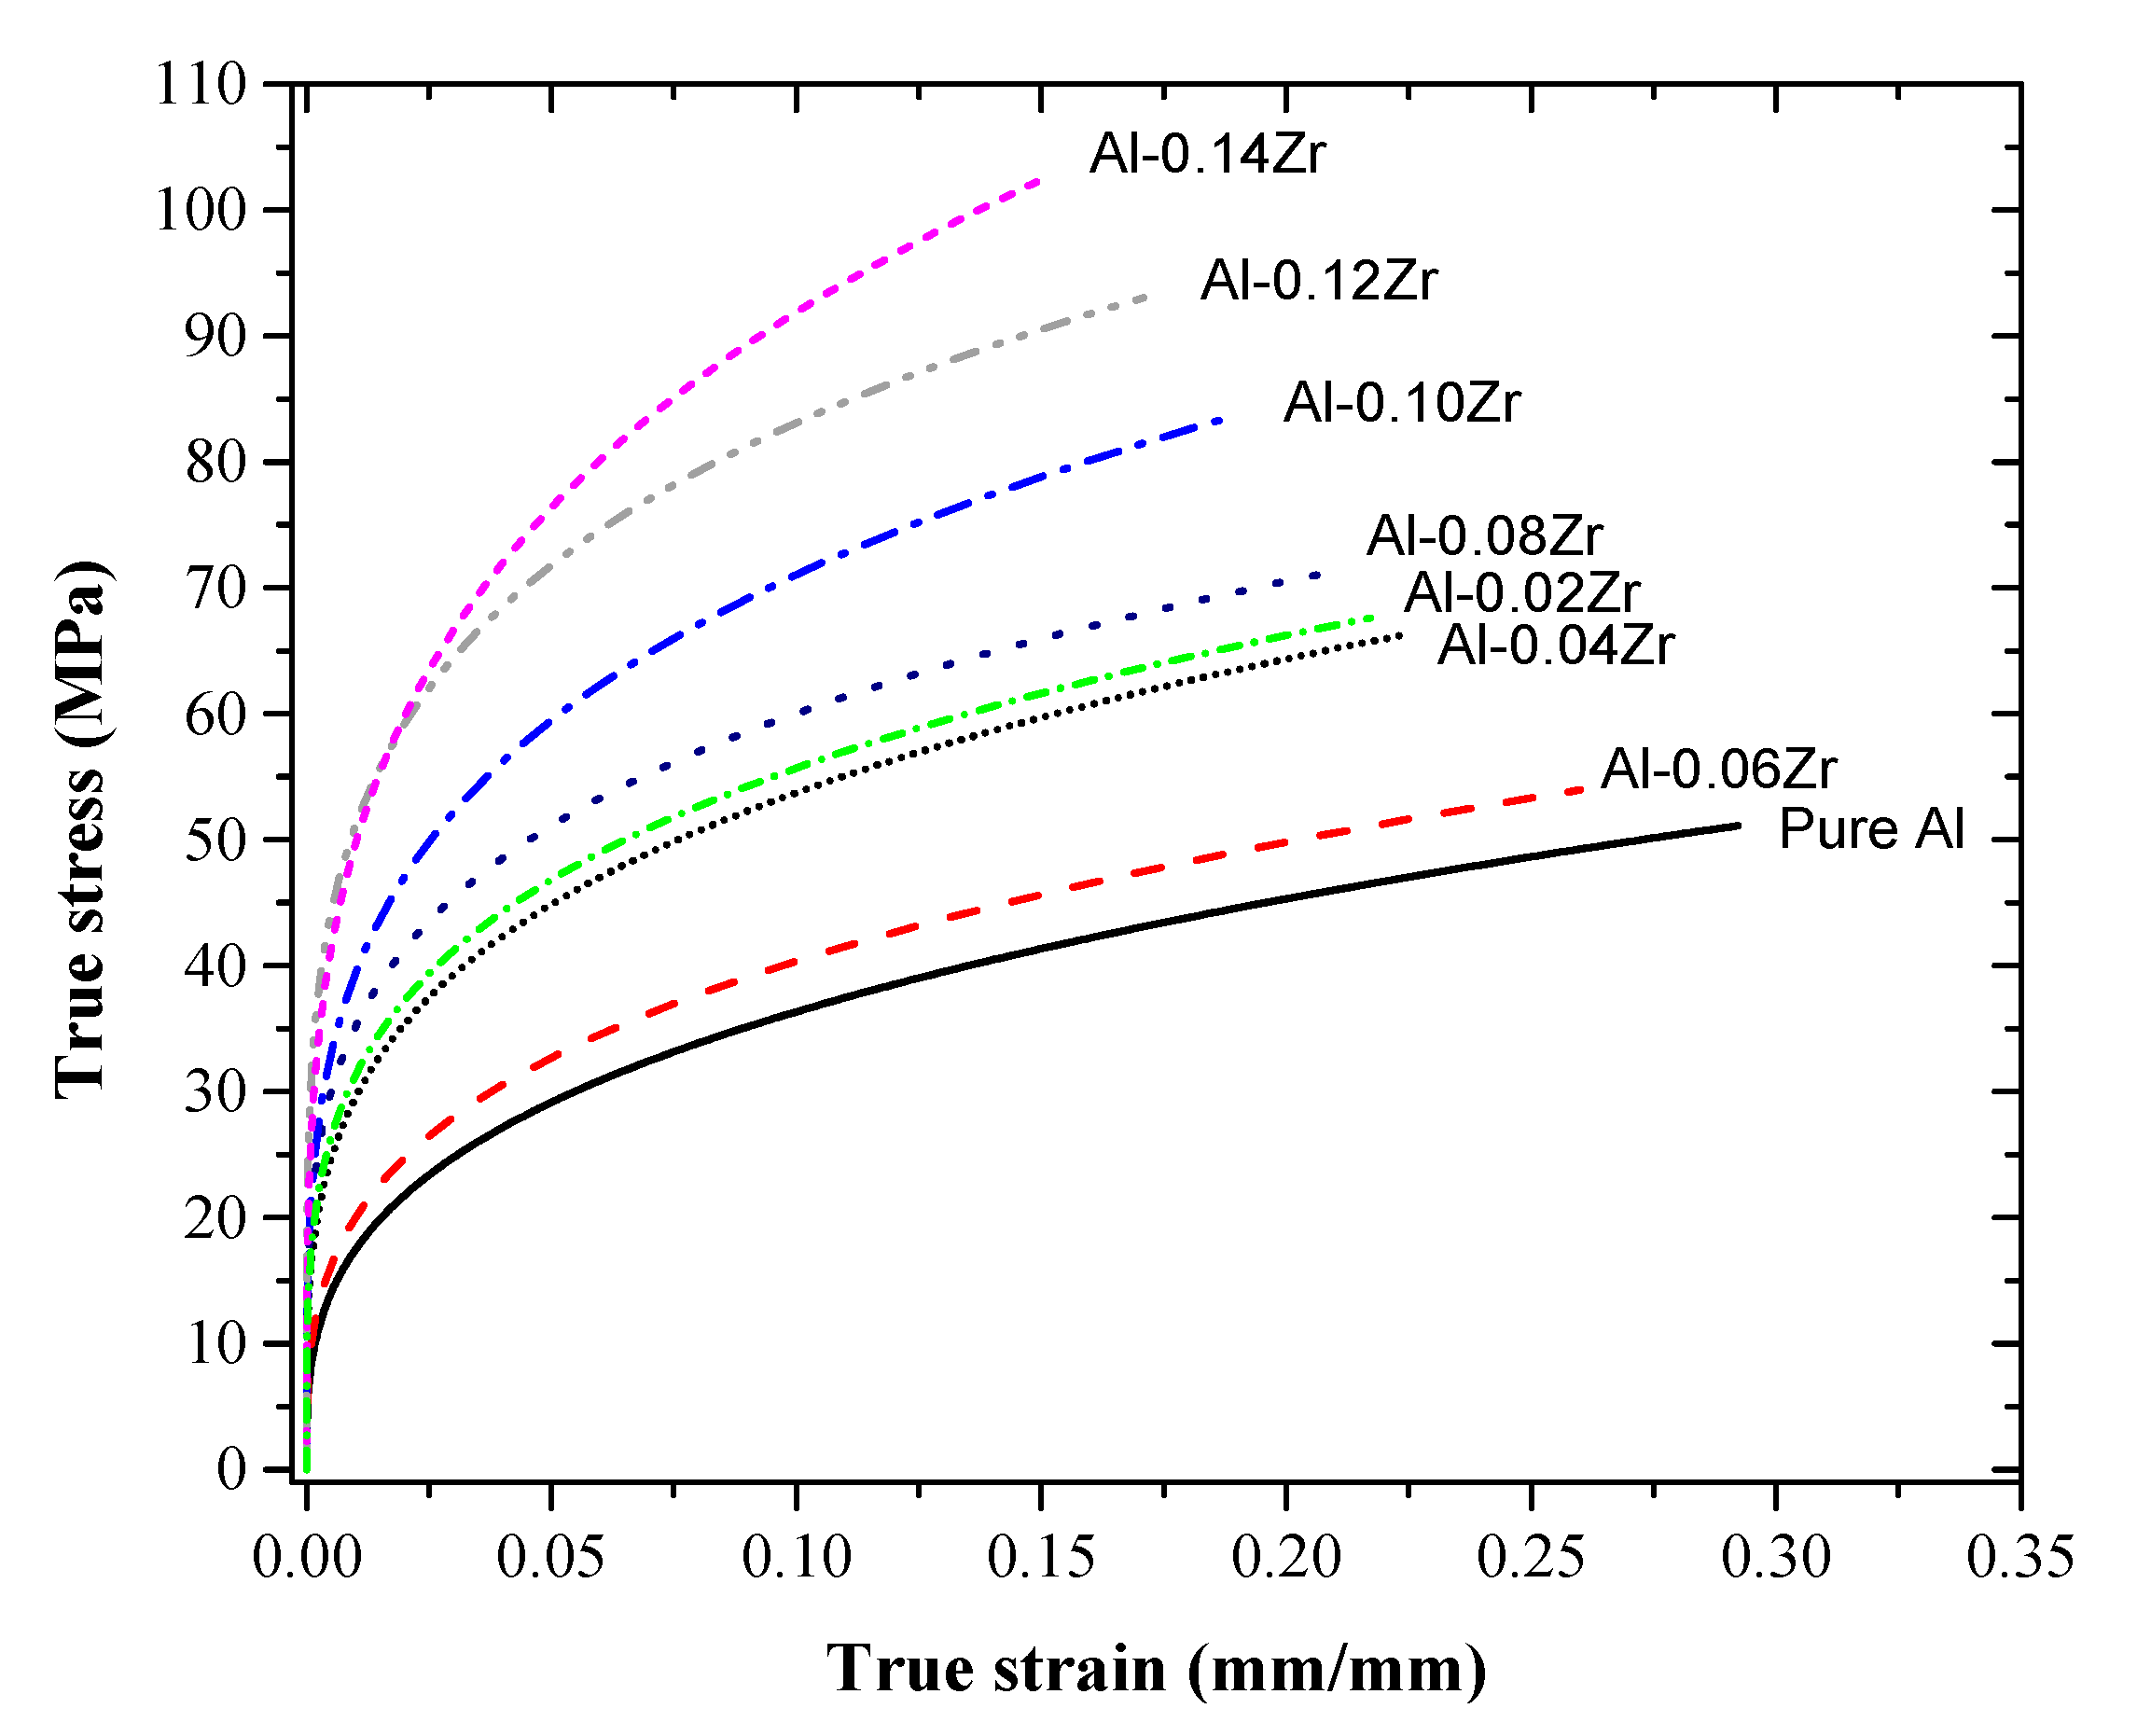
The mechanical behaviors of commercial purity aluminum and Al-Zr microalloys are presented by the calculated true stress-true strain curves in Figure 7. Accordingly, the proof stress at 0.2% strain and mechanical behavior parameters, i.e., strength coefficient (k) and strain hardening exponent (n), were derived from the tensile experiments for all examined specimens and summarized in Table 3. The error percentages in the tensile properties could be due to the structural defects in commercial purity Al or due to the inhomogeneous distribution of the fine particles in Al-Zr microalloys.
The proof stress of all Al-Zr microalloys increased from 19.67 to 48.18 MPa as compared to 16.87 MPa for commercial purity aluminum. The increased proof stress value is attributed to the presence of Zr in all microalloys. With reference to the phase assemblage diagrams (Figure 5), the amount of Al3Zr phase increases directly with the increase of Zr concentration in the microalloys, which has a notable effect on the mechanical properties. The formation of nanosized Al3Zr particles within the FCC_Al matrix plays a significant role in blocking the dislocations’ movement under mechanical loading [12]. Hence, the strength of Al-Zr microalloys increases with increased Zr concentration. Although Zr-0.06Zr microalloy showed higher proof stress value of 19.67 MPa as compared to 16.87 MPa for commercial purity aluminum, its value still lower than that of Al-0.02Zr and Al-0.04Zr microalloys, which is about 29.32 and 28.27 MPa, respectively. The improved mechanical performance of Al-0.02Zr and Al-0.04Zr microalloys could be attributed to the smaller average grain sizes of about 88.8 and 112.6 μm, respectively, as compared to 148.4 μm for Al-0.06Zr microalloy.
The contribution of grain size to the improved mechanical properties can be expressed by Hall-Petch relationship [6,7]:
where, σy is the yield stress, σo is the material constant for the dislocation movement at the starting stress, ky is the material strengthening coefficient and d is the average grain diameter. In accordance to Hall-Petch relationship, the addition of Zr improved the mechanical properties of commercial purity Al as shown in Figure 7.
The strain hardening exponent (n) and strength coefficient (k) were calculated from ln σ vs. ln ε curves for all examined specimens. It is important to mention that ln σ vs. ln ε curves for all specimens were plotted in the plastic deformation region to fulfill Hollomon’s equation, which is a power law relating the true strain to the true stress [11] as follows:
where, σT is the true stress, k is the strength coefficient, εT is the true strain and n is the strain hardening exponent. It can be noticed from Table 3 that both n and k numbers are in compatible trends to the yield strength values. The increased strain hardening exponent values for all microalloys could be attributed to the decreased average grain size, which dramatically influenced the mechanical behavior of the Al-Zr microalloys. The value of n indicates the capability to uniformly distribute the deformation. In other words, n evaluates the strain- hardening capability of the material [35].
3.4. Fractography Analysis of Tensile Specimens
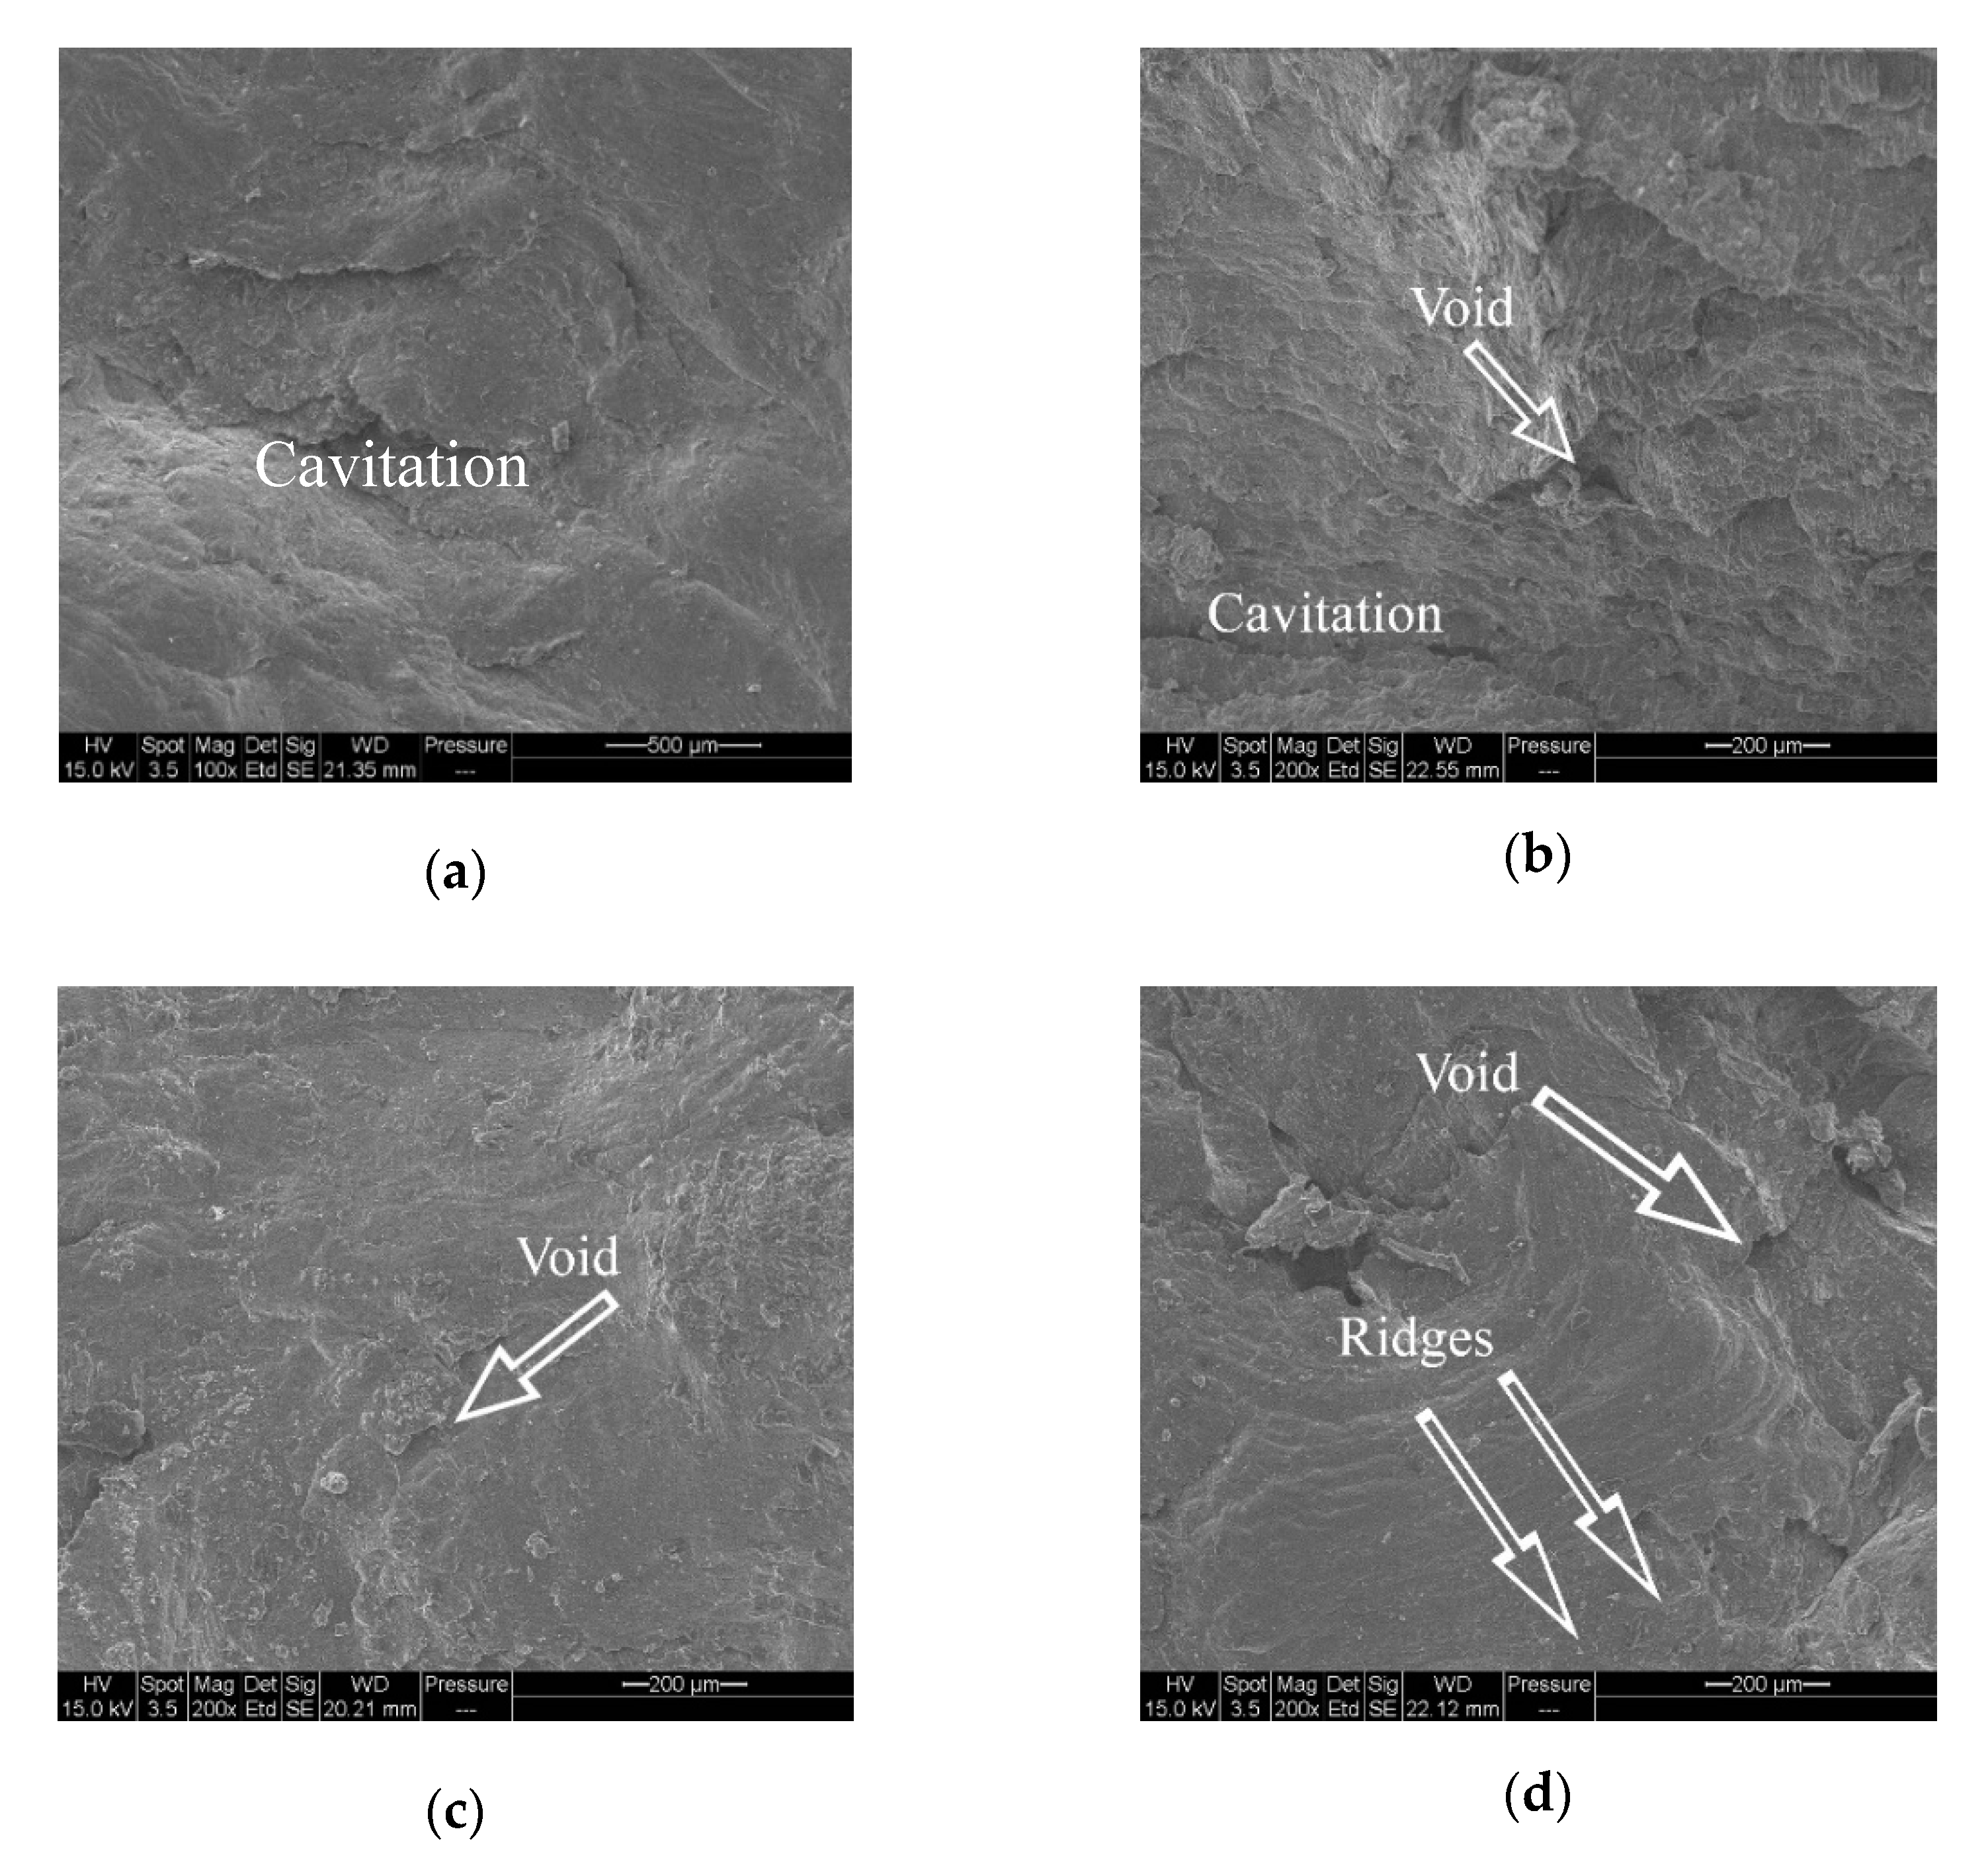
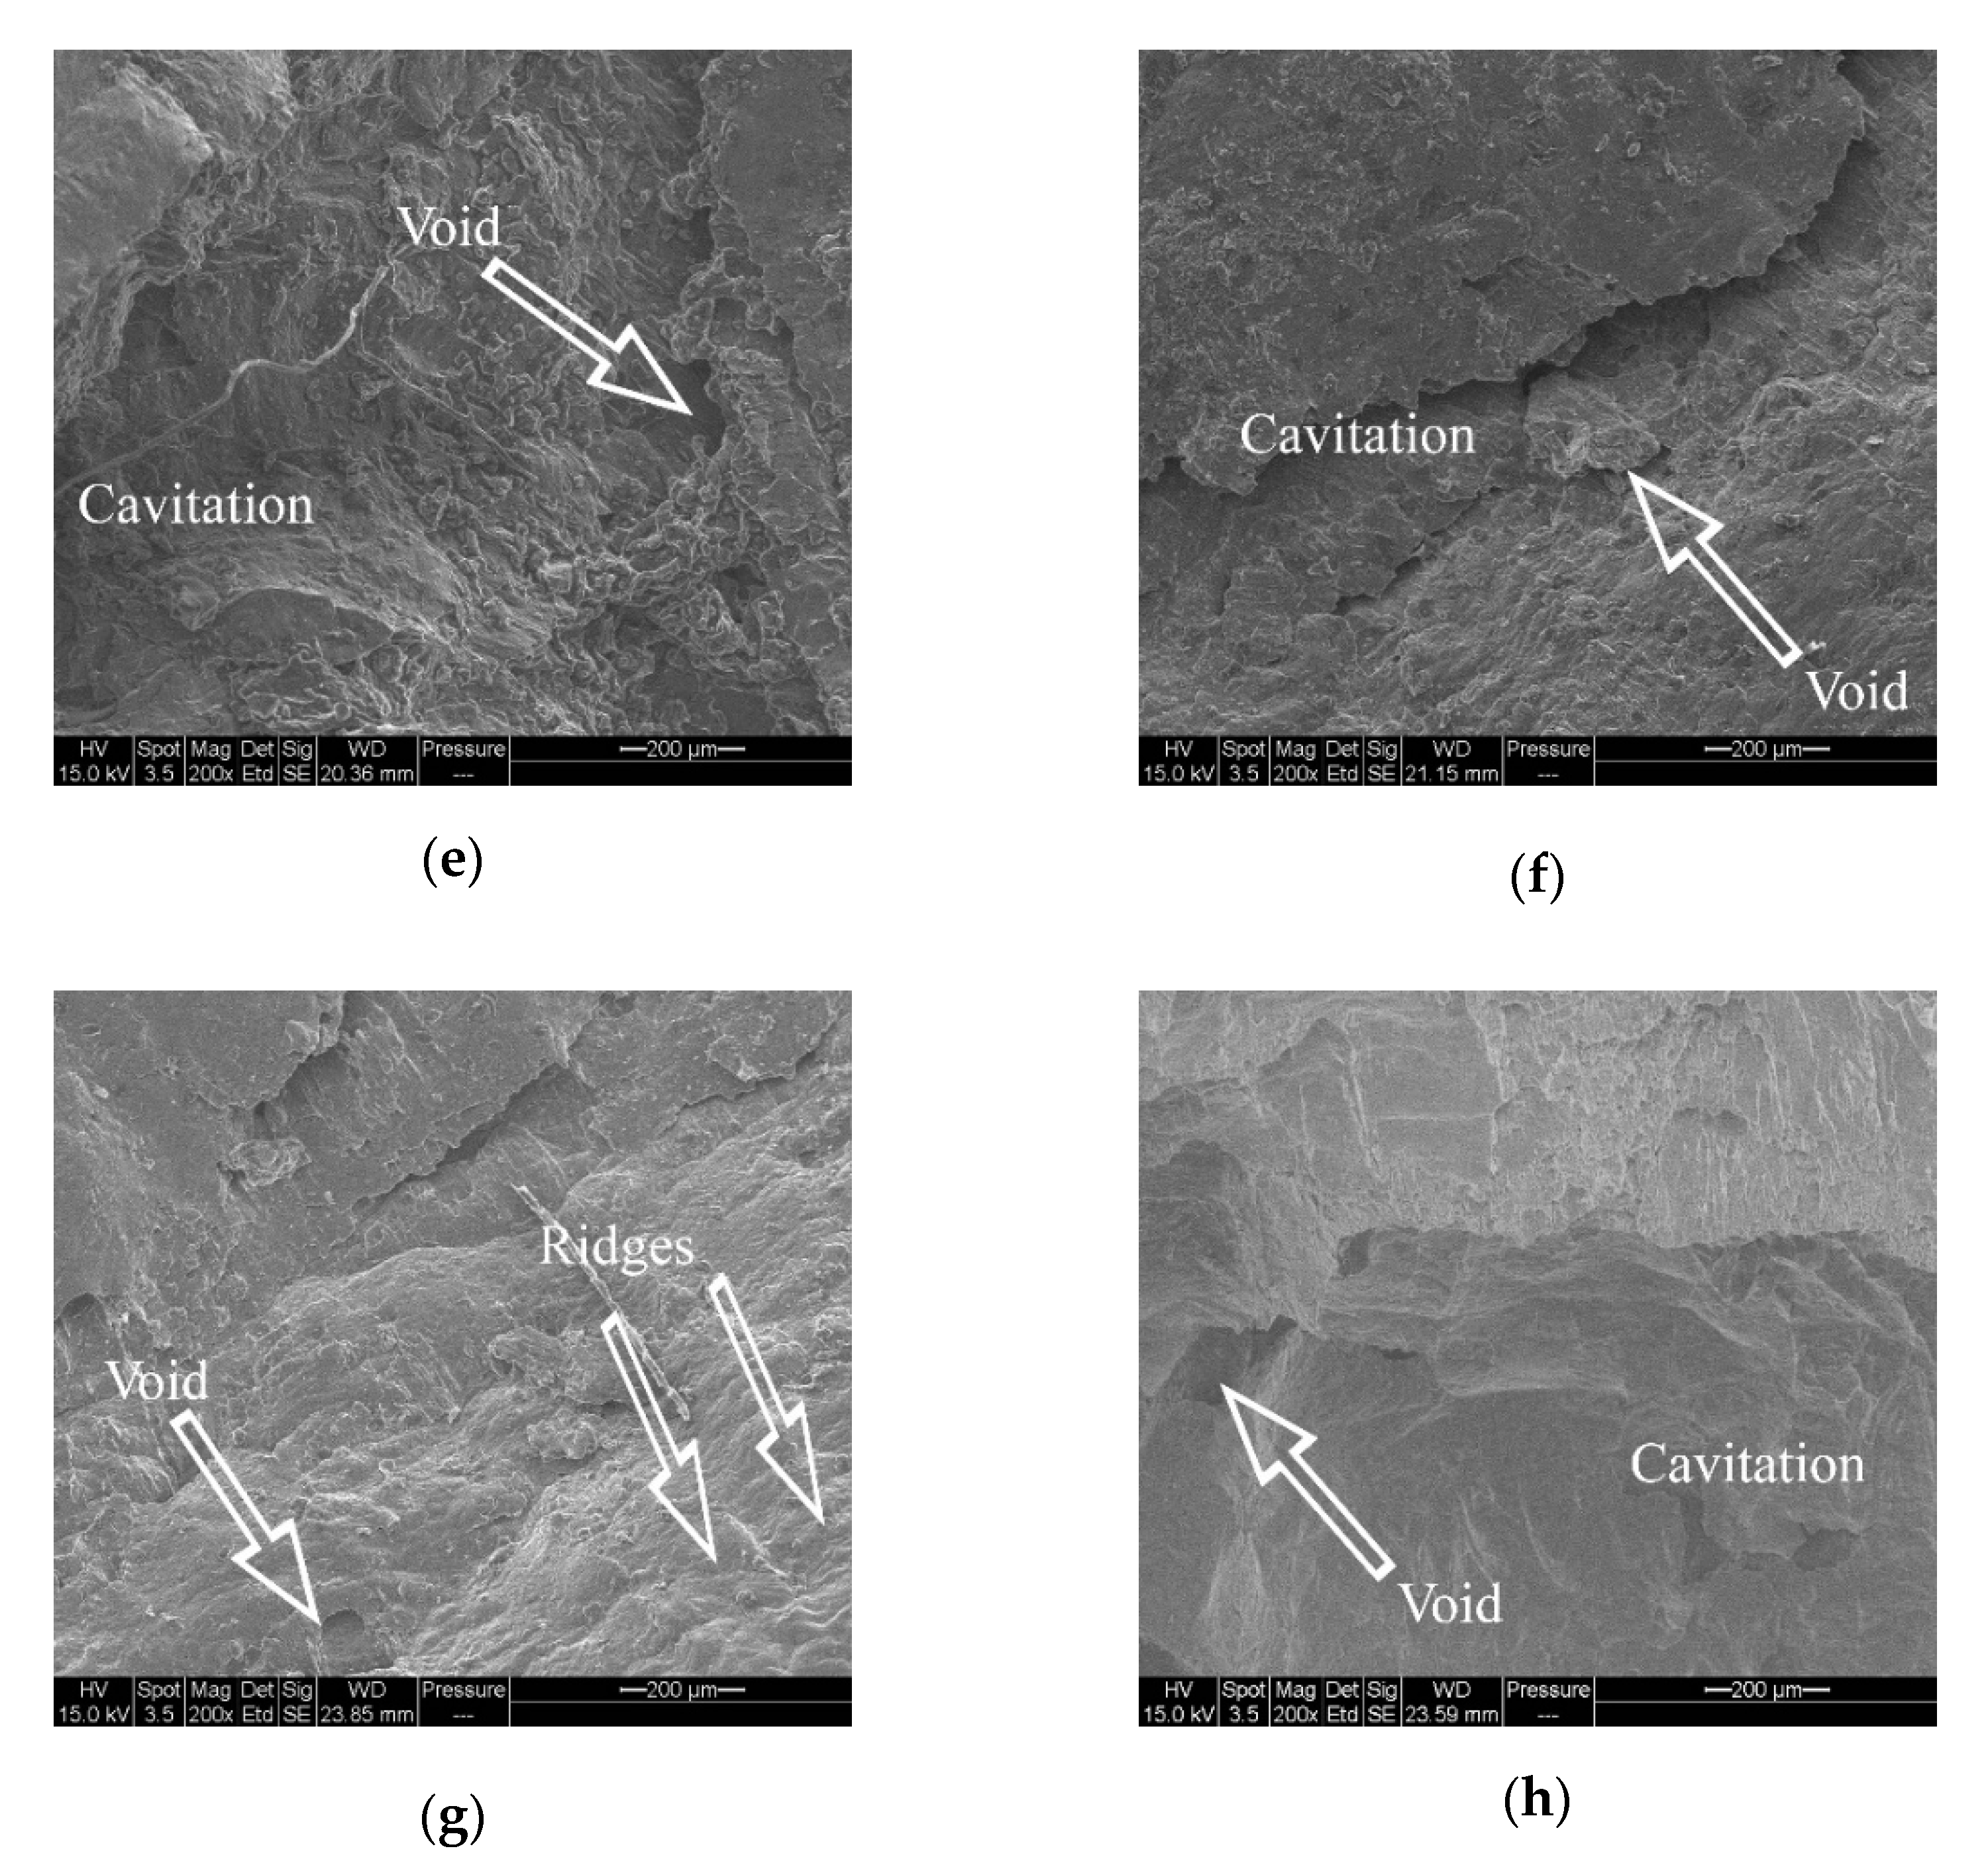
The fractured surfaces of tensile specimens and their features were observed using SEM as shown in Figure 8. The basic fracture mode in all specimens is ductile, because Al has an FCC structure and remains ductile even at low temperatures. The ductile fracture took place in transgranular manner, which can be recognized by the flat surfaces of the specimen halves after fracture. This type of fracture occurs by void coalescence of a polycrystalline material during tension experiment [36]. The presence of ridges (stepped structure) are evident of crack propagation under progressive tensile loading and indicates the material resistance to failure upon loading. The hollow points (voids) are usually form at the locations of the second phase particles, i.e., Al3Zr, in Al-Zr microalloys specifically. The crack-like voids are formed by the grain-boundary cavitation, by which a full grain is detached from the observed surface along its boundaries during the tensile test.
3.5. Impact Fracture Analysis
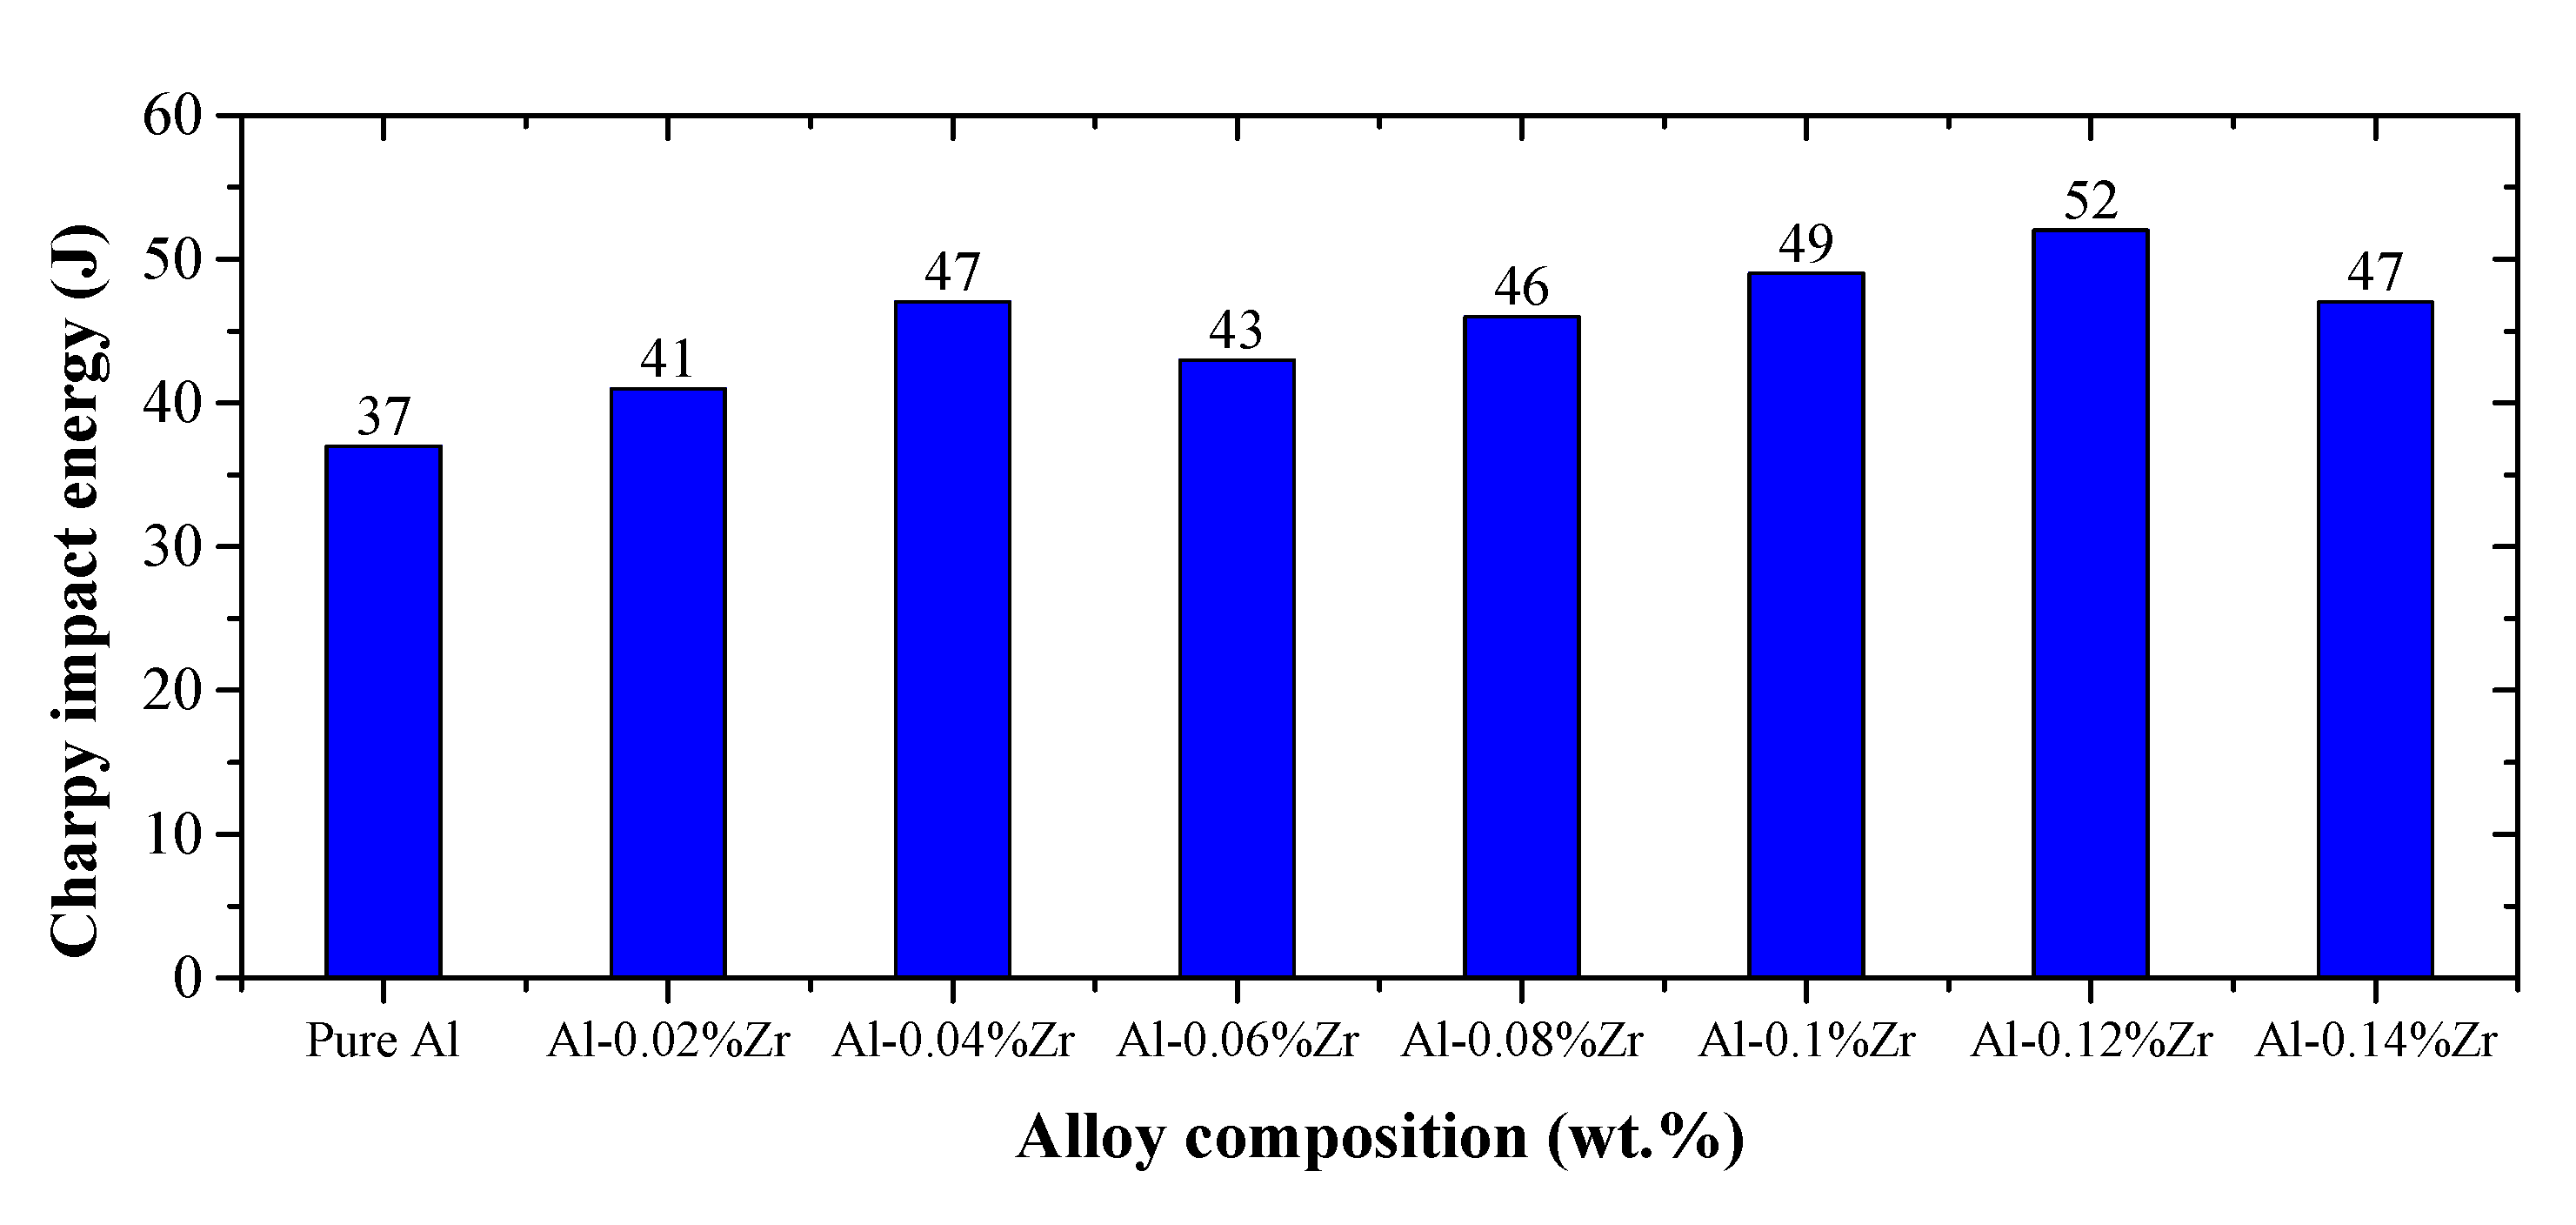
The fracture toughness of a material is generally represented by its Charpy impact energy, which is a high strain-rate test (1 × 10⁻³—1 × 10⁻⁴ s−1) that determines the amount of energy absorbed by a material during fracture [26]. The bar chart in Figure 9 is the Charpy impact energy plotted for commercial purity Al and Al-Zr microalloys. The measured impact energy increased steadily from 36.6 J for commercial purity Al to 41.2, 47.09, 43.19, 46.11, 49.05, 51.99 and 47.07 J for Al-Zr microalloys containing Zr concentrations from 0.02 wt.% to 0.14 wt.% (with 0.02 wt.% Zr step), respectively. The increase in the impact energy was not significant and this could be due to alloying of commercial purity Al with minute Zr additions. It is highly recommended that the improvement in the fracture energy was due to the formation of Al3Zr particles in Al-Zr microalloys, which also played a significant role in initiating new nucleation sites to refine the coarse Al grains.
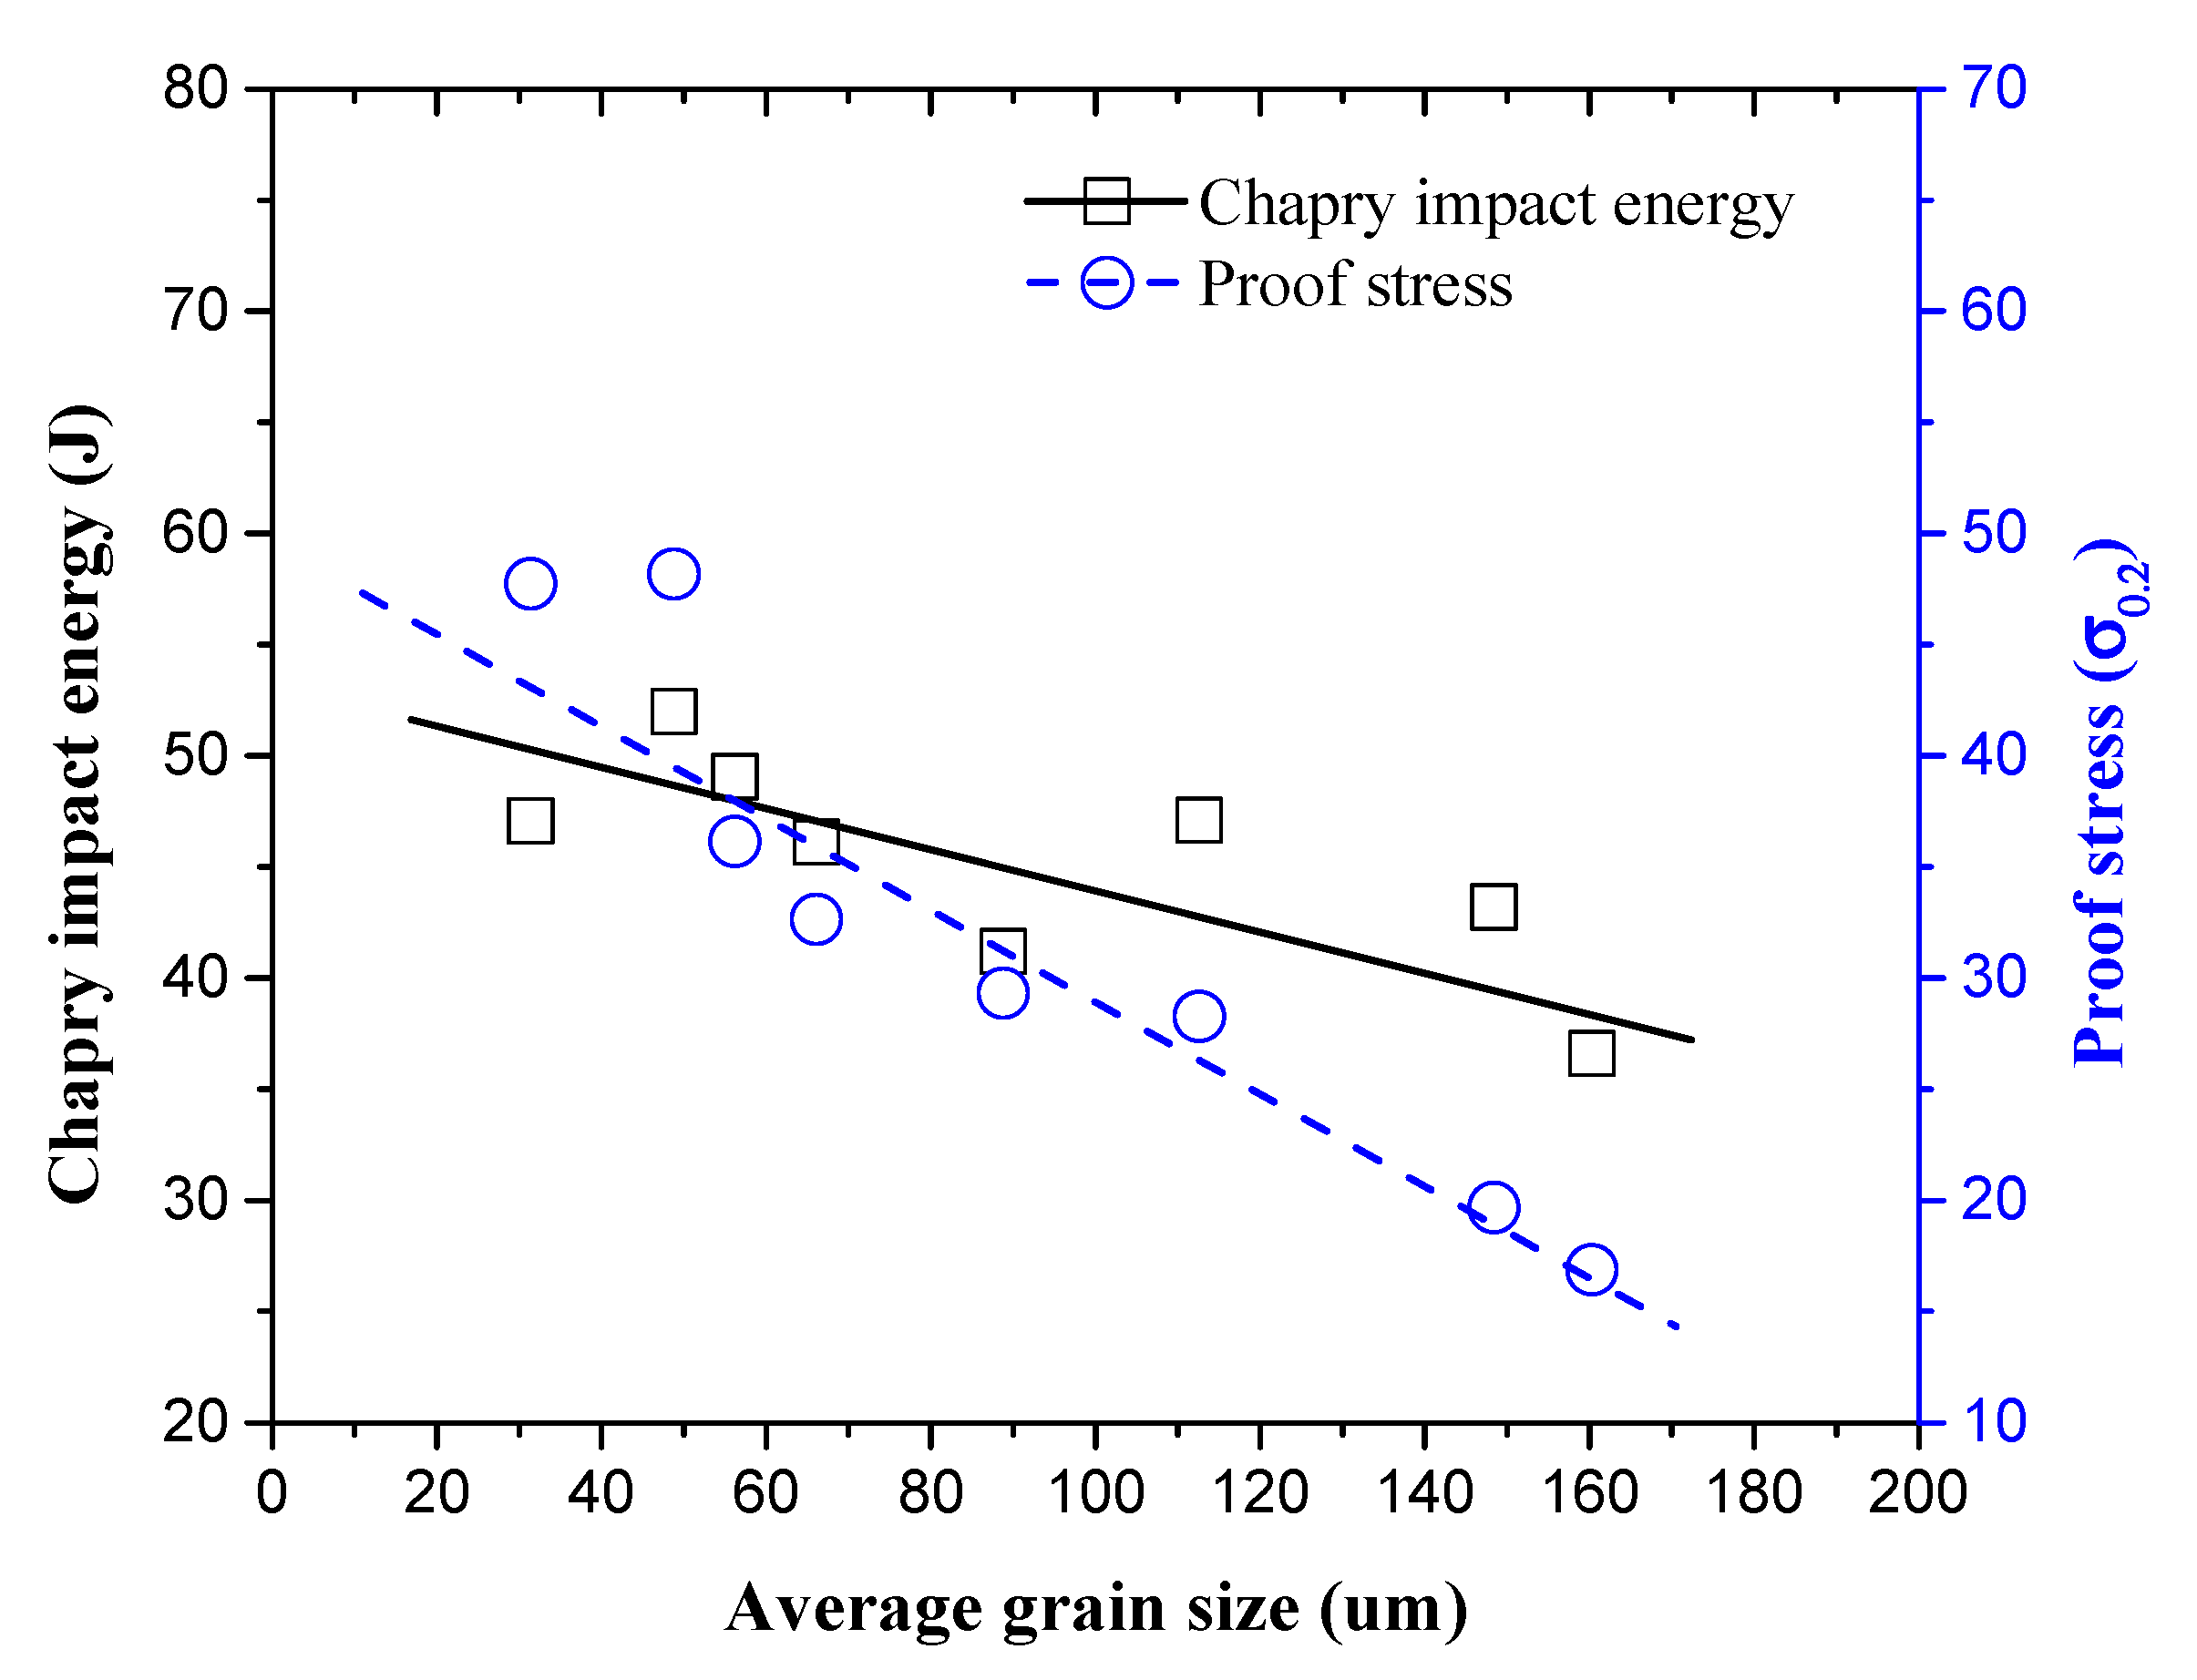
Miyahara et al. [37] reported that the validated impact energy was independent of the grain size in alumina, whereas, Tarpani and Spinelli [38] plotted a direct relationship between Charpy impact energy and equivalent grain size, by which the fracture energy increases with increasing grain size. The relationship [38] was extracted indirectly from the effect of annealing temperature on the equivalent grain size, which in turn improved the fracture toughness of the material. In the current work, the purpose of grain refinement of commercial purity Al was to improve its mechanical properties and thus the specimens were not heat treated. The grains of commercial purity Al were refined by adding Zr inclusions, as discussed earlier in this work. Figure 10 shows an inverse relationship between the Charpy impact energy and average grain size for the examined specimens. In this case, the impact energy is inversely proportional to the grain boundary area that provide prominent resistance to impact fracture due to the increased number of dislocations.
In fact, the fracture energy is lowered if yield strength heightens for the same material [39]. However, in the current experiments, the chemical composition of the reference material is different than that of the microalloys. Thus, the Al-Zr microalloys lead to both high yield strength and high fracture energy as could be concluded from Figure 10.
4. Conclusions
In this work, the mechanical properties of commercial purity aluminum modified by Zr micro-additives have been investigated. The experiments showed that addition of Zr in the 0.02–0.14 wt.% composition range has reduced the grain size of commercial purity aluminum from 160.3 μm down to 31.4 μm for Al-0.14Zr microalloy, due to the formation of Al3Zr particles which served as nucleation sites for the growth of new grains. The relative amount of Al3Zr was calculated at room temperature as 0.0377–0.2647 wt.% for Al-Zr microalloys using FactSage thermochemical software and databases. As a result of this reduction, the microhardness number was improved due to the improved solute content with increased concentrations of Zr. The inverse relationship between the average grain size and Charpy impact energy indicated that the resistance to fracture was due to the increased grain boundary areas in the microalloys. Both Charpy impact energy and proof stress were improved as a result of increased number of dislocations in the fine-structured specimens. The presence of voids, fracture ridges and cavitation on the fractured surfaces were evidences that failure mode was ductile fracture in all examined specimens. Furthermore, the ductile fracture took place in a transgranular manner as could be noticed from the flat nature of the fractured surfaces.
Author Contributions
Conceptualization, A.K.; Formal analysis, A.M., A.A. and A.K.; Investigation, A.M. and A.A.; Methodology, A.M. and A.A.; Resources, A.M. and A.K.; Software, A.M.; Supervision, A.K.; Validation, A.M. and A.K.; Visualization, A.M.; Writing–original draft, A.M. and W.A.; Writing–review & editing, A.M. All authors have read and agreed to the published version of the manuscript.
Funding
This research received no external funding.
Data Availability Statement
Data is contained within the article.
Acknowledgments
The authors thankfully acknowledge the financial support provided by the University of Jordan and thanks are due to Tafila Technical University for granting necessary permissions to experimental facilities.
Conflicts of Interest
The authors declare no conflict of interest.
References
- Errandonea, D.; Burakovsky, L.; Preston, D.L.; MacLeod, S.G.; Santamaría-Perez, D.; Chen, S.; Cynn, H.; Simak, S.I.; McMahon, M.I.; Proctor, J.E.; et al. Experimental and theoretical confirmation of an orthorhombic phase transition in niobium at high pressure and temperature. Commun. Mater. 2020, 1, 60. [Google Scholar] [CrossRef]
- Straumal, B.; Korneva, A.; Kilmametov, A.; Lityńska-Dobrzyńska, L.; Gornakova, A.; Chulist, R.; Karpov, M.; Zięba, P. Structural and Mechanical Properties of Ti–Co Alloys Treated by High Pressure Torsion. Materials 2019, 12, 426. [Google Scholar] [CrossRef] [PubMed] [Green Version]
- Smith, D.; Joris, O.P.J.; Sankaran, A.; Weekes, H.E.; Bull, D.J.; Prior, T.J.; Dye, D.; Errandonea, D.; Proctor, J.E. On the high-pressure phase stability and elastic properties of β -titanium alloys. J. Phys. Condens. Matter 2017, 29, 155401. [Google Scholar] [CrossRef] [PubMed]
- Dorward, R.C.; Pritchett, T.R. Advanced aluminium alloys for aircraft and aerospace applications. Mater. Des. 1988, 9, 63–69. [Google Scholar] [CrossRef]
- Li, H.; Li, D.; Zhu, Z.; Chen, B.; Chen, X.; Yang, C.; Zhang, H.; Kang, W. Grain refinement mechanism of as-cast aluminum by hafnium. Trans. Nonferrous Met. Soc. China 2016, 26, 3059–3069. [Google Scholar] [CrossRef]
- Hall, E.O. The Deformation and Ageing of Mild Steel: III Discussion of Results. Proc. Phys. Soc. Sect. B 1951, 64, 747–753. [Google Scholar] [CrossRef]
- Petch, N.J. The cleavage strength of polycrystal. J. Iron Steel Inst. 1953, 174, 25–28. [Google Scholar]
- Zhang, Y.; Ma, N.; Yi, H.; Li, S.; Wang, H. Effect of Fe on grain refinement of commercial purity aluminum. Mater. Des. 2006, 27, 794–798. [Google Scholar] [CrossRef]
- Mohd Syukry, Z.; Ahmad Badri, I. Effect of Aging Time to the Commercial Aluminum Alloy Modified with Zirconium Addition. Mater. Sci. Forum 2015, 819, 50–56. [Google Scholar] [CrossRef]
- Zaid, A.I.O.; Mostafa, A.O. Effect of hafnium addition on wear resistance of zinc-aluminum 5 alloy: A three-dimensional presentation. Adv. Mater. Lett. 2017, 8, 910–915. [Google Scholar] [CrossRef]
- Mostafa, A.O. Mechanical Properties and Wear Behavior of Aluminum Grain Refined by Ti and Ti+B. Int. J. Surf. Eng. Interdiscip. Mater. Sci. 2019, 7, 1–19. [Google Scholar] [CrossRef] [Green Version]
- Gao, Z.; Li, H.; Lai, Y.; Ou, Y.; Li, D. Effects of minor Zr and Er on microstructure and mechanical properties of pure aluminum. Mater. Sci. Eng. A 2013, 580, 92–98. [Google Scholar] [CrossRef]
- Toschi, S.; Balducci, E.; Ceschini, L.; Mørtsell, E.; Morri, A.; Di Sabatino, M. Effect of Zr Addition on Overaging and Tensile Behavior of 2618 Aluminum Alloy. Metals 2019, 9, 130. [Google Scholar] [CrossRef] [Green Version]
- Wang, F.; Qiu, D.; Liu, Z.-L.; Taylor, J.A.; Easton, M.A.; Zhang, M.-X. The grain refinement mechanism of cast aluminium by zirconium. Acta Mater. 2013, 61, 5636–5645. [Google Scholar] [CrossRef]
- Crossley, F.A.; Mondolfo, L.F. Mechanism of Grain Refinement in Aluminum Alloys. JOM 1951, 3, 1143–1148. [Google Scholar] [CrossRef]
- Murray, J.; Peruzzi, A.; Abriata, J.P. The Al-Zr (aluminum-zirconium) system. J. Phase Equilib. 1992, 13, 277–291. [Google Scholar] [CrossRef]
- Wang, T.; Jin, Z.; Zhao, J.-C. Thermodynamic Assessment of the Al-Zr Binary System. J. Phase Equilib. 2001, 22, 544–551. [Google Scholar] [CrossRef]
- Wang, F.; Eskin, D.G.; Khvan, A.V.; Starodub, K.F.; Lim, J.J.H.; Burke, M.G.; Connolley, T.; Mi, J. On the occurrence of a eutectic-type structure in solidification of Al-Zr alloys. Scr. Mater. 2017, 133, 75–78. [Google Scholar] [CrossRef]
- Lü, X.Y.; Guo, E.J.; Rometsch, P.; Wang, L.J. Effect of one-step and two-step homogenization treatments on distribution of Al3Zr dispersoids in commercial AA7150 aluminium alloy. Trans. Nonferrous Met. Soc. China 2012, 22, 2645–2651. [Google Scholar] [CrossRef]
- Duan, Y.L.; Xu, G.F.; Peng, X.Y.; Deng, Y.; Li, Z.; Yin, Z.M. Effect of Sc and Zr additions on grain stability and superplasticity of the simple thermal-mechanical processed Al-Zn-Mg alloy sheet. Mater. Sci. Eng. A 2015, 648, 80–91. [Google Scholar] [CrossRef]
- Seyed Ebrahimi, S.H.; Emamy, M.; Pourkia, N.; Lashgari, H.R. The microstructure, hardness and tensile properties of a new super high strength aluminum alloy with Zr addition. Mater. Des. 2010, 31, 4450–4456. [Google Scholar] [CrossRef]
- Fang, H.C.; Chen, K.H.; Chen, X.; Huang, L.P.; Peng, G.S.; Huang, B.Y. Effect of Zr, Cr and Pr additions on microstructures and properties of ultra-high strength Al–Zn–Mg–Cu alloys. Mater. Sci. Eng. A 2011, 528, 7606–7615. [Google Scholar] [CrossRef]
- ASTM International. B557-15. Standard Test Methods for Tension Testing Wrought and Cast Aluminum- and Magnesium-Alloy Products. In Annual Book of ASTM Standards; ASTM International: West Conshohocken, PA, USA, 2016. [Google Scholar]
- ASTM International. E23-18. Standard Test Methods for Notched Bar Impact Testing of Metallic Materials. In ASTM Book of Standards; ASTM International: West Conshohocken, PA, USA, 2018; ISBN 435493654. [Google Scholar]
- ASTM International ASTM E112-13. Standard Test Methods for Determining Average Grain Size. In ASTM Book of Standards; ASTM International: West Conshohocken, PA, USA, 2013. [Google Scholar]
- Senčič, B.; Šolić, S.; Leskovšek, V. Fracture toughness–Charpy impact test–Rockwell hardness regression based model for 51CrV4 spring steel. Mater. Sci. Technol. 2014, 30, 1500–1505. [Google Scholar] [CrossRef]
- Mahmudi, R.; Sepehrband, P.; Ghasemi, H.M. Improved properties of A319 aluminum casting alloy modified with Zr. Mater. Lett. 2006, 60, 2606–2610. [Google Scholar] [CrossRef]
- Ryum, N. Precipitation and recrystallization in an A1-0.5 wt.% Zr-alloy. Acta Metall. 1969, 17, 269–278. [Google Scholar] [CrossRef]
- Mahmoud, A.E.; Mahfouz, M.G.; Elrab, H.G.G.-; Doheim, M.A. Grain refinement of commercial pure aluminium by zirconium. J. Eng. Sci. 2014, 42, 1232–1241. [Google Scholar]
- Rohrer, G.S. The role of grain boundary energy in grain boundary complexion transitions. Curr. Opin. Solid State Mater. Sci. 2016, 20, 231–239. [Google Scholar] [CrossRef]
- Kaibyshev, O.A.; Faizova, S.N.; Hairullina, A.F. Diffusional mass transfer and superplastic deformation. Acta Mater. 2000, 48, 2093–2100. [Google Scholar] [CrossRef]
- Bale, C.W.; Bélisle, E.; Chartrand, P.; Decterov, S.A.; Eriksson, G.; Gheribi, A.E.; Hack, K.; Jung, I.-H.; Kang, Y.-B.; Melançon, J.; et al. FactSage thermochemical software and databases, 2010–2016. Calphad 2016, 54, 35–53. [Google Scholar] [CrossRef] [Green Version]
- Souza, P.H.L.; de Oliveira, C.A.S.; do Vale Quaresma, J.M. Precipitation hardening in dilute Al–Zr alloys. J. Mater. Res. Technol. 2018, 7, 66–72. [Google Scholar] [CrossRef]
- Knipling, K.E.; Dunand, D.C.; Seidman, D.N. Nucleation and Precipitation Strengthening in Dilute Al-Ti and Al-Zr Alloys. Metall. Mater. Trans. A 2007, 38, 2552–2563. [Google Scholar] [CrossRef]
- Silva, R.; Pinto, A.; Kuznetsov, A.; Bott, I. Precipitation and Grain Size Effects on the Tensile Strain-Hardening Exponents of an API X80 Steel Pipe after High-Frequency Hot-Induction Bending. Metals 2018, 8, 168. [Google Scholar] [CrossRef] [Green Version]
- Pineau, A.; Benzerga, A.A.; Pardoen, T. Failure of metals I: Brittle and ductile fracture. Acta Mater. 2016, 107, 424–483. [Google Scholar] [CrossRef] [Green Version]
- Miyahara, N.; Mutoh, Y.; Yamaishi, K.; Uematsu, K.; Inoue, M. The Effects of Grain Size on Strength, Fracture Toughness, and Static Fatigue Crack Growth in Alumina. In Grain Boundary Controlled Properties of Fine Ceramics; Springer: Dordrecht, The Netherlands, 1992; pp. 125–136. [Google Scholar]
- Tarpani, J.R.; Spinelli, D. Grain size effects in the charpy impact energy of a thermally embrittled RPV steel. J. Mater. Sci. 2003, 38, 1493–1498. [Google Scholar] [CrossRef]
- Nakai, M.; Itoh, G. The Effect of Microstructure on Mechanical Properties of Forged 6061 Aluminum Alloy. Mater. Trans. 2014, 55, 114–119. [Google Scholar] [CrossRef] [Green Version]
Figure 1.
Standard test specimens (in mm) for (a) tensile and (b) impact experiments.

Figure 2.
Micrographs of experimental aluminum alloys: (a) commercial purity Al, (b) Al-0.02Zr, (c) Al-0.04Zr, (d) Al-0.06Zr, (e) Al-0.08Zr, (f) Al-0.10Zr, (g) Al-0.12Zr and (h) Al-0.14Zr.
Figure 2.
Micrographs of experimental aluminum alloys: (a) commercial purity Al, (b) Al-0.02Zr, (c) Al-0.04Zr, (d) Al-0.06Zr, (e) Al-0.08Zr, (f) Al-0.10Zr, (g) Al-0.12Zr and (h) Al-0.14Zr.


Figure 3.
The calculated Al-rich side of the Al-Zr binary phase diagram.

Figure 4.
Average grain size (μm) vs. Zr concentration plot.

Figure 5.
Phase assemblage diagrams for (a) Al3Zr and (b) FCC_Al.

Figure 6.
Microhardness number vs. Zr concentration plot.

Figure 7.
True stress-true strain curves for pure Al and Al-Zr microalloys.

Figure 8.
SEM images for the fractured tensile specimens: (a) commercial purity Al, (b) Al-0.02Zr, (c) Al-0.04Zr, (d) Al-0.06Zr, (e) Al-0.08Zr, (f) Al-0.10Zr, (g) Al-0.12Zr and (h) Al-0.14Zr.
Figure 8.
SEM images for the fractured tensile specimens: (a) commercial purity Al, (b) Al-0.02Zr, (c) Al-0.04Zr, (d) Al-0.06Zr, (e) Al-0.08Zr, (f) Al-0.10Zr, (g) Al-0.12Zr and (h) Al-0.14Zr.


Figure 9.
Charpy impact energy for commercial purity Al and Al-Zr microalloys.

Figure 10.
Charpy impact energy and proof stress for commercial purity Al and Al-Zr microalloys as functions of grain size.
Figure 10.
Charpy impact energy and proof stress for commercial purity Al and Al-Zr microalloys as functions of grain size.


Table 1.
Chemical compositions of commercial purity Al (wt.%).
| Fe | Si | Mg | Ti | B | V | Zn | Others 1 | Al | |
|---|---|---|---|---|---|---|---|---|---|
| Commercial purity Al | 0.11 | 0.05 | 0.004 | 0.004 | 0.0005 | 0.008 | 0.005 | 0.015 | Bal. |
1 Cu, Na and Mn.
Table 2.
Relative amounts of the solid phases in the studied alloys at room temperature (wt.%).
| Microalloy | FCC_Al | Al3Zr |
|---|---|---|
| Al-0.02Zr | 99.962 | 0.037 (7) |
| Al-0.04Zr | 99.925 | 0.075 (4) |
| Al-0.06Zr | 99.887 | 0.113 (2) |
| Al-0.08Zr | 99.849 | 0.150 (9) |
| Al-0.10Zr | 99.811 | 0.188 (7) |
| Al-0.12Zr | 99.774 | 0.226 (4) |
| Al-0.14Zr | 99.736 | 0.264 (2) |
Table 3.
Mechanical behavior parameters as extracted from the tensile experiments for all examined specimens.
Table 3.
Mechanical behavior parameters as extracted from the tensile experiments for all examined specimens.
| Material | Proof Stress (σ0.2) MPa | Strain Hardening Exponent (n) | Strength Coefficient (k) MPa |
|---|---|---|---|
| Pure Al | 16.87 ± 9.6% | 0.318 | 75.60 |
| Al-0.02Zr | 29.32 ± 5.1% | 0.251 | 99.04 |
| Al-0.04Zr | 28.27 ± 7.0% | 0.260 | 97.79 |
| Al-0.06Zr | 19.67 ± 6.1% | 0.304 | 81.26 |
| Al-0.08Zr | 32.63 ± 8.4% | 0.232 | 102.42 |
| Al-0.10Zr | 36.14 ± 7.3% | 0.256 | 128.08 |
| Al-0.12Zr | 48.18 ± 4.6% | 0.211 | 135.08 |
| Al-0.14Zr | 47.74 ± 3.3% | 0.267 | 169.94 |
Publisher’s Note: MDPI stays neutral with regard to jurisdictional claims in published maps and institutional affiliations. |
© 2021 by the authors. Licensee MDPI, Basel, Switzerland. This article is an open access article distributed under the terms and conditions of the Creative Commons Attribution (CC BY) license (http://creativecommons.org/licenses/by/4.0/).
Share and Cite
MDPI and ACS Style
Mostafa, A.; Adaileh, W.; Awad, A.; Kilani, A. Mechanical Properties of Commercial Purity Aluminum Modified by Zirconium Micro-Additives. Crystals 2021, 11, 270. https://0-doi-org.brum.beds.ac.uk/10.3390/cryst11030270
AMA Style
Mostafa A, Adaileh W, Awad A, Kilani A. Mechanical Properties of Commercial Purity Aluminum Modified by Zirconium Micro-Additives. Crystals. 2021; 11(3):270. https://0-doi-org.brum.beds.ac.uk/10.3390/cryst11030270
Chicago/Turabian StyleMostafa, Ahmad, Wail Adaileh, Alaa Awad, and Adnan Kilani. 2021. "Mechanical Properties of Commercial Purity Aluminum Modified by Zirconium Micro-Additives" Crystals 11, no. 3: 270. https://0-doi-org.brum.beds.ac.uk/10.3390/cryst11030270
Note that from the first issue of 2016, this journal uses article numbers instead of page numbers. See further details here.