
Halogen Bonding Involving I2 and d8 Transition-Metal Pincer Complexes


1
Department of Chemistry, Southern Methodist University, 3215 Daniel Avenue, Dallas, TX 75275-0314, USA
2
Departamento de Quimica, Instituto Tecnologico de Aeronautica (ITA), Sao Jose dos Campos, Sao Paulo, SP 12228-900, Brazil
*
Author to whom correspondence should be addressed.
Crystals 2021, 11(4), 373; https://0-doi-org.brum.beds.ac.uk/10.3390/cryst11040373
Submission received: 25 February 2021
/
Revised: 23 March 2021
/
Accepted: 31 March 2021
/
Published: 3 April 2021
(This article belongs to the Special Issue Advanced Research in Halogen Bonding)
Abstract
:We systematically investigated iodine–metal and iodine–iodine bonding in van Koten’s pincer complex and 19 modifications changing substituents and/or the transition metal with a PBE0–D3(BJ)/aug–cc–pVTZ/PP(M,I) model chemistry. As a novel tool for the quantitative assessment of the iodine–metal and iodine–iodine bond strength in these complexes we used the local mode analysis, originally introduced by Konkoli and Cremer, complemented with NBO and Bader’s QTAIM analyses. Our study reveals the major electronic effects in the catalytic activity of the M–I–I non-classical three-center bond of the pincer complex, which is involved in the oxidative addition of molecular iodine I2 to the metal center. According to our investigations the charge transfer from the metal to the antibonding orbital of the I–I bond changes the 3c–4e character of the M–I–I three-center bond, which leads to weakening of the iodine I–I bond and strengthening of the metal–iodine M–I bond, facilitating in this way the oxidative addition of I2 to the metal. The charge transfer can be systematically modified by substitution at different places of the pincer complex and by different transition metals, changing the strength of both the M–I and the I2 bonds. We also modeled for the original pincer complex how solvents with different polarity influence the 3c–4e character of the M–I–I bond. Our results provide new guidelines for the design of pincer complexes with specific iodine–metal bond strengths and introduce the local vibrational mode analysis as an efficient tool to assess the bond strength in complexes.

1. Introduction
Pincer complexes were first discovered in 1976 by Moulton and Shaw [1]. After almost a decade these complexes got more attention when researchers found they display extraordinary thermal stability (high melting points). Such properties indicate pincer complexes can be used in homogeneous catalysis, increasing their range of applications from nanomaterials to the development of chemical sensors and chemical switches [2,3,4,5,6,7]. A pincer complex consists of a metal center and pincer type ligands which mostly act as electron donors to the metal center. With increase in electron density, comes increase in nucleophilicity in the case of the metal center; hence a high utility in catalysis involving dihydrogens, silanes, hydrogen halides and alkyl halides [8,9,10,11,12,13,14,15,16,17,18,19,20,21,22,23,24,25,26,27,28,29,30,31,32,33,34,35]. Dihydrogens and silanes show concerted cis addition while for others electrophillic attack to the nucleophillic metal center have been proposed. Dihydrogens are affected by the basicity of the metal center. High basicity leads to the cleavage of H–H bond as a result of metal (M)–*(H2) back donation, while on the other hand a more acidic metal center can retain positive charge and play a stabilizing role of electron acceptor; both of which favor H2 complexation over bond cleavage. In the case of dihalogens, the idea is just beginning to develop. In this regard pincer complexes have been widely studied [36,37,38]. The two nitrogens increase electron density around metal center, contributing to the stability of Pt−’–I2 interaction. The possible reasons for this stability are the presence of σ–donating amine ligands, the plane of the aryl ring which coincides with the coordination plane, and steric constrains [39,40,41]. This opens new pathways for investigating the variation of atoms involved in pincer complexes. Variation of nitrogen donor substituents is powerful for increasing/decreasing the nucleophilicity of the metal center along with screening metal center from attack of reagents from a certain direction [42]. Also, a variety of pincer complexes have been synthesized and studied by changing the donors to PSiP [43], PNF [44], ONO [45] and PCN [46] or the metal center to Zr and Hf [47], P [45], Mo and W [48], Ni [49,50] etc. The Monsanto process for making acetic acid exemplifies a broad and far-reaching application of pincer complexes. Several studies on the effects of steric hindrance, donors [51,52], rates of migratory insertion of CO to methyl [53], indicate pincer complexes as great catalysts.
Halogen bonding has attracted a lot of attention over recent decades. This is documented in many review articles summarizing many experimental and theoretical investigations aimed at the discussion of its characteristic signatures, current conflicting views, and the rich application repertoire [54,55,56,57,58,59,60,61,62,63,64,65,66]. Halogen bonding is a donor-acceptor interaction in which an electrophilic region associate with a halogenated moiety (Lewis-acid) interacts attractively with a nucleophilic region of another molecular entity (Lewis-base), which can be the lone pair of a heteroatom [67,68,69], a -bond or even a metal [70,71]. Metal-halogen bonding plays an important role in the oxidative addition to metal centers [72,73,74,75,76,77,78]. Most widely employed is I2 which has a characteristic acceptor and donor properties due to its relatively low lying LUMO and high lying HOMO [79]. Hence, I2 is bonded as acceptor [7] or as donor [80]. Due to the Janus–face [36] of I2 it is widely employed in pincer complexes. As we discussed in a previous study, metal-halogen interactions show a smooth transition from weak non-covalent halogen bonding to non-classical 3-center-4-electron bonding and finally covalent metal-halide bonding [67], a feature which we also observed for compounds with hypervalent iodine bonding [81]. Intrigued by these results, the current study was aimed at shedding new light into iodine–metal bonding in pincer complexes.
We systematically investigated iodine–metal and iodine–iodine bonding in van Koten’s pincer complex and 19 modifications with different substituents and/or the transition metal shown in Figure 1. Our main goal was to comprehend the major electronic effects that lead to the weakening of iodine bond (I–I) and strength of the halogen–metal bond (M–I) in the three-center bond (M–I–I), as the first step in the oxidative addition of iodine to the metal coordination center. We analyzed how substitutions at different places in pincer complexes modify the strength of both chemical bonds, and what electronic effects are responsible for different strength of these bonds with different transition metals. As efficient quantitative measure of bond strength we used local vibrational force constants derived from the local vibrational mode theory (LVM), originally introduced by Konkoli and Cremer [82,83,84,85,86,87], complemented with NBO [88] and Bader’s QTAIM [89] analyses. We also modeled how solvents with different polarity weaken the I–I bond and strength the M–I bond, facilitating the oxidative addition of I2 to the metal.
2. Computational Methods
Geometries and harmonic vibrational frequencies of complexes 1–20 were calculated with the PBE0 functional combined with the D3(BJ) scheme of Grimme [90] for dispersion corrections using the aug-cc-pVTZ basis set [91,92,93,94,95,96,97,98] and the aug-cc-pVTZ-PP basis set combined with a suitable relativistic effective core potential [99,100] to account for scalar relativistic effects of the heavy atoms. All geometry optimizations completed without any imaginary frequencies. (The Cartesian coordinates of optimized complexes 1–20 are provided in the Supplementary Materials as well as a comparison of the calculated and experimental X-ray geometries of complex 1 to validate the model chemistry used in our study.) Solvent effects of benzene and acetone were modeled using the solute electron density (SMD) variation of IEFPCM [101]. Local vibrational modes and associated local mode force constants were calculated using the LModeA package [87,102]. Electronic and energy distributions were assessed using the AIMALL software package [89,103,104]. The covalent nature of the (M–I) bonds was characterized following the Cremer-Kraka criterion, which implies that covalent bonding is characterized by a negative energy density, i.e., < 0 at the bond critical point between the two atoms forming the bond, whereas electrostatic interactions are indicated by positive energy density values, i.e., > 0 [105,106,107]. NBO6 [88,108,109,110] was used to compute NBO atomic charges and the charge transfer (CT) to the I2 ligand coordinated to the metal center. The CT values were obtained from the total population of the orbital of the I2 ligand. DFT calculations were carried out using Gaussian16 [111]. The local mode force constants can be transformed into bond strength orders (BSO) using a power relationship according to the generalized Badger rule [112,113], BSO ; where the constants A and B are determined by two reference molecules with known BSO and values. Similarly as was done in our previous study [70], the constants A = 0.651 and B = 0.660 were obtained for the I–I bond in I2 with a BSO value of n = 1.0 and a value of 1.924 mDyn/Å and for the 3c–4e bond in the [I⋯I⋯I] anion with a BSO value of n = 0.5 and a value of 0.672 mDyn/Å based on the Rundle–Pimentel model of the non-classical I–I bond (at the PBE0–D3(BJ)/aug–cc–pVTZ/PP(M,I) level of theory). The 3c–4e character of the M–I–I bond was obtained in our study as the BSO ratio n(M–I)/n(I–I) [114], where values between 0.75 and 1.0 indicate on a dominant role of this character in a chemical bond and values above 1.0 indicate on an inverse 3c–4e character where the M–I bond is stronger than the I–I bond, which can lead to dissociation of the I–I bond. Binding energies were defined as the energy of the complex minus the energy of the pincer part without the I2 ligand and minus the energy of the I2 ligand. Both fragments were first calculated in the frozen geometry of the complex and corrected for basis set superposition errors employing the counterpoise correction [115]. Then the geometries of both fragments were allowed to relax to their minimum energy and the energy difference between frozen and relaxed geometries were included in the calculation of the binding energies.
In Reference [87] a comprehensive discussion of the underlying theory of local vibrational modes is provided, therefore in the following only the essential features are summarized. Moreover, serving as a popular analytical tool, modern vibrational spectroscopy [116,117,118] can be an excellent source for electronic structure information of a molecule, in particular for a new quantitative measure of the intrinsic strength of a chemical bond. However, one must consider that normal vibrational modes are generally delocalized over the molecule due to the coupling of the atomic motions [119,120,121]. Therefore, one cannot directly derive an intrinsic bond strength measure from the normal modes. It is also often difficult to assign a certain normal mode in a vibrational spectrum with a single characteristic vibration, in particular in the mid- and lower frequency range. Both problems are addressed in the LMV theory [87].
There are two coupling mechanisms [119,120,121,122], electronic coupling associated with the potential energy content of the vibrational mode and mass coupling associated with the kinetic energy content. The electronic mode–mode coupling can be eliminated via the Wilson GF-matrix formalism [119,120,121], i.e., solving the vibrational secular equation:
Matrix is the force constant matrix (Hessian) in Cartesian coordinates . A molecule with N atoms has Cartesian coordinates, therefore the dimension of is . The number of internal coordinates of a molecule is ); (: number of translations and rotations; 6 for nonlinear and 5 for linear molecules) [119]. Matrix is a diagonal matrix with the eigenvalues , which leads to the (harmonic) vibrational frequencies according to , (c = speed of light) and collects the vibrational eigenvectors in its columns with
= is a diagonal matrix and is a vector that collects the normal coordinates [123,124], i.e., diagonalization of the force constant matrix and transforming to normal coordinates [123,124,125,126] eliminates the off-diagonal coupling force constant matrix elements, and in this way the electronic coupling [119]. The vibrational secular equation expressed in internal coordinates is given by [119]
contains the normal mode column vectors () in internal coordinates and matrix is the Wilson [119].
As is obvious from Equation (3), solving the secular equation does not resolve the mass coupling contained in the off-diagonal elements of the Wilson matrix, reflecting pairwise kinetic coupling between the internal coordinates, which often has been overlooked. Konkoli and Cremer [82,83,84,85,86] solved this problem by introducing a mass-decoupled equivalent to the Wilson equation to derive mass-decoupled local vibrational modes directly from normal vibrational modes and the matrix via Equation (4):
For each of the local mode i, one can define a corresponding local model frequency , a local force constant , and a local mode mass [82]. The local mode frequency is defined by:
and the corresponding local mode force constant by:
Local vibrational modes have several unique properties. Zou, Kraka and Cremer [84,85] verified the uniqueness of the local vibrational modes via an adiabatic connection scheme between local and normal vibrational modes. In contrast to normal mode force constants, local mode force constants have the advantage of not being dependent of the choice of the coordinates used to describe the target molecule and in contrast to vibrational frequencies they are independent of the atomic masses. They are of high sensitivity to electronic structure differences (e.g., caused by changing a substituent) and directly reflect the intrinsic strength of a bond or weak chemical interaction as shown by Zou and Cremer [127]. Thus, local vibration stretching force constants have been used as a unique measure of the intrinsic strength of a chemical bond [86,128,129,130,131,132,133,134,135,136,137,138,139,140,141] or weak chemical interaction [67,68,69,70,71,81,142,143,144,145,146,147,148,149,150,151,152,153,154,155,156,157,158,159] based on vibration spectroscopy. We have successfully described bonding in iodine bonding in a diverse set of 34 hypervalent iodine compounds [81], in this work we apply LMV and associated local mode stretching vibrational force constants to assess iodine bonding in pincer complexes.
3. Results and Discussion
The set of complexes 1–20 (see Figure 1) was chosen to cover a range of different substituents and central transition metals. Complex 1 is the original van Koten complex [38] with an I atom coordinated to the central Pt atom in equatorial position relative to the aryl ring, and the I2 ligand bonded to Pt in axial position. Complexes 2–6 are modifications of reference 1 with different substituents replacing the iodine atom bonded to Pt in equatorial position. In complex 7 the original NMe2 groups are replaced with PMe2 groups and the complexes 8–10 are characterized by modifying Me2 in the NMe2 groups. Complexes 11–12 have different aryl ring substituents in para position relative to the metal coordination center, while complexes 13–17 are modification of reference 1 regarding exchange of the central transition metal. In 15–17 aryl is replaced with pyridine. Complexes 18–20 are other model compounds of general interest [160,161,162]. Throughout the manuscript we use the label M–I for the bond between the metal and iodine atom of the I2 ligand and the label I–I represents the iodine–iodine bond of the I2 ligand coordinated to the metal.
In Figure 2 electronic features are shown elucidating the interaction between I2 and the Pt framework in complexes 1 and 2. In Figure 2a depicting the electron difference density distributions (r) for complex 1 the strong blue region between Pt and I shows that density is built up in the halogen bond region, whereas charge is depleted from the I2 mid-bond region due to the charge transfer (CT) mechanism indicated in Figure 2b. The most relevant CT takes place from the occupied 5d lone pair orbital of the metal to the unoccupied (I–I) orbital of iodine (delocalization energy: 55.0 kcal/mol), leading to the weakening of the iodine bond I2, thus facilitating it oxidative addition to the metal. This is supported by the CT from the occupied 5p lone pair of the anionic iodine ligand coordinated to the metal (delocalization energy: 18.7 kcal/mol). A third but still significant CT involves the occupied -bond(Pt-C) orbital (delocalization energy: 7.9 kcal/mol). The molecular electrostatic potential (ESP) shown in Figure 2c provides the anisotropic charge distribution of the pincer complexes 1 and 2. (ESPs for complexes 1–20 and I2 can be found in the Supplementary Materials). Similar to our previous studies on halogen bonding involving transition-metal Lewis bases, the metal center to which I2 coordinates is not necessarily the most negatively charged part of the molecule. Our previous studies [70] indicate that although a qualitative relationship between the electrostatic potential at the metal center and the binding energy may exist, a correlation between ESP and the I–M bond strength is not expected. Mention worthy is that even in the absence of a negative electrostatic potential, as observed for the positively charged pincer 19 and 20, iodine is still able to form an attractive interaction with the metal center.
In the following general trends observed for 1–20 will be at the focus. Table 1 presents the binding energy of the I2 ligand, the bond length r of the M–I and I–I bonds, the local mode stretching force constant of the I–I and M–I bonds, the corresponding bond strength order BSO n(M–I) and BSO n(I–I), the electron density (M–I) and the energy density (M–I) at the bond critical point and (I–I) and (I–I), respectively, the CT between the metal and a antibonding orbital of the I–I bond and the 3c–4e bond character of the M–I–I bond for complexes 1–20. In Figure 3, Figure 4, Figure 5 and Figure 6 correlations between these properties are shown.
Figure 3a,b present the power relationship between the BSO n and values for the M–I and the I–I bonds, respectively, which transforms force constant values into more commonly applied bond strength orders. According to Table 1, the BSO n values of the M–I bond are in a range between 0.186 and 0.591, which corresponds to relatively weak metal ligand bonding. The strongest M–I bond is found for complex 17 in which the central Pt metal of the original van Koten complex is replaced with Ir, whereas the weakest M–I bond is found for the doubly positively charged Pt complex 19. As reflected by the values in Table 1 all M–I bonds are covalent in nature. The BSO n values for the I–I bonds range from 0.502 and 0.903 are somewhat stronger and reach for 19 with a value 0.903 almost the strength of the I–I bond in I2 (BSO n = 1). In Figure 3c the relationship between (M–I) and (I–I) is depicted. Although the correlation is not perfect (R = 0.8232), it reflects the general trend that a stronger M–I bond corresponds to a weaker I–I bond for a particular molecular complex, in line with the CT mechanism discussed above and in accordance with our previous studies on transition-metal I2 complexes revealing an inverse proportional relationship between the M–I and I–I bond strength [70]. Furthermore, there is also a practical implication, it shows that (M–I) and (I–I) data can be used in a straight-forward manner for the fine-tuning of the iodine bonding in pincer complexes.
In the next section a comparison of local mode stretching force constants and the often-applied binding energies and bond distances r as bond strength measure is presented. Figure 4a,b show the correlation between and of M–I and I–I bonds and Figure 4c,d a correlation between and r of M–I and I–I bonds of complexes 1–20. There is a moderate correlation between and (R = 0.8992 M–I bonds and R = 0.8180 for M–I bonds, respectively) reflecting the general trend that stronger M–I bonds are associated with larger binding energies which also holds to a lesser extend for the I–I bonds. Complex 17 with the strongest M–I bond has the largest I2 binding energy of 36.3 kcal/mol, whereas 19 with the weakest M–I bond has the smallest I2 binding energy of 11.4 kcal/mol. The somewhat better correlation between and for the M–I bonds results from the fact that as defined in this work correlates more with the strength of the M–I bond formed, given by (M–I), than with the weakening of I2, reflected by (I–I) which is a secondary effect observed due to the charge transfer to the *(I–I) antibonding orbital.
The correlations presented in Figure 4a,b seem to be intuitive; however, a caveat is appropriate. The binding energy [163,164,165] is a reaction parameter that includes all changes taking place during the dissociation process. Accordingly, it includes any (de)stabilization effects of the fragments to be formed. It reflects the energy needed for bond breaking, but also contains energy contributions due to geometry relaxation and electron density reorganization of the dissociation fragments. Therefore, it is not a suitable measure of the intrinsic strength of a chemical bond and its use may lead to misjudgments, as documented in the literature [68,112,133,134,166,167]. In the case of the pincer complexes investigated in this work, in particular the geometry relaxation effects are minor, and therefore we observe this qualitatively good relationship.
Besides bond dissociation energies bond lengths are a popular parameter used to assess the strength of a bond and/or weak chemical interaction. Figure 4d shows a significant correlation between and r (R = 0.9206) for I–I bonds. We find the longest I–I bond of 2.934 Å for complex 17 (close to the I–I distance of 2.9357 Å in the [I⋯I⋯I] anion) and the shortest I–I bond of 2.690 Å for complex 19 (close to the I–I distance of 2.6639 Å of the I2 molecule). However, we do not find a similarly significant correlation between and r (R = 0.6440) for M–I bonds as shown in Figure 4c. The M–I bonds investigated in our study range from 2.640 and 3.207Å, a variation of 0.567 Å compared to a much smaller variation of 0.224 Å of the I–I bonds. According to Table 1 complex 19 has the longest complex M–I bond (r = 3.207 Å); however 15 with a central Co atom has the shortest M–I bond (r = 2.640 Å) and not 17 as one would expect in the case of a significant correlation between (M–I) and r(M–I). The observed discrepancy can be related to the different electronic environment of this bond caused by the different transition metals, e.g., a smaller covalent radius of the metal atom can lead to a contraction of the valence orbitals and to shorter bonds, which does not imply that the bonds become stronger. The same holds for relativistic effects [138,168,169].
If in addition to iodine other halogens would have been investigated, similar discrepancies between bond length and local mode force constants would have been expected [68]. In summary, the lack of a significant correlation between M–I bond lengths and local mode force constants is in line with other studies [148,149,170,171] reporting that the stronger bond is not always the shorter one, which disqualifies the bond length as direct bond strength measure.
The correlation between bond strength as reflected by the values and electron density and energy density at the bond critical point for M–I and I–I bonds is the next topic. As reflected by the data collected in Table 1 all M–I and I–I bonds are of covalent nature according to the Cremer-Kraka criterion [105,106,107]. Complex 17 with the strongest M–I bond ( = 0.865 mDyn/Å) has the most negative value of the energy density ( = −0.128 Hartree/Å) corresponding to the most covalent character of our series, whereas complex 19 with the weakest M–I bond (the value = 0.150 mDyn/Å) has an energy density value closer to zero ( = −0.010 Hartree/Å), the onset of a chemical bond with a mixed electrostatic and covalent character. For the I–I bonds we find the largest negative value of −0.172 Hartree/Å for complex 19 and the smallest negative value of −0.065 Hartree/Å for complex 17, again reflecting the inverse strength and nature of the M–I and I–I bonds. Figure 5a,b show the corresponding correlation between and for the M–I and Figure 5c,d show the corresponding correlation between and for M–I and I–I bonds, respectively with significant correlation coefficients R of 0.9687 and 0.9466 for the electron density correlations and R of 0.9834 and 0.9738 for the energy density correlations. The somewhat lower correlation between electron density and local mode force constant is caused predominantly by one outlier, doubly charged complex 19 (see Figure 5a,b) which is another example that is not necessarily a good measure of bond strength [105]. Overall, the strength of the M–I and I–I bonds of complexes 1–20 correlates well with their covalent character as reflected by .
The last two columns of Table 1 report the CT and 3c–4e character of complexes 1–20. As discussed above, the CT from the pincer framework into the unoccupied (I–I) orbital predominantly via the occupied 5d lone pair orbital of the metal with contributions from the occupied 5p lone pair of the anionic iodine ligand coordinated to the metal and a (M–C) bonding orbital. We find the largest CT for complex 15 (0.521 e) and the smallest for complex 19 (0.023 e). In Figure 6a,b the corresponding correlation between CT and (M–I) as well as CT and (I–I) is shown. Although the correlation is moderate in both cases (R values of 0.8271 and 0.8640, respectively) the general trend can be seen that the CT into the unoccupied (I–I) orbital weakens the I–I bond as reflected by (I–I). There is a stronger correlation between the 3c–4e character of the M–I–I bonds and the local stretching force constants shown in Figure 6c for (M–I) (R = 0.9622) and in Figure 6d for (I–I) (R = 0.8737). The 3c–4e character as the ratio of the BSO n values of the M–I and I–I bonds is large when the M–I bond dominates the strength of the I–I bond. Chemically seen, a large 3c–4e character value is indicative of a potential dissociation of the I–I bond in the I2 ligand followed by the oxidative addition reaction on the metal center. Therefore, monitoring of both 3c–4e character and local mode force constants is a valuable tool for the pincer complex designer unlocking how substituent effects may strengthen either the M–I or the I–I bond.
Complexes 2–6 present modifications of 1 where the equatorial iodine ligand is replaced with groups of different electron donating and/or accepting properties. Among them, 3 with –F is a and electron donating ligand, and 4 with a –CH3 group is a donating ligand, while 5 and 6 with –CF3 and –CN groups are electron donating and accepting ligands [172]. According to Table 1 (see also Figure 6c,d) 3 and 4 have a larger 3c–4e character than 5 and 6 (0.62 and 0.68 versus 0.56 and 0.53). This indicates that electron accepting groups decrease the strength of the M–I bond and increase the strength of the I–I bond by decreasing charge transfer to the antibonding orbital. This is in line with the corresponding values. The strength of the I–I bond in 3 and 4 is smaller than that in 1 ( values of 1.064, 1.043, and 1.100 mDyn/Å, respectively), while in 5 and 6 the I–I bond is stronger compared to that in 1 ( values of 1.150, 1.168, 1.100 mDyn/Å, respectively), see Table 1.
Complex 7 is a modification of 1, where the methyl amino groups –NMe2 are replaced with methyl phosphine groups –PMe2. Overall, differences between these two complexes are small, although the –NMe2 group is a donor and the –PMe2 group is a acceptor ligand [173]. According to Table 1 the strength of the I–I bond in 7 is almost the same as in 1 ( values of 1.096 and 1.100 mDyn/Å, respectively); however the M–I bond in 7 is weaker than that in 1 ( values of 0.428 and 0.477 mDyn/Å, respectively), which leads to a slightly smaller 3c–4e character of the M–I–I bond (0.54 versus 0.58) and to a smaller charge transfer to the I–I bond in 7 than in 1 (CT values of 0.233 and 0.254, respectively).
In complexes 8–10 the –NMe2 groups are modified; the methyl groups are replaced with atoms of different electronegativity. According to Table 1, these modifications lead to a smaller 3c–4e character (0.57, 0.55, and 0.47, respectively) and a stronger I–I bond relative to 1. The largest change is observed for 10, where the –NMe2 groups are replaced with –NHF, incorporating a strong electronegative F atom ( values of 1.100 and 1.191 mDyn/Å, for 1 and 10, respectively). The donating character of the –NMe2 group in 1 is changed by the H and F substitutions in 10, which leads to a smaller 3c–4e character of the M–I–I bond, lowers the charge transfer to the orbital of the I–I bond, and makes this bond stronger.
In complexes 11 and 12, the H atom in para position of the aryl ligand of 1 are exchanged in 11 with a –CN group and in 12 with a strong –NMe2 donating group. –CN is a -acceptor ligand capable of stabilizing the metal lone pair weakening the charge transfer from the orbital to the I2 orbital. According to Table 1 and Figure 6c,d 11 has a smaller 3c–4e character than 12 (0.52 versus 0.61) indicating that the strong withdrawing group –CN decreases the strength of the M–I bond and increases the strength of the I–I bond by decreasing the charge transfer to the antibonding orbital. The strength of the I–I bond in 11 is larger than that in 1 ( values of 1.156 and 1.100 mDyn/Å, respectively), whereas in 12 it is smaller than that in 1 ( values of 1.049 and 1.100 mDyn/Å, respectively).
Complexes 13–17 represent modifications of 1 with different transition metals. In addition, in 15–17 the benzene ring replaced with pyridine. The pyridine ring was primarily used to keep these pincer complexes isoelectronic with the Ni, Pd, Pt pincer complexes. The largest 3c–4e character is observed for 17 with a central Ir atom, followed by 16 with a Rh atom and 15 with a Co atom (1.14, 1.04 and 1.04, respectively). The 3c–4e character in these three complexes is larger than 1.0, indicating an inverse character of the 3c–4e bond, where the M–I bond has become stronger than the I–I bond. According to Table 1, the strength of the M–I in these three complexes is regularly increasing ( value of 0.713, 0.793, and 0.865 mDyn/Å, respectively); however the strongest M–I bond in 17 does not correspond to the weakest I–I bond in this series, which we find for 15 ( value of 0.676 mDyn/Å). The strong M–I bond in 17 can be related to a strong stabilization of the Ir–I bond by relativistic effects, as was observed for Ir–C bonds [53,174]. According to our previous study [70], relativistic effects in transition-metal complexes with I2 are responsible for the expansion of the metal d orbitals, which leads to a larger polarization of the electron density in the M–I–I bond and a larger 3c–4e character, increasing the strength of the M–I bond. 15 has the weakest I–I bond observed in our study, which can be attributed to a large charge transfer to the orbital of this bond (CT value of 0.521 e), the largest CT value among all the complexes investigated in this study.
Complex 18 is a model for an Ir pincer complex, which was suggested as catalytic proton sources in the proton–catalyzed H2 addition pathways [160,161]. According to Table 1, the 3c–4e character of the Ir–I–I bond in 18 is larger than in 1 (3c–4e values of 0.73 and 0.58, respectively), however is smaller than that in 17, the second Ir pincer complex investigated in our study (3c–4e value of 1.14), which leads to a I–I bond with similar strength as in 1 ( values of 0.935 and 1.100 mDyn/Å, for 18 and 1, respectively). Complexes 19 and 20 were added due to their unconventional electronic structures and the ability to form the halogen-metal bonds even though they are positively charged [162].
Complex 20 is a six–coordinate octahedral Pt complex containing a neutral I2 ligand [162], showing a similar charge transfer effect for the 3c–4e bond as the other complexes investigated in this study. According to Table 1, the 3c–4e character of this three-center bond is comparable to that in 1 (3c–4e values of 0.53 and 0.58, for 20 and 1, respectively). This leads also to a similar strength of the I–I bond ( values of 0.971 and 1.100 mDyn/Å, for 20 and 1, respectively). It is interesting to note that the similar Pt complex 19 containing a neutral I2 ligand, has only small 3c–4e character (3c–4e value of 0.21) leading to the strongest I–I bond ( value of 1.649 mDyn/Å), and the smallest charge transfer to orbital of this bond (CT value of 0.023 e) in this series.
To assess potential solvent effects on the M–I and I–I bonds strengths, complex 1 was investigated in the gas phase and in solution, using benzene as a model for a non-polar solvent, and acetone as a model for a polar solvent. According to Table 2 and Figure 7, the Pt–I1 bond is the weakest in the gas phase, followed by benzene solution, and acetone solution ( values of 0.477, 0.564, and 0.595 mDyn/Å, respectively). This result reveals that solvent polarity does affect the Pt–I1 bond strength, where both the polar and the non-polar solvents strengthen the interaction compared to the gas phase. However, the solvent effect is reversed for the I1–I2 bond, as reflected by the decreasing values of the local mode force constant ( values of 1.100, 0.955, and 0.640 mDyn/Å, for the gas phase, benzene, and acetone solutions, respectively). Similarly, we observe decreasing local mode force constants for the Pt–I3, Pt–N, and Pt–C chemical bonds. Figure 7 shows also the NBO atomic charges of the Pt and I atoms in the gas phase and in both solutions. The positive NBO charge on the Pt atom is increasing from the gas phase, followed by the benzene, and the acetone solutions (NBO charge values of 0.59, 0.61, and 0.68 e, respectively). The charge on the I1 atom remains almost unchanged (NBO charges of −0.06, −0.05, and −0.05 e, respectively), and the charge on the I2 atom becomes more negative in the same series (NBO charges of −0.19, −0.25, and −0.36 e, respectively). Increased polarity of the solution polarizes the Pt–I1–I2 3c–4e bond and increases the electron density transfer to the antibonding orbital of the I1–I2 bond decreasing its strength. The results of our calculations in solutions are consistent with the gas phase calculations of all complexes presented in this study, showing that the strength of the M–I and I–I bonds in the M–I–I system are inverse proportional, which makes the Pt–I1 bond stronger in the more polar solvent.
4. Conclusions
We systematically investigated iodine–metal and iodine–iodine bonding in van Koten’s pincer complex and 19 modifications changing substituents and/or the transition metal at the PBE0–D3(BJ)/aug–cc–pVTZ/PP(M,I) level of theory, modeling a large range of different electronic effects. As a novel tool for the quantitative assessment of the iodine–metal and iodine–iodine bond strength in these complexes we used the local mode analysis, complemented with NBO and Bader’s QTAIM analyses. Focusing for the first time on the individual bond strengths in these complexes has led to several new insights.
- According to our results, the catalytic activity of the original pincer complex is related to the 3c–4e character of the non-classical three-center M–I–I bond, which is involved in the first step of the oxidative addition of molecular iodine I2 to the metal. The charge transfer from the metal to the antibonding orbital of the I–I bond changes the 3c–4e character of the three-center M–I–I bond, which in turn leads to a weakening of the I–I bond and a strengthening of the M–I bond.
- The largest change in charge transfer with regard to the original van Koten complex 1 was observed for the complexes with Co, Rh and Ir transition metals and a pyridine instead of a benzene ligand, for which we observed an inverse 3c–4e character of the three-center M–I–I bond, i.e., the M–I bond becomes stronger than the I–I bond. The large 3c–4e character in these three pincer complexes is attributed to relativistic effects which expand the d orbitals of the metal leading to a larger charge transfer to the antibonding orbital of the I–I ligand.
- According to solvent calculations, the charge transfer is increased in a polar solvent, which leads to a larger polarization of the M–I–I three-center bond, increasing its 3c–4e character and decreasing the strength of the I–I bond.
In summary, our study introduces local mode force constants as an efficient tool to assess halogen bonding in pincer complexes, providing new guidelines for the design of pincer complexes with specific iodine–metal bond strengths. We hope that this article will inspire the community and will foster collaborations aiming at the use of pincer transition-metal complexes in new key catalytic processes which will save energy and our environment.
Supplementary Materials
The following are available online at https://0-www-mdpi-com.brum.beds.ac.uk/article/10.3390/cryst11040373/s1, Comparison calculated and experimental geometry geometries of complex 1; NBO charges of the (M–I–I) unit of complexes 1–20; Electrostatic potential maps complexes 1–20 and I2; Binding energy versus sum of local M–I and I–I stretching force constants for complexes 1–20; Charge transfer versus 3c–4e character for complexes 1–20; Cartesian Coordinates of 1–20.
Author Contributions
Conceptualization, E.K., M.F., V.O., and S.Y.; methodology, M.F., S.Y., N.V., and E.K.; validation, M.F., S.Y., V.O., and N.V.; formal analysis, S.Y., M.F., V.O., and N.V.; investigation, S.Y. and M.F.; resources, E.K.; data curation, S.Y., M.F.; writing-original draft preparation, M.F. and E.K.; writing-review and editing, E.K., M.F., and V.O.; visualization, S.Y., M.F., and N.V.; supervision, E.K.; funding acquisition, E.K. and V.O. All authors have read and agreed to the published version of the manuscript.
Funding
This research was funded by a National Science Foundation grant number CHE–1464906 (E.K.) and a Brazilian Grant, grant number 2018/13673-7, Sao Paulo Research Foundation (FAPESP) (V.O.).
Acknowledgments
The authors thank SMU for providing generous computational resources.
Conflicts of Interest
The authors declare no conflict of interest.
References
- Chipperfield, J.R.; Ford, J.; Hayter, A.C.; Lee, D.J.; Webster, D.E. Reactivity of Main-Group-Transition-Metal Bonds. Part V. Kinetics of Reactions of Halogens and Interhalogens with Pentacarbonyl(Trimethylstannyl)Manganese, Tricarbonyl(η-Cyclopentadienyl)(Trimethylstannyl)Molybdenum, and Dicarbonyl(η-Cyclopentadienyl)(Trimethylstannyl)Iron, Including the Effects of Solvents on Reactivity. J. Chem. Soc. Dalton Trans. 1976, 11, 1024–1028. [Google Scholar] [CrossRef]
- Piccirilli, L.; Pinheiro, D.L.J.; Nielsen, M. Recent Progress with Pincer Transition Metal Catalysts for Sustainability. Catalysts 2020, 10, 773. [Google Scholar] [CrossRef]
- Budweg, S.; Junge, K.; Beller, M. Catalytic oxidations by dehydrogenation of alkanes, alcohols and amines with defined (non)-noble metal pincer complexes. Catal. Sci. Technol. 2020, 10, 3825–3842. [Google Scholar] [CrossRef]
- Lawrence, M.; Green, K.; Nelson, P.; Lorraine, S. Review: Pincer ligands—Tunable, versatile and applicable. Polyhedron 2018, 143, 11–27. [Google Scholar] [CrossRef]
- Morales-Morales, D. Pincer Compounds: Chemistry and Applications; Elsevier: Amsterdam, The Netherlands, 2018. [Google Scholar]
- Asay, M.; Morales-Morales, D. Non-symmetric pincer ligands: Complexes and applications in catalysis. Dalton Trans. 2015, 44, 17432–17447. [Google Scholar] [CrossRef] [PubMed]
- Albrecht, M.; van Koten, G. Platinum Group Organometallics Based on “Pincer” Complexes: Sensors, Switches, and Catalysts. Angew. Chem. Int. Ed. 2001, 40, 3750–3781. [Google Scholar] [CrossRef]
- Van der Boom, M.E.; Milstein, D. Cyclometalated Phosphine-Based Pincer Complexes: Mechanistic Insight in Catalysis, Coordination, and Bond Activation. Chem. Rev. 2003, 103, 1759–1792. [Google Scholar] [CrossRef] [PubMed]
- Kubas, G.J. Molecular Hydrogen Complexes: Coordination of a σ Bond to Transition Metals. Acc. Chem. Res. 1988, 21, 120–128. [Google Scholar] [CrossRef]
- Musa, S.; Shaposhnikov, I.; Cohen, S.; Gelman, D. Ligand-Metal Cooperation in PCP Pincer Complexes: Rational Design and Catalytic Activity in Acceptorless Dehydrogenation of Alcohols. Angew. Chem. Int. Ed. 2011, 50, 3533–3537. [Google Scholar] [CrossRef]
- Dani, P.; Karlen, T.; Gossage, R.A.; Gladiali, S.; van Koten, G. Hydrogen-Transfer Catalysis with Pincer-Aryl Ruthenium(II) Complexes. Angew. Chem. Int. Ed. 2000, 39, 743–745. [Google Scholar] [CrossRef]
- Jensen, C.M. Iridium PCP Pincer Complexes: Highly Active and Robust Catalysts for Novel Homogeneous Aliphatic Dehydrogenations. Chem. Commun. 1999, 2443–2449. [Google Scholar] [CrossRef]
- Choi, J.; MacArthur, A.H.R.; Brookhart, M.; Goldman, A.S. Dehydrogenation and Related Reactions Catalyzed by Iridium Pincer Complexes. Chem. Rev. 2011, 111, 1761–1779. [Google Scholar] [CrossRef] [PubMed]
- Tanaka, R.; Yamashita, M.; Nozaki, K. Catalytic Hydrogenation of Carbon Dioxide Using Ir(III)-Pincer Complexes. J. Am. Chem. Soc. 2009, 131, 14168–14169. [Google Scholar] [CrossRef] [PubMed]
- Liu, F.; Pak, E.B.; Singh, B.; Jensen, C.M.; Goldman, A.S. Dehydrogenation of n-Alkanes Catalyzed by Iridium “Pincer” Complexes: Regioselective Formation of α-Olefins. J. Am. Chem. Soc. 1999, 121, 4086–4087. [Google Scholar] [CrossRef]
- Jongbloed, L.S.; Vogt, N.; Sandleben, A.; de Bruin, B.; Klein, A.; van der Vlugt, J.I. Nickel-Alkyl Complexes with a Reactive PNC-Pincer Ligand. Eur. J. Inorg. Chem. 2018, 2018, 2408–2418. [Google Scholar] [CrossRef] [Green Version]
- Fang, S.; Chen, H.; Wei, H. Insight into Catalytic Reduction of CO2 to Methane with Silanes using Brookhart’s Cationic Ir(III) Pincer Complex. RSC Adv. 2018, 8, 9232–9242. [Google Scholar] [CrossRef] [Green Version]
- Yao, L.; Li, Y.; Huang, L.; Guo, K.; Ren, G.; Wu, Z.; Lei, Q.; Fang, W.; Xie, H. A DFT Study on the Mechanisms of Hydrogenation and Hydrosilylation of Nitrous Oxide Catalyzed by a Ruthenium PNP Pincer Complex. Comput. Theor. Chem. 2018, 1128, 48–55. [Google Scholar] [CrossRef]
- Murphy, L.J.; Hollenhorst, H.; McDonald, R.; Ferguson, M.; Lumsden, M.D.; Turculet, L. Selective Ni-Catalyzed Hydroboration of CO2 to the Formaldehyde Level Enabled by New PSiP Ligation. Organometallics 2017, 36, 3709–3720. [Google Scholar] [CrossRef]
- Ramaraj, A.; Reddy, K.H.K.; Keil, H.; Herbst-Irmer, R.; Stalke, D.; Jemmis, E.D.; Jagirdar, B.R. Approaches to Sigma Complexes via Displacement of Agostic Interactions: An Experimental and Theoretical Investigation. Organometallics 2017, 36, 2736–2745. [Google Scholar] [CrossRef]
- Imayoshi, R.; Nakajima, K.; Takaya, J.; Iwasawa, N.; Nishibayashi, Y. Synthesis and Reactivity of Iron- and Cobalt-Dinitrogen Complexes Bearing PSiP-Type Pincer Ligands toward Nitrogen Fixation. Eur. J. Inorg. Chem. 2017, 2017, 3769–3778. [Google Scholar] [CrossRef]
- Mazzotta, M.G.; Xiong, M.; Abu-Omar, M.M. Carbon Dioxide Reduction to Silyl-Protected Methanol Catalyzed by an Oxorhenium Pincer PNN Complex. Organometallics 2017, 36, 1688–1691. [Google Scholar] [CrossRef]
- Zeng, R.; Feller, M.; Ben-David, Y.; Milstein, D. Hydrogenation and Hydrosilylation of Nitrous Oxide Homogeneously Catalyzed by a Metal Complex. J. Am. Chem. Soc. 2017, 139, 5720–5723. [Google Scholar] [CrossRef] [PubMed]
- Wenz, J.; Wadepohl, H.; Gade, L.H. Regioselective Hydrosilylation of Epoxides Catalysed by Nickel(II) Hydrido Complexes. Chem. Commun. 2017, 53, 4308–4311. [Google Scholar] [CrossRef]
- Fang, H.; Guo, L.; Zhang, Y.; Yao, W.; Huang, Z. A Pincer Ruthenium Complex for Regioselective C–H Silylation of Heteroarenes. Org. Lett. 2016, 18, 5624–5627. [Google Scholar] [CrossRef] [PubMed]
- Charboneau, D.J.; Balcells, D.; Hazari, N.; Lant, H.M.C.; Mayer, J.M.; Melvin, P.R.; Mercado, B.Q.; Morris, W.D.; Repisky, M.; Suh, H.W. Dinitrogen-Facilitated Reversible Formation of a Si–H Bond in a Pincer-Supported Ni Complex. Organometallics 2016, 35, 3154–3162. [Google Scholar] [CrossRef]
- Buslov, I.; Keller, S.C.; Hu, X. Alkoxy Hydrosilanes As Surrogates of Gaseous Silanes for Hydrosilylation of Alkenes. Org. Lett. 2016, 18, 1928–1931. [Google Scholar] [CrossRef] [PubMed] [Green Version]
- Comanescu, C.C.; Iluc, V.M. E–H (E = B, Si, Ge) Bond Activation of Pinacolborane, Silanes, and Germanes by Nucleophilic Palladium Carbene Complexes. Chem. Commun. 2016, 52, 9048–9051. [Google Scholar] [CrossRef]
- Xiong, Z.; Li, X.; Zhang, S.; Shi, Y.; Sun, H. Synthesis and Reactivity of N-Heterocyclic PSiP Pincer Iron and Cobalt Complexes and Catalytic Application of Cobalt Hydride in Kumada Coupling Reactions. Organometallics 2016, 35, 357–363. [Google Scholar] [CrossRef]
- Mucha, N.T.; Waterman, R. Correction to Iridium Pincer Catalysts for Silane Dehydrocoupling: Ligand Effects on Selectivity and Activity. Organometallics 2015, 34, 5682. [Google Scholar] [CrossRef] [Green Version]
- LaPierre, E.A.; Piers, W.E.; Spasyuk, D.M.; Bi, D.W. Activation of Si–H Bonds across the Nickel Carbene Bond in Electron Rich Nickel PCcarbeneP Pincer Complexes. Chem. Commun. 2016, 52, 1361–1364. [Google Scholar] [CrossRef] [Green Version]
- Hao, J.; Vabre, B.; Zargarian, D. Reactions of Phenylhydrosilanes with Pincer–Nickel Complexes: Evidence for New Si–O and Si–C Bond Formation Pathways. J. Am. Chem. Soc. 2015, 137, 15287–15298. [Google Scholar] [CrossRef]
- Buslov, I.; Becouse, J.; Mazza, S.; Montandon-Clerc, M.; Hu, X. Chemoselective Alkene Hydrosilylation Catalyzed by Nickel Pincer Complexes. Angew. Chem. Int. Ed. 2015, 54, 14523–14526. [Google Scholar] [CrossRef]
- Puddephatt, R.J. Coordinative Unsaturation in Platinum(IV) Chemistry: From Proposed Reaction Intermediates to the First Structurally Characterized Complexes. Angew. Chem. Int. Ed. 2002, 41, 261. [Google Scholar] [CrossRef]
- Titova, E.M.; Osipova, E.S.; Pavlov, A.A.; Filippov, O.A.; Safronov, S.V.; Shubina, E.S.; Belkova, N.V. Mechanism of Dimethylamine–Borane Dehydrogenation Catalyzed by an Iridium(III) PCP-Pincer Complex. ACS Catal. 2017, 7, 2325–2333. [Google Scholar] [CrossRef]
- Rogachev, A.Y.; Hoffmann, R. Iodine (I2) as a Janus–Faced Ligand in Organometallics. J. Am. Chem. Soc. 2013, 135, 3262–3275. [Google Scholar] [CrossRef] [PubMed]
- Gossage, R.A.; Ryabov, A.D.; Spek, A.L.; Stufkens, D.J.; van Beek, J.A.M.; van Eldik, R.; van Koten, G. Models for the Initial Stages of Oxidative Addition. Synthesis, Characterization, and Mechanistic Investigation of η1–I2 Organometallic “Pincer” Complexes of Platinum. X-ray Crystal Structures of [PtI(C6H3{CH2NMe2}2–2,6)(η1–I2)] and exo-meso-[Pt(η1–I3)(η1–I2)(C6H3{CH2N(t–Bu)Me}2–2,6)]. J. Am. Chem. Soc. 1999, 121, 2488–2497. [Google Scholar] [CrossRef]
- Beek, J.A.M.V.; Koten, G.V.; Smeets, W.J.J.; Spek, A.L. Model for the Initial Stage in the Oxidative Addition of I2 to Organoplatinum(II) Compounds. X-Ray Structure of Square-Pyramidal [PtIII{C6H3(CH2NMe2)2−o,o′}(η1–I2)] containing a Linear Pt–I–I Arrangement. J. Am. Chem. Soc. 1986, 108, 5010–5011. [Google Scholar] [CrossRef]
- Van Koten, G.; Hollis, T.K.; Morales-Morales, D. Pincer Chemistry and Catalysis. Eur. J. Inorg. Chem. 2020, 2020, 4416–4417. [Google Scholar] [CrossRef]
- Van Koten, G. Novel Aspects of η’-Diiodine Coordination and Diiodine Oxidative Addition to Platinum(II) and Halide Transfer Oxidation Reactions of Organo-Platinum(II) with CuIIX2. Pure Appl. Chem. 1990, 62, 1155–1159. [Google Scholar] [CrossRef]
- Van Koten, G. Highlights of 45 years of research: A personal account. J. Organomet. Chem. 2017, 845, 4–18. [Google Scholar] [CrossRef]
- Van Beek, J.A.; van Koten, G.; Dekker, G.P.; Wissing, E.; Zoutberg, M.C.; Stam, C.H. Synthesis and Reactivity Towards Diiodine of Palladium(II) and Platinum(II) Complexes with Non-Cyclic and Cyclic Ligands (C6H3{CH2NR1R2}2–2,6)−. End-on Diiodine-Platinum(II) Bonding in Macrocyclic [PtI(C6H3{CH2NMe(CH2)7MeNCH2}–2,6)(η1–I2)]. J. Organomet. Chem. 1990, 394, 659–678. [Google Scholar] [CrossRef]
- Li, Y.H.; Ding, X.H.; Zhang, Y.; He, W.R.; Huang, W. Synthesis, characterization, and catalytic behavior of a PSiP pincer-type ruthenium(II) complex. Inorg. Chem. Commun. 2012, 15, 194–197. [Google Scholar] [CrossRef]
- Scharf, A.; Goldberg, I.; Vigalok, A. Evidence for Metal–Ligand Cooperation in a Pd–PNF Pincer-Catalyzed Cross-Coupling. J. Am. Chem. Soc. 2012, 135, 967–970. [Google Scholar] [CrossRef]
- Robinson, T.P.; De Rosa, D.; Aldridge, S.; Goicoechea, J.M. On the Redox Reactivity of a Geometrically Constrained Phosphorus(III) Compound. Chem. Eur. J. 2017, 23, 15455–15465. [Google Scholar] [CrossRef] [PubMed]
- Fleckhaus, A.; Mousa, A.H.; Lawal, N.S.; Kazemifar, N.K.; Wendt, O.F. Aromatic PCN Palladium Pincer Complexes. Probing the Hemilability through Reactions with Nucleophiles. Organometallics 2015, 34, 1627–1634. [Google Scholar] [CrossRef]
- Clark, W.D.; Cho, J.; Valle, H.U.; Hollis, T.K.; Valente, E.J. Metal and Halogen Dependence of the Rate Effect in Hydroamination/Cyclization of Unactivated Aminoalkenes: Synthesis, Characterization, and Catalytic Rates of CCC-NHC Hafnium and Zirconium Pincer Complexes. J. Organomet. Chem. 2014, 751, 534–540. [Google Scholar] [CrossRef]
- De Aguiar, S.R.M.M.; Stöger, B.; Pittenauer, E.; Allmaier, G.; Veiros, L.F.; Kirchner, K. Structural Diversity of Halocarbonyl Molybdenum and Tungsten Pnp Pincer Complexes through Ligand Modifications. Dalton Trans. 2016, 45, 13834–13845. [Google Scholar] [CrossRef] [PubMed] [Green Version]
- Martinez, G.E.; Ocampo, C.; Park, Y.J.; Fout, A.R. Accessing Pincer Bis(carbene) Ni(IV) Complexes from Ni(II) via Halogen and Halogen Surrogates. J. Am. Chem. Soc. 2016, 138, 4290–4293. [Google Scholar] [CrossRef]
- Sitek, P.; Jaworska, M.; Lodowski, P.; Chmielowska, A. Methyl Transfer Reaction between MeI and Ni(PPh2CH2CH2SEt)2 complex. A DFT study. Inorg. Chem. Commun. 2013, 29, 65–69. [Google Scholar] [CrossRef]
- Adcock, R.J.; Nguyen, D.H.; Ladeira, S.; Berre, C.L.; Serp, P.; Kalck, P. Reactivity of Rhodium(I) Complexes Bearing Nitrogen-Containing Ligands toward CH3I: Synthesis and Full Characterization of Neutral cis-[RhX(CO)2(L)] and Acetyl [RhI(μ-I)(COMe)(CO)(L)]2 Complexes. Inorg. Chem. 2012, 51, 8670–8685. [Google Scholar] [CrossRef]
- Gaunt, J.A.; Gibson, V.C.; Haynes, A.; Spitzmesser, S.K.; White, A.J.P.; Williams, D.J. Bis(imino)carbazolide Complexes of Rhodium: Highly Nucleophilic Ligands Exerting a Dramatic Accelerating Effect on MeI Oxidative Addition. Organometallics 2004, 23, 1015–1023. [Google Scholar] [CrossRef]
- Cheong, M.; Ziegler, T. Density Functional Study of the Oxidative Addition Step in the Carbonylation of Methanol Catalyzed by [M(CO)2I2]−(M = Rh, Ir). Organometallics 2005, 24, 3053–3058. [Google Scholar] [CrossRef]
- Varadwaj, P.R.; Varadwaj, A.; Marques, H.M. Halogen Bonding: A Halogen-Centered Noncovalent Interaction Yet to Be Understood. Inorganics 2019, 7, 40. [Google Scholar] [CrossRef] [Green Version]
- Varadwaj, P.R.; Varadwaj, A.; Marques, H.M. Interaction Nature and Computational Methods for Halogen Bonding: A Perspective. J. Chem. Inf. Model. 2020, 60, 268–2696. [Google Scholar]
- Cavallo, G.; Metrangolo, P.; Milani, R.; Pilati, T.; Priimagi, A.; Resnati, G.; Terraneo, G. The Halogen Bond. Chem. Rev. 2016, 116, 2478–2601. [Google Scholar] [CrossRef] [PubMed] [Green Version]
- Catalano, L.; Cavallo, G.; Metrangolo, P.; Resnati, G.; Terraneo, G. Halogen Bonding in Hypervalent Iodine Compounds. In Hypervalent Iodine Chemistry; Wirth, T., Ed.; Springer International Publishing: Cham, Switzerland, 2016; pp. 289–309. [Google Scholar]
- Wang, H.; Wang, W.; Jin, W.J. σ-Hole Bond vs π-Hole Bond: A Comparison Based on Halogen Bond. Chem. Rev. 2016, 116, 5072–5104. [Google Scholar] [CrossRef]
- Maharramov, A.M.; Shixaliyev, N.Q.; Gurbanov, A.V.; Mahmudov, K.T.; Nenajdenko, V.G.; Pombeiro, A.J.L.; Kopylovich, M.N. Halogen Bonding in the Synthesis and Design of Coordination and Organometallic Compounds. In Non-covalent Interactions in the Synthesis and Design of New Compounds; John Wiley and Sons, Inc.: Hoboken, NJ, USA, 2016; pp. 145–162. [Google Scholar]
- Politzer, P.; Murray, J.S.; Clark, T. η-Hole Bonding: A Physical Interpretation. In Halogen Bonding I: Impact on Materials Chemistry and Life Sciences; Metrangolo, P., Resnati, G., Eds.; Springer International Publishing: Cham, Switzerland, 2015; pp. 19–42. [Google Scholar]
- Scheiner, S.; Lu, J. Halogen, Chalcogen, and Pnicogen Bonding Involving Hypervalent Atoms. Chem. Eur. J. 2018, 24, 8167–8177. [Google Scholar] [CrossRef]
- Grabowski, S. New Type of Halogen Bond: Multivalent Halogen Interacting with π- and σ-Electrons. Molecules 2017, 22, 2150. [Google Scholar] [CrossRef] [Green Version]
- Engelage, E.; Reinhard, D.; Huber, S.M. Is There a Single Ideal Parameter for Halogen-Bonding-Based Lewis Acidity? Chem. Eur. J. 2020, 26, 3843–3861. [Google Scholar] [CrossRef]
- Aakeroy, C.B.; Wijethunga, T.K.; Desper, J.; Dakovic, M. Electrostatic Potential Differences and Halogen-Bond Selectivity. Cryst. Growth Des. 2016, 16, 2662–2670. [Google Scholar] [CrossRef]
- Wang, C.; Danovich, D.; Mo, Y.; Shaik, S. On The Nature of the Halogen Bond. J. Chem. Theory Comput. 2014, 10, 3726–3737. [Google Scholar] [CrossRef] [PubMed]
- Berger, G.; Frangville, P.; Meyer, F. Halogen bonding for molecular recognition: New developments in materials and biological sciences. Chem. Commun. 2020, 56, 4970–4981. [Google Scholar] [CrossRef] [PubMed]
- Oliveira, V.; Kraka, E.; Cremer, D. The Intrinsic Strength of the Halogen Bond: Electrostatic and Covalent Contributions Described by Coupled Cluster Theory. Phys. Chem. Chem. Phys. 2016, 18, 33031–33046. [Google Scholar] [CrossRef] [PubMed]
- Oliveira, V.; Kraka, E.; Cremer, D. Quantitative Assessment of Halogen Bonding Utilizing Vibrational Spectroscopy. Inorg. Chem. 2016, 56, 488–502. [Google Scholar] [CrossRef]
- Tao, Y.; Qiu, Y.; Zou, W.; Nanayakkara, S.; Yannacone, S.; Kraka, E. In Situ Assessment of Intrinsic Strength of X-I⋯OA Type Halogen Bonds in Molecular Crystals with Periodic Local Vibrational Mode Theory. Molecules 2020, 25, 1589. [Google Scholar] [CrossRef] [Green Version]
- Oliveira, V.; Cremer, D. Transition from Metal-Ligand Bonding to Halogen Bonding Involving a Metal as Halogen Acceptor: A Study of Cu, Ag, Au, Pt, and Hg Complexes. Chem. Phys. Lett. 2017, 681, 56–63. [Google Scholar] [CrossRef]
- Oliveira, V.P.; Marcial, B.L.; Machado, F.B.C.; Kraka, E. Metal-Halogen Bonding Seen through the Eyes of Vibrational Spectroscopy. Materials 2020, 13, 55. [Google Scholar] [CrossRef] [Green Version]
- Eliseeva, A.A.; Ivanov, D.M.; Rozhkov, A.V.; Ananyev, I.V.; Frontera, A.; Kukushkin, V.Y. Bifurcated Halogen Bonding Involving Two Rhodium(I) Centers as an Integrated σ-Hole Acceptor. J. Am. Chem. Soc. Au 2021, 1, 354–361. [Google Scholar] [CrossRef]
- Wolf, J.; Huber, F.; Erochok, N.; Heinen, F.; Guerin, V.; Legault, C.Y.; Kirsch, S.F.; Huber, S.M. Activation of a Metal-Halogen Bond by Halogen Bonding. Angew. Chem. Int. Ed. 2020, 59, 16496–16500. [Google Scholar] [CrossRef]
- Yang, H.; Wong, M.W. Application of Halogen Bonding to Organocatalysis: A Theoretical Perspective. Molecules 2020, 25, 1045. [Google Scholar] [CrossRef] [Green Version]
- Sousa e Silva, F.C.; Tierno, A.F.; Wengryniuk, S.E. Hypervalent Iodine Reagents in High Valent Transition Metal Chemistry. Molecules 2017, 22, 780. [Google Scholar] [CrossRef] [PubMed] [Green Version]
- Mahmudov, K.T.; Gurbanov, A.V.; Guseinov, F.I.; Guedes da Silva, M.F.C. Noncovalent Interactions in Metal Complex Catalysis. Coord. Chem. Rev. 2019, 387, 32–46. [Google Scholar] [CrossRef]
- Benz, S.; Poblador-Bahamonde, A.I.; Low-Ders, N.; Matile, S. Catalysis with Pnictogen, Chalcogen, and Halogen Bonds. Angew. Chem. Int. Ed. 2018, 57, 5408–5412. [Google Scholar] [CrossRef] [PubMed]
- Ivanov, D.M.; Novikov, A.S.; Ananyev, I.V.; Kirina, Y.V.; Kukushkin, V.Y. Halogen Bonding between Metal Centers and Halocarbons. Chem. Commun. 2016, 52, 5565–5568. [Google Scholar] [CrossRef] [Green Version]
- Rogachev, A.Y.; Hoffmann, R. Hypervalent compounds as ligands: I3–anion adducts with rransition metal pentacarbonyls. Inorg. Chem. 2013, 52, 7161–7171. [Google Scholar] [CrossRef]
- Cotton, F.A.; Dikarev, E.V.; Petrukhina, M.A. Coordinated and Clathrated Molecular Diiodine in [Rh2(O2CCF3)4I2]·I2. Angew. Chem. Int. Ed. 2000, 39, 2362–2364. [Google Scholar] [CrossRef]
- Yannacone, S.; Oliveira, V.; Verma, N.; Kraka, E. A Continuum from Halogen Bonds to Covalent Bonds: Where Do λ3 Iodanes Fit? Inorganics 2019, 7, 47. [Google Scholar] [CrossRef] [Green Version]
- Konkoli, Z.; Cremer, D. A New Way of Analyzing Vibrational Spectra. I. Derivation of Adiabatic Internal Modes. Int. J. Quantum Chem. 1998, 67, 1–9. [Google Scholar] [CrossRef]
- Konkoli, Z.; Larsson, J.A.; Cremer, D. A New Way of Analyzing Vibrational Spectra. II. Comparison of Internal Mode Frequencies. Int. J. Quantum Chem. 1998, 67, 11–27. [Google Scholar] [CrossRef]
- Konkoli, Z.; Cremer, D. A New Way of Analyzing Vibrational Spectra. III. Characterization of Normal Vibrational Modes in terms of Internal Vibrational Modes. Int. J. Quantum Chem. 1998, 67, 29–40. [Google Scholar] [CrossRef]
- Konkoli, Z.; Larsson, J.A.; Cremer, D. A New Way of Analyzing Vibrational Spectra. IV. Application and Testing of Adiabatic Modes within the Concept of the Characterization of Normal Modes. Int. J. Quantum Chem. 1998, 67, 41–55. [Google Scholar] [CrossRef]
- Cremer, D.; Larsson, J.A.; Kraka, E. New Developments in the Analysis of Vibrational Spectra on the Use of Adiabatic Internal Vibrational Modes. In Theoretical and Computational Chemistry; Parkanyi, C., Ed.; Elsevier: Amsterdam, The Netherlands, 1998; pp. 259–327. [Google Scholar] [CrossRef]
- Kraka, E.; Zou, W.; Tao, Y. Decoding chemical information from vibrational spectroscopy data: Local vibrational mode theory. Wiley Interdiscip. Rev. Comput. Mol. Sci. 2020, 10, e1480. [Google Scholar] [CrossRef]
- Landis, C.R.; Weinhold, F. The NBO View of Chemical Bonding. In The Chemical Bond: Fundamental Aspects of Chemical Bonding; Wiley-VCH Verlag GmbH & Co. KGaA: Weinheim, Germany, 2014; pp. 91–120. [Google Scholar]
- Bader, R.F.W. A Quantum Theory of Molecular Structure and Its Applications. Chem. Rev. 1991, 91, 893–928. [Google Scholar] [CrossRef]
- Grimme, S.; Ehrlich, S.; Goerigk, L. Effect of the Damping Function in Dispersion Corrected Density Functional Theory. J. Comput. Chem. 2011, 32, 1456–1465. [Google Scholar] [CrossRef] [PubMed]
- Adamo, C.; Barone, V. Toward Reliable Density Functional Methods without Adjustable Parameters: The PBE0 Model. J. Chem. Phys. 1999, 110, 6158–6170. [Google Scholar] [CrossRef]
- Bousquet, D.; Brémond, E.; Sancho-García, J.C.; Ciofini, I.; Adamo, C. Is There Still Room for Parameter Free Double Hybrids? Performances of PBE0-DH and B2PLYP over Extended Benchmark Sets. J. Chem. Theory Comput. 2013, 9, 3444–3452. [Google Scholar] [CrossRef] [PubMed]
- Perdew, J.P.; Ernzerhof, M.; Burke, K. Rationale for Mixing Exact Exchange with Density Functional Approximations. J. Chem. Phys. 1996, 105, 9982–9985. [Google Scholar] [CrossRef]
- Perdew, J.P.; Burke, K.; Ernzerhof, M. Generalized Gradient Approximation Made Simple. Phys. Rev. Lett. 1996, 77, 3865–3868. [Google Scholar] [CrossRef] [Green Version]
- Woon, D.E.; Dunning, T.H. Gaussian Basis Sets for use in Correlated Molecular Calculations. IV. Calculation of Static Electrical Response Properties. J. Chem. Phys. 1994, 100, 2975–2988. [Google Scholar] [CrossRef] [Green Version]
- Woon, D.E.; Dunning, T.H. Gaussian Basis Sets for use in Correlated Molecular Calculations. III. The Atoms Aluminum through Argon. J. Chem. Phys. 1993, 98, 1358–1371. [Google Scholar] [CrossRef] [Green Version]
- Kendall, R.A.; Dunning, T.H.; Harrison, R.J. Electron Affinities of the First Row Atoms Revisited. Systematic Basis Sets and Wave Functions. J. Chem. Phys. 1992, 96, 6796–6806. [Google Scholar] [CrossRef] [Green Version]
- Dunning, T.H. Gaussian Basis Sets for use in Correlated Molecular Calculations. I. The Atoms Boron through Neon and Hydrogen. J. Chem. Phys. 1989, 90, 1007–1023. [Google Scholar] [CrossRef]
- Peterson, K.A.; Figgen, D.; Goll, E.; Stoll, H.; Dolg, M. Systematically Convergent Basis Sets with Relativistic Pseudopotentials. II. Small-Core Pseudopotentials and Correlation Consistent Basis Sets for the Post-d Group 16-18 Elements. J. Chem. Phys. 2003, 119, 11113–11123. [Google Scholar] [CrossRef] [Green Version]
- Peterson, K.A. Systematically Convergent Basis Sets with Relativistic Pseudopotentials. I. Correlation Consistent Basis Sets for the Post-d Group 13–15 Elements. J. Chem. Phys. 2003, 119, 11099–11112. [Google Scholar] [CrossRef] [Green Version]
- Marenich, A.V.; Cramer, C.J.; Truhlar, D.G. Universal Solvation Model Based on Solute Electron Density and on a Continuum Model of the Solvent Defined by the Bulk Dielectric Constant and Atomic Surface Tensions. J. Phys. Chem. B 2009, 113, 6378–6396. [Google Scholar] [CrossRef]
- Zou, W.; Tao, Y.; Freindorf, M.; Makoś, M.Z.; Verma, N.; Kraka, E. Local Vibrational Mode Analysis (LModeA); Computational and Theoretical Chemistry Group (CATCO), Southern Methodist University: Dallas, TX, USA, 2020. [Google Scholar]
- Keith, T.A. AIMAll, Version 17.11.14; TK Gristmill Software: Overland Park, KS, USA, 2017; Available online: aim.tkgristmill.com (accessed on 15 February 2021).
- Bader, R.F.W. The Quantum Mechanical Basis of Conceptual Chemistry. Monatshefte Chem. 2005, 136, 819–854. [Google Scholar] [CrossRef]
- Cremer, D.; Kraka, E. Chemical Bonds without Bonding Electron Density? Does the Difference Electron-Density Analysis Suffice for a Description of the Chemical Bond? Angew. Chem. Int. Ed. 1984, 23, 627–628. [Google Scholar] [CrossRef]
- Cremer, D.; Kraka, E. A Description of the Chemical Bond in Terms of Local Properties of Electron Density and Energy. Croat. Chem. Acta 1984, 57, 1259–1281. [Google Scholar]
- Kraka, E.; Cremer, D. Chemical Implication of Local Features of the Electron Density Distribution. In Theoretical Models of Chemical Bonding. The Concept of the Chemical Bond; Maksic, Z.B., Ed.; Springer: Heidelberg, Germany, 1990; Volume 2, p. 453. [Google Scholar]
- Glendening, E.D.; Landis, C.R.; Weinhold, F. NBO 6.0: Natural bond orbital analysis program. J. Comput. Chem. 2013, 34, 1429–1437. [Google Scholar] [CrossRef]
- Reed, A.E.; Curtiss, L.A.; Weinhold, F. Intermolecular Interactions from a Natural Bond Orbital, Donor–Acceptor Viewpoint. Chem. Rev. 1988, 88, 899–926. [Google Scholar] [CrossRef]
- Weinhold, F.; Landis, C.R.; Glendening, E.D. What is NBO Analysis and How is it Useful? Int. Rev. Phys. Chem. 2016, 35, 39–440. [Google Scholar] [CrossRef]
- Frisch, M.J.; Trucks, G.W.; Schlegel, H.B.; Scuseria, G.E.; Robb, M.A.; Cheeseman, J.R.; Scalmani, G.; Barone, V.; Petersson, G.A.; Nakatsuji, H.; et al. Gaussian 16 Revision A.03; Gaussian Inc.: Wallingford, CT, USA, 2016. [Google Scholar]
- Cremer, D.; Kraka, E. From Molecular Vibrations to Bonding, Chemical Reactions, and Reaction Mechanism. Curr. Org. Chem. 2010, 14, 1524–1560. [Google Scholar] [CrossRef]
- Kraka, E.; Larsson, J.A.; Cremer, D. Generalization of the Badger Rule Based on the Use of Adiabatic Vibrational Modes. In Computational Spectroscopy; Grunenberg, J., Ed.; Wiley: New York, NY, USA, 2010; pp. 105–149. [Google Scholar] [CrossRef]
- Oliveira, V.P.; Kraka, E.; Machado, F.B.C. Pushing 3c–4e Bonds to the Limit: A Coupled Cluster Study of Stepwise Fluorination of First-Row Atoms. Inorg. Chem. 2019, 58, 14777–14789. [Google Scholar] [CrossRef]
- Boys, S.; Bernardi, F. The calculation of small molecular interactions by the differences of separate total energies. Some procedures with reduced errors. Mol. Phys. 1970, 19, 553–566. [Google Scholar] [CrossRef]
- Wu, G. Vibrational Spectroscopy; De Gruyter: Berlin, Germany, 2019. [Google Scholar]
- Huang, Y.; Chang, C.; Yuan, J.; Zhao, Z. High-Harmonic and Terahertz Spectroscopy (HATS): Methods and Applications. Appl. Sci. 2019, 9, 853. [Google Scholar] [CrossRef] [Green Version]
- Smith, E.; Dent, G. Modern Raman Spectroscopy: A Practical Approach; Wiley: New York, NY, USA, 2019. [Google Scholar]
- Wilson, E.B.; Decius, J.C.; Cross, P.C. Molecular Vibrations; McGraw-Hill: New York, NY, USA, 1955. [Google Scholar]
- Wilson, E.B., Jr. A Method of Obtaining the Expanded Secular Equation for the Vibration Frequencies of a Molecule. J. Chem. Phys. 1939, 7, 1047–1052. [Google Scholar] [CrossRef]
- Woodward, L.A. Introduction to the Theory of Molecular Vibrations and Vibrational Spectroscopy; Oxford University Press: Oxford, UK, 1972. [Google Scholar]
- Califano, S. Vibrational States; Wiley: London, UK, 1976. [Google Scholar]
- Kelley, J.D.; Leventhal, J.J. Problems in Classical and Quantum Mechanics: Normal Modes and Coordinates; Springer: Cham, Switzerland, 2017; pp. 95–117. [Google Scholar]
- Groner, P. Normal Coordinate Analysis; Wiley: New York, NY, USA, 2006. [Google Scholar]
- Neto, N. Tensor Formalism in Anharmonic Calculations. Chem. Phys. 1984, 91, 89–100. [Google Scholar] [CrossRef]
- Stare, J. First-Principle Calculation of Reduced Masses in Vibrational Analysis Using Generalized Internal Coordinates: Some Crucial Aspects and Examples. J. Chem. Inf. Model. 2007, 47, 840–850. [Google Scholar] [CrossRef]
- Zou, W.; Cremer, D. C2 in a Box: Determining its Intrinsic Bond Strength for the X1Σ+g Ground State. Chem. Eur. J. 2016, 22, 4087–4097. [Google Scholar] [CrossRef]
- Oomens, J.; Kraka, E.; Nguyen, M.K.; Morton, T.M. Structure, Vibrational Spectra, and Unimolecular Dissociation of Gaseous 1-Fluoro-1-phenethyl Cations. J. Phys. Chem. A 2008, 112, 10774–10783. [Google Scholar] [CrossRef]
- Zou, W.; Kalescky, R.; Kraka, E.; Cremer, D. Relating Normal Vibrational Modes to Local Vibrational Modes: Benzene and Naphthalene. J. Mol. Model. 2012, 19, 2865–2877. [Google Scholar] [CrossRef] [PubMed]
- Kalescky, R.; Kraka, E.; Cremer, D. Identification of the Strongest Bonds in Chemistry. J. Phys. Chem. A 2013, 117, 8981–8995. [Google Scholar] [CrossRef] [PubMed]
- Kalescky, R.; Kraka, E.; Cremer, D. Description of Aromaticity with the Help of Vibrational Spectroscopy: Anthracene and Phenanthrene. J. Phys. Chem. A 2013, 118, 223–237. [Google Scholar] [CrossRef]
- Kalescky, R.; Kraka, E.; Cremer, D. New Approach to Tolman’s Electronic Parameter Based on Local Vibrational Modes. Inorg. Chem. 2013, 53, 478–495. [Google Scholar] [CrossRef] [PubMed]
- Kalescky, R.; Kraka, E.; Cremer, D. Are Carbon-Halogen Double and Triple Bonds Possible? Int. J. Quantum Chem. 2014, 114, 1060–1072. [Google Scholar] [CrossRef]
- Kalescky, R.; Zou, W.; Kraka, E.; Cremer, D. Quantitative Assessment of the Multiplicity of Carbon-Halogen Bonds: Carbenium and Halonium Ions with F, Cl, Br, and I. J. Phys. Chem. A 2014, 118, 1948–1963. [Google Scholar] [CrossRef]
- Humason, A.; Zou, W.; Cremer, D. 11,11-Dimethyl-1,6-methano[10]annulene-An Annulene with an Ultralong CC Bond or a Fluxional Molecule? J. Phys. Chem. A 2014, 119, 1666–1682. [Google Scholar] [CrossRef]
- Sethio, D.; Daku, L.M.L.; Hagemann, H.; Kraka, E. Quantitative Assessment of B–B–B, B–Hb–B, and B–Ht Bonds: From BH3 to B12H122-. ChemPhysChem 2019, 20, 1967–1977. [Google Scholar] [CrossRef] [PubMed]
- Makoś, M.Z.; Freindorf, M.; Sethio, D.; Kraka, E. New Insights into Fe–H2 and Fe–H− Bonding of a [NiFe] Hydrogenase Mimic—A Local Vibrational Mode Study. Theor. Chem. Acc. 2019, 138, 76. [Google Scholar] [CrossRef]
- Makoś, M.Z.; Zou, W.; Freindorf, M.; Kraka, E. Metal-Ring Interactions in Actinide Sandwich Compounds: A Combined Normalized Elimination of the Small Component and Local Vibrational Mode Study. Mol. Phys. 2020, 118, e1768314. [Google Scholar] [CrossRef]
- Verma, N.; Tao, Y.; Zou, W.; Chen, X.; Chen, X.; Freindorf, M.; Kraka, E. A Critical Evaluation of Vibrational Stark Effect (VSE) Probes with the Local Vibrational Mode Theory. Sensors 2020, 20, 2358. [Google Scholar] [CrossRef] [Green Version]
- Freindorf, M.; Kraka, E. Critical Assessment of the FeC and CO Bond strength in Carboxymyoglobin—A QM/MM Local Vibrational Mode Study. J. Mol. Model. 2020, 26, 281. [Google Scholar] [CrossRef] [PubMed]
- Kraka, E.; Freindorf, M. Characterizing the Metal Ligand Bond Strength via Vibrational Spectroscopy: The Metal Ligand Electronic Parameter (MLEP). In Topics in Organometallic Chemistry—New Directions in the Modeling of Organometallic Reactions; Lledós, A., Ujaque, G., Eds.; Springer: Berlin/Heidelberg, Germany, 2020; Volume 67, pp. 1–43. [Google Scholar]
- Freindorf, M.; Kraka, E.; Cremer, D. A Comprehensive Analysis of Hydrogen Bond Interactions Based on Local Vibrational Modes. Int. J. Quantum Chem. 2012, 112, 3174–3187. [Google Scholar] [CrossRef]
- Kalescky, R.; Zou, W.; Kraka, E.; Cremer, D. Local Vibrational Modes of the Water Dimer—Comparison of Theory and Experiment. Chem. Phys. Lett. 2012, 554, 243–247. [Google Scholar] [CrossRef]
- Kalescky, R.; Kraka, E.; Cremer, D. Local Vibrational Modes of the Formic Acid Dimer—The Strength of the Double H-Bond. Mol. Phys. 2013, 111, 1497–1510. [Google Scholar] [CrossRef]
- Kraka, E.; Freindorf, M.; Cremer, D. Chiral Discrimination by Vibrational Spectroscopy Utilizing Local Modes. Chirality 2013, 25, 185–196. [Google Scholar] [CrossRef] [PubMed]
- Setiawan, D.; Kraka, E.; Cremer, D. Description of Pnicogen Bonding with the help of Vibrational Spectroscopy—The Missing Link Between Theory and Experiment. Chem. Phys. Lett. 2014, 614, 136–142. [Google Scholar] [CrossRef]
- Setiawan, D.; Kraka, E.; Cremer, D. Strength of the Pnicogen Bond in Complexes Involving Group VA Elements N, P, and As. J. Phys. Chem. A 2014, 119, 1642–1656. [Google Scholar] [CrossRef]
- Setiawan, D.; Kraka, E.; Cremer, D. Hidden Bond Anomalies: The Peculiar Case of the Fluorinated Amine Chalcogenides. J. Phys. Chem. A 2015, 119, 9541–9556. [Google Scholar] [CrossRef]
- Kraka, E.; Setiawan, D.; Cremer, D. Re-Evaluation of the Bond Length-Bond Strength Rule: The Stronger Bond Is not Always the Shorter Bond. J. Comp. Chem. 2015, 37, 130–142. [Google Scholar] [CrossRef]
- Zhang, X.; Dai, H.; Yan, H.; Zou, W.; Cremer, D. B-H π Interaction: A New Type of Nonclassical Hydrogen Bonding. J. Am. Chem. Soc. 2016, 138, 4334–4337. [Google Scholar] [CrossRef] [PubMed]
- Setiawan, D.; Cremer, D. Super-Pnicogen Bonding in the Radical Anion of the Fluorophosphine Dimer. Chem. Phys. Lett. 2016, 662, 182–187. [Google Scholar] [CrossRef] [Green Version]
- Tao, Y.; Zou, W.; Jia, J.; Li, W.; Cremer, D. Different Ways of Hydrogen Bonding in Water—Why Does Warm Water Freeze Faster than Cold Water? J. Chem. Theory Comput. 2016, 13, 55–76. [Google Scholar] [CrossRef] [PubMed]
- Oliveira, V.; Cremer, D.; Kraka, E. The Many Facets of Chalcogen Bonding: Described by Vibrational Spectroscopy. J. Phys. Chem. A 2017, 121, 6845–6862. [Google Scholar] [CrossRef] [PubMed]
- Oliveira, V.; Kraka, E. Systematic Coupled Cluster Study of Noncovalent Interactions Involving Halogens, Chalcogens, and Pnicogens. J. Phys. Chem. A 2017, 121, 9544–9556. [Google Scholar] [CrossRef]
- Zou, W.; Zhang, X.; Dai, H.; Yan, H.; Cremer, D.; Kraka, E. Description of an Unusual Hydrogen Bond Between Carborane and a Phenyl Group. J. Organomet. Chem. 2018, 865, 114–127. [Google Scholar] [CrossRef]
- Lyu, S.; Beiranvand, N.; Freindorf, M.; Kraka, E. Interplay of Ring Puckering and Hydrogen Bonding in Deoxyribonucleosides. J. Phys. Chem. A 2019, 123, 7087–7103. [Google Scholar] [CrossRef]
- Yannacone, S.; Sethio, D.; Kraka, E. Quantitative Assessment of Intramolecular Hydrogen Bonds in Neutral Histidine. Theor. Chem. Acc. 2020, 139, 125. [Google Scholar] [CrossRef]
- Martins, J.; Quintino, R.P.; Politi, J.R.S.; Sethio, D.; Gargano, R.; Kraka, E. Computational Analysis of Vibrational Frequencies and Rovibrational Spectroscopic Constants of Hydrogen Sulfide Dimer using MP2 and CCSD(T). Spectrochim. Acta A 2020, 239, 118540. [Google Scholar] [CrossRef]
- Yannacone, S.; Freindorf, M.; Tao, Y.; Zou, W.; Kraka, E. Local Vibrational Mode Analysis of π-Hole Interactions between Aryl Donors and Small Molecule Acceptors. Crystals 2020, 10, 556. [Google Scholar] [CrossRef]
- Goldberg, J.M.; Wong, G.W.; Brastow, K.E.; Kaminsky, W.; Goldberg, K.I.; Heinekey, D.M. The Importance of Steric Factors in Iridium Pincer Complexes. Organometallics 2015, 34, 753–762. [Google Scholar] [CrossRef]
- Goldberg, J.M.; Cherry, S.D.T.; Guard, L.M.; Kaminsky, W.; Goldberg, K.I.; Heinekey, D.M. Hydrogen Addition to (pincer)IrI(CO) Complexes: The Importance of Steric and Electronic Factors. Organometallics 2016, 35, 3546–3556. [Google Scholar] [CrossRef]
- Makiura, R.; Nagasawa, I.; Kimura, N.; Ishimaru, S.; Kitagawa, H.; Ikeda, R. An unusual six–co–ordinate platinum(II) complex containing a neutral I2 ligand. Chem. Commun. 2001, 2001, 1642–1643. [Google Scholar]
- Luo, Y.R. Comprehensive Handbook of Chemical Bond Energies; Taylor and Francis: Boca Raton, FL, USA, 2007. [Google Scholar]
- Moltved, K.A.; Kepp, K.P. Chemical Bond Energies of 3d Transition Metals Studied by Density Functional Theory. J. Chem. Theory Comput. 2018, 14, 3479–3492. [Google Scholar] [CrossRef] [PubMed] [Green Version]
- Morse, M.D. Predissociation measurements of bond dissociation energies. Acc. Chem. Res. 2018, 52, 119–126. [Google Scholar] [CrossRef]
- Setiawan, D.; Sethio, D.; Cremer, D.; Kraka, E. From Strong to Weak NF Bonds: On the Design of a New Class of Fluorinating Agents. Phys. Chem. Chem. Phys. 2018, 20, 23913–23927. [Google Scholar] [CrossRef]
- Sethio, D.; Oliveira, V.; Kraka, E. Quantitative Assessment of Tetrel Bonding Utilizing Vibrational Spectroscopy. Molecules 2018, 23, 2763. [Google Scholar] [CrossRef] [Green Version]
- Pyykkö, P. Relativistic Effects in Chemistry: More Common Than You Thought. Annu. Rev. Phys. Chem. 2012, 63, 45–64. [Google Scholar] [CrossRef] [PubMed]
- Kraka, E.; Filatov, M.; Cremer, D. Comparison of Gold Bonding with Mercury Bonding. Croat. Chim. Acta 2009, 82, 233–243. [Google Scholar]
- Kaupp, M.; Danovich, D.; Shaik, S. Chemistry is about energy and its changes: A critique of bond-length/bond-strength correlations. Coord. Chem. Rev. 2017, 344, 355–362. [Google Scholar] [CrossRef]
- Kraka, E.; Cremer, D. Weaker Bonds with Shorter Bond Lengths. Revista Processos Químicos 2012, 6, 31–34. [Google Scholar] [CrossRef]
- Mitoraj, M.; Michalak, A. Donor–Acceptor Properties of Ligands from the Natural Orbitals for Chemical Valence. Organometallics 2007, 26, 6576–6580. [Google Scholar] [CrossRef]
- Mitoraj, M.P.; Michalak, A. σ–Donor and π–Acceptor Properties of Phosphorus Ligands: An Insight from the Natural Orbitals for Chemical Valence. Inorg. Chem. 2010, 49, 578–582. [Google Scholar] [CrossRef]
- Iliaš, M.; Pershina, V. Carbonyl compounds of Rh, Ir, and Mt: Electronic structure, bonding and volatility. Phys. Chem. Chem. Phys. 2020, 22, 18681–18694. [Google Scholar] [CrossRef]
Figure 1.
Sketches of complexes 1–20 investigated in this work.

Figure 2.
(a) Difference electron density distribution (r) for complex 1. (r) is plotted for an electron density surface with a constant density value of 0.001 a.u. Blue regions indicate an increase in the electron density, red regions a density decrease relative to the superimposed density of the I2 and the Pt complex. (b) NBO charge transfer mechanism and CT delocalization energies given in kcal/mol. (c) Electrostatic potential mapped onto the van der Waals surface (0.001 a.u. isodensity) of the pincer of complexes 1 and 2; ranging from −1.4 eV (red) to +1.4 eV (blue). PBE0–D3(BJ)/aug–cc–pVTZ/PP(M,I) level of theory.

Figure 3.
(a) Power relationship between bond strength order (BSO) n and local stretching force constant for the M–I bonds; (b) Power relationship between bond strength order (BSO) n and local stretching force constant for the I–I bonds; (c) Correlation between M–I and I–I local mode force constants for 1–20. PBE0–D3(BJ)/aug–cc–pVTZ/PP(M,I) level of theory.

Figure 4.
(a) Correlation between binding energy and local stretching force constant of the M–I bonds; (b) Correlation between binding energy and local stretching force constant of the I–I bonds; (c) Bond length r versus local stretching force constant for the M–I bonds; (d) Bond length r versus local stretching force constant for the I–I bonds of molecules 1–20. PBE0–D3(BJ)/aug–cc–pVTZ/PP(M,I) level of theory.

Figure 5.
(a) Correlation between the electron density at the bond critical point and for the M–I bonds; (b) Correlation between the electron density and for the I–I bonds; (c) Correlation between the energy density at the bond critical point and for the M–I bonds; (d) Correlation between the energy density and for the I–I bonds of molecules 1–20. PBE0–D3(BJ)/aug–cc–pVTZ/PP(M,I) level of theory.

Figure 6.
(a) Correlation between charge transfer CT to the I–I bond and local stretching force constant for the M–I bond; (b) Correlation between charge transfer CT to the I–I bond and local stretching force constant for the I–I bond; (c) Correlation between the 3c–4e bond character of the M–I–I bonds given by BSO n(M–I)/BSO n(I–I) and the local stretching force constant of the M–I bond; (d) Correlation between the 3c–4e bond character of the M–I–I bonds given by BSO n(M–I)/BSO n(I–I) and the local stretching force constant of the I–I bond for 1–20. PBE0–D3(BJ)/aug–cc–pVTZ/PP(M,I) level of theory.

Figure 7.
Atomic charges of Pt and I atoms of 1 in the gas phase (blue), in benzene (green) and in acetone (red). PBE0–D3(BJ)/aug–cc–pVTZ/PP(M,I)/SMD level of theory.
Figure 7.
Atomic charges of Pt and I atoms of 1 in the gas phase (blue), in benzene (green) and in acetone (red). PBE0–D3(BJ)/aug–cc–pVTZ/PP(M,I)/SMD level of theory.


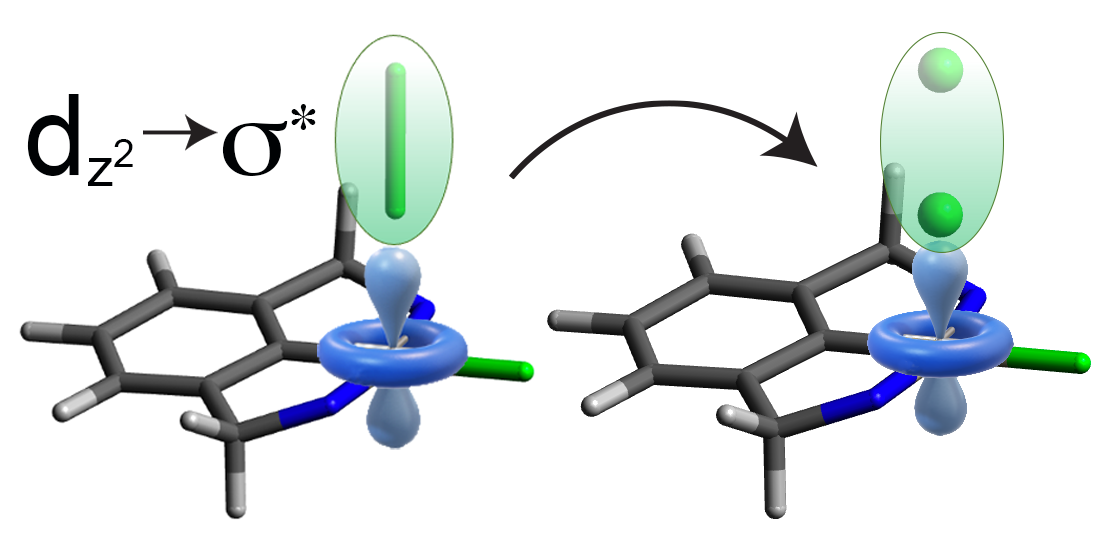
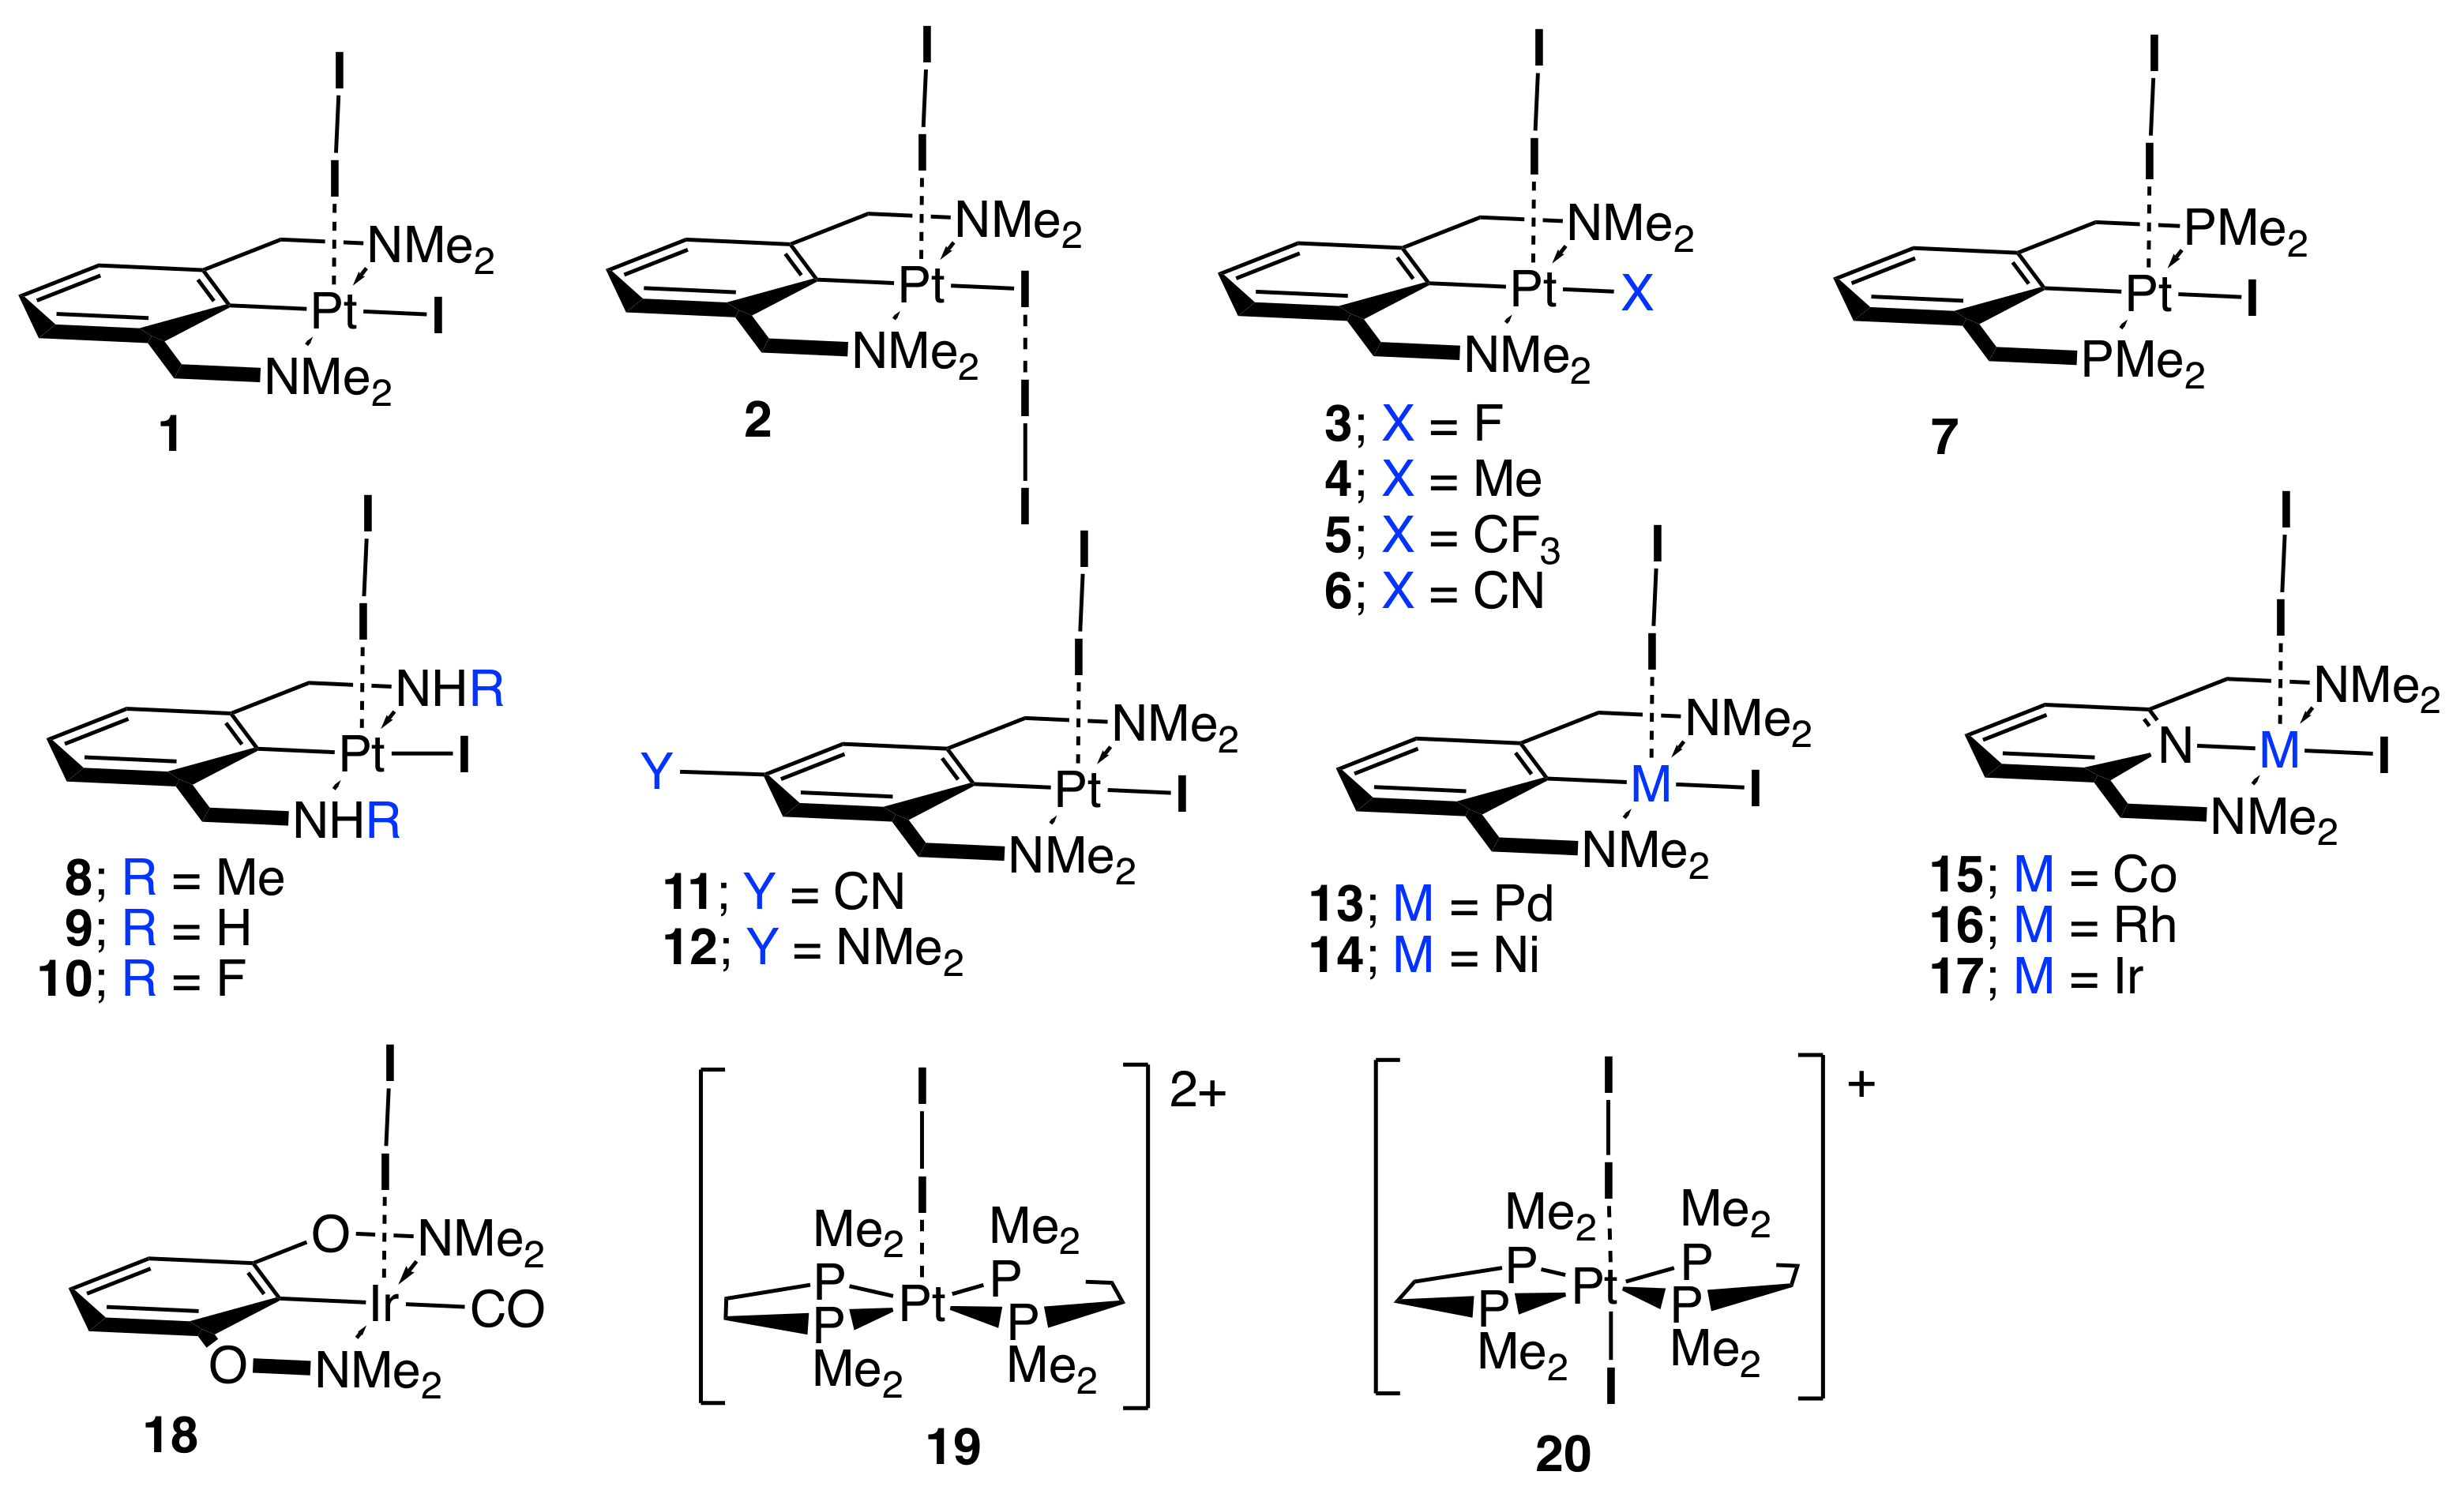
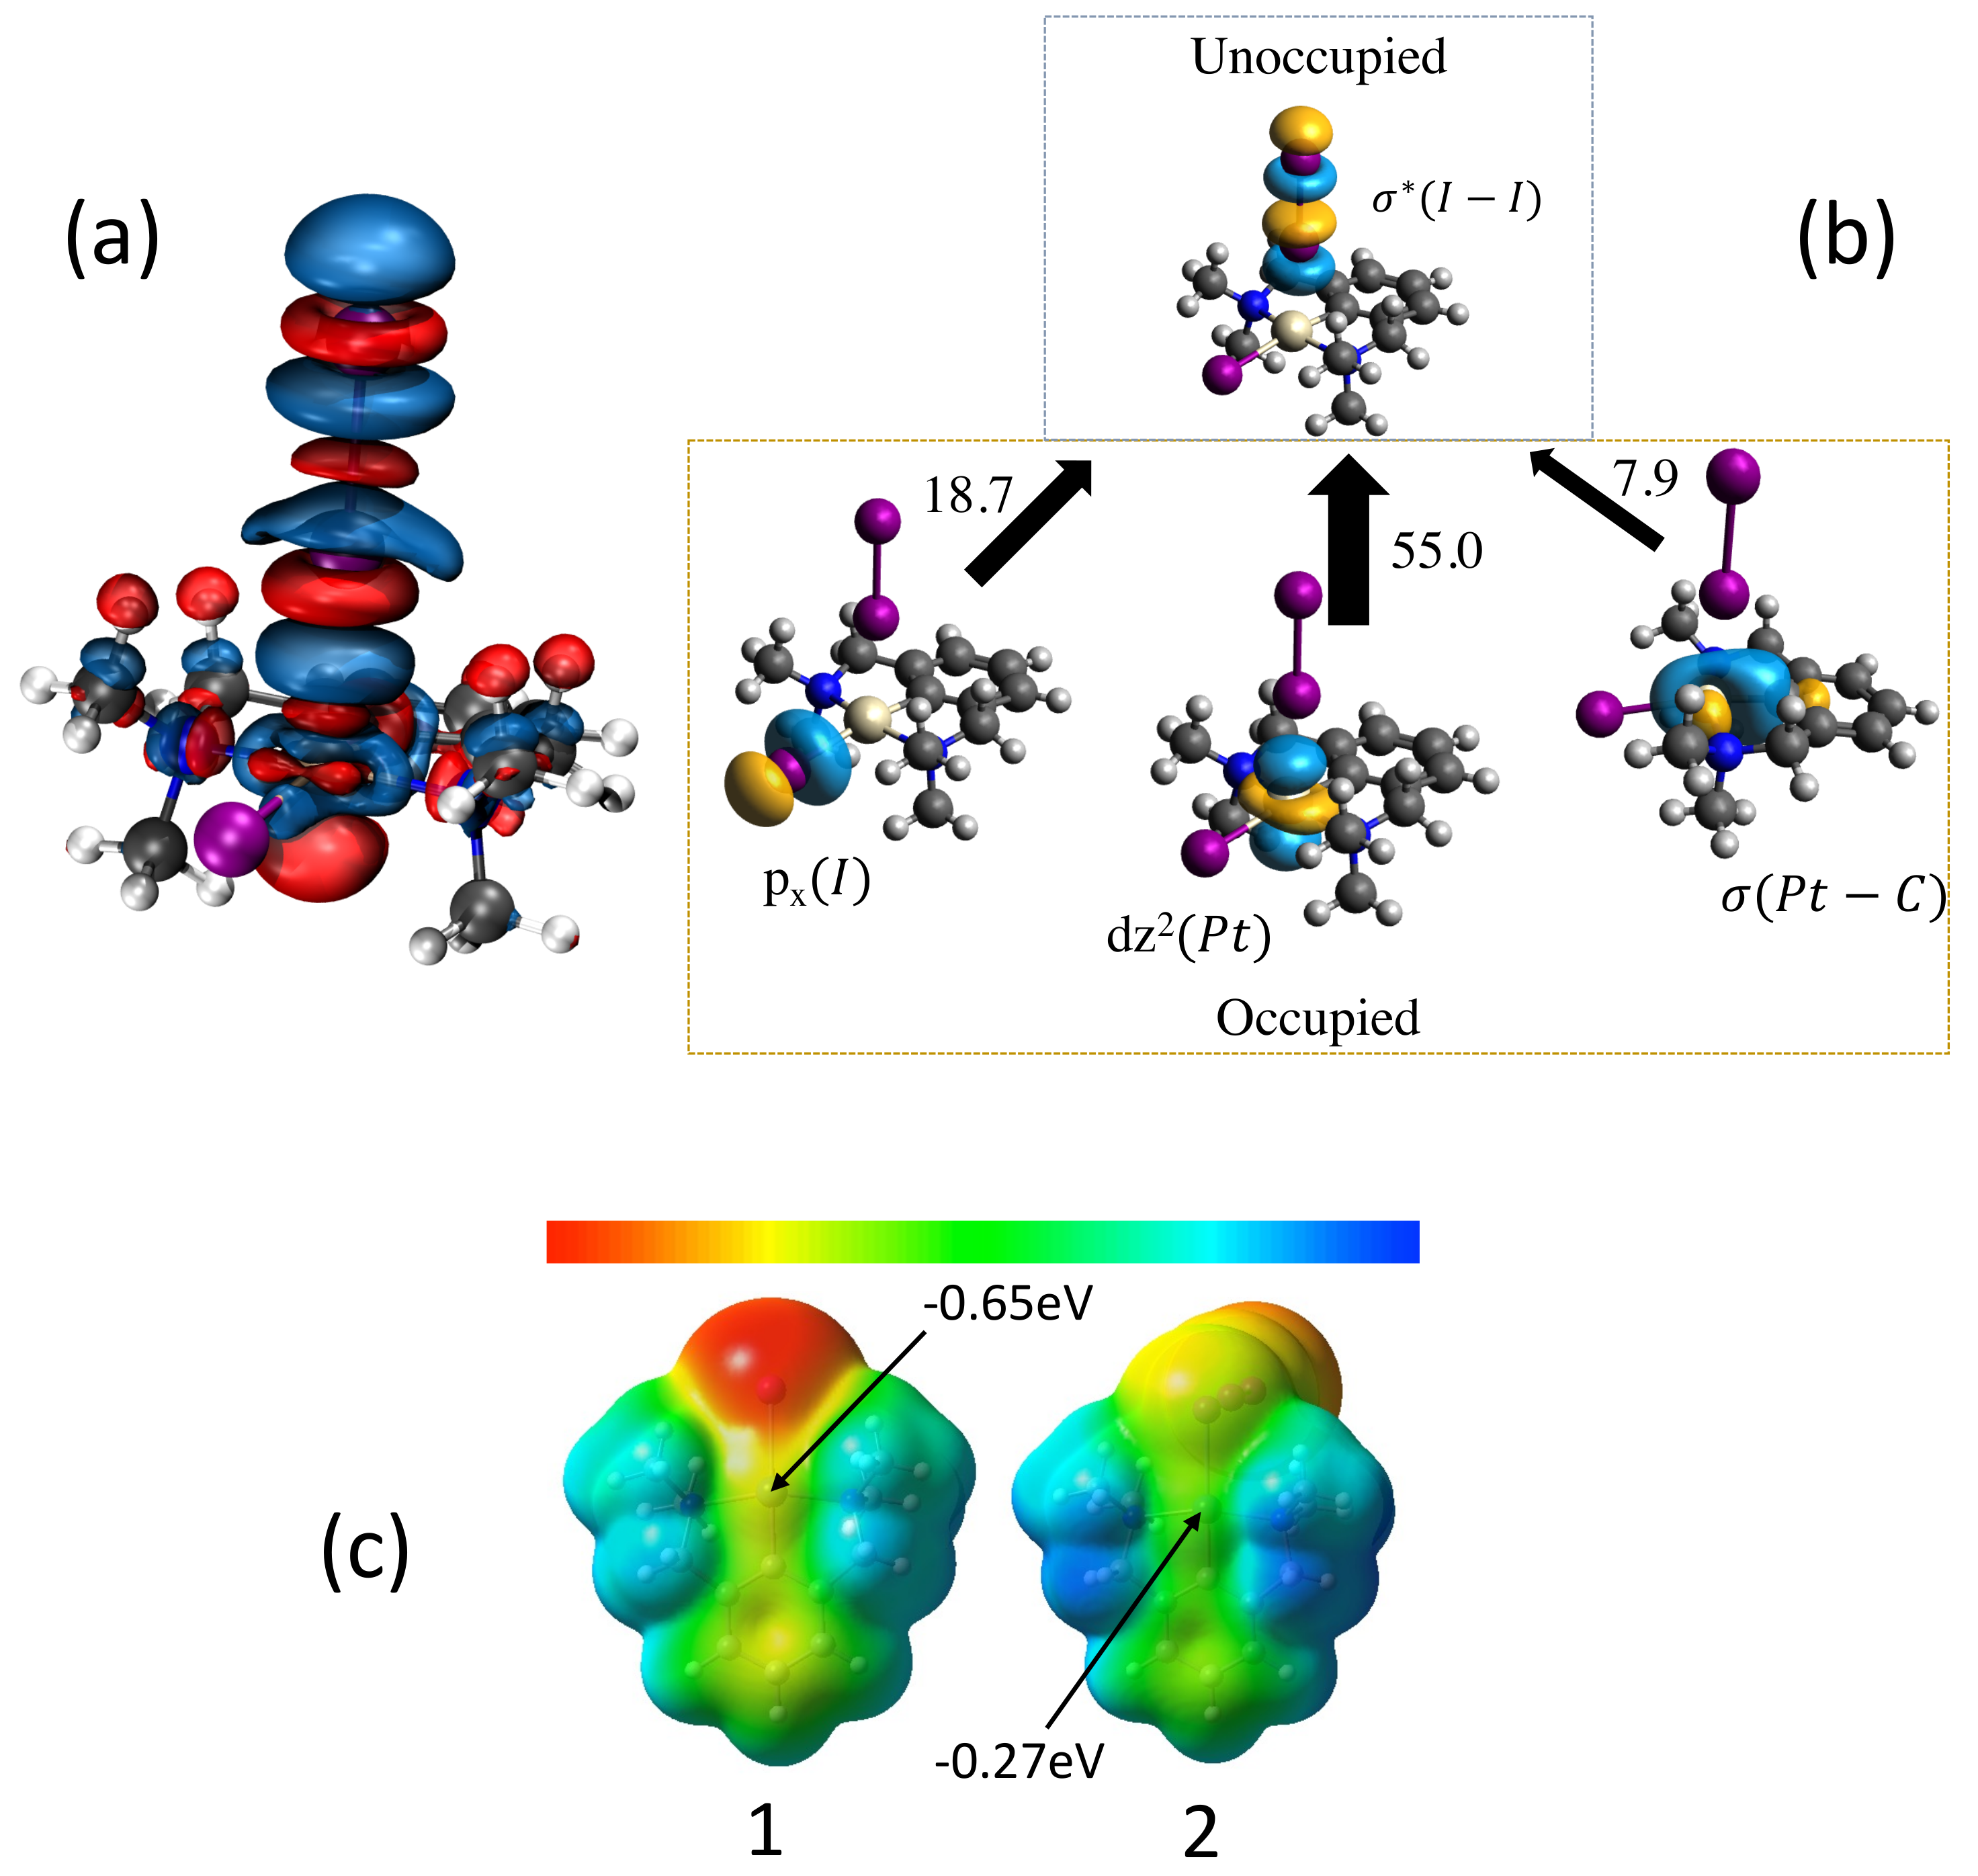
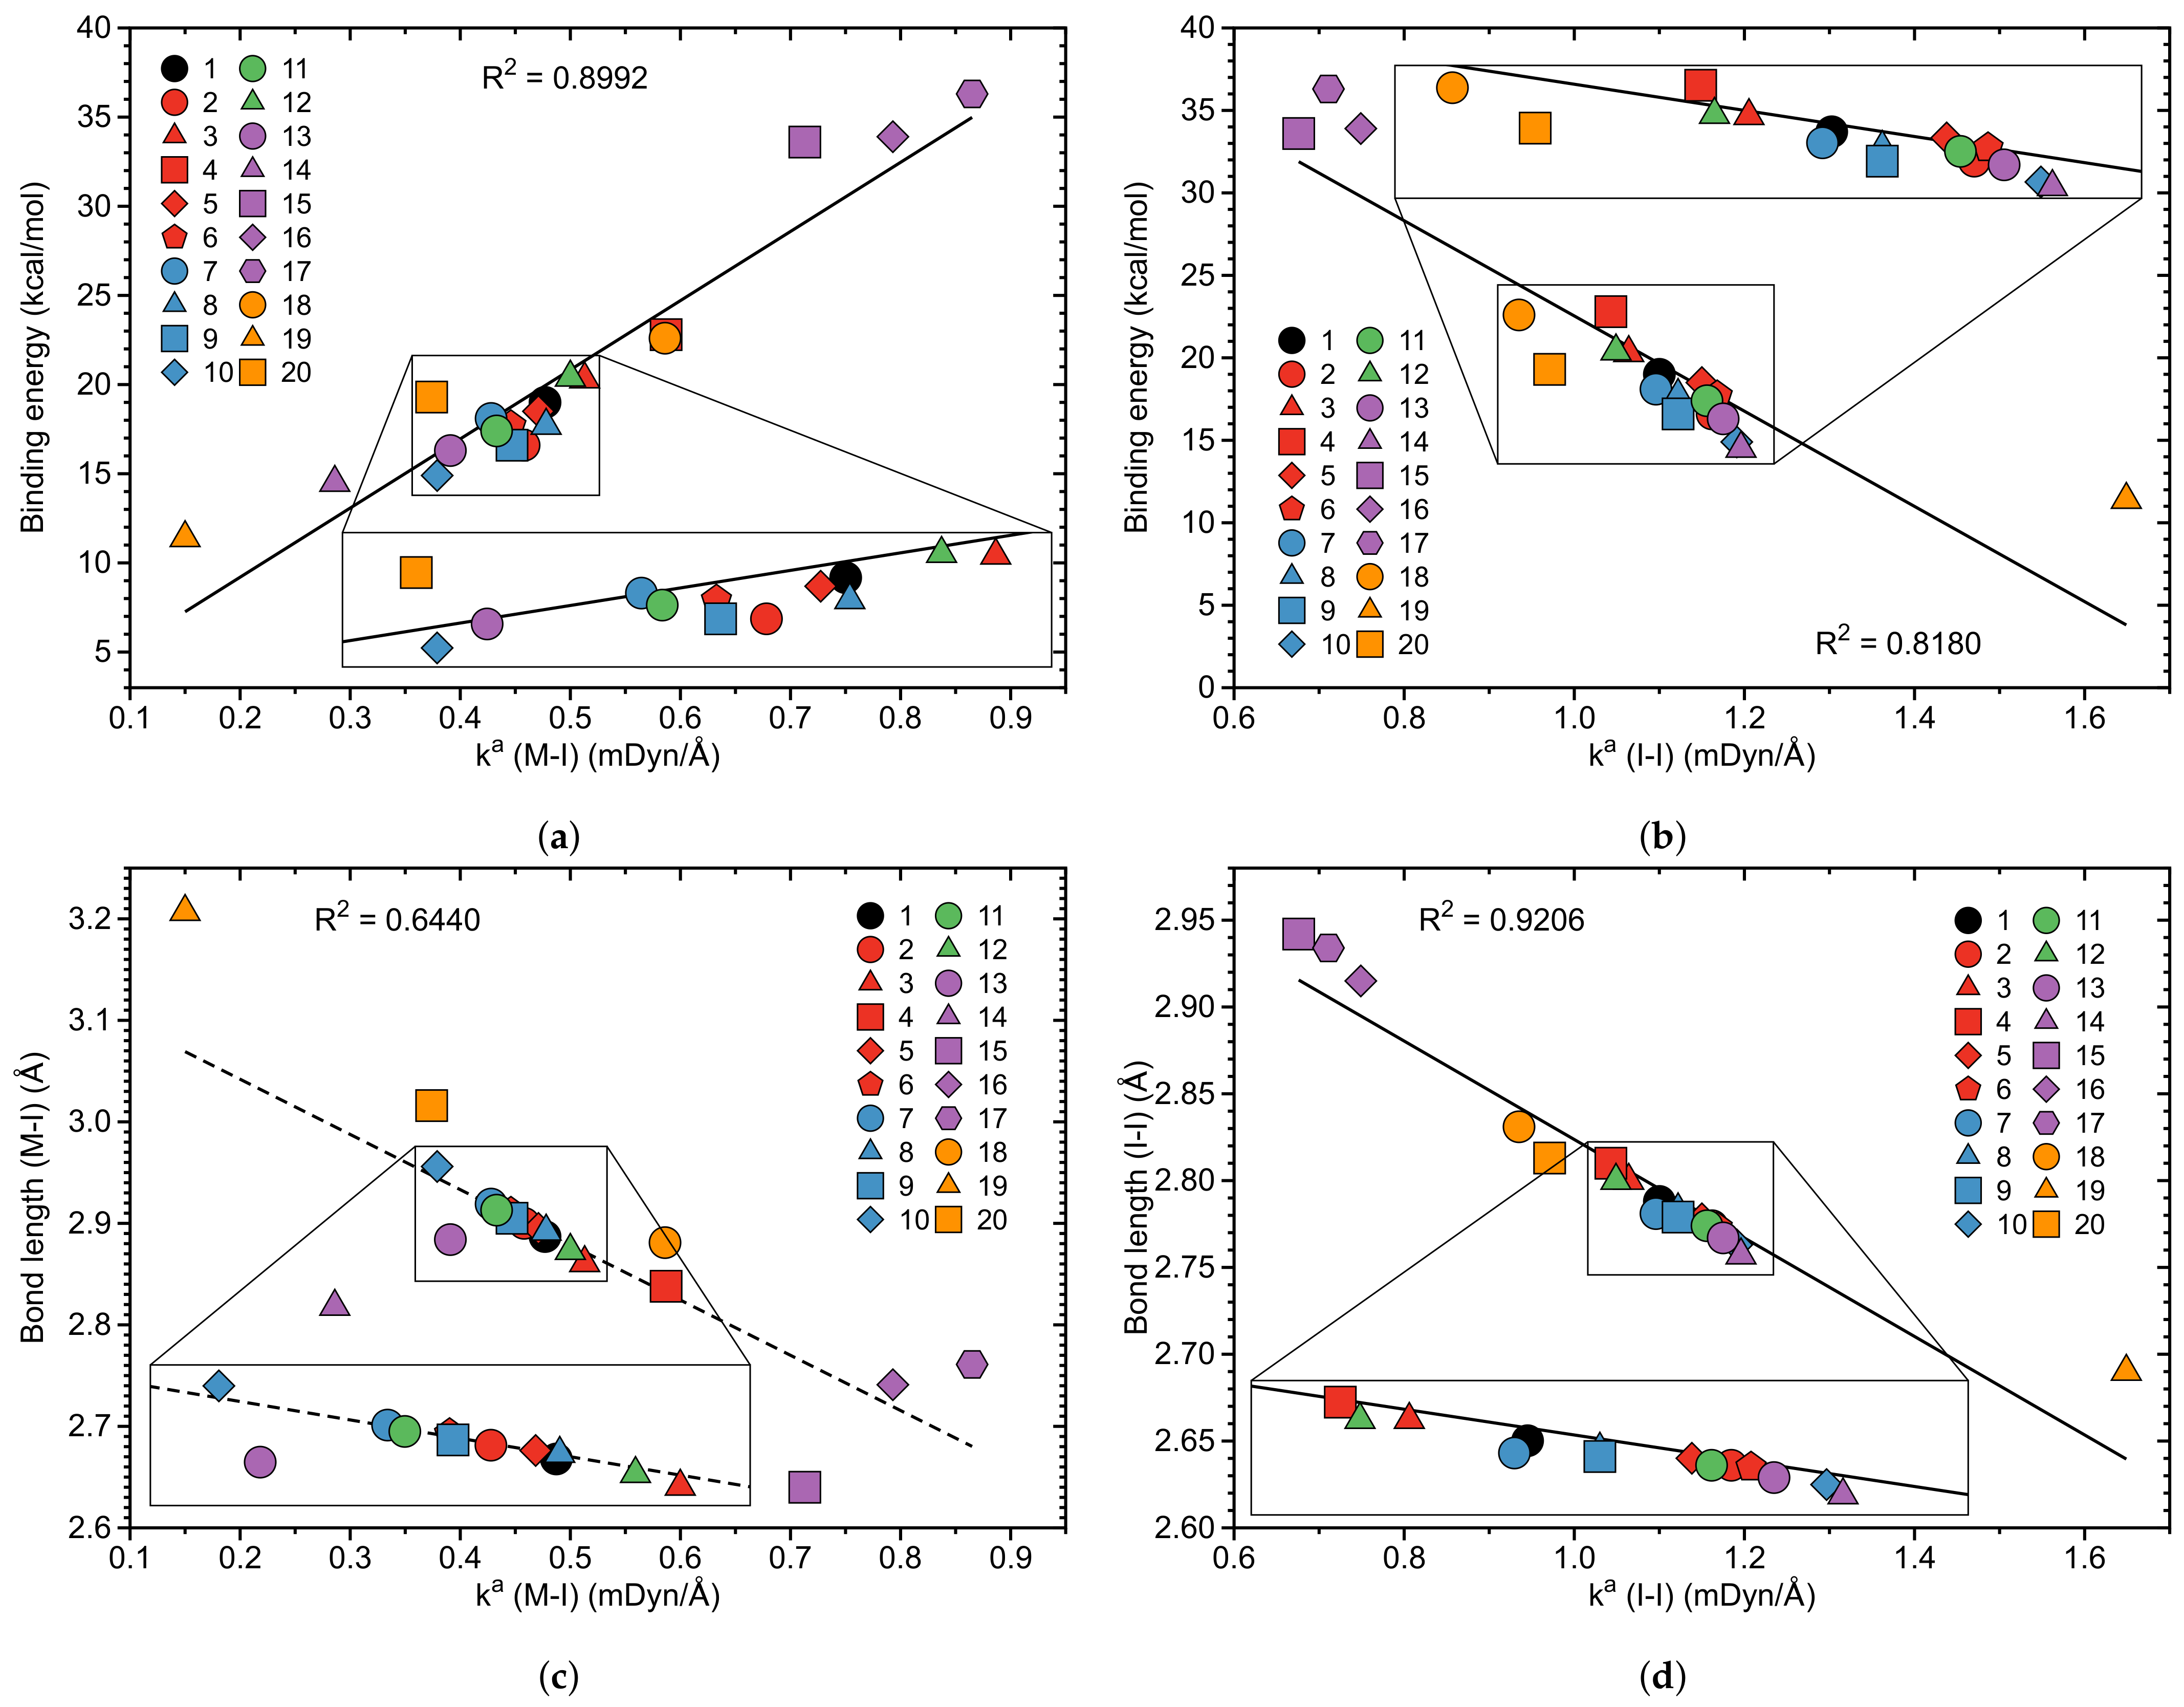
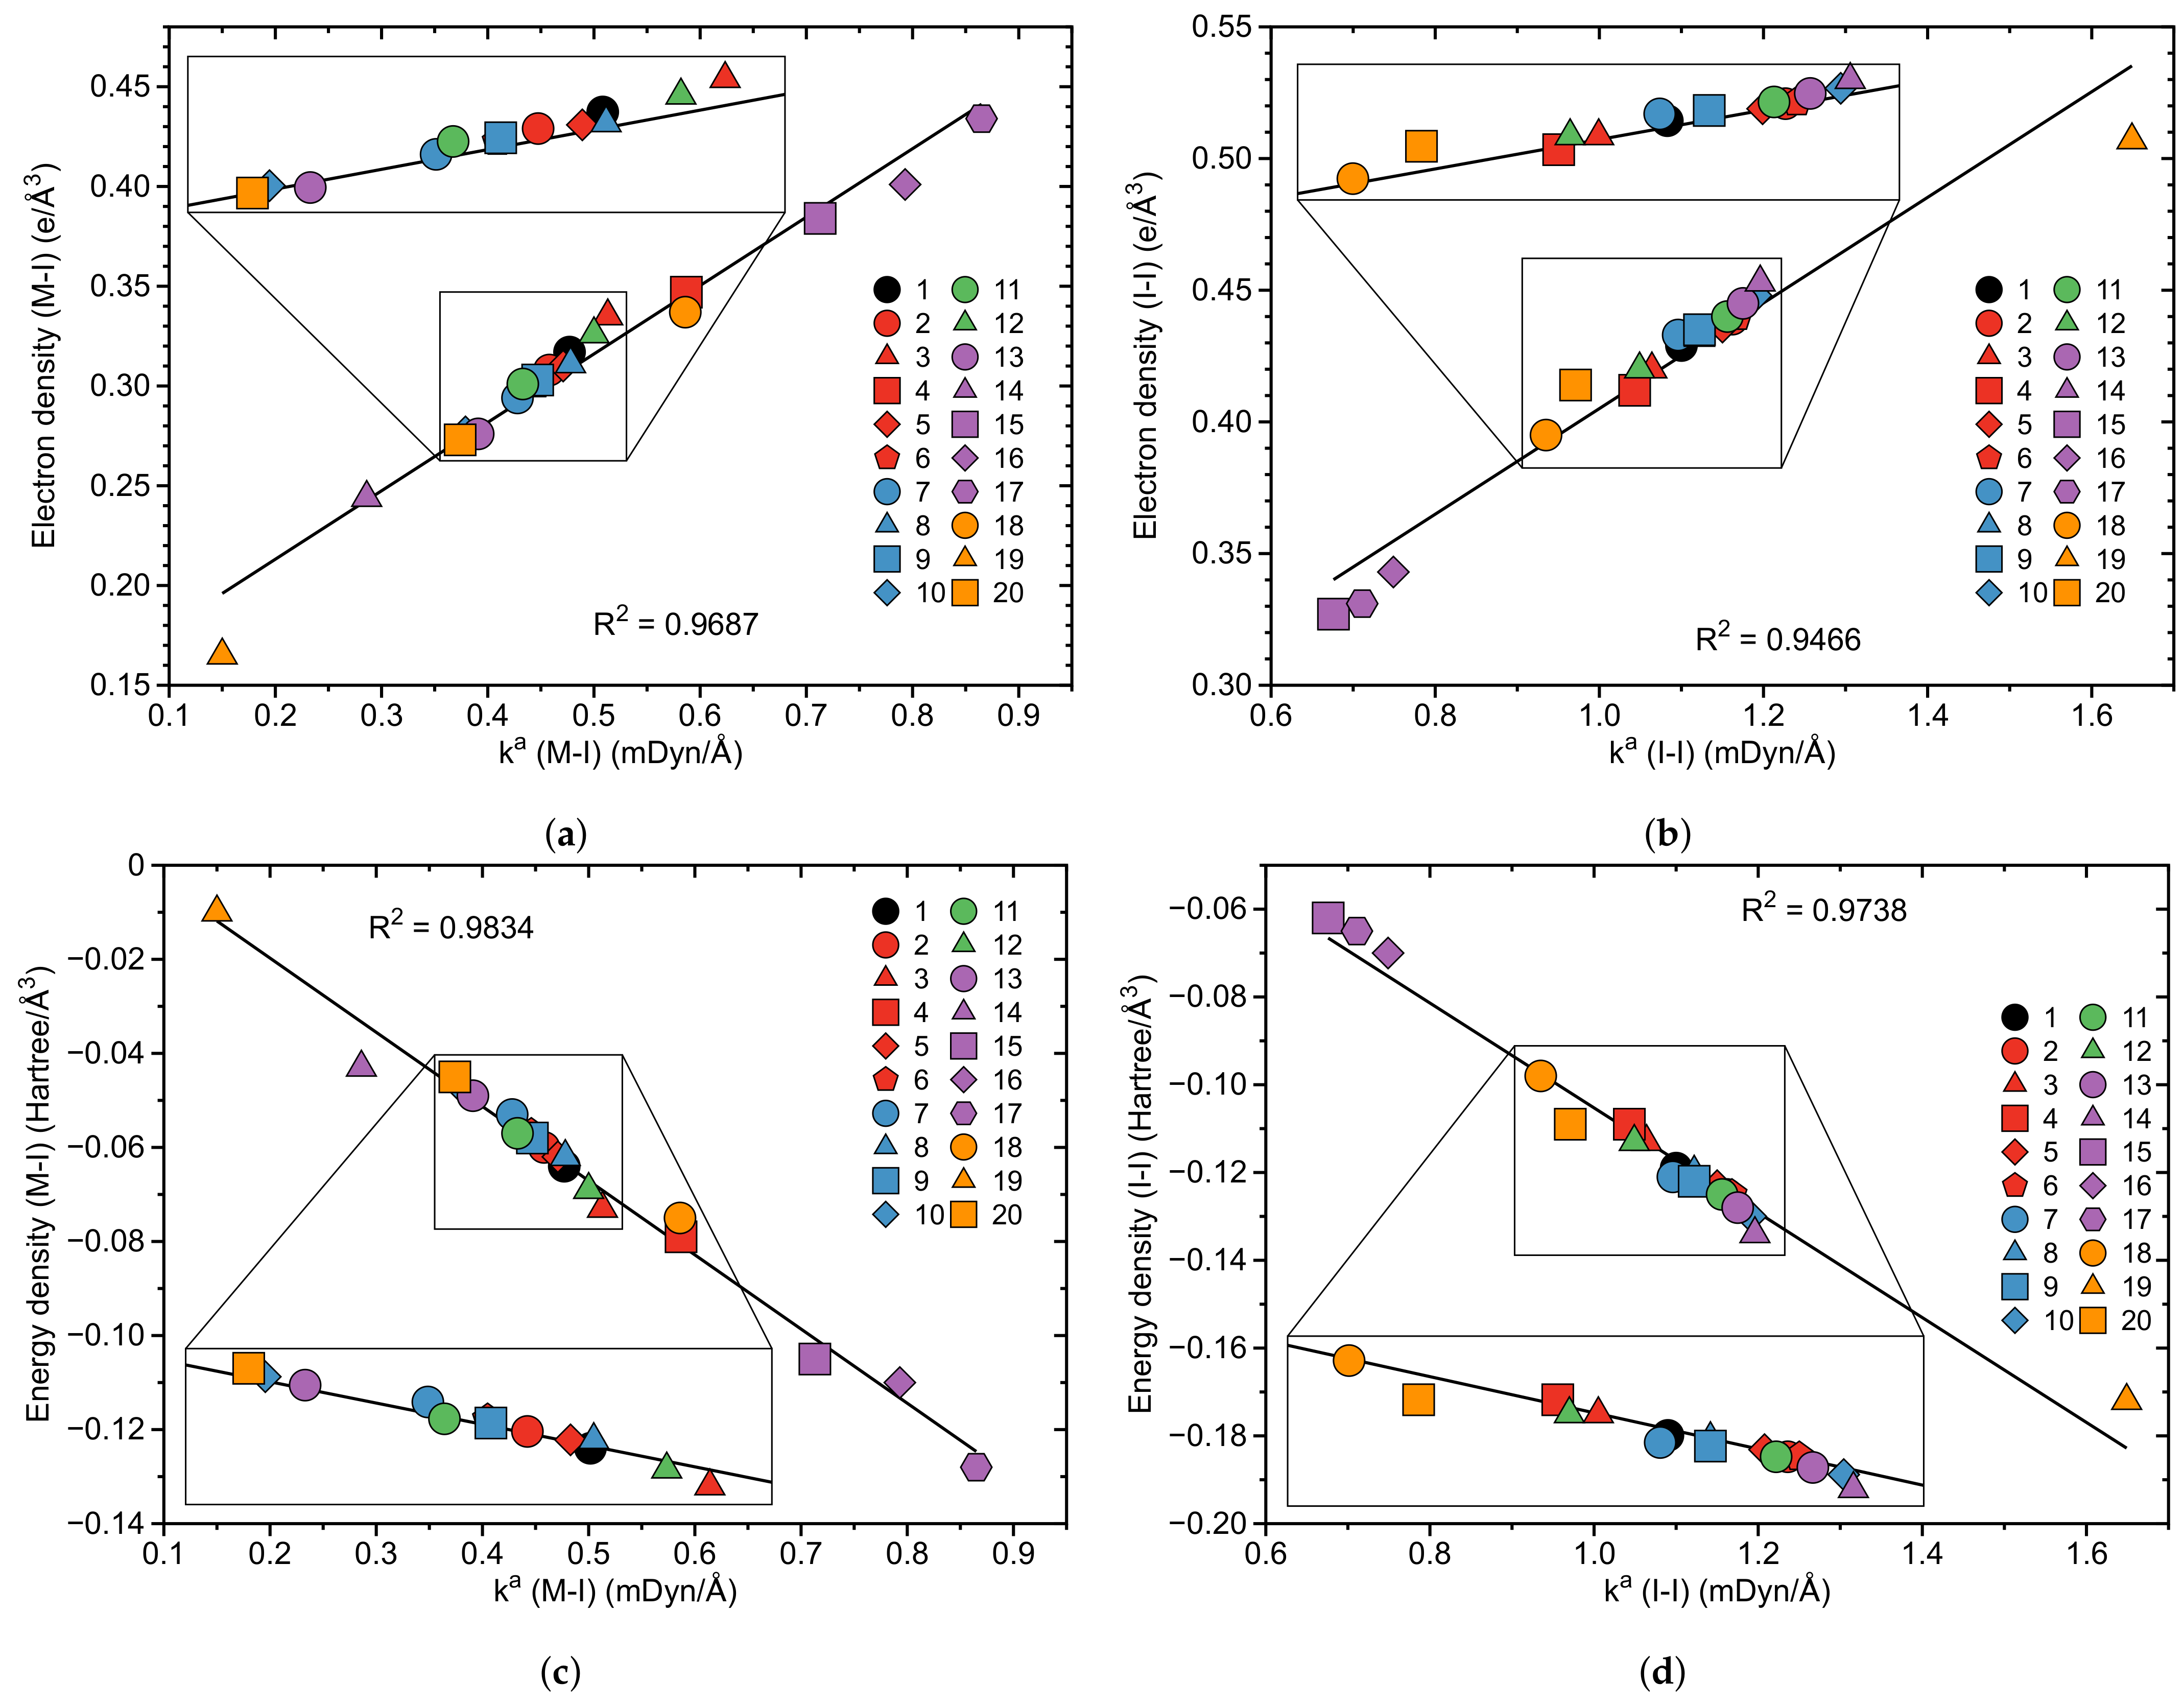
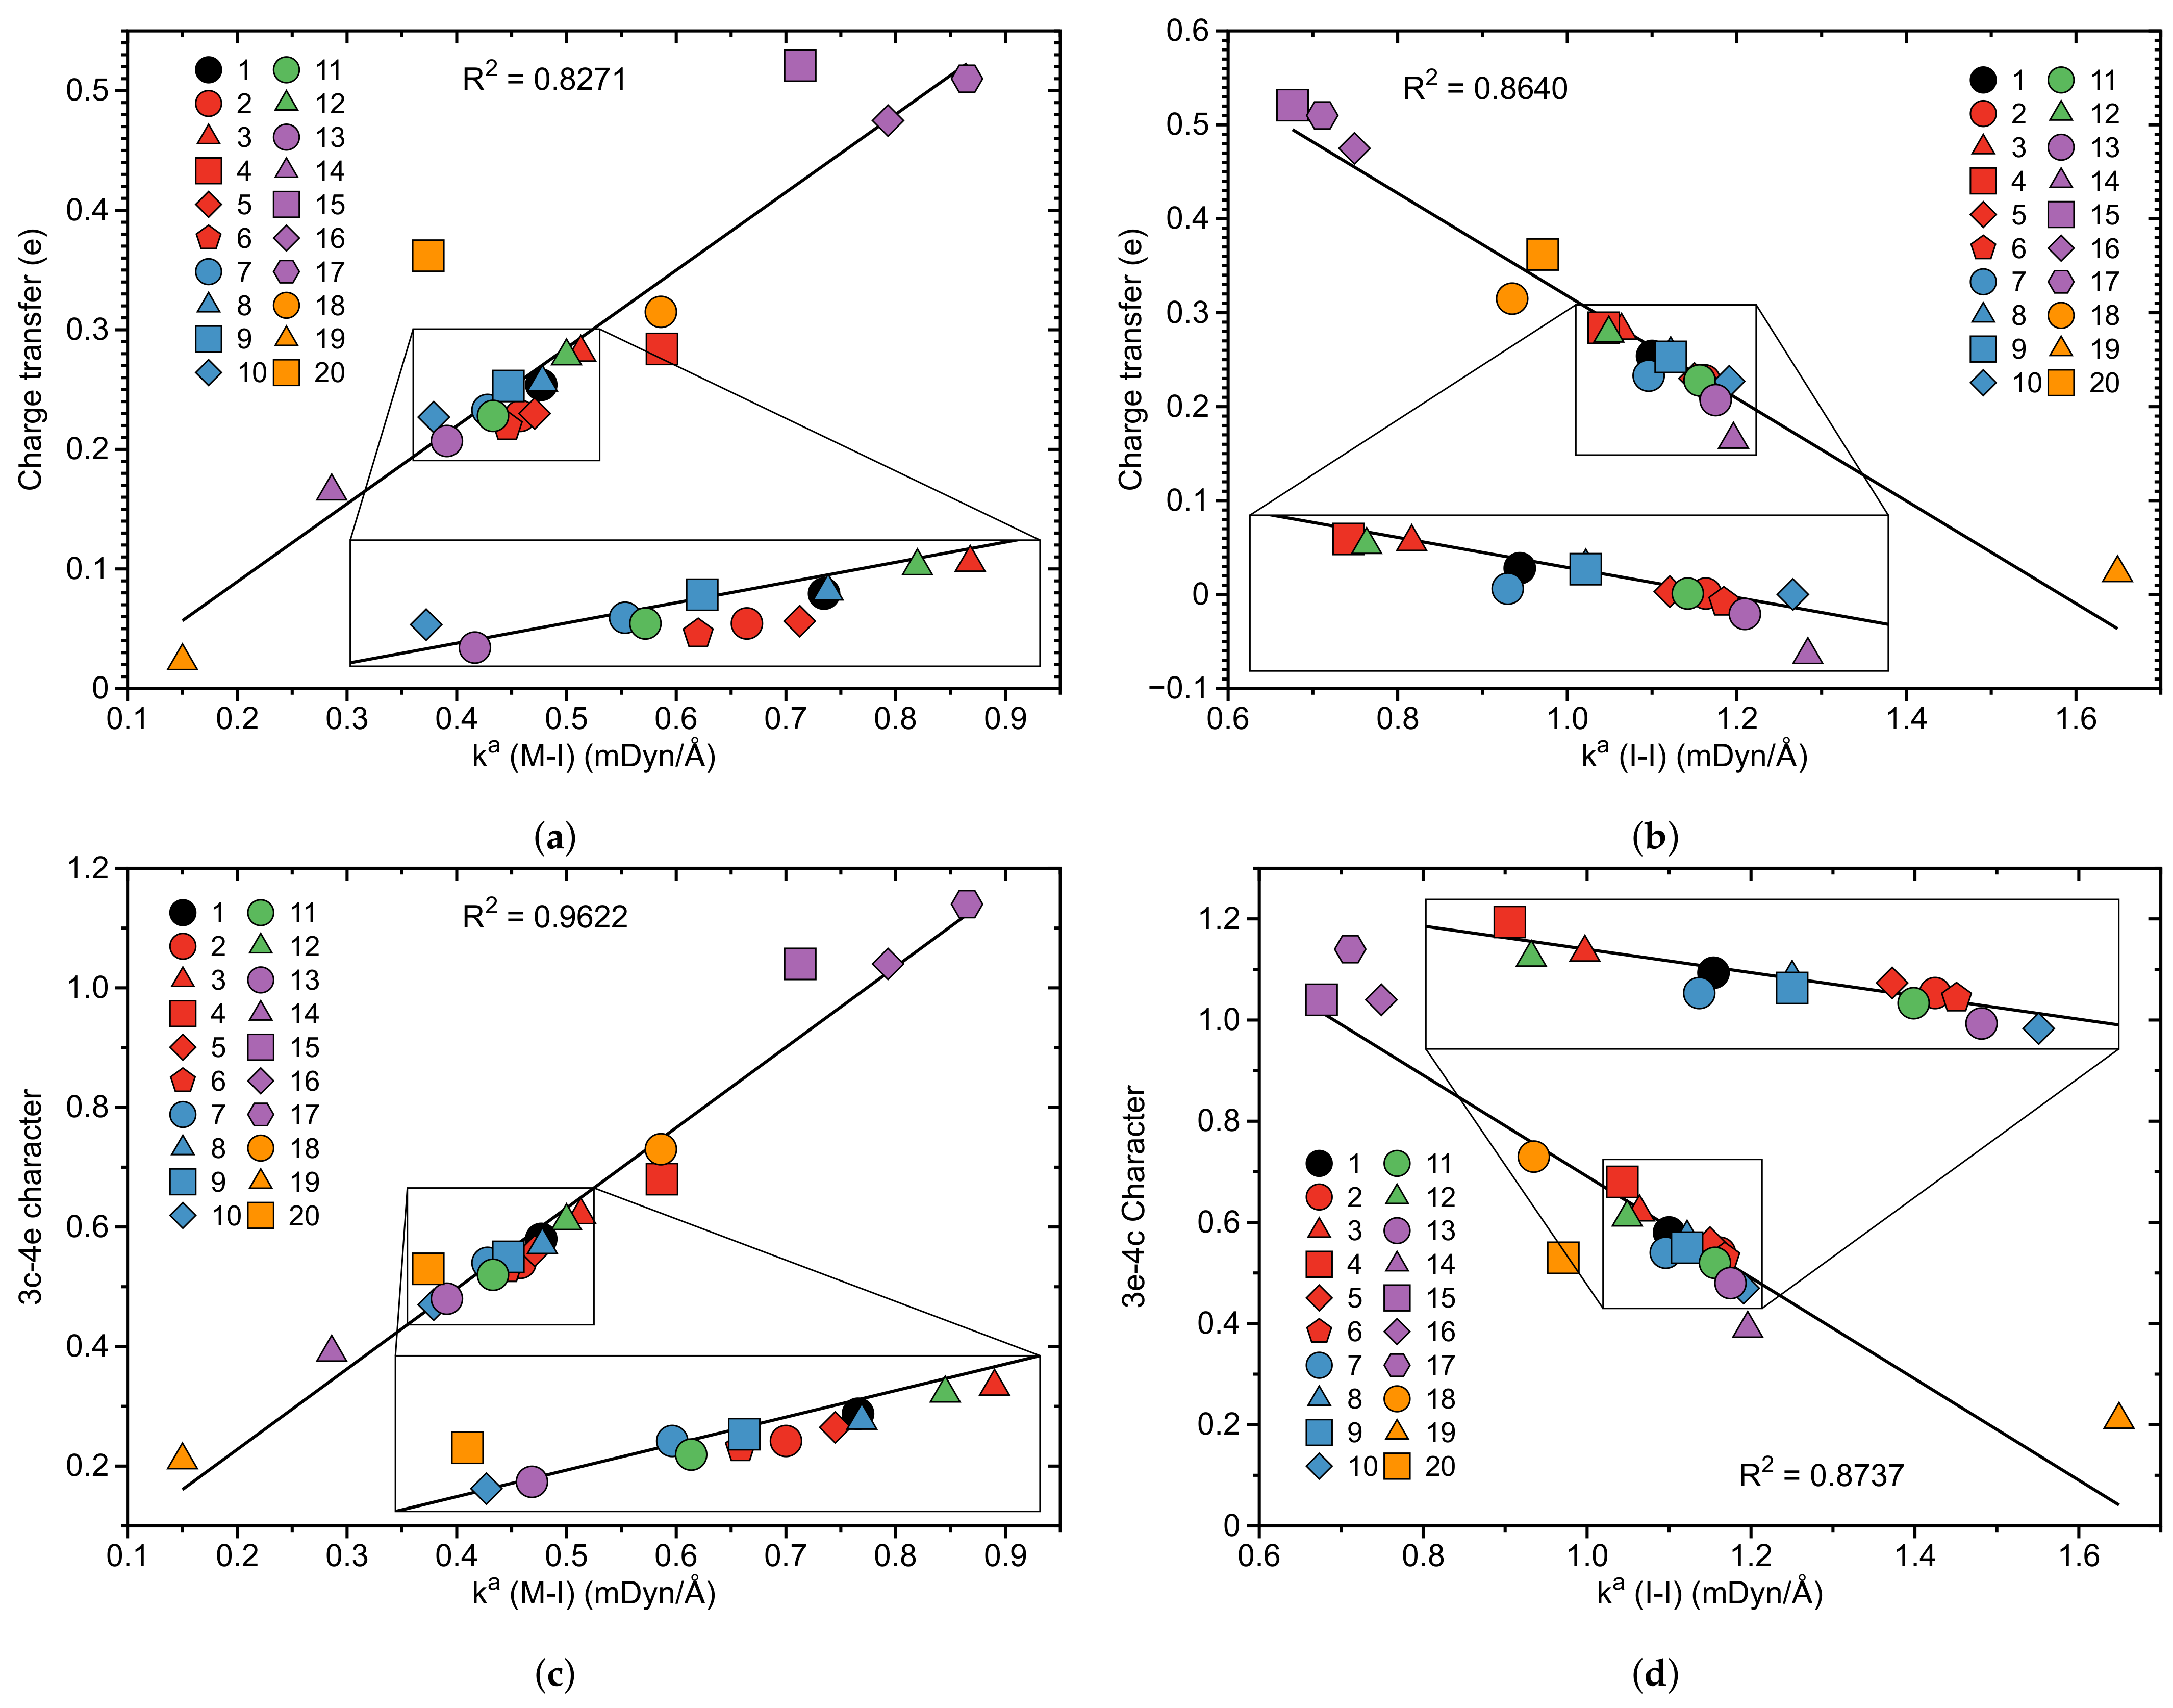
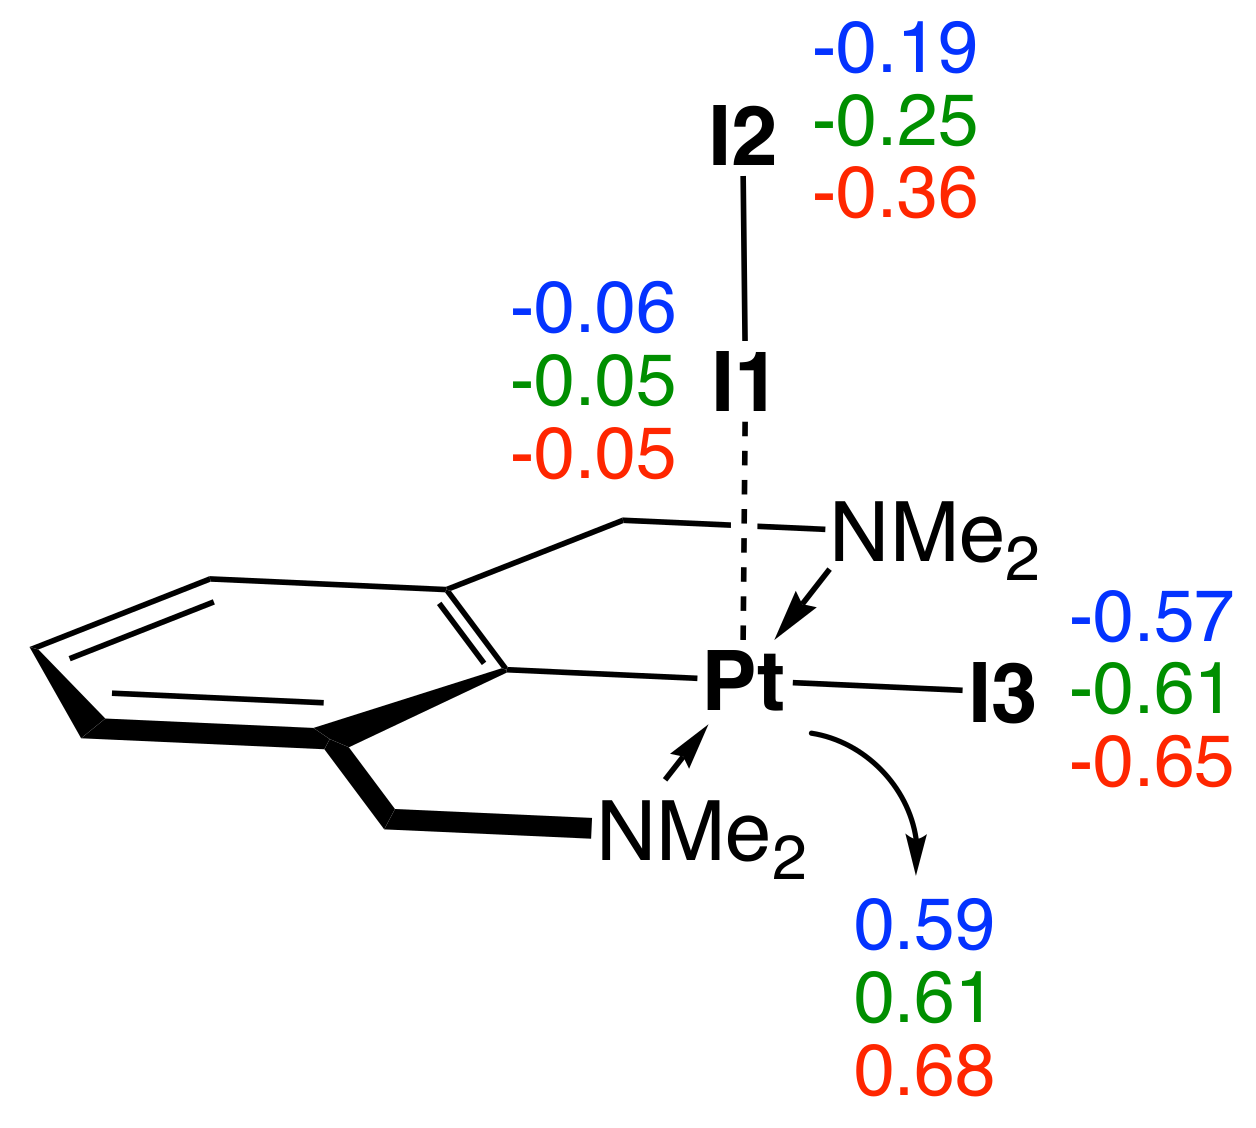
Table 1.
Binding energy, bond length, local mode force constant, BSO n, electron density and energy density at bond critical point, charge transfer, and 3c–4e character for the M–I and I–I bonds of the complexes 1–20 a.
Table 1.
Binding energy, bond length, local mode force constant, BSO n, electron density and energy density at bond critical point, charge transfer, and 3c–4e character for the M–I and I–I bonds of the complexes 1–20 a.
| Nr | r(M–I) | r(I–I) | (M–I) | (I–I) | BSO n(M–I) | BSO n(I–I) | (M–I) | (M–I) | (I–I) | (I–I) | CT | 3c–4e | |
|---|---|---|---|---|---|---|---|---|---|---|---|---|---|
| 1 | 19.0 | 2.887 | 2.788 | 0.477 | 1.100 | 0.399 | 0.692 | 0.317 | −0.064 | 0.429 | −0.119 | 0.254 | 0.58 |
| 2 | 16.6 | 2.900 | 2.774 | 0.458 | 1.162 | 0.389 | 0.718 | 0.308 | −0.060 | 0.439 | −0.125 | 0.228 | 0.54 |
| 3 | 20.3 | 2.861 | 2.800 | 0.513 | 1.064 | 0.419 | 0.677 | 0.335 | −0.073 | 0.420 | −0.113 | 0.281 | 0.62 |
| 4 | 22.8 | 2.838 | 2.81 | 0.587 | 1.043 | 0.458 | 0.668 | 0.347 | −0.079 | 0.412 | −0.109 | 0.284 | 0.68 |
| 5 | 18.5 | 2.895 | 2.778 | 0.471 | 1.150 | 0.396 | 0.713 | 0.310 | −0.062 | 0.436 | −0.123 | 0.230 | 0.56 |
| 6 | 17.7 | 2.911 | 2.773 | 0.446 | 1.168 | 0.382 | 0.720 | 0.301 | −0.057 | 0.440 | −0.125 | 0.219 | 0.53 |
| 7 | 18.1 | 2.919 | 2.781 | 0.428 | 1.096 | 0.372 | 0.690 | 0.294 | −0.053 | 0.433 | −0.121 | 0.233 | 0.54 |
| 8 | 17.7 | 2.892 | 2.783 | 0.478 | 1.122 | 0.400 | 0.701 | 0.311 | −0.062 | 0.432 | −0.12 | 0.256 | 0.57 |
| 9 | 16.6 | 2.905 | 2.779 | 0.447 | 1.122 | 0.382 | 0.701 | 0.303 | −0.058 | 0.435 | −0.122 | 0.253 | 0.55 |
| 10 | 14.9 | 2.956 | 2.763 | 0.379 | 1.191 | 0.343 | 0.729 | 0.277 | −0.047 | 0.448 | −0.130 | 0.227 | 0.47 |
| 11 | 17.4 | 2.913 | 2.774 | 0.433 | 1.156 | 0.374 | 0.715 | 0.301 | −0.057 | 0.440 | −0.125 | 0.228 | 0.52 |
| 12 | 20.4 | 2.873 | 2.800 | 0.500 | 1.049 | 0.412 | 0.671 | 0.326 | −0.069 | 0.420 | −0.113 | 0.278 | 0.61 |
| 13 | 16.3 | 2.884 | 2.767 | 0.391 | 1.175 | 0.350 | 0.723 | 0.276 | −0.049 | 0.445 | −0.128 | 0.207 | 0.48 |
| 14 | 14.5 | 2.818 | 2.757 | 0.286 | 1.196 | 0.285 | 0.731 | 0.244 | −0.043 | 0.453 | −0.134 | 0.165 | 0.39 |
| 15 | 33.6 | 2.640 | 2.942 | 0.713 | 0.676 | 0.520 | 0.502 | 0.384 | −0.105 | 0.327 | −0.062 | 0.521 | 1.04 |
| 16 | 33.9 | 2.741 | 2.915 | 0.793 | 0.749 | 0.558 | 0.537 | 0.401 | −0.110 | 0.343 | −0.070 | 0.475 | 1.04 |
| 17 | 36.3 | 2.761 | 2.934 | 0.865 | 0.711 | 0.591 | 0.519 | 0.434 | −0.128 | 0.331 | −0.065 | 0.510 | 1.14 |
| 18 | 22.6 | 2.881 | 2.831 | 0.586 | 0.935 | 0.457 | 0.622 | 0.337 | −0.075 | 0.395 | −0.098 | 0.315 | 0.73 |
| 19 | 11.4 | 3.207 | 2.690 | 0.150 | 1.649 | 0.186 | 0.903 | 0.165 | −0.010 | 0.507 | −0.172 | 0.023 | 0.21 |
| 20 | 19.3 | 3.016 | 2.813 | 0.374 | 0.971 | 0.340 | 0.638 | 0.273 | −0.045 | 0.414 | −0.109 | 0.362 | 0.53 |
a Binding energy
in kcal/mol, bond length r in Å, local mode force constant
in mDyn/Å, electron density at the bond critical point
in e/Å, energy density at the bond critical
point in Hartree/Å, charge transfer CT in e.
PBE0–D3(BJ)/aug–cc–pVTZ/PP(M,I) level of theory.
Table 2.
Bond length and local mode force constant of selected atoms of the molecular system 1 in the gas phase and in solution .
Table 2.
Bond length and local mode force constant of selected atoms of the molecular system 1 in the gas phase and in solution .
| Atoms | Gas Phase | Benzene | Acetone | |||
|---|---|---|---|---|---|---|
| r | r | r | ||||
| I1–I2 | 2.788 | 1.100 | 2.815 | 0.955 | 2.880 | 0.640 |
| Pt–I1 | 2.887 | 0.477 | 2.838 | 0.564 | 2.768 | 0.595 |
| Pt–I3 | 2.707 | 1.161 | 2.723 | 1.037 | 2.750 | 0.856 |
| Pt–N | 2.099 | 1.910 | 2.102 | 1.902 | 2.105 | 1.845 |
| Pt–C | 1.933 | 4.186 | 1.934 | 4.160 | 1.935 | 4.113 |
Distances r in Å, local force constants in mDyn/Å. PBE0–D3(BJ)/aug–cc–pVTZ/PP(M,I)/SMD level of theory.
Publisher’s Note: MDPI stays neutral with regard to jurisdictional claims in published maps and institutional affiliations. |
© 2021 by the authors. Licensee MDPI, Basel, Switzerland. This article is an open access article distributed under the terms and conditions of the Creative Commons Attribution (CC BY) license (https://creativecommons.org/licenses/by/4.0/).
Share and Cite
MDPI and ACS Style
Freindorf, M.; Yannacone, S.; Oliveira, V.; Verma, N.; Kraka, E. Halogen Bonding Involving I2 and d8 Transition-Metal Pincer Complexes. Crystals 2021, 11, 373. https://0-doi-org.brum.beds.ac.uk/10.3390/cryst11040373
AMA Style
Freindorf M, Yannacone S, Oliveira V, Verma N, Kraka E. Halogen Bonding Involving I2 and d8 Transition-Metal Pincer Complexes. Crystals. 2021; 11(4):373. https://0-doi-org.brum.beds.ac.uk/10.3390/cryst11040373
Chicago/Turabian StyleFreindorf, Marek, Seth Yannacone, Vytor Oliveira, Niraj Verma, and Elfi Kraka. 2021. "Halogen Bonding Involving I2 and d8 Transition-Metal Pincer Complexes" Crystals 11, no. 4: 373. https://0-doi-org.brum.beds.ac.uk/10.3390/cryst11040373
Note that from the first issue of 2016, this journal uses article numbers instead of page numbers. See further details here.