Article

Process Parameter Optimization Framework for the Selective Laser Melting of Hastelloy X Alloy Considering Defects and Solidification Crack Occurrence

1
Research Center for Structural Materials, National Institute for Materials Science (NIMS), Sengen 1-2-1, Tsukuba, Ibaraki 305-0047, Japan
2
Department of Materials Science and Engineering, Shibaura Institute of Technology, 3-7-5 Toyosu, Koto, Tokyo 135-8548, Japan
*
Author to whom correspondence should be addressed.
Submission received: 20 April 2021 / Revised: 13 May 2021 / Accepted: 19 May 2021 / Published: 21 May 2021

Abstract

:
Recent years have witnessed increasing demand for selective laser melting (SLM) in practical applications; however, determining the appropriate process parameter range remains challenging. In this study, a framework was developed to determine the appropriate process parameter range considering the occurrence of defects and cracks by conducting a single-track test and thermal elastoplastic analysis. Keyholing, balling, and the residual unmelted regions were considered defects. The occurrence of solidification cracking, which is predominant in the SLM of solution-strengthened Ni-based alloys, was considered. Using the proposed framework, we could fabricate a part with largely no defects or cracks, except for the edges, under the determined optimal process parameters.

1. Introduction

In recent years, research and development into the selective laser melting (SLM) process has been actively pursued to improve the degree of freedom of part design, reduce the number of parts, and lower the cost via integrated fabrication. Several studies have been carried out on the application of the SLM process to materials such as titanium alloys [1,2], Ni-based superalloys [3,4,5,6], aluminum alloys [7,8], and steel materials [9,10]. These studies have revealed that it is important to set the process parameters (layer thickness, hatch spacing, laser power, and scan speed) within an appropriate range to fabricate parts with largely no defects or cracks. Typically, when applying the SLM process to a material whose appropriate parameter range is unknown, it is necessary to fabricate a part of a few tens of square millimeters under various process parameters and evaluate the presence of defects and cracks by cross-sectional observation to determine the process parameters. However, this method requires considerable time and cost.
To this end, Seede et al. proposed a framework to determine the appropriate process parameters that do not cause keyholing, balling, or residual unmelted areas by combining single-track tests and analytical model evaluations [11]. The single-track test is a method used to obtain a melt pool on a line by scanning a laser only on a single line under various fabrication conditions; this test can be performed in a shorter duration compared with fabricating parts of several tens of square millimeters. Keyholing is a phenomenon in which the porosity remains at the bottom of the melt pool when the melt pool has an extremely large depth relative to its width [12,13]. Keyholing occurs under high laser power and low scan speed conditions. Balling is a phenomenon in which the melt pool solidifies into a spherical shape owing to the unstable flow of the melt pool [14,15], and a notch-like groove is formed at the outer edge of the melt pool. Balling occurs under high laser power and high scan speed conditions. A residual unmelted area is observed when the powder layer cannot be completely melted. This is due to the low laser power, high scan speed, and large hatch spacing.
Using Seede’s framework, it is possible to quickly and inexpensively determine the appropriate process parameter range where no defects occur, i.e., no keyholing, balling, or residual unmelted area. However, there is one problem: the occurrence of cracks is not considered. Because various characteristics are affected when cracks occur in a part, it is important to exclude the process parameter range in which cracks occur from the appropriate process parameter range.
Recently, the authors proposed a method for predicting solidification cracking, which is the dominant type of cracking in the SLM of solution-strengthened Ni-based superalloys, using the plastic strain behavior in the high-temperature region obtained from a thermal elastoplastic analysis [16]. Solidification cracking occurs when the residual liquid film at the columnar interface cannot fully resist shrinkage strain during the solidification process of the material and the cracks are not healed by residual liquid in the surrounding area. It has also been reported that carbide precipitation may affect the occurrence of solidification cracking [17]. Previous studies on welding technology have shown that various Ni-based superalloys, including solution-strengthened Ni-based superalloys, are highly susceptible to solidification cracking because of γ single-phase solidification [18,19,20]. By incorporating the authors’ method for predicting solidification cracking into Seede’s framework, we can establish a method for determining an appropriate process parameter range that does not cause defects or cracking in solid-solution-strengthened Ni-based superalloys.
In this study, we developed and validated a framework for determining the appropriate SLM process parameter range for solution-strengthened Ni-based superalloys by combining a defect-free condition search based on Seede’s method and a solidification crack prediction method. Specifically, the range of process parameters that does not cause keyholing, balling, or residual unmelted area in Hastelloy X, which is a solution-strengthened Ni-based superalloy, was determined by referring to the results of single-track tests. Subsequently, within this range, the process parameters that do not cause solidification cracks were determined. Two methods were considered to determine the parameters that do not cause solidification cracks: grid-based sampling and Bayesian optimization. In addition, the effectiveness of the proposed framework was verified by fabricating parts using the process parameters near the optimal conditions obtained by the above procedure and by evaluating the defects and cracks through cross-sectional observation.

2. Materials and Methods

This paper proposes a framework for determining the appropriate process parameters considering defects and crack occurrence, by combining the search for defect-free conditions using single-track test results and the prediction of solidification cracking using plastic strain behavior obtained through thermal elastoplastic analysis. Figure 1 shows the outline of the proposed framework. The details of the framework are presented in the following sections.

2.1. Search Method for Defect-Free Process Parameter Range

By referring to Seede’s method, the process parameter range that does not cause defects, such as keyholing, balling, and residual unmelted area, is determined. Seede conducted a single-track test using the same powder layer thickness as that used in actual fabrication and used the obtained melt pool width and depth as well as an analytical model of heat conduction phenomena adjusted using the melt pool dimensions to determine the process parameter range under which defects do not occur [11]. In this study, a single-track test using only a substrate without powder was conducted as a simpler method, and only the obtained melt pool width and depth were used to determine the process parameter range for a defect-free fabrication.

2.1.1. Single-Track Tests

Single-track tests were performed using SLM280HL (SLM SOLUTIONS) with a maximum power of 700 W (fiber laser, spot diameter: 80 μm, Gaussian distribution). In the test, the laser power was set to six levels (50, 100, 180, 300, 500, and 700 W), and the scan speed was set to five levels (250, 500, 900, 1500, and 2500 mm/s). However, when the laser power was 50 or 100 W and the scan speed was 1500 mm/s or more, the substrate hardly melted; hence, it was excluded from the following study. The scanning length of the laser was set to 10 mm, and the distance between adjacent scans was set to 10 mm. A Hastelloy X plate with dimensions of 100 mm × 100 mm × 3 mm was used as the substrate. Table 1 presents the composition of the Hastelloy X plate.
Single-track test samples fabricated under each condition were cut at the center cross section, polished, and observed by scanning electron microscopy (SEM) to evaluate the melt pool dimensions (width W and depth D ). Because the melt pool shape near the surface was found to be unstable, the melt pool width W D / 2 measured at half the melt pool depth was used for the melt pool width, and we assumed that the melt pool shape follows a parabolic shape.
W = 2   W D / 2 .
Figure 2 shows the definitions of W , D , and W D / 2 .

2.1.2. Criteria for Determining Defect Occurrence

The occurrence of keyholing was determined by the ratio of the melt pool width to the depth. Roehling et al. [13] stated that keyholing occurs when the melt pool depth D /melt pool width W > 1.5, and the same value was used in this study.
The occurrence of balling was determined from the top and cross-sectional views of the single-track test samples. The occurrence of balling can be easily determined because the melt pool has a spherical shape and notch-like grooves appear at its outer edge.
The occurrence of the remaining unmelted area was determined using two methods. The first method is by comparing the melt pool depth in the single-track test and the powder layer thickness in the actual fabrication. If the melt depth is less than the powder layer thickness, the part will not be integrated, and defects will occur. In this study, the powder layer thickness was kept constant at 30 μm. The other method is based on the relationship between the melt pool dimensions and the hatch spacing. Seede derived the relationship between the maximum hatch spacing h max and the melt pool dimensions (melt pool width W s and depth D s ) to avoid the remaining unmelted area as:
h max = W s 1 t t + D s       ,
by geometrical considerations [11], where t is the powder layer thickness. Equation (2) is based on the assumption that the results of single-track tests, including the powder layer, are used, and the results of single-track tests without powder in this study cannot be used without modification. This is because the melt pool depth of the single-track parts with the powder layer D s is obtained by subtracting the thickness of the powder layer from the thickness of the total melt area, and the melt pool depth of the single-track parts without the powder layer D is the length of the total molten area in the thickness direction. As shown in Figure 3, we first assumed the melt pool width of the single-track parts without powder W and the melt pool width of the single-track parts with the powder layer W s were equal. Then, we also assumed the melt pool depth of the single-track parts without the powder layer D was the sum of the melt pool depth of the single-track parts with the powder layer D s and the powder layer thickness. In other words, we assumed that,
W = W s ,
D = D s + t .
Under this assumption, we can write Equation (2) as:
h max = W 1 t D       ,
and the maximum hatch spacing h max can be evaluated from the single-track melt pool dimensions without a powder layer to avoid the remaining unmelted part. The hatch spacing in the actual fabrication was kept constant at 100 μm, and the region where h max < 100 μm was determined to be the region where unmelted parts remained due to excess hatch spacing.

2.2. Method for Determining Solidification Crack-Free Process Parameters

2.2.1. Prediction Method for Solidification Cracking by Thermal Elastoplastic Analysis

In a previous study, the authors investigated the correlation between the strain behavior in the high-temperature region, which can be obtained via a thermal elastoplastic analysis, and the occurrence of solidification cracking in the actual parts of single-track melt components within the process parameter range assuming the SLM process [16]. As a result, it was clarified that solidification cracking occurs when the maximum value of the incremental plastic strain in the solid–liquid coexistence temperature range during the cooling process Δ ε p max , obtained through the thermal elastoplastic analysis, exceeds a threshold value. This threshold value is useful for predicting the occurrence of solidification cracks caused by the fracture of the residual liquid film. In the thermal elastoplastic analysis, the occurrence of solidification cracking in single-track parts with a powder layer can be predicted without considering the effect of the powder layer. In the present study, solidification crack occurrence was predicted using the same method. The thermal elastoplastic finite element analysis was performed by conducting a one-way coupled analysis, in which a transient heat conduction analysis was carried out without considering the deformation, and then, an elastoplastic analysis was performed with reference to the temperature history of each node. The same mesh was used for the heat conduction finite element analysis and the elastoplastic finite element analysis. A fine element division (5 μm square) was performed near the region where melting was expected.
The heat input area dimensions ( H W ,   H D in Figure 4) were determined by referring to the melt region shape of each sample, and the region was heated at a constant heat flux, Q (J/m3s) for t (s). Here, the relationships between Q , t , laser power L P (W), and scan speed v (m/s) were determined as t = 2 a v and Q = η L P 2 a D W ( η : laser absorption efficiency; a : laser radius), assuming that t is equal to the time taken for the laser to pass through the 2D section. η was set to 0.7, which is the same value in the previous study. The initial temperature of the model was set to 25 °C, and the model boundary was set to an adiabatic condition. As in the previous study, H W was assumed to be equal to W D / 2 / 2 , and H D was assumed to be equal to D . To determine the heat input area other than the single-track test condition, a neural network model was constructed using the melt pool dimensions obtained from the single-track tests. The specific method for constructing the neural network model is described in the following section. In the elastoplastic analysis, the model was assumed to be in a plane-stress state, and the bottom edge of the model was fixed in the x and y directions. Δ ε p max is the maximum value of incremental plastic strain in the region, where the maximum temperature larger than the liquidus temperature.
The material properties used in the thermal elastoplastic analysis were the same as those used in the previous study [16]. The maximum incremental plastic strain threshold value for the occurrence of solidification cracking was set to 0.0041, as determined in the previous study [16].

2.2.2. Process Parameters under Which Cracking Does Not Occur

The procedure described in Section 2.2.1 can be applied to determine whether solidification cracking has occurred at each laser power and scan speed. Because a thermal elastoplastic analysis is computationally expensive, the presence or absence of solidification cracking in the entire range of laser power and scan speed employed in the single-track test could not be evaluated; nevertheless, this could be done in the range of the defect-free process parameters determined using the procedure explained in Section 2.1.
The process parameter range to avoid solidification cracks was determined using two methods: grid-based sampling [21] and Bayesian optimization [22,23,24]. In the grid-based sampling method, the range of defect-free conditions was plotted on the laser power–scan speed map and then divided into grids, and the presence or absence of solidification cracks at the grid intersections was evaluated. Grid-based sampling is a method for comprehensively evaluating the presence or absence of solidification cracks within the defect-free process parameter range and can help us understand the trend of solidification crack occurrence conditions. However, because it requires a large number of evaluations and calculation time, it is inefficient for obtaining only the optimum process parameters. Therefore, assuming that only the optimal conditions are to be obtained, a search for the optimal conditions by Bayesian optimization was also conducted. Here, the optimal conditions were defined as the conditions with the highest fabrication efficiency, i.e., the highest laser power, within the range of conditions where no defects or cracks occurred.
The statistics and machine learning toolbox of MATALB 2021a was used for the Bayesian optimization, and the “expected-improvement-plus” option was used as an acquisition function. The acquisition function under the “expected-improvement-plus” option can be written as follows:
E I x , Q = max ( 0 ,   μ Q x best f x ,
where x b e s t is the location of the lowest posterior mean, μ Q   x best is the lowest value of the posterior mean, and f x is the objective function [22,23,24]. To prevent falling into a local solution, when σ F x < 0.5 σ , the kernel function of the acquisition function was modified by multiplying the kernel parameter θ with the number of iterations, as suggested by Bull [25]. Here, σ F is the standard deviation of the posterior objective function at x , and σ is the posterior standard deviation of the additive Gaussian noise. The ARD Matérn 5/2 kernel [26] was used for the kernel function.

2.3. Fabrication and Evaluation of Parts for Validating the Effectiveness of the Proposed Framework

Hastelloy X powder (AMPERPRINT 0228; Höganäs AB, Höganäs) prepared by gas atomization was used to fabricate the parts. Table 2 lists the composition of the Hastelloy-X powder used. Figure 5 and Figure 6 shows the SEM image of Hastelloy-X powder and particle size distribution of the powder, evaluated using a particle size analyzer with laser diffraction scattering. The SLM system and substrate were the same as those described in Section 2.1.1. The laser power and scan speed were determined by referring to the results of the search for the process parameter range that does not cause defects or cracks, obtained using the procedure described in Section 2.1 and 2.2.
The fabricated parts were cylindrical, 10 mm in diameter and 8 mm in height, with a powder layer thickness of 30 μm and a hatch spacing of 100 μm. A bidirectional scanning strategy with 90° interlayer rotation was employed as the scanning strategy. The fabricated parts were cut at the center cross-section, polished, and evaluated for defects and cracks by SEM.

3. Results and Discussions

3.1. Search Result for Defect-Free Process Parameters

3.1.1. Single-Track Test Results

Figure 7 shows the relationship between the melt pool dimensions and the scanning speed obtained from the single-track test at each laser power. Here, W is the value calculated using Equation (1). The conditions in which balling occurred were excluded because it was difficult to define the melt pool dimensions.
This figure shows that the melt pool width tends to decrease as the scan speed increases at low laser powers (laser power: 50, 100, and 180 W). This is because the amount of heat inputted per unit length decreases as the scan speed increases. On the other hand, when the laser power was high (laser power: 300, 500, and 700 W), the melt pool width did not change significantly even when the scan speed increased. This is because the heat input width corresponds to the laser diameter, and there is a limit to the melt pool width. In other words, under conditions of high laser power, the melt width is saturated, and the effect of changes in the heat input is small. The melt pool depth decreases with increasing scan speed and decreasing heat input per unit length under all laser powers.

3.1.2. Defect-Free Process Parameter Range

Figure 8a shows the defect-free process parameter range determined based on the results reported in Section 3.1.1. The process parameter range in which the keyholing phenomenon and the remaining unmelted area occur were evaluated from the melt pool dimensions of the single-track test samples, and the range in which balling occurred was evaluated from the top and cross-sectional views of the single-track melt pool. In Figure 8a, the good region is defined as the area where the single-track test results show no defect generation, and the other areas are defined as areas where either keyholing, balling, or unmelted areas remain. Figure 8b shows a typical cross-sectional view of the region in which each phenomenon occurs. Figure 8b also shows the laser power, scan speed, and type of defect judgment corresponding to each cross-sectional view.
Figure 8a shows that, similar to the results obtained by Seede, keyholing occurs under high laser power and low scan speeds, balling occurs under high laser power and high scan speeds, and residual unmelted area occurs under low laser power and high scan speeds. This indicates that the results are reasonable. The white area indicated by “good”, which was not judged to be a defective area, is the defect-free process parameter range in this study.
From Figure 8b, it is possible to understand the typical cross-sectional characteristics where various types of defects are judged to occur. When keyholing is judged to occur, the melt pool depth is larger than the melt pool width, as defined. In the case where balling is judged to occur, a notch-like defect occurs at the edge of the melt pool. When the remaining unmelted area is judged to occur, the melt pool depth is lower than the thickness of the powder layer (30 μm) used in the actual fabrication in this study.

3.2. Search Result for Solidification Crack-Free Process Parameters

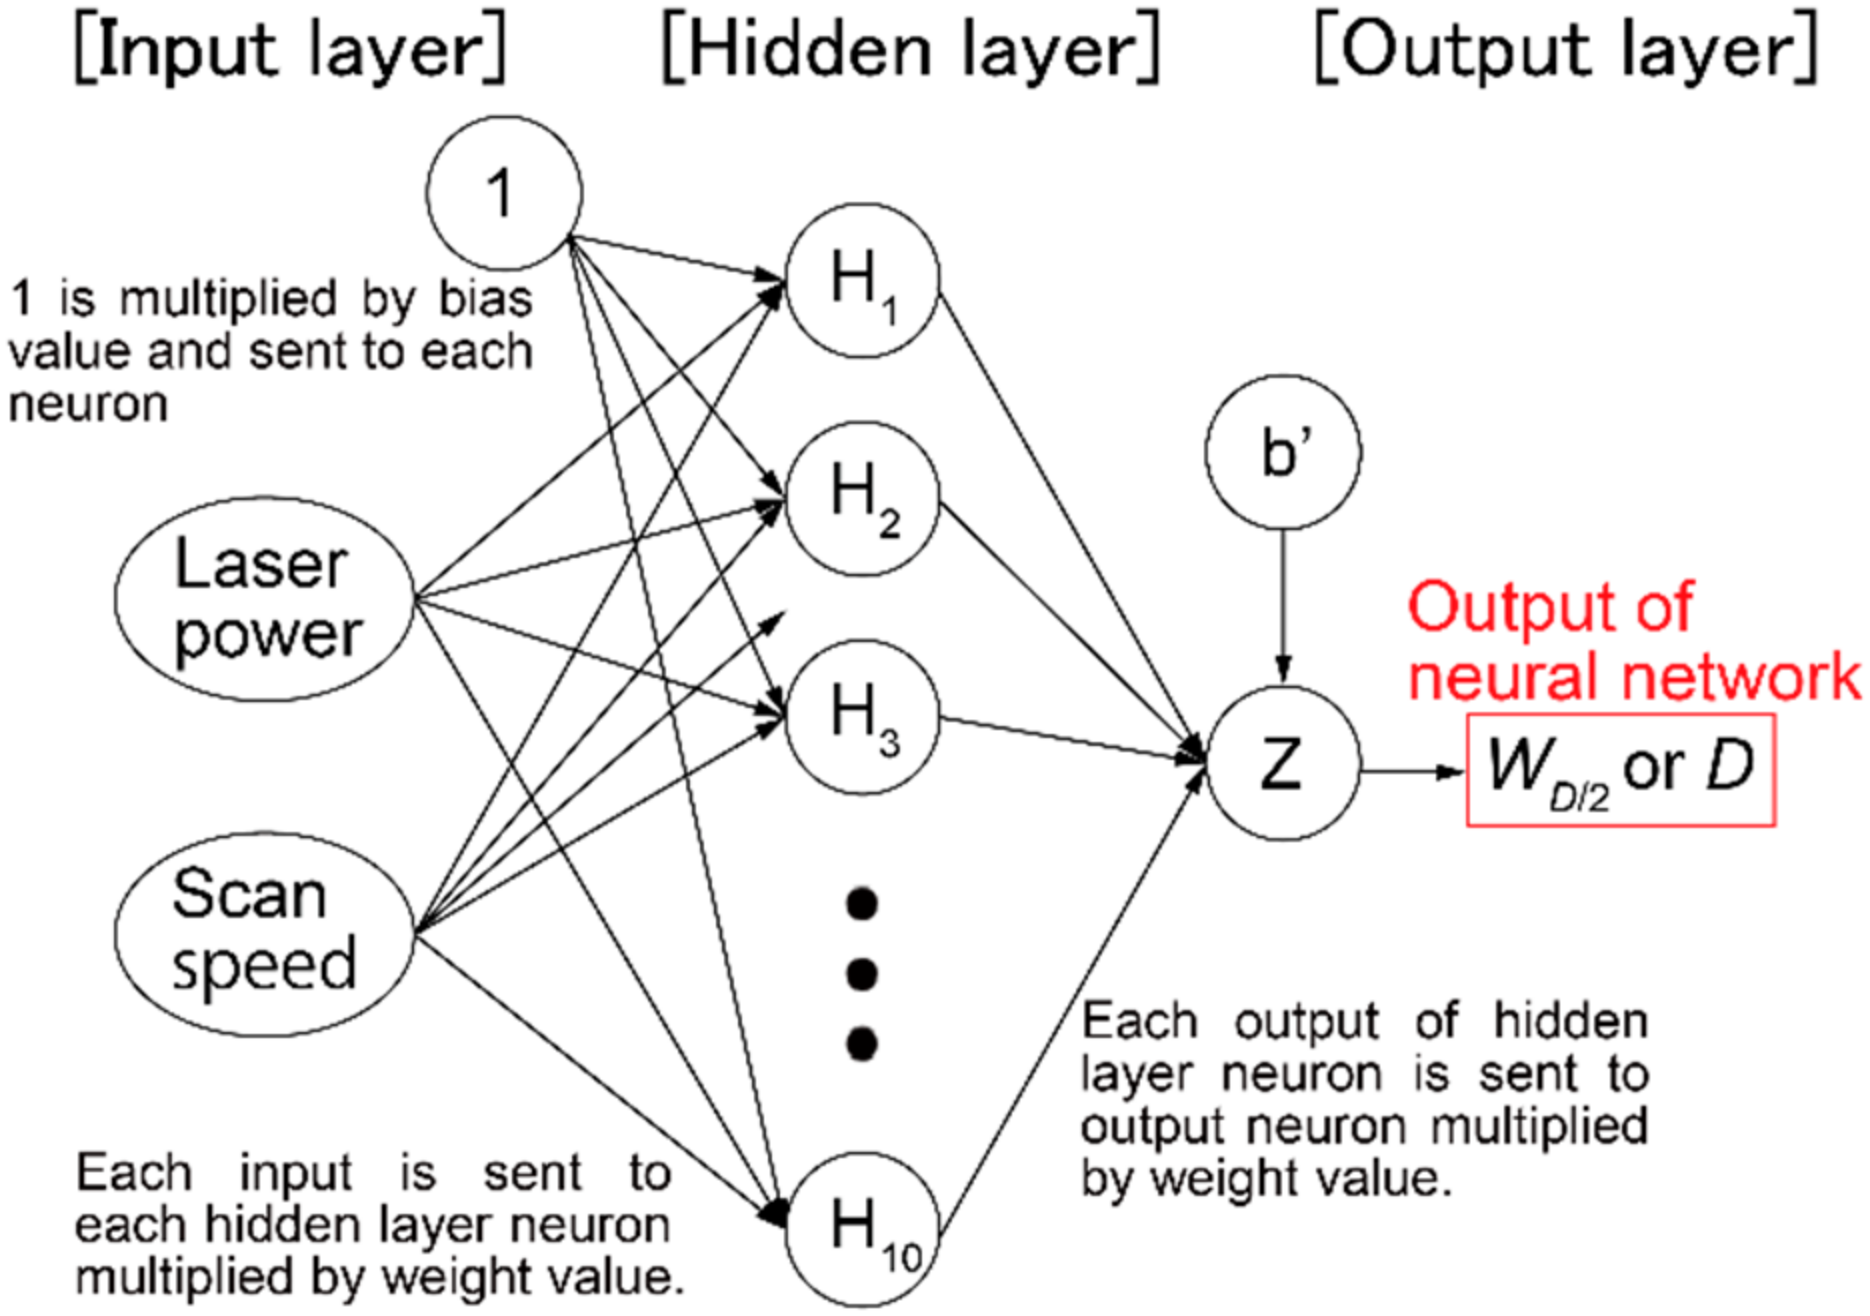
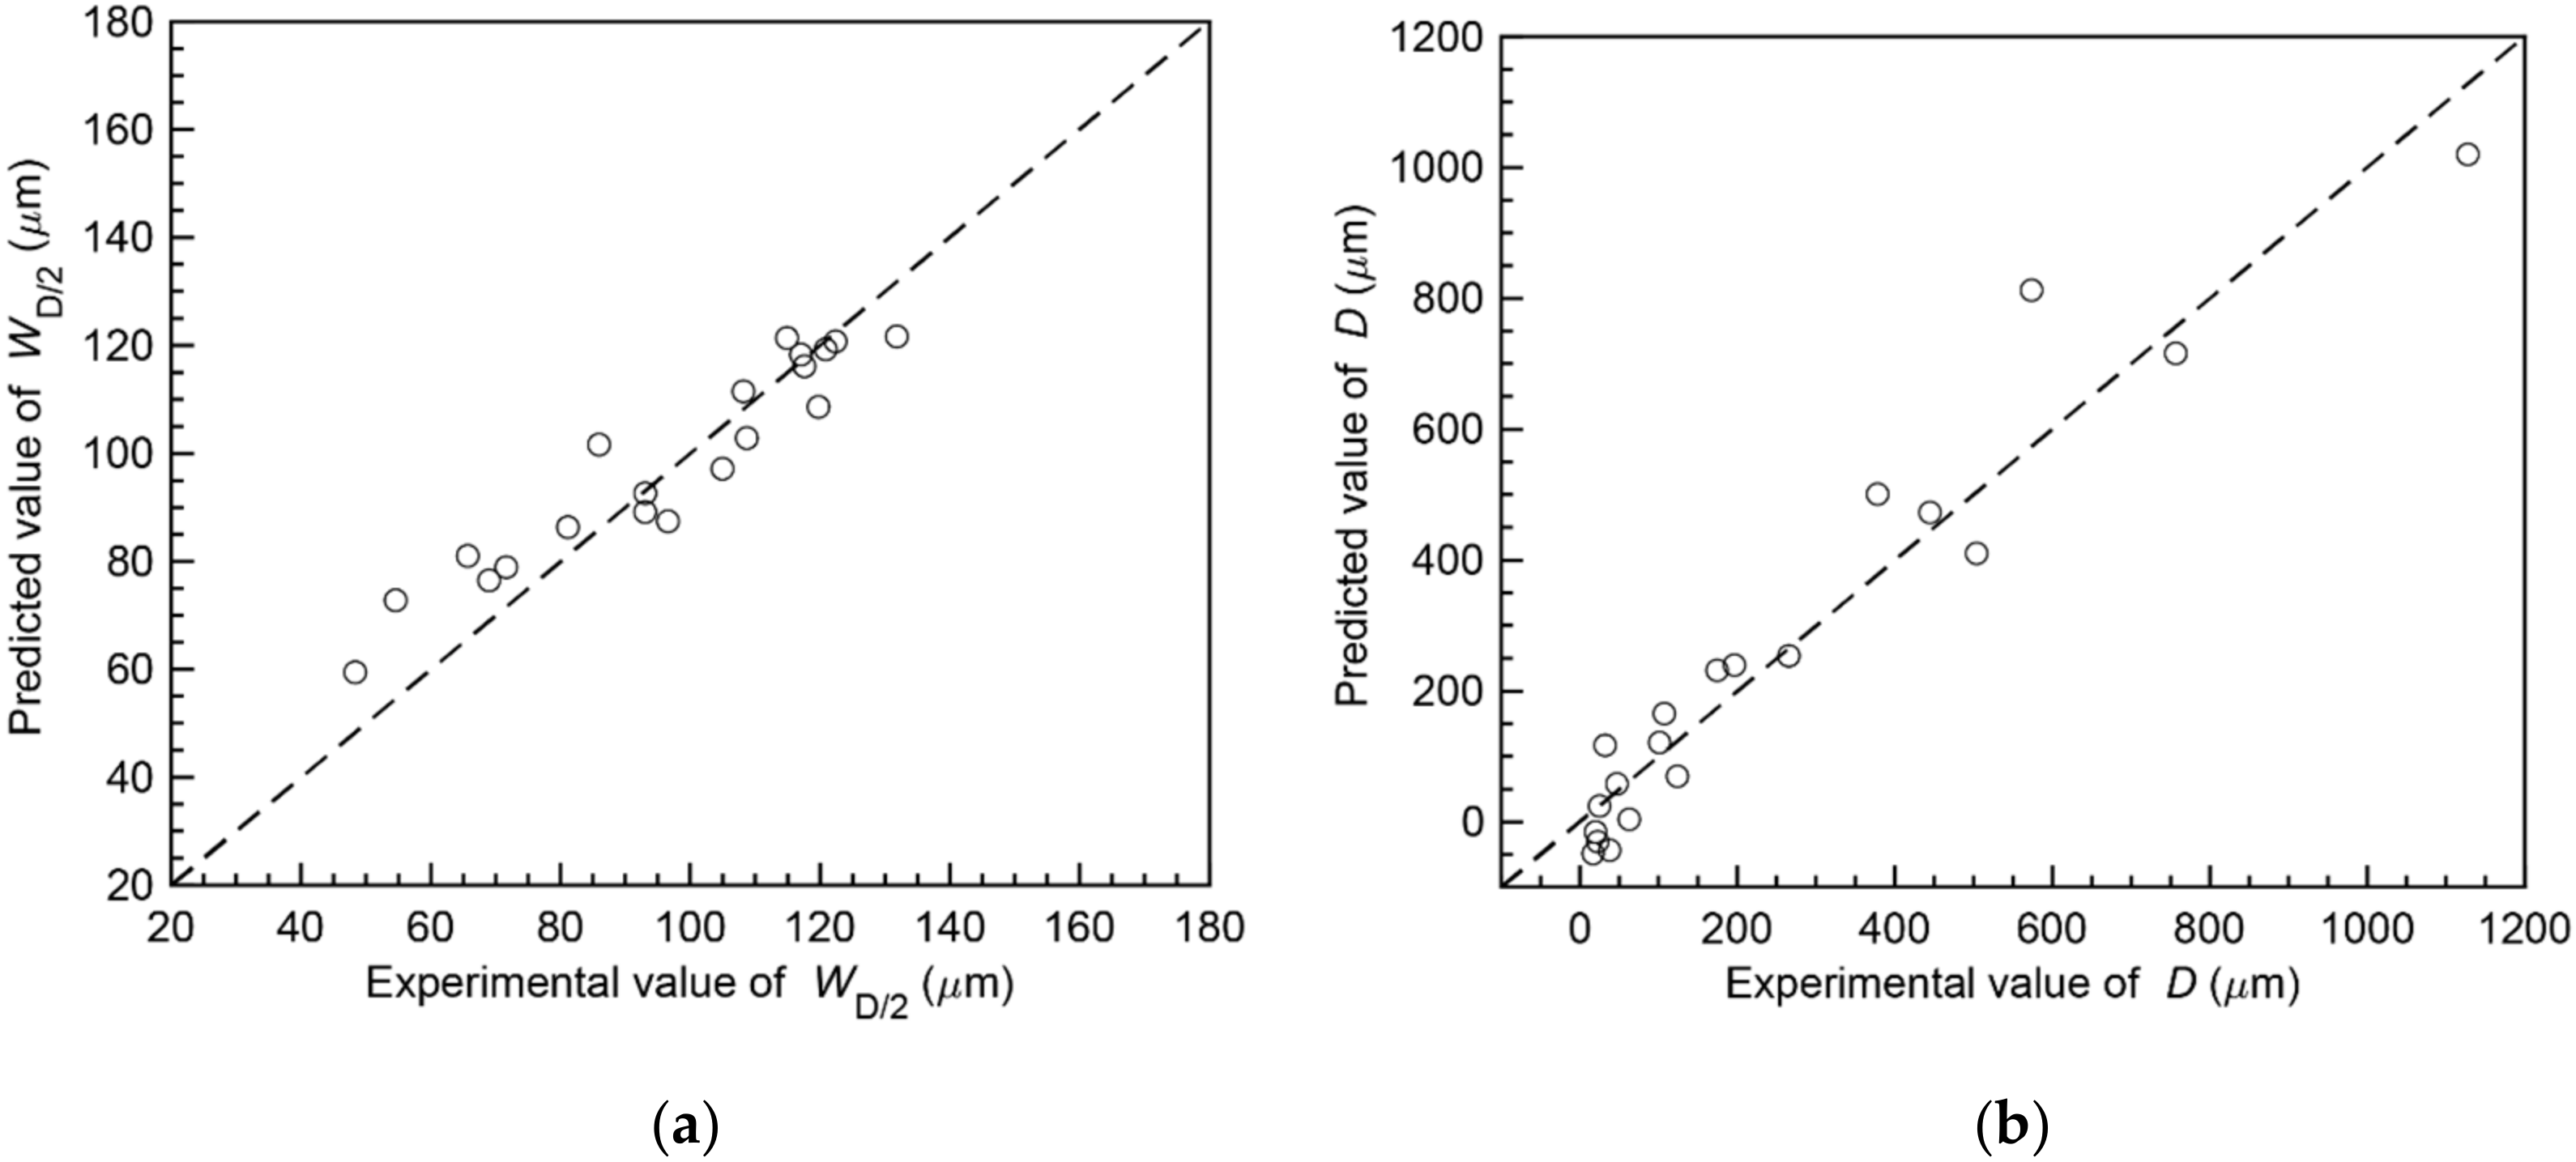
3.2.1. Construction of Neural Network Model for Predicting Heat Input Area

To determine the heat input area dimensions H W and H D under the process parameters in and near the defect-free area, a neural network was constructed to predict W D / 2 / 2 and D from the laser power and scan speed. The neural network used was a three-layer feed-forward fully coupled neural network comprising an input layer, a hidden layer, and an output layer, as shown in Figure 9, with 10 neurons in the hidden layer. For training the neural network, that is, optimization of the weight and bias values in Figure 9, W D / 2 / 2 and D under the condition that balling does not occur, as obtained from the single-track test, were used as training data.
Seventy percent of the training data were used to update the weight and bias values, and the remaining 30% were used to determine the number of training iterations. The optimal weight and bias values were determined using the Bayesian regulation backpropagation algorithm [27,28].
Figure 10 shows the results of the comparison between the predicted values of W D / 2 / 2 and D using the trained neural network and the experimental values obtained from the single-track test under the condition where balling does not occur. The neural network was used to determine the heat input area dimensions H W and H D in the heat conduction finite element analysis in the following study. The predicted values of the melt pool depth D by the neural network were negative in some cases; nevertheless, the predicted values of the melt pool depth D remained positive within the range of the analysis conditions in the following study.

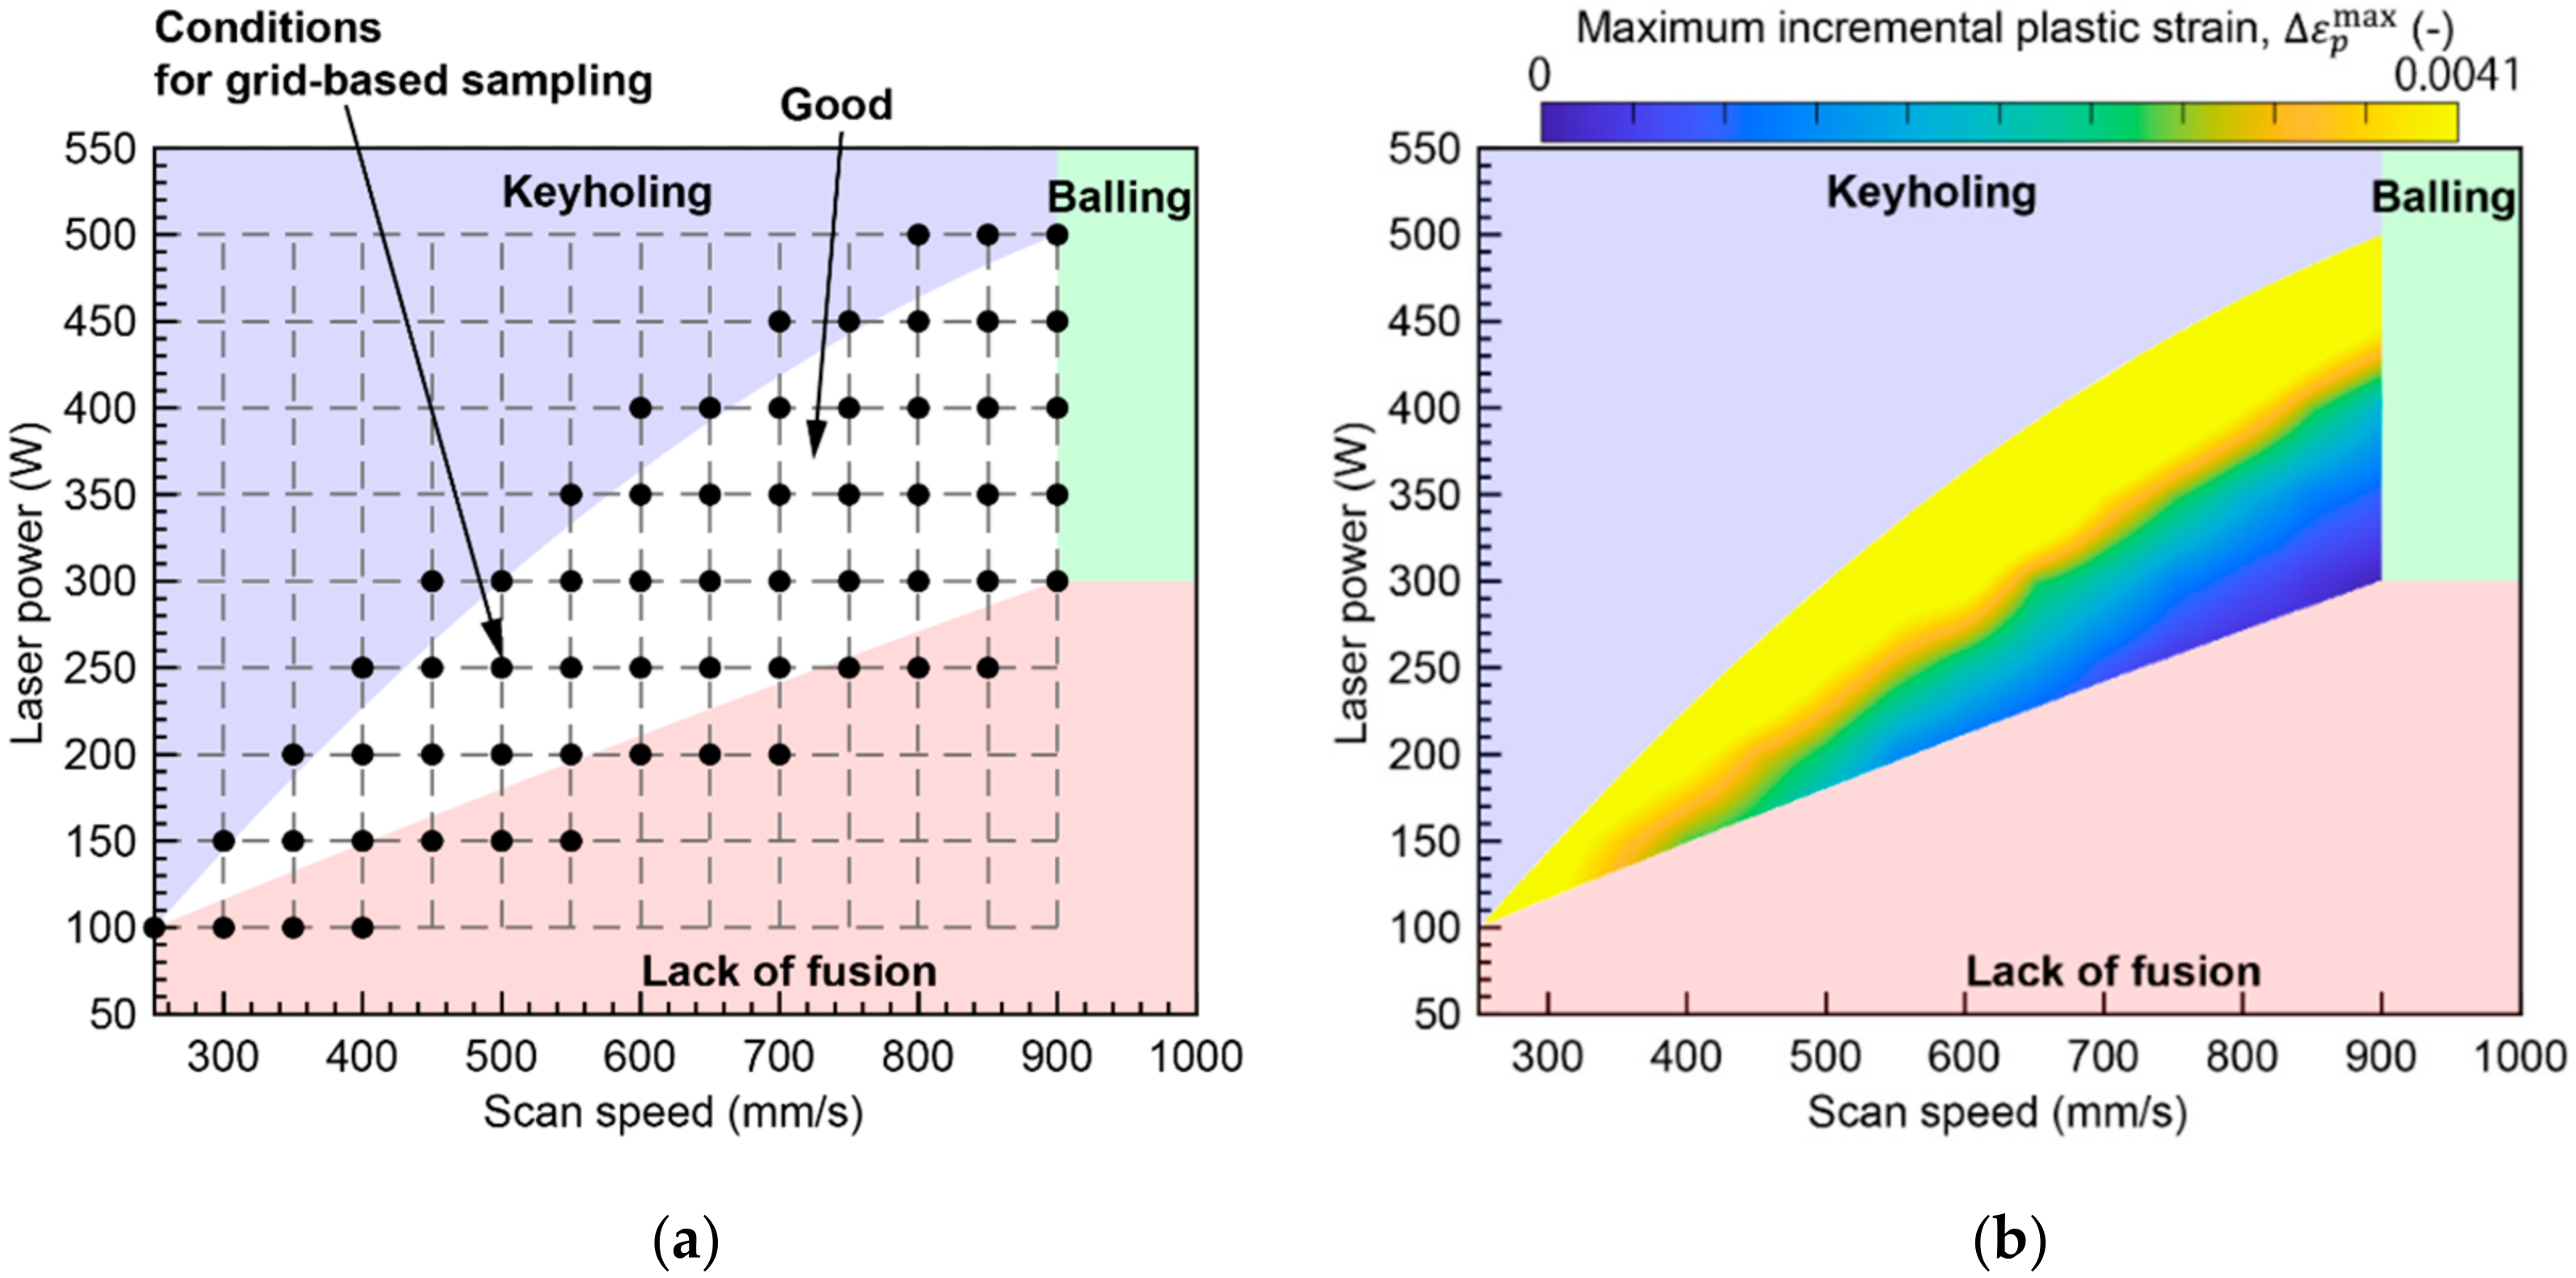
3.2.2. Grid-Based Sampling Results

For grid-based sampling, as shown in Figure 11a, the good track region and its neighborhood in the laser power-scan speed map were divided into grids at laser power increments of 50 W and scan speed increments of 50 mm/s. The maximum incremental plastic strain Δ ε p max in the melt pool was obtained by thermal elastoplastic analysis, as described in Section 2.2.1.
Figure 11b shows the distribution of the maximum incremental plastic strain in the good track region in the laser power-scan speed map obtained by interpolating the maximum incremental plastic strain under each condition in the grid-based sampling. The region above the solidification crack occurrence threshold (=0.0041) is indicated by a single color. This result indicates that solidification cracks may occur even within the good track region, which was obtained from the viewpoint of no defect generation. The process parameters that do not cause defects and solidification cracks should be selected within the good track region and within the region where the maximum incremental plastic strain in the melt pool is <0.0041. The maximum incremental plastic strain tends to increase at a high laser power or low scan speed, which is the same trend as reported in the previous study. From the results, it can be estimated that the most efficient condition, i.e., the condition with the highest laser power, is the optimal condition: a laser power of 440 W and a scanning speed of 900 mm/s.

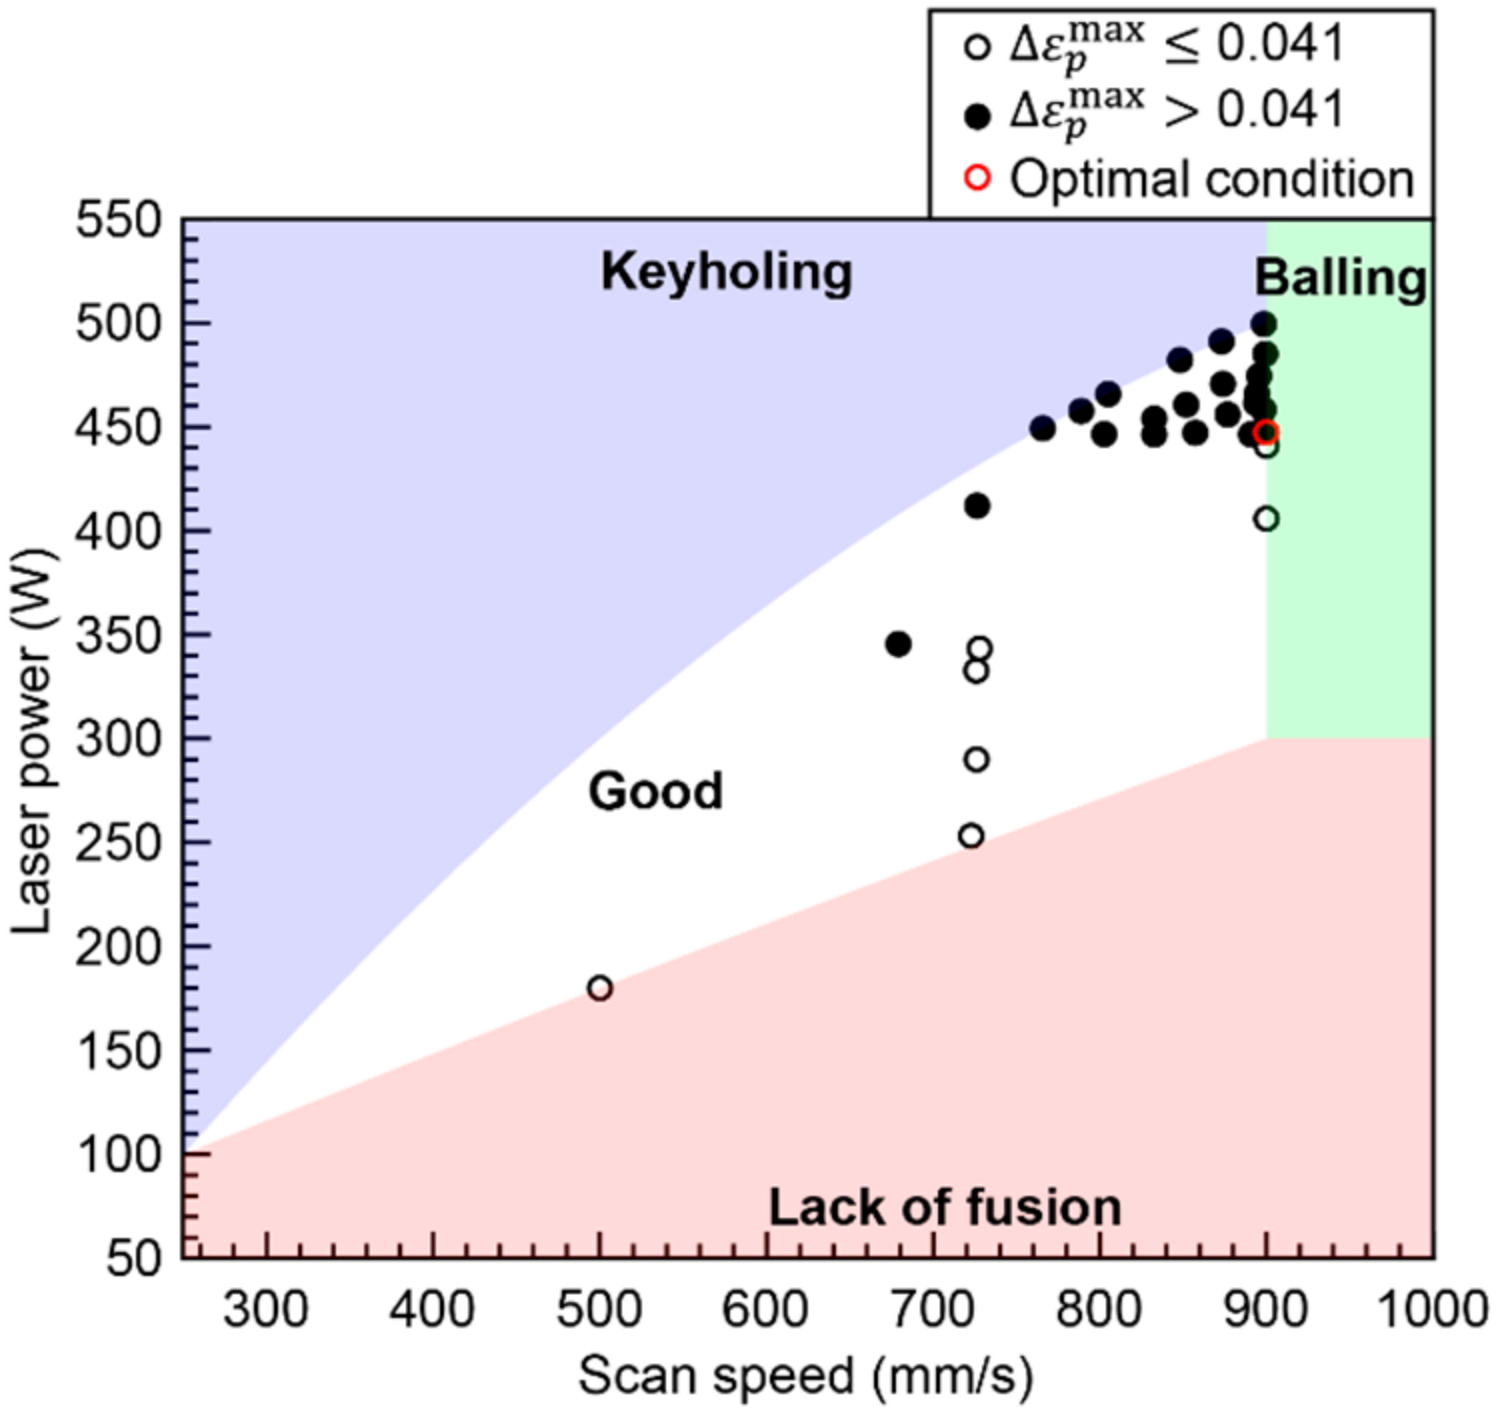
3.2.3. Optimal Process Parameter Search Result by Bayesian Optimization

Figure 12 shows the results of the optimal process parameter search using Bayesian optimization. The starting point of the search was set at a laser power of 180 W and scan speed of 500 mm/s, and the optimal value was determined after 30 iterations. The white plots in the figure indicate points where no solidification cracks were predicted to occur, and the black plots indicate points where solidification cracks were predicted to occur. The optimal conditions (laser power: 447 W, scan speed: 900 mm/s) obtained during the iterations are also shown. This optimal condition was found in the 23rd iteration.
This shows that the optimal process parameters obtained are largely the same as those obtained using grid-based sampling and could be determined in approximately half the number of calculations compared with grid-based sampling. This is because the search could be carried out by focusing on the area with a high laser power in the good track region, as shown in Figure 12. Therefore, it is more efficient to use Bayesian optimization than grid-based sampling to obtain only the optimal process parameters.

3.3. Validation of the Effectiveness of the Proposed Framework

To verify the effectiveness of the framework for determining the optimal process parameters considering the occurrence of defects and solidification cracks, cylindrical parts were fabricated and their cross-section was observed using the procedure described in Section 2.3.
The parts were fabricated under three conditions. The first condition was the optimal condition, where 450 W laser power and 900 mm/s scanning speed were adopted as approximations of the optimal process parameters obtained in Section 3.2.2 and 3.2.3. In the second condition, the laser power was not changed from the optimal condition, and only the scanning speed was changed to 700 mm/s. This condition is located near the outer edge of the keyholing region, and defects or cracks are expected to occur. In the third condition, the laser power was increased to 500 W, which was larger than the optimal condition. The optimal condition in this study is the result of the search for the maximum laser power at which defects and cracks do not occur. Therefore, defects and cracks are very likely to occur under this condition. The scan speed was set to 833 mm/s to avoid balling. In the third condition, it was difficult to fabricate an 8 mm-height object due to the instability of the melt pool. Therefore, fabrication was stopped at a height of about 2 mm. The second and third conditions are for comparison, and the effectiveness of the proposed framework is examined by comparing the cross-sectional states of parts fabricated under these conditions with those of the part fabricated under the optimal condition.
As shown in Figure 13a, cross-sectional observations were made in three regions: the center of the plane (circular center), the middle of the edge and the center of the plane, and the region including the edge. Figure 13b to j show the results of cross-sectional observation in each regions of the parts made by both conditions. Each image also shows the porosity ratio calculated by using the black area as porosity. When cracks were observed, the typical crack positions were indicated by arrows.
From Figure 13b,e, it can be seen that almost no defects can be produced in the center and middle regions under the optimal condition. The average porosity ratio in the center and middle regions of the parts is about 0.1%. In addition, no cracks were observed. However, in the edge region (Figure 13h), a slight increase in the porosity ratio and cracks can be observed. This is because the edge region had a different temperature and strain state from the single-track test due to the effect of the laser turnover.
From Figure 13c,f,i, no cracks can be observed except at the edge region as in the optimal condition when only the scan speed was changed from the optimum condition. However, the porosity ratio increase compared to that of the part fabricated under the optimal condition. The average porosity ratio at the center and middle of the part is about 0.6%, which is six times higher than that of the part fabricated under the optimal condition. This indicates that the optimal condition explored in this study are effective for suppressing defect occurrence.
From Figure 13d,g,j, many cracks can be observed even in the center and middle region, where no cracks can be observed in the other conditions although the porosity ratio is at the same level as that of the part fabricated under the optimal condition. This indicates that the optimal condition explored in this study is effective in preventing cracks at least in the center and middle regions.
From the above, it was found that the framework proposed in this study is effective in searching for the conditions for fabricating parts with almost no defects and without cracks in the center and middle regions of the parts. In order to achieve the parts fabrication without defects and cracking over the entire cross section, it is considered effective to reduce the deviation of temperature and strain state from the single-track test in the edge region by optimizing the scan strategy. In addition, a large change in part size can also cause a large deviation from the states under single-track test, and the scan strategy needs to be optimized in this case as well. Such a scanning strategy will be the subject of future study.

4. Conclusions

In this study, we developed a framework for determining the appropriate process parameter range for the SLM of solution-strengthened Ni-based alloys by combining the evaluation of defect-free regions based on the melt pool shape information obtained from a single-track test and the prediction of solidification cracking by thermal elastoplastic analysis. The conclusions drawn from the results are as follows:
(1)
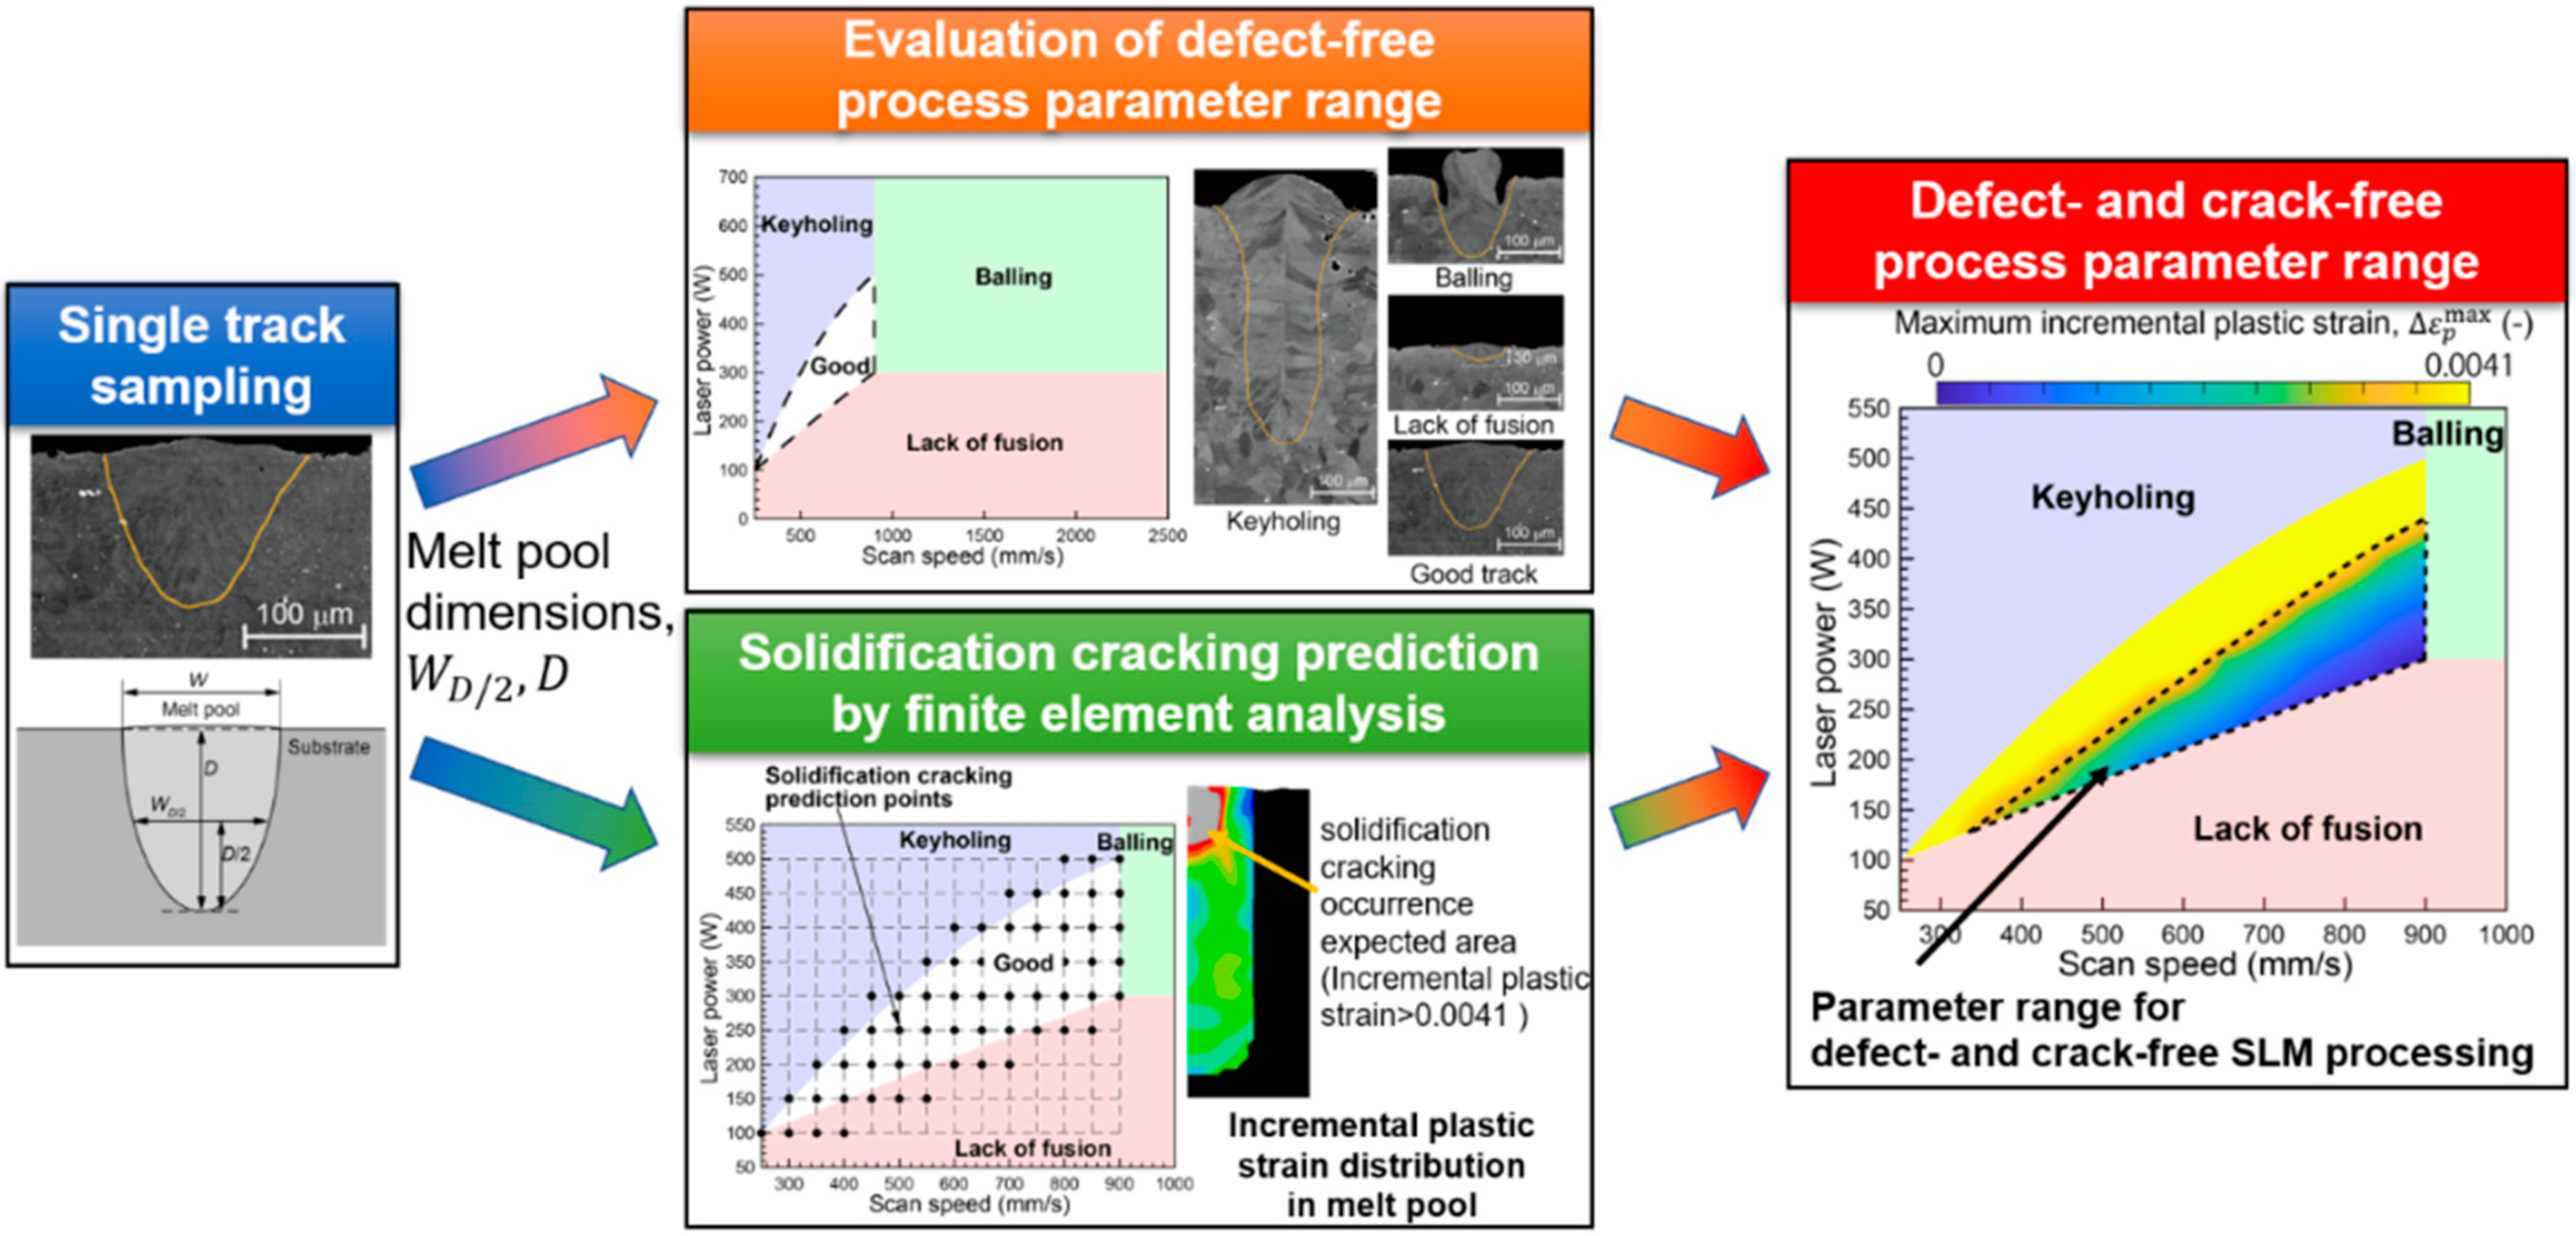
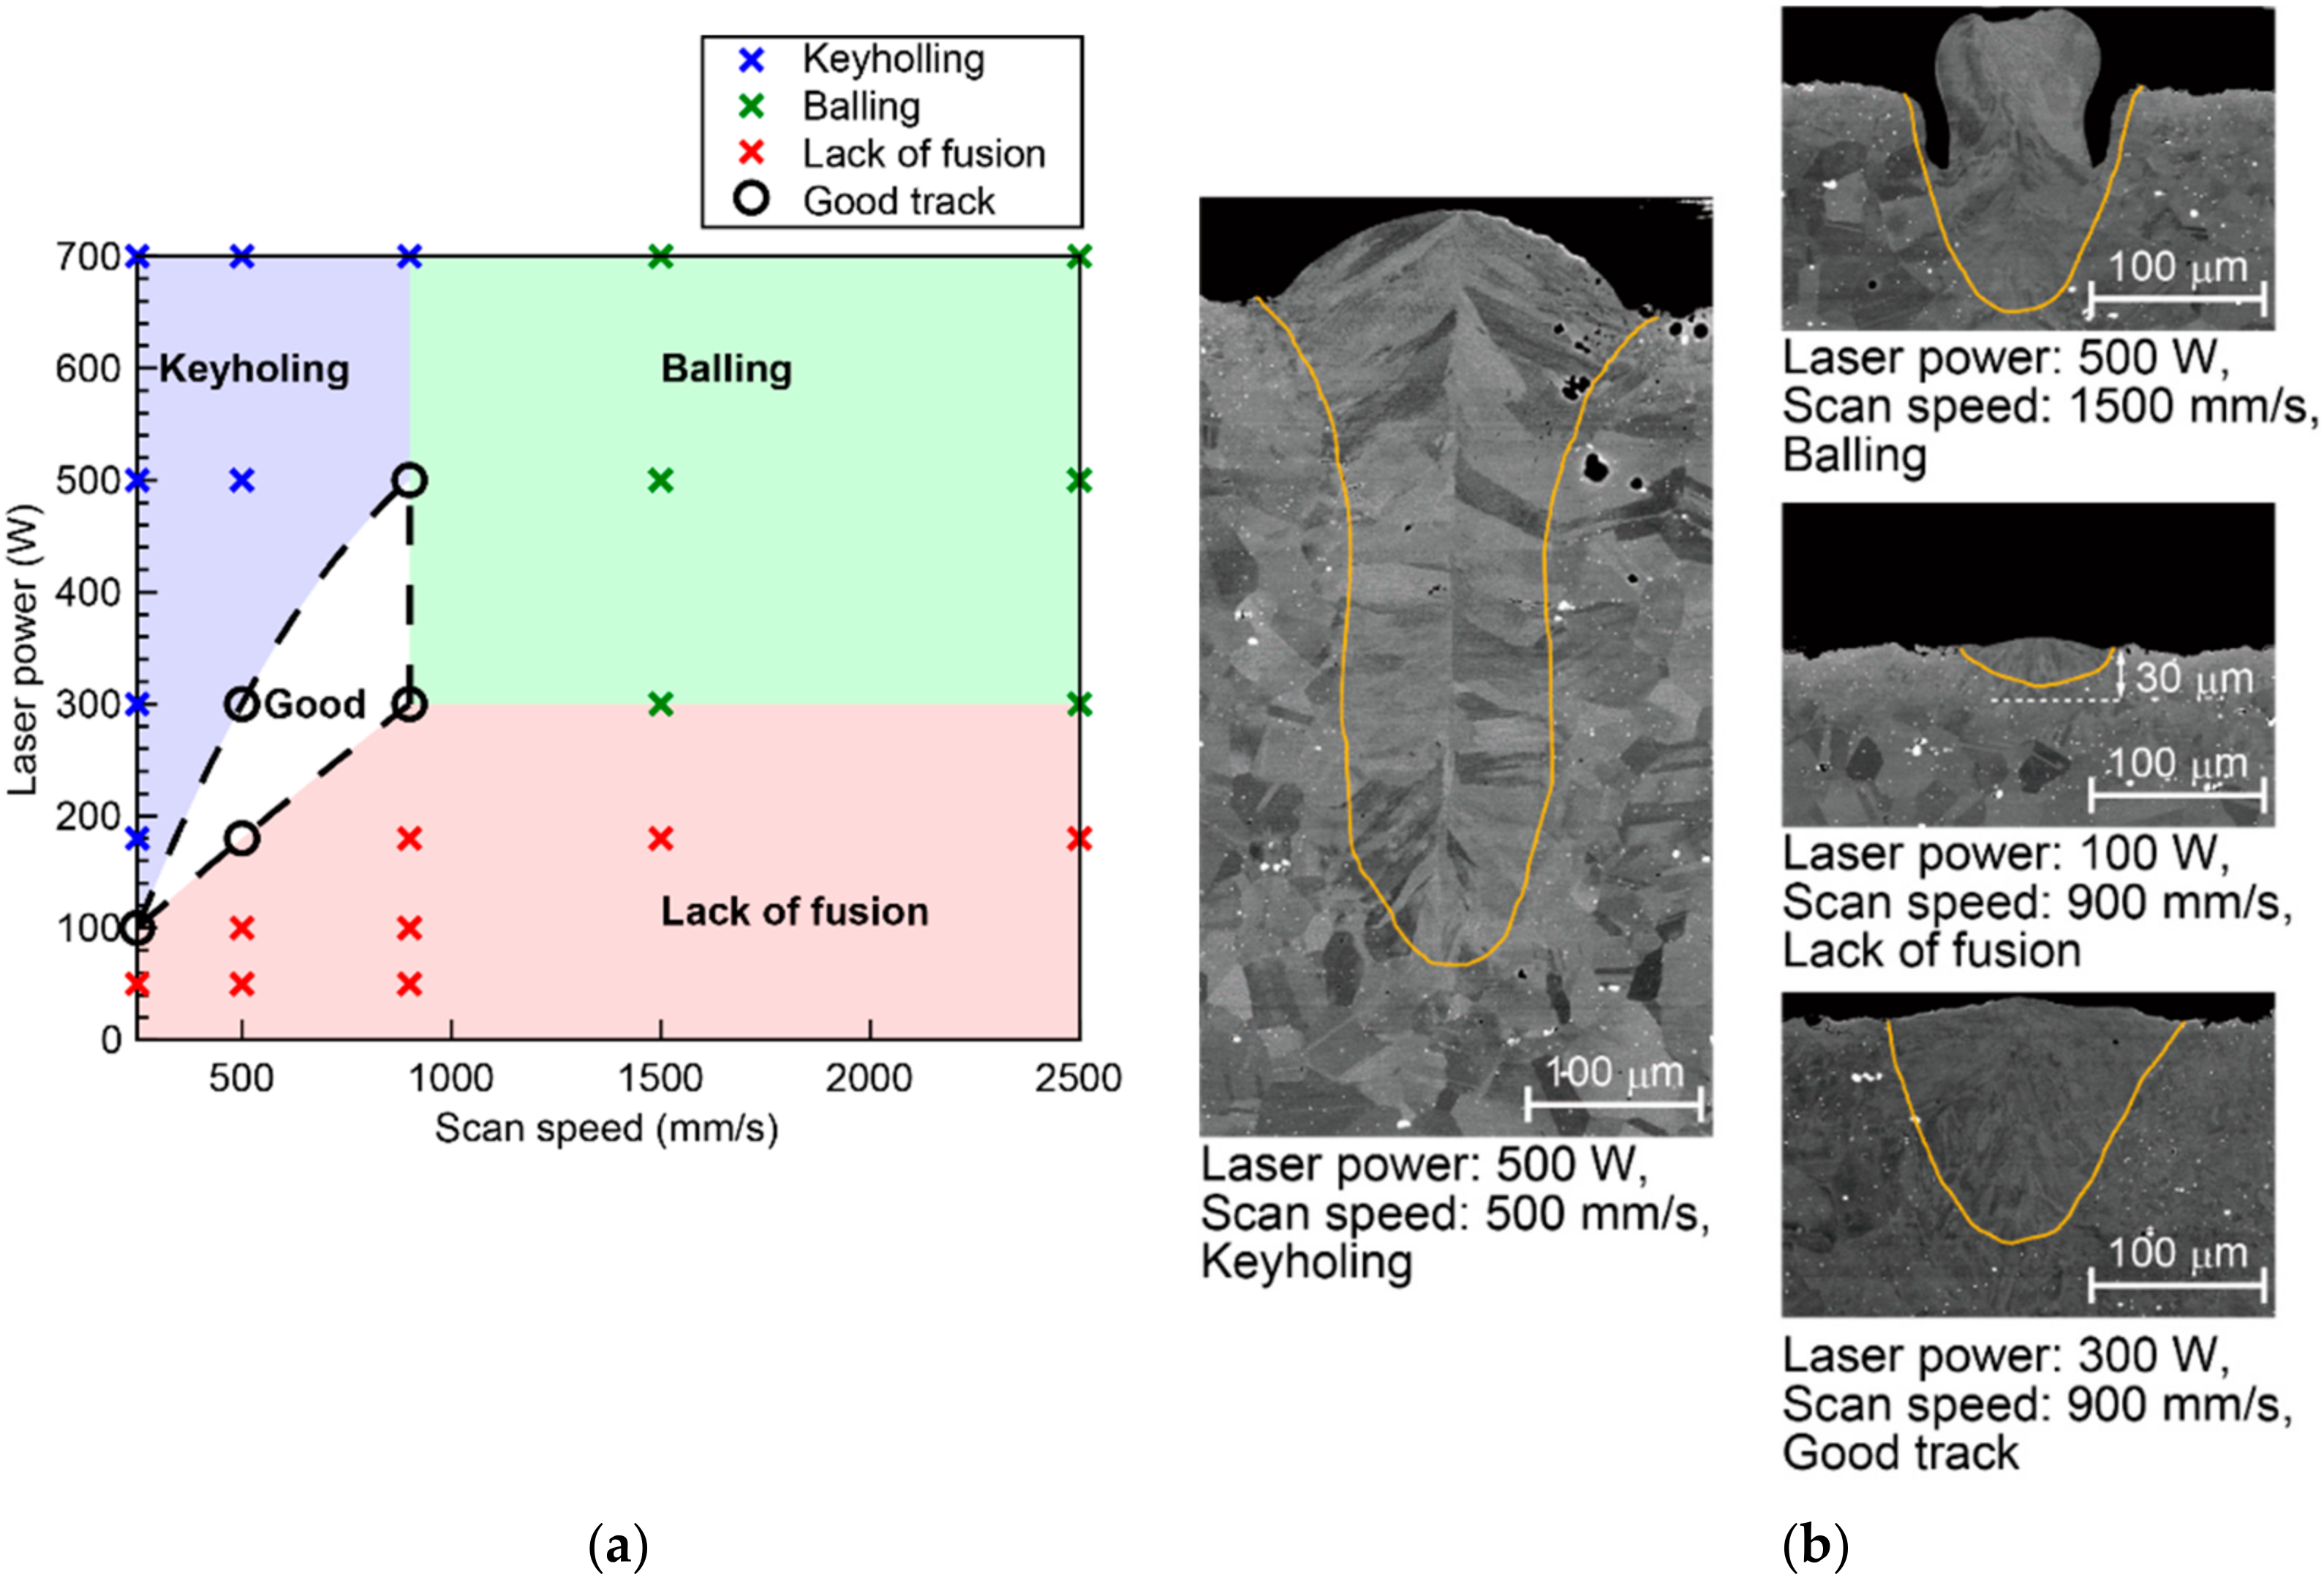
Using the melt pool shape information obtained from the single-track test, the defect-free area was evaluated. As a result, it was determined that keyholing occurred under high laser power and low scan speed, balling occurred under high laser power and high scan speed, and residual unmelted areas occurred under low laser power and high scan speed. This trend was found to be consistent with previous findings.
(2)
As a result of predicting the occurrence of solidification cracks under laser irradiation conditions in and near the defect-free area in the laser power-scan speed map, it was found that solidification cracks may occur even in the defect-free area. This result indicates the need for determining an appropriate process parameter range that considers the occurrence of cracks.
(3)
As a result of using Bayesian optimization to determine the optimal process parameter to avoid defects and cracks, the optimal molding conditions could be found in approximately half the number of calculations compared with grid-based sampling.
(4)
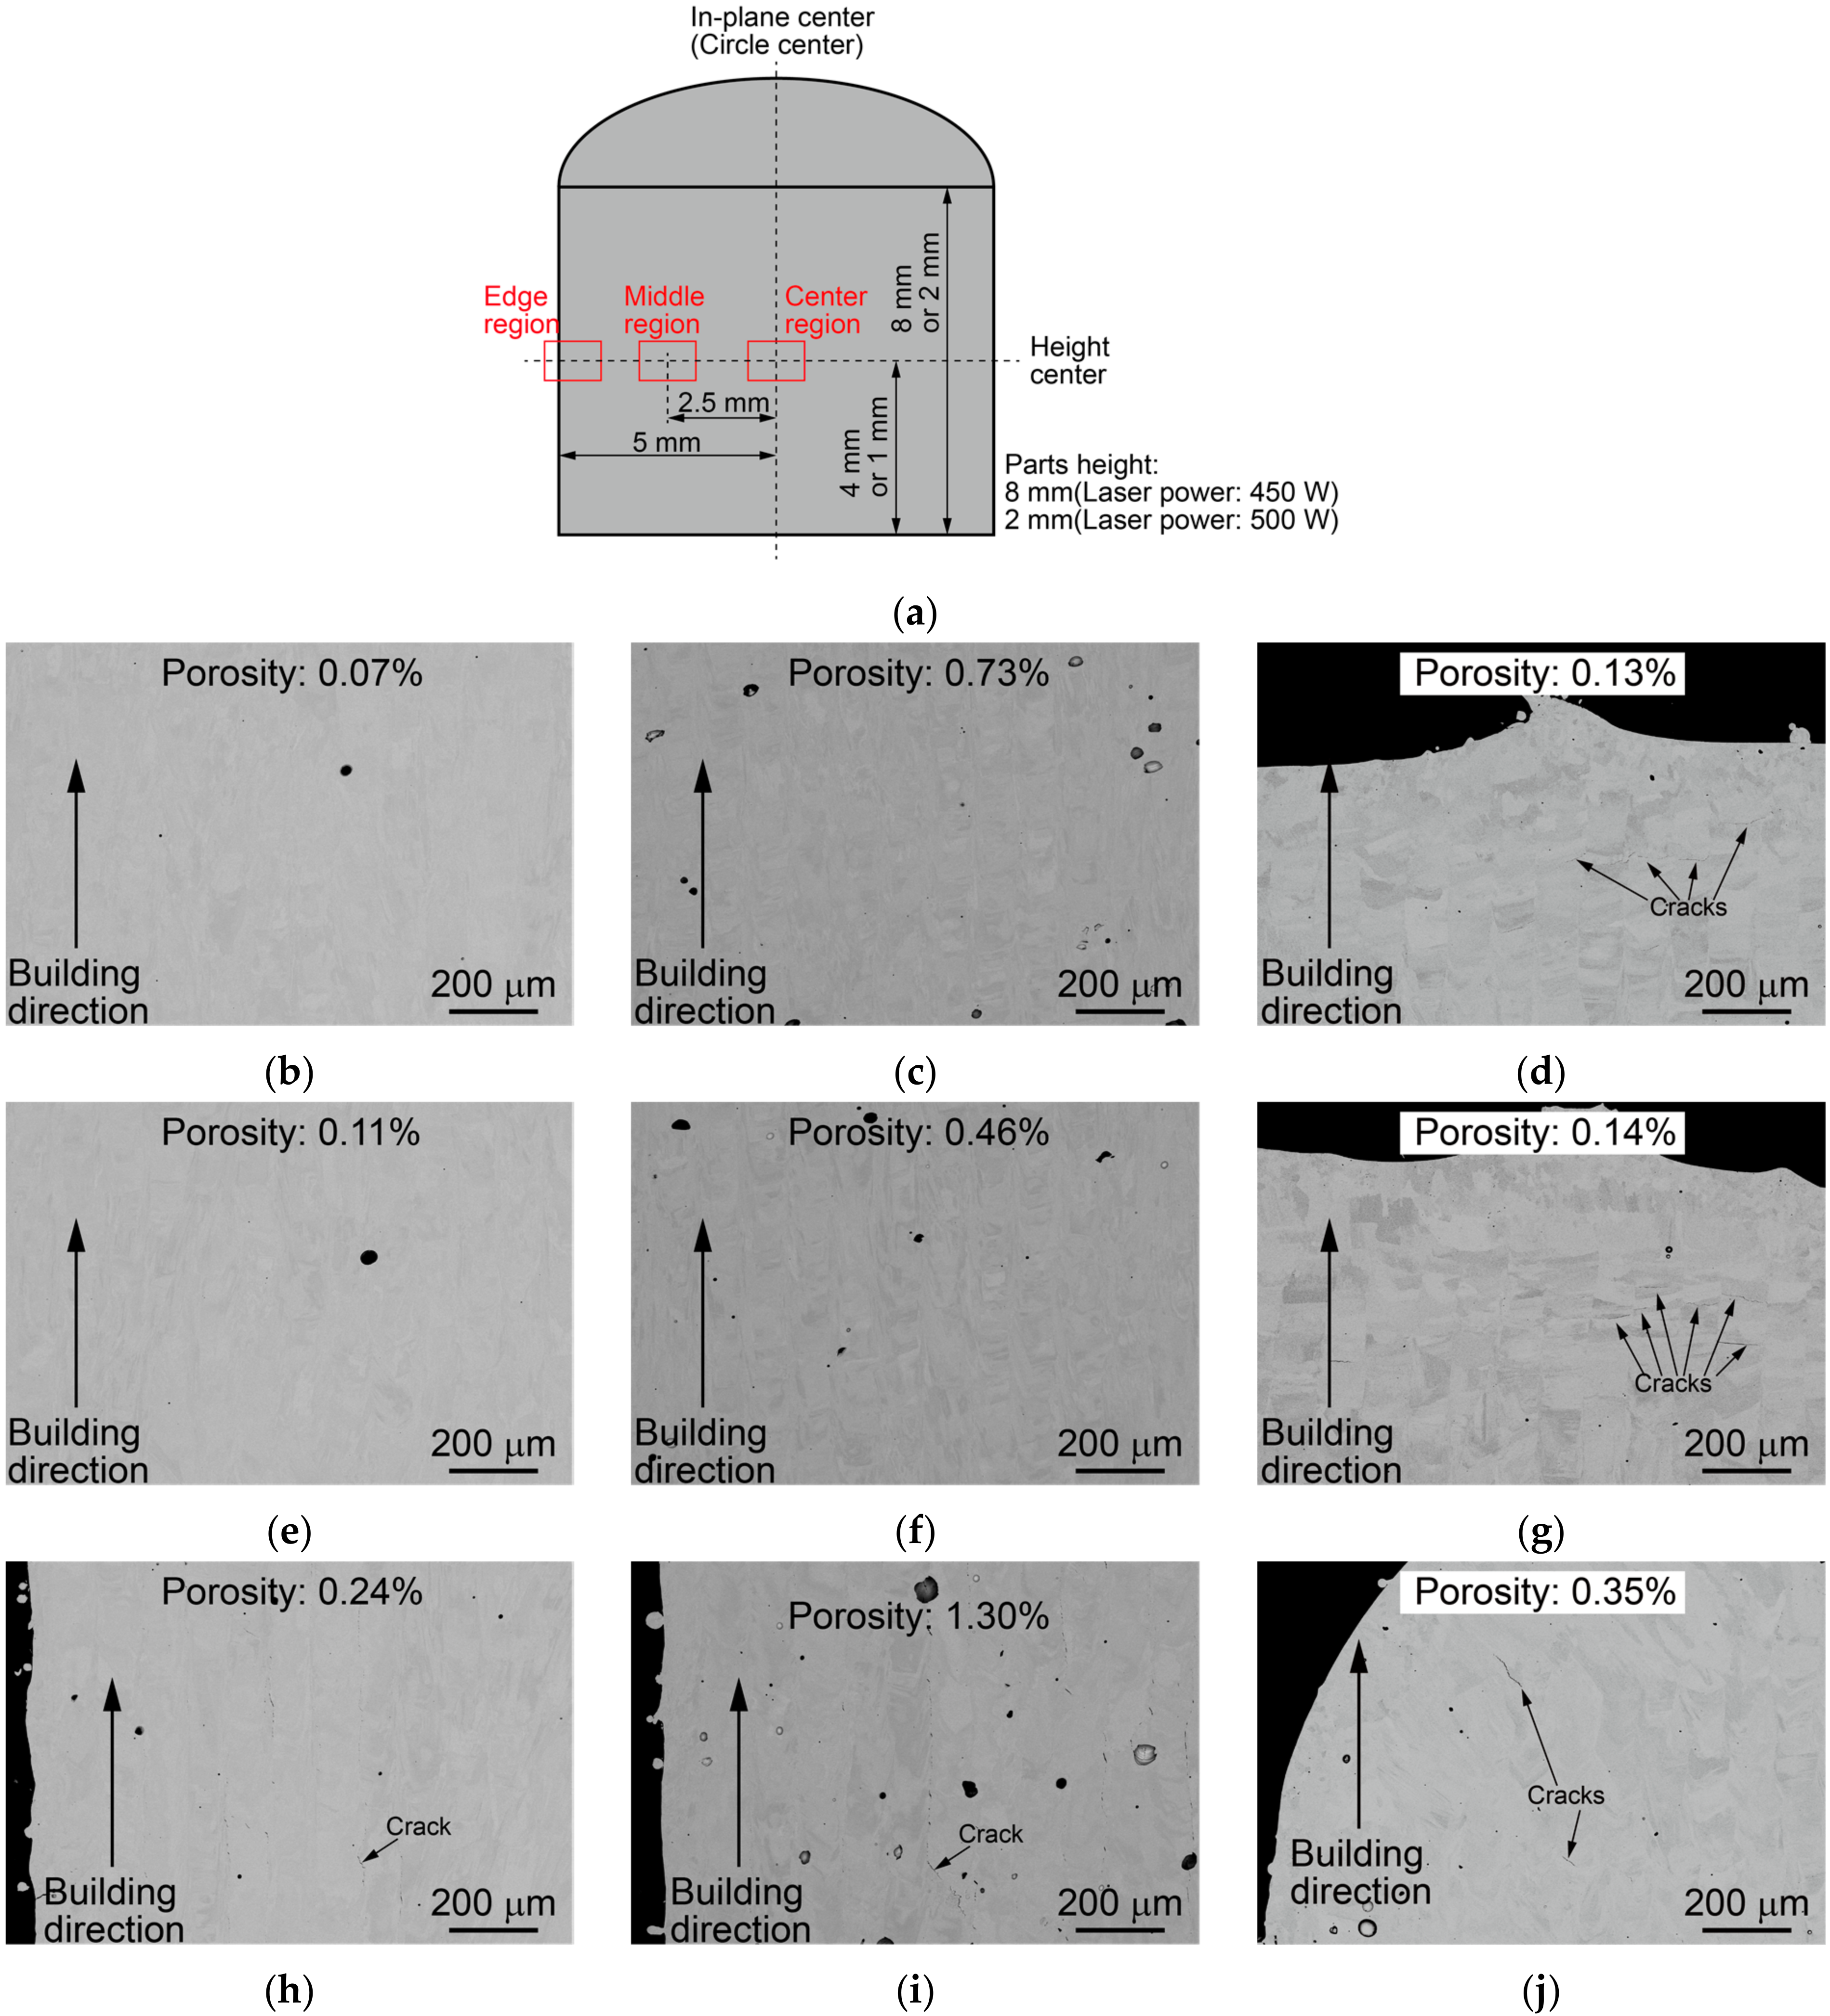
As a result of fabricating a cylindrical sample under the obtained optimal process parameter, the optimal process parameter could help fabricate a part with almost no defects or cracks, except for the edges, confirming the effectiveness of the proposed framework.
(5)
The cracking near the edge was considered to be caused by the change in temperature and strain state due to the laser turnover. In order to achieve the parts fabrication without defects and cracking over the entire cross section, optimizing the scan strategy will be needed.

Author Contributions

Conceptualization: H.K., M.W.; Methodology: H.K.; Investigation: M.K., M.T.; Formal analysis: M.K., M.T.; Software: H.K.; Validation: H.K.; Writing—original draft: H.K.; Writing—review and editing: M.W.; Supervision: A.Y.; M.W. All authors have read and agreed to the published version of the manuscript.

Funding

This work was supported by the Council for Science, Technology and Innovation (CSTI), Cross-ministerial Strategic Innovation Promotion Program (SIP), “Materials Integration for revolutionary design system of structural materials” (Funding agency: JST).

Institutional Review Board Statement

Not applicable.

Informed Consent Statement

Not applicable.

Data Availability Statement

Not applicable.

Acknowledgments

Financial support from the Council for Science, Technology and Innovation (CSTI), Cross-ministerial Strategic Innovation Promotion Program (SIP), “Materials Integration’ for revolutionary design system of structural materials” (Funding agency: JST) is gratefully acknowledged.

Conflicts of Interest

The authors declare no conflict of interest. The funders had no role in the study design; in the collection, analyses, or interpretation of data; in the writing of the manuscript; or in the decision to publish the results.

References

  1. Cai, C.; Wu, X.; Liu, W.; Zhu, W.; Chen, H.; Qiu, J.C.D.; Sun, C.; Liu, J.; Wei, Q.; Shi, Y. Selective laser melting of near-α titanium alloy Ti-6Al-2Zr-1Mo-1V: Parameter optimization, heat treatment and mechanical performance. J. Mater. Sci. Technol. 2020, 57, 51–64. [Google Scholar] [CrossRef]
  2. Sun, W.; Ma, Y.; Huang, W.; Zhang, W.; Qian, X. Effects of build direction on tensile and fatigue performance of selective laser melting Ti6Al4V titanium alloy. Int. J. Fatigue 2020, 130, 105260. [Google Scholar] [CrossRef]
  3. Grange, D.; Bartout, J.D.; Macquaire, B.; Colin, C. Processing a non-weldable nickel-base superalloy by selective laser melting: Role of the shape and size of the melt pools on solidification cracking. Materials 2020, 12, 100686. [Google Scholar] [CrossRef]
  4. Wang, G.; Huang, L.; Liu, Z.; Qin, Z.; He, W.; Liu, F.; Chen, C.; Nie, Y. Process optimization and mechanical properties of oxide dispersion strengthened nickel-based superalloy by selective laser melting. Mater. Des. 2020, 188, 108418. [Google Scholar] [CrossRef]
  5. Wang, F. Mechanical property study on rapid additive layer manufacture Hastelloy® X alloy by selective laser melting technology. Int. J. Adv. Manuf. Technol. 2012, 58, 545–551. [Google Scholar] [CrossRef]
  6. Keshavarzkermani, A.; Esmaeilizadeh, R.; Ali, U.; Enrique, P.D.; Mahmoodkhani, Y.; Zhou, N.Y.; Bonakdar, A.; Toyserkani, E. Controlling mechanical properties of additively manufactured Hastelloy X by altering solidification pattern during laser powder-bed fusion. Mater. Sci. Eng. A 2019, 762, 138081. [Google Scholar] [CrossRef]
  7. Tonelli, L.; Liverani, E.; Valli, G.; Fortunato, A.; Ceschini, L. Effects of powders and process parameters on density and hardness of A357 aluminum alloy fabricated by selective laser melting. Int. J. Adv. Manuf. Technol. 2020, 106, 371–383. [Google Scholar] [CrossRef]
  8. Yan, Q.; Song, B.; Shi, Y. Comparative study of performance comparison of AlSi10Mg alloy prepared by selective laser melting and casting. J. Mater. Sci. Technol. 2020, 41, 199–208. [Google Scholar] [CrossRef]
  9. Liu, J.; Song, Y.; Chen, C.; Wang, X.; Li, H.; Zhou, C.; Wang, J.; Guo, K.; Sun, J. Effect of scanning speed on the microstructure and mechanical behavior of 316L stainless steel fabricated by selective laser melting. Mater. Des. 2020, 186, 108355. [Google Scholar] [CrossRef]
  10. Ghayoor, M.; Lee, K.; He, Y.; Chang, C.; Paul, B.K.; Pasebani, S. Selective laser melting of 304L stainless steel: Role of volumetric energy density on the microstructure, texture and mechanical properties. Addit. Manuf. 2020, 32, 101011. [Google Scholar] [CrossRef]
  11. Seede, R.; Shoukr, D.; Zhang, B.; Whitt, A.; Gibbons, S.; Flater, P.; Elwany, A.; Arroyave, R.; Karaman, I. An ultra-high strength martensitic steel fabricated using selective laser melting additive manufacturing: Densification, microstructure, and mechanical properties. Acta Mater. 2020, 86, 199–214. [Google Scholar] [CrossRef]
  12. Shrestha, S.; Starr, T.; Chou, K. A study of keyhole porosity in selective laser melting: Single-track scanning with micro-CT analysis. ASME. J. Manuf. Sci. Eng. 2019, 141, 071004. [Google Scholar] [CrossRef]
  13. Roehling, J.D.; Perron, A.; Fattebert, J.L.; Haxhimali, T.; Guss, G.; Li, T.T.; Bober, D.; Stokes, A.W.; Clarke, A.J.; Turchi, P.E.A.; et al. Rapid solidification in bulk Ti–Nb alloys by single-track laser melting. JOM 2018, 70, 1589–1597. [Google Scholar] [CrossRef]
  14. Li, R.; Liu, J.; Shi, Y.; Wang, L.; Jiang, W. Balling behavior of stainless steel and nickel powder during selective laser melting process. Int. J. Adv. Manuf. Technol. 2012, 59, 1025–1035. [Google Scholar] [CrossRef]
  15. Yadav, P.; Rigo, O.; Arvieu, C.; Le Guen, E.; Lacoste, E. In situ monitoring systems of the SLM process: On the need to develop machine learning models for data processing. Crystals 2020, 10, 524. [Google Scholar] [CrossRef]
  16. Kitano, H.; Tsujii, M.; Kusano, M.; Yumoto, A.; Watanabe, M. Effect of plastic strain on the solidification cracking of Hastelloy-X in the selective laser melting process. Addit. Manuf. 2020, 37, 101742. [Google Scholar] [CrossRef]
  17. Marchese, G.; Basile, G.; Bassini, E.; Aversa, A.; Lombardi, M.; Ugues, D.; Fino, P.; Biamino, S. Study of the Microstructure and Cracking Mechanisms of Hastelloy X Produced by Laser Powder Bed Fusion. Materials 2018, 11, 106. [Google Scholar] [CrossRef] [Green Version]
  18. Lippold, J.; Sowards, J.; Murray, G.; Alexandrov, B.; Ramirez, A. Weld Solidification Cracking in Solid-Solution Strengthened Ni-Base Filler Metals. Hot Cracking Phenomena in Welds II; Springer: Berlin/Heidelberg, Germany, 2008; pp. 147–170. [Google Scholar]
  19. Draxler, J.; Edberg, J.; Andersson, J.; Lindgren, L. Modeling and simulation of weld solidification cracking part III. Weld. World 2019, 63, 1883–1901. [Google Scholar] [CrossRef] [Green Version]
  20. Wu, W.; Tsai, H. Hot cracking susceptibility of fillers 52 and 82 in alloy 690. Metall. Mater. Trans. A 1999, 30, 417–426. [Google Scholar] [CrossRef]
  21. Terner, M.; Ricordel, T.; Cho, J.H.; Lee, J.S. The Response Surface Methodology for Optimizing the Process Parameters of Selective Laser Melting. J. Weld. Join 2019, 37, 27–39. [Google Scholar] [CrossRef]
  22. Gelbart, M.A.; Snoek, J.; Adams, R.P. Bayesian optimization with unknown constraints. In Proceedings of the Thirtieth Conference on Uncertainty in Artificial Intelligence, Quebec, QC, Canada, 23–27 July 2014; pp. 250–259. [Google Scholar]
  23. Jones, D.R.; Schonlau, M.; Welch, W.J. Efficient global optimization of expensive black-box functions. J. Glob. Optim. 1998, 13, 455–492. [Google Scholar] [CrossRef]
  24. Mockus, J.; Tiesis, V.; Zilinskas, A. The application of Bayesian methods for seeking the extremum. In Towards Global Optimization 2; Dixon, L.C.W., Szegö, G.P., Eds.; North-Holland: New York, NY, USA, 1978; Volume 30, pp. 117–129. [Google Scholar]
  25. Bull, A.D. Convergence rates of efficient global optimization algorithms. J. Mach. Learn. Res. 2011, 11, 2879–2904. [Google Scholar]
  26. Snoek, J.; Larochelle, H.; Adams, R. Practical Bayesian optimization of machine learning algorithms. In Proceedings of the Advances in Neural Information Processing Systems 25 (NIPS 2012), Lake Tahoe, NV, USA, 3–6 December 2012; pp. 2960–2968. [Google Scholar]
  27. MacKay, D. Bayesian interpolation. Neural Comput. 1992, 43, 415–447. [Google Scholar] [CrossRef]
  28. Vidakis, N.; Petousis, M.; Vaxevanidis, N.; Kechagias, J. Surface Roughness Investigation of Poly-Jet 3D Printing. Mathematics 2020, 8, 1758. [Google Scholar] [CrossRef]
Figure 1. Outline of the proposed framework for determining appropriate selective laser melting (SLM) process parameter range considering defects and crack occurrence.
Crystals 11 00578 g001
Figure 2. Definitions of W , D and W D / 2
Crystals 11 00578 g002
Figure 3. Relationship between melt pool dimensions with and without the powder layer.
Crystals 11 00578 g003
Figure 4. Finite-element model employed for analysis.
Crystals 11 00578 g004
Figure 5. Scanning electron microscope (SEM) image of Hastelloy-X powder.
Crystals 11 00578 g005
Figure 6. Particle size distribution of Hastelloy-X powder.
Crystals 11 00578 g006
Figure 7. Relationship between melt pool dimensions and laser scan condition: (a) Melt pool width, W ; (b) Melt pool depth, D .
Crystals 11 00578 g007
Figure 8. Defect-free process parameter map and cross-sectional image examples: (a) defect-free process parameter map; (b) cross-sectional image examples.
Crystals 11 00578 g008
Figure 9. Neural network for predicting melt pool dimensions used in this study.
Crystals 11 00578 g009
Figure 10. Comparison between experimental melt pool dimensions and results predicted by the neural network: (a) melt pool width at half melt pool depth W D / 2 ; (b) melt pool depth D .
Crystals 11 00578 g010
Figure 11. Laser irradiation conditions for grid-based sampling and maximum incremental plastic strain distribution in the good track region: (a) laser irradiation conditions for grid-based sampling; (b) maximum incremental plastic strain in the good track region.
Crystals 11 00578 g011
Figure 12. Results of optimal laser irradiation condition search by Bayesian optimization. (Optimal laser power: 447 W, Optimal scan speed: 900 mm/s).
Crystals 11 00578 g012
Figure 13. Results of the cross-sectional observation of cylindrical parts: (a) cross-sectional observation region. (b) Laser power: 450 W, Scan speed: 900 mm/s, center region; (c) Laser power: 450 W, Scan speed: 700 mm/s, center region; (d) Laser power: 500 W, Scan speed: 833 mm/s, center region; (e) Laser power: 450 W, Scan speed: 900 mm/s, middle region; (f) Laser power: 450 W, Scan speed: 700 mm/s, middle region; (g) Laser power: 500 W, Scan speed: 833 mm/s, middle region; (h) Laser power: 450 W, Scan speed: 900 mm/s, edge region; (i) Laser power: 450 W, Scan speed: 700 mm/s, edge region; (j) Laser power: 500 W, Scan speed: 833 mm/s, edge region.
Crystals 11 00578 g013
Table 1. Chemical composition of Hastelloy X base plate, wt%.
NiFeCrCoMoWCSiMnPS
Bal.18.421.61.08.90.60.080.460.480.008<0.002
Table 2. Chemical composition of Hastelloy X powder, wt%.
NiFeCrCoMoWCSiMnPS
Bal.18.122.11.69.00.70.060.10-0.0050.003
Publisher’s Note: MDPI stays neutral with regard to jurisdictional claims in published maps and institutional affiliations.

