
Suppression of Acoustic Resonances in BST-Based Bulk-Ceramic Varactors by Addition of Magnesium Borate

 , ,
, ,
Abstract
:
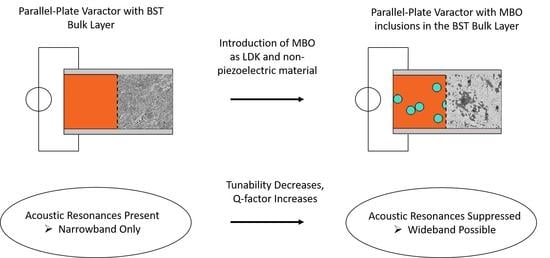
1. Introduction
2. Acoustic Resonances Methodology
2.1. Theory
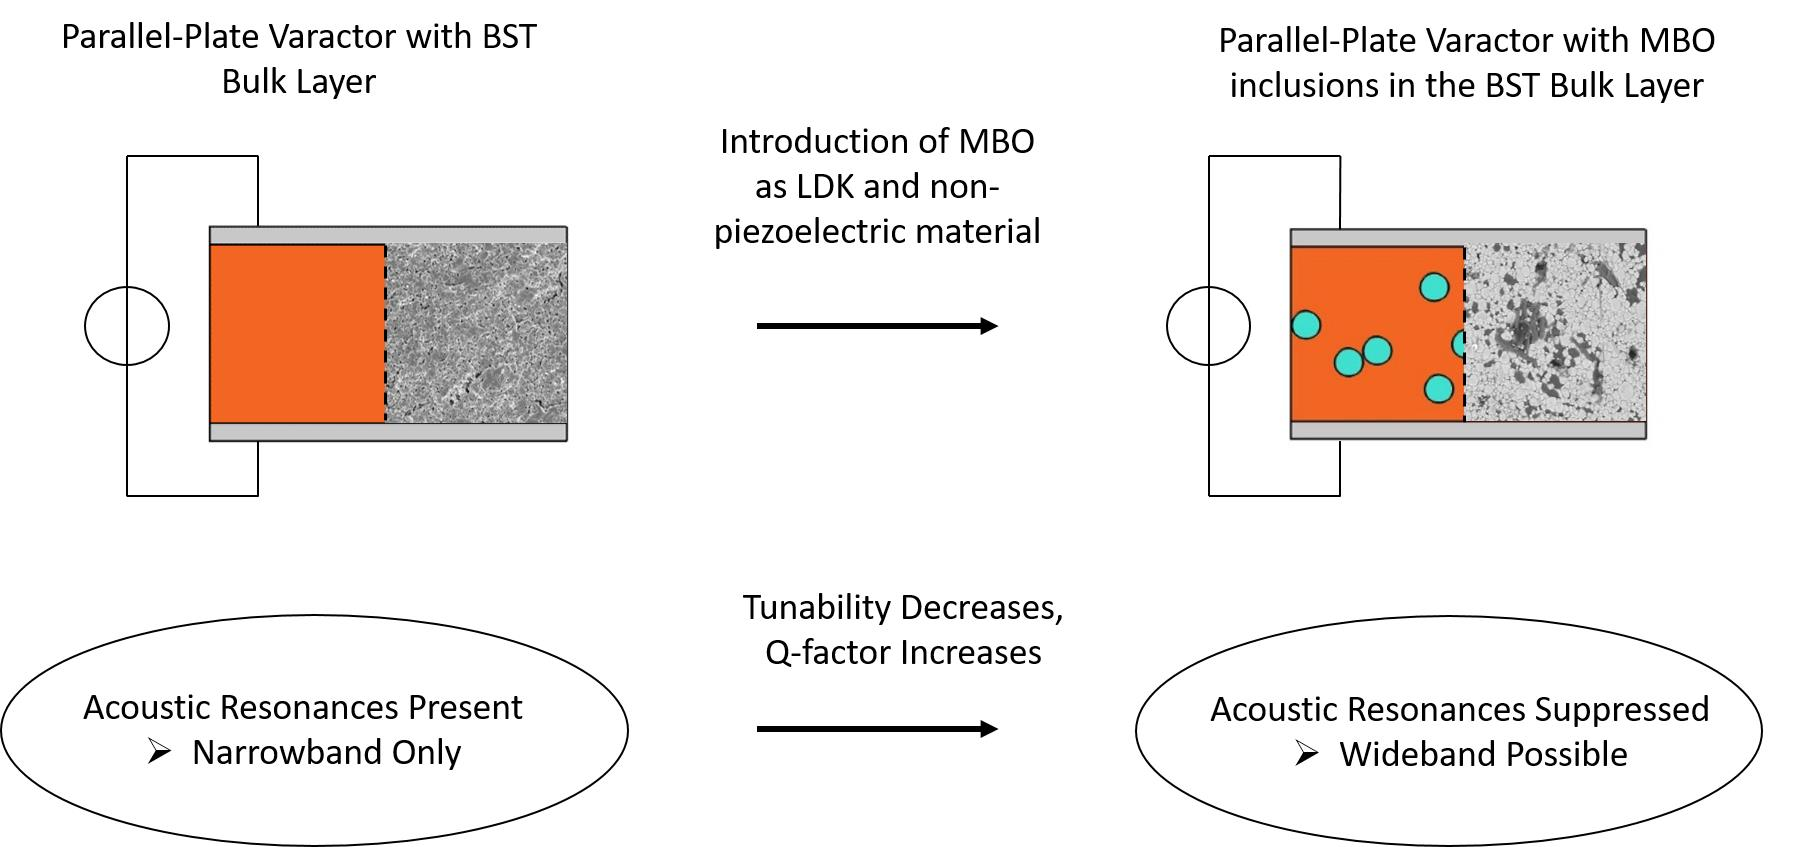
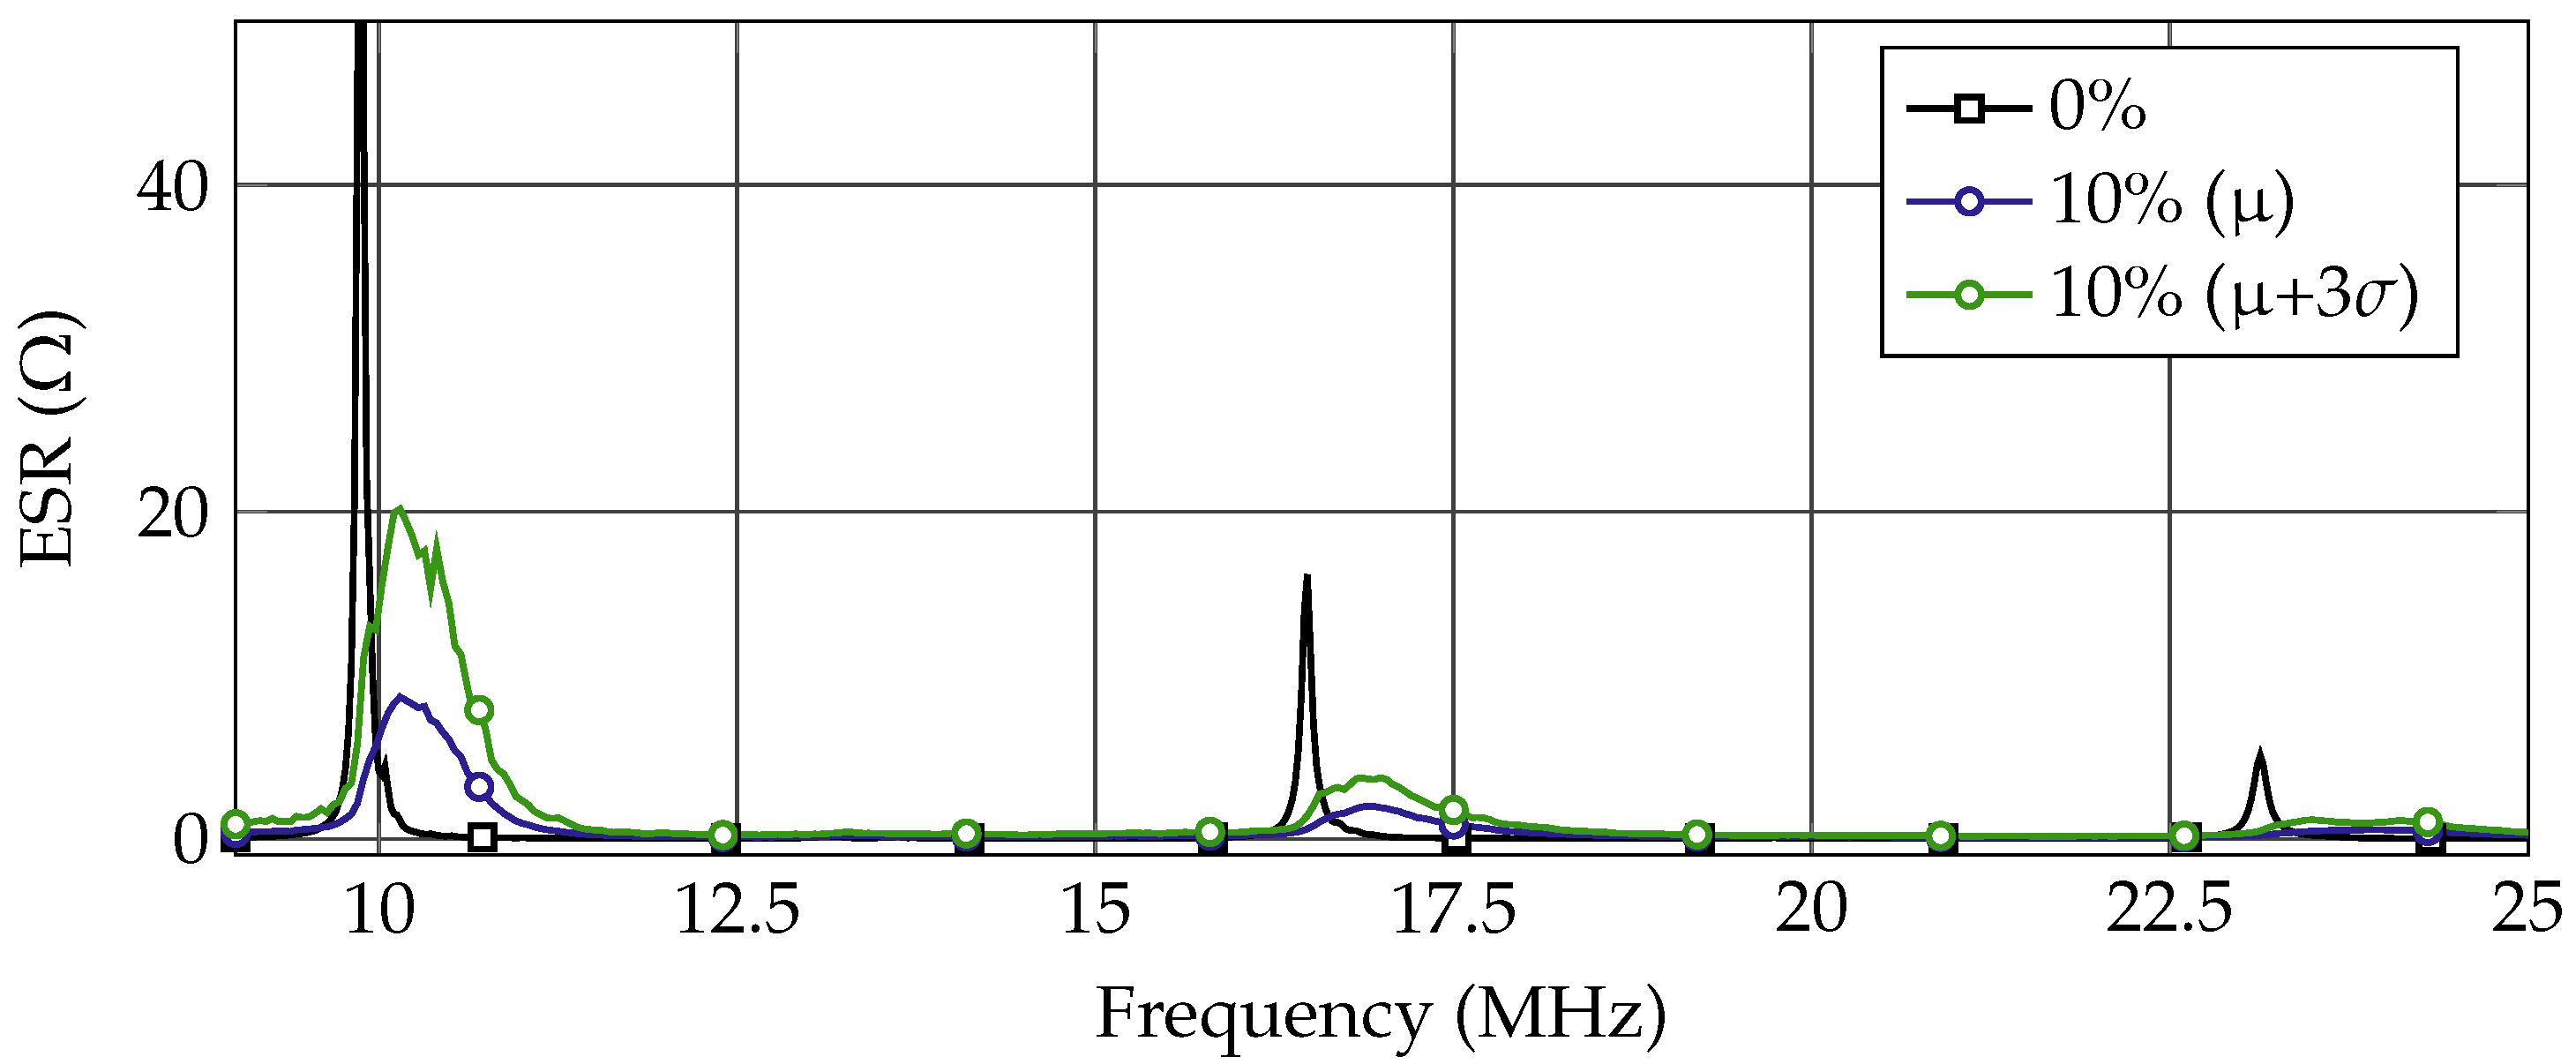
2.2. Simulative Analysis
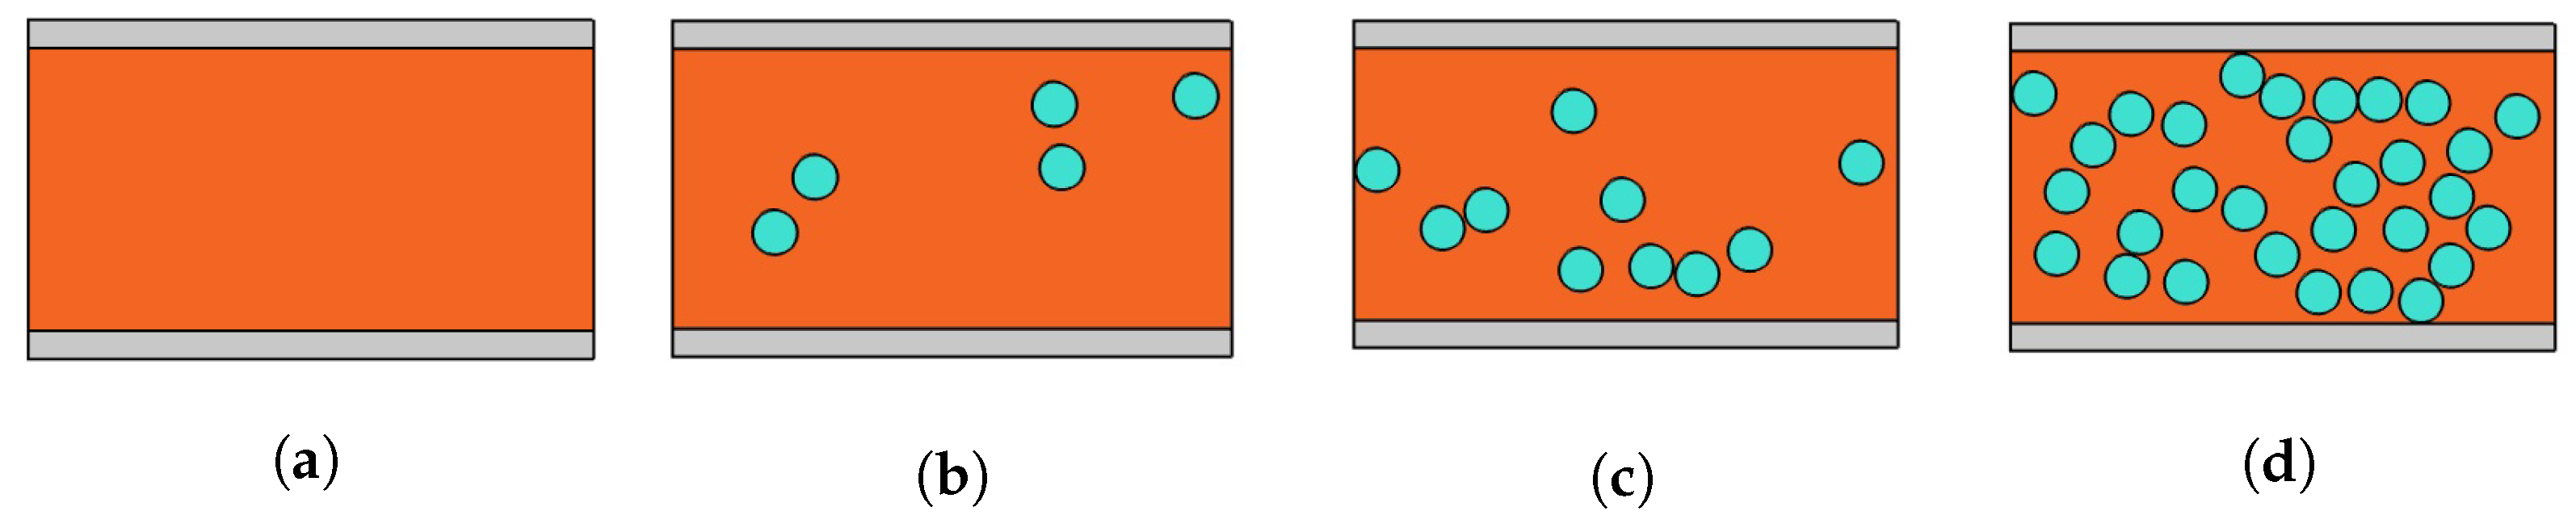
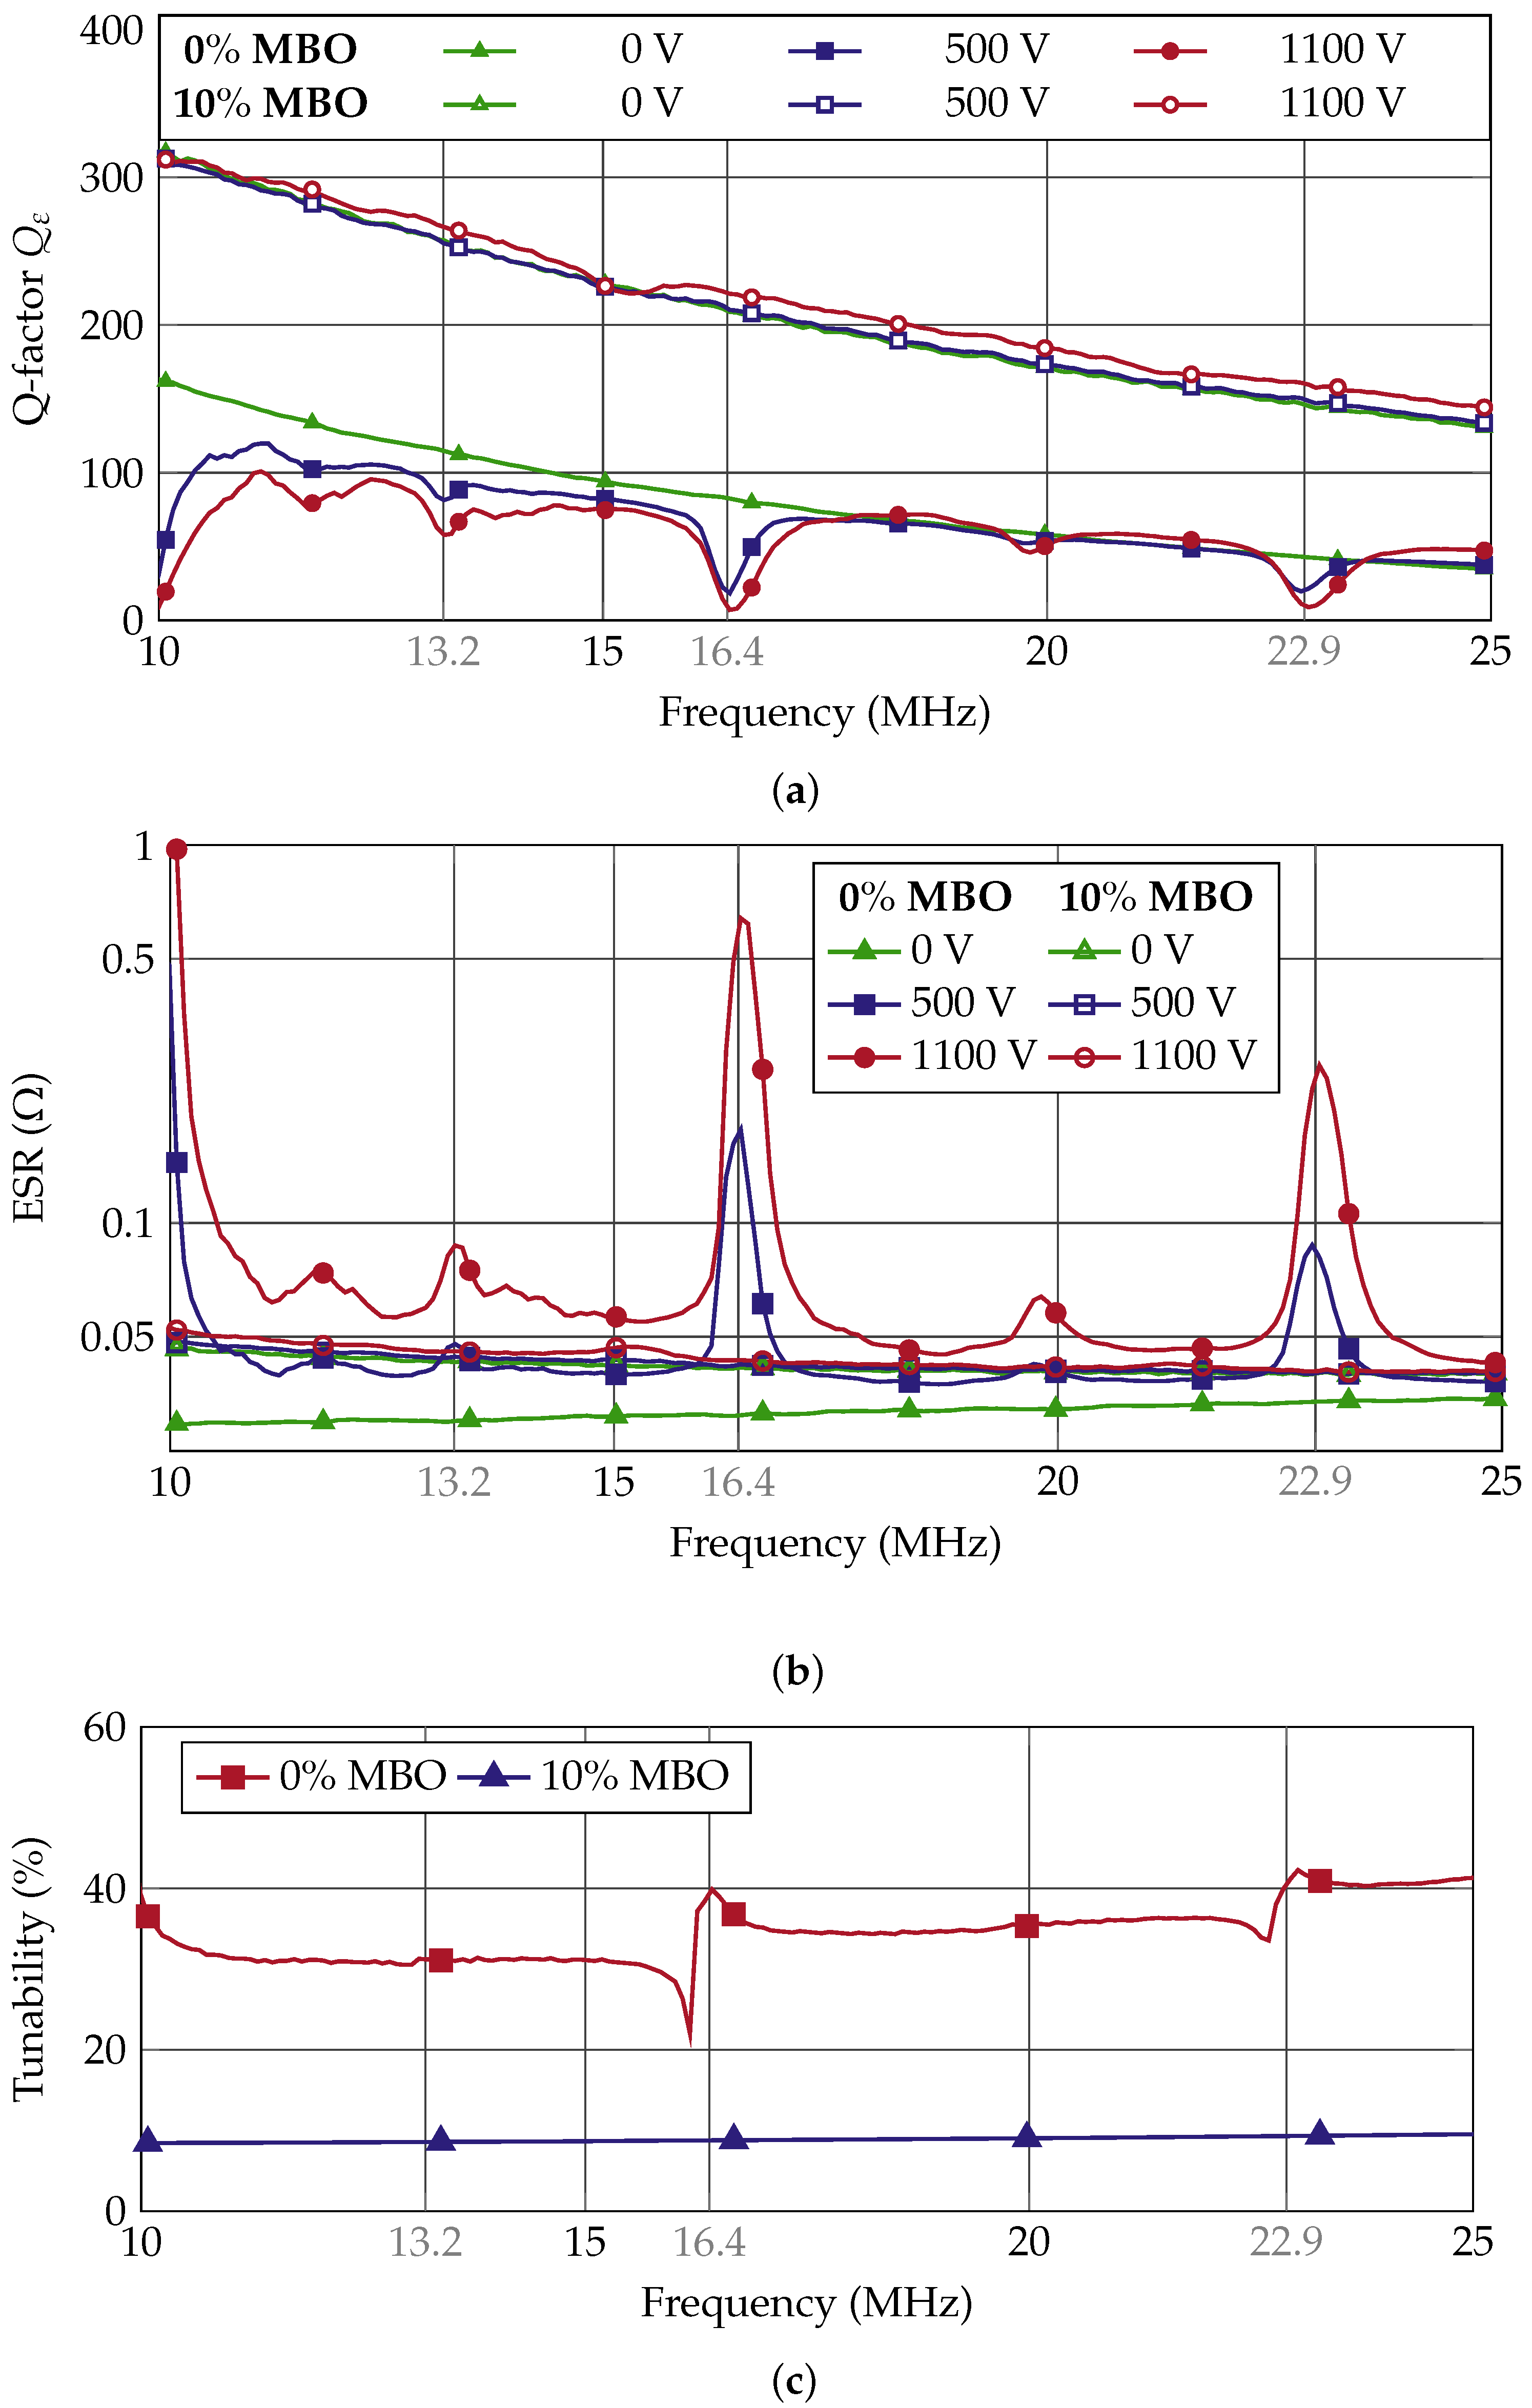
3. Varactor Design and Characterization
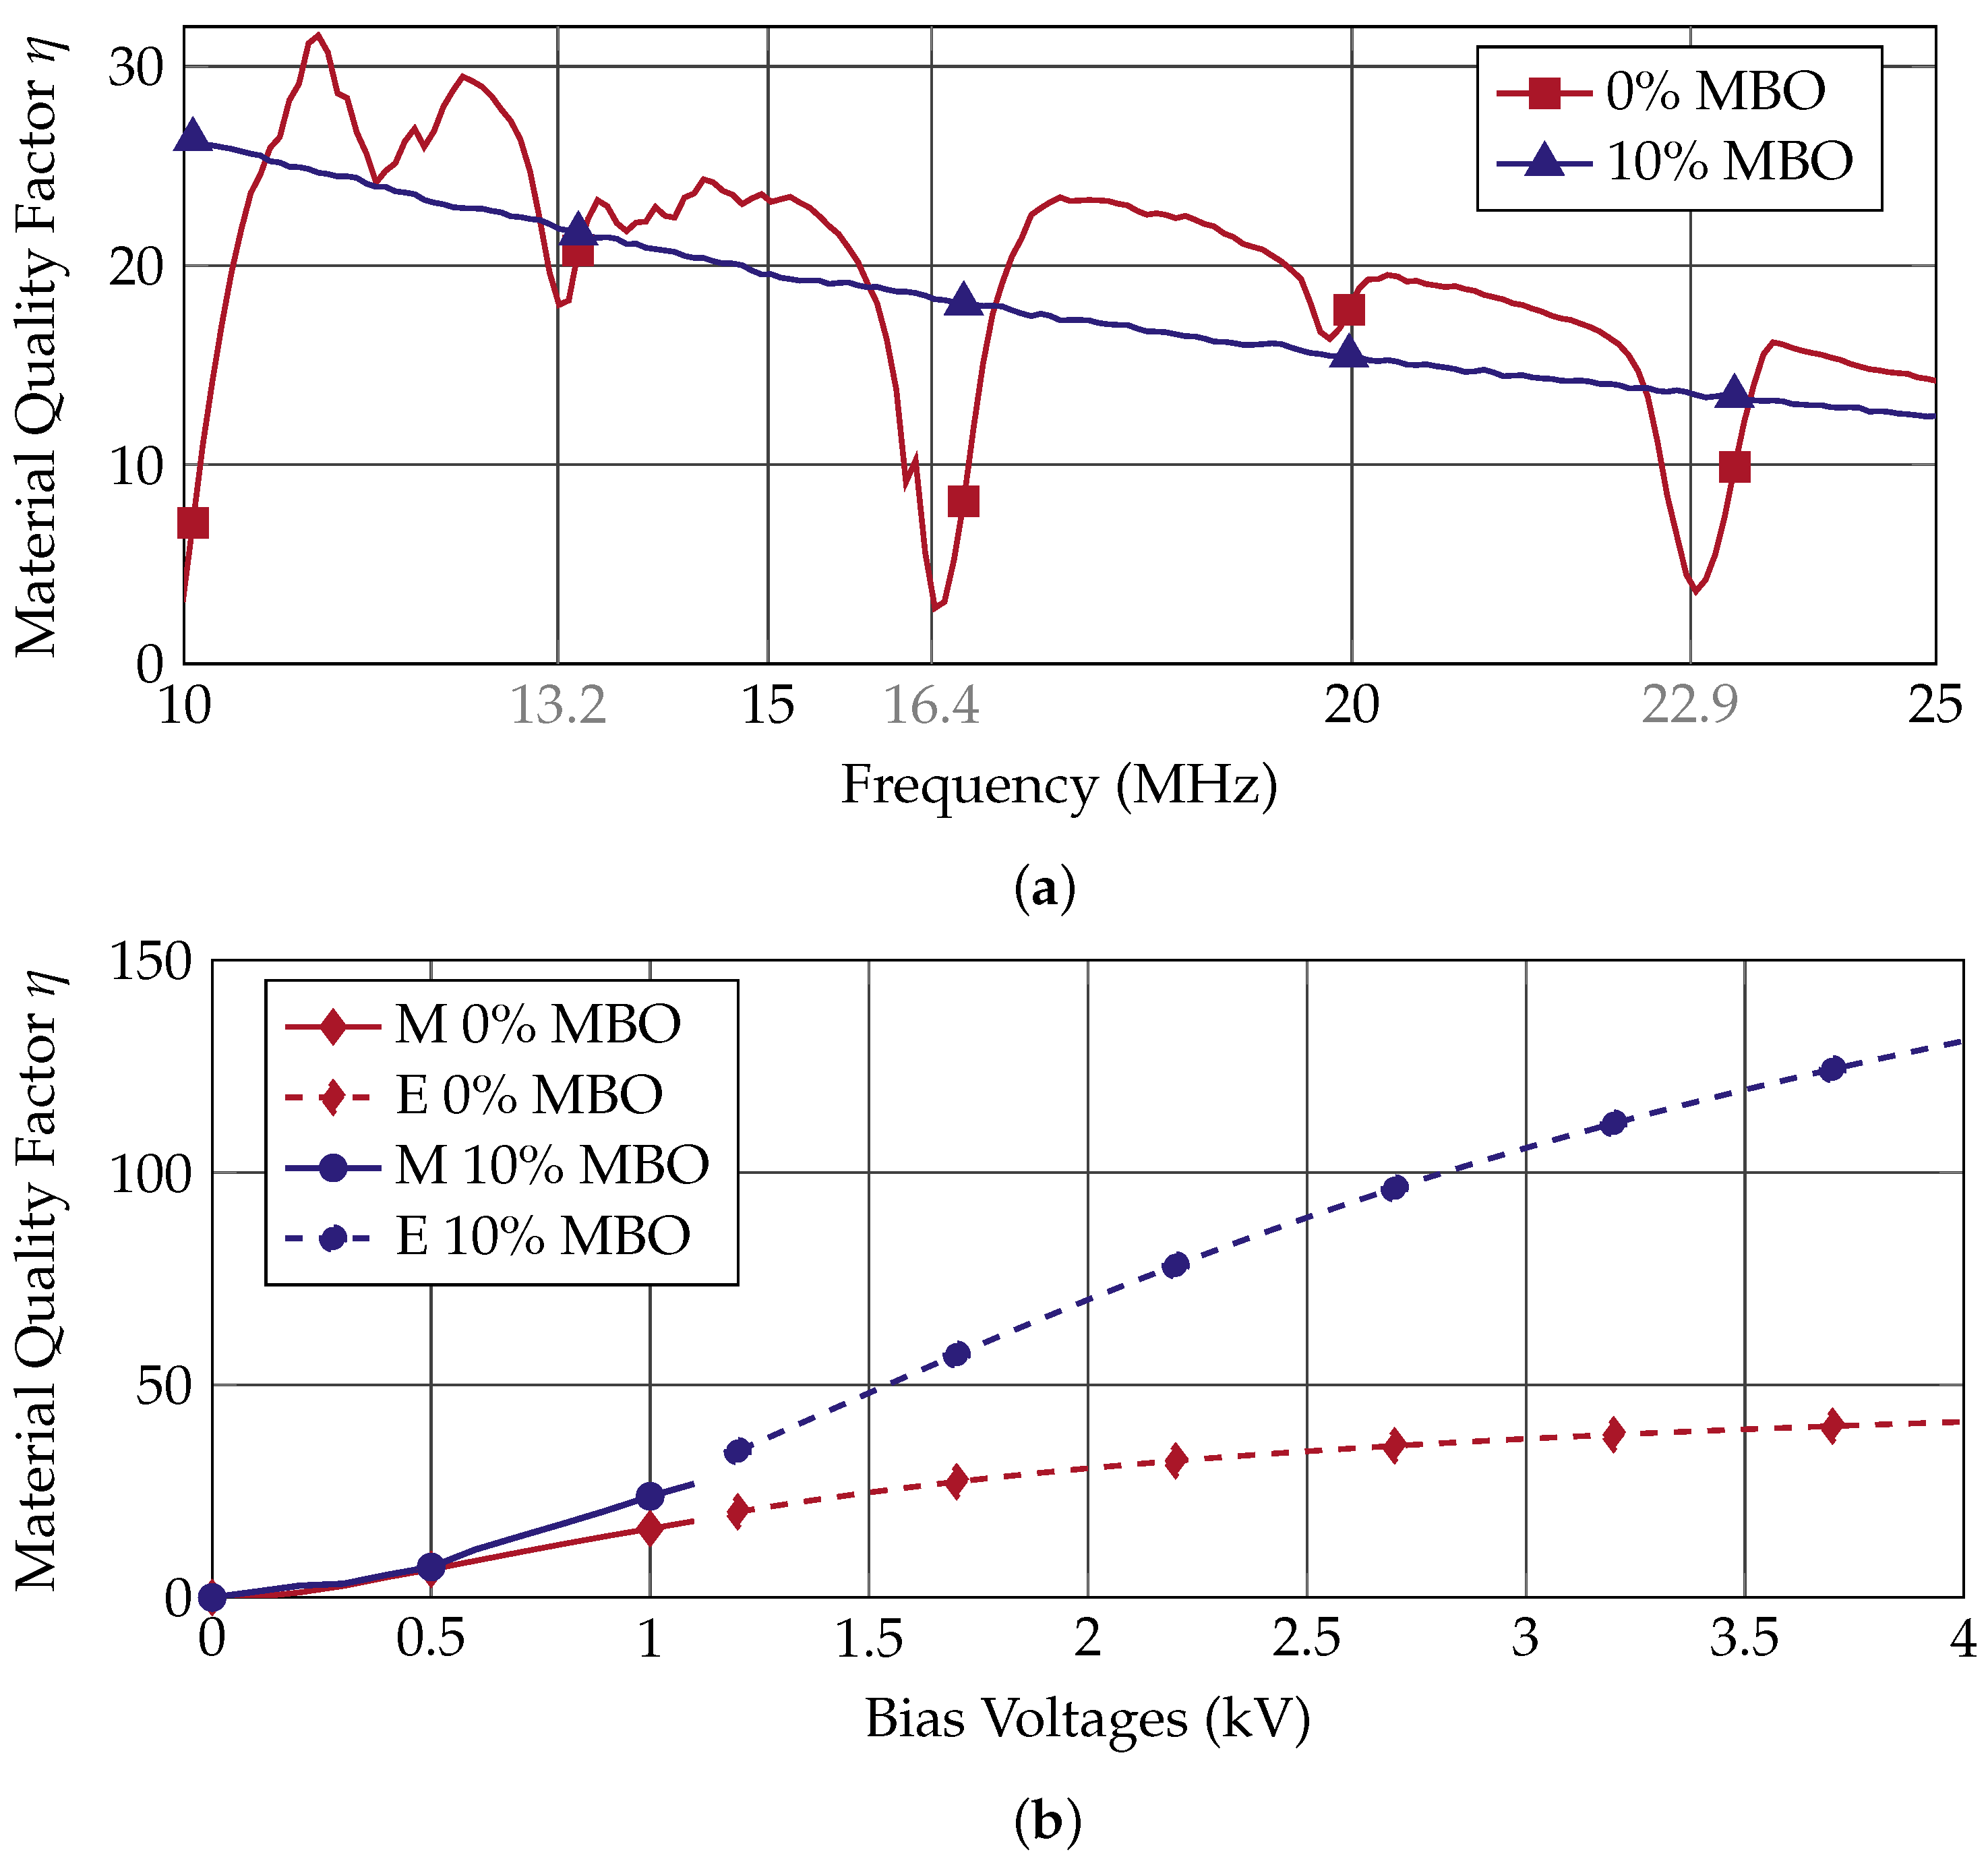
4. Evaluation
5. Conclusions
Author Contributions
Funding
Institutional Review Board Statement
Informed Consent Statement
Data Availability Statement
Conflicts of Interest
Sample Availability
References
- Fang, F. Towards atomic and close-to-atomic scale manufacturing. Int. J. Extrem. Manuf. 2012, 1, 012001. [Google Scholar] [CrossRef]
- Kanarik, K.J.; Tan, S.; Gottscho, R.A. Atomic Layer Etching: Rethinking the Art of Etch. Int. J. Phys. Chem. Lett. 2018, 9, 4814–4821. [Google Scholar] [CrossRef] [PubMed] [Green Version]
- Chen, Y. Tunable Decoupling and Matching Concepts for Compact Mobile Terminal Antennas. Ph.D. Dissertation, Gottfried Wilhelm Leibniz Universität Hannover, Hannover, Germany, 2017. [Google Scholar]
- Andersson, C.M.; Ejebjork, N.; Henry, A.; Andersson, S.; Janzen, E.; Zirath, H.; Rorsman, N. A SiC Varactor With Large Effective Tuning Range for Microwave Power Applications. IEEE Electron Device Lett. 2011, 32, 788–790. [Google Scholar] [CrossRef] [Green Version]
- Streeter, R.D.; Hall, C.A.; Wood, R.; Mahadevan, R. VHF High-Power Tunable RF Bandpass Filter Using Microelectromechanical (MEM) Microrelays. Int. J. RF Microw. Comput. Aided Eng. 2001, 11, 261–275. [Google Scholar] [CrossRef]
- Preis, S.; Wiens, A.; Kienemund, D.; Kendig, D.; Maune, H.; Jakoby, R.; Heinrich, W.; Bengtsson, O. Discrete RF-power MIM BST thick-film varactors. In Proceedings of the European Microwave Conference (EuMC), Paris, France, 7–10 September 2015; pp. 941–944. [Google Scholar]
- Kienemund, D.; Walk, D.; Bohn, N.; Binder, J.R.; Jakoby, R.; Maune, H. Proceedings of the 48th European Microwave Conference Suppression of Acoustic Resonances in Fully-Printed, BST Thick Film Varactors Utilizing Double MIM Structures. In Proceedings of the 48th European Microwave Conference, Madrid, Spain, 23–27 September 2018; pp. 567–570. [Google Scholar]
- Jeon, J.H. Effect of SrTiO3 concentration and sintering temperature on microstructure and dielectric constant of Ba1-xSrxTiO3. J. Eur. Ceram. Soc. 2004, 24, 1045–1048. [Google Scholar] [CrossRef]
- Nguyen, Q.M.; Anthony, T.K.; Zaghloul, A.I. Free-Space-Impedance-Matched composite dielectric metamaterial with high refractive index. IEEE Antennas Wirel. Propag. Lett. 2019, 18, 2751–2755. [Google Scholar] [CrossRef]
- Zhang, Q.; Zhai, J.; Yao, X. Dielectric and Percolative Properties of Ba0.5Sr0.5TiO3–Mg3B2O6 Composite Ceramics. J. Am. Ceram. Soc. 2011, 94, 1138–1142. [Google Scholar] [CrossRef]
- Giere, A.; Schafranek, R.; Zheng, Y.; Maune, H.; Sazegar, M.; Jakoby, R.; Klein, A. Characterization of Acoustic Effects in Ferroelectric Thin-Films for Microwave Components. Frequenz 2008, 62, 52–56. [Google Scholar] [CrossRef]
- Ghalem, A.; Huitema, L.; Crunteanu, A.; Rammal, M.; Trupina, L.; Nedelcu, L.; Banciu, M.G.; Dutheil, P.; Constantinescu, C.; Marchet, P.; et al. Electrical transport properties and modelling of electrostrictive resonance phenomena in Ba2/3Sr1/3TiO3 thin films. J. Appl. Phys. 2016, 120, 184101. [Google Scholar] [CrossRef] [Green Version]
- Newnham, R.E.; Sundar, V.; Yimnirun, R.; Su, J.; Zhang, Q.M. Electrostriction: Nonlinear electromechanical coupling in solid dielectrics. J. Phys. Chem. 1997, 101, 10141. [Google Scholar] [CrossRef]
- Li, F.; Jin, L.; Xu, Z.; Zhang, S. Electrostrictive effect in ferroelectrics: An alternative approach to improve piezoelectricity. Appl. Phys. Rev. 2014, 1, 011103. [Google Scholar] [CrossRef] [Green Version]
- Gevorgian, S.; Vorobiev, A.; Lewin, T. DC field and temperature dependent acoustic resonances in parallel-plate capacitors based on srtio3 and ba0.25sr0.75tio3 films: Experiment and modeling. J. Appl. Phys. 2006, 99, 124112. [Google Scholar] [CrossRef]
- Kienemund, D.; Fink, T.; Abrecht, M.; Bigler, W.; Binder, J.R.; Jakoby, R.; Maune, H. A fully-printed, BST MIM varactor for low ISM-band matching networks up to 1000 W. In Proceedings of the 47th European Microwave Conference, Nuremberg, Germany, 10–12 October 2017; pp. 1001–1004. [Google Scholar]
- Abomostafa, H.; Ellamey, M. Studying the mechanical properties of barium strontium titanate ceramics by an ultrasonic pluse echo technique. J. Ovonic Res. 2018, 14, 307–316. [Google Scholar]
- Wiens, A.; Kohler, C.; Hansli, M.; Schuessler, M.; Jost, M.; Maune, M.; Binder, J.R.; Jakoby, R. CAD-assisted modeling of high dielectric contrast composite materials. J. Eur. Ceram. Soc. 2017, 37, 1487–1494. [Google Scholar] [CrossRef]
- Shen, S.; Xin, L.; Ren, L.; Wang, W.; Jin, J.; Zhai, J.; Zhang, M. Effects of non-stoichiometric defects on the dielectric properties of (Ba0.5Sr0.5)xTiO3-ZnGa2O4 composite ceramics. Ceram. Int. 2020, 46, 22391–22396. [Google Scholar] [CrossRef]
- Giere, A. Material- und Bauteiloptimierung Steuerbarer Mikrowellenkomponenten Mit Nichtlinearen Ferroelektrika. Ph.D. Dissertation, Technical University of Darmstadt, Darmstadt, Germany, 2009. [Google Scholar]
- Chase, D.R.; Chen, L.; York, R.A. Modeling the capacitive nonlinearity in thin-film BST varactors. IEEE Trans. Microw. Theory Tech. 2005, 53, 3215–3220. [Google Scholar] [CrossRef]


Publisher’s Note: MDPI stays neutral with regard to jurisdictional claims in published maps and institutional affiliations. |
© 2021 by the authors. Licensee MDPI, Basel, Switzerland. This article is an open access article distributed under the terms and conditions of the Creative Commons Attribution (CC BY) license (https://creativecommons.org/licenses/by/4.0/).
Share and Cite
Agrawal, P.; Kienemund, D.; Walk, D.; Matic, S.; Bohn, N.; Häuser, K.; Fink, T.; Abrecht, M.; Bigler, W.; Binder, J.R.; et al. Suppression of Acoustic Resonances in BST-Based Bulk-Ceramic Varactors by Addition of Magnesium Borate. Crystals 2021, 11, 786. https://0-doi-org.brum.beds.ac.uk/10.3390/cryst11070786
Agrawal P, Kienemund D, Walk D, Matic S, Bohn N, Häuser K, Fink T, Abrecht M, Bigler W, Binder JR, et al. Suppression of Acoustic Resonances in BST-Based Bulk-Ceramic Varactors by Addition of Magnesium Borate. Crystals. 2021; 11(7):786. https://0-doi-org.brum.beds.ac.uk/10.3390/cryst11070786
Chicago/Turabian StyleAgrawal, Prannoy, Daniel Kienemund, Dominik Walk, Stipo Matic, Nicole Bohn, Kevin Häuser, Thomas Fink, Mike Abrecht, Walter Bigler, Joachim R. Binder, and et al. 2021. "Suppression of Acoustic Resonances in BST-Based Bulk-Ceramic Varactors by Addition of Magnesium Borate" Crystals 11, no. 7: 786. https://0-doi-org.brum.beds.ac.uk/10.3390/cryst11070786