Article

Synthesis, Crystal Structure and Optical Properties of 3,5-Dihydroxyphenyl-5-(dimethylamino)naphthalene-1-sulfonate as a Fluorescence Sensor for Fluoride Ion Detection

by
Siraprapa Khunarj
1,
Woradorn Saijaroensakul
1,
Wilailak Marom
1,
Kittipong Chainok
2,
Tanwawan Duangthongyou
3,
Bussaba Pinchaipat
4 and
Boontana Wannalerse
3,*
1
Department of Chemistry, Faculty of Science, Kasetsart University, Bangkok 10900, Thailand
2
Thammasat University Research Unit in Multifunctional Crystalline Materials and Applications (TU-MCMA), Faculty of Science and Technology, Thammasat University, Pathum Thani 12121, Thailand
3
Department of Chemistry, Center of Excellence for Innovation in Chemistry, Faculty of Science, Kasetsart University, Chatuchak, Bangkok 10900, Thailand
4
Department of Chemistry, Faculty of Science, Naresuan University, Phitsanulok 65000, Thailand
*
Author to whom correspondence should be addressed.
Submission received: 18 November 2022 / Revised: 11 December 2022 / Accepted: 13 December 2022 / Published: 15 December 2022

Abstract

:
3,5-Dihydroxyphenyl-5-(dimethylamino)naphthalene-1-sulfonate, also referred to as sensor R1, was synthesized and characterized by 1H- and 13C-NMR, IR, HRMS, and single-crystal X-ray diffraction. Connections in the packing crystal structure of sensor R1 occur through hydrogen bonding interactions. However, no π-π stacking interactions between molecules of sensor R1 were observed. Addition of fluoride ion to a solution of sensor R1 resulted in the appearance of a new absorption band at 310 nm, which corresponded to the deprotonated species, and quenching of the peak at an emission wavelength of 562 nm. For the addition of other anions, there was a slight decrease in corresponding peaks in the UV-visible and emission spectra of sensor R1. According to the 1H-NMR study, the aromatic proton resonances of sensor R1 shifted upfield when adding fluoride ion. Analysis of the solutions prepared using Job’s method revealed that the complexation ratio of the complex formed between sensor R1 and fluoride ion was 1:1. The Stern−Volmer quenching constant (Ksv) between sensor R1 and fluoride ion was characterized as 7157 M−1.

1. Introduction

To date, many crystals have been found to display a variety of changes in numerous applications, the nature of which is dependent on the specific structure form of the crystal. Organic molecule crystals, which display charge specificity in binding to anions, cations, or neutral molecules, are generally used as chemical sensors [1,2,3,4,5,6,7,8,9]. In addition, organic crystals strongly bind to anions via hydrogen bonding, π–π stacking, and electrostatic interactions, resulting in a change in photo properties. Photophysical changes in molecules lead to shifts in absorption and emission bands in terms of the wavelength becoming longer or shorter, and whether there is enhancement or quenching of emission [10,11,12,13]. Anions are important analytes that present many advantages and disadvantages in numerous aspects, such as those arising in environmental fields, biological systems and industrial plants [14,15,16]. For example, the fluoride ion, which can be used as a nucleophile in organic reaction, is the smallest in size of the halide anions and regarding its strength of basicity. Fluoride ion is an anion important for growth of bones and teeth in the human body. However, excess levels of fluoride ion result in the development of bone growth disorders and dental fluorosis, among other issues [17,18]. Therefore, fluoride ion can give rise to both benefits and drawbacks depending on the intake level. Numerous researchers have attempted to detect fluoride ion by using fluorescence molecules that can be rapidly measured. During the past 10 years, fluoride ion sensors have been developed based on the occurrence of fluoride ions in numerous processes such as complexation, deprotonation, transformation of molecules, etc. [19,20,21,22,23] This paper describes the synthesis and crystal structure of 3,5-dihydroxyphenyl-5-(dimethylamino)naphthalene-1-sulfonate, referred to as sensor R1. In addition, we studied the behavior of binding between sensor R1 and various anions using 1H-NMR, UV-visible and fluorescence spectroscopy.

2. Experiment

2.1. Materials

For experiments, all anions (F, Cl, Br, I, H2PO4, CH3COO, C6H5COO) were in the tetrabutylammonium form and were purchased from Sigma-Aldrich, MO, USA. Phloroglucinol and dansyl chloride were purchased from Tokyo Chemical Industry Company Limited, Tokyo, Japan. Potassium carbonate was purchased from Carlo erba Reagents S.A.S., Val de Reuil, France. Acetonitrile, ethyl acetate and dichloromethane were purchased from RCI Labscan Limited, Bangkok, Thailand. Deuterated DMSO for NMR solvent was also purchased from Merck, Darmstadt, Germany.

2.2. Methods

Crystallographic Methods

The single crystal X-ray diffraction data of the sensor R1 were collected using a Bruker D8 Quest CMOS diffractometer with graphite monochromatic MoKα radiation. The graphical pictures of crystal R1 were captured and processed using OLEX2 and Mercury 3.10.3 [24] software. CCDC 2212336 contains the supplementary crystallographic data for sensor R1. These data can be obtained via http://www.ccdc.cam.ac.uk/conts/retrieving.html (accessed on 12 October 2022). The structures were solved and refined by OLEX2 [25] with the olex2.solve structure solution program using charge flipping and by SHELXL [26] refinement package using least squares minimization, respectively. Anisotropic displacement parameters were refined for all non-hydrogen atoms. Analysis of hydrogen atoms was carried out through a mixture of independent and constrained refinement.

2.3. Apparatus

Fluorescence spectra were collected by FL 8500. HRMS data were obtained on a Bruker micrOTOF-Q III. UV–vis spectra were obtained using a Perkin Elmer lambda 365. The 1H- and 13C-NMR spectra were collected on a 400 MHz NMR Bruker spectrometer. Infrared spectra were collected by a Perkin Elmer system 2000 Fourier transform infrared spectrometer.

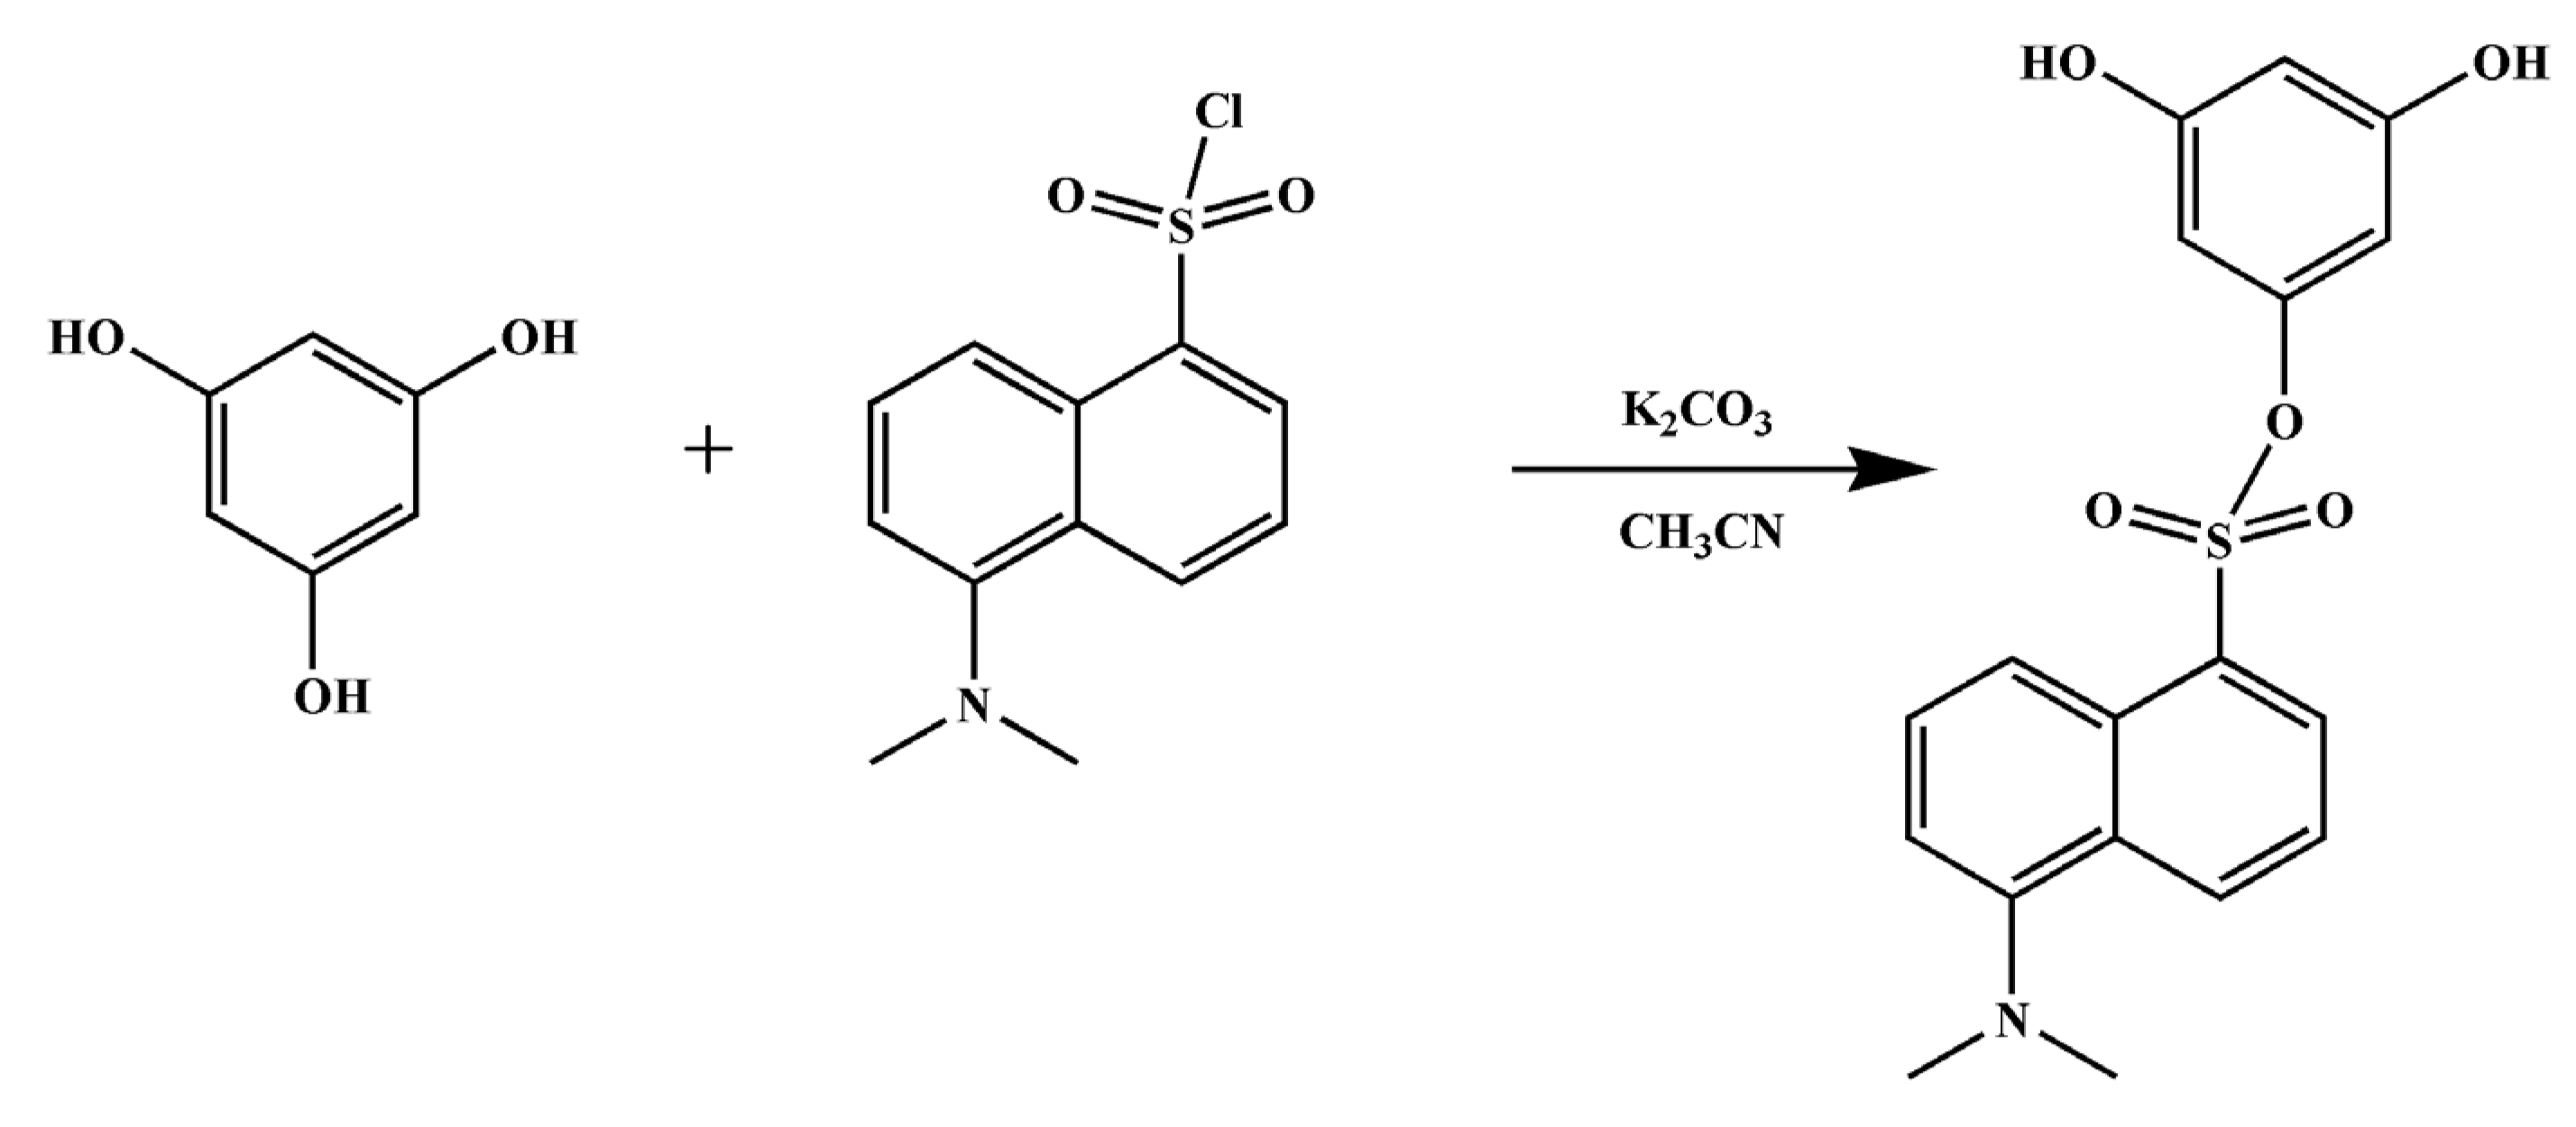
2.4. The Synthesis of 3,5-Dihydroxyphenyl-5-(dimethylamino)naphthalene-1-sulfonate, Sensor R1, as Shown in Scheme 1

A mixture of phloroglucinol (3 g, 24 mmol) and K2CO3 (1.133 g, 8.21 mmol) in CH3CN 15 mL was stirred and refluxed at 130 °C for 1 h. Dansyl chloride (2.218 g, 8.22 mmol) in CH3CN 28 mL was slowly added to the reaction. Then, the mixture was continually stirred and refluxed at 130 °C for 4 h, followed by evaporation in a rotary evaporator. Then, the mixture was extracted using water and dichloromethane. The dichloromethane layer was purified by column chromatography using 1.5:8.5 of EtOAc/CH2Cl2 as an eluent. The product was afforded as a yellow solid at a yield of 18.64%. 1H-NMR(d6-DMSO) δ: (9.62, s, OH, 2H), (8.62, d, ArH, 1H), (8.22, d, ArH, 1H), (8.11, d, ArH, 1H), (7.75, t, ArH, 1H), (7.63, t, ArH, 1H), (7.35, d, ArH, 1H), (6.05, s, ArH, 1H), (5.75, s, ArH, 2H), (2.87, s, CH3, 6H) 13C-NMR(d6-DMSO) δ: 159.4, 152.2, 150.8, 132.4, 131.5, 130.8, 129.7, 129.6, 129.3, 124.0, 118.7, 116.1, 101.9, 100.2, 45.5 FT-IR (cm−1): 3268.23, 2917.39, 1611.88, 1460.39, 1301.63, 1160.44, 987.91, 623.20. Mp.:135 °C HRMS (m/z): C18H18NO5S calculated 360.0906 and found 360.0914 [M+H]+.
Scheme 1. The pathway for synthesis of R1.
Crystals 12 01836 sch001

3. Results and Discussion

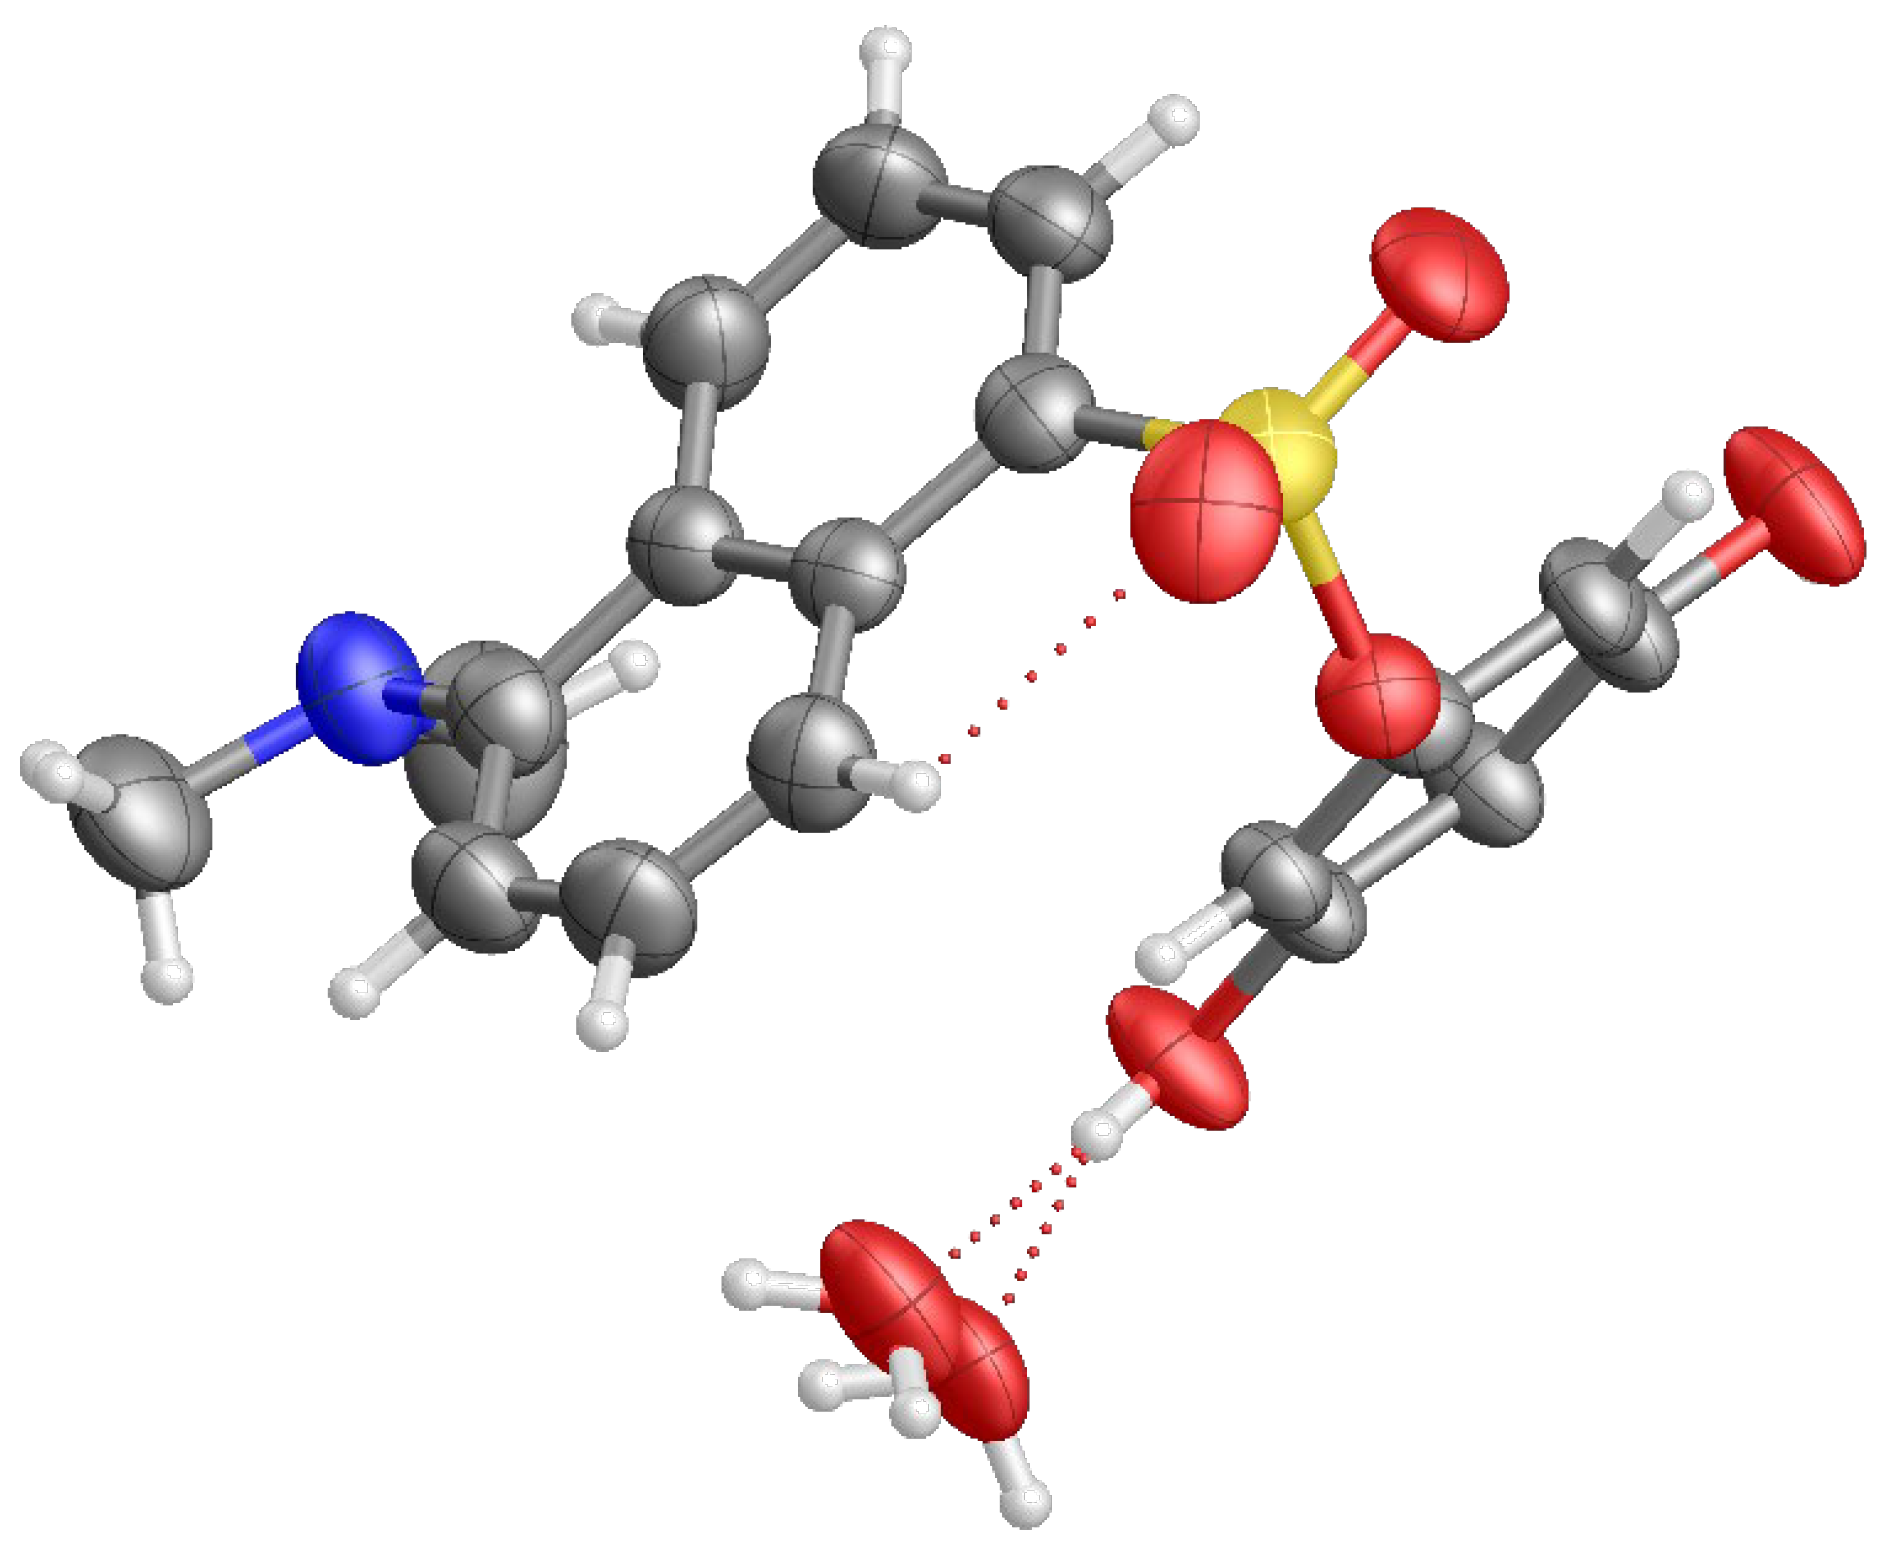
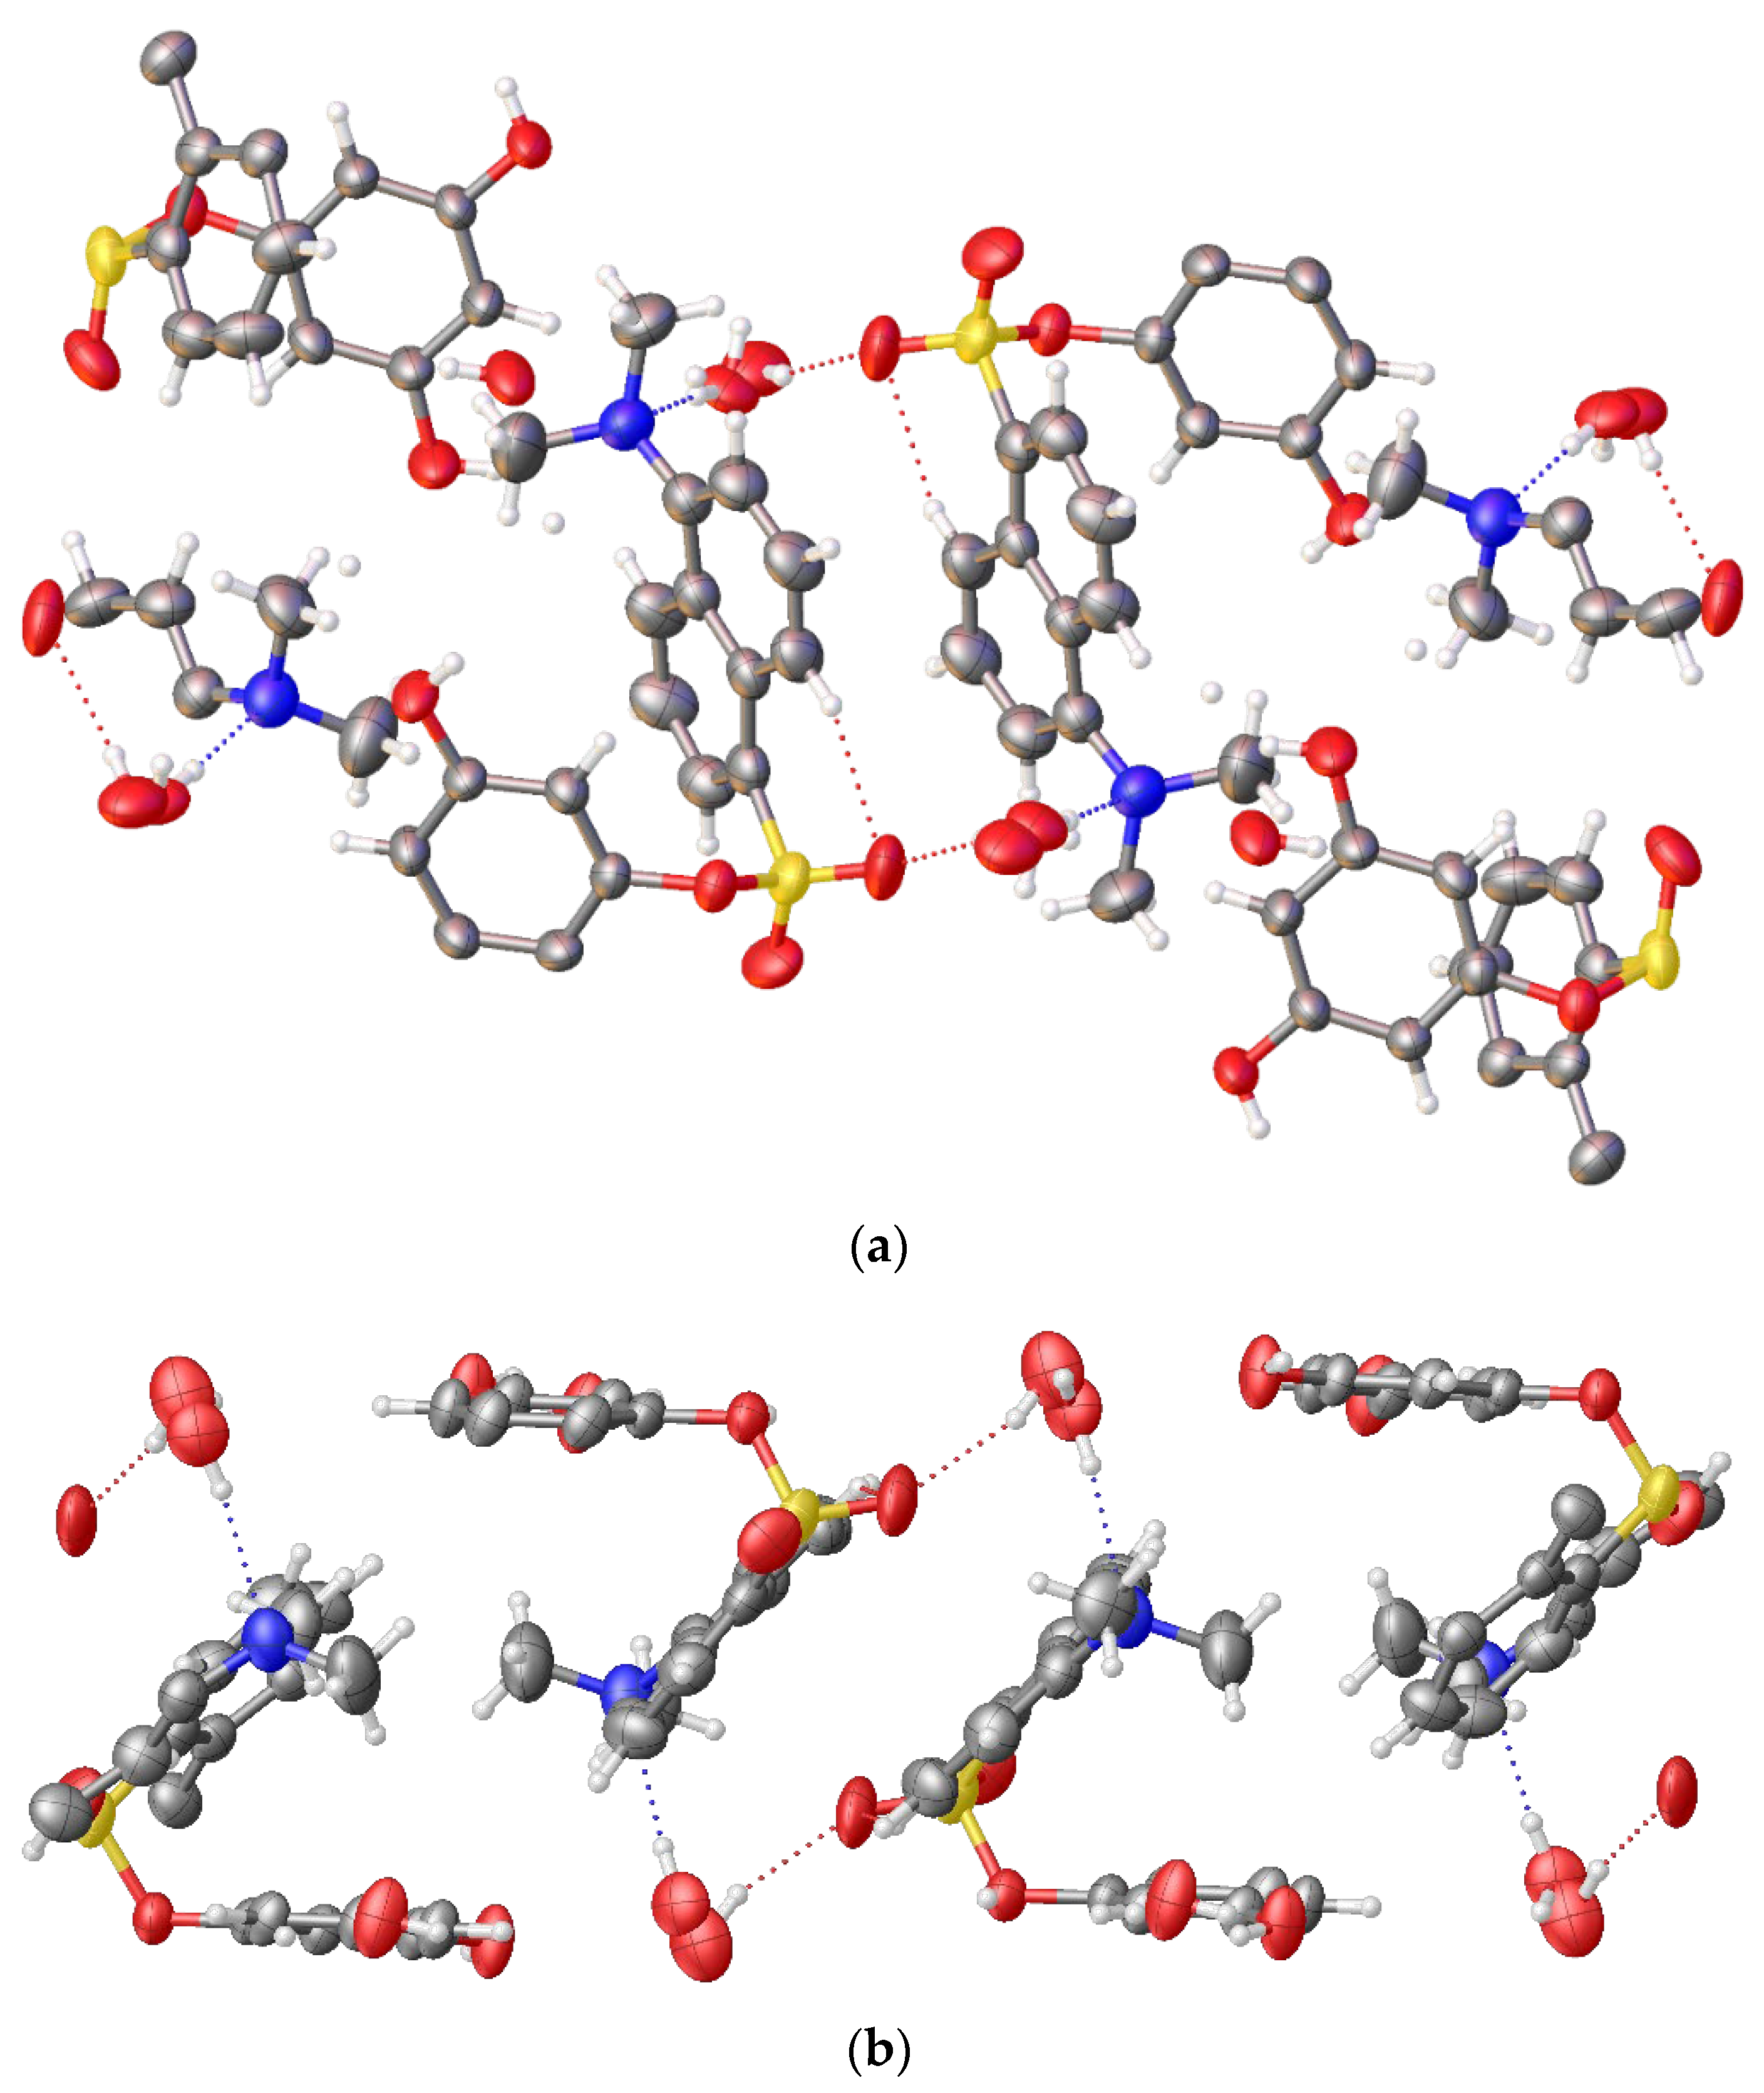
3.1. Crystal Structure of Sensor R1

Crystals of sensor R1 were grown in a mixed solvent of EtOAc/CH2Cl2 = 1.5:8.5 (v/v). Experimental parameters for single-crystal X-ray analysis of the compound are given in Table 1. The compound was crystalized as a monoclinic system with P21/c space group, and its molecular structure is presented in Figure 1. The structure of sensor R1 was found to be tetrahedral around the sulfur atom with angles of O1–S1–C7; 102.31(9), O2–S1–C7; 109.2(1) and O3–S1–C7; 113.3(1), respectively.
The occurrence of intramolecular H-bonding of S=O…H was observed in sensor R1 with a distance of 2.456 Å. Moreover, the structural analysis also revealed two water molecules engaged in H-bonding with the same hydroxyl group of the benzene ring, as shown in Figure 2. The lengths of these interactions were found to be 1.843 and 1.756 Å, respectively.
The packing images of sensor R1 for front view and side view are presented in Figure 3. According to the tetrahedral structure, no differences between each plane and π–π interactions were observed in sensor R1. Notwithstanding, apart from the abovementioned H-bonding, S=O…H–O–H and (CH3)2N…H–O–H interactions were also observed in the packing form with distances of 2.170 and 2.183 Å, respectively. Additionally, these water molecules appeared in the fragment that jointly connected each molecule of sensor R1. The relevant data of bond lengths, bond angles, and torsion angles are presented in Table 2.

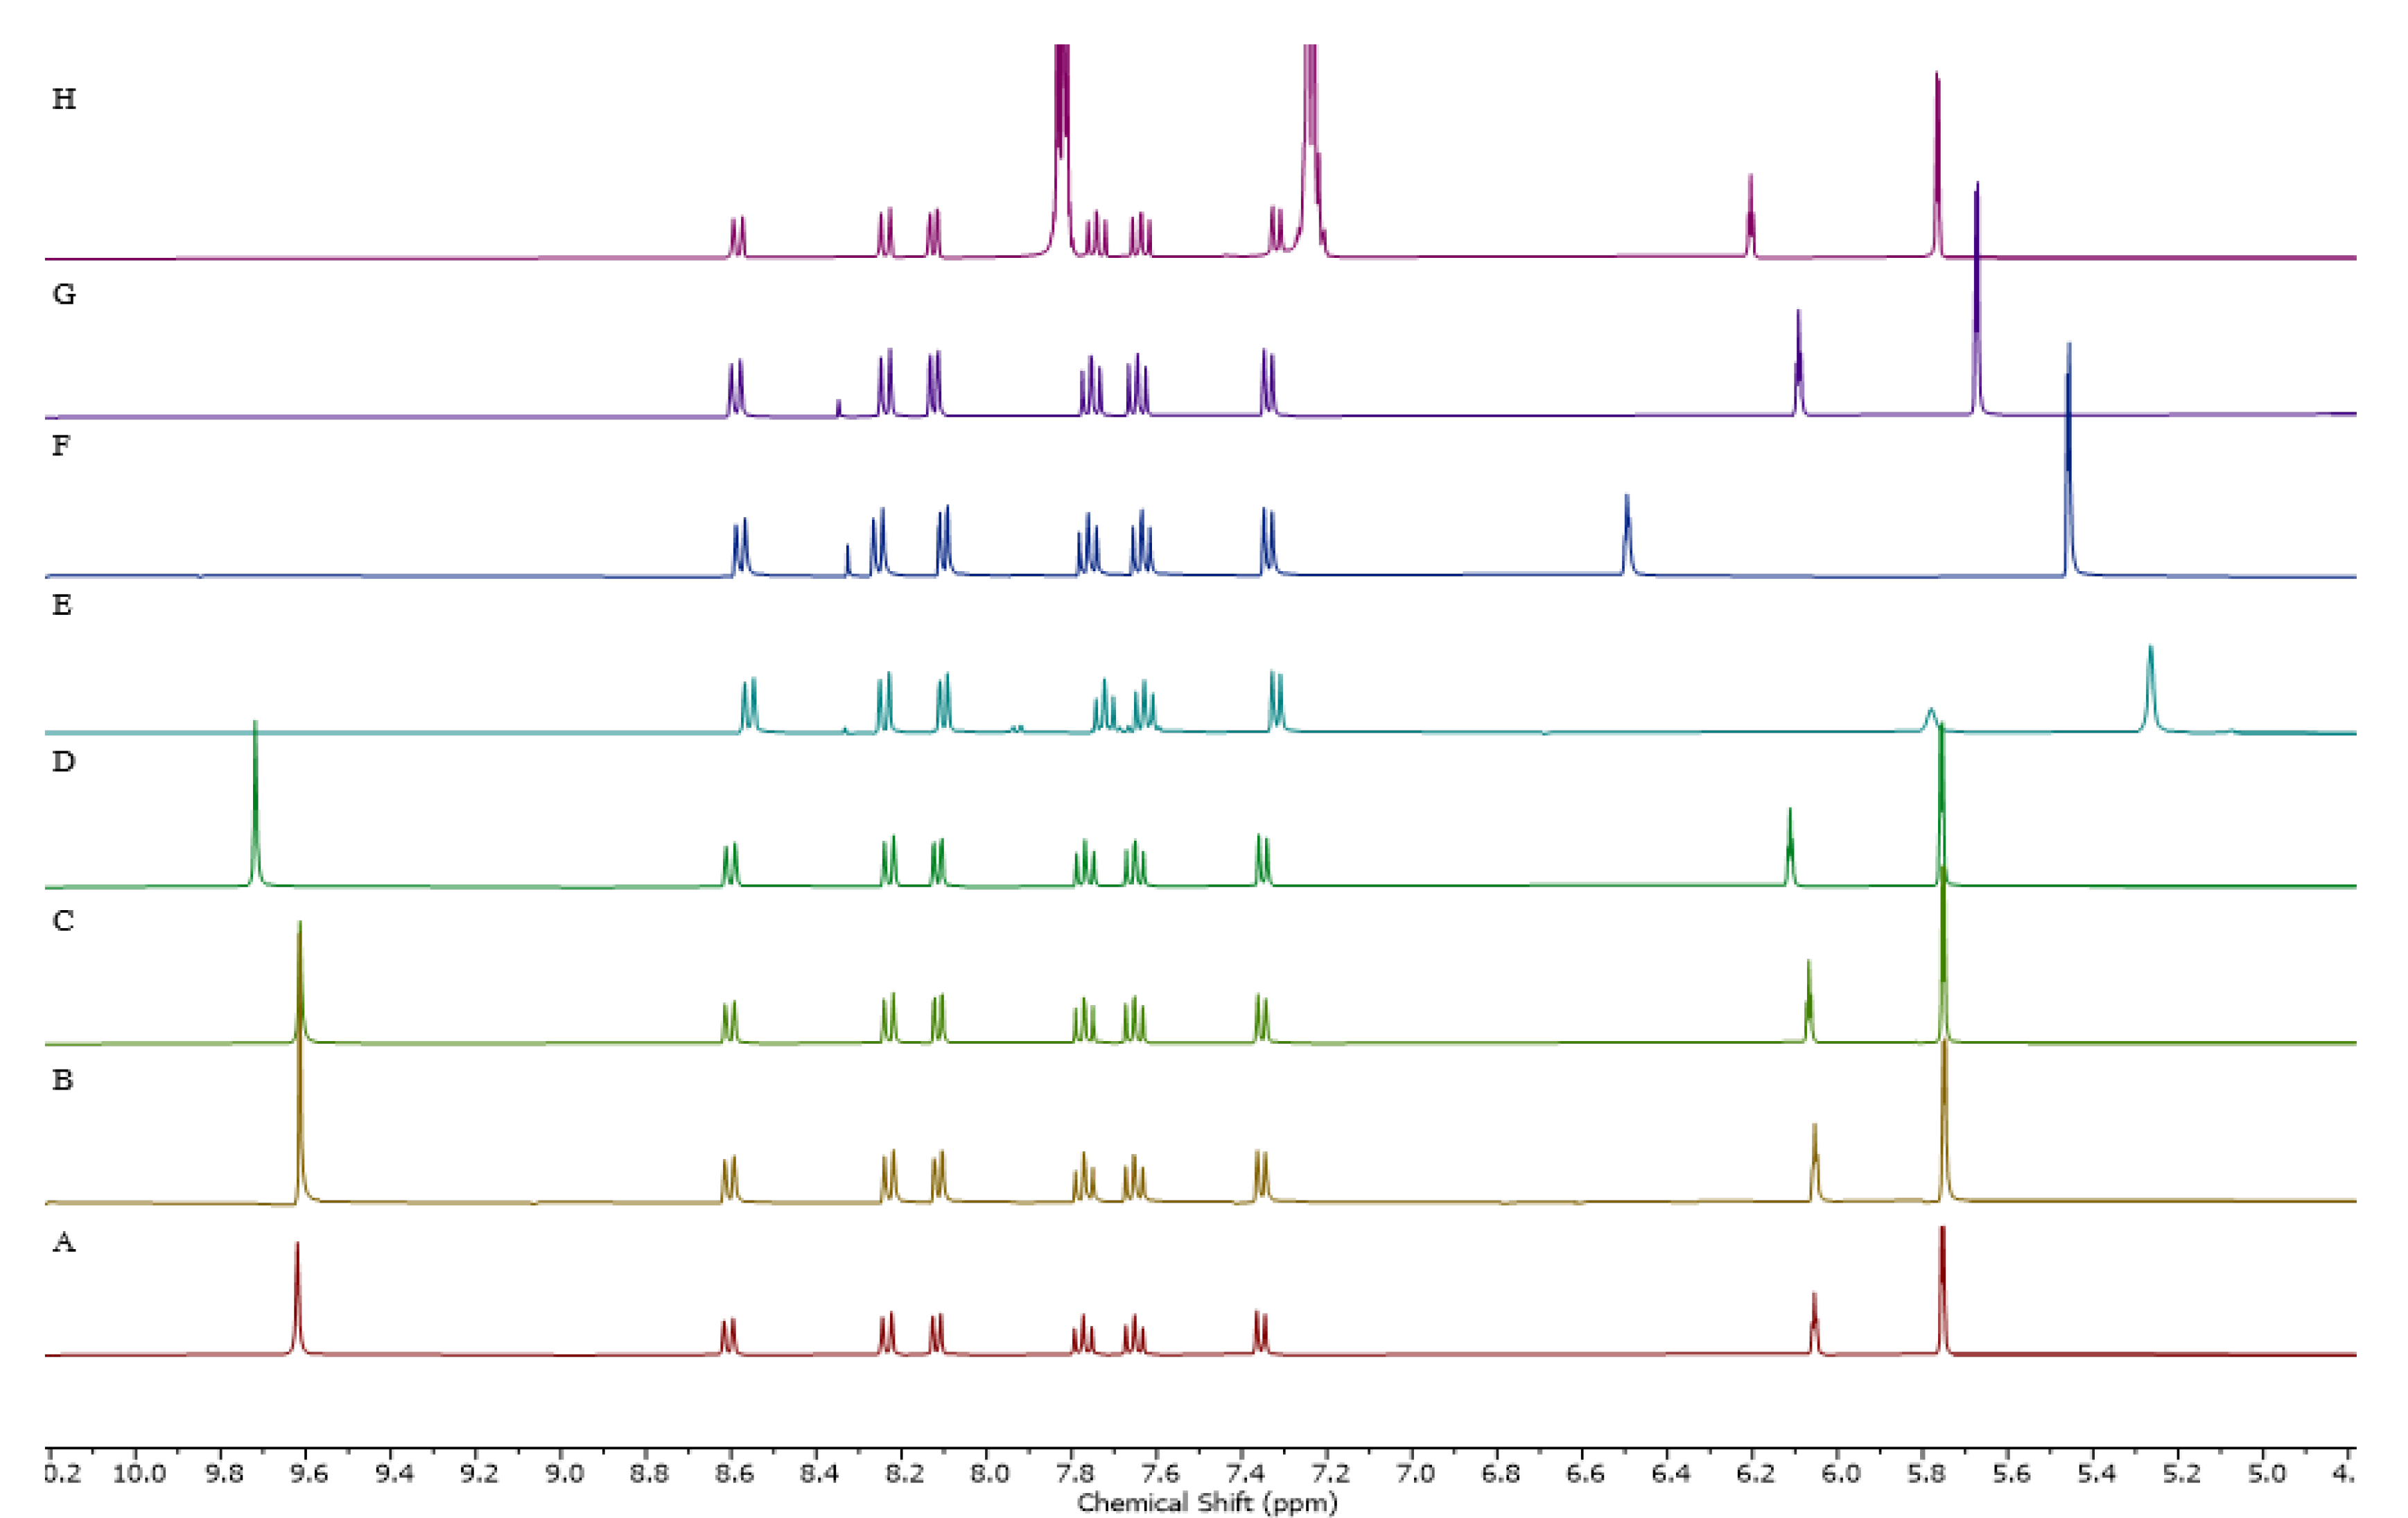
3.2. The Binding Behavior of Sensor R1 and Different Anions Characterized by 1H-NMR Spectroscopy

From comparison of the 1H-NMR spectra for sensor R1 binding with various anions in d6-DMSO, it can be seen that the addition of fluoride ions resulted in obvious changes. The peak for OH proton in the sensor R1 spectrum disappeared, and the peaks for aromatic protons shifted upfield, as seen in Figure 4. For peaks in the aromatic region, changes from 7.35–8.62, 5.75, and 6.05 ppm to 7.31–8.57, 5.26, and 5.78 ppm, respectively, were observed upon addition of fluoride ions, as shown in Figure 4. The triplet peak around 16.12 ppm was related to bifluoride species, and was indicative of the deprotonation when adding excess fluoride ions, as shown in Figure S1 [27]. This is explained by fluoride ions interacting with the hydroxyl group of R1 through strong hydrogen bonding interactions. The hydroxyl moiety is then loosened as a result of the deprotonation process. Moreover, the resonance signals of aromatic protons shifted upfield due to the increase in their electron density. For CH3COO, H2PO4, and C6H5COO, the hydroxyl proton peak of sensor R1 vanished, and there were slight changes in those for aromatic protons. In the case of Cl, Br, and I, the protons of sensor R1 barely shifted due to the weaker interaction between sensor R1 and these anions.

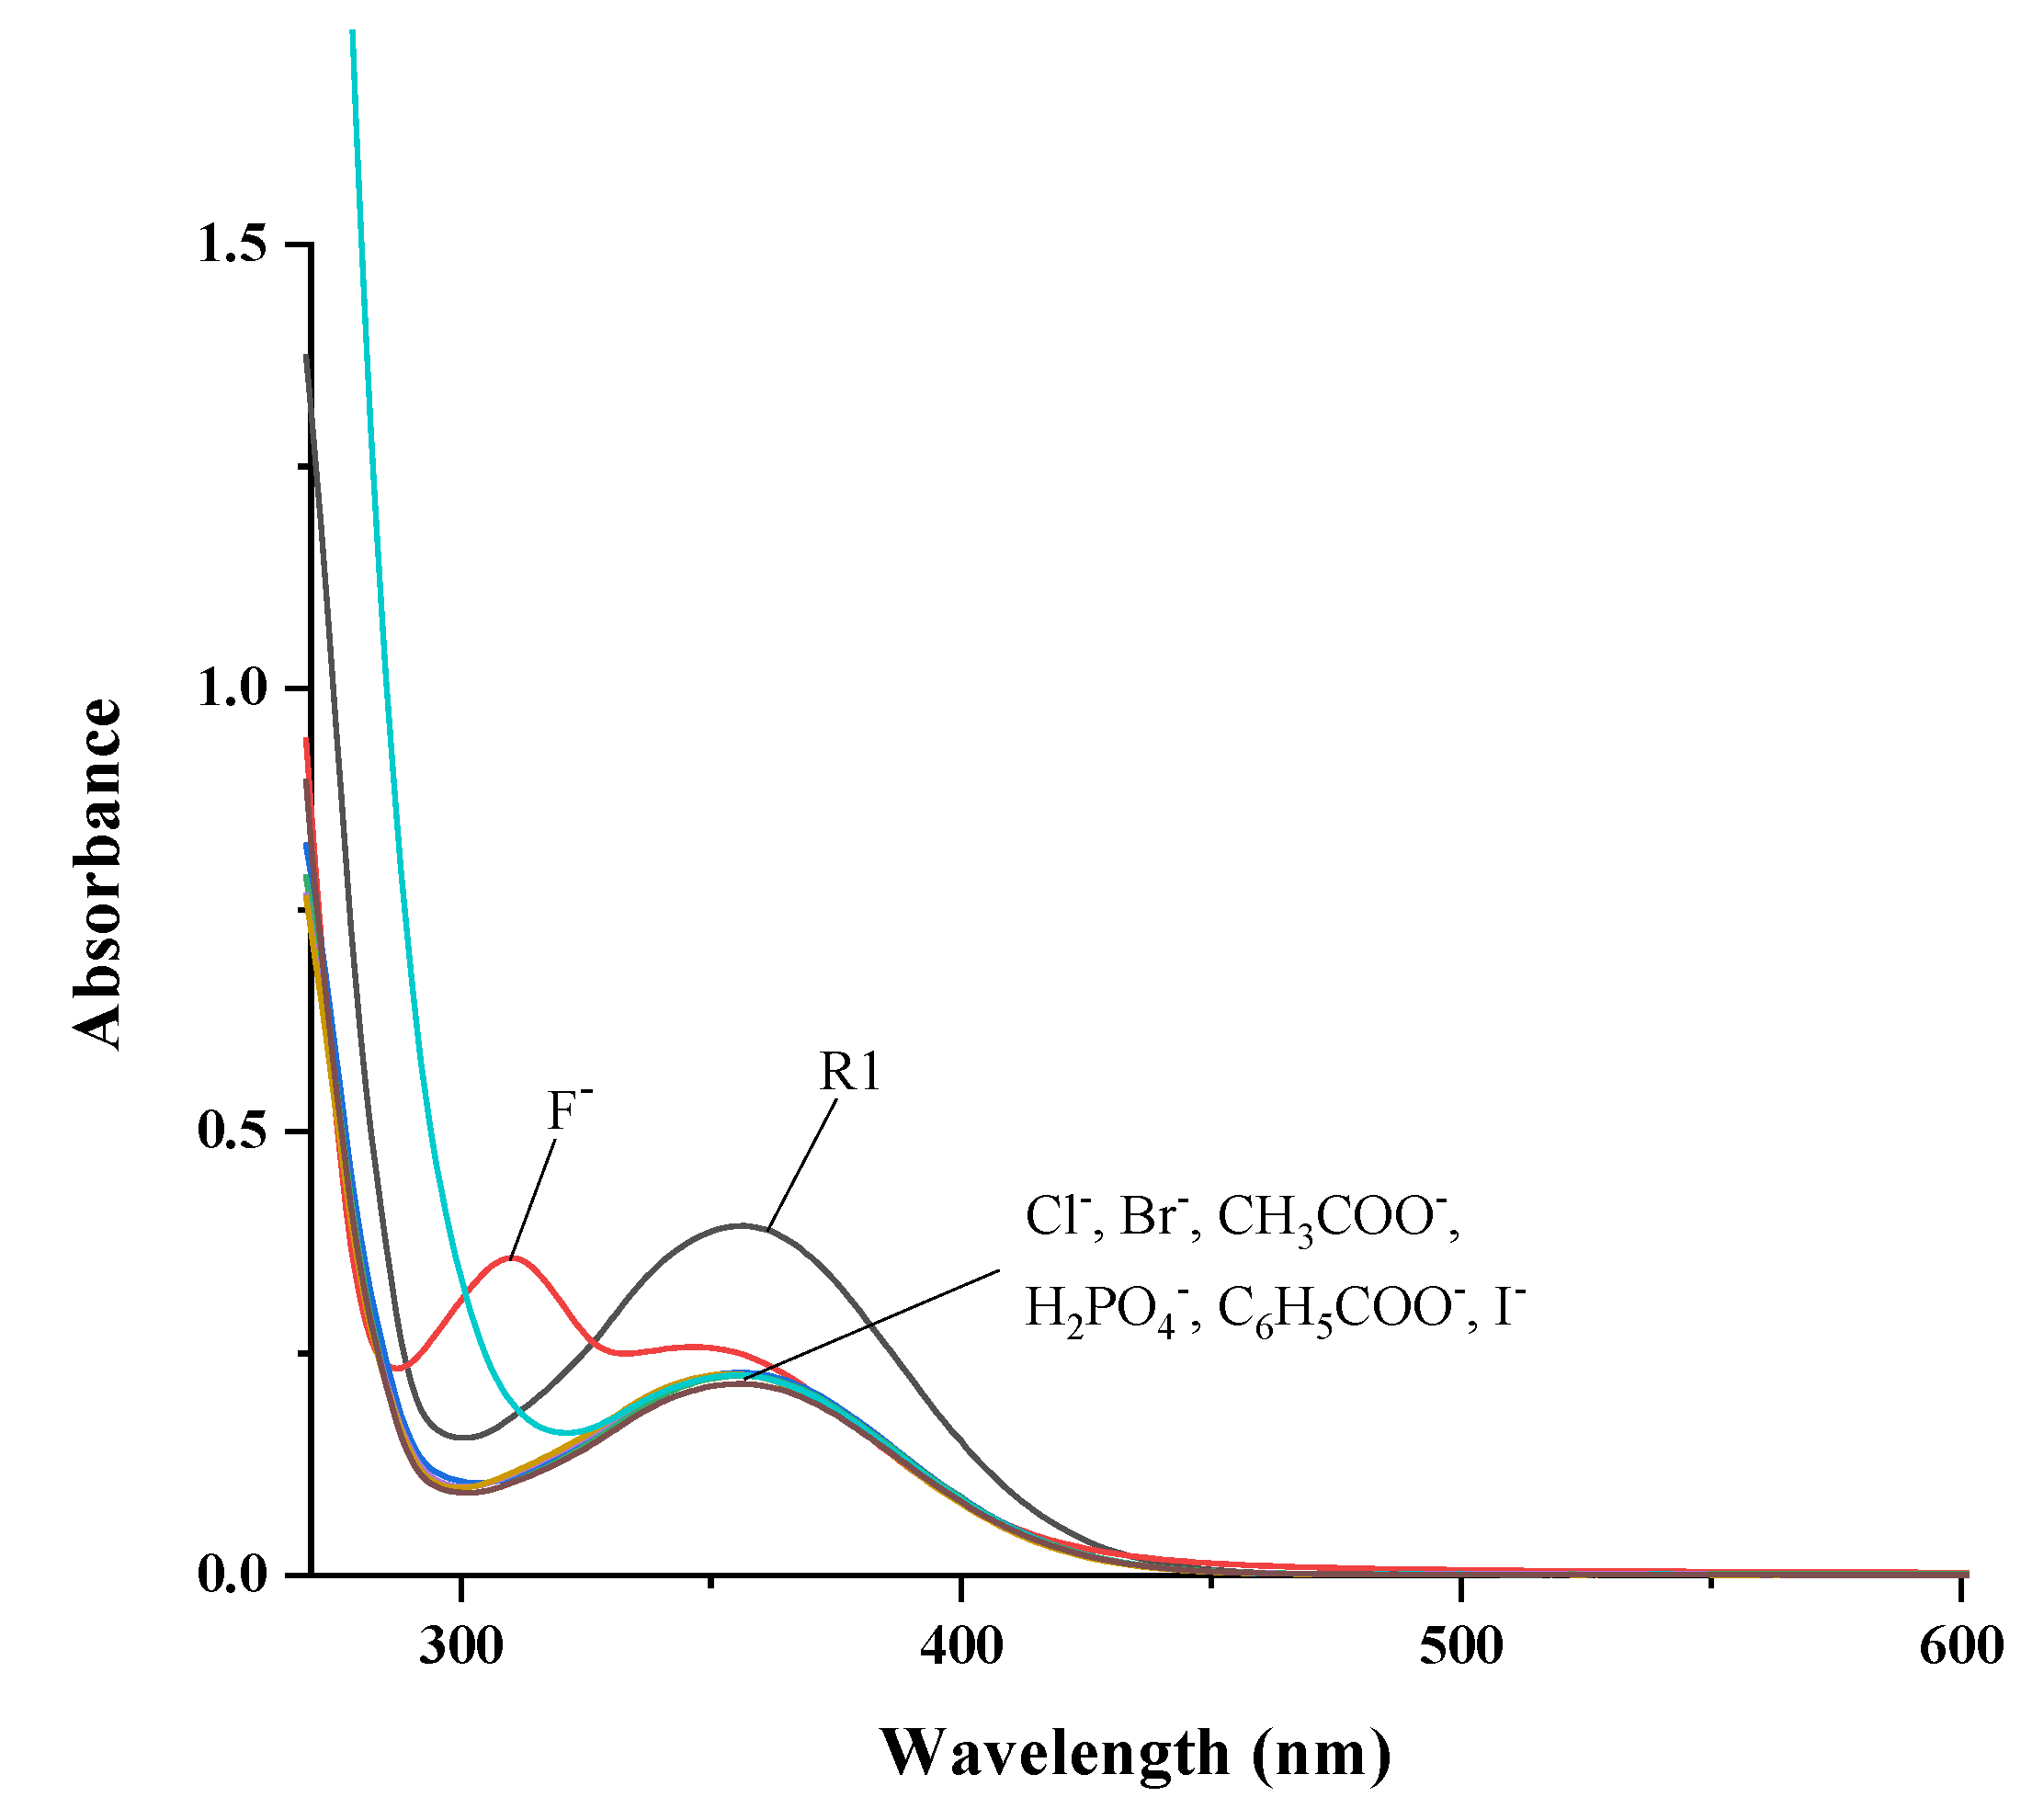
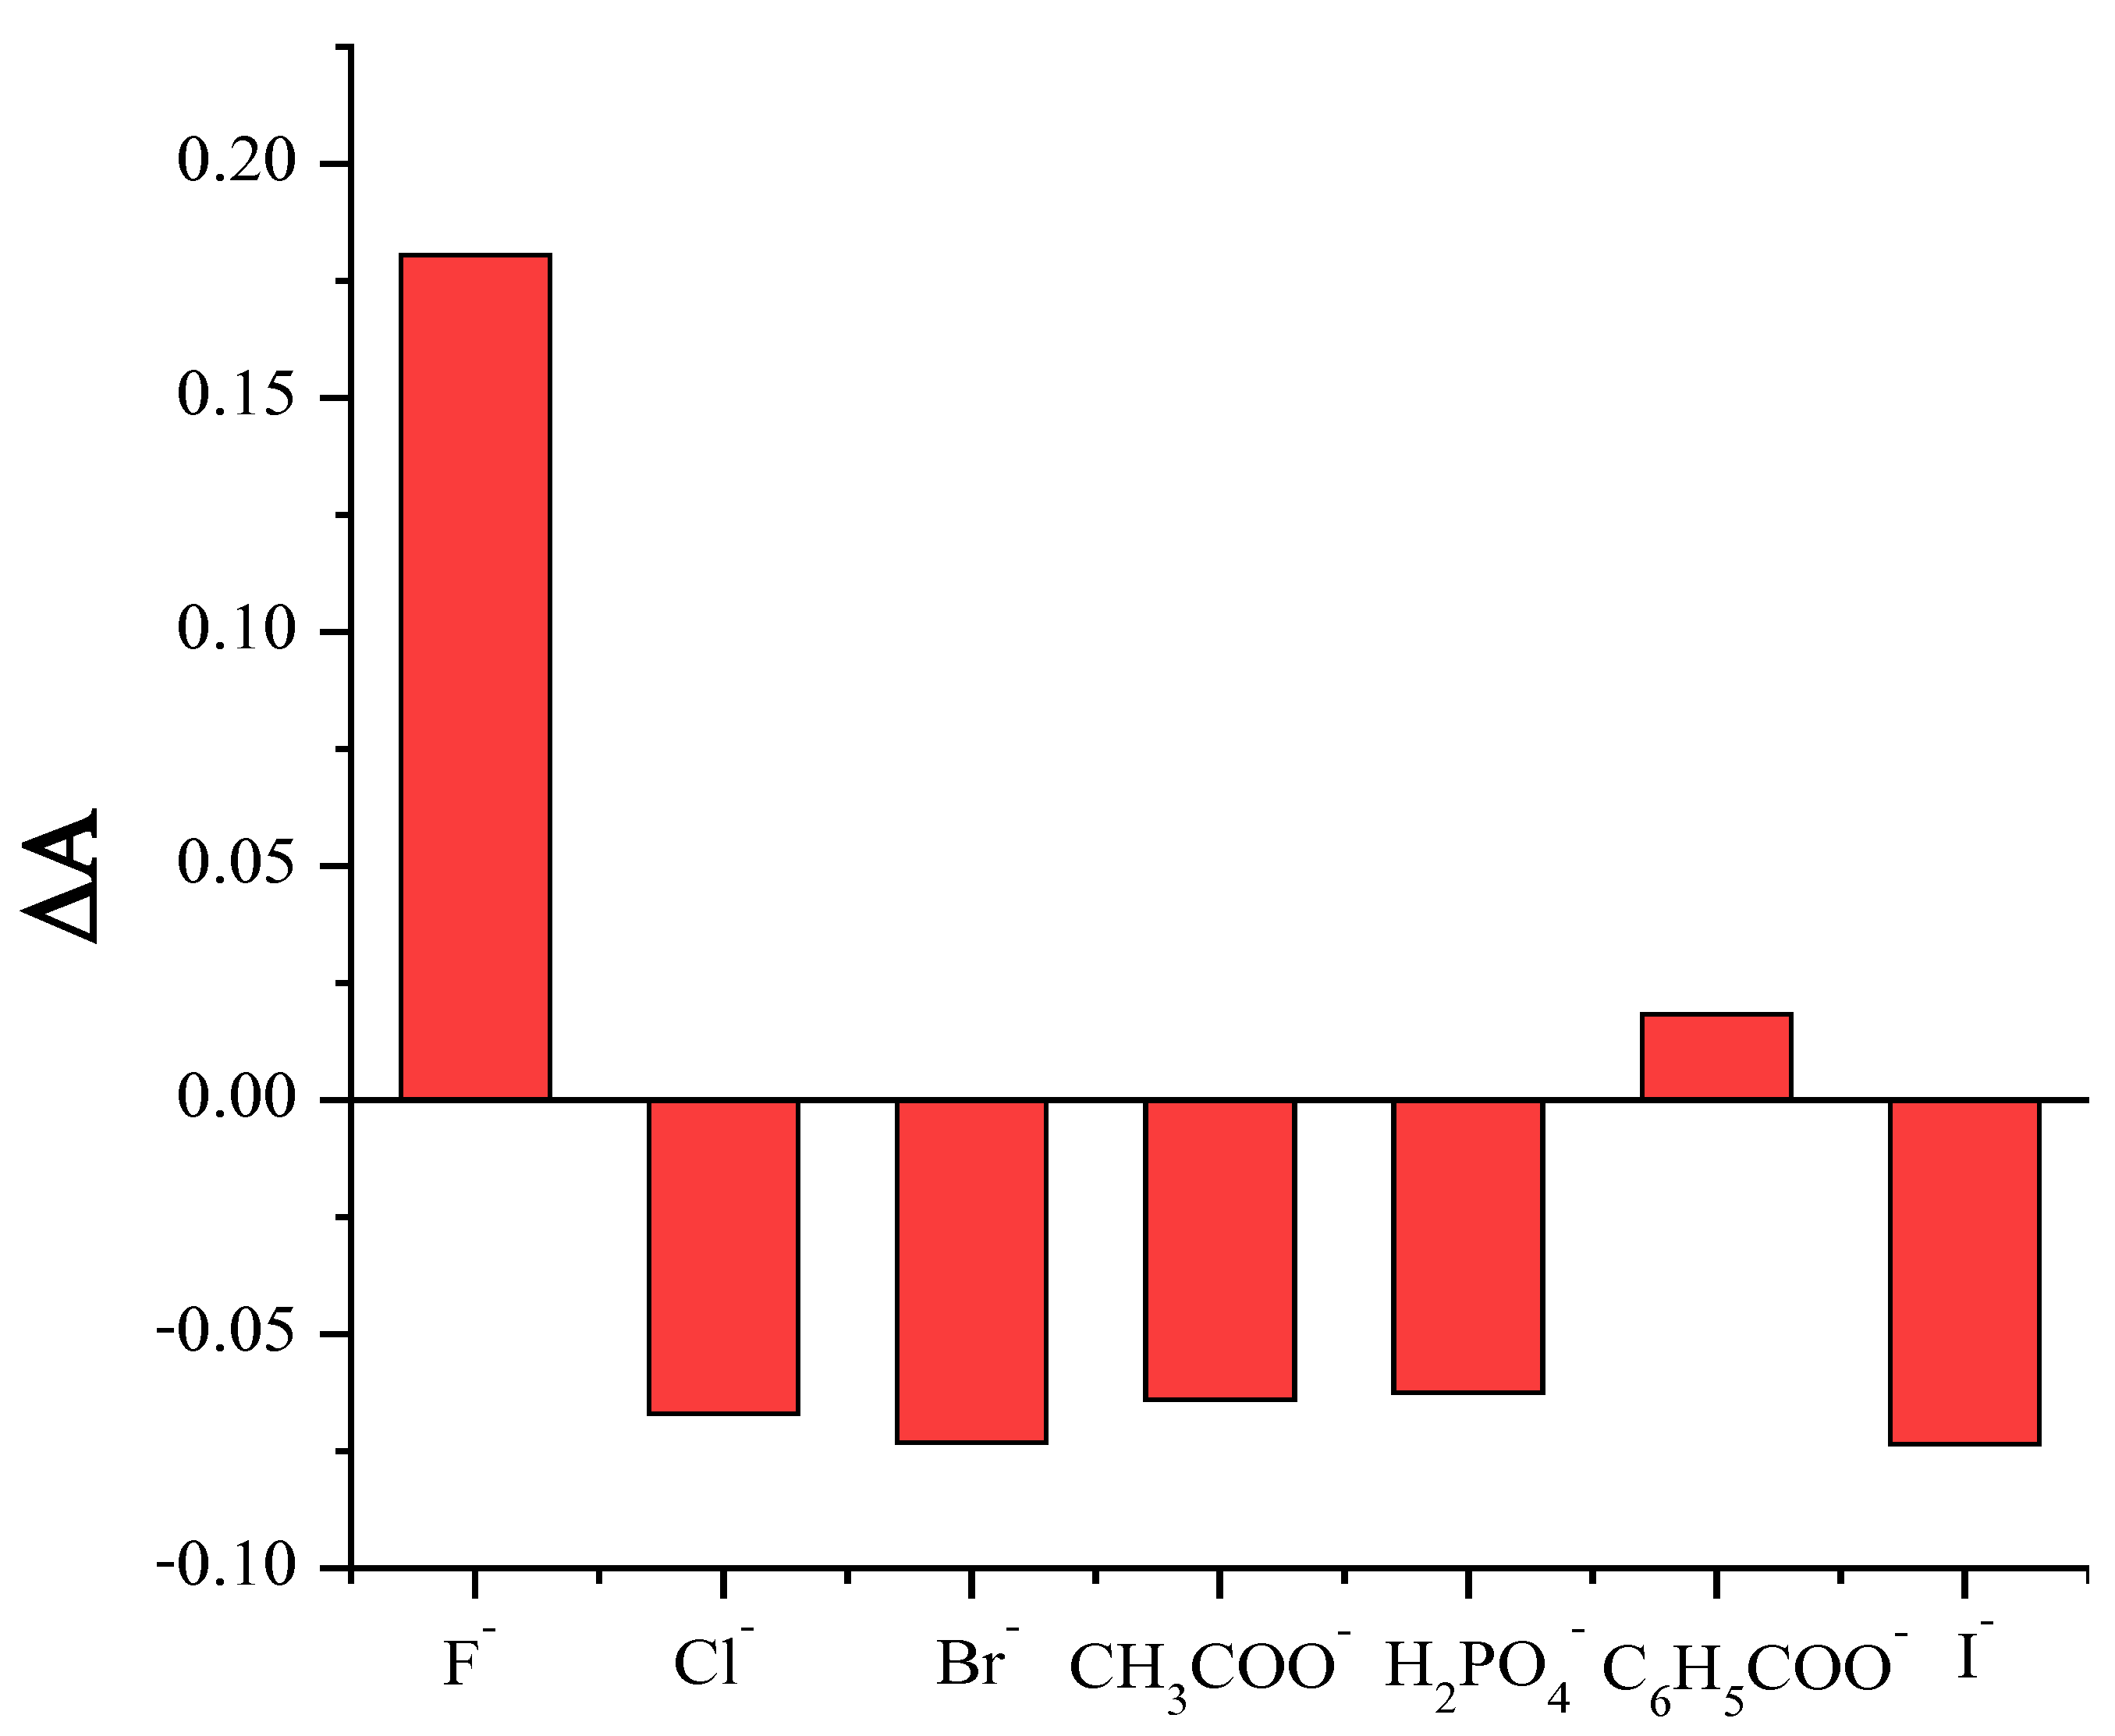
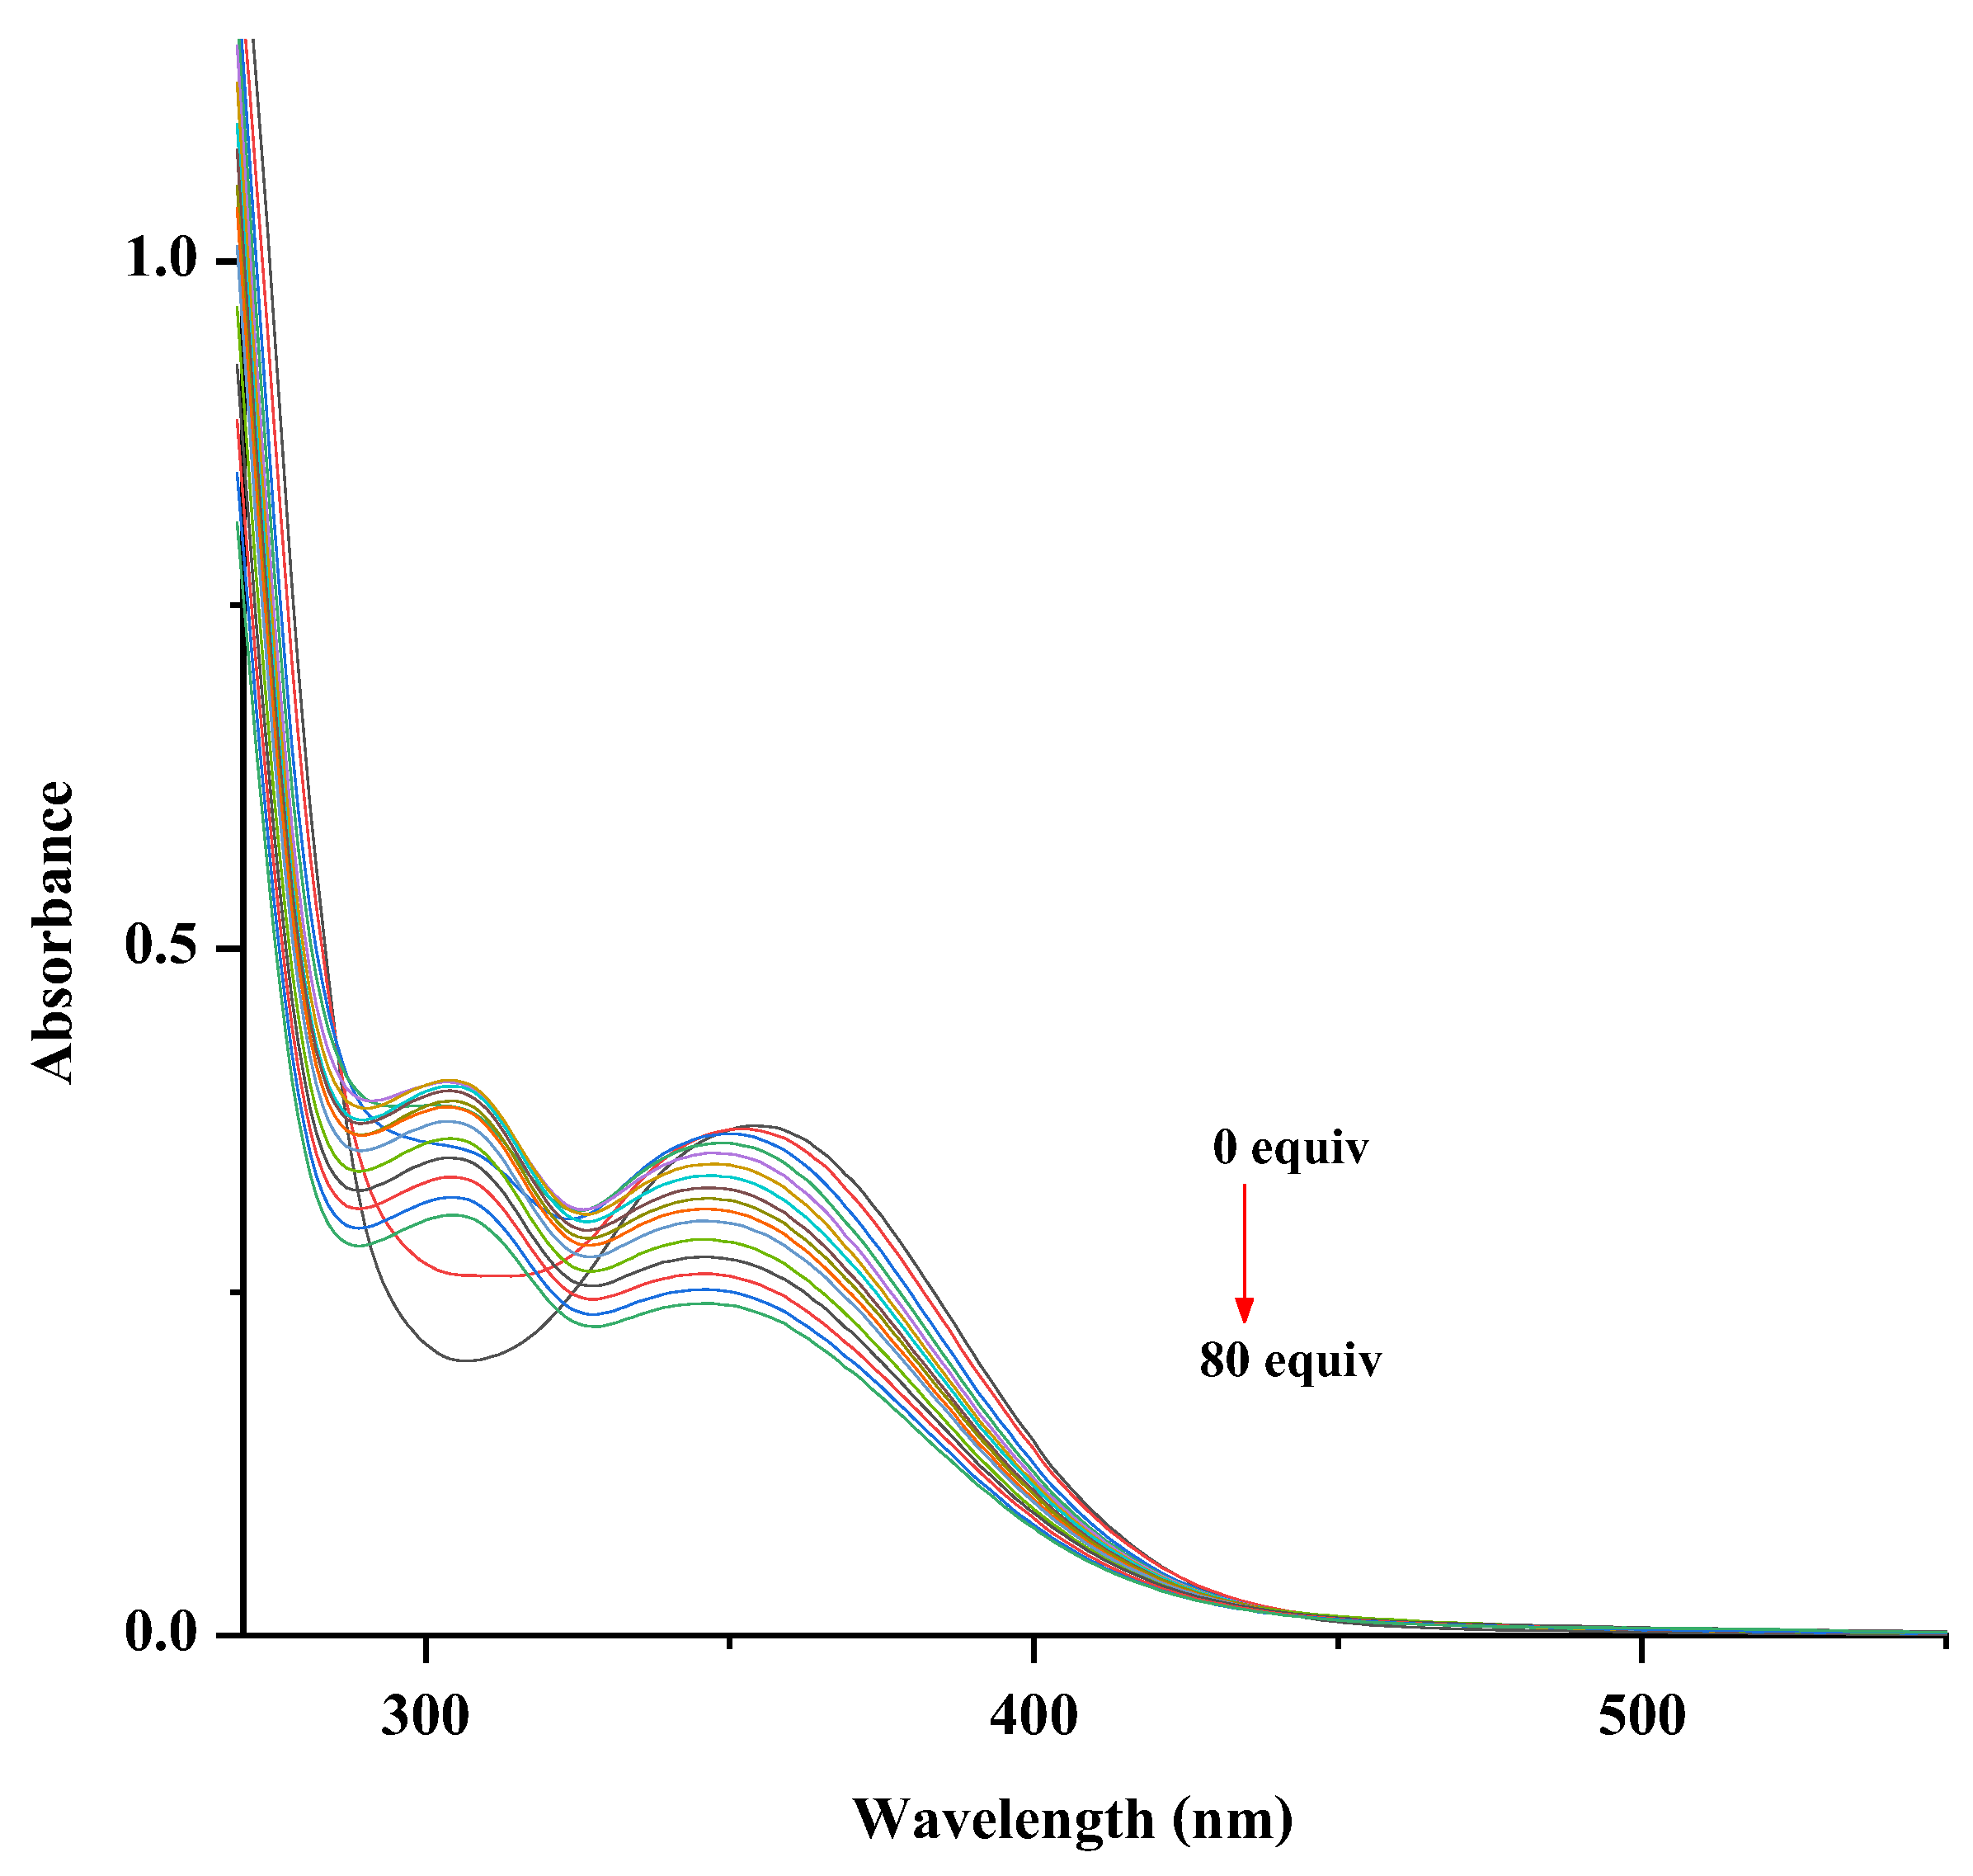
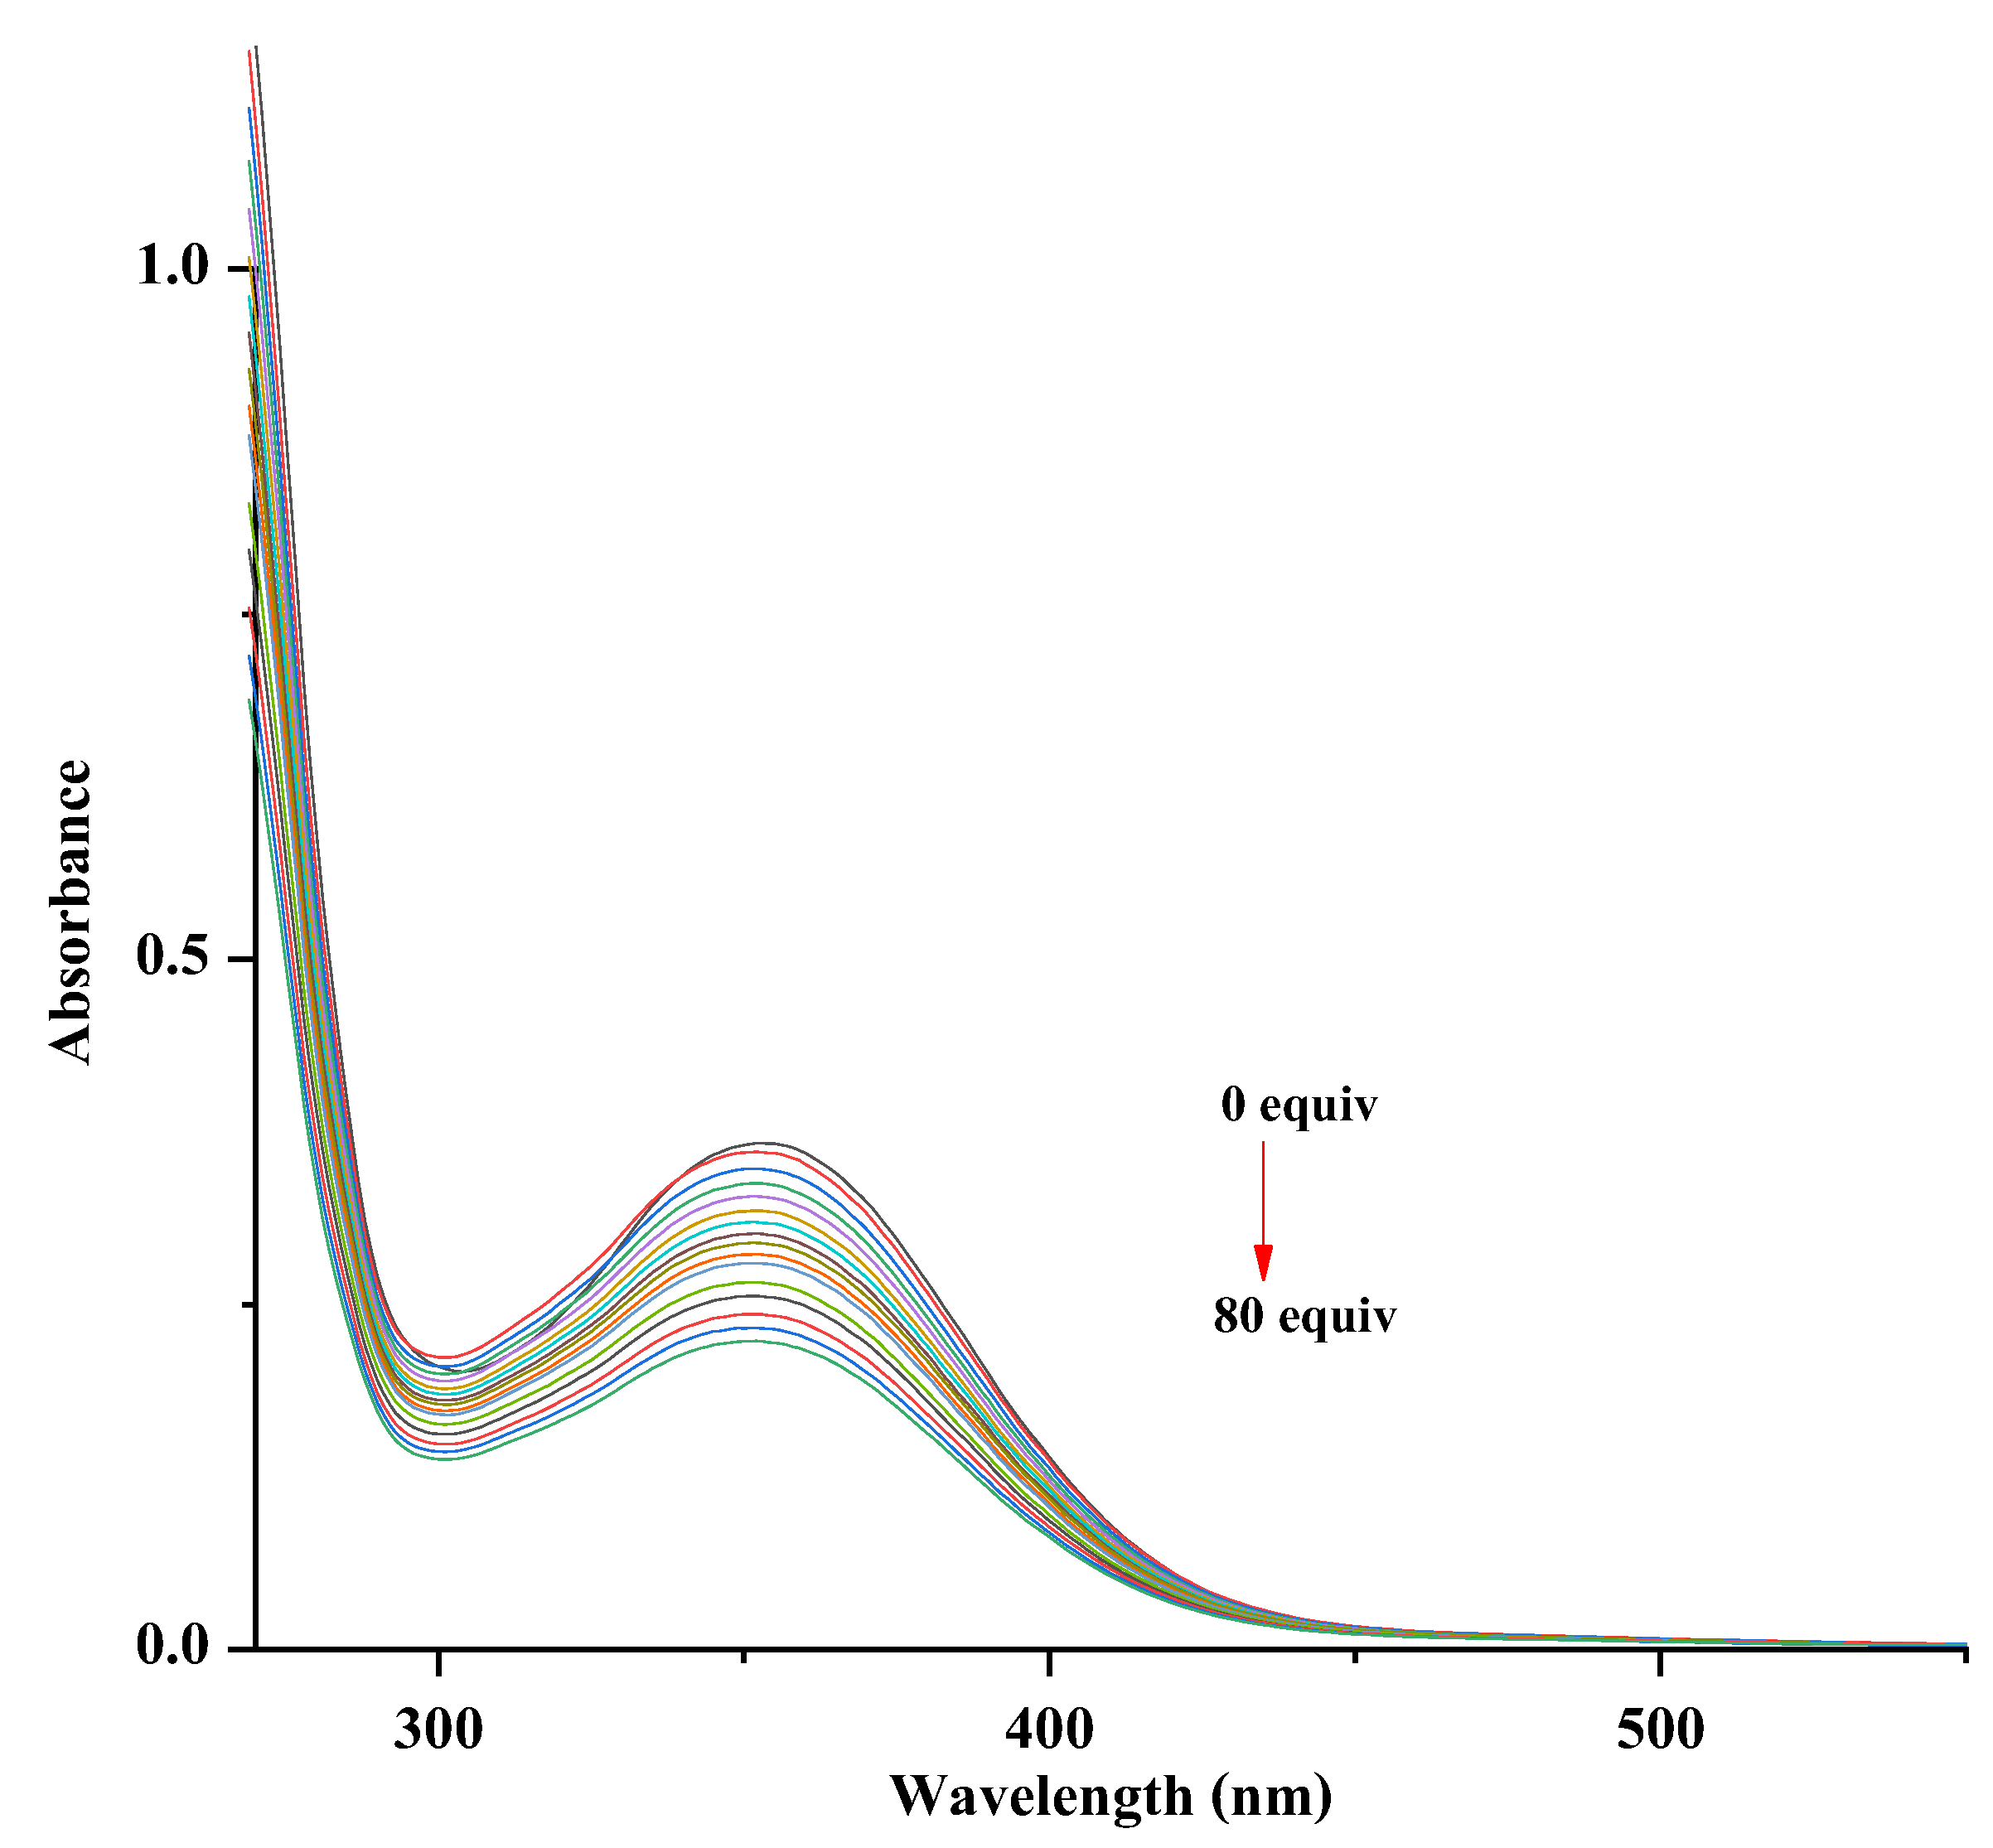
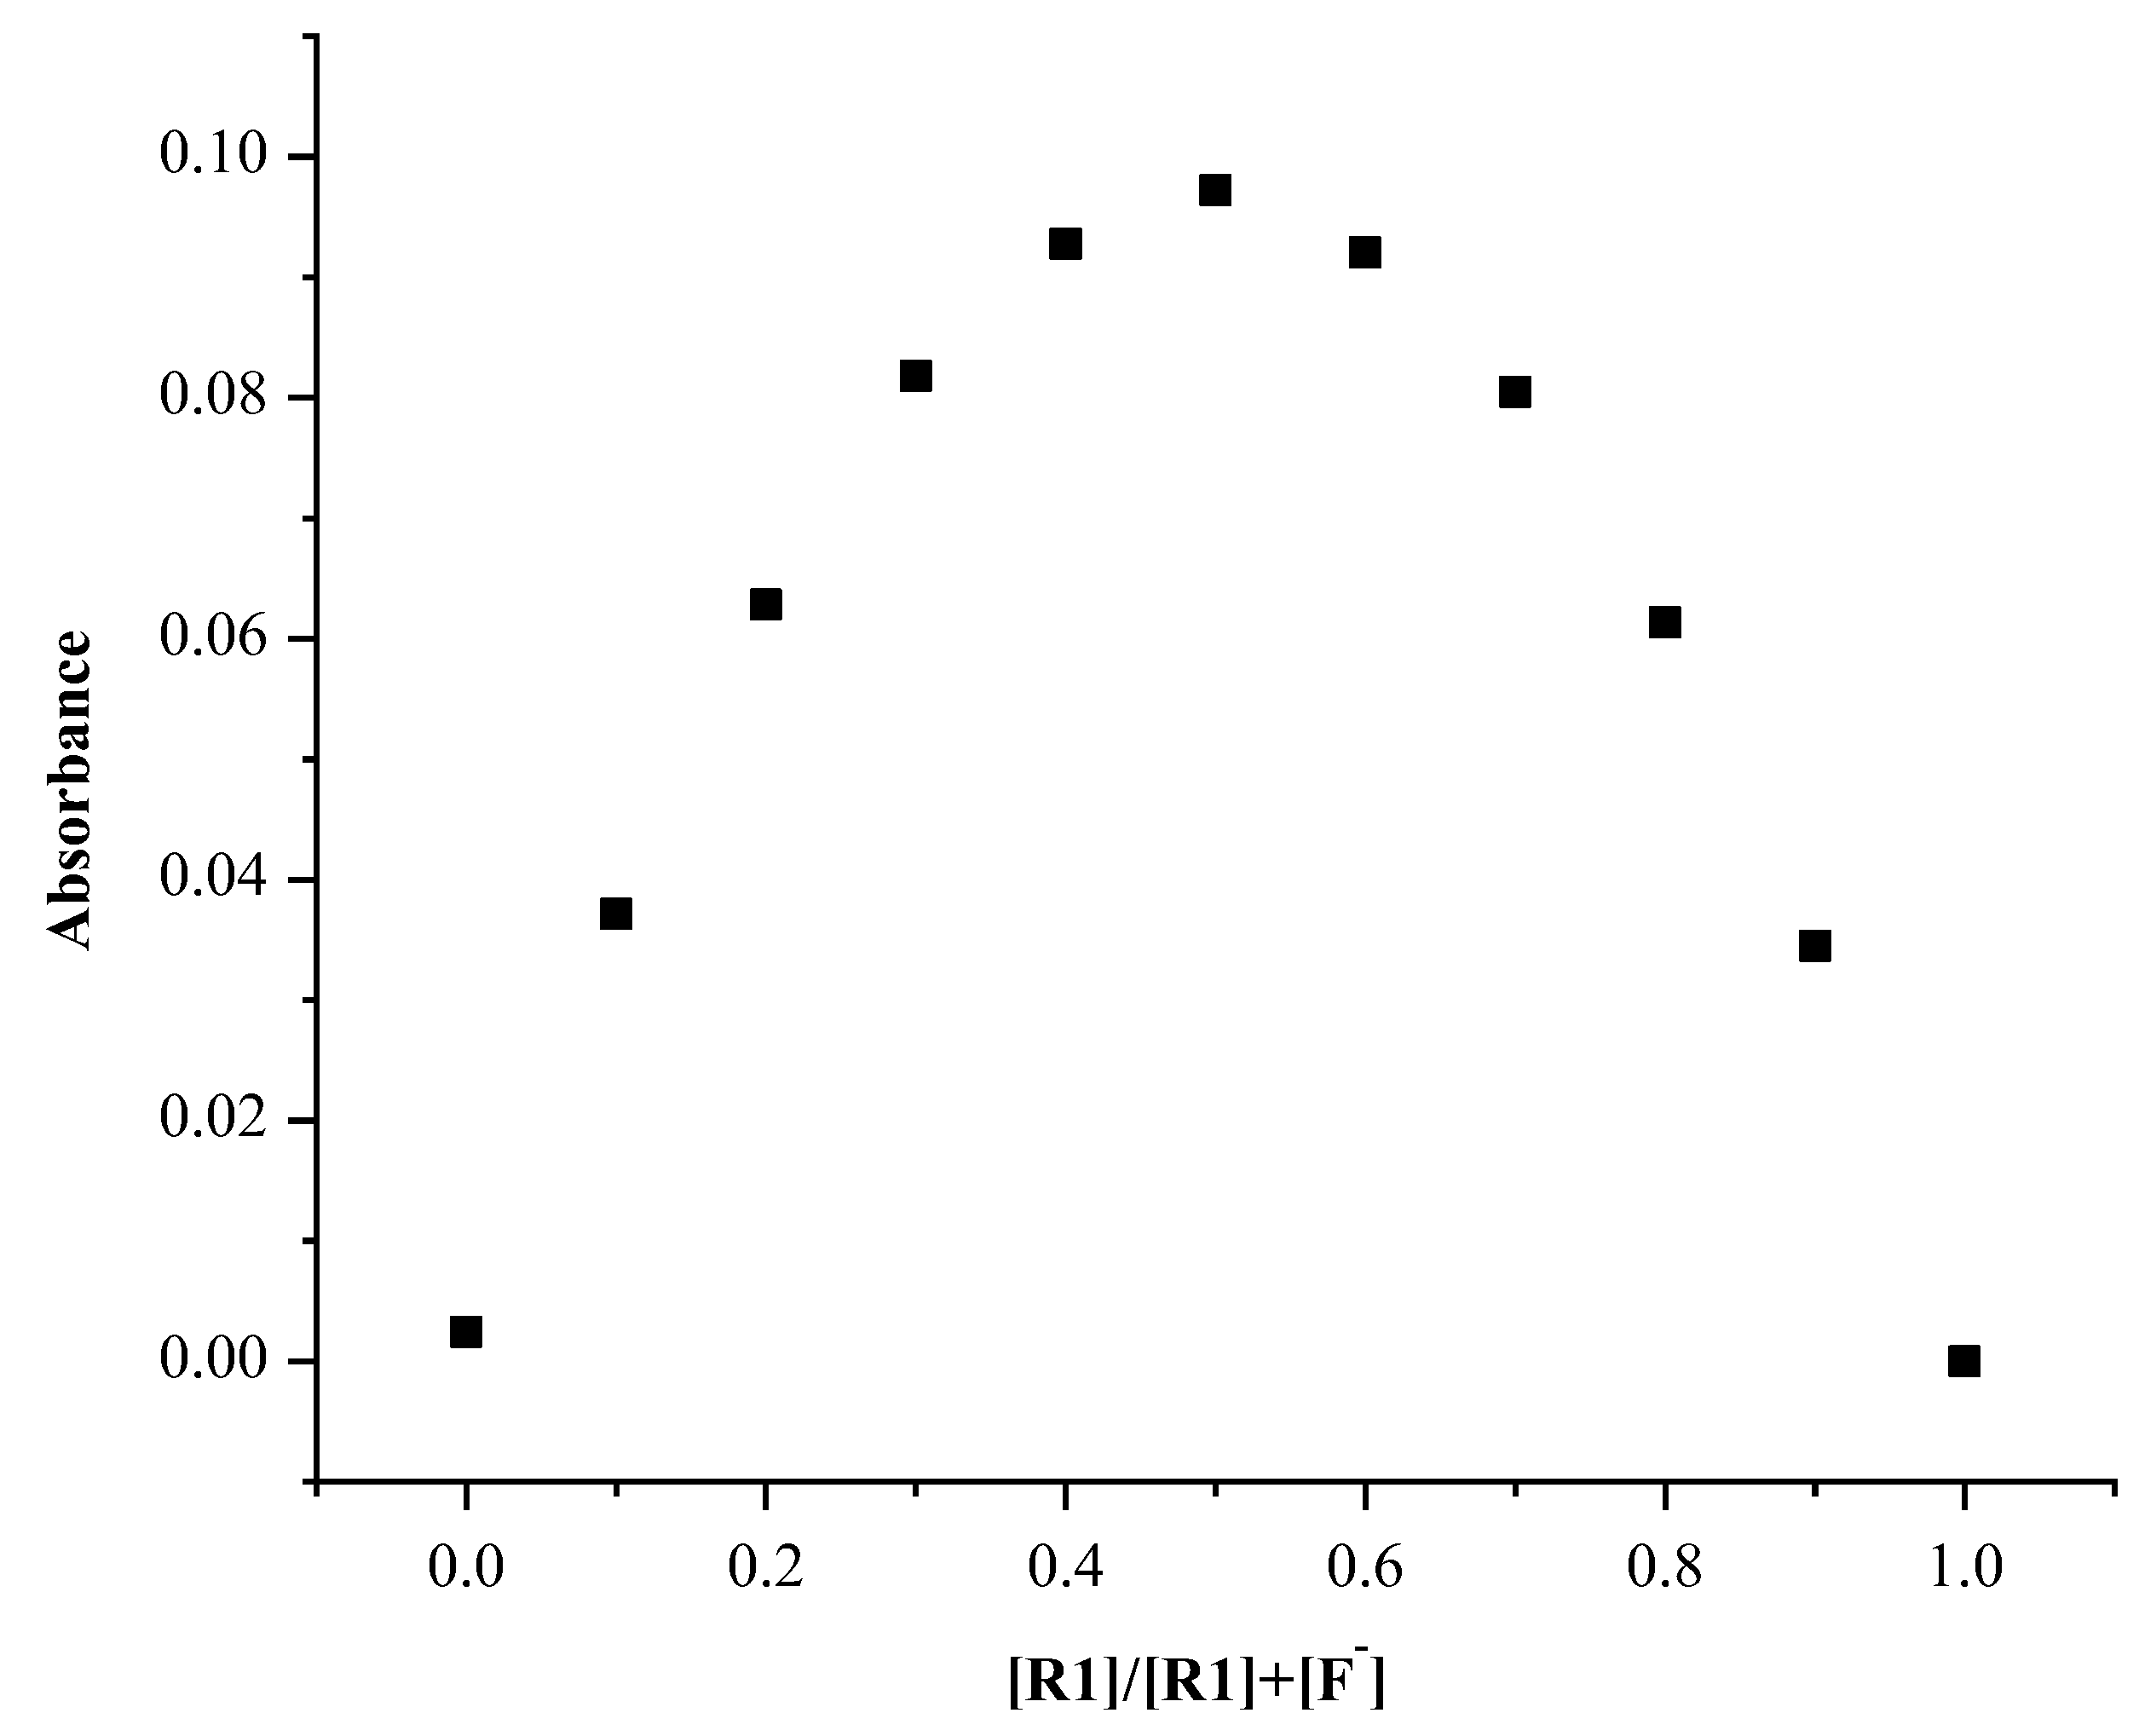
3.3. Characterization of the Binding Interaction of Sensor R1 and Different Anions by UV-Vis Spectroscopy

The absorption wavelength of sensor R1 in DMSO was at 354 nm. To the sensor R1 solution, 80 equivalents of different anions were added, as shown in Figure 5. Following addition of fluoride ion to the sensor R1 solution, the maximum absorption band of sensor R1 changed from 354 to 310 nm, indicating the appearance of the deprotonated form of sensor R1. For other anions, it was found that the intensity of the absorption band at 354 nm decreased, as presented in Figure 5. For the other anions, the maximum absorbance of sensor R1 slightly changed because of weak hydrogen bonding interactions. The graph bar shows that the addition of fluoride ion to sensor R1 resulted in the maximum difference in absorbance (ΔA) at 310 nm when compared with other anions, as shown in Figure 6. These collectively indicated that of the tested anions, sensor R1 had the strongest interaction with fluoride ion. The addition of other anions indicates that the interaction between sensor R1 and other anions was rather weak. In the titration results following addition of 0–80 equivalents of fluoride ion to the solution sensor R1, a new absorption band at 310 nm appeared, corresponding to the deprotonated species in solution, as presented in the Figure 7. For addition of 0–80 equivalents of CH3COO, the intensity of the absorption band at 354 nm decreased, as seen in Figure 8. The other anions gave similar results, all showing a decrease in intensity of the peak at an absorption wavelength of 354 nm because of the weak interaction. A 1:1 complexation ratio between sensor R1 and fluoride ion was confirmed using Job’s plot analysis. The maximum absorption of complexation was observed for the mole fraction ratio of 0.5, as shown in Figure 9.

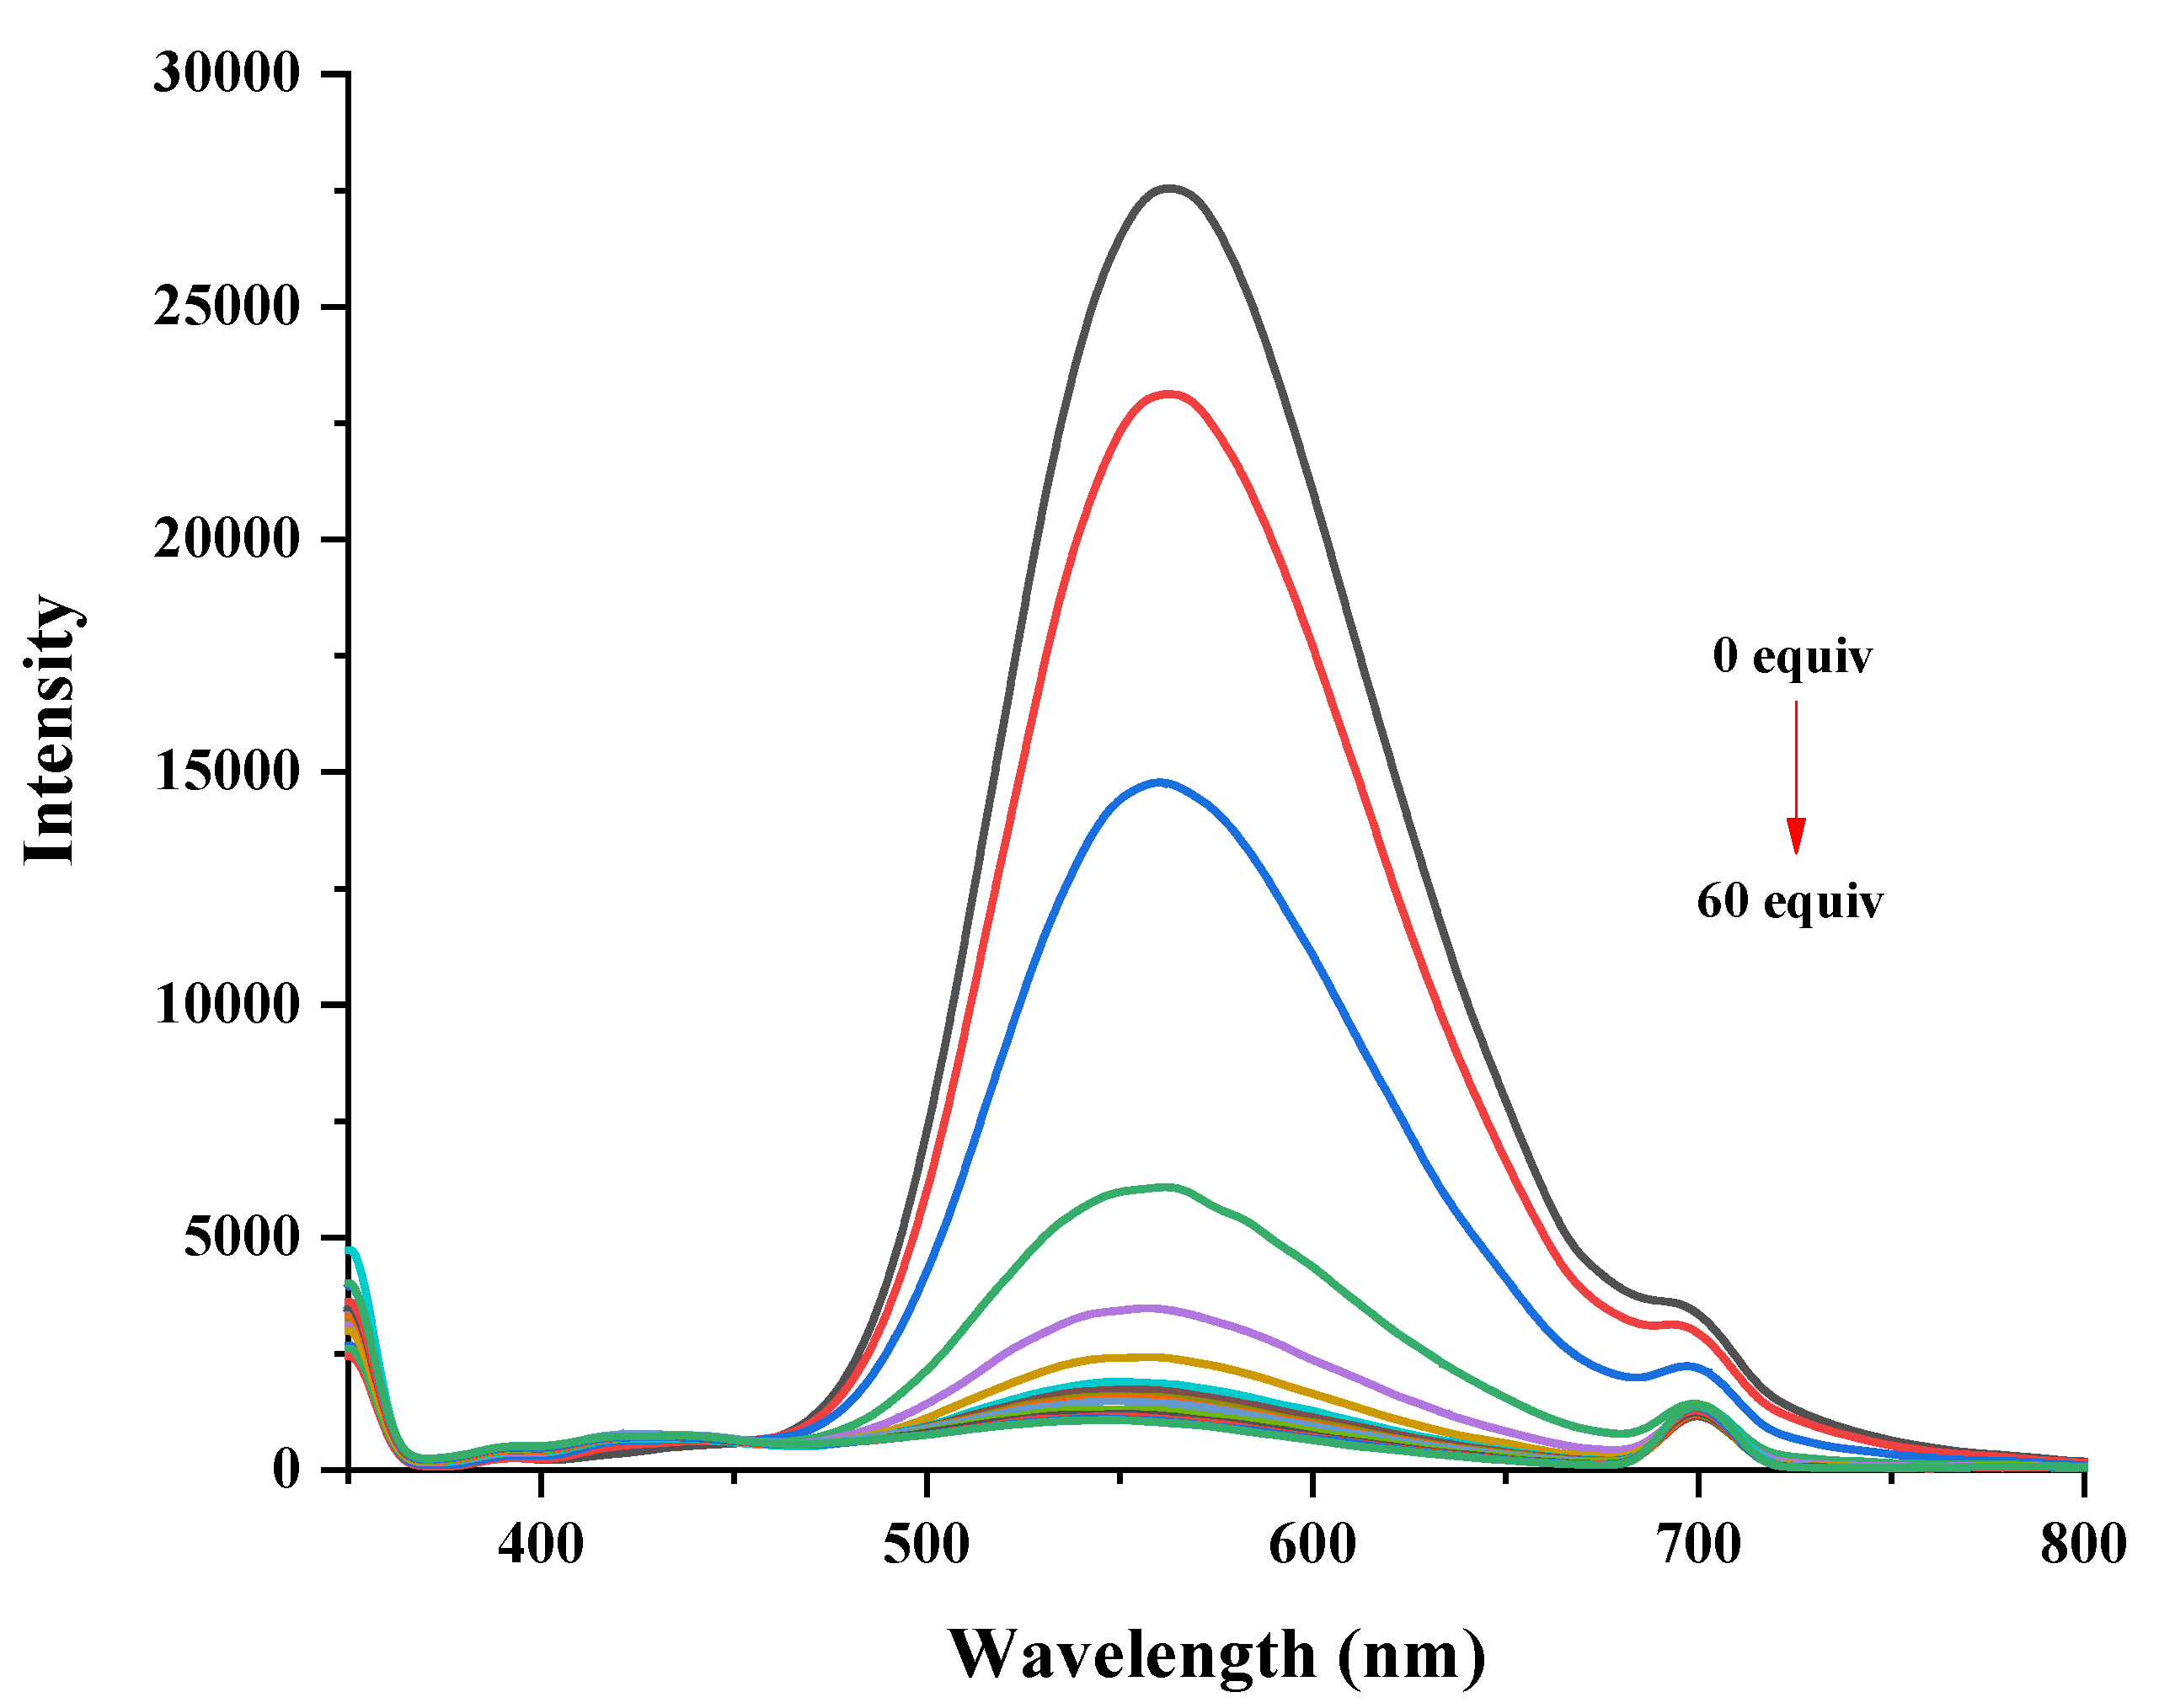
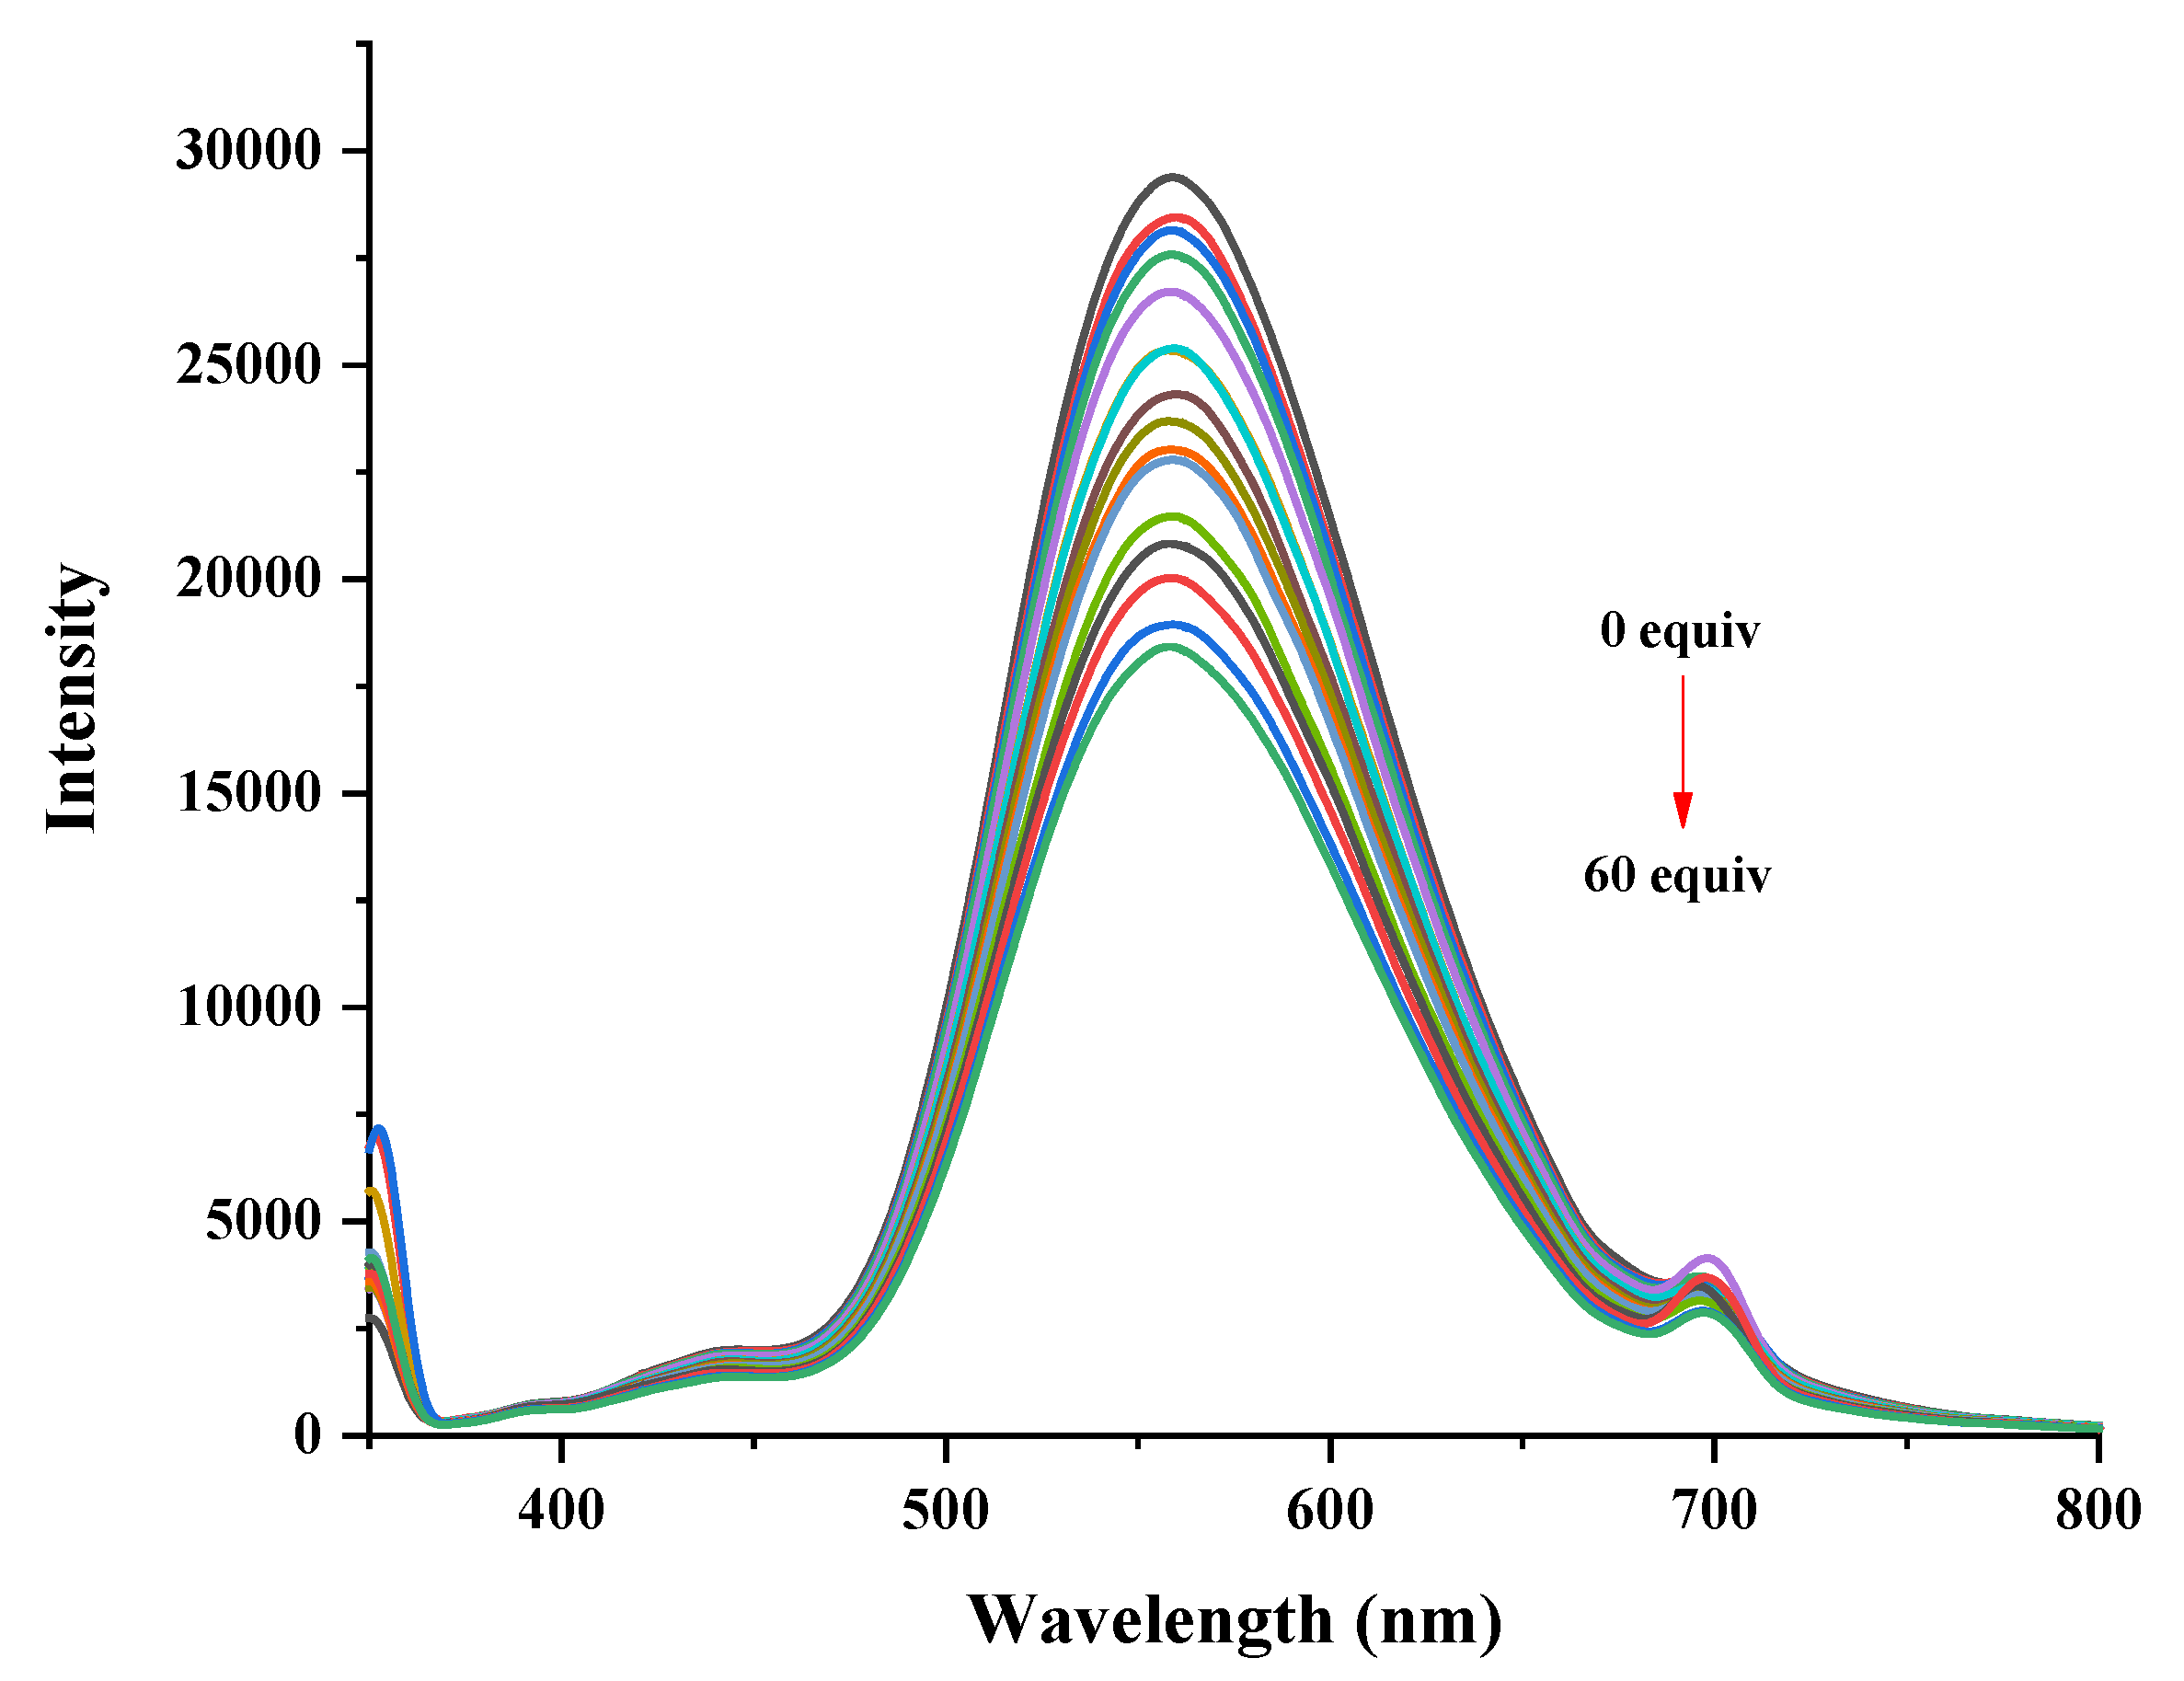
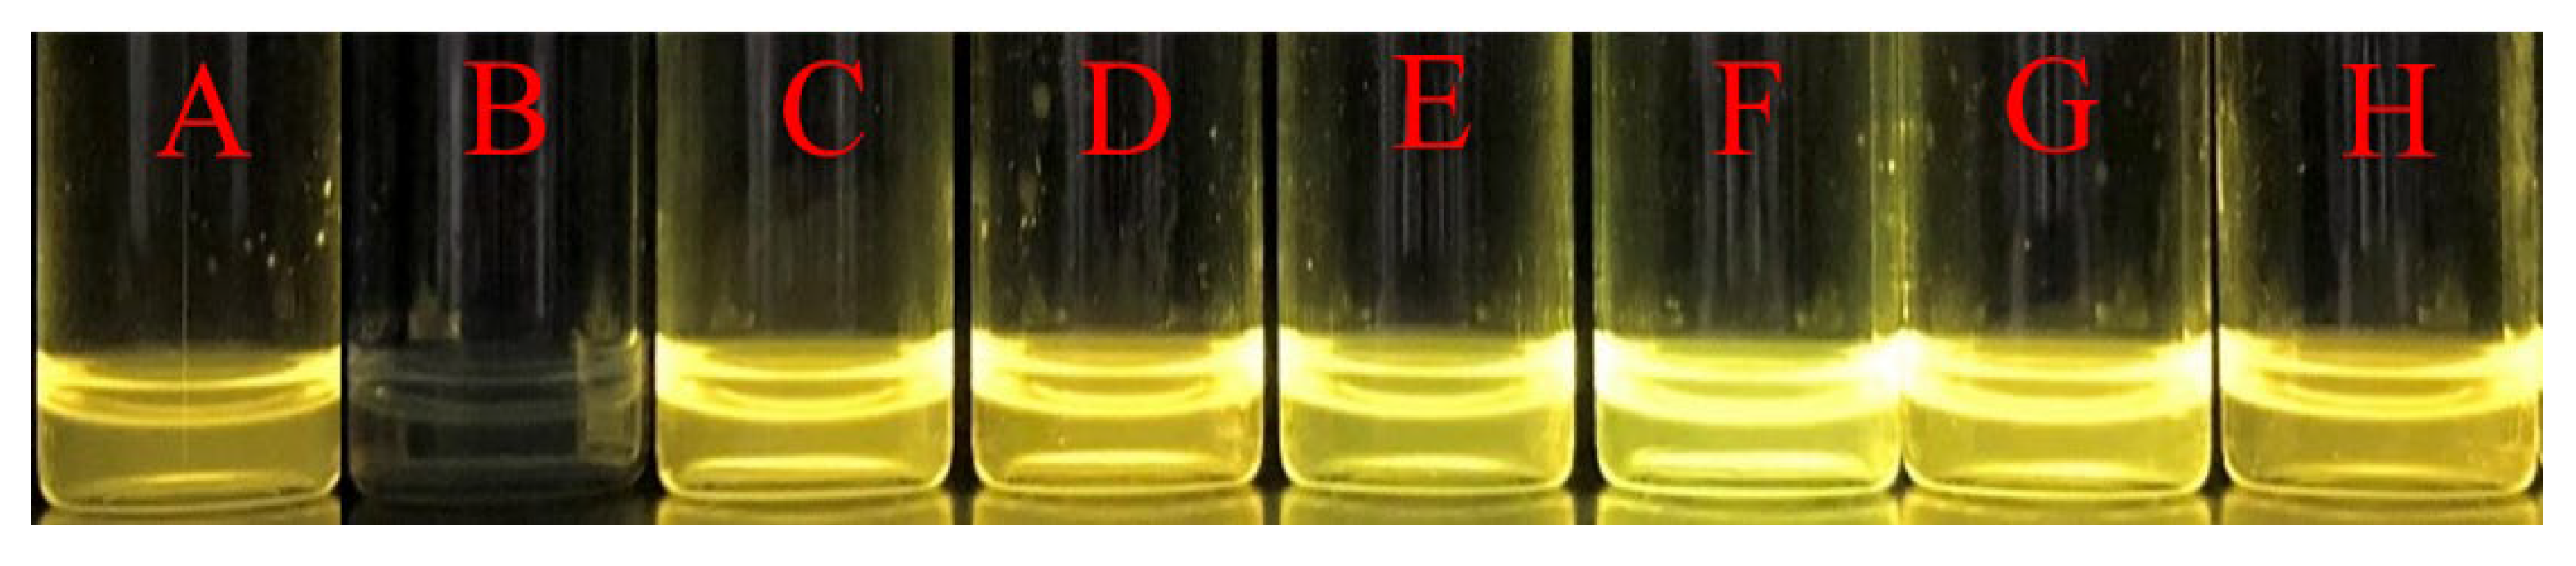
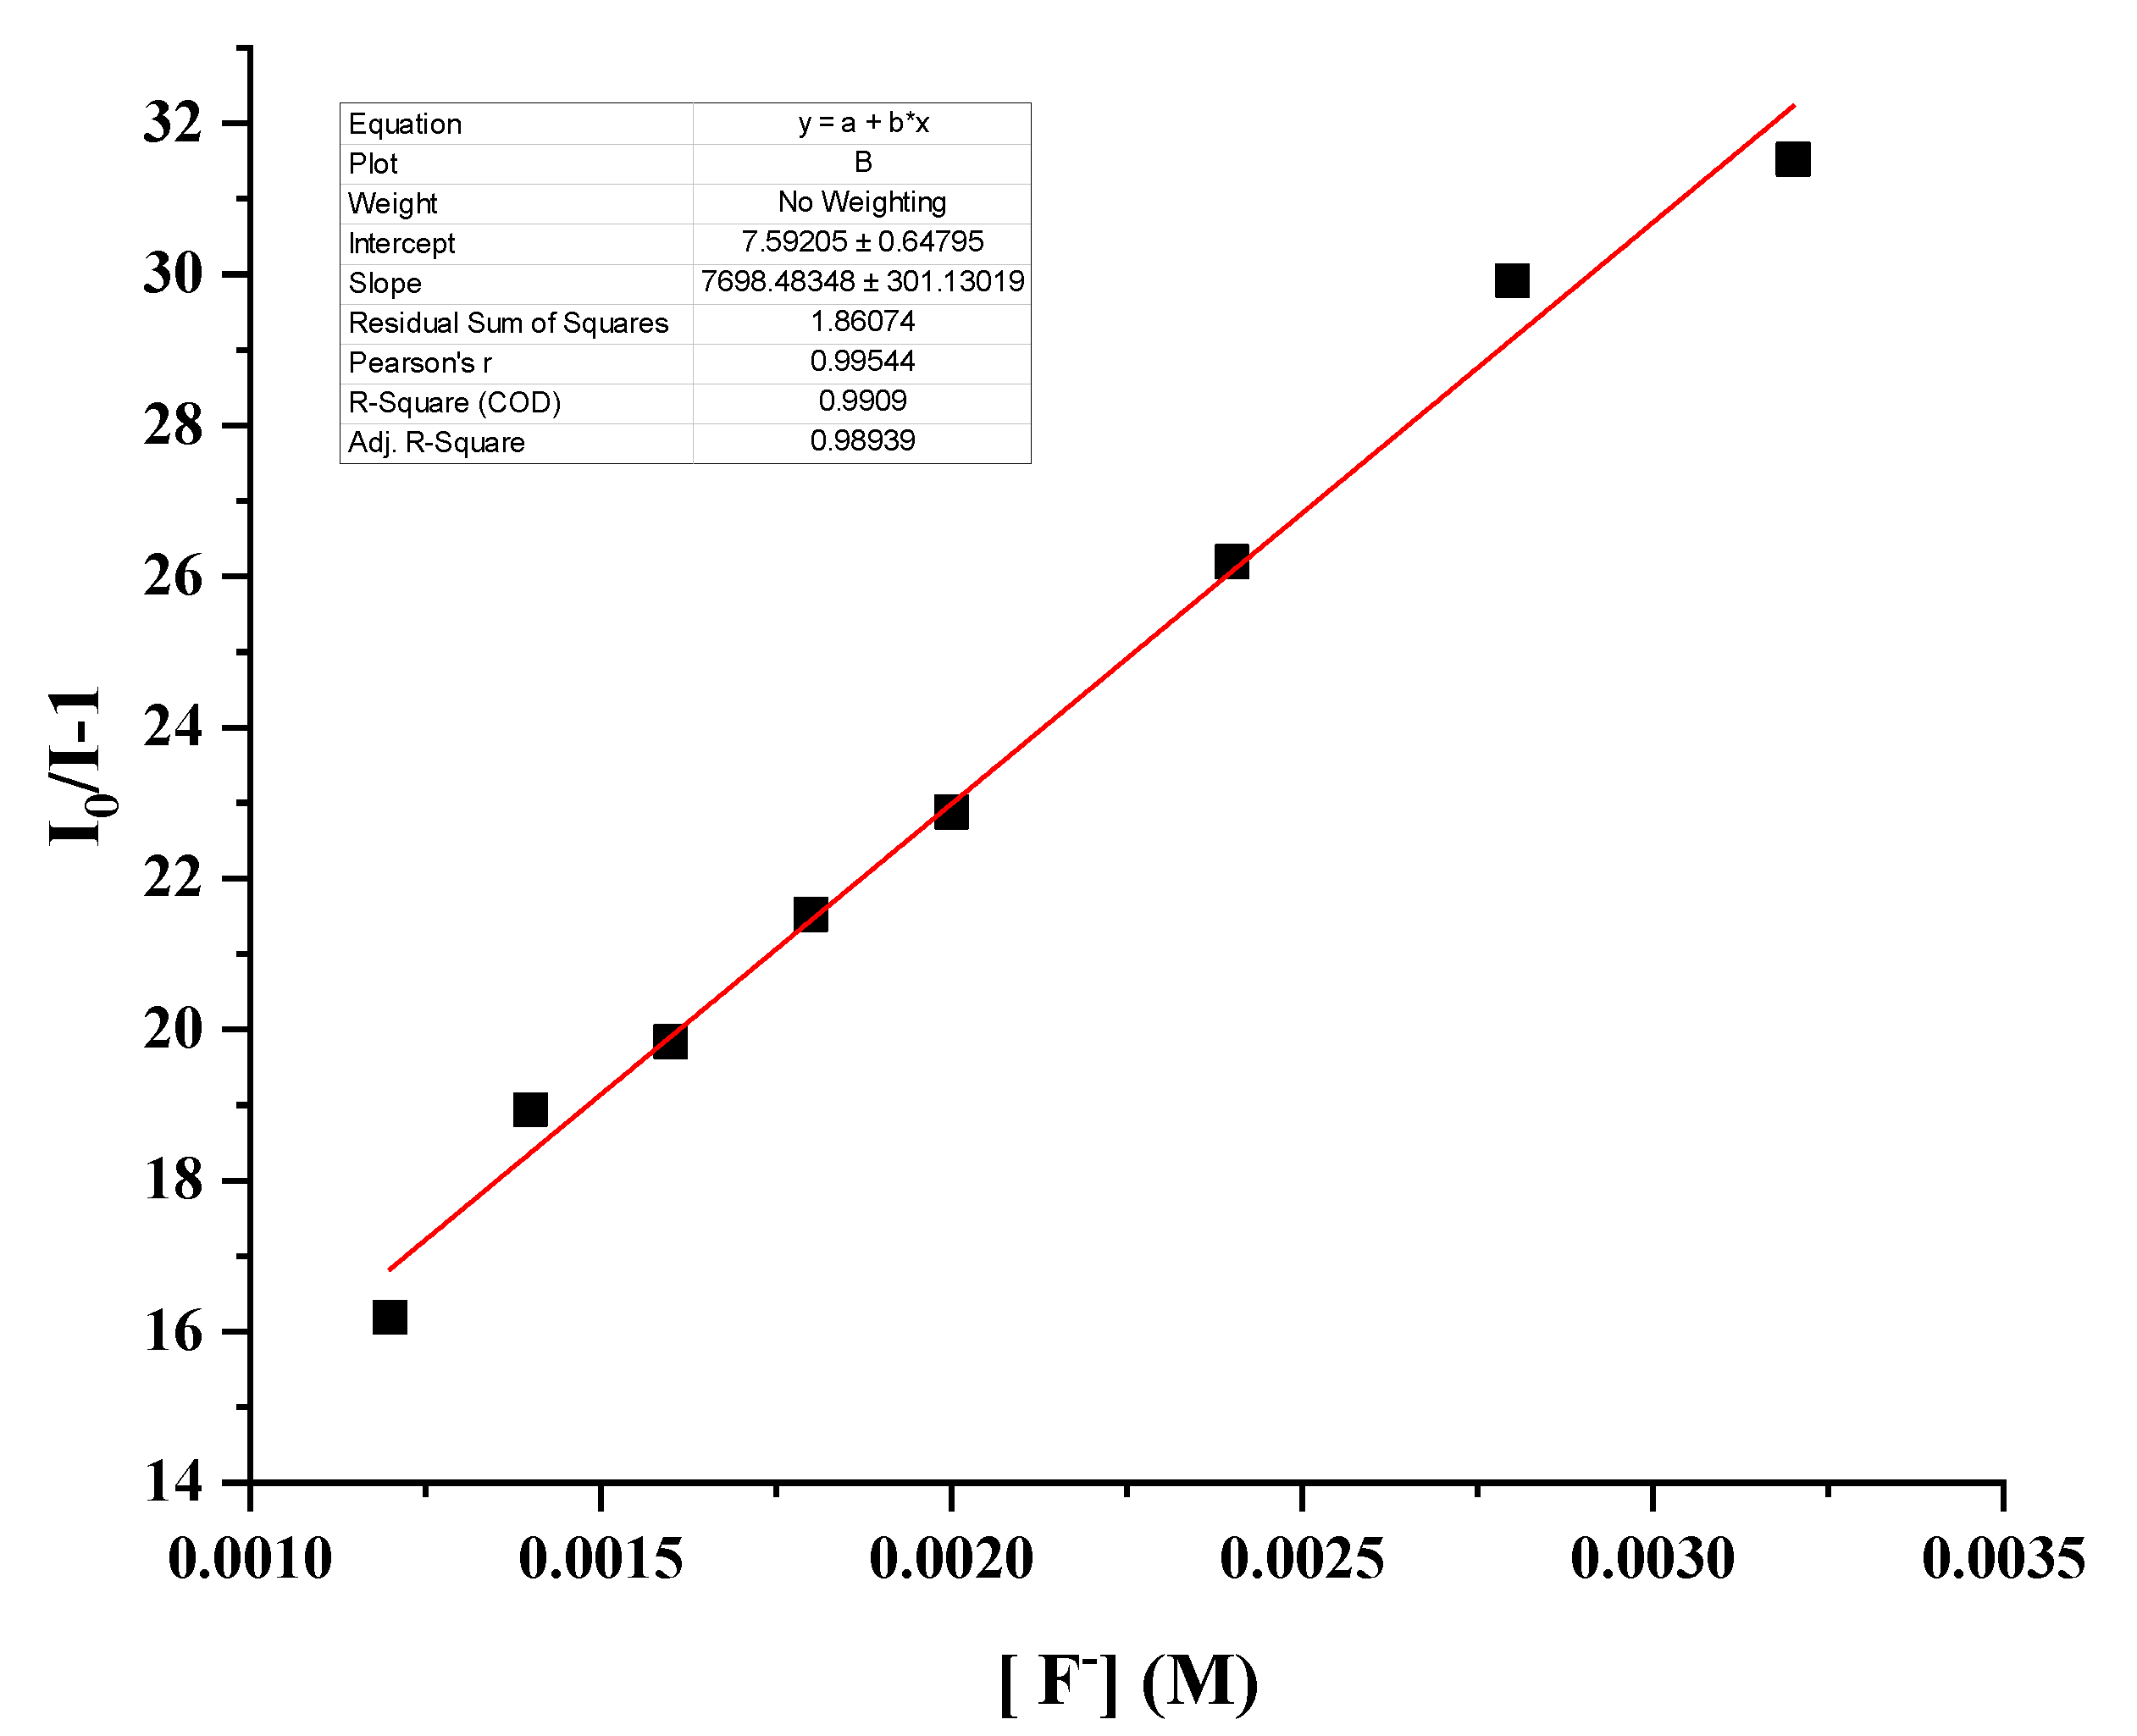
3.4. Complexation Study of Sensor R1 and Various Anions by Fluorescence Spectroscopy

In the fluorescence emission wavelength of sensor R1 in DMSO, a main band at 562 nm and a shoulder band at 700 nm were observed, as presented in Figure 10. With the addition of F ion, an emission band of sensor R1 at 562 nm was quenched due to the appearance of the deprotonated form of sensor R1. For the other anions, there was only a decrease in the intensity of the emission band at 562 nm of sensor R1, as shown in Figure 11. The graph shows that addition of the fluoride ion, in contrast to the other anions, resulted in complete quenching of sensor R1 fluorescence. In color testing under a UV lamp at a wavelength of 365 nm, the yellow brightness fluorescence of sensor R1 disappeared upon addition of fluoride ion. When adding other anions, the solution color of sensor R1 was the same as the original color of R1, as shown in Figure 12. The relationship between sensor R1 and fluoride ion was evaluated using a Stern–Volmer plot, as shown in Figure 13. The Stern–Volmer quenching constant (Ksv) between sensor R1 and fluoride ion was calculated as 7157 M−1. These results indicate that sensor R1 favors binding to fluoride ion over other anions because the fluoride ion has the smallest size and strength of basicity, which facilitate binding with sensor R1. The other anions may still weakly interact with sensor R1. The limit of detection between sensor R1 and F was determined as 3.70 ppm using an equation of 3σ/slope [28].

4. Conclusions

Sensor R1 was successfully synthesized using a one-step protocol. The crystal structure of sensor R1 is in the space group of P21/c. The two molecules of sensor R1 are stabilized through hydrogen bonding interaction. The 1H-NMR results show that the resonance signal for the hydroxyl group of R1 disappears, and that the aromatic moiety shifts upfield upon addition of fluoride ion. The formation of the deprotonated species was confirmed by the appearance of a new band at the 310 nm absorption wavelength and the emission band at 562 nm for sensor R1, which was quenched after adding F ion. Therefore, the results support the use of R1 as a fluorescence sensor for fluoride ion.

Supplementary Materials

The following supporting information can be downloaded at: https://0-www-mdpi-com.brum.beds.ac.uk/article/10.3390/cryst12121836/s1, Figure S1: 1H-NMR spectrum of sensor R1 (1 × 10⁻² M) and excess fluoride ions (10 equivalents).

Author Contributions

Conceptualization, B.W.; methodology, B.W.; funding, B.W.; writing draft, B.W.; writing, B.P.; methodology, S.K., W.S., W.M., T.D. and K.C. All authors have read and agreed to the published version of the manuscript.

Funding

The authors would like to thank the Kasetsart University Research and Development (KURDI) for support under Grant No. FF(KU)9.65 for financial support.

Institutional Review Board Statement

Not applicable.

Informed Consent Statement

Not applicable.

Acknowledgments

The authors thank the Department of Chemistry, Faculty of Science, Kasetsart University for providing facilities and equipment.

Conflicts of Interest

The authors declare no conflict of interest.

References

  1. Sarkar, S.K.; Mukherjee, S.; Thilagar, P. Going beyond Red with a Tri- and Tetracoordinate Boron Conjugate: Intriguing Near-IR Optical Properties and Applications in Anion Sensing. Inorg. Chem. 2014, 53, 2343–2345. [Google Scholar] [CrossRef] [PubMed]
  2. Chang, K.-C.; Minami, T.; Koutnik, P.; Savechenkov, P.Y.; Liu, Y.; Anzenbacher, P., Jr. Anion Binding Modes in meso-Substituted Hexapyrrolic Calix [4]pyrrole Isomers. J. Am. Chem. Soc. 2014, 136, 1520–1525. [Google Scholar] [CrossRef] [PubMed]
  3. Jo, Y.; Chidalla, N.; Cho, D.-G. Bis-ureidoquinoline as a Selective Fluoride Anion Sensor through Hydrogen-Bond Interactions. J. Org. Chem. 2014, 79, 9418–9422. [Google Scholar] [CrossRef] [PubMed]
  4. Liu, L.; Sun, B.; Ding, R.; Mao, Y. Role of the Weak Interactions during the 2,4,6-Trinitrophenol Detecting Process of a Fluorescein-Based Sensor. J. Phys. Chem. A 2021, 125, 7867–7875. [Google Scholar] [CrossRef] [PubMed]
  5. Aboubakr, H.; Brisset, H.; Siri, O.; Raimundo, J.-M. Highly Specific and Reversible Fluoride Sensor Based on an Organic Semiconductor. Anal. Chem. 2013, 85, 9968–9974. [Google Scholar] [CrossRef] [PubMed]
  6. Das, S.; Bharadwaj, P.K. Self-Assembly of a Luminescent Zinc (II) Complex: A Supramolecular Host-Guest Fluorescence Signaling System for Selective Nitrobenzene Inclusion. Inorg. Chem. 2006, 45, 5257–5259. [Google Scholar] [CrossRef]
  7. Areti, S.; Bandaru, S.; Rao, C.P. Triazole-Linked Quinoline Conjugate of Glucopyranose: Selectivity Comparison among Zn2+, Cd2+, and Hg2+ Based on Spectroscopy, Thermodynamics, and Microscopy, and Reversible Sensing of Zn2+ and the Structure of the Complex Using DFT. ACS Omega 2016, 1, 626–635. [Google Scholar] [CrossRef] [Green Version]
  8. Wang, H.-H.; Gan, Q.; Wang, X.-J.; Xue, L.; Liu, S.-H.; Jiang, H.A. Water-Soluble, Small Molecular Fluorescent Sensor with Femtomolar Sensitivity for Zinc Ion. Org. Lett. 2007, 9, 4995–4998. [Google Scholar] [CrossRef]
  9. Ravi, A.; Krishnarao, P.S.; Shumilova, T.A.; Khrustalev, V.N.; Rüffer, T.; Lang, H.; Kataev, E.A. Cation Molecular Exchanger Based on a Conformational Hinge. Org. Lett. 2018, 20, 6211–6214. [Google Scholar] [CrossRef]
  10. Zhou, Y.-P.; Zhang, M.; Li, Y.-H.; Guan, Q.-R.; Wang, F.; Lin, Z.-J.; Lam, C.-K.; Feng, X.-L.; Chao, H.-Y. Mononuclear Gold(I) Acetylide Complexes with Urea Group: Synthesis, Characterization, Photophysics, and Anion Sensing Properties. Inorg. Chem. 2012, 51, 5099–5109. [Google Scholar] [CrossRef]
  11. Filby, M.H.; Dickson, S.J.; Zaccheroni, N.; Prodi, L.; Bonacchi, S.; Montalti, M.; Paterson, M.J.; Humphries, T.D.; Chiorboli, C.; Steed, J.W. Induced Fit Interanion Discrimination by Binding-Induced Excimer Formation. J. Am. Chem. Soc. 2008, 130, 4105–4113. [Google Scholar] [CrossRef] [PubMed]
  12. Kumar, A.; Yang, M.; Kim, M.; Gabba, F.P.; Lee, M.H. OFF-ON Fluorescence Sensing of Fluoride by Donor-Antimony(V) Lewis Acids. Organometallics 2017, 36, 4901–4907. [Google Scholar] [CrossRef]
  13. Goswami, S.; Hazra, A.; Chakrabarty, R.; Fun, H.-K. Recognition of Carboxylate Anions and Carboxylic Acids by Selenium-Based New Chromogenic Fluorescent Sensor: A Remarkable Fluorescence Enhancement of Hindered Carboxylates. Org. Lett. 2009, 11, 4350–4353. [Google Scholar] [CrossRef] [PubMed]
  14. Busschaert, N.; Caltagirone, C.; Rossom, W.V.; Gale, P.A. Applications of Supramolecular Anion Recognition. Chem. Rev. 2015, 115, 8038–8155. [Google Scholar] [CrossRef] [PubMed]
  15. Mohapatra, S.; Sahu, S.; Nayak, S.; Ghosh, S.K. Design of Fe3O4@SiO2@Carbon Quantum Dot Based Nanostructure for Fluorescence Sensing, Magnetic Separation, and Live Cell Imaging of Fluoride Ion. Langmuir 2015, 31, 8111–8120. [Google Scholar] [CrossRef] [PubMed]
  16. Ullah, Z.; Sonawane, P.M.; Nguyen, T.S.; Garai, M.; Churchill, D.G.; Yavuz, C.T. Bisphenol-based cyanide sensing: Selectivity, reversibility, facile synthesis, bilateral “OFF-ON” fluorescence, C2ν structural and conformational analysis. Spectrochim. Acta Part A Mol. Biomol. Spectroscopy 2021, 256, 119881. [Google Scholar] [CrossRef]
  17. Sui, B.; Kim, B.; Zhang, Y.; Frazer, A.; Belfield, K.D. Highly Selective Fluorescence Turn-On Sensor for Fluoride Detection. Appl. Mater. Interfaces 2013, 5, 2920–2923. [Google Scholar] [CrossRef]
  18. Mukherjee, S.; Shah, M.; Chaudhari, K.; Jana, A.; Sudhakar, C.; Srikrishnarka, P.; Islam, M.R.; Philip, L.; Pradeep, T. Smartphone-based Fluoride-specific Sensor for Rapid and Affordable Colorimetric Detection and Precise Quantification at Sub-ppm Levels for Field Applications. ACS Omega 2020, 5, 25253–25263. [Google Scholar] [CrossRef]
  19. Melaimi, M.; GabbaÏ, F.P. A Heteronuclear Bidentate Lewis Acid as a Phosphorescent Fluoride Sensor. J. Am. Chem. Soc. 2005, 127, 9680–9681. [Google Scholar] [CrossRef]
  20. Stauber, J.M.; Alliger, G.E.; Nocera, D.G.; Cummins, C.C. Second-Coordination-Sphere Assisted Selective Colorimetric Turn-On Fluoride Sensing by a Mono-Metallic Co(II) Hexacarboxamide Cryptand Complex. Inorg. Chem. 2017, 56, 7615–7619. [Google Scholar] [CrossRef]
  21. Bhosale, S.V.; Bhosale, S.V.; Kalyankar, M.B.; Langford, S.J. A Core-Substituted Naphthalene Diimide Fluoride Sensor. Org. Lett. 2009, 11, 5418–5421. [Google Scholar] [CrossRef] [PubMed]
  22. Zhou, X.; Lai, R.; Li, H.; Stains, C.I. The 8-Silyloxyquinoline Scaffold as a Versatile Platform for the Sensitive Detection of Aqueous Fluoride. Anal. Chem. 2015, 87, 4081–4086. [Google Scholar] [CrossRef] [PubMed] [Green Version]
  23. Ullah, Z.; Kraimi, A.; Kim, H.J.; Jang, S.; Mary, Y.S.; Kwon, H.W. Selective detection of F ion and SO2 molecule: An experimental and DFT study. J. Mol.Liq. 2022, 359, 119329. [Google Scholar] [CrossRef]
  24. Macrae, C.F.; Bruno, I.J.; Chisholm, J.A.; Edgington, P.R.; McCabe, P.; Pidcock, E.; Rodriguez-Monge, L.; Taylor, R.; Streek, J.V.D.; Wood, P.A. Mercury CSD 2.0-New Features for the Visualization and Investigation of Crystal Structures. J. Appl. Crystallogr. 2008, 41, 466–470. [Google Scholar] [CrossRef]
  25. Dolomanov, O.V.; Bourhis, L.J.; Gildea, R.J.; Howard, J.A.K.; Puschmann, H. OLEX2: A Complete Structure Solution, Refinement and Analysis Program. J. Appl. Crystallogr. 2009, 42, 339–341. [Google Scholar] [CrossRef]
  26. Sheldrick, G.M. Crystal Structure Refinement with SHELXL. Acta Crystallogr. 2015, C71, 3–8. [Google Scholar]
  27. Saravanan, C.; Easwaramoorthi, S.; Hsiow, C.-Y.; Wang, K.; Hayashi, M.; Wang, L. Benzoselenadiazole Fluorescent Probes—Near-IR Optical and Ratiometric Fluorescence Sensor for Fluoride Ion. Org. Lett. 2014, 16, 354–357. [Google Scholar] [CrossRef]
  28. Buasakun, J.; Srilaoong, P.; Chainok, K.; Raksakoon, C.; Rattanakram, R.; Duangthongyou, T. Dual Luminescent Coordination Polymers Based on Flexible Aliphatic Carboxylate Ligands Supplemented by Rigid Bipyridyl Ligands for 2,4-Dinitrophenol (DNP) and Iron(III) Ion Detection. Polyhedron 2021, 204, 115265. [Google Scholar] [CrossRef]
Figure 1. Molecular structure of sensor R1 drawn with 50% thermal ellipsoid probability. Hydrogen atoms have been omitted for clarity.
Crystals 12 01836 g001
Figure 2. Hydrogen bonding in sensor R1.
Crystals 12 01836 g002
Figure 3. Packing images of sensor R1: (a) front view and (b) side view.
Crystals 12 01836 g003
Figure 4. 1H-NMR spectrum of sensor R1 (1 × 10⁻² M) (A) with 6 equivalents of different anions of Br (B), I (C), Cl (D), F (E), H2PO4 (F), CH3COO (G), and C6H5COO (H) in d6-DMSO.
Crystals 12 01836 g004
Figure 5. The absorption spectra of sensor R1 (1 × 10⁻⁴ M) and sensor R1 in DMSO with 80 equivalents of different anions.
Crystals 12 01836 g005
Figure 6. Bar graph of absorbances at 310 nm for different mixtures of sensor R1 with various anions.
Crystals 12 01836 g006
Figure 7. UV-vis spectra of titration between sensor R1 (1 × 10⁻⁴ M) and fluoride ion in a range of concentrations (0–80 equivalents) in DMSO.
Crystals 12 01836 g007
Figure 8. UV-vis spectra of titration between sensor R1 (1 × 10⁻⁴ M) and CH3COO in a range of concentrations (0–80 equivalents) in DMSO.
Crystals 12 01836 g008
Figure 9. Job’s plot between sensor R1 and fluoride ion.
Crystals 12 01836 g009
Figure 10. The fluorescence spectra in DMSO of titration between sensor R1 (5 × 10⁻⁵ M) and F ion in the range of concentrations of 0-60 equivalents.
Crystals 12 01836 g010
Figure 11. The fluorescence spectra in DMSO of titration between sensor R1 (5 × 10⁻⁵ M) and Cl ion in the range of concentrations of 0-60 equivalents.
Crystals 12 01836 g011
Figure 12. The color change resulting from combination of sensor R1 and different anions under UV lamp 365 nm, in order of (A) only sensor R1, (B) R1+F, (C) R1+Cl, (D) R1+Br, (E) R1+CH3COO, (F) R1+H2PO4, (G) R1+C6H5COO, and (H) R1+I.
Crystals 12 01836 g012
Figure 13. Stern-Volmer plot of fluorescence quenching due to interaction between sensor R1 and fluoride ion.
Crystals 12 01836 g013
Table 1. Crystal data and structure refinement parameters for sensor R1.
Crystal DataSensor R1
Empirical formulaC18H19NO6S
Formula weight377.40
Temperature(K)296
Crystal systemmonoclinic
Space groupP21/c
a/Å8.1631(3)
b/Å9.3968(3)
c/Å23.5699(9)
α/°90.00
β/°97.8630(10)
γ/°90.00
Volume/Å31790.98(11)
Z4
ρcalc g/cm31.400
μ/mm−10.216
F (000)792.0
Crystal size/mm30.24 × 0.2 × 0.1
RadiationMoKα (λ = 0.71073)
2Θ range for data collection/°4.672 to 54.968
Index ranges−10 ≤ h ≤ 10, −12 ≤ k ≤ 12, −30 ≤ l ≤ 30
Reflections collected36,616
Independent reflections4106 [Rint = 0.0773, Rsigma = 0.0345]
Data/restraints/parameters4106/12/254
Goodness-of-fit on F21.017
Final R indexes [I ≥ 2σ (I)]R1 = 0.0451, wR2 = 0.0965
Final R indexes [all data]R1 = 0.0797, wR2 = 0.1141
Largest diff. peak/hole/e Å−30.14/−0.31
Table 2. Selected bond lengths (Å), bond angles (°) and torsion angles (°) in sensor R1.
Sensor R1
Selected bond lengths
N1–C171.468(4)C1–O11.421(2)C5–O51.367(2)S1–O21.430(2)
N1–C181.460(3)C3–O41.370(2)S1–O11.594(2)S1–O31.418(2)
Selected bond angles
C12–N1–C18116.1(2)O1–S1–O3103.02(9)
C17–N1–C12112.7(2)O2–S1–O3118.5(1)
C17–N1–C18109.6(2)S1–O1–C1118.5(1)
C7–S1–O1102.31(9)O4–C3–C2117.3(2)
C7–S1–O2109.2(1)O4–C3–C4121.3(2)
C7–S1–O3113.3(1)O5–C5–C4117.7(2)
O1–S1–O2108.93(9)O5–C5–C6121.3(2)
Selected torsion angles
C17–N1–C12–C11−110.0(3)O3–S1–C7–C8−49.9(2)
C17–N1–C12–C1371.1(3)O3–S1–C7–C16135.2(2)
C18–N1–C12–C1117.5(3)S1–O1–C1–C270.2(2)
C18–N1–C12–C13−161.4(2)S1–O1–C1–C6−111.3(2)
O2–S1–O1–C1−66.5(2)O5–C5–C4–C3−179.5(2)
O2–S1–O7–C8175.6(2)O5–C5–C6–C1−179.8(2)
O2–S1–O7–C160.7(2)O4–C3–C2–C1179.0(2)
O3–S1–O1–C1166.8(1)O4–C3–C4–C5−179.9(2)
Publisher’s Note: MDPI stays neutral with regard to jurisdictional claims in published maps and institutional affiliations.

