
Molecular Simulation Approaches to the Study of Thermotropic and Lyotropic Liquid Crystals

 ,
,  ,
,
Abstract
:1. Introduction
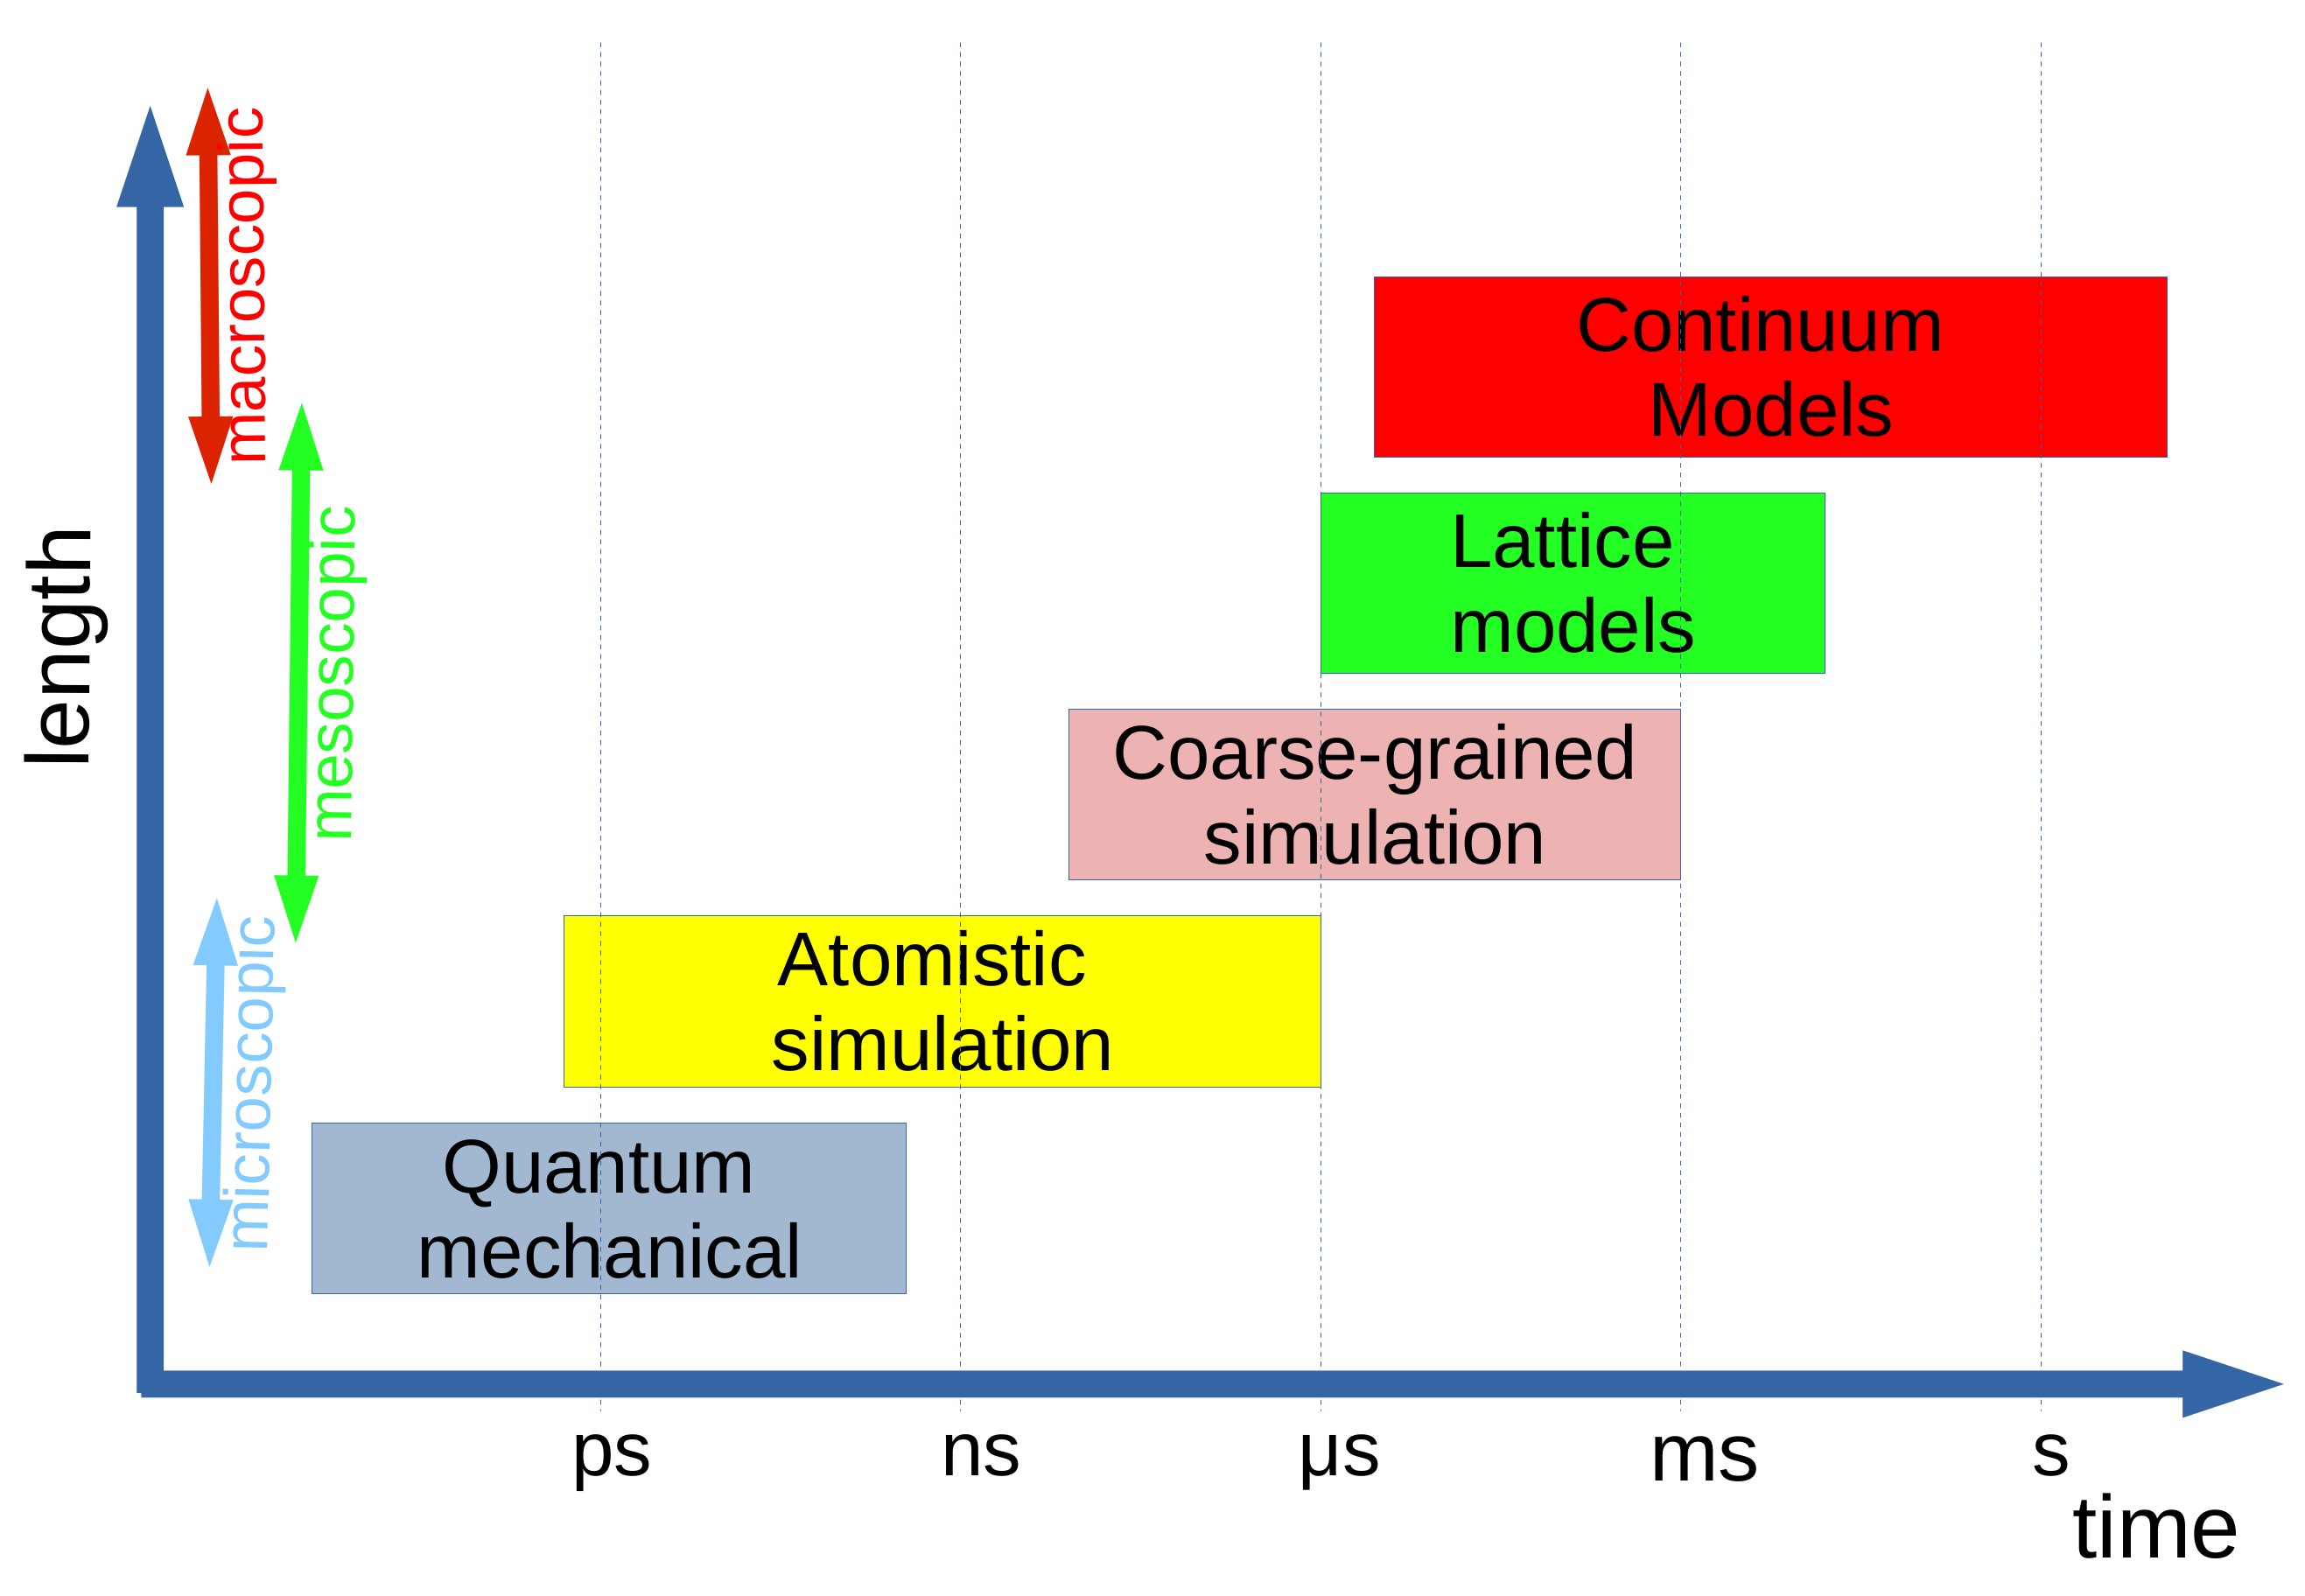
- The quantum mechanical regime, where single-molecule calculations are valuable in determining molecular properties of single thermotropic mesogens to use, for example, in the development of materials for displays [15];
- The coarse-grained regime where simulations can be used to study the structure of smectics [18], twist grain boundary phases [19], and polymer liquid crystals [20,21,22,23] and more complex liquid crystal phases where molecular shape and packing (or often the shape of a larger object such as a colloid) are often significant in determining the structure of the phase;
- The continuum regime where simulations no longer consider a molecular description but instead considers a fluid description where the local orientation of the director can be followed in complex geometries [24].
2. Thermotropic Liquid Crystals
2.1. Atomistic Simulations of Thermotropics: Towards the Prediction of Accurate Transition Temperatures
- A good charge distribution to represent the local electrostatic potential around a thermotropic mesogen;
- Accurate torsional potentials to represent internal rotations, as these can dramatically alter the average shape exhibited by a thermotropic mesogen within a liquid crystalline phase;
- Excellent nonbonded interactions to represent steric repulsion and attractive interactions.
2.2. Simulation Insights into the Structure of New Phases
- The dark conglomerate (DC) phase where atomistic simulations demonstrate the presence of molecular layers which undergo a saddle-splay layer deformation [31];
- Studies of B4 phase forming molecules [45,46] where subtle changes in molecular packing can be induced by the positioning of a (sterically significant) lateral methyl group at chiral centres in bent-core molecules with a long and short arm. These lead to changes in the splay, twist, and bend of molecular layers, which ultimately lead to the formation of twisted filaments and multi-level hierarchical self-assembled structures.
- The formation of chiral superstructures from asymmetric bent-cores molecules composed of achiral tangential Lennard–Jones and WCA spheres [54];
- The formation of the phase from crescent-shaped particles composed of tangential hard spheres [55];
- The formation of biaxial, twist-bend, and splay-bend nematic phases from hard banana-shaped particles [56].
2.3. Calculation of Material Properties Using Molecular Simulations
3. Lyotropic Liquid Crystals
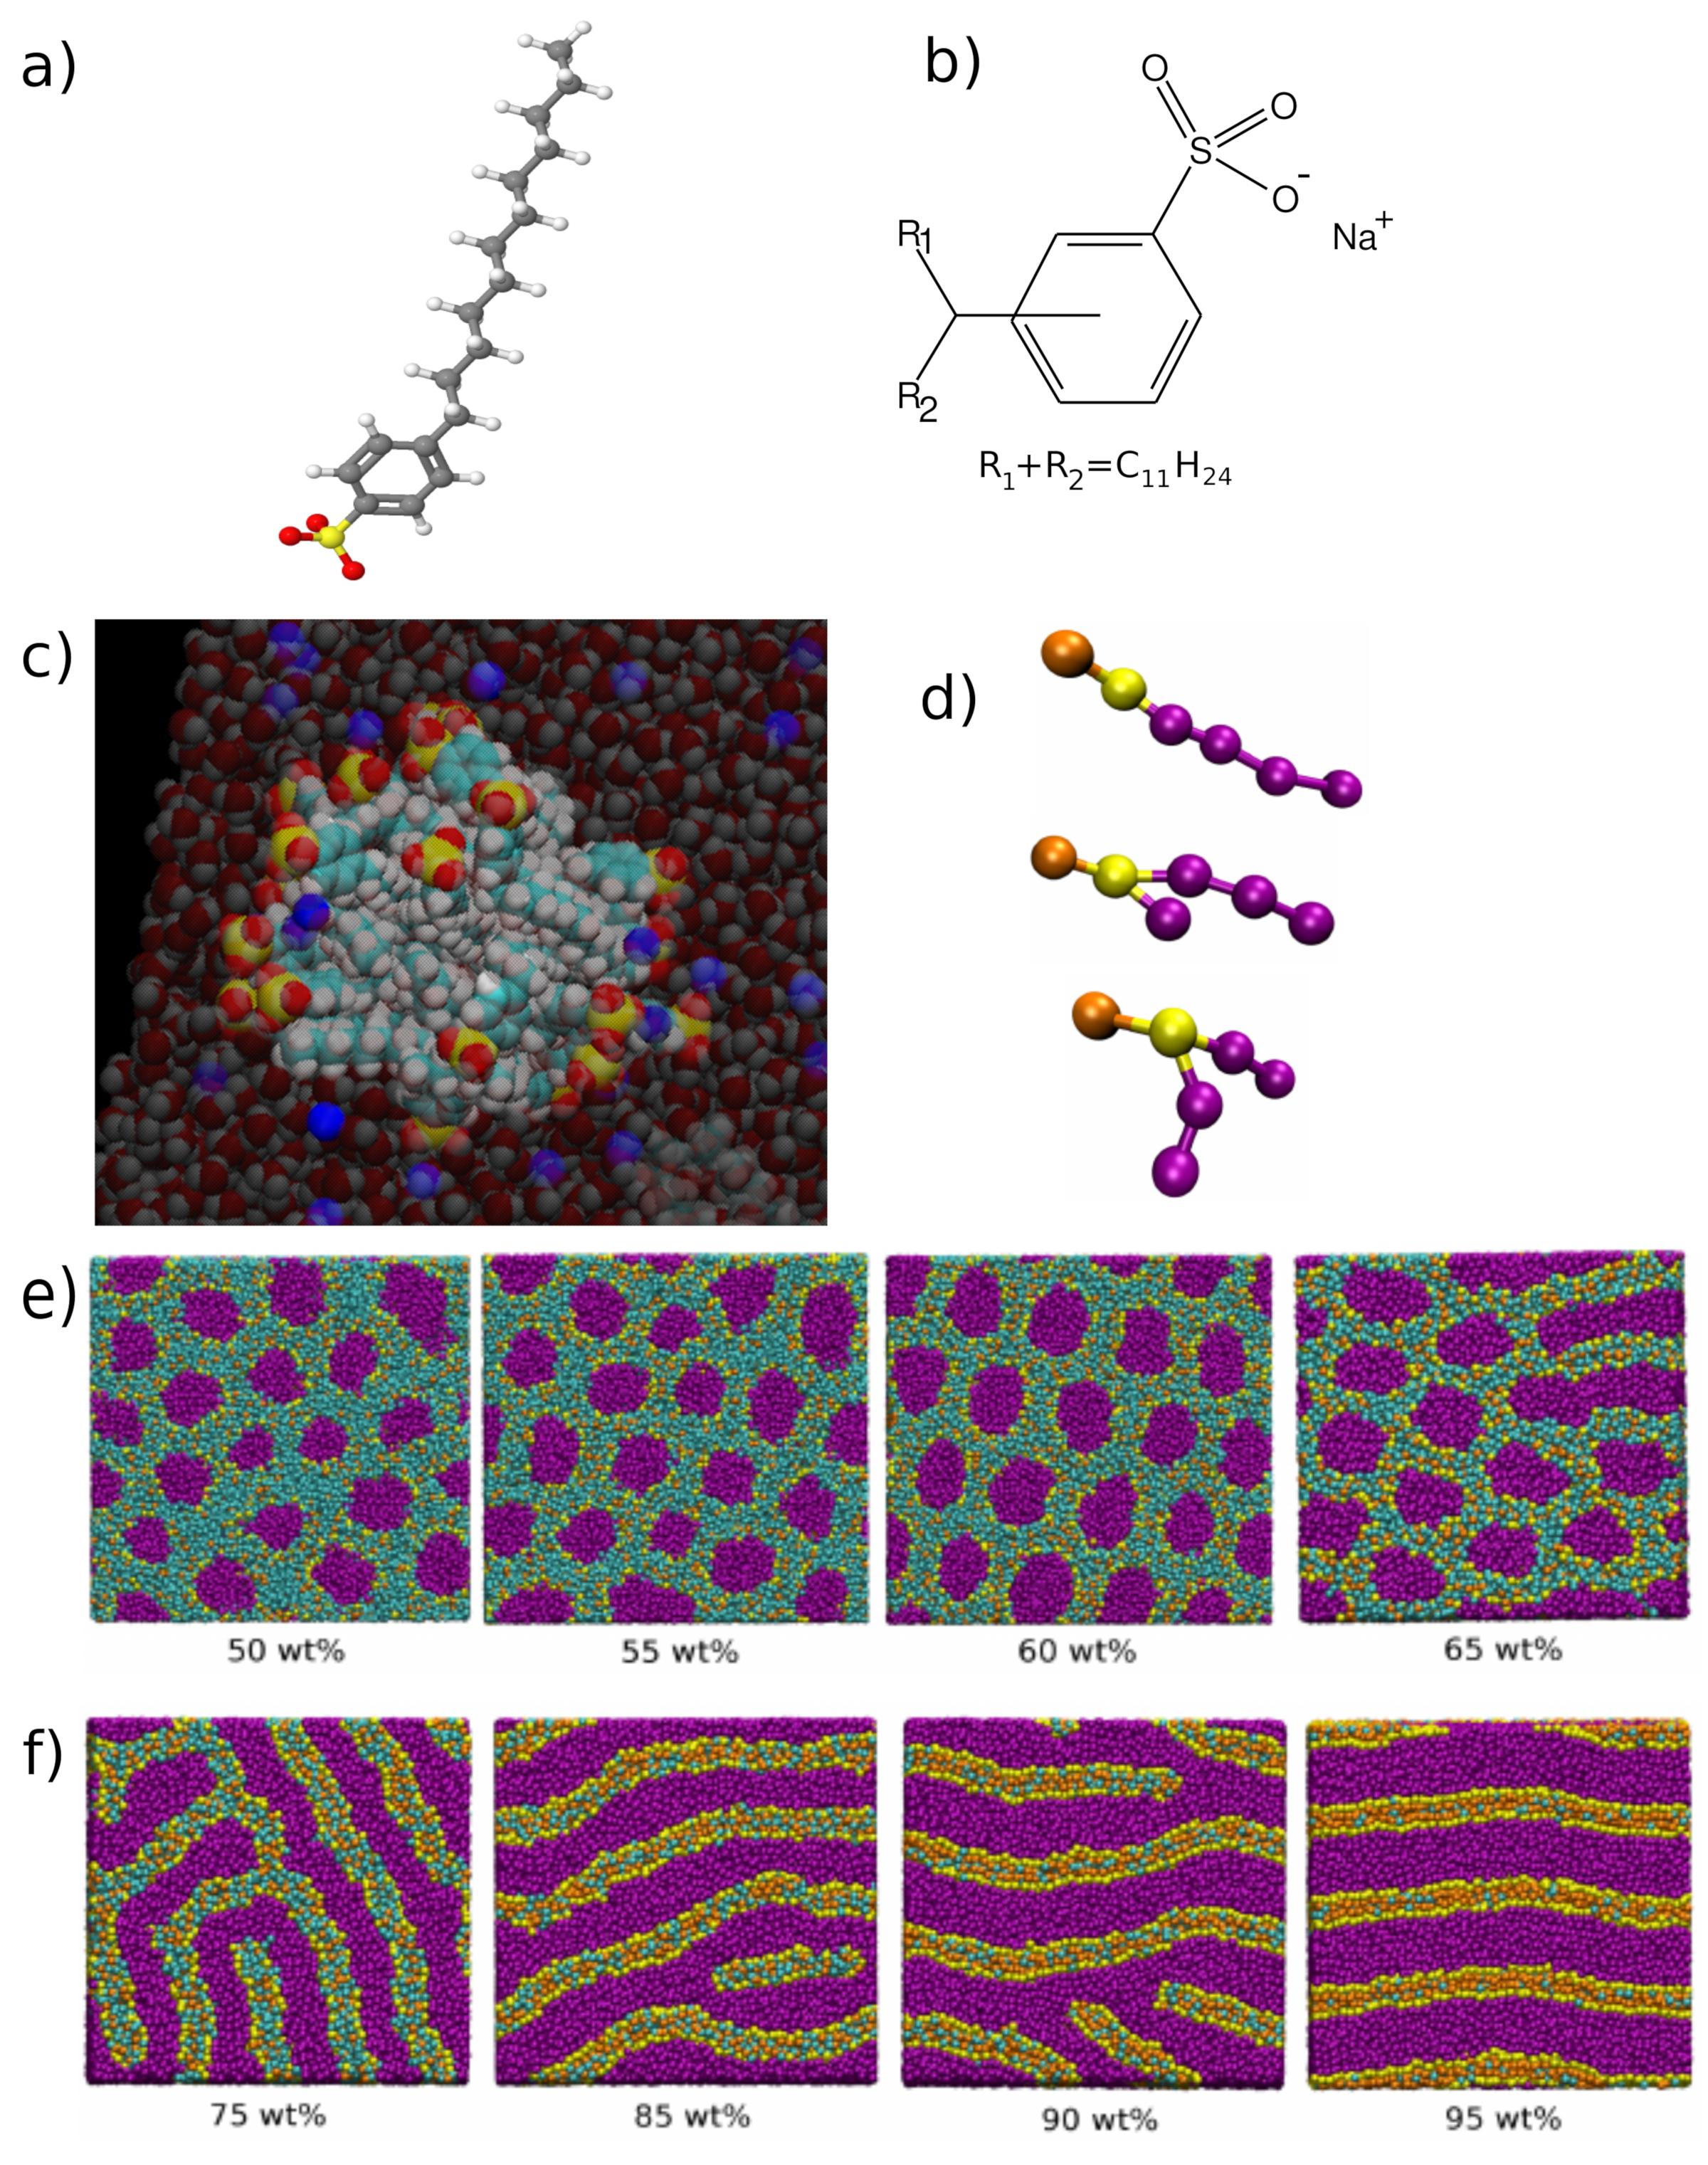
3.1. Surfactant Models, Micelles, and the Formation of Lyotropic Phases
3.2. Models for Chromonic Liquid Crystals

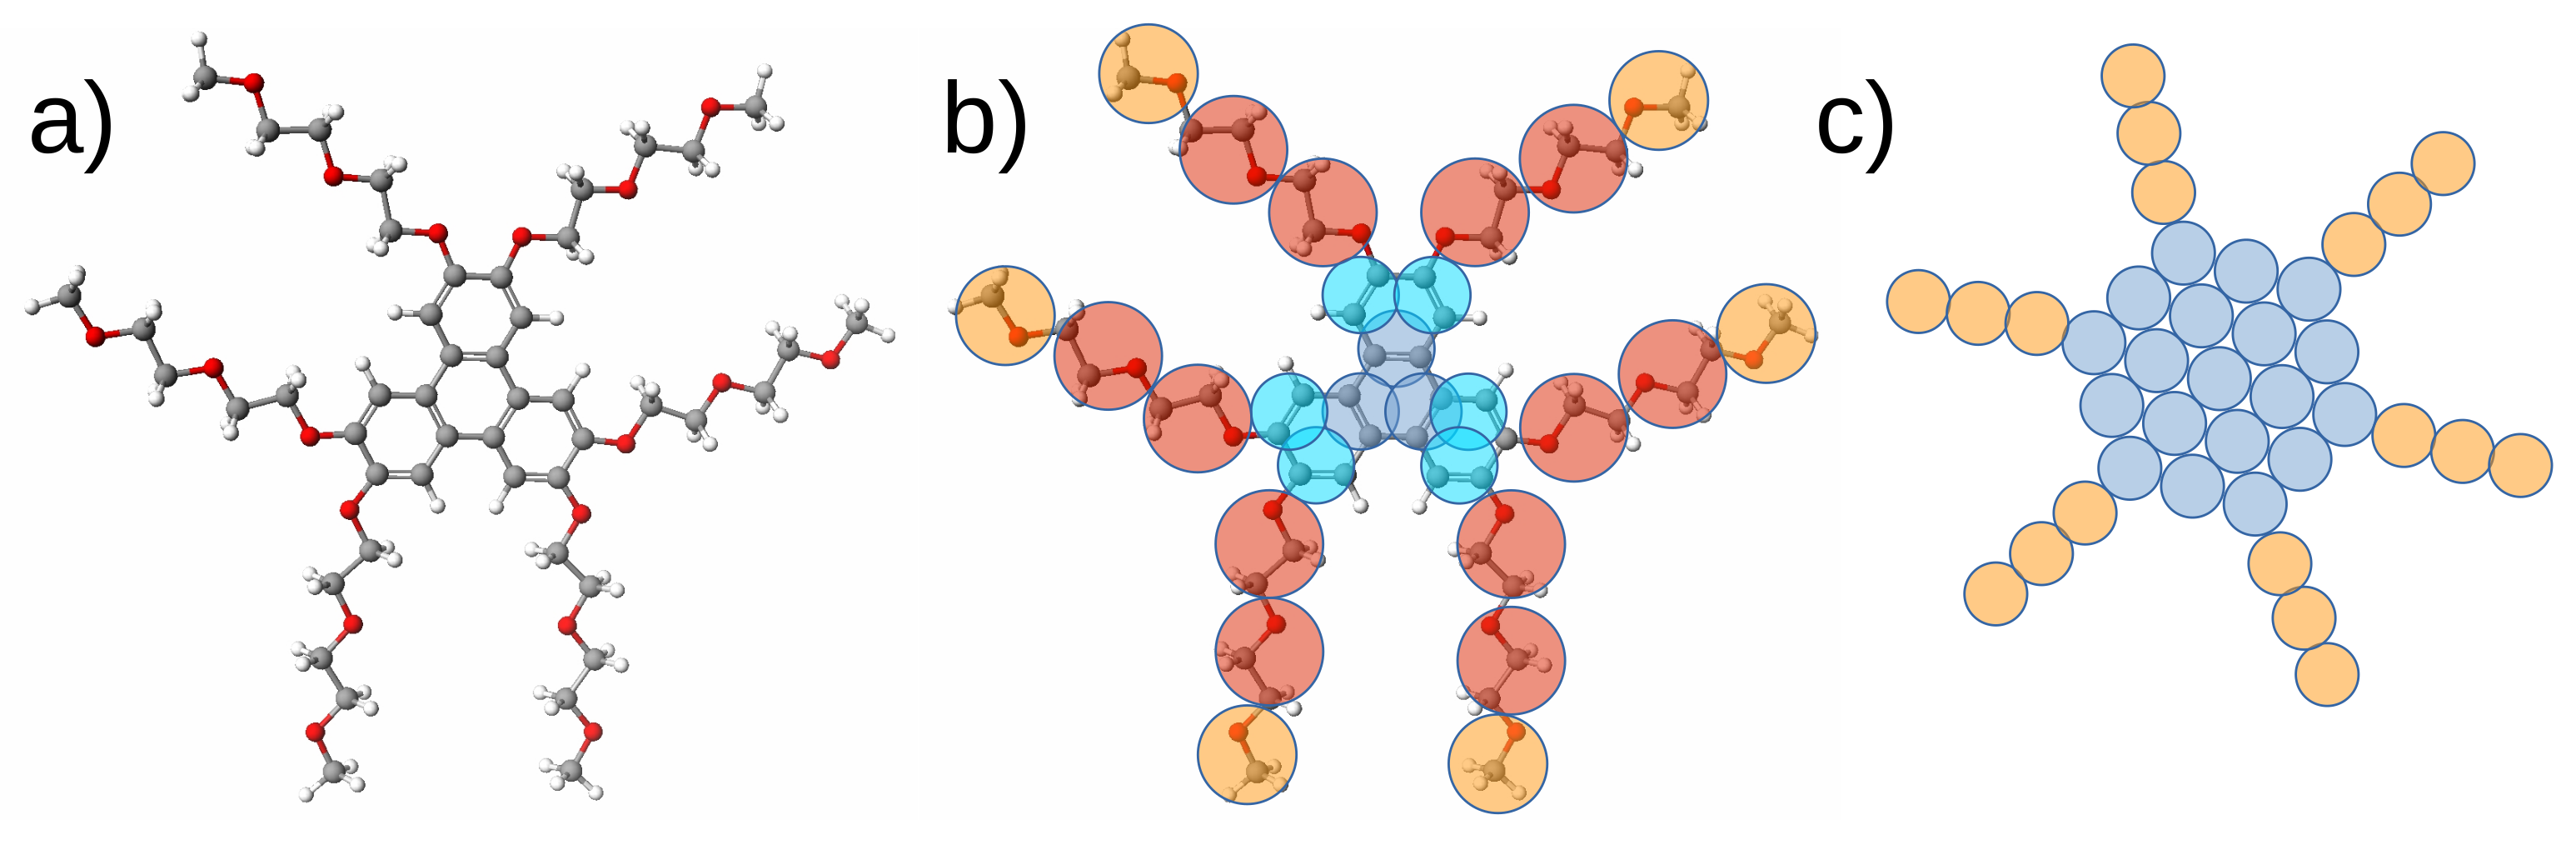
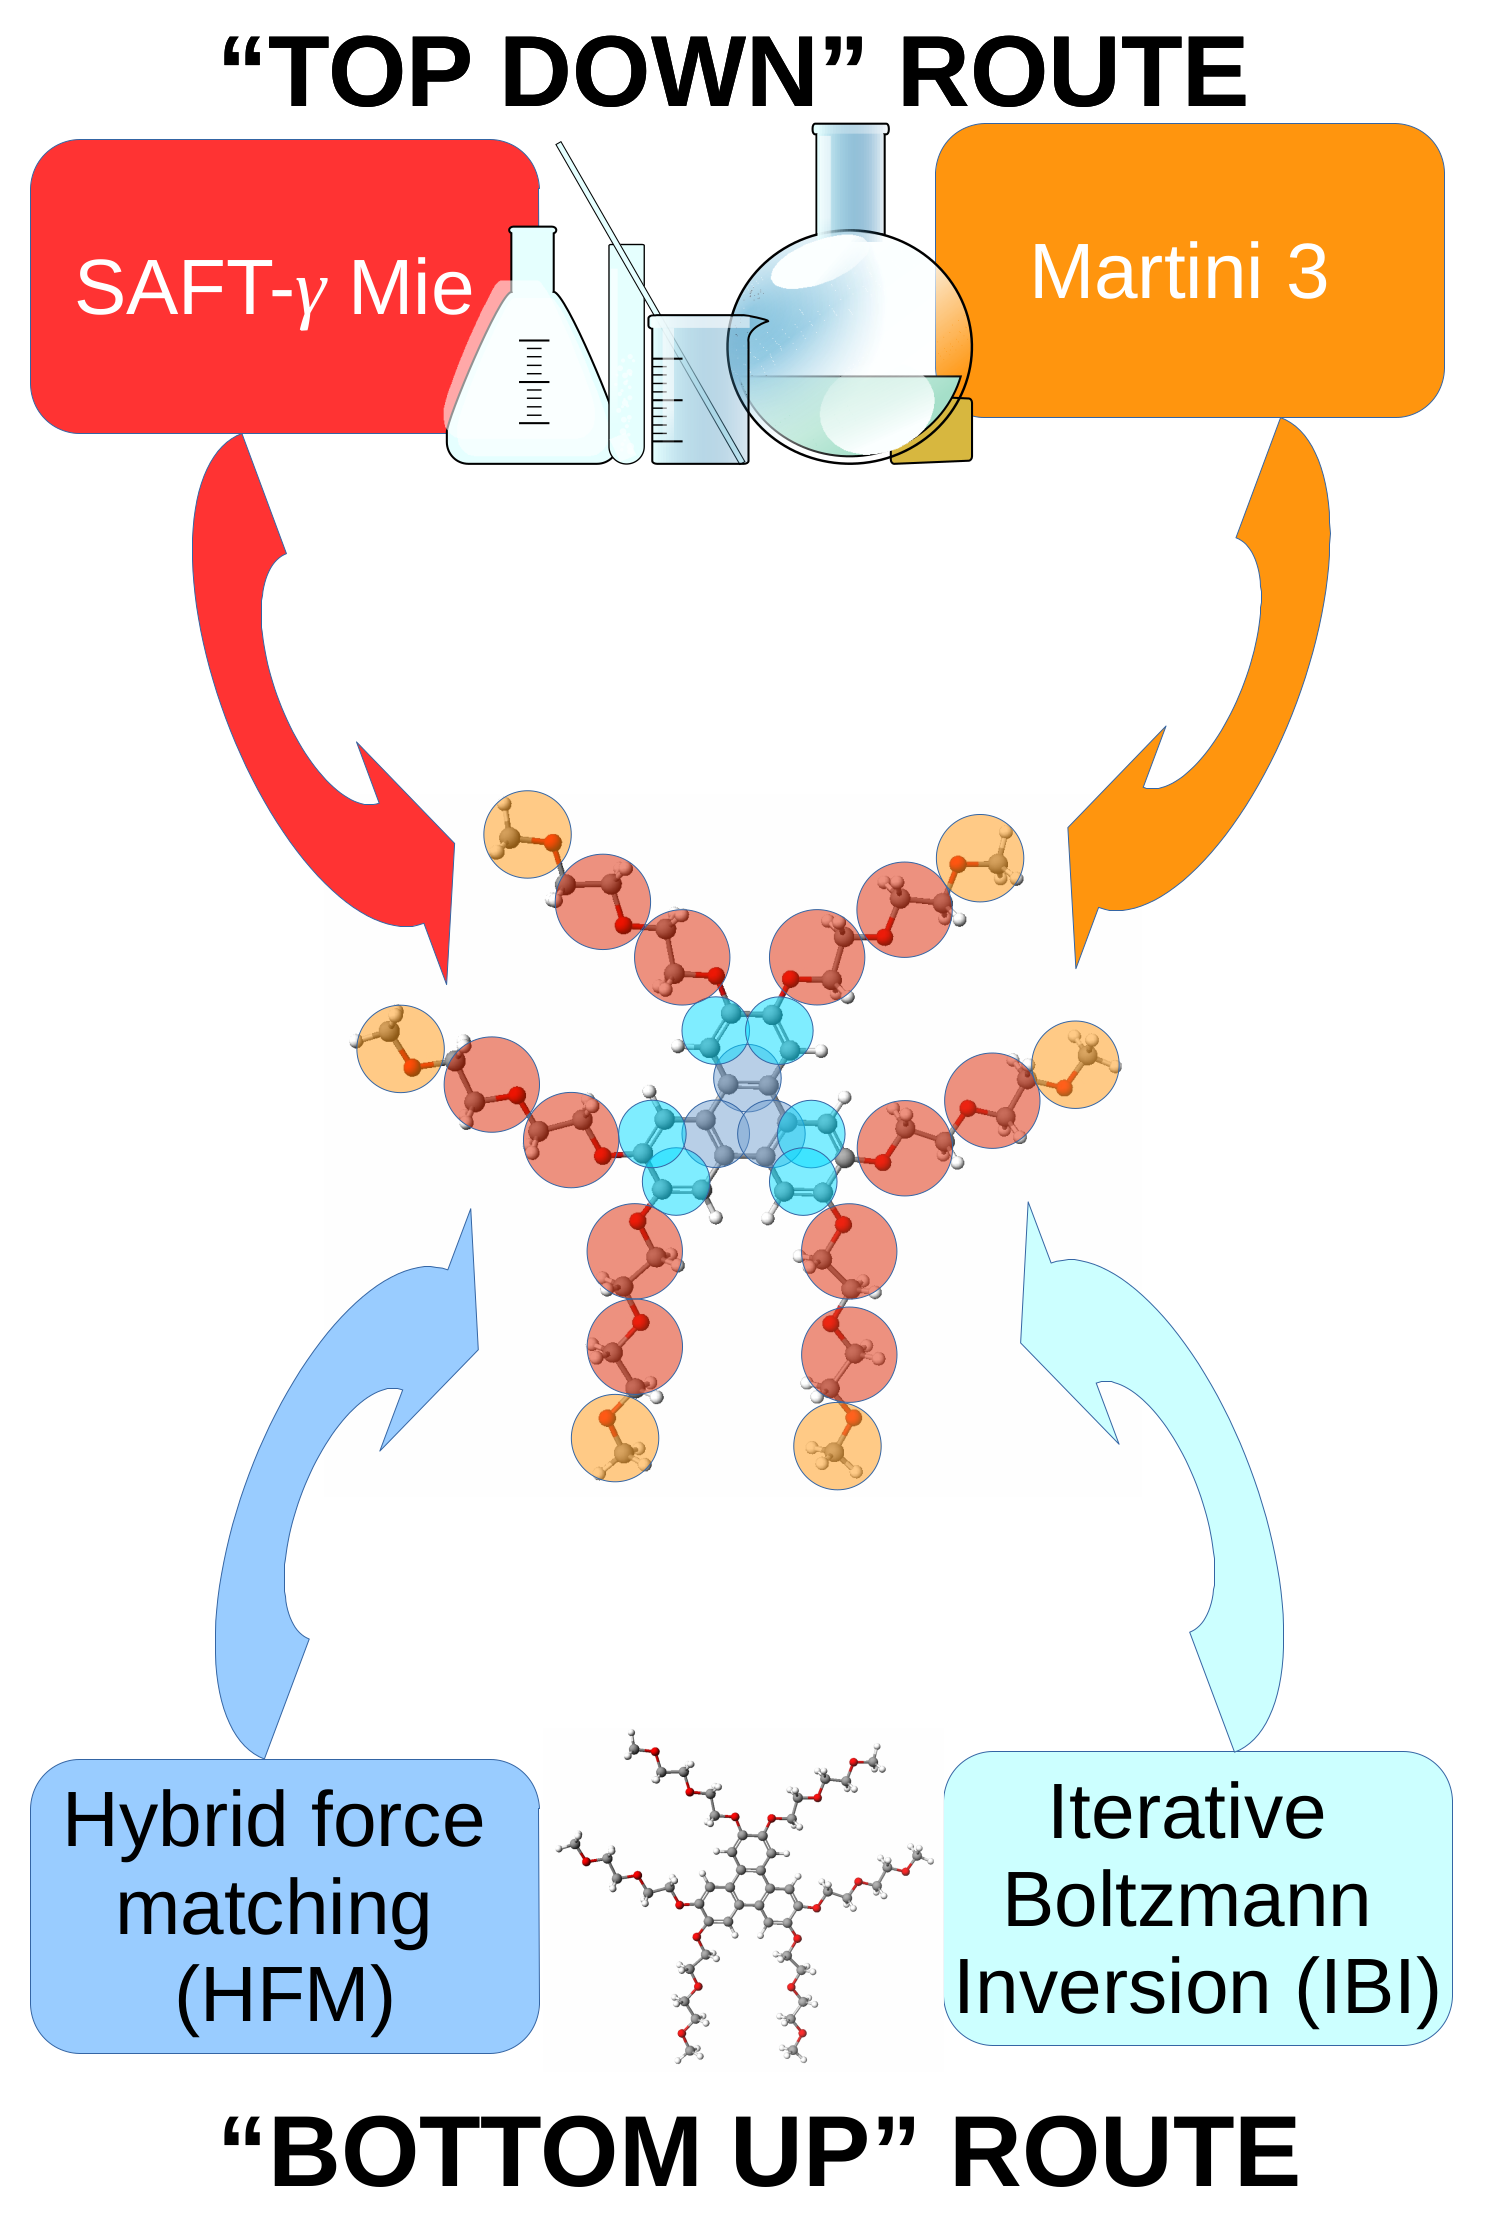
3.3. Studies of Nonionic Chromonics
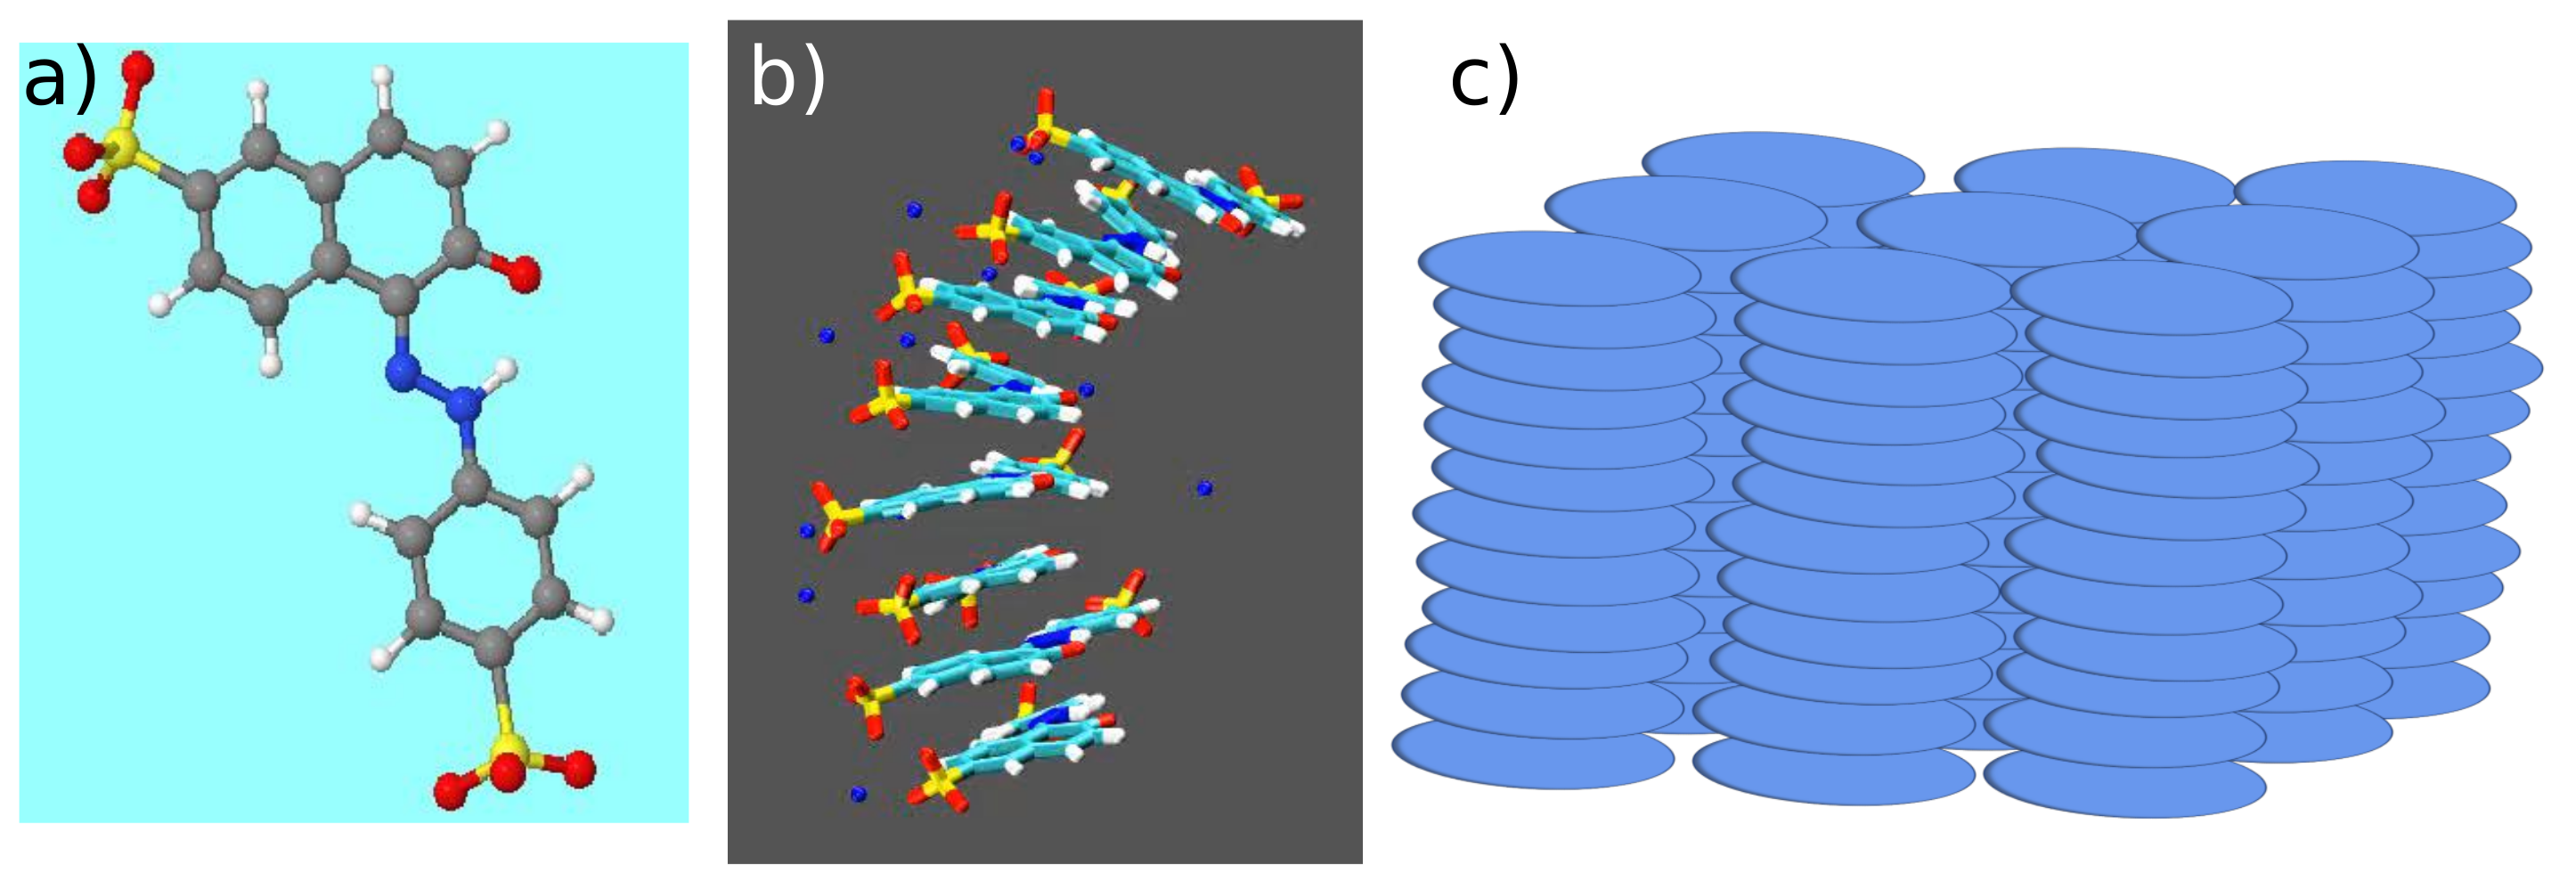
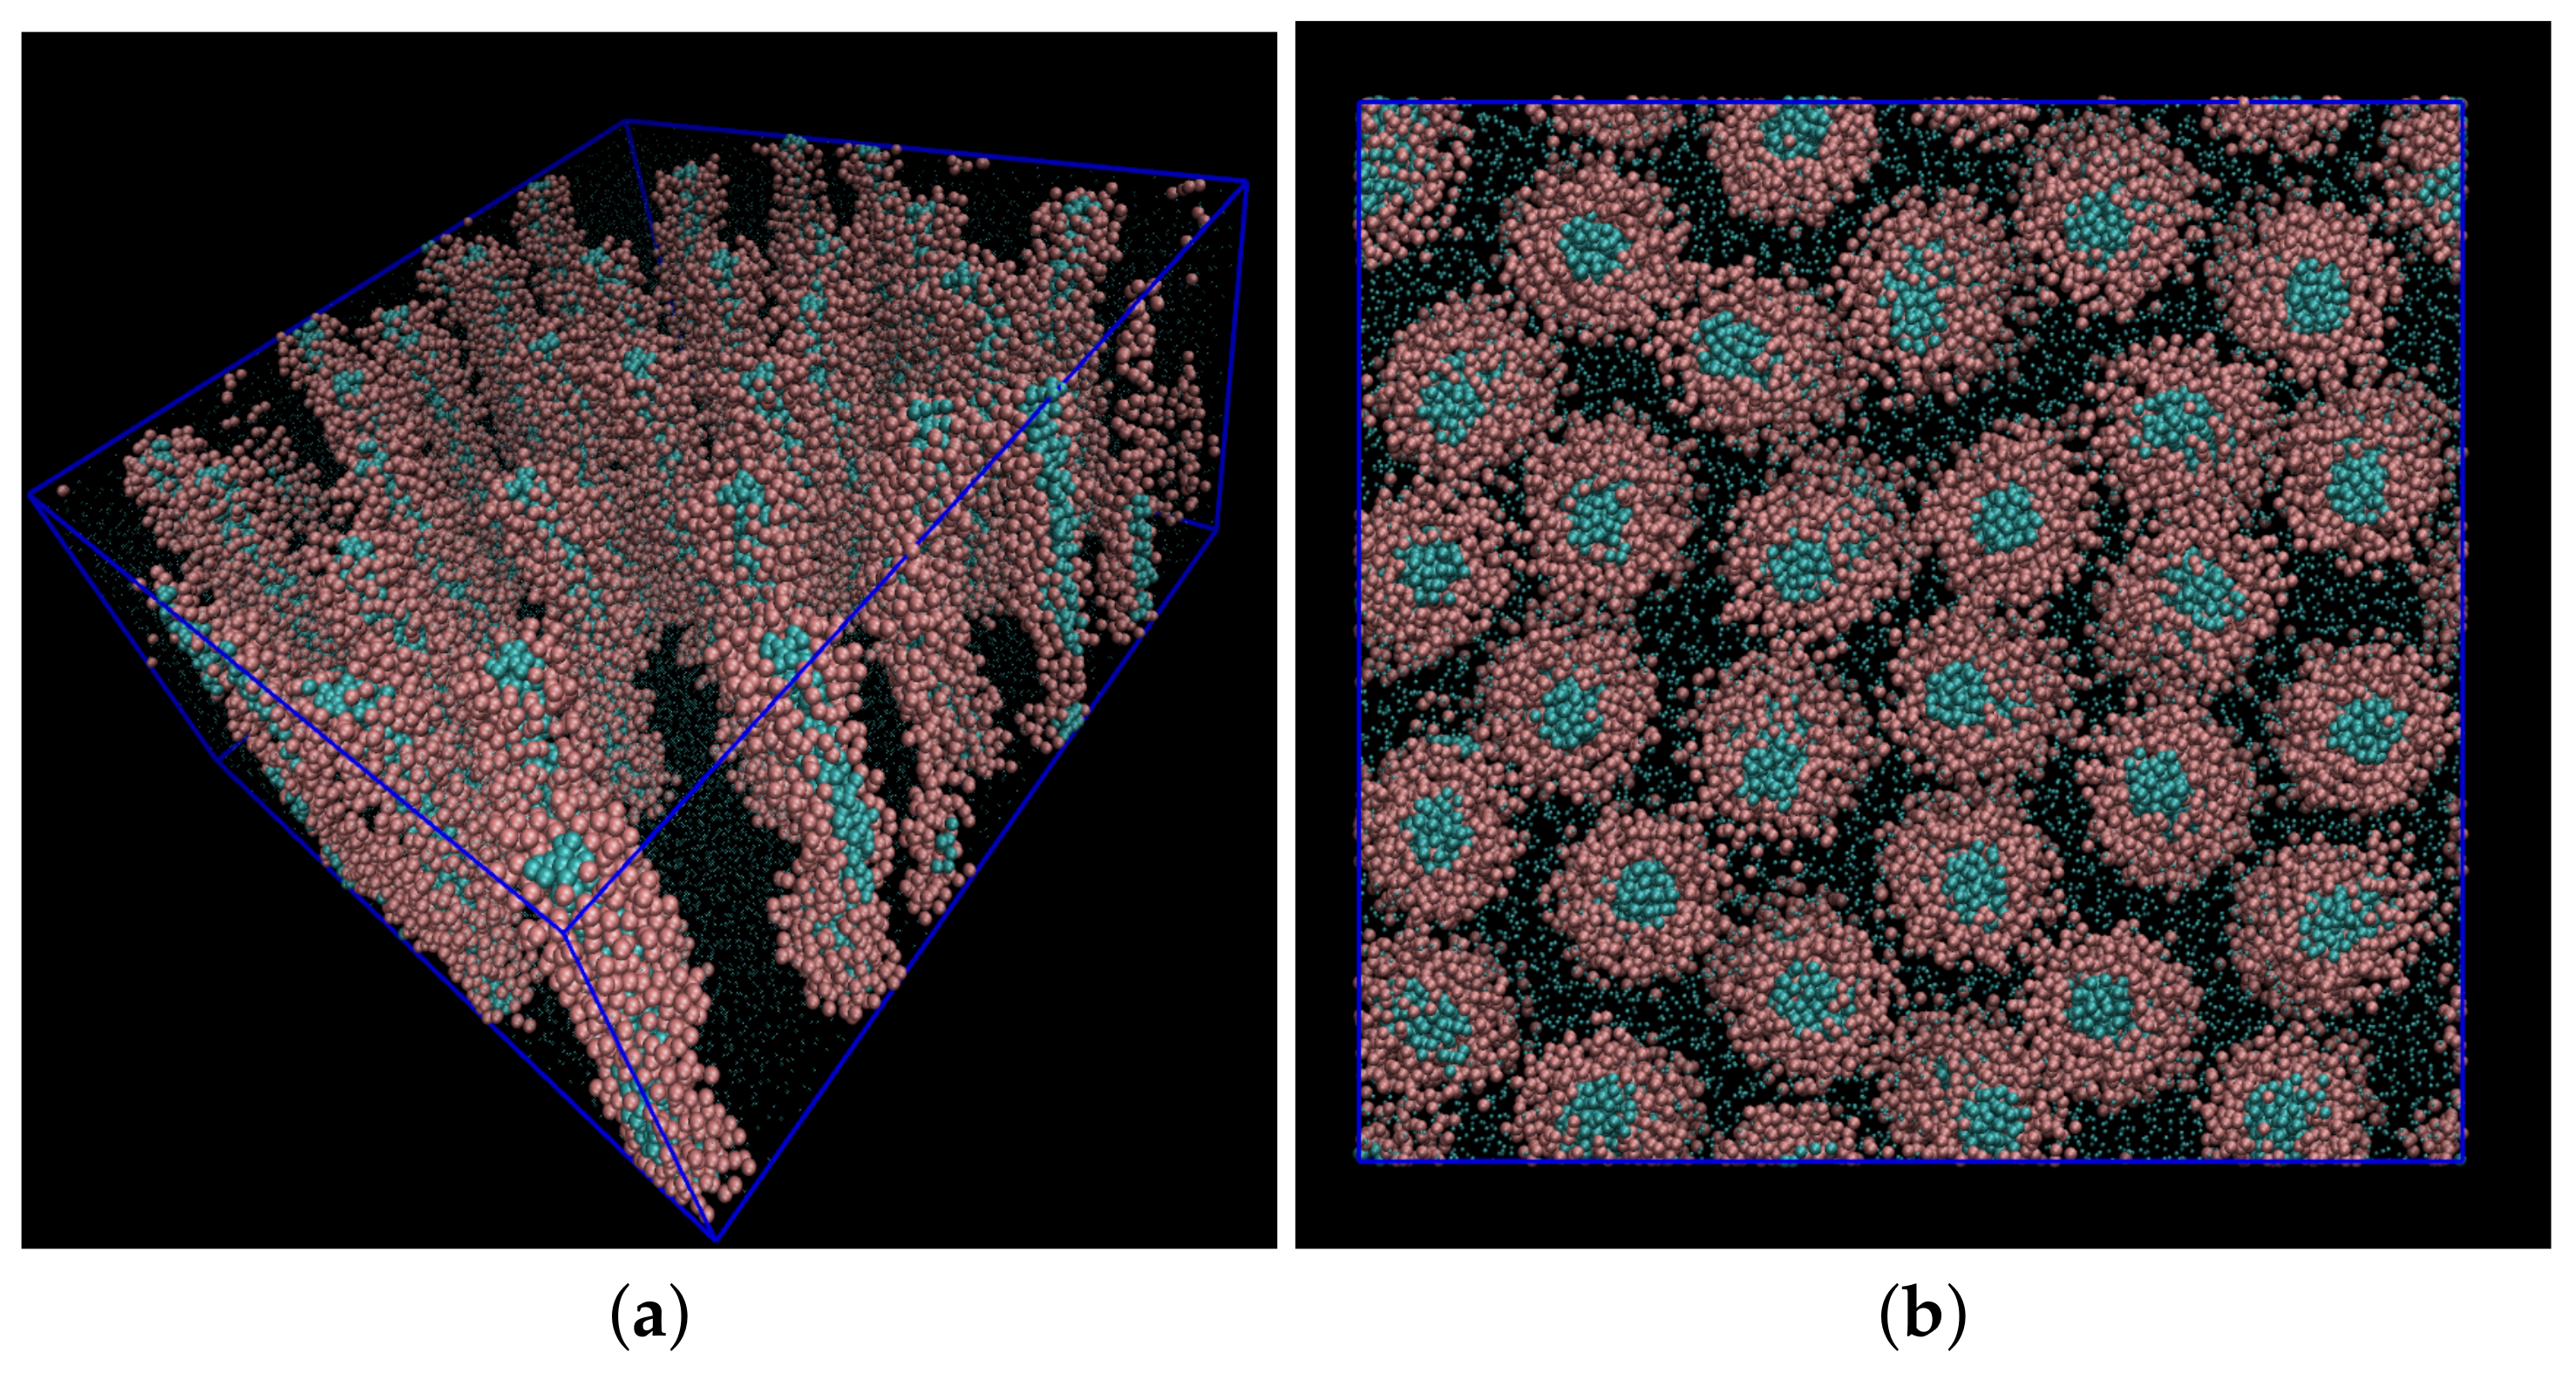
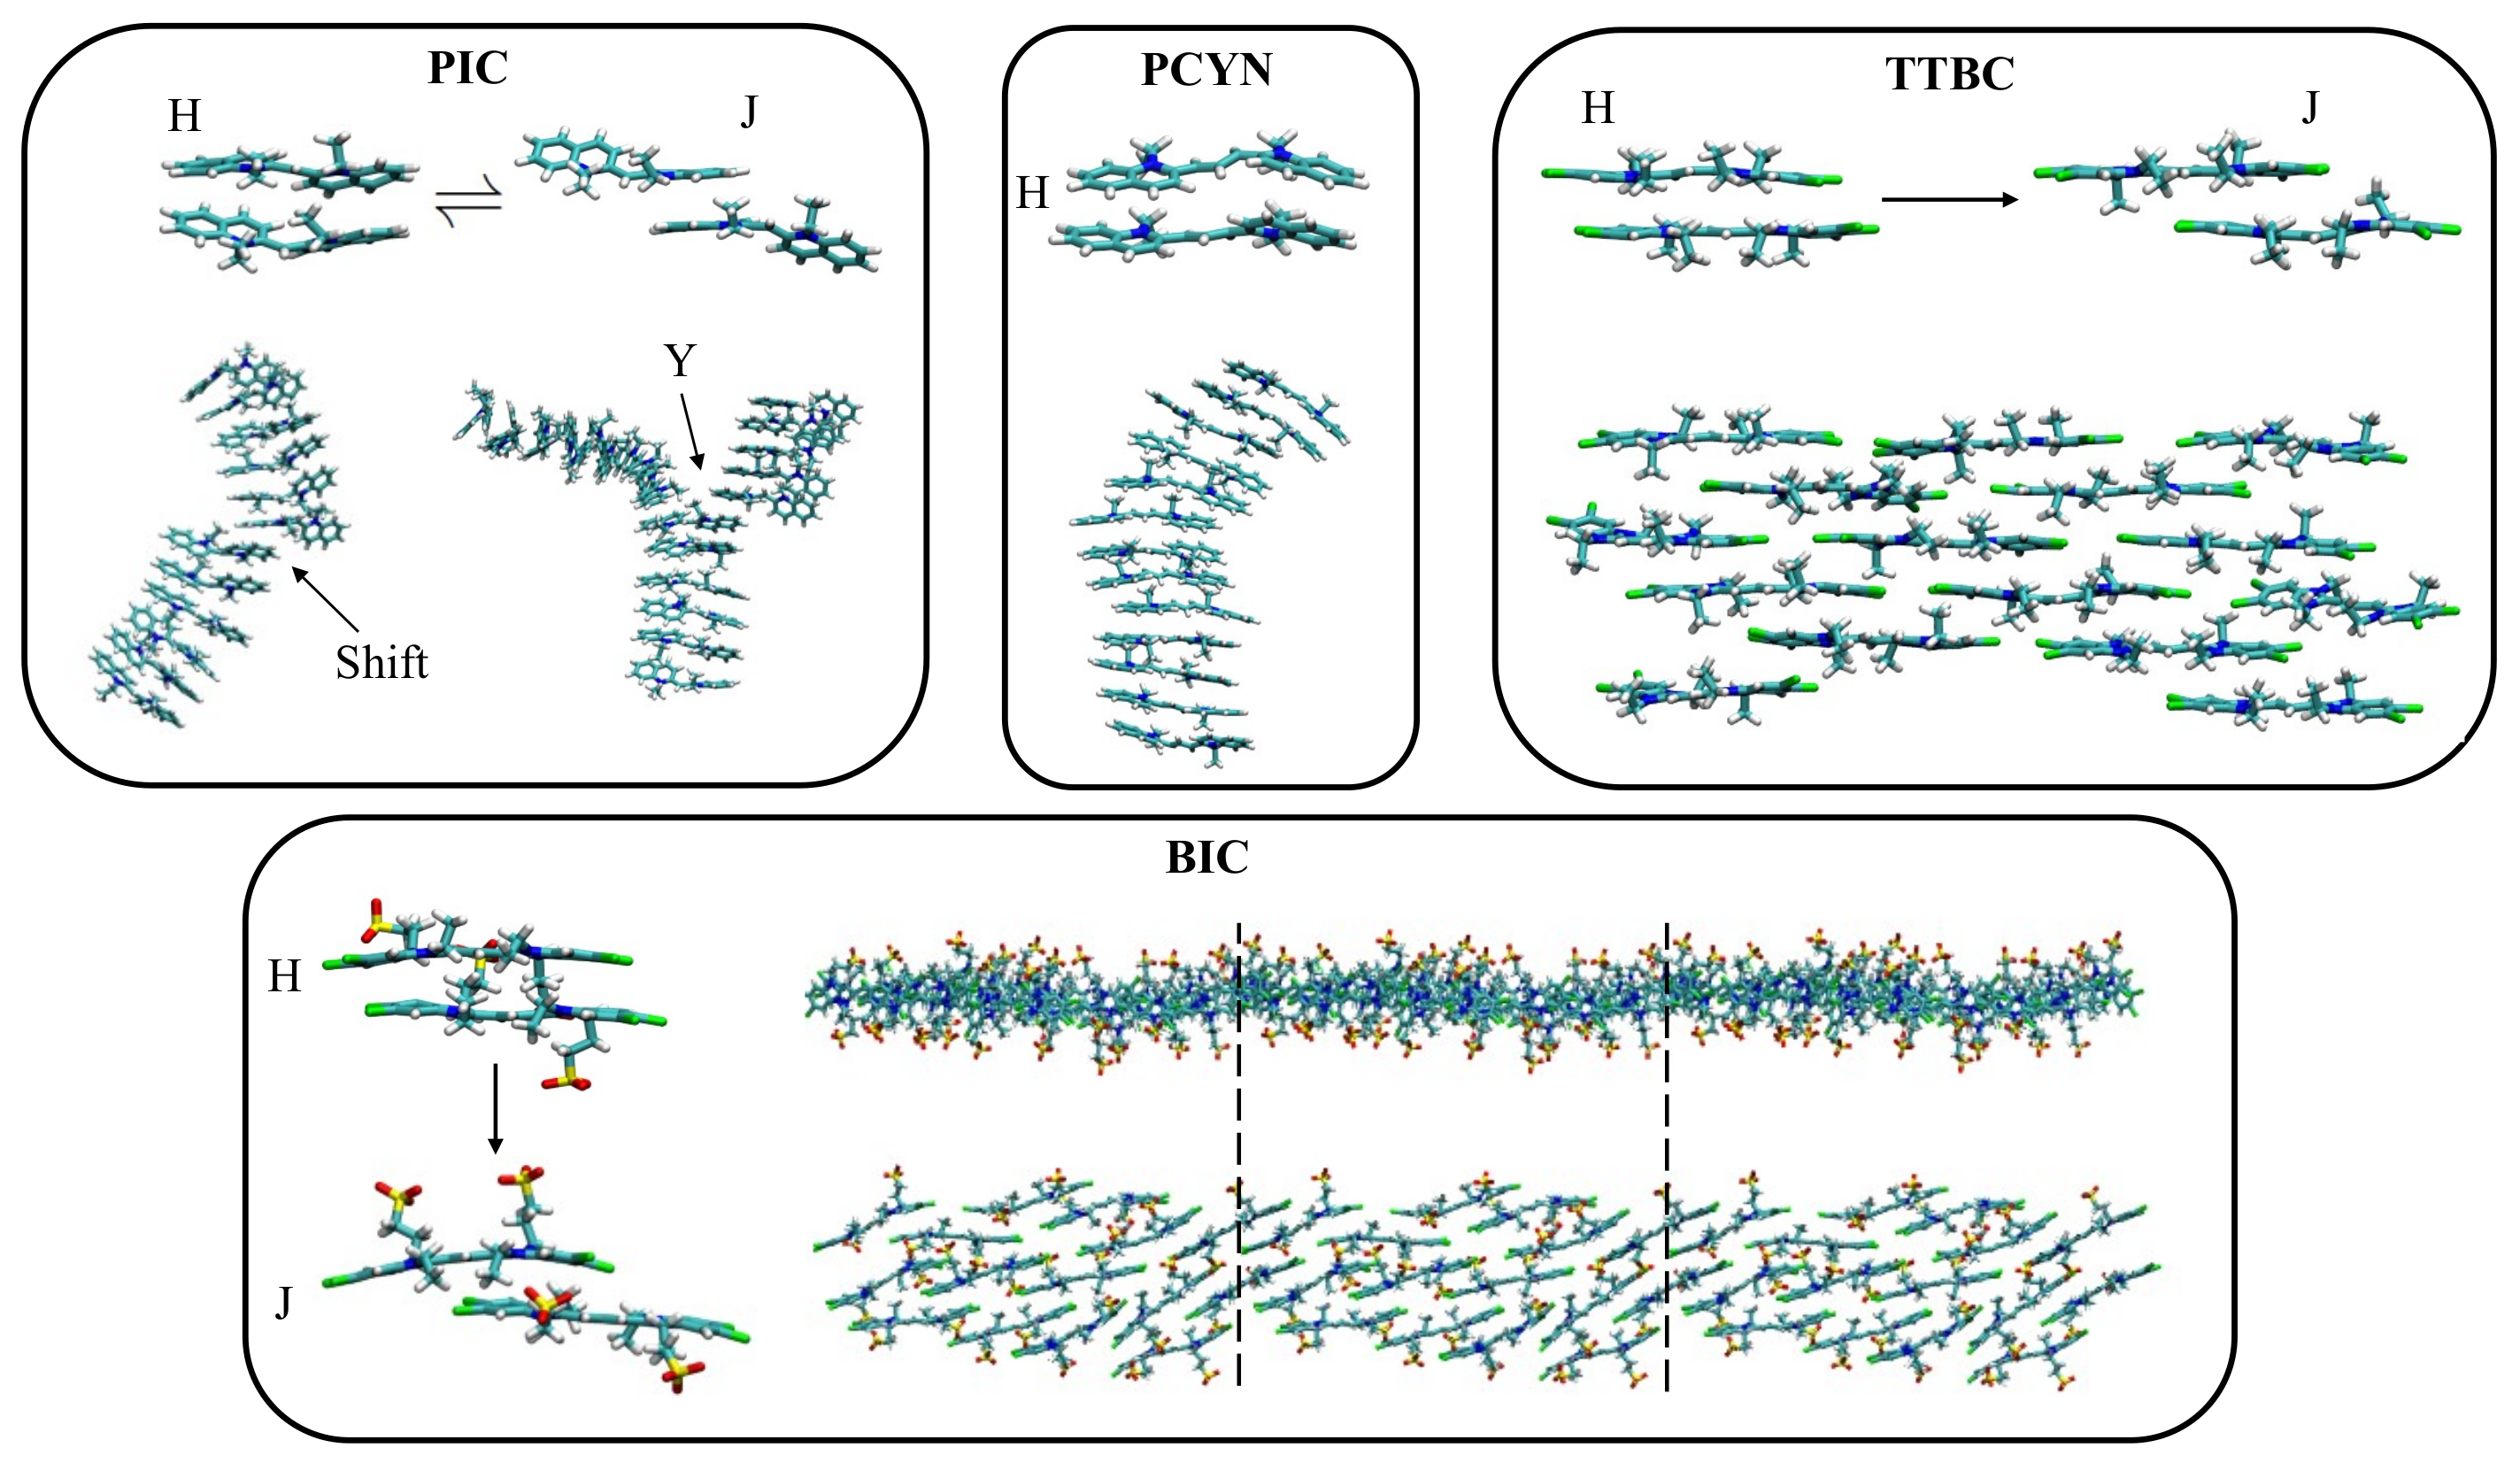
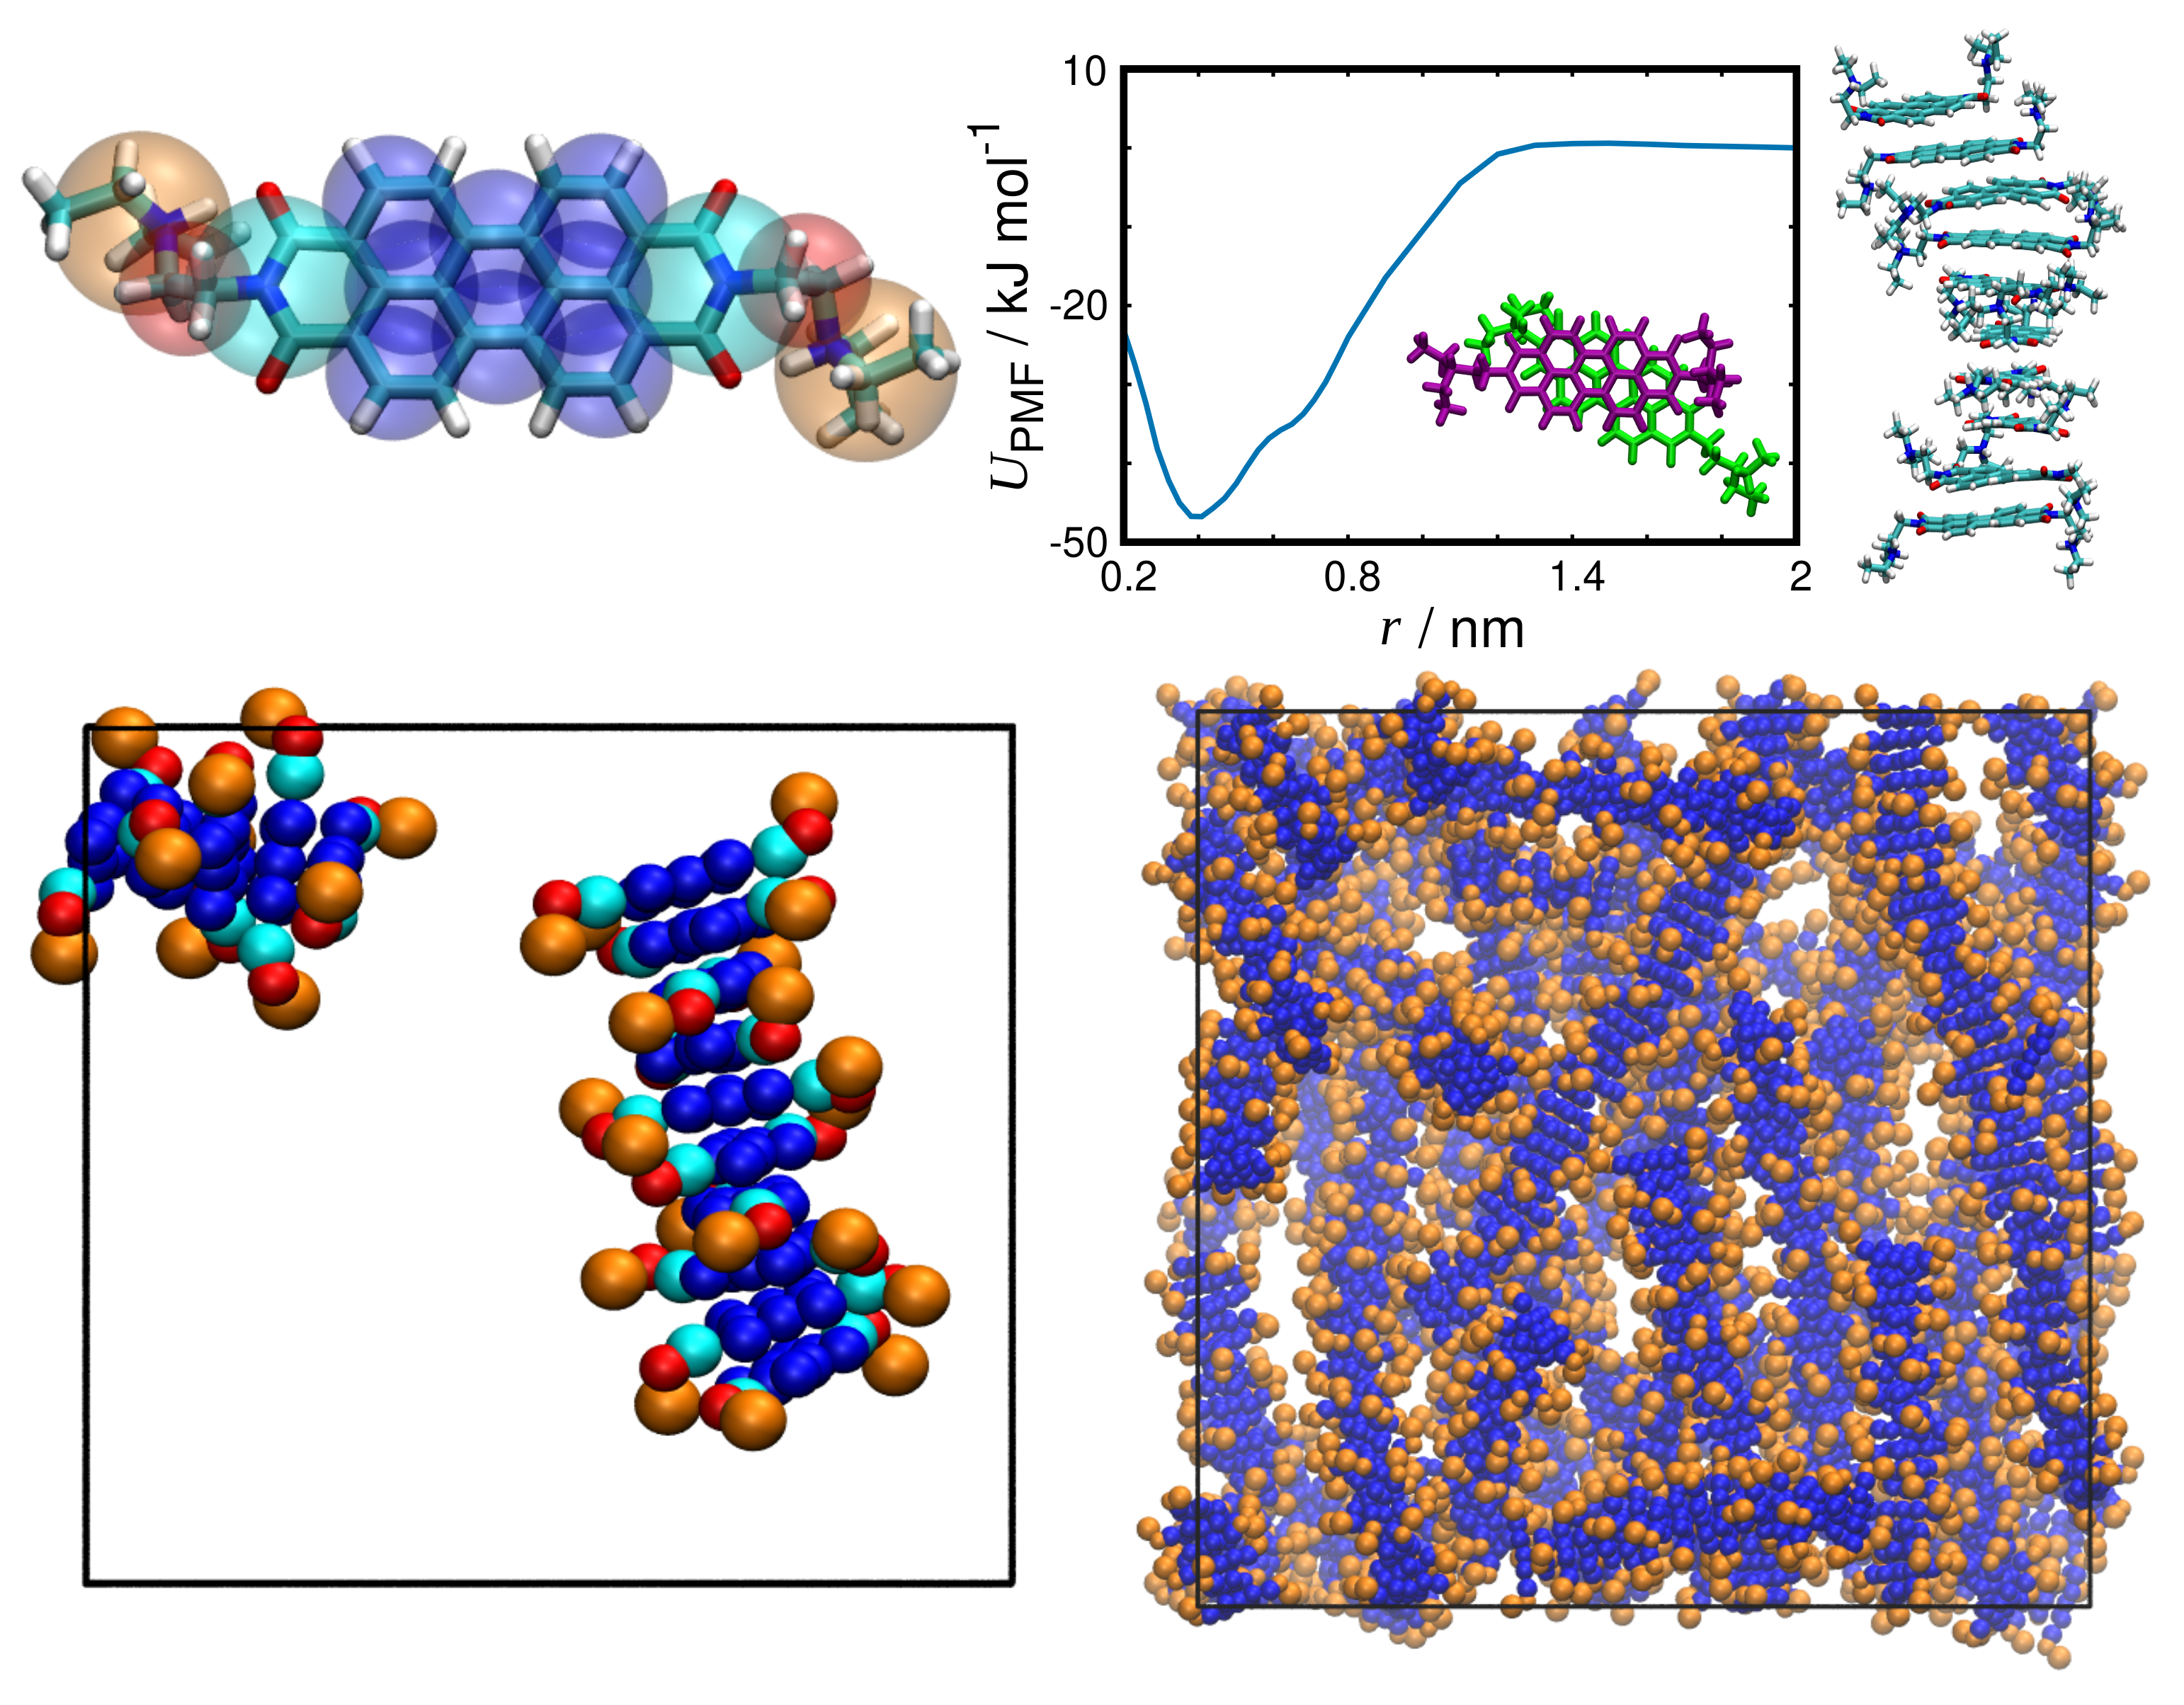
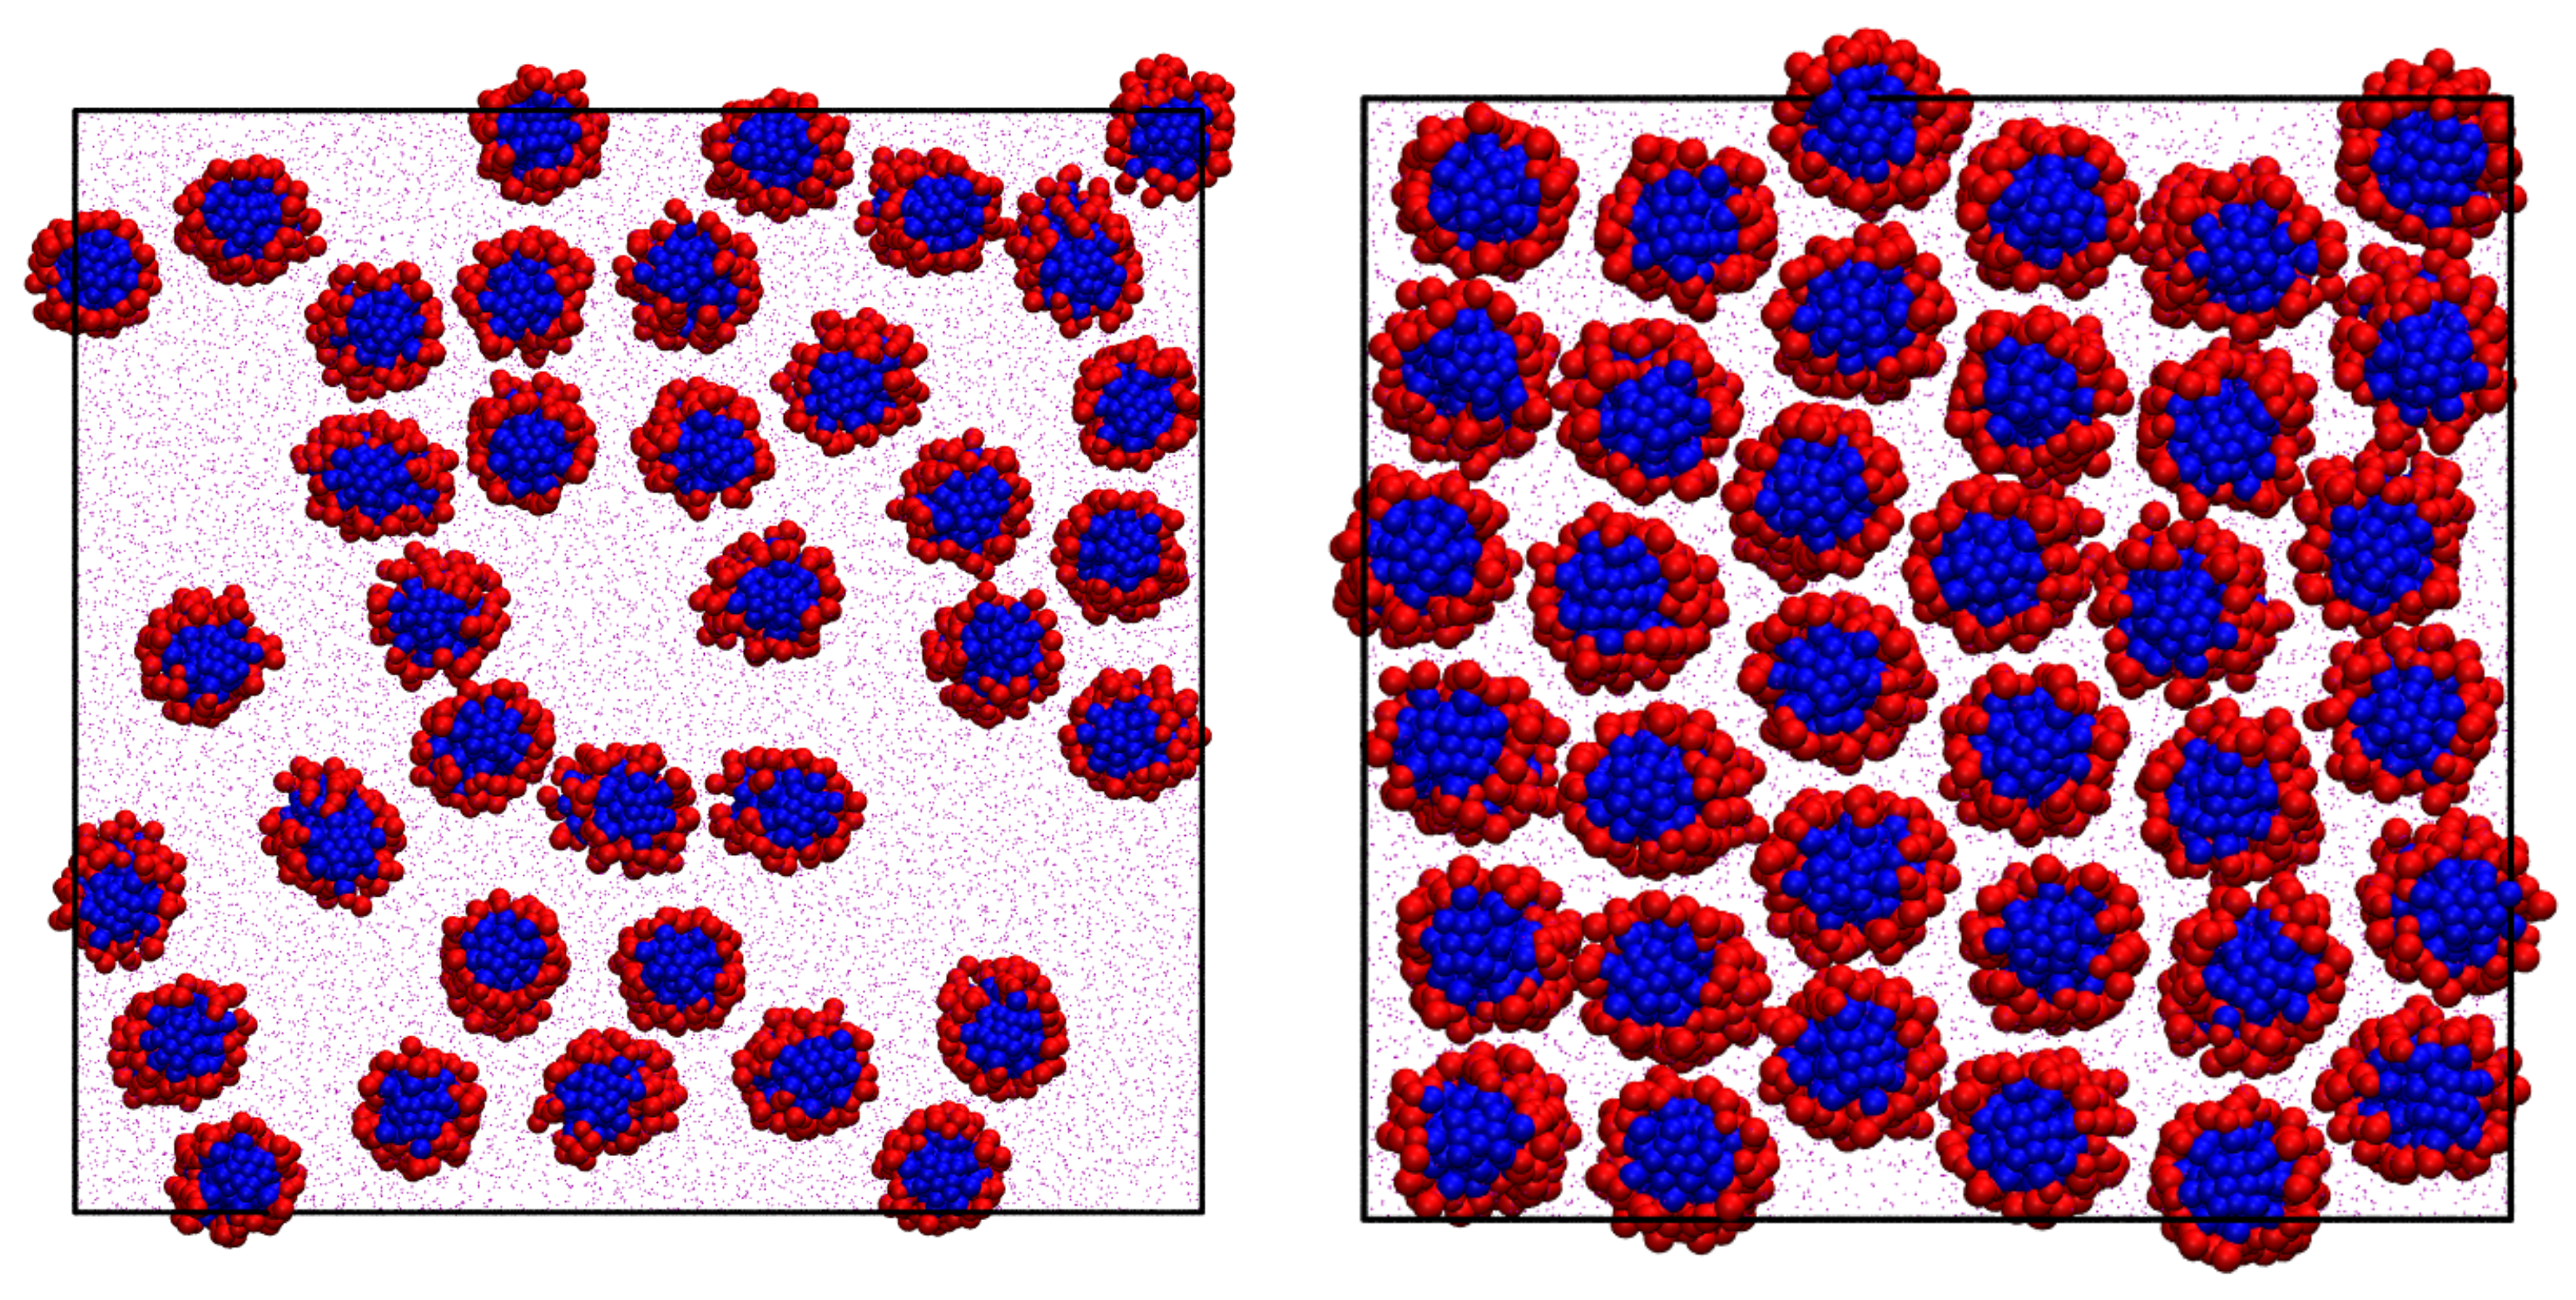
3.4. Ionic Chromonics: A Rich Variety of Aggregation Motifs
4. Conclusions
Author Contributions
Funding
Data Availability Statement
Acknowledgments
Conflicts of Interest
References
- Güryel, S.; Walker, M.; Geerlings, P.; De Proft, F.; Wilson, M.R. Molecular dynamics simulations of the structure and the morphology of graphene/polymer nanocomposites. Phys. Chem. Chem. Phys. 2017, 19, 12959–12969. [Google Scholar] [CrossRef] [PubMed] [Green Version]
- Tasche, J.; Sabattié, E.F.D.; Thompson, R.L.; Campana, M.; Wilson, M.R. Oligomer/Polymer Blend Phase Diagram and Surface Concentration Profiles for Squalane/Polybutadiene: Experimental Measurements and Predictions from SAFT-γ Mie and Molecular Dynamics Simulations. Macromolecules 2020, 53, 2299–2309. [Google Scholar] [CrossRef] [PubMed]
- Rodgers, T.L.; Townsend, P.D.; Burnell, D.; Jones, M.L.; Richards, S.A.; McLeish, T.C.B.; Pohl, E.; Wilson, M.R.; Cann, M.J. Modulation of Global Low-Frequency Motions Underlies Allosteric Regulation: Demonstration in CRP/FNR Family Transcription Factors. PLoS Biol. 2013, 11, e1001651. [Google Scholar] [CrossRef] [PubMed] [Green Version]
- McLeish, T.C.B.; Rodgers, T.L.; Wilson, M.R. Allostery without conformation change: Modelling protein dynamics at multiple scales. Phys. Biol. 2013, 10, 056004. [Google Scholar] [CrossRef] [Green Version]
- Marrink, S.J.; de Vries, A.H.; Tieleman, D.P. Lipids on the move: Simulations of membrane pores, domains, stalks and curves. Biochim. Biophys. Acta (BBA)-Biomembr. 2009, 1788, 149–168. [Google Scholar] [CrossRef] [Green Version]
- Catte, A.; White, G.F.; Wilson, M.R.; Oganesyan, V.S. Direct Prediction of EPR Spectra from Lipid Bilayers: Understanding Structure and Dynamics in Biological Membranes. ChemPhysChem 2018, 19, 2183–2193. [Google Scholar] [CrossRef] [Green Version]
- Catte, A.; Wilson, M.R.; Walker, M.; Oganesyan, V.S. Antimicrobial action of the cationic peptide, chrysophsin-3: A coarse-grained molecular dynamics study. Soft Matter 2018, 14, 2796–2807. [Google Scholar] [CrossRef] [Green Version]
- Yu, G.; Wilson, M.R. Molecular simulation studies of self-assembly for a chromonic perylene dye: All-atom studies and new approaches to coarse-graining. J. Mol. Liq. 2022, 345, 118210. [Google Scholar] [CrossRef]
- Prasitnok, K.; Wilson, M.R. A coarse-grained model for polyethylene glycol in bulk water and at a water/air interface. Phys. Chem. Chem. Phys. 2013, 15, 17093–17104. [Google Scholar] [CrossRef] [Green Version]
- Anderson, P.M.; Wilson, M.R. Molecular dynamics simulations of amphiphilic graft copolymer molecules at a water/air interface. J. Chem. Phys. 2004, 121, 8503–8510. [Google Scholar] [CrossRef]
- Allen, M.P. Molecular simulation of liquid crystals. Mol. Phys. 2019, 117, 2391–2417. [Google Scholar] [CrossRef] [Green Version]
- Wilson, M.R. Progress in computer simulations of liquid crystals. Int. Rev. Phys. Chem. 2005, 24, 421–455. [Google Scholar] [CrossRef]
- Wilson, M.R. Molecular simulation of liquid crystals: Progress towards a better understanding of bulk structure and the prediction of material properties. Chem. Soc. Rev. 2007, 36, 1881–1888. [Google Scholar] [CrossRef] [PubMed] [Green Version]
- Care, C.M.; Cleaver, D.J. Computer simulation of liquid crystals. Rep. Prog. Phys. 2005, 68, 2665–2700. [Google Scholar] [CrossRef]
- Bremer, M.; Kirsch, P.; Klasen-Memmer, M.; Tarumi, K. The TV in Your Pocket: Development of Liquid-Crystal Materials for the New Millennium. Angew. Chem. Int. Ed. 2013, 52, 8880–8896. [Google Scholar] [CrossRef]
- Cheung, D.L.; Clark, S.J.; Wilson, M.R. Calculation of the rotational viscosity of a nematic liquid crystal. Chem. Phys. Lett. 2002, 356, 140–146. [Google Scholar] [CrossRef]
- Cheung, D.L.; Clark, S.J.; Wilson, M.R. Calculation of flexoelectric coefficients for a nematic liquid crystal by atomistic simulation. J. Chem. Phys. 2004, 121, 9131–9139. [Google Scholar] [CrossRef] [Green Version]
- Berardi, R.; Lintuvuori, J.S.; Wilson, M.R.; Zannoni, C. Phase diagram of the uniaxial and biaxial soft–core Gay–Berne model. J. Chem. Phys. 2011, 135, 134119. [Google Scholar] [CrossRef] [Green Version]
- Allen, M.P.; Warren, M.A.; Wilson, M.R. Molecular-dynamics simulation of the smectic-A* twist grain- boundary phase. Phys. Rev. E 1998, 57, 5585–5596. [Google Scholar] [CrossRef] [Green Version]
- Lyulin, A.; Al-Barwani, M.; Allen, M.; Wilson, M.; Neelov, I.; Allsopp, N. Molecular dynamics simulation of main chain liquid crystalline polymers. Macromolecules 1998, 31, 4626–4634. [Google Scholar] [CrossRef]
- Al Sunaidi, A.; Den Otter, W.K.; Clarke, J.H.R. Liquid-crystalline ordering in rod-coil diblock copolymers studied by mesoscale simulations. Philos. Trans. R. Soc. Lond. A 2004, 362, 1773–1781. [Google Scholar] [CrossRef] [PubMed]
- Stimson, L.M.; Wilson, M.R. Molecular dynamics simulations of side chain liquid crystal polymer molecules in isotropic and liquid-crystalline melts. J. Chem. Phys. 2005, 123, 034908. [Google Scholar] [CrossRef] [PubMed] [Green Version]
- Lintuvuori, J.S.; Wilson, M.R. A coarse-grained simulation study of mesophase formation in a series of rod-coil multiblock copolymers. Phys. Chem. Chem. Phys. 2009, 11, 2116–2125. [Google Scholar] [CrossRef] [PubMed]
- Walton, J.; Mottram, N.; McKay, G. Nematic liquid crystal director structures in rectangular regions. Phys. Rev. E 2018, 97, 022702. [Google Scholar] [CrossRef] [PubMed] [Green Version]
- Al-Barwani, M.S.; Allen, M.P. Isotropic-nematic interface of soft spherocylinders. Phys. Rev. E 2000, 62, 6706–6710. [Google Scholar] [CrossRef] [PubMed]
- Camp, P.J.; Mason, C.P.; Allen, M.P.; Khare, A.A.; Kofke, D.A. The isotropic-nematic phase transition in uniaxial hard ellipsoid fluids: Coexistence data and the approach to the Onsager limit. J. Chem. Phys. 1996, 105, 2837–2849. [Google Scholar] [CrossRef] [Green Version]
- McGrother, S.C.; Williamson, D.C.; Jackson, G. A re-examination of the phase diagram of hard spherocylinders. J. Chem. Phys. 1996, 104, 6755–6771. [Google Scholar] [CrossRef]
- Boyd, N.J.; Wilson, M.R. Optimization of the GAFF force field to describe liquid crystal molecules: The path to a dramatic improvement in transition temperature predictions. Phys. Chem. Chem. Phys. 2015, 17, 24851–24865. [Google Scholar] [CrossRef] [Green Version]
- Wang, J.M.; Wolf, R.M.; Caldwell, J.W.; Kollman, P.A.; Case, D.A. Development and testing of a general amber force field. J. Comp. Chem. 2004, 25, 1157–1174. [Google Scholar] [CrossRef]
- Onsager, L. The effects of shape on the interaction of colloidal particles. Ann. N. Y. Acad. Sci. 1949, 51, 627–659. [Google Scholar] [CrossRef]
- Boyd, N.J.; Wilson, M.R. Validating an optimized GAFF force field for liquid crystals: TNI predictions for bent-core mesogens and the first atomistic predictions of a dark conglomerate phase. Phys. Chem. Chem. Phys. 2018, 20, 1485–1496. [Google Scholar] [CrossRef] [PubMed] [Green Version]
- Cheung, D.L.; Clark, S.J.; Wilson, M.R. Parametrization and validation of a force field for liquid- crystal forming molecules. Phys. Rev. E 2002, 65, 051709. [Google Scholar] [CrossRef] [PubMed] [Green Version]
- Wang, J.; Hou, T. Application of Molecular Dynamics Simulations in Molecular Property Prediction. 1. Density and Heat of Vaporization. J. Chem. Theory Comp. 2011, 7, 2151–2165. [Google Scholar] [CrossRef] [PubMed] [Green Version]
- Caleman, C.; van Maaren, P.J.; Hong, M.; Hub, J.S.; Costa, L.T.; van der Spoel, D. Force Field Benchmark of Organic Liquids: Density, Enthalpy of Vaporization, Heat Capacities, Surface Tension, Isothermal Compressibility, Volumetric Expansion Coefficient, and Dielectric Constant. J. Chem. Theory Comp. 2012, 8, 61–74. [Google Scholar] [CrossRef] [PubMed]
- Qiu, Y.; Smith, D.G.; Boothroyd, S.; Jang, H.; Hahn, D.F.; Wagner, J.; Bannan, C.C.; Gokey, T.; Lim, V.T.; Stern, C.D.; et al. Development and Benchmarking of Open Force Field v1. 0.0—The Parsley Small-Molecule Force Field. J. Chem. Theory Comput. 2021, 17, 6262–6280. [Google Scholar] [CrossRef]
- Poll, K.; Sims, M.T. An insight into de Vries behaviour of smectic liquid crystals from atomistic molecular dynamics simulations. J. Mater. Chem. C 2020, 8, 13040–13052. [Google Scholar] [CrossRef]
- Poll, K.; Sims, M.T. Sub-layer rationale of anomalous layer-shrinkage from atomistic simulations of a fluorinated mesogen. Mater. Adv. 2022, 3, 1212–1223. [Google Scholar] [CrossRef]
- Meyer, R.B. Les Houches Summer School in Theoretical Physics; Balian, R.G., Weil, G., Eds.; Gordon and Breach: New York, NY, USA, 1976; pp. 273–373. [Google Scholar]
- Dozov, I. On the spontaneous symmetry breaking in the mesophases of achiral banana-shaped molecules. Europhys. Lett. 2001, 56, 247. [Google Scholar] [CrossRef]
- Chen, D.; Porada, J.H.; Hooper, J.B.; Klittnick, A.; Shen, Y.; Tuchband, M.R.; Korblova, E.; Bedrov, D.; Walba, D.M.; Glaser, M.A.; et al. Chiral heliconical ground state of nanoscale pitch in a nematic liquid crystal of achiral molecular dimers. Proc. Natl. Acad. Sci. USA 2013, 110, 15931–15936. [Google Scholar] [CrossRef] [Green Version]
- Paterson, D.A.; Gao, M.; Kim, Y.K.; Jamali, A.; Finley, K.L.; Robles-Hernández, B.; Diez-Berart, S.; Salud, J.; de la Fuente, M.R.; Timimi, B.A.; et al. Understanding the twist-bend nematic phase: The characterisation of 1-(4-cyanobiphenyl-4′-yloxy)-6-(4-cyanobiphenyl-4′-yl)hexane (CB6OCB) and comparison with CB7CB. Soft Matter 2016, 12, 6827–6840. [Google Scholar] [CrossRef] [Green Version]
- Cestari, M.; Diez-Berart, S.; Dunmur, D.A.; Ferrarini, A.; de La Fuente, M.R.; Jackson, D.J.B.; Lopez, D.O.; Luckhurst, G.R.; Perez-Jubindo, M.A.; Richardson, R.M.; et al. Phase behavior and properties of the liquid-crystal dimer 1′′,7′′-bis (4-cyanobiphenyl-4′-yl) heptane: A twist-bend nematic liquid crystal. Phys. Rev. E 2011, 84, 031704. [Google Scholar] [CrossRef] [PubMed] [Green Version]
- Borshch, V.; Kim, Y.K.; Xiang, J.; Gao, M.; Jákli, A.; Panov, V.P.; Vij, J.K.; Imrie, C.T.; Tamba, M.G.; Mehl, G.H.; et al. Nematic twist-bend phase with nanoscale modulation of molecular orientation. Nat. Commun. 2013, 4, 2635. [Google Scholar] [CrossRef] [PubMed] [Green Version]
- Yu, G.; Wilson, M.R. All-atom simulations of bent liquid crystal dimers: The twist-bend nematic phase and insights into conformational chirality. Soft Matter 2022, 18, 3087–3096. [Google Scholar] [CrossRef] [PubMed]
- Shadpour, S.; Nemati, A.; Boyd, N.J.; Li, L.; Prévôt, M.E.; Wakerlin, S.L.; Vanegas, J.P.; Salamończyk, M.; Hegmann, E.; Zhu, C.; et al. Heliconical-layered nanocylinders (HLNCs)–hierarchical self-assembly in a unique B4 phase liquid crystal morphology. Mater. Horiz. 2019, 6, 959–968. [Google Scholar] [CrossRef] [Green Version]
- Shadpour, S.; Nemati, A.; Salamończyk, M.; Prévôt, M.E.; Liu, J.; Boyd, N.J.; Wilson, M.R.; Zhu, C.; Hegmann, E.; Jákli, A.I.; et al. Missing Link between Helical Nano- and Microfilaments in B4 Phase Bent-Core Liquid Crystals, and Deciphering which Chiral Center Controls the Filament Handedness. Small 2020, 16, 1905591. [Google Scholar] [CrossRef]
- Berardi, R.; Emerson, A.P.J.; Zannoni, C. Monte Carlo investigations of a Gay—Berne liquid crystal. J. Chem. Soc. Faraday Trans. 1993, 89, 4069–4078. [Google Scholar] [CrossRef]
- Zannoni, C. Molecular Design and Computer Simulations of Novel Mesophases. J. Mater. Chem. 2001, 11, 2637–2646. [Google Scholar] [CrossRef]
- Berardi, R.; Muccioli, L.; Orlandi, S.; Ricci, M.; Zannoni, C. Computer simulations of biaxial nematics. J. Phys.-Condens. Matter 2008, 20, 463101. [Google Scholar] [CrossRef]
- Wilson, M.; Allen, M. Computer simulation study of liquid crystal formation in a semi-flexible system of linked hard spheres. Mol. Phys. 1993, 80, 277–295. [Google Scholar] [CrossRef]
- Wilson, M.R. Molecular dynamics simulation of semi-flexible mesogens. Mol. Phys. 1994, 81, 675–690. [Google Scholar] [CrossRef]
- AlSunaidi, A.; den Otter, W.K.; Clarke, J.H.R. Inducement by directional fields of rotational and translational phase ordering in polymer liquid-crystals. J. Chem. Phys. 2013, 138, 154904. [Google Scholar] [CrossRef] [PubMed] [Green Version]
- Skačej, G.; Zannoni, C. Molecular simulations elucidate electric field actuation in swollen liquid crystal elastomers. Proc. Natl. Acad. Sci. USA 2012, 109, 10193–10198. [Google Scholar] [CrossRef] [PubMed] [Green Version]
- Yan, F.; Hixson, C.A.; Earl, D.J. Self-assembled chiral superstructures composed of rigid achiral molecules and molecular scale chiral induction by dopants. Phys. Rev. Lett. 2008, 101, 157801. [Google Scholar] [CrossRef] [PubMed] [Green Version]
- Greco, C.; Ferrarini, A. Entropy-driven chiral order in a system of achiral bent particles. Phys. Rev. Lett. 2015, 115, 147801. [Google Scholar] [CrossRef]
- Chiappini, M.; Drwenski, T.; Van Roij, R.; Dijkstra, M. Biaxial, twist-bend, and splay-bend nematic phases of banana-shaped particles revealed by lifting the “smectic blanket”. Phys. Rev. Lett. 2019, 123, 068001. [Google Scholar] [CrossRef]
- Fernández-Rico, C.; Chiappini, M.; Yanagishima, T.; de Sousa, H.; Aarts, D.G.; Dijkstra, M.; Dullens, R.P. Shaping colloidal bananas to reveal biaxial, splay-bend nematic, and smectic phases. Science 2020, 369, 950–955. [Google Scholar] [CrossRef]
- Lintuvuori, J.S.; Wilson, M.R. A new anisotropic soft-core model for the simulation of liquid crystal mesophases. J. Chem. Phys. 2008, 128, 044906. [Google Scholar] [CrossRef]
- Humpert, A.; Allen, M.P. Elastic constants and dynamics in nematic liquid crystals. Mol. Phys. 2015, 113, 2680–2692. [Google Scholar] [CrossRef]
- Allen, M.P.; Warren, M.A.; Wilson, M.R.; Sauron, A.; Smith, W. Molecular dynamics calculation of elastic constants in Gay-Berne nematic liquid crystals. J. Chem. Phys. 1996, 105, 2850–2858. [Google Scholar] [CrossRef] [Green Version]
- Allen, M.P.; Frenkel, D. Calculation of liquid-crystal Frank constants by computer simulation. Phys. Rev. A 1988, 37, 1813–1816. [Google Scholar] [CrossRef] [Green Version]
- Fischermeier, E.; Bartuschat, D.; Preclik, T.; Marechal, M.; Mecke, K. Simulation of a hard-spherocylinder liquid crystal with the pe. Comput. Phys. Commun. 2014, 185, 3156–3161. [Google Scholar] [CrossRef] [Green Version]
- Cleaver, D.; Allen, M. Computer Simulations of the elastic properties of liquid crystals. Phys. Rev. A 1991, 43, 1918–1931. [Google Scholar] [CrossRef]
- Gruhn, T.; Hess, S. Monte Carlo simulation of the director field of a nematic liquid crystal with three elastic coefficients. Z. Naturf. 1996, 51, 1–9. [Google Scholar] [CrossRef] [Green Version]
- Phuong, N.H.; Germano, G.; Schmid, F. Elastic constants from direct correlation functions in nematic liquid crystals: A computer simulation study. J. Chem. Phys. 2001, 115, 7227–7234. [Google Scholar] [CrossRef] [Green Version]
- Sarman, S.; Evans, D.J. Statistical mechanics of viscous flow in nematic fluids. J. Chem. Phys. 1993, 99, 9021–9036. [Google Scholar] [CrossRef]
- Kuwajima, S.; Manabe, A. Computing the rotational viscosity of nematic liquid crystals by an atomistic molecular dynamics simulation. Chem. Phys. Lett. 2000, 332, 105–109. [Google Scholar] [CrossRef]
- Sarman, S. Molecular dynamics of liquid crystals. Phys. A 1997, 240, 160–172. [Google Scholar] [CrossRef]
- Cuetos, A.; Ilnytskyi, J.M.; Wilson, M.R. Rotational viscosities of Gay-Berne mesogens. Mol. Phys. 2002, 100, 3839–3845. [Google Scholar] [CrossRef]
- Osipov, M.; Nemtsov, V. On the statistical theory of the flexoelectric effect in liquid crystals. Sov. Phys. Crystallogr. 1986, 31, 125–130. [Google Scholar]
- Ferrarini, A.; Moro, G.; Nordio, P. A shape model for the twisting power of chiral solutes in nematics. Liq. Cryst. 1995, 19, 397–399. [Google Scholar] [CrossRef]
- Feltre, L.; Ferrarini, A.; Pacchiele, F.; Nordio, P. Numerical prediction of twisting power for chiral dopants. Mol. Cryst. Liq. Cryst. Sci. Technol. Sect. A 1996, 290, 109–118. [Google Scholar] [CrossRef]
- Di Matteo, A.; Todd, S.M.; Gottarelli, G.; Solladié, G.; Williams, V.E.; Lemieux, R.P.; Ferrarini, A.; Spada, G.P. Correlation between molecular structure and helicity of induced chiral nematics in terms of short-range and electrostatic- induction interactions. The case of chiral biphenyls. J. Am. Chem. Soc. 2001, 123, 7842–7851. [Google Scholar] [CrossRef] [PubMed]
- Ferrarini, A.; Gottarelli, G.; Nordio, P.L.; Spada, G.P. Determination of absolute configuration of helicenes and related biaryls from calculation of helical twisting powers by the surface chirality model. J. Chem. Soc. Perkin Trans. 2 1999, 411–418. [Google Scholar] [CrossRef]
- Ferrarini, A.; Nordio, P.; Shibaev, P.; Shibaev, V. Twisting power of bridged binaphthol derivatives: Comparison of theory and experiment. Liq. Cryst. 1998, 24, 219–227. [Google Scholar] [CrossRef]
- Ferrarini, A.; Moro, G.; Nordio, P. Shape model for ordering properties of molecular dopants inducing chiral mesophases. Mol. Phys. 1996, 87, 485–499. [Google Scholar] [CrossRef]
- Ferrarini, A.; Moro, G.; Nordio, P. Simple molecular model for induced cholesteric phases. Phys. Rev. E 1996, 53, 681–688. [Google Scholar] [CrossRef]
- Osipov, M.; Pickup, B.; Dunmur, D. A new twist to molecular chirality: Intrinsic chirality indices. Mol. Phys. 1995, 84, 1193–1206. [Google Scholar] [CrossRef]
- Solymosi, M.; Low, R.J.; Grayson, M.; Neal, M.P. A generalized scaling of a chiral index for molecules. J. Chem. Phys. 2002, 116, 9875–9881. [Google Scholar] [CrossRef]
- Solymosi, M.; Low, R.J.; Grayson, M.; Neal, M.P.; Wilson, M.R.; Earl, D.J. Scaled chiral indices for ferroelectric liquid crystals. Ferroelectrics 2002, 277, 483–490. [Google Scholar] [CrossRef]
- Earl, D.J.; Wilson, M.R. Predictions of molecular chirality and helical twisting powers: A theoretical study. J. Chem. Phys. 2003, 119, 10280–10288. [Google Scholar] [CrossRef] [Green Version]
- Neal, M.P.; Solymosi, M.; Wilson, M.R.; Earl, D.J. Helical twisting power and scaled chiral indices. J. Chem. Phys. 2003, 119, 3567–3573. [Google Scholar] [CrossRef] [Green Version]
- Earl, D.; Osipov, M.; Takezoe, H.; Takanishi, Y.; Wilson, M. Induced and spontaneous deracemization in bent-core liquid crystal phases and in other phases doped with bent-core molecules. Phys. Rev. E 2005, 71, 021706. [Google Scholar] [CrossRef] [PubMed] [Green Version]
- Jo, S.Y.; Kim, B.C.; Jeon, S.W.; Bae, J.H.; Walker, M.; Wilson, M.; Choi, S.W.; Takezoe, H. Enhancement of the helical twisting power with increasing the terminal chain length of nonchiral bent-core molecules doped in a chiral nematic liquid crystal. RSC Adv. 2017, 7, 1932–1935. [Google Scholar] [CrossRef] [Green Version]
- Kim, B.C.; Walker, M.; Jo, S.Y.; Wilson, M.R.; Takezoe, H.; Choi, S.W. Effect of terminal chain length on the helical twisting power in achiral bent-core molecules doped in a cholesteric liquid crystal. RSC Adv. 2018, 8, 1292–1295. [Google Scholar] [CrossRef] [Green Version]
- Lintuvuori, J.S.; Yu, G.; Walker, M.; Wilson, M.R. Emergent chirality in achiral liquid crystals: Insights from molecular simulation models of the behaviour of bent-core mesogens. Liq. Cryst. 2018, 45, 1996–2009. [Google Scholar] [CrossRef]
- Earl, D.J.; Wilson, M.R. Calculations of helical twisting powers from intermolecular torques. J. Chem. Phys. 2004, 120, 9679–9683. [Google Scholar] [CrossRef]
- Germano, G.; Allen, M.P.; Masters, A.J. Simultaneous calculation of the helical pitch and the twist elastic constant in chiral liquid crystals from intermolecular torques. J. Chem. Phys. 2002, 116, 9422–9430. [Google Scholar] [CrossRef] [Green Version]
- Allen, M.P. Calculating the helical twisting power of dopants in a liquid crystal by computer simulation. Phys. Rev. E 1993, 47, 4611–4614. [Google Scholar] [CrossRef] [Green Version]
- Wilson, M.R.; Earl, D.J. Calculating the helical twisting power of chiral dopants. J. Mater. Chem. 2001, 11, 2672–2677. [Google Scholar] [CrossRef]
- Gray, S.J. Dissipative Particle Dynamics Simulations of Surfactant Systems: Phase Diagrams, Phases and Self-Assembly. Ph.D. Thesis, University of Durham, Durham, UK, 2018. [Google Scholar]
- Groot, R.D.; Warren, P.B. Dissipative particle dynamics: Bridging the gap between atomistic and mesoscopic simulation. J. Chem. Phys. 1997, 107, 4423–4435. [Google Scholar] [CrossRef]
- Lavagnini, E.; Cook, J.L.; Warren, P.B.; Hunter, C.A. Translation of Chemical Structure into Dissipative Particle Dynamics Parameters for Simulation of Surfactant Self-Assembly. J. Phys. Chem. B 2021, 125, 3942–3952. [Google Scholar] [CrossRef] [PubMed]
- Eslami, H.; Khani, M.; Müller-Plathe, F. Gaussian charge distributions for incorporation of electrostatic interactions in dissipative particle dynamics: Application to self-assembly of surfactants. J. Chem. Theory Comput. 2019, 15, 4197–4207. [Google Scholar] [CrossRef] [PubMed]
- McDonagh, J.L.; Shkurti, A.; Bray, D.J.; Anderson, R.L.; Pyzer-Knapp, E.O. Utilizing machine learning for efficient parameterization of coarse grained molecular force fields. J. Chem. Inf. Model. 2019, 59, 4278–4288. [Google Scholar] [CrossRef] [PubMed]
- Johnston, M.A.; Duff, A.I.; Anderson, R.L.; Swope, W.C. Model for the Simulation of the CnEm Nonionic Surfactant Family Derived from Recent Experimental Results. J. Phys. Chem. B 2020, 124, 9701–9721. [Google Scholar] [CrossRef] [PubMed]
- Lydon, J. Chromonic review. J. Mater. Chem. 2010, 20, 10071–10099. [Google Scholar] [CrossRef]
- Bosire, R.; Ndaya, D.; Kasi, R.M. Recent progress in functional materials from lyotropic chromonic liquid crystals. Polym. Int. 2021, 70, 938–943. [Google Scholar] [CrossRef]
- Shiyanovskii, S.V.; Lavrentovich, O.D.; Schneider, T.; Ishikawa, T.; Smalyukh, I.I.; Woolverton, C.J.; Niehaus, G.D.; Doane, K.J. Lyotropic chromonic liquid crystals for biological sensing applications. Mol. Cryst. Liq. Cryst. 2005, 434, 587–598. [Google Scholar] [CrossRef]
- Shiyanovskii, S.V.; Schneider, T.; Smalyukh, I.I.; Ishikawa, T.; Niehaus, G.D.; Doane, K.J.; Woolverton, C.J.; Lavrentovich, O.D. Real-time microbe detection based on director distortions around growing immune complexes in lyotropic chromonic liquid crystals. Phys. Rev. E 2005, 71, 020702. [Google Scholar] [CrossRef] [Green Version]
- Kaznatcheev, K.V.; Dudin, P.; Lavrentovich, O.D.; Hitchcock, A.P. X-ray microscopy study of chromonic liquid crystal dry film texture. Phys. Rev. E 2007, 76, 61703. [Google Scholar] [CrossRef] [Green Version]
- Park, H.S.; Agarwal, A.; Kotov, N.A.; Lavrentovich, O.D. Controllable Side-by-Side and End-to-End Assembly of Au Nanorods by Lyotropic Chromonic Materials. Langmuir 2008, 24, 13833–13837. [Google Scholar] [CrossRef]
- Zhou, S.; Sokolov, A.; Lavrentovich, O.D.; Aranson, I.S. Living liquid crystals. Proc. Natl. Acad. Sci. USA 2014, 111, 1265–1270. [Google Scholar] [CrossRef] [PubMed] [Green Version]
- Walker, M.; Masters, A.J.; Wilson, M.R. Self-assembly and mesophase formation in a non-ionic chromonic liquid crystal system: Insights from dissipative particle dynamics simulations. Phys. Chem. Chem. Phys. 2014, 16, 23074–23081. [Google Scholar] [CrossRef] [PubMed] [Green Version]
- Walker, M.; Wilson, M.R. Formation of complex self-assembled aggregates in non-ionic chromonics: Dimer and trimer columns, layer structures and spontaneous chirality. Soft Matter 2016, 12, 8588–8594. [Google Scholar] [CrossRef] [PubMed] [Green Version]
- Chami, F.; Wilson, M.R. Molecular Order in a Chromonic Liquid Crystal: A Molecular Simulation Study of the Anionic Azo Dye Sunset Yellow. J. Am. Chem. Soc. 2010, 132, 7794–7802. [Google Scholar] [CrossRef] [PubMed]
- Yu, G.; Walker, M.; Wilson, M.R. Atomistic simulation studies of ionic cyanine dyes: Self-assembly and aggregate formation in aqueous solution. Phys. Chem. Chem. Phys. 2021, 23, 6408–6421. [Google Scholar] [CrossRef]
- Thind, R.; Walker, M.; Wilson, M.R. Molecular Simulation Studies of Cyanine-Based Chromonic Mesogens: Spontaneous Symmetry Breaking to Form Chiral Aggregates and the Formation of a Novel Lamellar Structure. Adv. Theory Simul. 2018, 1, 1800088. [Google Scholar] [CrossRef] [Green Version]
- Carbone, P.; Varzaneh, H.A.K.; Chen, X.; Müller-Plathe, F. Transferability of coarse-grained force fields: The polymer case. J. Chem. Phys. 2008, 128, 064904. [Google Scholar] [CrossRef]
- Villa, A.; Peter, C.; van der Vegt, N.F.A. Self-assembling dipeptides: Conformational sampling in solvent-free coarse-grained simulation. Phys. Chem. Chem. Phys. 2009, 11, 2077–2086. [Google Scholar] [CrossRef]
- Villa, A.; van der Vegt, N.F.A.; Peter, C. Self-assembling dipeptides: Including solvent degrees of freedom in a coarse-grained model. Phys. Chem. Chem. Phys. 2009, 11, 2068–2076. [Google Scholar] [CrossRef]
- Li, C.; Shen, J.; Peter, C.; van der Vegt, N.F.A. A Chemically Accurate Implicit-Solvent Coarse-Grained Model for Polystyrenesulfonate Solutions. Macromolecules 2012, 45, 2551–2561. [Google Scholar] [CrossRef]
- Potter, T.D.; Walker, M.; Wilson, M.R. Self-assembly and mesophase formation in a non-ionic chromonic liquid crystal: Insights from bottom-up and top-down coarse-grained simulation models. Soft Matter 2020, 16, 9488–9498. [Google Scholar] [CrossRef] [PubMed]
- Potter, T.D.; Tasche, J.; Barrett, E.L.; Walker, M.; Wilson, M.R. Development of new coarse-grained models for chromonic liquid crystals: Insights from top-down approaches. Liq. Cryst. 2017, 44, 1979–1989. [Google Scholar] [CrossRef] [Green Version]
- Saiz, L.; Klein, M.L. Computer simulation studies of model biological membranes. Acc. Chem. Res. 2002, 35, 482–489. [Google Scholar] [CrossRef] [PubMed]
- Talandashti, R.; Mehrnejad, F.; Rostamipour, K.; Doustdar, F.; Lavasanifar, A. Molecular Insights into Pore Formation Mechanism, Membrane Perturbation, and Water Permeation by the Antimicrobial Peptide Pleurocidin: A Combined All-Atom and Coarse-Grained Molecular Dynamics Simulation Study. J. Phys. Chem. B 2021, 125, 7163–7176. [Google Scholar] [CrossRef] [PubMed]
- Souza, L.M.; Souza, F.R.; Reynaud, F.; Pimentel, A.S. Tuning the hydrophobicity of a coarse grained model of 1,2-dipalmitoyl-sn-glycero-3-phosphatidylcholine using the experimental octanol-water partition coefficient. J. Mol. Liq. 2020, 319, 114132. [Google Scholar] [CrossRef]
- Bertrand, B.; Garduño-Juárez, R.; Munoz-Garay, C. Estimation of pore dimensions in lipid membranes induced by peptides and other biomolecules: A review. Biochim. Biophys. Acta Biomembr. 2021, 1863, 183551. [Google Scholar] [CrossRef]
- Potter, T.D.; Barrett, E.L.; Miller, M.A. Automated Coarse-Grained Mapping Algorithm for the Martini Force Field and Benchmarks for Membrane–Water Partitioning. J. Chem. Theory Comput. 2021, 17, 5777–5791. [Google Scholar] [CrossRef]
- Potter, T.D.; Tasche, J.; Wilson, M.R. Assessing the transferability of common top-down and bottom-up coarse-grained molecular models for molecular mixtures. Phys. Chem. Chem. Phys. 2019, 21, 1912–1927. [Google Scholar] [CrossRef] [Green Version]
- Izvekov, S.; Voth, G.A. A multiscale coarse-graining method for biomolecular systems. J. Phys. Chem. B 2005, 109, 2469–2473. [Google Scholar] [CrossRef]
- Noid, W.G.; Chu, J.W.; Ayton, G.S.; Krishna, V.; Izvekov, S.; Voth, G.A.; Das, A.; Andersen, H.C. The multiscale coarse-graining method. I. A rigorous bridge between atomistic and coarse-grained models. J. Chem. Phys. 2008, 128, 244114. [Google Scholar] [CrossRef] [Green Version]
- Noid, W.G.; Liu, P.; Wang, Y.; Chu, J.W.; Ayton, G.S.; Izvekov, S.; Andersen, H.C.; Voth, G.A. The multiscale coarse-graining method. II. Numerical implementation for coarse-grained molecular models. J. Chem. Phys. 2008, 128, 244115. [Google Scholar] [CrossRef] [PubMed] [Green Version]
- Reith, D.; Pütz, M.; Müller-Plathe, F. Deriving effective mesoscale potentials from atomistic simulations. J. Comput. Chem. 2003, 24, 1624–1636. [Google Scholar] [CrossRef] [PubMed] [Green Version]
- Lafitte, T.; Apostolakou, A.; Avendaño, C.; Galindo, A.; Adjiman, C.S.; Müller, E.A.; Jackson, G. Accurate statistical associating fluid theory for chain molecules formed from Mie segments. J. Chem. Phys. 2013, 139, 154504. [Google Scholar] [CrossRef] [PubMed]
- Avendaño, C.; Lafitte, T.; Galindo, A.; Adjiman, C.S.; Jackson, G.; Müller, E.A. SAFT-γ Force Field for the Simulation of Molecular Fluids. 1. A Single-Site Coarse Grained Model of Carbon Dioxide. J. Phys. Chem. B 2011, 115, 11154–11169. [Google Scholar] [CrossRef] [PubMed]
- Avendaño, C.; Lafitte, T.; Adjiman, C.S.; Galindo, A.; Müller, E.A.; Jackson, G. SAFT-γ Force Field for the Simulation of Molecular Fluids: 2. Coarse-Grained Models of Greenhouse Gases, Refrigerants, and Long Alkanes. J. Phys. Chem. B 2013, 117, 2717–2733. [Google Scholar] [CrossRef]
- Müller, E.A.; Jackson, G. Force Field Parameters from the SAFT-γ Equation of State for use in Coarse-Grained Molecular Simulations. Annu. Rev. Chem. Biomol. Eng. 2014, 5, 405–427. [Google Scholar] [CrossRef]
- Fayaz-Torshizi, M.; Müller, E.A. Coarse-Grained Molecular Simulation of Polymers Supported by the Use of the SAFT-γ Mie Equation of State. Macromol. Theory Simul. 2021, 31, 2100031. [Google Scholar] [CrossRef]
- Fayaz-Torshizi, M.; Müller, E.A. Coarse-grained molecular dynamics study of the self-assembly of polyphilic bolaamphiphiles using the SAFT-γ Mie force field. Mol. Syst. Des. Eng. 2021, 6, 594–608. [Google Scholar] [CrossRef]
- Von Berlepsch, H.; Böttcher, C.; Dähne, L. Structure of J-Aggregates of Pseudoisocyanine Dye in Aqueous Solution. J. Phys. Chem. B 2000, 104, 8792–8799. [Google Scholar] [CrossRef]
- Bricker, W.P.; Banal, J.L.; Stone, M.B.; Bathe, M. Molecular model of J-aggregated pseudoisocyanine fibers. J. Chem. Phys. 2018, 149, 024905. [Google Scholar] [CrossRef]
- Kirstein, S.; Daehne, S. J-aggregates of amphiphilic cyanine dyes: Self-organization of artificial light harvesting complexes. Int. J. Photoenergy 2006, 5, 020363. [Google Scholar] [CrossRef]


| Molecule | (exp.) /K | (GAFF-LCFF) /K |
|---|---|---|
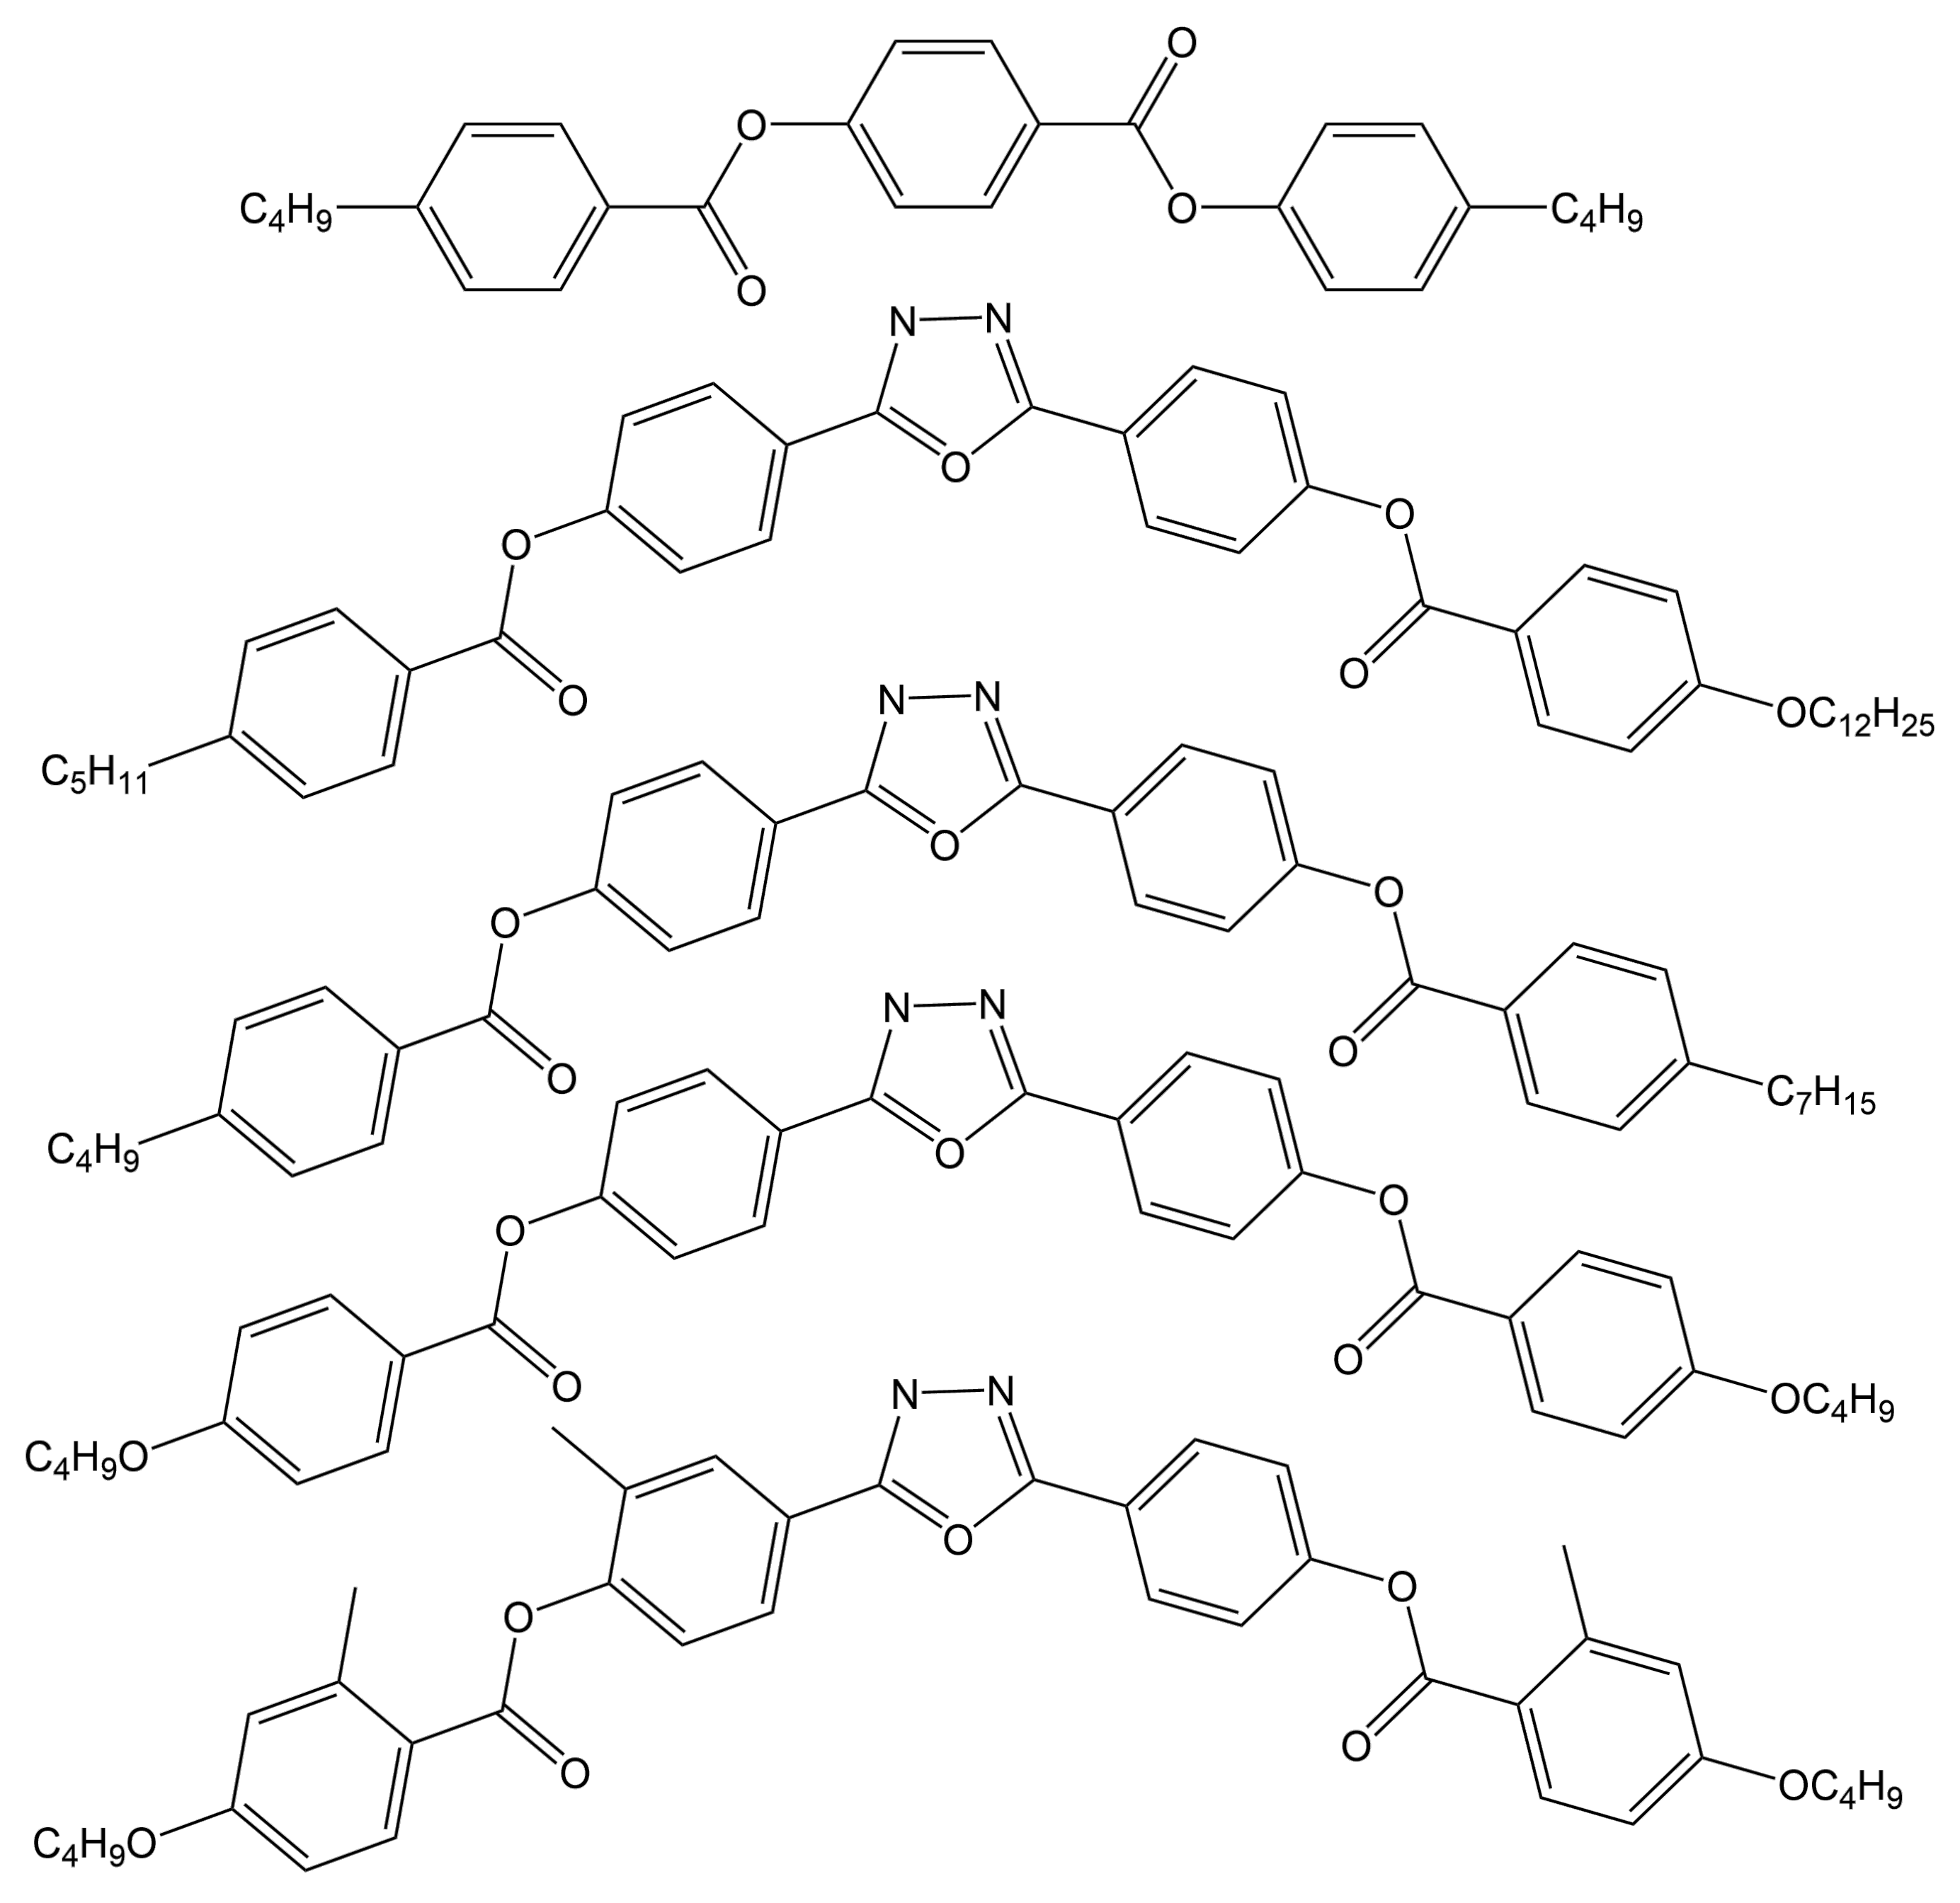
| 1,3-benzenedicarboxylic acid,1,3-bis(4-butylphenyl)-ester | 452 | 450–460 |
| C5-Ph-ODBP-Ph-OC12 | 512.6 | ∼510 |
| C4-Ph-ODBP-Ph-C7 | 507 | ∼500 |
| C4O-Ph-ODBP | 558 | 550–560 |
| C4O-Ph-ODBP (trimethylated) | 421 | 420–430 |
Publisher’s Note: MDPI stays neutral with regard to jurisdictional claims in published maps and institutional affiliations. |
© 2022 by the authors. Licensee MDPI, Basel, Switzerland. This article is an open access article distributed under the terms and conditions of the Creative Commons Attribution (CC BY) license (https://creativecommons.org/licenses/by/4.0/).
Share and Cite
Wilson, M.R.; Yu, G.; Potter, T.D.; Walker, M.; Gray, S.J.; Li, J.; Boyd, N.J. Molecular Simulation Approaches to the Study of Thermotropic and Lyotropic Liquid Crystals. Crystals 2022, 12, 685. https://0-doi-org.brum.beds.ac.uk/10.3390/cryst12050685
Wilson MR, Yu G, Potter TD, Walker M, Gray SJ, Li J, Boyd NJ. Molecular Simulation Approaches to the Study of Thermotropic and Lyotropic Liquid Crystals. Crystals. 2022; 12(5):685. https://0-doi-org.brum.beds.ac.uk/10.3390/cryst12050685
Chicago/Turabian StyleWilson, Mark R., Gary Yu, Thomas D. Potter, Martin Walker, Sarah J. Gray, Jing Li, and Nicola Jane Boyd. 2022. "Molecular Simulation Approaches to the Study of Thermotropic and Lyotropic Liquid Crystals" Crystals 12, no. 5: 685. https://0-doi-org.brum.beds.ac.uk/10.3390/cryst12050685