
Ferroelectric Smectic Liquid Crystals as Electrocaloric Materials


School of Physics and Astronomy, University of Leeds, Leeds LS2 9JT, UK
*
Author to whom correspondence should be addressed.
Crystals 2022, 12(6), 809; https://0-doi-org.brum.beds.ac.uk/10.3390/cryst12060809
Submission received: 10 May 2022
/
Revised: 2 June 2022
/
Accepted: 4 June 2022
/
Published: 8 June 2022
(This article belongs to the Special Issue State-of-the-Art Liquid Crystals Research in UK)
Abstract
:The 1980s saw the development of ferroelectric chiral smectic C (SmC*) liquid crystals (FLCs) with a clear focus on their application in fast electro-optic devices. However, as the only known fluid ferroelectric materials, they also have potential in other applications, one of which is in heat-exchange devices based on the electrocaloric effect. In particular, ferroelectric liquid crystals can be both the electrocaloric material and the heat exchanging fluid in an electrocaloric device, significantly simplifying some of the design constraints associated with solid dielectrics. In this paper, we consider the electrocaloric potential of three SmC* ferroelectric liquid crystal systems, two of which are pure materials that exhibit ferroelectric, antiferroelectric, and intermediate phases and one that was developed as a room-temperature SmC* material for electro-optic applications. We report the field-induced temperature changes of these selected materials, measured indirectly using the Maxwell method. The maximum induced temperature change determined, 0.37 K, is currently record-breaking for an FLC and is sufficiently large to make these materials interesting candidates for the development for electrocaloric applications. Using the electrocaloric temperature change normalised as a function of electric field strength, as a function of merit, the performances of FLCs are compared with ferroelectric ceramics and polymers.
1. Introduction
The electrocaloric (EC) effect, discovered in 1930, is the induction of a reversible temperature change in a material via the adiabatic application of an electric field [1]. The EC effect has long been regarded as having potential as a cooling technology for cryogenic [2,3] and, more recently, for room temperature applications [4]. Interest has also grown as it is considered to be an environmentally friendly alternative to the ubiquitous vapour compression devices. This is because the typically high efficiency of vapour compression materials is offset by their large global warming impact. The unavoidable leakage of refrigerant results in a large environmental impact over the lifetime of the device [5]. In comparison, electrocaloric materials have a negligible direct impact on global warming as they are not volatile gases. Additionally, with the continuing rise in computing power, there is a growing demand for efficient and compact refrigeration technology in microelectronics. Vapour compression devices that have been proposed [6,7] are cumbersome with significantly reduced efficiency. Thus, there is a need for alternative refrigeration technologies that are efficient on a range of length scales and do not rely on the use of greenhouse gases.
For many years, EC materials have offered only small induced temperature (T) changes (∆T ~ 2 K) in response to very large applied voltages (several hundred volts), so the phenomenon was considered to be far from practical applications. However, in 2006 [8], Mischenko et al. reported ∆T ~ 12 K in the ferroelectric ceramic lead zirconate titanate (PZT) for fields of 48 V µm−1 at a temperature of 220 °C, closely followed by a similarly large EC temperature change in ferroelectric polymers near room temperature [9]. Significant research into solid inorganic ceramics and fluorinated polymers as potential EC materials followed, but there has been only one report of a ferroelectric liquid crystal considered [10], despite some exciting potential advantages, discussed further below [4,11,12,13]. This paper examines three carefully selected FLCs for their electrocaloric potential, demonstrating both the current state-of-the-art research and offering insight into how to develop this exciting application area.
An EC material works as follows: the entropy of a dielectric material can be considered as being the sum of two contributions, one due to thermal vibrations and phonons and the second from the ordering of dipoles in the material. Upon adiabatic application of an electric field, the dipoles in the dielectric material align with the field, causing a decrease in the dipole entropy. The total entropy of the system is constant in an adiabatic process; therefore, the entropy due to molecular vibrations, and subsequently the temperature, increases. The converse occurs when the field is removed adiabatically, resulting in a temperature decrease. Clearly, for this to work in a device, heat exchange must also occur, and a common method of heat transfer is to pump a heat-exchanging liquid over the EC material and into a heat-exchange unit [14,15,16,17,18]. A major challenge with all electrocaloric device designs is the transfer of heat away from the refrigerated area. There are significant efficiency losses due to imperfect heat transfer between the heat exchange liquid and EC material. Alternative methods for heat exchange that do not use a liquid have been proposed, but there are still engineering challenges [19,20,21,22]. Therefore, the potential of using a dielectric liquid, rather than a solid, as the EC material is exciting as it could be pumped away from the refrigerated area. Liquid crystals (LCs) are obvious candidates worthy of serious consideration as novel EC materials; this paper specifically considers the potential of ferroelectric smectic liquid crystals as electrocaloric materials. In particular, we aim to: (i) deduce the electrocaloric performance of known ferroelectric, smectic, liquid crystals; (ii) elucidate the design rules for optimising the electrocaloric performance of new liquid crystal materials; and (iii) consider how their performance compares to solid-state ferroelectric electrocaloric materials (ceramics and polymers).
Most of the (rather few) measurements of the electrocaloric effect in LCs have explored commercially available materials and considered the phenomenon near the isotropic–nematic transition, with some promising results. Direct measurements of the EC effect in 5CB [23] showed an induced temperature change of ∆T = 0.36 K for an applied field of 19 V µm−1, while indirect measurements [24] suggest a peak change of ∆T = 5.26 K for a field of 90 V µm−1. A temperature change of ∆T ~ 1.4 K has also been directly measured in 8CB [25] using a 6 V µm−1 field. The temperature change induced at the isotropic to SmA transition has been studied using 12CB, with a significant temperature change, ∆T ~ 6.5 K, measured near the transition using an 8 V µm−1 field [25,26]. The results for 12CB suggest that the greatest EC effect is around a phase transition where the applied field can induce a comparatively large change in the order parameter. However, a disadvantage of measurements at an isotropic–LC phase transition is the very narrow temperature range over which the phenomenon can be exploited—typically a few tenths of a degree at most.
It seems an obvious step to consider the potential of ferroelectric liquid crystals as EC materials, given that the largest EC effect measured to date has been in solid ferroelectrics [12,13]. However, we are aware of only one report of the EC effect in ferroelectric liquid crystals, in which two commercial ferroelectric liquid crystal mixtures designed for electro-optic displays were investigated [10], with a peak temperature change ∆T = 0.16 K. We selected three materials as follows: one is a well-known commercial material, SCE13, which is rather similar to the materials already studied, allowing us to perform a direct comparison with published data. As is explained in Section 2, a larger electrocaloric effect occurs for materials that exhibit a larger spontaneous polarisation, so we have also selected two pure, smectic, ferroelectric LCs (LC 1 and LC 2) with large values of PS, each with different phase sequences. In all cases, we measured the EC effect indirectly using the Maxwell approach [27]. We also normalised the maximum EC absolute temperature change with respect to the applied field as , offering a “figure of merit” for the electrocaloric effect, which allows a meaningful comparison of the effect across LCs, polymers, and ferroelectric ceramics. We demonstrate that simple material selection criteria that include the consideration of the PS and the phase behaviour allowed us to record the largest EC temperature change to date for a ferroelectric LC, both in terms of absolute temperature change and normalised with respect to the applied field.
As already stated, in this paper, the electrocaloric temperature change is measured indirectly using the Maxwell approach [27]. An expression for the isothermal entropy change per unit volume, , as a function of electric field can be derived using the Maxwell relation between the electric field and temperature,
where and are the initial and final field strengths and is the rate of change of spontaneous polarisation with respect to temperature at a constant field strength. Assuming that the initial temperature and the volumetric heat capacity do not vary with the applied field, an estimate of the induced temperature change, , is
where (K) is the temperature at which the field is applied and (J K−1 m−3) is the volumetric heat capacity at zero field, measured at . Equation (2) offers a basis for indirectly measuring the temperature change of an FLC in response to an applied field, provided that both and are known.
2. Materials and Methodology
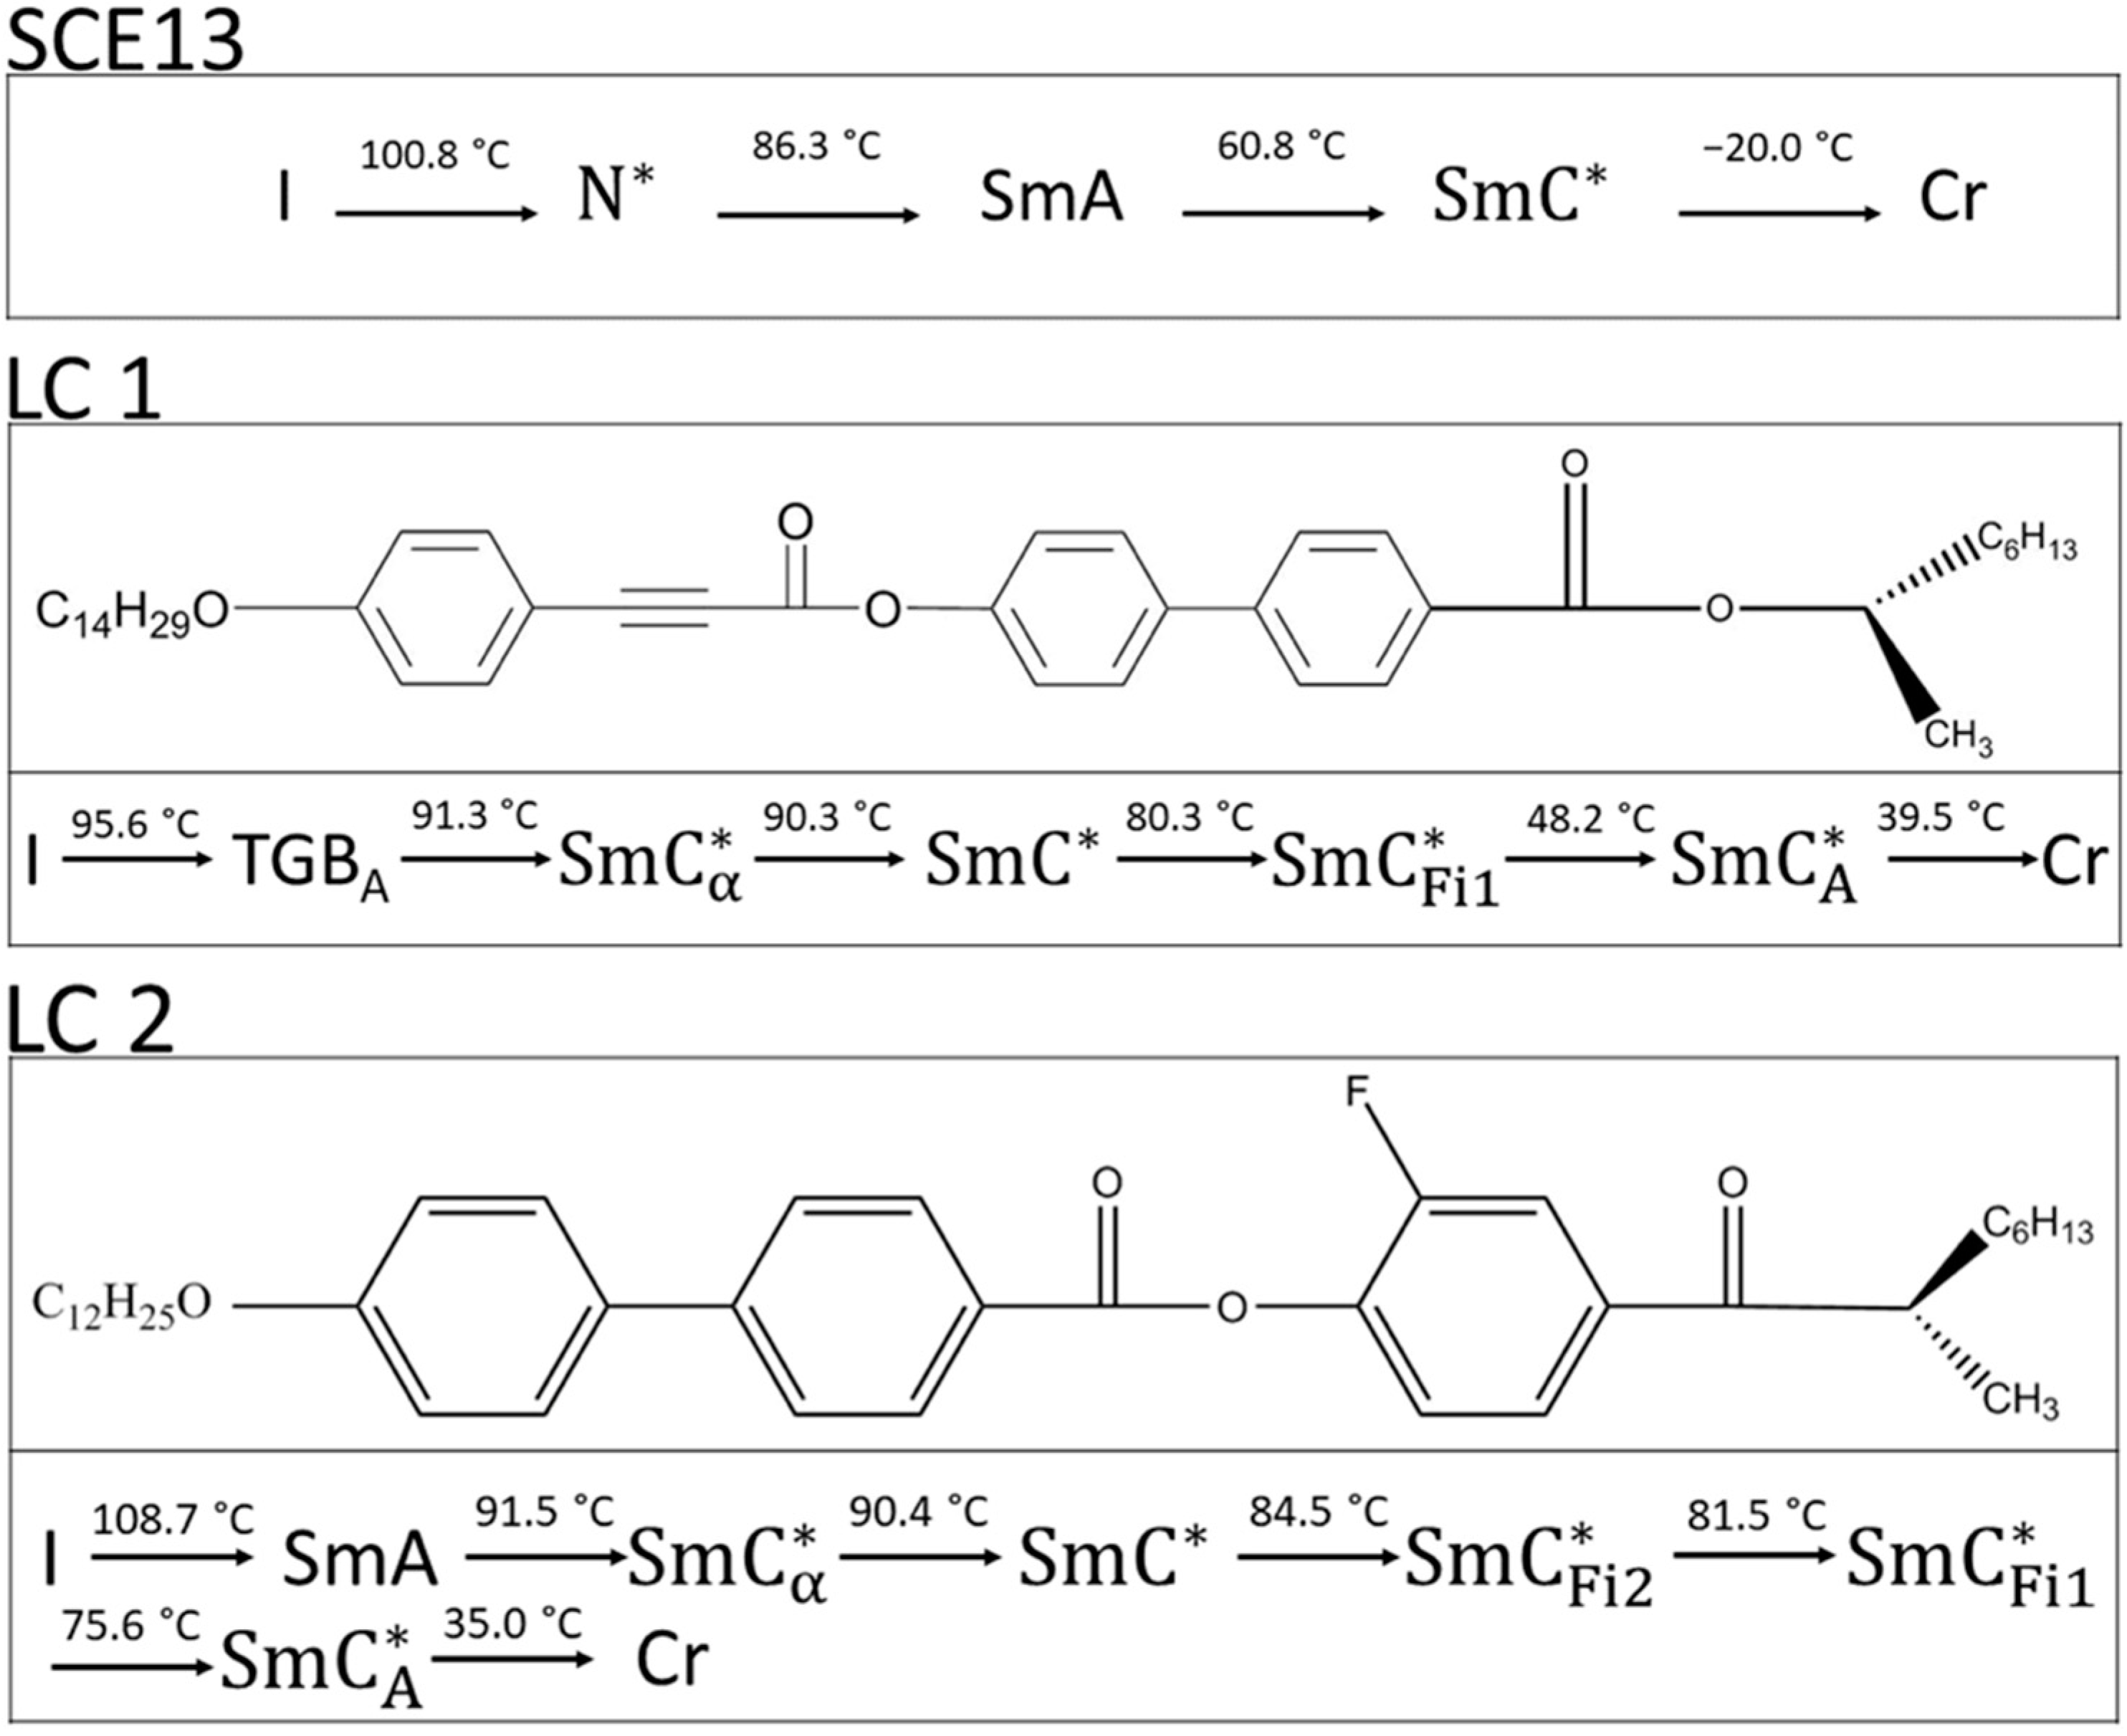
The FLC materials chosen for this study were selected to (i) allow us to evaluate the influence of the magnitude of the PS and (ii) examine the influence of the phase behaviour at the transition to the FLC phase. SCE13 is a ferroelectric mixture supplied by Merck, with the phase sequence shown in Figure 1. As this mixture was designed for use in electro-optic devices, the phase sequence includes a chiral nematic phase with very large pitch at the chiral nematic (N*)–smectic A (SmA) phase transition, and the material has a modest spontaneous polarization () at room temperature. Liquid crystals 1 (LC 1) and 2 (LC 2) are shown in Figure 1, together with their phase sequences; they were originally designed as novel antiferroelectric materials and have a larger spontaneous polarization (). Full details of their properties are reported elsewhere [28,29]. Both LC 1 and LC 2 exhibit a narrow (~1 °C) smectic C alpha (SmC*α) phase directly above the SmC* phase. LC 1 also exhibits a twist-grain boundary A (TGBA) phase extending for ~5 °C above the SmC* phase, before the material becomes isotropic. LC 2 has a relatively wide (~17 °C) SmA phase directly above the SmC*α phase. The nature of the SmC*α to SmC* phase transition has been discussed in detail elsewhere [30] and can be first or second order, a factor that will influence the field and temperature dependence of the spontaneous polarization. The subphases exhibited by LC 1 and LC 2 are all several degrees below ferroelectric to paraelectric (SmC*α to TGBA or SmA phase) and do not contribute to the measurements reported in this paper.
The heat capacity, CE(0,T), is measured via differential scanning calorimetry using a TA Instruments Q2000 Different Scanning Calorimeter. All heat capacity measurements were made at zero field (the option of applying a field during the calorimetry was not available) and taken on cooling at 10 Kmin−1. The data are quoted with respect to a critical temperature, TO, defined as the temperature where the ferroelectric phase was first observed. To determine the volumetric heat capacity of a sample, the specific heat capacity is multiplied by the density of the sample. For this work, the density of the materials was estimated from literature values for calamitic LCs in the SmC [31,32,33] or SmA phase [34] at the phase transition. The range of values reported for density span 0.96 to 1.02 g cm−3, with an average density of (0.97 ± 0.02) g cm−3. We employed the average value to indirectly determine the electrocaloric temperature change and estimate that this contributes to ~2% uncertainty in our final measurement of ∆T.
The spontaneous polarisation is measured using the current reversal technique with an accuracy of ±1 nC cm−2 [35]. All measurements were taken in cells approximately 1.8 µm thick treated for planar alignment, purchased from AWAT (Poland). An electric field with a triangular wave was applied to the cell, and the current associated with the change in sign of the Ps of the ferroelectric LC, IP, was passed in series to a current-to-voltage amplifier. The resulting signal was then recorded on a Tektronix 2024C oscilloscope. PS is determined by analysing the current peak using Equation (3),
where A is the surface area of the electrodes, R is the resistance of the current to voltage amplifier, and t is time.
Temperature control is achieved using a Linkam TMS 94 with an LTS 350 hot plate. The spontaneous polarisation is determined as a function of applied field at temperature intervals of 0.2 K spanning temperatures from 2 K above to 10 K below the SmA–SmC* transition for SCE13, TGBA–SmC*α for LC 1 and SmA–SmC*α transition for LC 2. Results are plotted on a reduced temperature scale with the critical temperature, TO, defined as the temperature where the ferroelectric phase was first observed using polarised microscopy.
The temperature change, , that occurs in the FLC as a consequence of applying a field is determined using the volumetric heat capacity and spontaneous polarisation data as outlined in the Introduction. For each material, Ps measurements were taken at 0.2 K temperature intervals across the phase transition while varying the electric field strength from 3–19 V µm−1 for SCE13 and LC 1 and from 5–19 V µm−1 for LC 2 in steps of ~3 V µm−1. The maximum electric field strengths applied to the samples are sufficient to fully saturate the Ps measurements whilst not inducing a chevron to bookshelf transition [36,37].
In order to determine and substitute into Equations (1) and (2), a numerical fit was applied to the experimental data to allow extrapolation between the data points as follows. The Ps measurements determined for SCE13 and Material 2 for each (constant) field strength were fit to a Curie–Weiss law ( at temperatures up to the sample’s respective critical temperature, TC. The Ps results for LC 1 were fit to a third-order polynomial because LC 1 shows a more discontinuous transition into the SmC*α phase. PS values determined above the critical temperature for all materials were fit to an exponential decay curve.
The gradient of each of the numerical fits with respect to temperature in Equations (1) and (2) was thus found for each field strength, and this was then plotted as a function of temperature. Taking a vertical slice through the graph of as a function of temperature represents as a function of electric field strength at a constant temperature, . Finally, a numerical fit can be made of as a function of electric field strength; integrating under the fitting curve results in the indirect measurement for isothermal entropy change per unit volume, as described by Equation (2). The electrocaloric temperature change was indirectly determined by multiplying the isothermal entropy change per unit volume at a given temperature, T1, by the temperature in Kelvin, and dividing by the volumetric heat capacity at T1.
3. Results
3.1. Heat Capacity
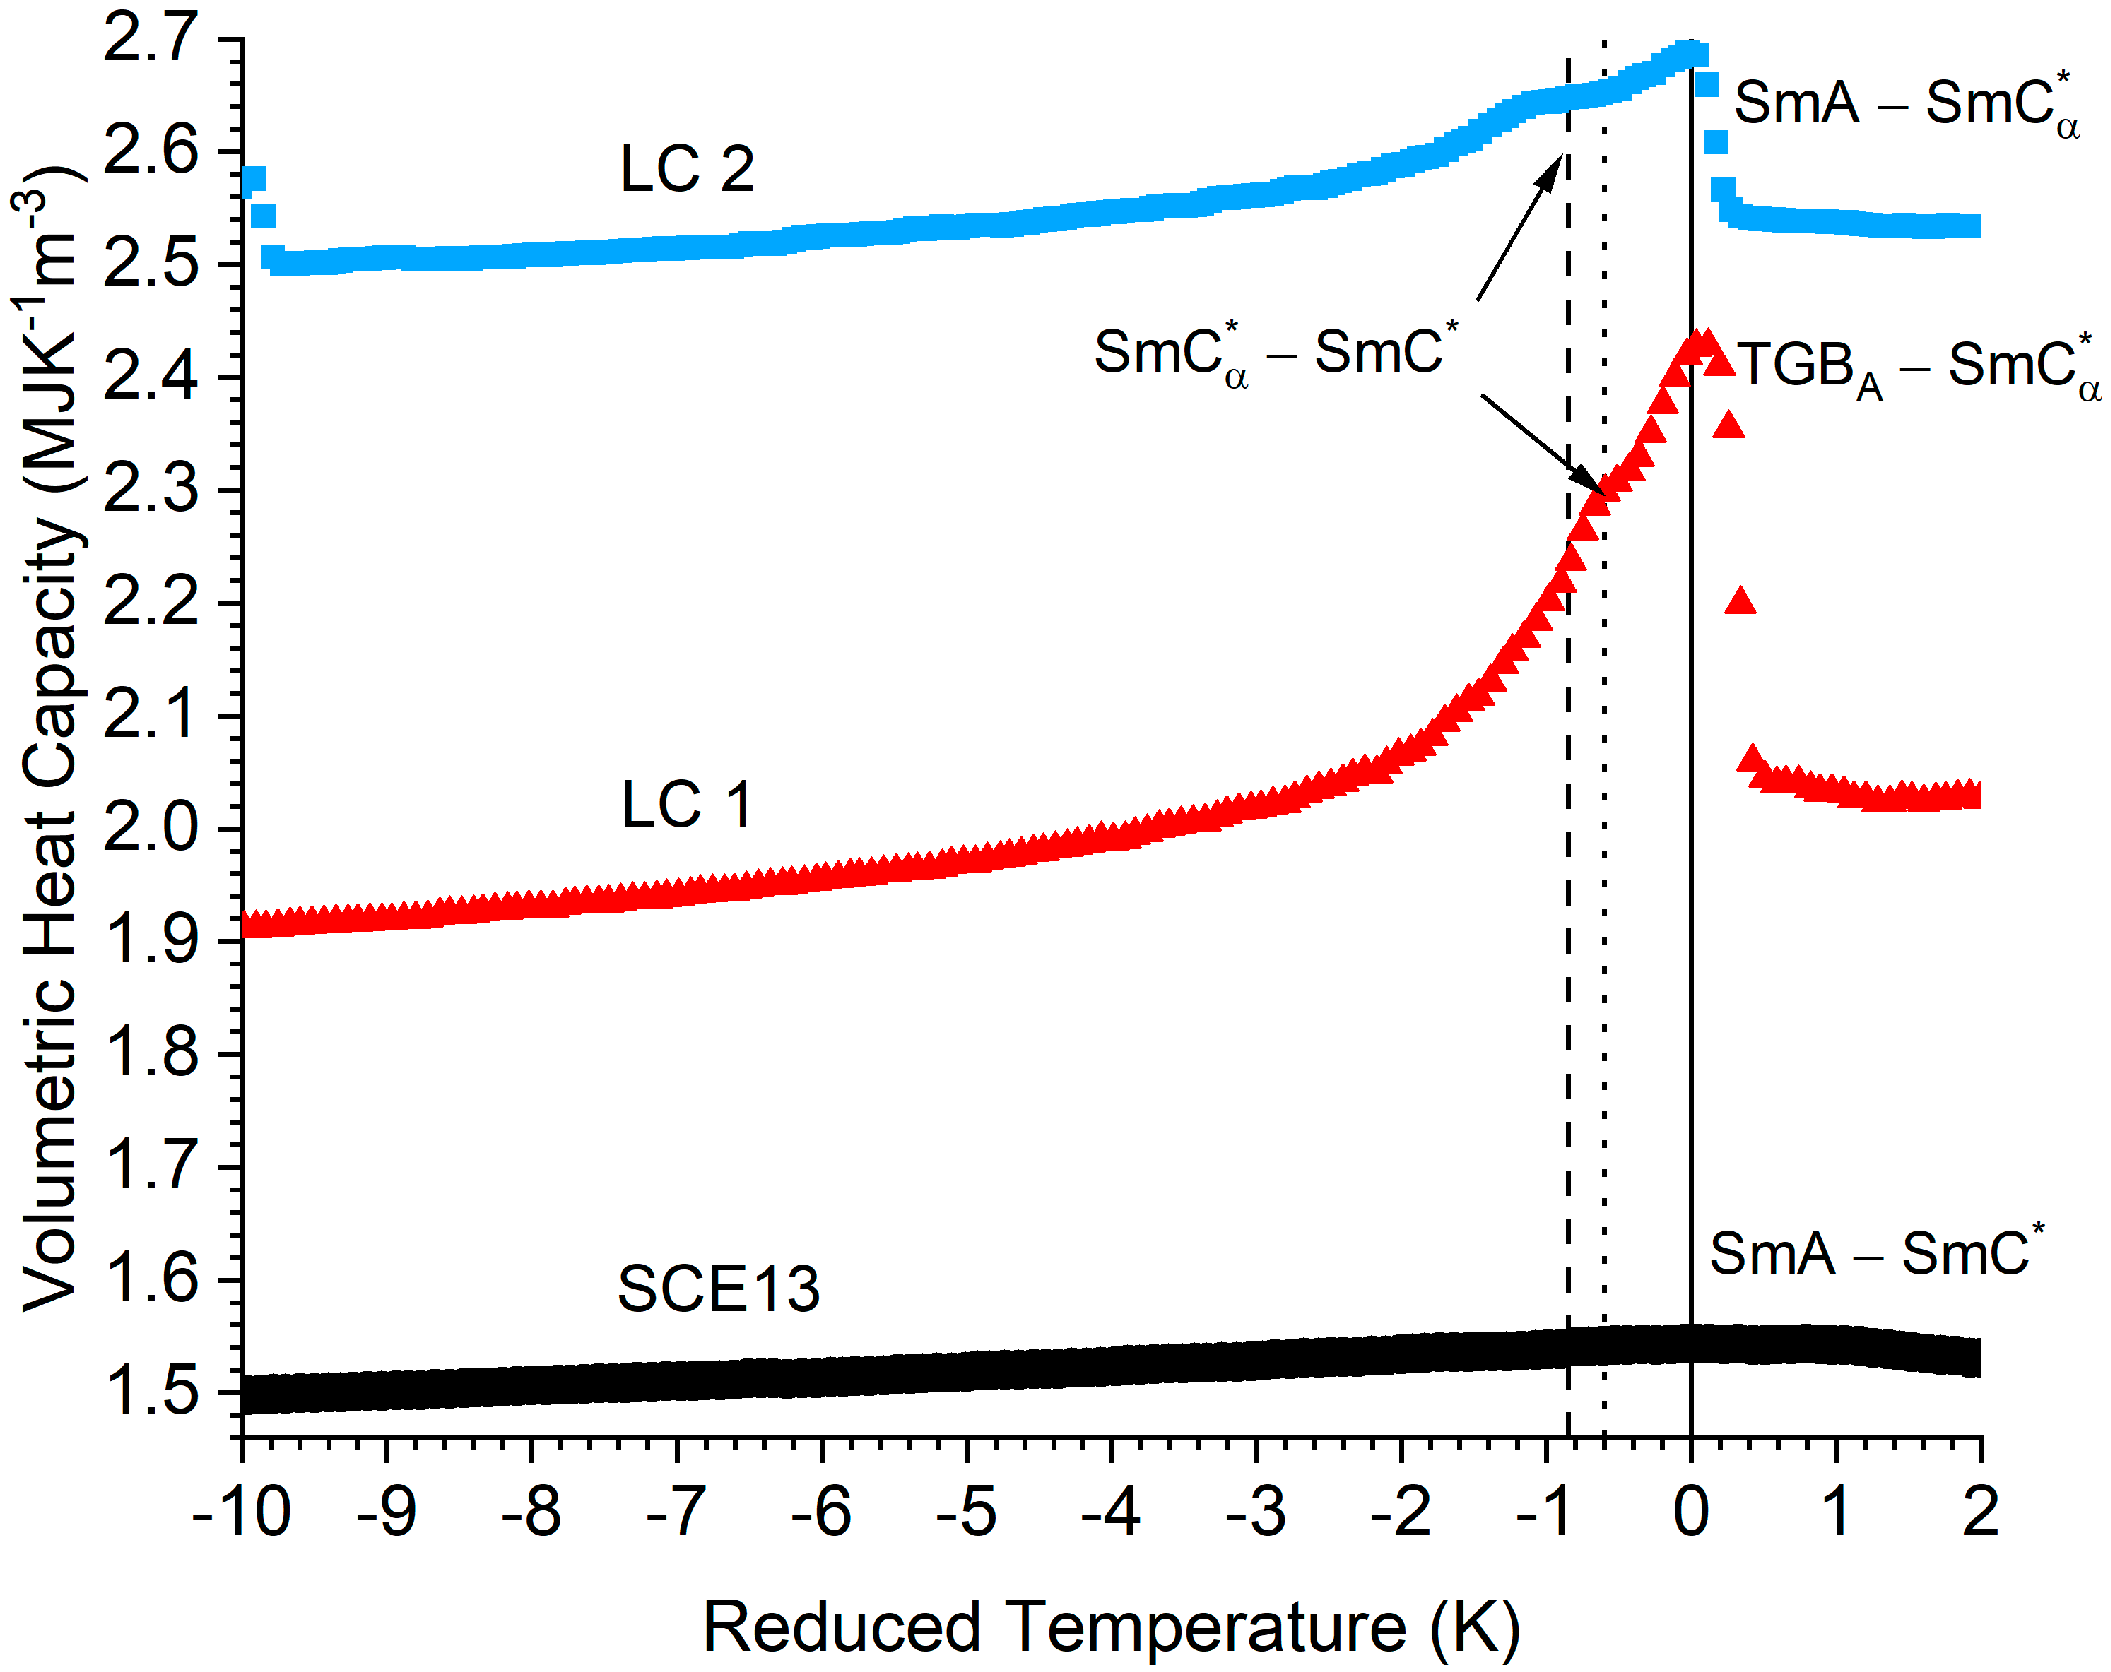
Figure 2 presents the volumetric heat capacity of SCE13, LC 1, and LC 2 around the transition into the ferroelectric phase of each material. The magnitude of the heat capacity is different for each of these materials, a factor that is important in their use as electrocaloric materials (Equation (2)). A peak is seen in the volumetric heat capacity around the ferroelectric to non-ferroelectric phase transitions for each of the materials. The relative magnitude of the peak is quite different for the three samples: LC 1 is the largest, 19% higher than the value 1 K above the transition; SCE13 shows less than a 1% increase, while LC 2 shows a 6% increase over the baseline value. The relative magnitude of the peaks is representative of the discontinuity at the phase transition. As will be explained further in Section 4, this subsequently affects the magnitude and applicable temperature range of the electrocaloric effect. The SmC*α–SmC transition is seen in the DSC traces for LC 1 and LC 2; however, the transition is convoluted with the TGBA–SmC*α transition in LC 1 and the SmA–SmC*α transition in LC 2. The convolution broadens the peak; therefore, the heat capacity, CE, around the transition stays larger over a wider temperature range. Subsequently, from Equation (2), the electrocaloric temperature change at all temperatures is deduced. For these measurements, the critical temperature for each sample is defined as the peak in the heat capacity.
3.2. Spontaneous Polarisation
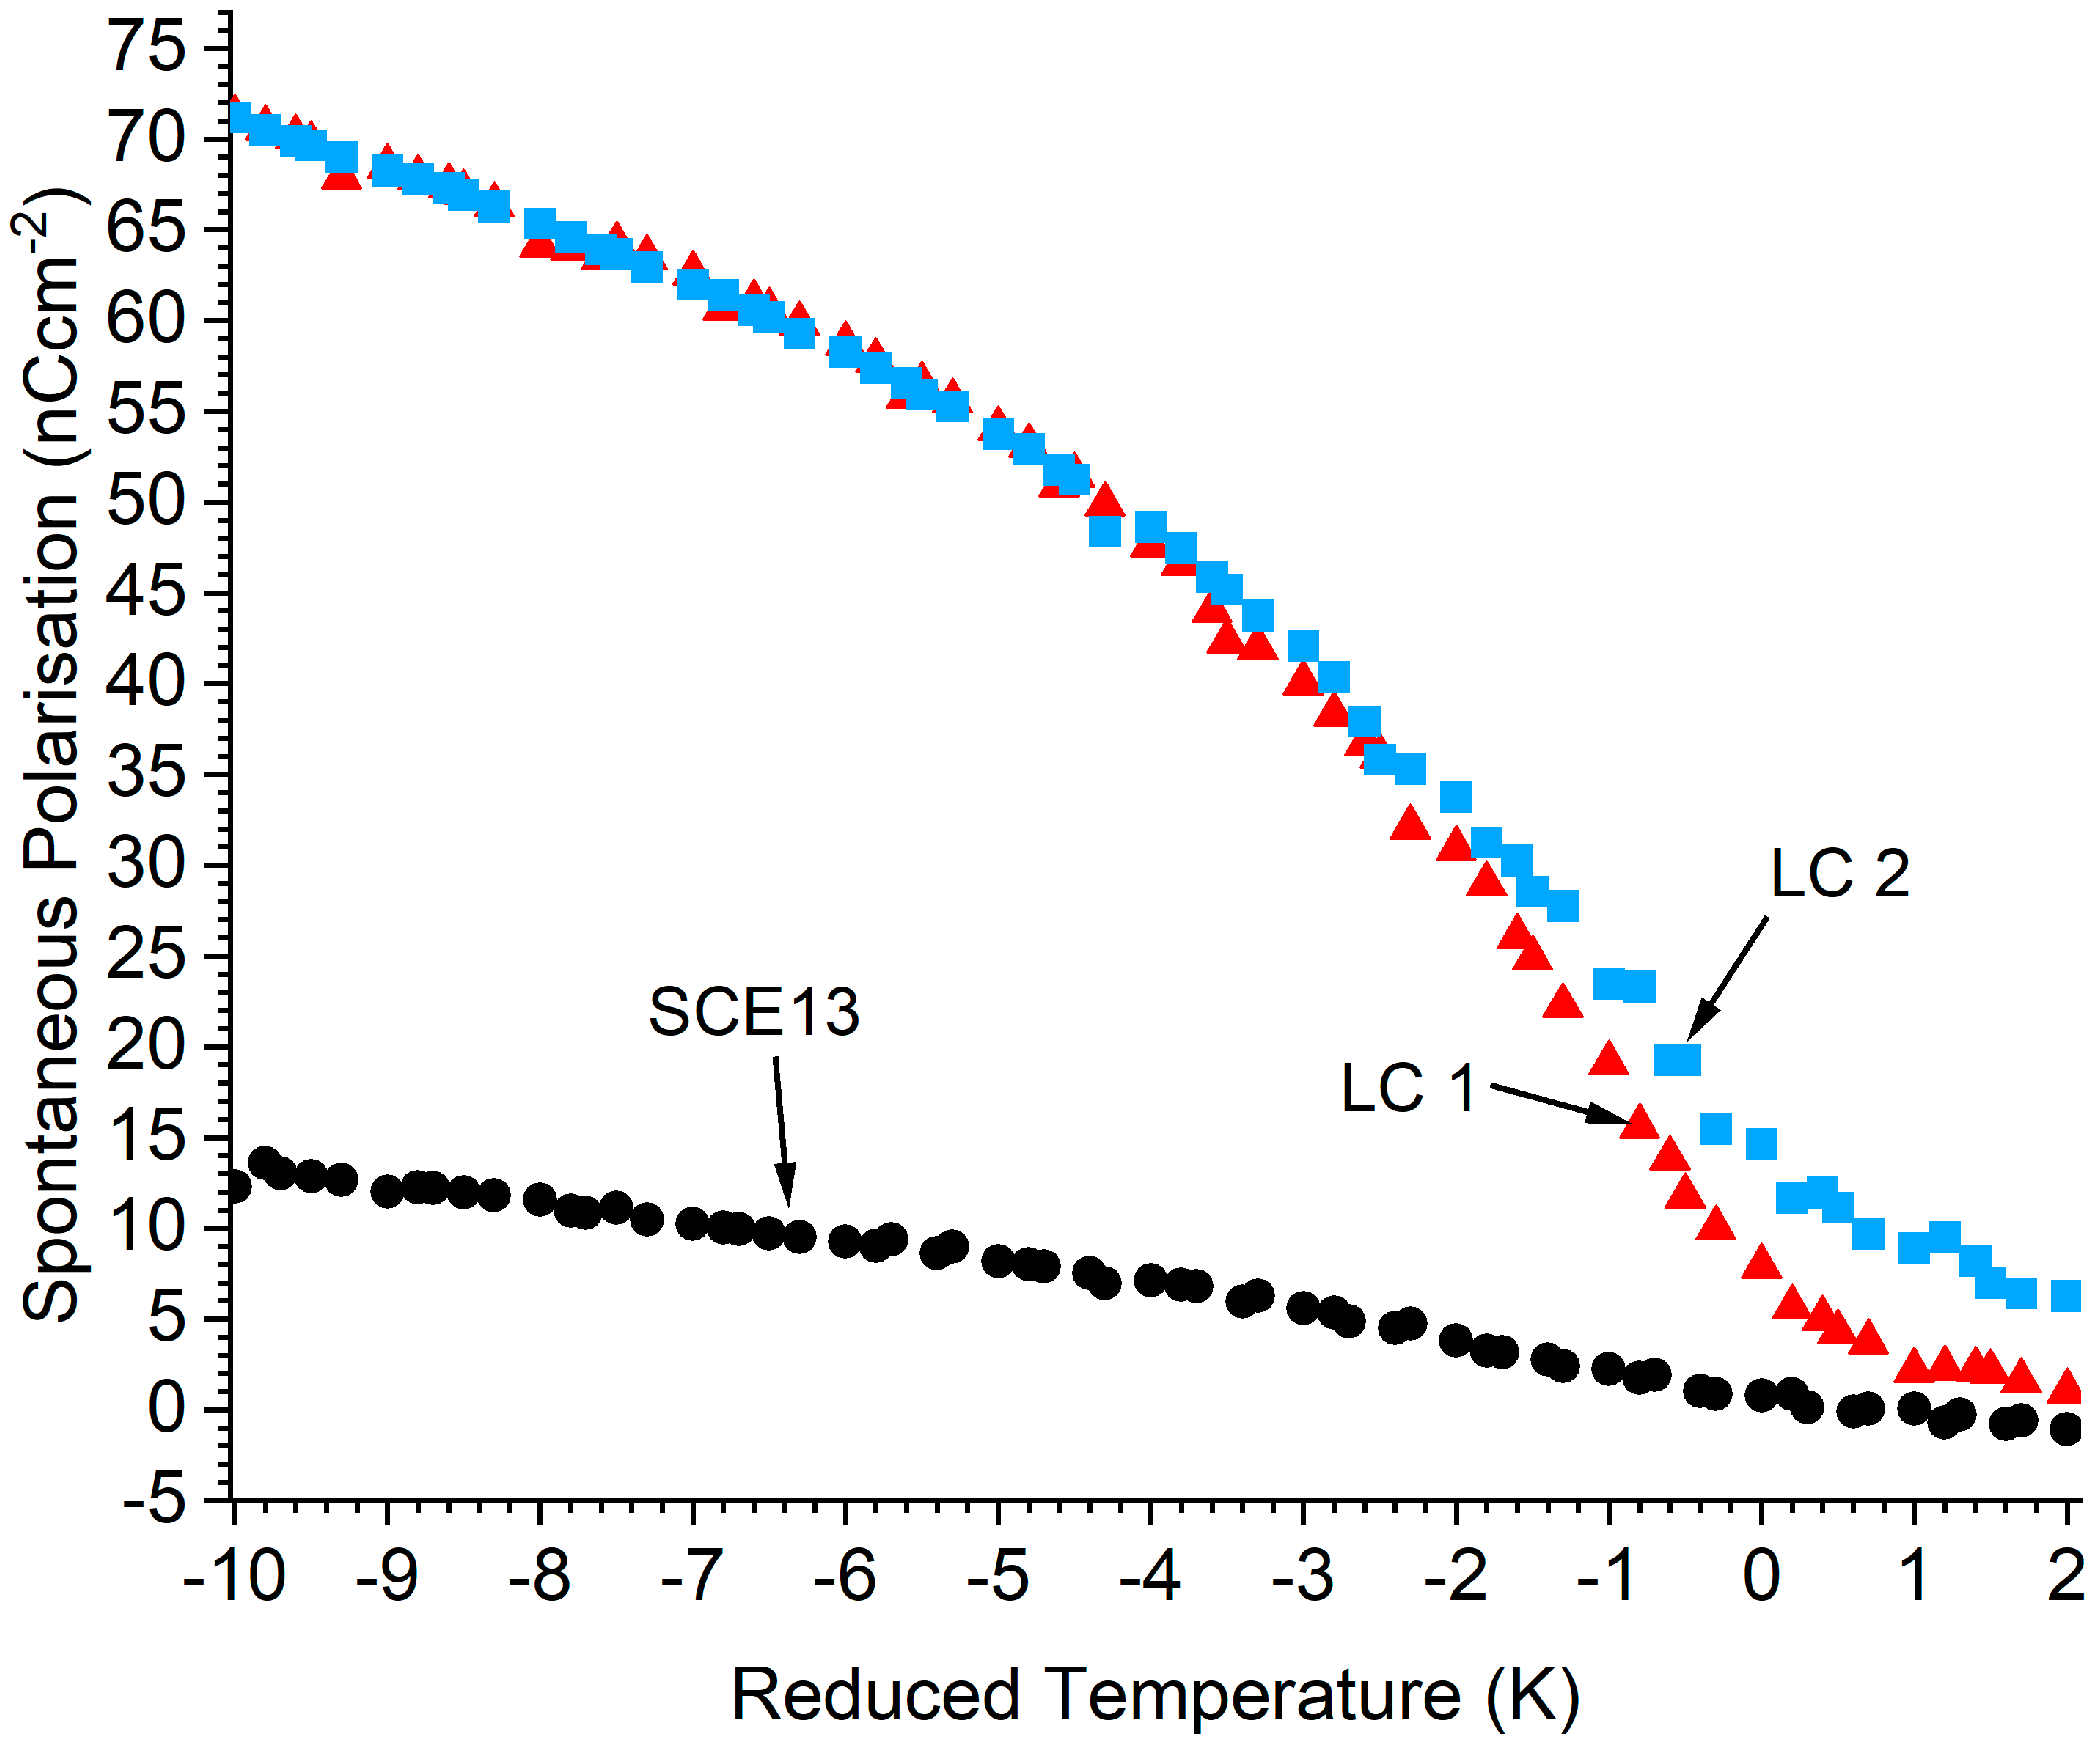
The spontaneous polarization determined using Equation (3) as a function of reduced temperature is shown in Figure 3 over the temperature range around the transition. SCE13 has the smallest absolute spontaneous polarization, taking a value of ~14 nC cm−2 at 10 K below the transition. The field-induced PS above TC is very small, below the sensitivity of our experiment, as would be expected from the very small electroclinic effect [38] known for SCE13. Both LC 1 and LC 2 show evidence of a significant field-induced PS above the phase transition, an extremely desirable phenomenon for electrocaloric applications, because this can extend the applicable temperature range. Both materials have a PS of approximately 71 nC cm−2 10 K below the transition, but as the rate of change is greater near the phase change for LC 1, a larger EC effect is expected.
3.3. Field-Induced Isothermal Entropy Change per Unit Volume
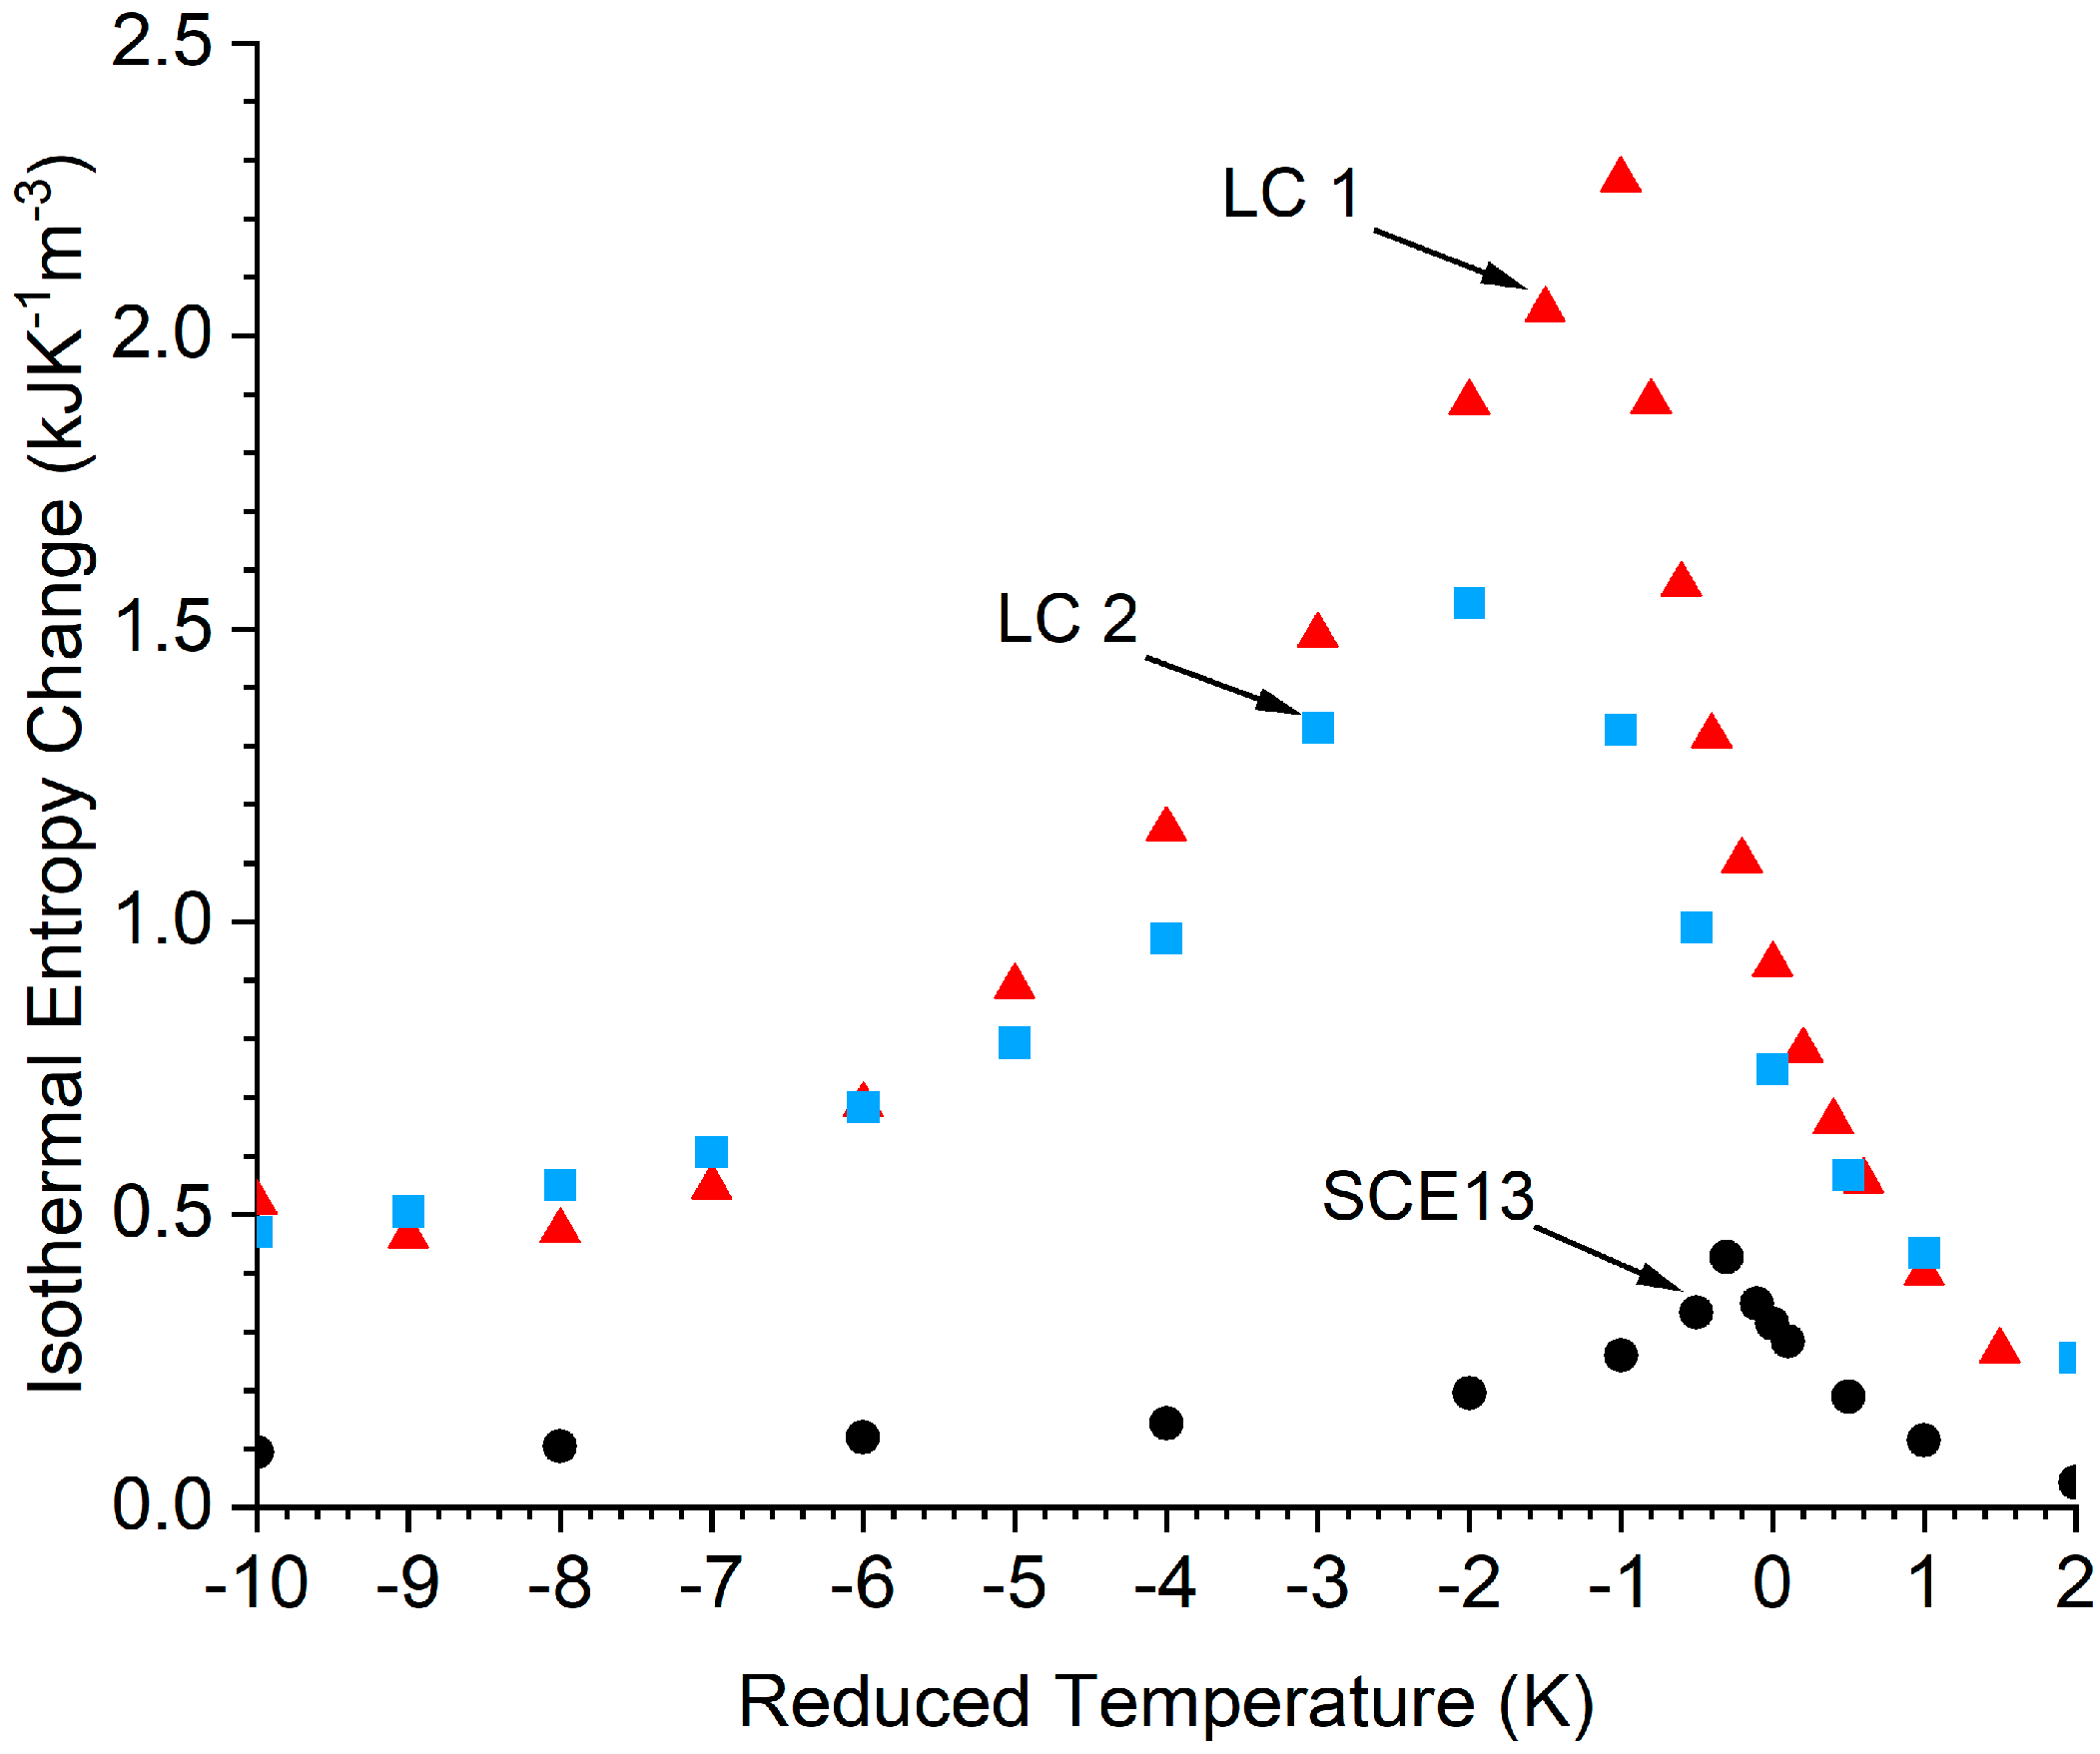
Figure 4 shows the peak isothermal entropy change per unit volume, V, , of the materials, determined using Equation (2), demonstrating the significantly better performance of LC 1 over that of the other systems considered. The maximum isothermal entropy change per unit volume of SCE13 is , less than 20% that of LC 1, which has a maximum of .
Although LC 1 and LC 2 have approximately the same value of PS, LC 1 performs ~25% better than LC 2. This is attributed to the more discontinuous TGBA–SmC*α transition in LC 1, which results in a larger at each field strength. The peak isothermal entropy changes of LC 1 and LC 2 occur at ~1 K and ~2 K, respectively, below the transition temperature. The temperature at which the maximum value occurs corresponds to the region where the gradient of the spontaneous polarisation, with respect to temperature, reaches a maximum for every electric field strength measured. These observations confirm the importance of the value of the parameter when considering which ferroelectric LCs will show the largest EC effect; although a large magnitude of PS is important, having a large gradient is vital. It is also important to consider the range over which a useful EC effect is available; real systems would typically need to operate over ~10 K. LC 1 maintains at least 90% of the value of its maximum entropy change over a 0.9 K range, while the useful range of LC 2 extends over 1.4 K, a noticeably wider temperature range.
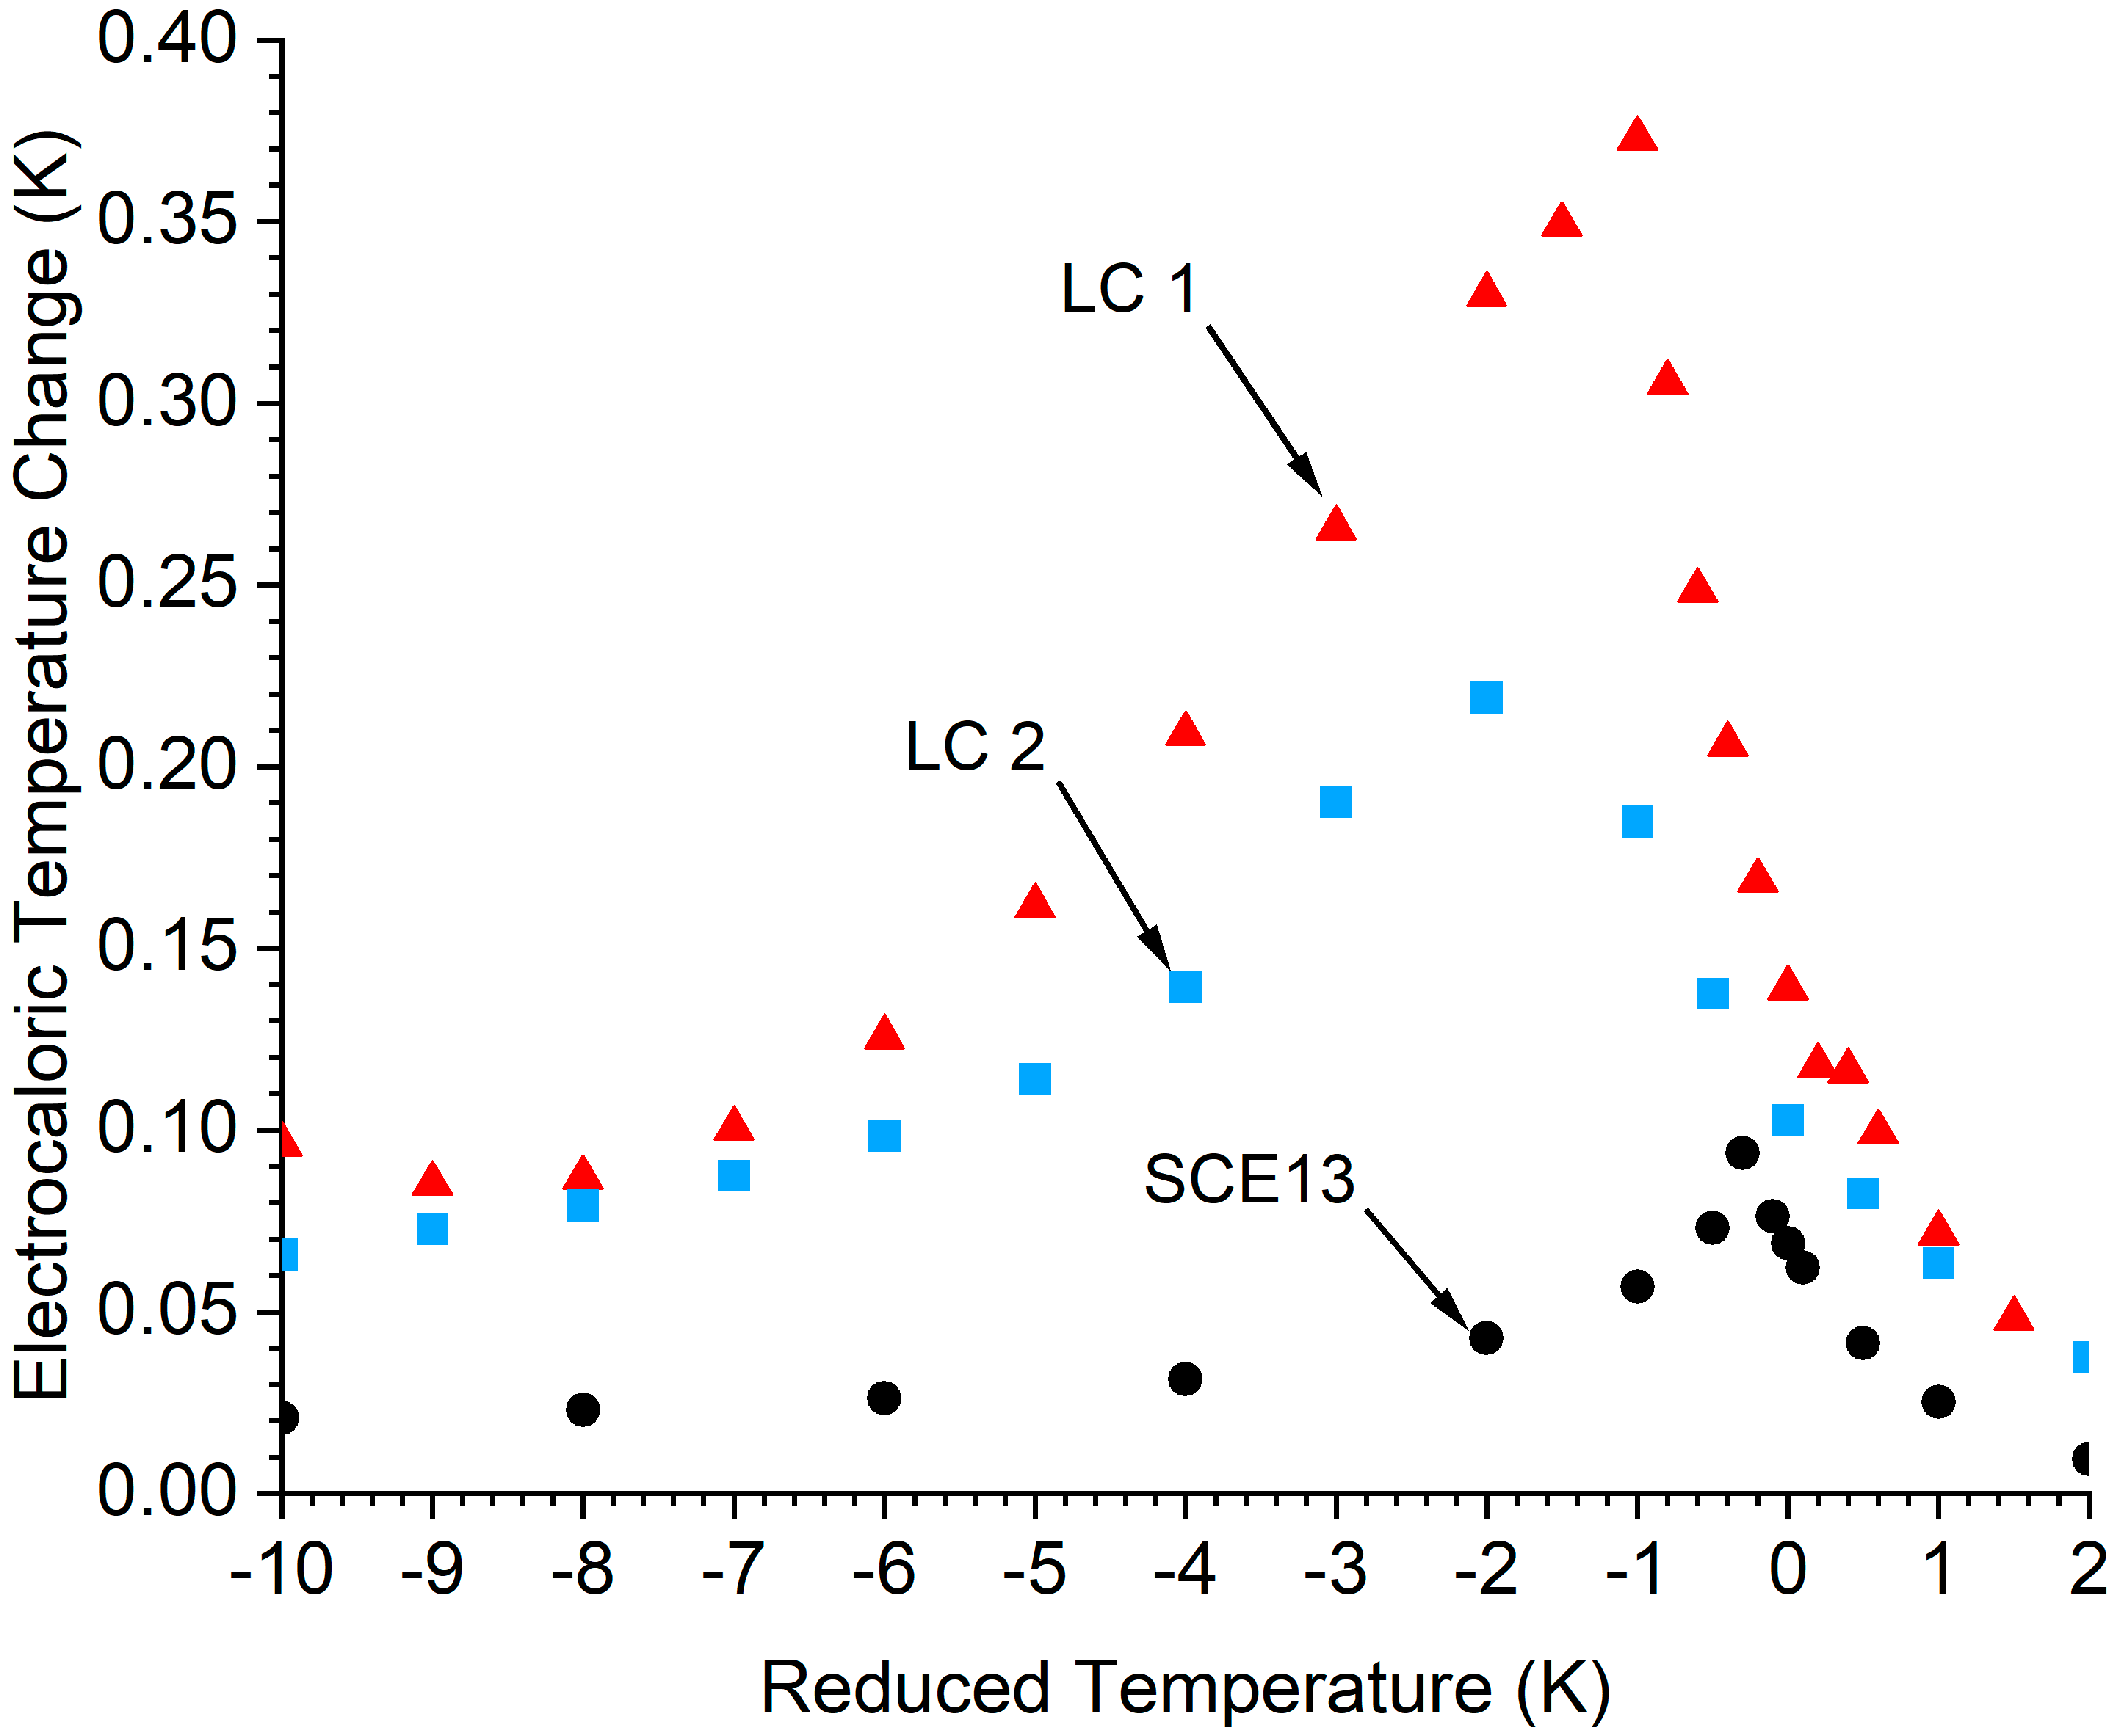
3.4. Electrocaloric Temperature Change
An indirect measurement of the EC temperature change, , was obtained by multiplying the isothermal entropy change per unit volume by the scaling factor (Equation (2), Figure 5). The importance of a low volumetric heat capacity can be seen in the relative differences in the maximum values for isothermal entropy, (Figure 4), and the EC temperature change (Figure 5). The lower heat capacity of SCE13 means that the electrocaloric temperature change is comparatively larger than the isothermal entropy change per unit volume alone would suggest. It is nonetheless still much smaller than the temperature change in LC 1 or LC 2 ( and , respectively). The lower heat capacity of LC 1 serves to enhance the induced temperature change compared to LC 2.
4. Discussion
Table 1 summarises the maximum values of the physical parameters relevant to the EC effect in the ferroelectric liquid crystals that are the subject of this paper and the few others reported elsewhere [10]. For comparison, the table also includes EC values for 12CB at the SmA–I transition [25] and for a solid-state ferroelectric ceramic device, which is currently considered state-of-the-art [39]. A figure of merit can be defined [40], , where is the field required to induce the maximum temperature change, , which offers a measure of the efficiency of the EC effect in different materials.
LC 1 shows the largest EC temperature change reported to date for a ferroelectric liquid crystal, , compared to , which was the maximum reported by Bsaibess et al. for the ferroelectric liquid crystal OB4HOB [10]. It can be seen that the main reason for the significant improvement seen for LC 1 over OB4HOB is the much higher heat capacity (7.1 MJ K−1m−3) and slightly smaller spontaneous polarization (~60 nC cm−2) of the latter material. Interestingly, the peak isothermal entropy change of OB4HOB can be estimated from data reported by Bsaibess et al. to be 3.1 kJ K−1 m−3, which is ~ 50% larger than that of LC 1. An additional important factor in the EC response is the gradient, , which is considerably larger for OB4HOB due to its first-order isotropic to SmC* phase transition (the Ps saturates 4 K below the transition temperature). LC 1 has a much smaller gradient, and subsequently, the induced entropy change over the same temperature range is smaller.
As mentioned, the heat capacity is an important factor. Indeed, the heat capacity of OB4HOB is over three-times larger than that of LC 1 at the temperature where the EC peak occurs, which results in a lower induced temperature change, , for a given isothermal entropy change Equation (2). Clearly, the heat capacity, saturated PS value, and the gradient of PS with respect to temperature must be compared in ferroelectric LCs to determine the overall suitability of materials with respect to their electrocaloric effect. It is also important that the indirect methodology employed here uses the heat capacity measured at zero field. As discussed in a recent review [12], not considering the field or temperature dependence results in the heat capacity being smeared and overestimated. Therefore, the indirectly measured temperature change reported in Figure 5 is an underestimate of the expected temperature change.
Both of the ferroelectric liquid crystal mixtures designed for display devices, SCE13 and FELIX-017/000, behave unsurprisingly modestly in terms of their EC potential. As materials that were designed for a completely different application, namely electro-optic devices, it was desirable to have a relatively low Ps, and the phase sequences were designed to allow good alignment to be obtained. The optical properties of such commercial mixtures were also important, with the ideal tilt angle of 22.5° being carefully engineered in them. Their figures of merit are very poor, a consequence of the low values of Ps.
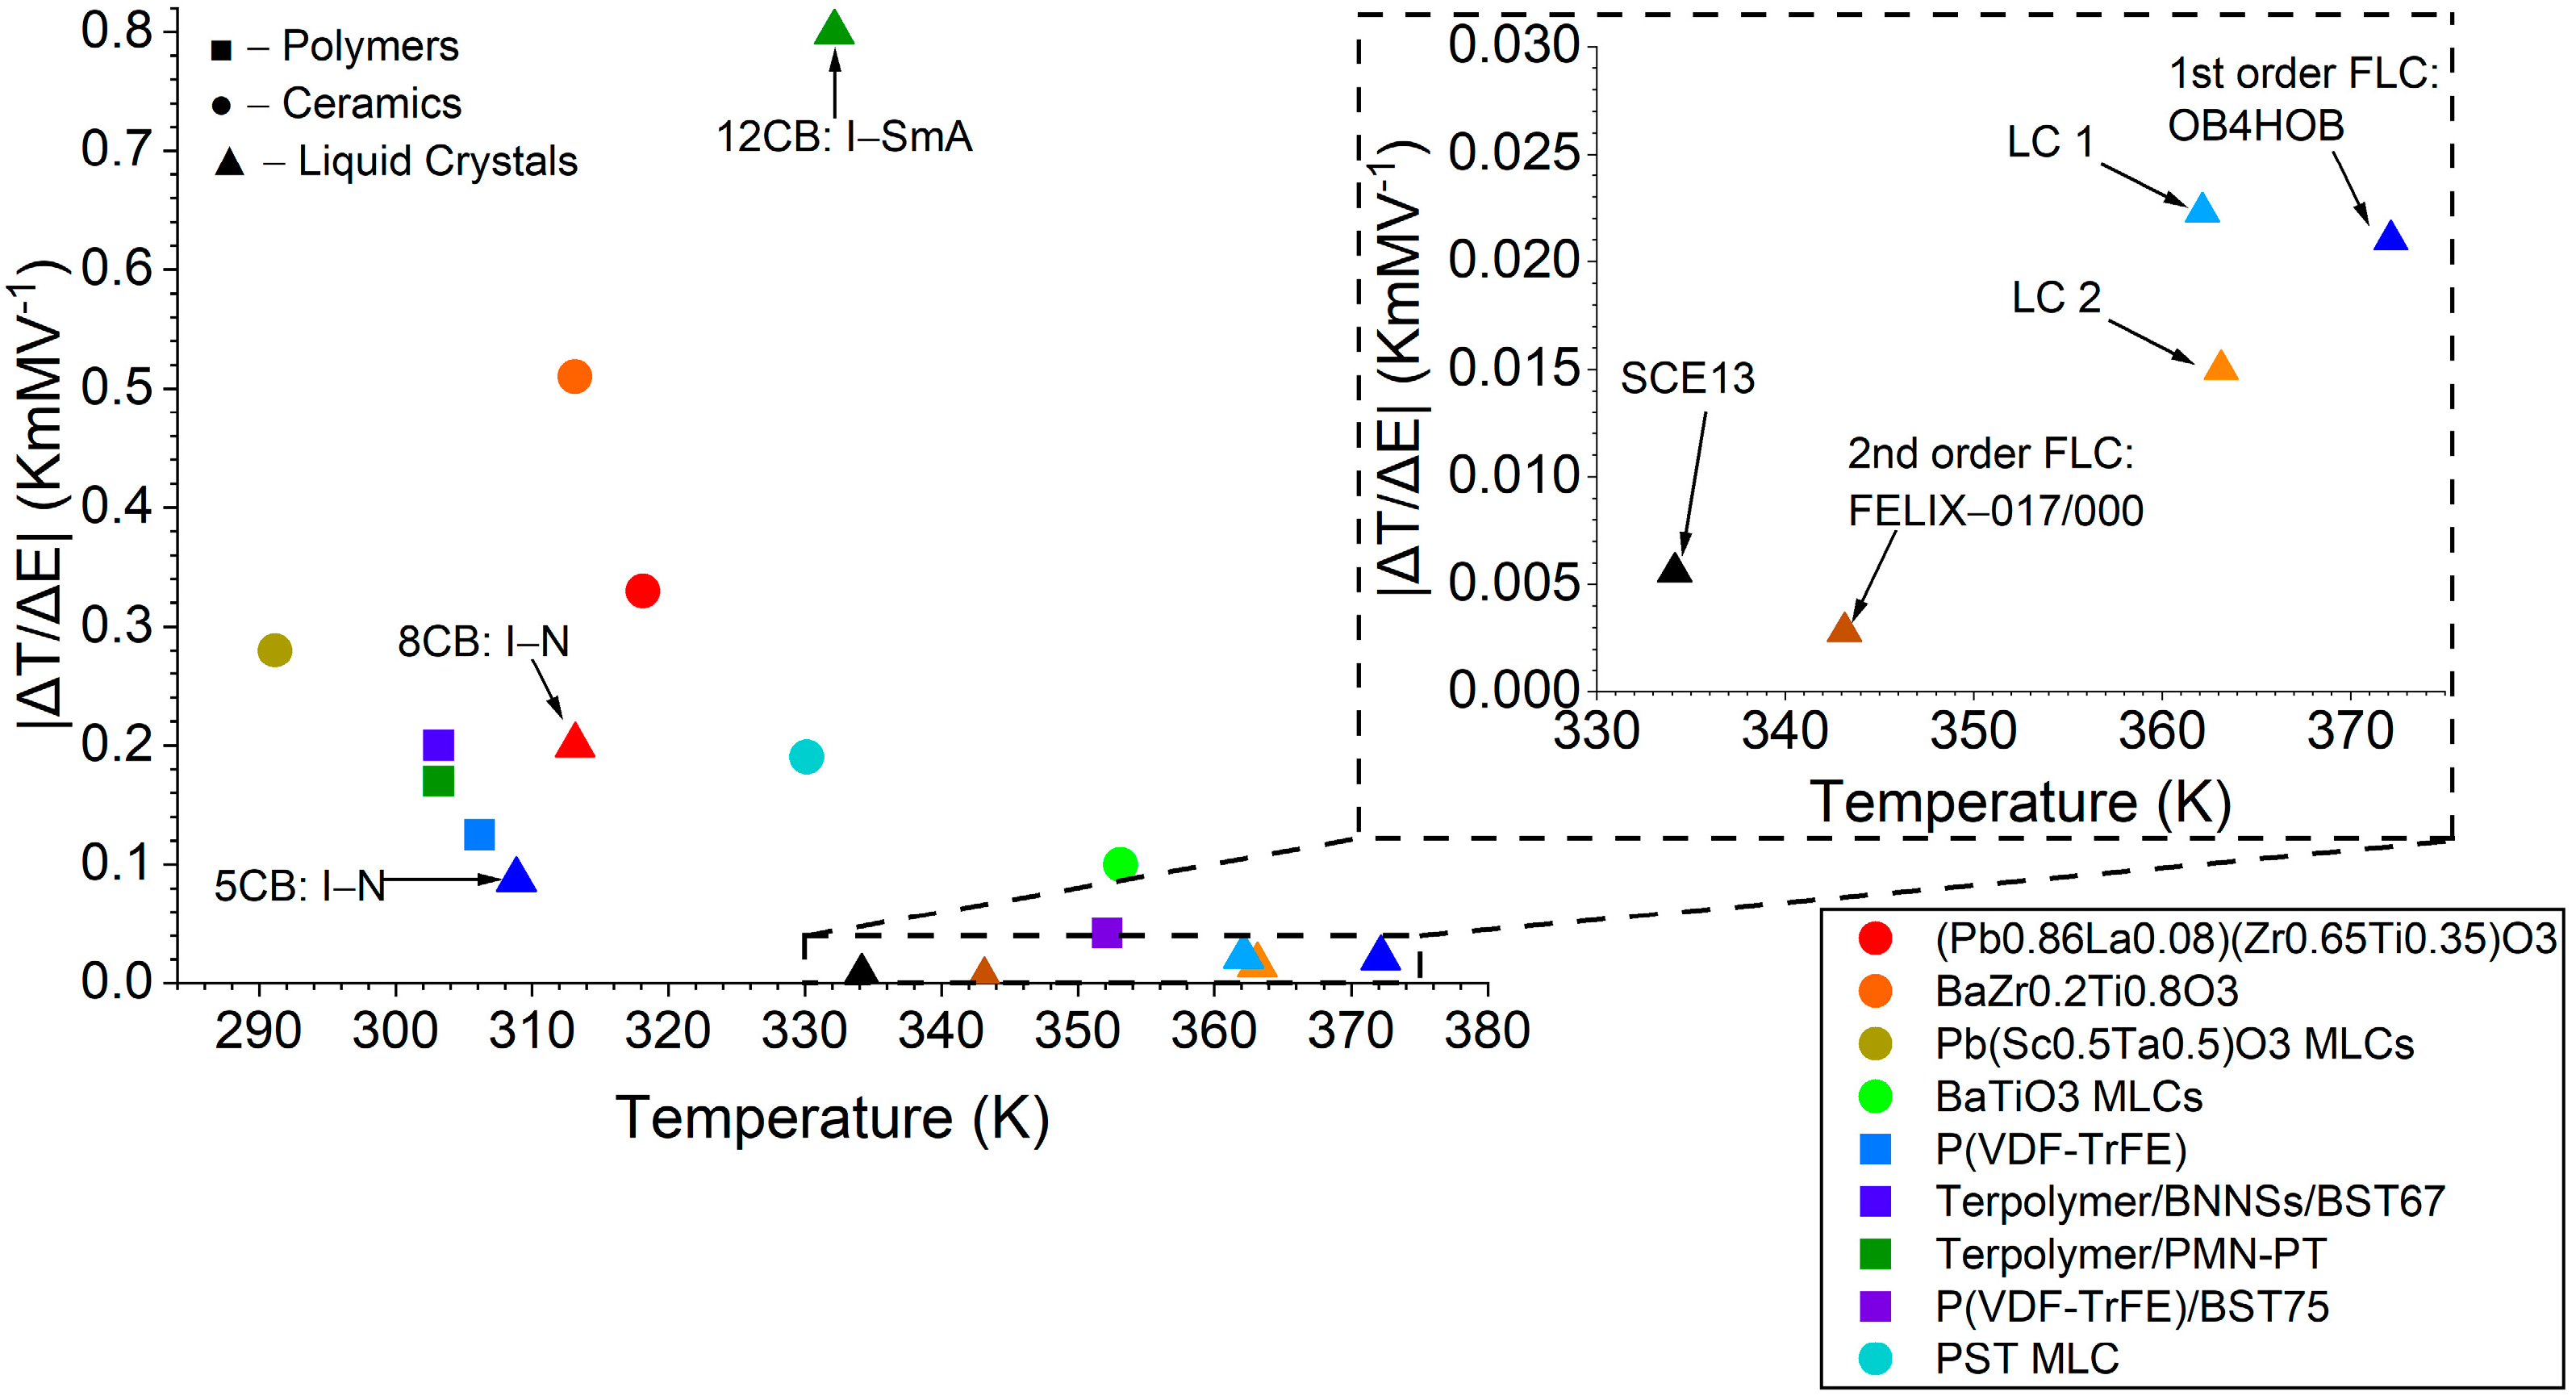
Although having a large gradient, , is clearly important in maximising , there are drawbacks to materials that reach maximum Ps over a shorter temperature range. Specifically, this will mean that the temperature span over which the electrocaloric effect decays is also smaller, giving such materials a poor useful range. Table 1 summarises this issue by considering the temperature range over which the electrocaloric temperature change remains greater than 90% of the peak temperature change, . As is shown in Figure 6, while the figure of merit, of OB4HOB is comparable to that of LC 1, for OB4HOB is a factor of 9 smaller than LC 1. The rate of decay of the electrocaloric effect as a function of temperature is an important quantity to consider for engineering purposes, as any electrocaloric refrigeration device must be able to operate over a broad temperature span. For comparison, lead scandium tantalate, PST, a ferroelectric ceramic, arranged in a multilayer capacitor, is also shown in Figure 6. This ceramic demonstrates an electrocaloric temperature change of 3 K over one of the broadest temperature ranges reported, 73 K [39]. Although the figures of merit for ferroelectric liquid crystals are only around an order of magnitude lower than the very best ceramic EC devices, their useful temperature range is not yet comparable.
It is appropriate to discuss briefly the liquid crystal system that performs best in terms of , 12CB. This system was mentioned in the Introduction, and it can be seen that the field-induced isotropic to SmA phase change offers an enormous figure of merit, , and a giant maximum induced temperature change, . Unfortunately, this exceptional EC performance is unsuitable for applications because of the very narrow useful temperature range, less than 0.1 K. Both the relatively large and narrow temperature range are due the physical phenomena behind the EC effect in this material, i.e., factors that electrically drive the isotropic to smectic transition. The absorption of latent heat as the LC transitions dominates the electrocaloric effect when inducing a liquid crystal phase [25]. Consequently, the effect is only significant across the isotropic–SmA coexistence region, which is extremely narrow in a pure material, with the effect reducing significantly on cooling further into the phase. Extending the very limited usable temperature range in this system to ~ 2 K has been achieved by extending the coexistence region by mixing nanoparticles into the LC [26].
One final, but important point for consideration in applications is the actual temperature at which the maximum electrocaloric effect occurs. Figure 6 shows for the materials considered in this paper together with selected ferroelectric ceramics and polymers [12,39], the ferroelectric LCs previously reported [10,39], and the cyanobiphenyl nematic liquid crystals 8CB and 12CB (where the entropy changes at the isotropic to liquid crystal transitions were considered) [25]. The temperature on the ordinate axis is that where was recorded. The specific application will determine whether or not a particular and temperature range of the EC effect is suitable, but it is noteworthy that engineering phase transition temperatures and physical properties across wide temperature ranges is well known in liquid crystals. For example, SCE13 was designed to have a ferroelectric phase from ~−20–60 °C to make it suitable for display applications, a relatively low Ps to optimise switching speed, and a tilt angle of 22.5° over a wide temperature range to optimise the optical contrast of electro-optic devices. Thus, provided FLCs are considered promising for EC applications and the design rules are known, one might expect them to be serious contenders in the future. In this case, despite the fact that LC 1 shows the largest normalized EC temperature change of any ferroelectric LC to date, it is evident that these materials are currently an order of magnitude less efficient, in terms of , than solid EC materials. Although a disappointing outcome, it is not a surprising one as the PS of FLCs is two or three orders of magnitude lower than that of solid ferroelectrics.
5. Conclusions
This work showed that for the development of ferroelectric LCs for the EC effect, both the isothermal entropy change and volumetric heat capacity must be considered. A large Ps and small heat capacity are clearly important, but the maximum EC temperature change coincides with the maximum gradient in spontaneous polarisation with respect to temperature, , bringing a new design rule to ferroelectric liquid crystals for this application. Furthermore, the variation in the gradient is the most significant factor affecting how the EC temperature change varies with temperature. Therefore, the development of new materials should focus on both maximising spontaneous polarisation and optimising the PS gradient to occur over the broadest temperature range without significantly reducing the EC temperature change. These are very different design considerations than were relevant to the development of FLC electro-optic devices with microsecond response times. We suggest that materials with a large PS designed for electroclinic devices would be interesting candidates for electrocaloric applications, but other systems have also been proposed, e.g., antiferroelectric bent-core liquid crystals [41]. However, it is clearly also important that the heat capacity of the LC material be considered; this changes by a factor of 3 even in the few liquid crystals we considered here. Finally, it is worth noting that although these current systems perform relatively poorly with respect to solid-state systems, the fact that we are considering fluids offers several significant advantages in electrocaloric applications. This is an exciting application area, especially in these times where sustainability and the efficiency of energy use are critical, and we demonstrated some important design considerations for developing liquid crystals for electrocaloric applications.
Author Contributions
Conceptualization, H.F.G. and P.J.T.; methodology, H.F.G. and P.J.T.; software, P.J.T.; validation, H.F.G. and P.J.T.; formal analysis, P.J.T.; investigation, P.J.T.; data curation, P.J.T.; writing—original draft preparation, P.J.T.; writing—review and editing, H.F.G. and P.J.T.; supervision, H.F.G.; project administration, H.F.G.; funding acquisition, H.F.G. All authors have read and agreed to the published version of the manuscript.
Funding
P.J.T. and H.F.G. acknowledge funding from the Engineering and Physical Sciences Research Council and from Merck Performance Materials Ltd. through a CASE award.
Institutional Review Board Statement
Not applicable.
Informed Consent Statement
Not applicable.
Data Availability Statement
The data associated with this paper are available from University of Leeds at https://0-doi-org.brum.beds.ac.uk/10.5518/1149.
Acknowledgments
P.J.T. and H.F.G. acknowledge the supply of materials from Merck Performance Materials Ltd.
Conflicts of Interest
The authors declare no conflict of interest.
References
- Kobenko, P.; Kurtschatov, J.Z. Dielektrische Eigenschaften der Seignettesalzkristalle. Z. Phys. 1930, 66, 192–205. [Google Scholar] [CrossRef]
- Lawless, W.N.; Morrow, A.J. Specific Heat and Electrocaloric Properties of a SrTiO3 Ceramic at Low Temperatures. Ferroelectrics 1977, 15, 159–165. [Google Scholar] [CrossRef]
- Lawless, W.N. Specific Heat and Electrocaloric Properties of KTaO3 at Low Temperatures. Phys. Rev. B 1977, 16, 433–439. [Google Scholar] [CrossRef]
- Greco, A.; Aprea, C.; Maiorino, A.; Masselli, C. A review of the state of the art of solid-state caloric cooling processes at room-temperature before 2019. Int. J. Refrig 2019, 106, 66–88. [Google Scholar] [CrossRef]
- Shi, J.Y.; Han, D.L.; Li, Z.C.; Yang, L.; Lu, S.G.; Zhong, Z.F.; Chen, J.P.; Zhang, Q.M.; Qian, X.S. Electrocaloric Cooling Materials and Devices for Zero-Global-Warming-Potential, High-Efficiency Refrigeration. Joule 2019, 3, 1200–1225. [Google Scholar] [CrossRef]
- Poachaiyapoom, A.; Leardkun, R.; Mounkong, J.; Wongwises, S. Miniature vapor compression refrigeration system for electronics cooling. Case Stud. Therm. Eng. 2019, 13, 100365. [Google Scholar] [CrossRef]
- He, J.; Wu, Y.T.; Chen, X.; Lu, Y.W.; Ma, C.F.; Du, C.X.; Liu, G.; Ma, R. Experimental study of a miniature vapor compression refrigeration system with two heat sink evaporators connected in series or in parallel. Int. J. Refrig 2015, 49, 28–35. [Google Scholar] [CrossRef]
- Mischenko, A.S.; Zhang, Q.; Scott, J.F.; Whatmore, R.W.; Mathur, N.D. Giant electrocaloric effect in thin-film PbZr0.95Ti0.05O3. Science 2006, 311, 1270–1271. [Google Scholar] [CrossRef] [Green Version]
- Neese, B.; Chu, B.J.; Lu, S.G.; Wang, Y.; Furman, E.; Zhang, Q.M. Large electrocaloric effect in ferroelectric polymers near room temperature. Science 2008, 321, 821–823. [Google Scholar] [CrossRef]
- Bsaibess, E.; Sahraoui, A.H.; Boussoualem, Y.; Soueidan, M.; Duponchel, B.; Singh, D.P.; Nsouli, B.; Daoudi, A.; Longuemart, S. Study of the electrocaloric effect in ferroelectric liquid crystals. Liq. Cryst. 2019, 46, 1517–1526. [Google Scholar] [CrossRef]
- Scott, J.F. Electrocaloric Materials. Annu. Rev. Mater. Res. 2011, 41, 229–240. [Google Scholar] [CrossRef]
- Liu, Y.; Scott, J.F.; Dkhil, B. Direct and indirect measurements on electrocaloric effect: Recent developments and perspectives. Appl. Phys. Rev. 2016, 3, 031102. [Google Scholar] [CrossRef] [Green Version]
- Moya, X.; Kar-Narayan, S.; Mathur, N.D. Caloric materials near ferroic phase transitions. Nat. Mater. 2014, 13, 439–450. [Google Scholar] [CrossRef] [PubMed]
- Olsen, R.B. Ferroelectric Conversion of Heat to Electrical Energy—A Demonstration. J. Energy 1982, 6, 91–95. [Google Scholar] [CrossRef]
- Plaznik, U.; Vrabelj, M.; Kutnjak, Z.; Malic, B.; Rozic, B.; Poredos, A.; Kitanovski, A. Numerical modelling and experimental validation of a regenerative electrocaloric cooler. Int. J. Refrig 2019, 98, 139–149. [Google Scholar] [CrossRef]
- Plaznik, U.; Kitanovski, A.; Rozic, B.; Malic, B.; Ursic, H.; Drnovsek, S.; Cilensek, J.; Vrabelj, M.; Poredos, A.; Kutnjak, Z. Bulk relaxor ferroelectric ceramics as a working body for an electrocaloric cooling device. Appl. Phys. Lett. 2015, 106, 043903. [Google Scholar] [CrossRef]
- Jia, Y.B.; Sungtaek, Y. A solid-state refrigerator based on the electrocaloric effect. Appl. Phys. Lett. 2012, 100, 242901. [Google Scholar] [CrossRef]
- Sette, D.; Asseman, A.; Gerard, M.; Strozyk, H.; Faye, R.; Defay, E. Electrocaloric cooler combining ceramic multi-layer capacitors and fluid. Apl. Mater. 2016, 4, 091101. [Google Scholar] [CrossRef]
- Gu, H.M.; Qian, X.S.; Li, X.Y.; Craven, B.; Zhu, W.Y.; Cheng, A.L.; Yao, S.C.; Zhang, Q.M. A chip scale electrocaloric effect based cooling device. Appl. Phys. Lett. 2013, 102, 122904. [Google Scholar] [CrossRef]
- Zhang, T.; Qian, X.S.; Gu, H.M.; Hou, Y.; Zhang, Q.M. An electrocaloric refrigerator with direct solid to solid regeneration. Appl. Phys. Lett. 2017, 110, 243503. [Google Scholar] [CrossRef]
- Wang, Y.D.; Smullin, S.J.; Sheridan, M.J.; Wang, Q.; Eldershaw, C.; Schwartz, D.E. A heat-switch-based electrocaloric cooler. Appl. Phys. Lett. 2015, 107, 134103. [Google Scholar] [CrossRef]
- Meng, Y.; Zhang, Z.Y.; Wu, H.X.; Wu, R.Y.; Wu, J.H.; Wang, H.L.; Pei, Q.B. A cascade electrocaloric cooling device for large temperature lift. Nat. Energy 2020, 5, 996–1002. [Google Scholar] [CrossRef]
- Lelidis, I.; Durand, G. Electrothermal effect in nematic liquid crystal. Phys. Rev. Lett. 1996, 76, 1868–1871. [Google Scholar] [CrossRef] [PubMed]
- Qian, X.S.; Lu, S.G.; Li, X.Y.; Gu, H.M.; Chien, L.C.; Zhang, Q.M. Large Electrocaloric Effect in a Dielectric Liquid Possessing a Large Dielectric Anisotropy Near the Isotropic-Nematic Transition. Adv. Funct. Mater. 2013, 23, 2894–2898. [Google Scholar] [CrossRef]
- Klemencic, E.; Trcek, M.; Kutnjak, Z.; Kralj, S. Giant electrocaloric response in smectic liquid crystals with direct smectic-isotropic transition. Sci. Rep. 2019, 9, 1721. [Google Scholar] [CrossRef] [PubMed]
- Trček, M.; Lavrič, M.; Cordoyiannis, G.; Zalar, B.; Rožič, B.; Kralj, S.; Tzitzios, V.; Nounesis, G.; Kutnjak, Z. Electrocaloric and elastocaloric effects in soft materials. Philos. Trans. R. Soc. A-Math. Phys. Eng. Sci. 2016, 374, 1–11. [Google Scholar] [CrossRef]
- Kutnjak, Z.; Rožič, B.; Pirc, R. Electrocaloric Effect: Theory, Measurements, and Applications. In Wiley Encyclopedia of Electrical and Electronics Engineering; Webster, J.G., Ed.; John Wiley & Sons: Hoboken, NJ, USA, Online; 2015; pp. 1–19. [Google Scholar] [CrossRef] [Green Version]
- Robinson, W.K.; Miller, R.J.; Gleeson, H.F.; Hird, M.; Seed, A.J.; Styring, P. Antiferroelectricity in Novel Liquid Crystalline Materials. Ferroelectrics 1996, 178, 237–247. [Google Scholar] [CrossRef]
- Mills, J.T.; Gleeson, H.F.; Goodby, J.W.; Hird, M.; Seed, A.; Styring, P. X-ray and optical studies of the tilted phases of materials exhibiting antiferroelectric, ferrielectric and ferroelectric mesophases. J. Mater. Chem. 1998, 8, 2385–2390. [Google Scholar] [CrossRef]
- Hirst, L.S.; Watson, S.J.; Gleeson, H.F.; Cluzeau, P.; Barois, P.; Pindak, R.; Pitney, J.; Cady, A.; Johnson, P.M.; Huang, C.C.; et al. Interlayer structures of the chiral smectic liquid crystal phases revealed by resonant x-ray scattering. Phys. Rev. E 2002, 65, 041705. [Google Scholar] [CrossRef]
- Rao, N.V.S.; Pisipati, V.G.K.M.; Alapati, P.R.; Potukuchi, D.M. Density Studies in TerephthalyIidene-bis-p-n-dodecylaniline. Mol. Cryst. Liq. Cryst. 1988, 162, 119–125. [Google Scholar]
- Kiefer, R.; Baur, G. Density Studies on Various Smectic Liquid Crystals. Liq. Cryst. 1990, 7, 815–837. [Google Scholar] [CrossRef]
- Lakshminarayana, S.; Prabhu, C.R.; Potukuchi, D.M.; Rao, N.V.S.; Pisipati, V.G.K.M. Pretransitional effects at the isotropic mesomorphic phase transitions in the TBAA series. Liq. Cryst. 1996, 20, 177–182. [Google Scholar] [CrossRef]
- Leadbetter, A.J.; Durrant, J.L.A.; Rugman, M. Density of 4 n-Octyl-4-Cyano-Biphenyl (8CB). Mol. Cryst. Liq. Cryst. 1977, 34, 231–235. [Google Scholar] [CrossRef]
- Lagarde, M.P. Direct Electrical Measurement of Permanent Polarization of a Ferroelectric Chiral Smectic C Liquid-Crystal. J. Phys. Lett. 1977, 38, L17–L19. [Google Scholar] [CrossRef]
- Patel, J.S.; Lee, S.D.; Goodby, J.W. Electric Field Induced Layer Reorientation in Ferroelectric Liquid-Crystals. Phys. Rev. A 1989, 40, 2854–2856. [Google Scholar] [CrossRef]
- Srajer, G.; Pindak, R.; Patel, J.S. Electric Field Induced Layer Reorientation in Ferroelectric Liquid-Crystals—An X-Ray Study. Phys. Rev. A 1991, 43, 5744–5747. [Google Scholar] [CrossRef]
- Garoff, S.; Meyer, R.B. Electroclinic Effect at AC Phase-Change in a Chiral Smectic Liquid-Crystal. Phys. Rev. Lett. 1977, 38, 848–851. [Google Scholar] [CrossRef]
- Nair, B.; Usui, T.; Crossley, S.; Kurdi, S.; Guzman-Verri, G.G.; Moya, X.; Hirose, S.; Mathur, N.D. Large electrocaloric effects in oxide multilayer capacitors over a wide temperature range. Nature 2019, 575, 468–472. [Google Scholar] [CrossRef]
- Li, J.J.; Li, J.T.; Wu, H.H.; Qin, S.Q.; Su, X.P.; Wang, Y.; Lou, X.J.; Guo, D.; Su, Y.J.; Qiao, L.J.; et al. Giant Electrocaloric Effect and Ultrahigh Refrigeration Efficiency in Antiferroelectric Ceramics by Morphotropic Phase Boundary Design. ACS Appl. Mater. Interfaces 2020, 12, 45005–45014. [Google Scholar] [CrossRef]
- Saha, R.; Feng, C.R.; Eremin, A.; Jakli, A. Antiferroelectric Bent-Core Liquid Crystal for Possible High-Power Capacitors and Electrocaloric Devices. Crystals 2020, 10, 652. [Google Scholar] [CrossRef]
Figure 1.
The phase transitions (measured on cooling) for all three materials studied, together with the chemical structure of LC 1 and LC 2. The notation of the phases is as defined in the text, with the following: Cr is crystal; SmC*Fi1 is the 3-layer intermediate phase; SmC*Fi2 is the 4-layer intermediate phase; SmC*A is the antiferroelectric phase.

Figure 2.
Volumetric heat capacity () (MJ K−1 m−3) measured from 2 K above to 10 K below the transition into the ferroelectric phase for each material. The critical temperature was defined as the peak in the heat capacity for each material. For SCE13 (black circles, the peak occurs across the SmA–SmC* transition. For LC 1 (red triangles), the peak occurs across the TGBA–SmCα* transition, and for LC 2 (blue squares), the peak is across the SmA–SmCα* transition. In LC 1 and LC 2, the SmCα*–SmC* transition is marked using dotted and dashed lines (LC 1 and LC 2, respectively).

Figure 3.
Maximum spontaneous polarisation (PS) measured as a function of reduced temperature relative to the SmA–SmC* transition for SCE13 (black circles), TGBA–SmCα* for LC 1 (red triangles), and SmA–SmCα* for LC 2 (blue squares). The uncertainty in PS = ±1 nC cm−2. LC 1 shows a discontinuous transition, while LC 2 and SCE13 show a continuous transition.

Figure 4.
Isothermal entropy change per unit volume as a function of reduced temperature determined using Equation (1). The results for SCE13 and LC 1 are for an effective field of 16 V µm−1, and an effective field of 14 V µm−1 for LC 2. The peak position of SCE13 (black circles) is ~−0.3 K; for LC 1 (red triangles), the peak position is ~−1 K; for LC 2 (blue squares), the peak position is ~ −2 K.

Figure 5.
Indirect measurement of the electrocaloric temperature change as a function of reduced temperature for a field strength of 16 V µm−1 SCE13 (black circles) and LC 1 (red triangles) and 14 V µm−1 for LC 2 (blue squares). The peak position occurs at reduced temperatures of ~−0.3 K (SCE13), ~−1 K (LC 1), and ~−2 K (LC 2).

Figure 6.
The EC figure of merit, , plotted as a function of the temperature at which the maximum EC effect was recorded. Results for LCs (triangles and labelled) and a sample of solid EC materials, including polymers (circles) and ceramics [12,39] (squares), are shown. Data for 8CB and 12CB [25] and previously reported ferroelectric LCs [10] are also shown for comparison. The inset graph is an expansion of the dotted rectangle between 330 K and 375 K that expands the region containing ferroelectric LCs.


Table 1.
The maximum spontaneous polarisation (PS), volumetric heat capacity (CE), maximum EC temperature change (Tmax), figure of merit, and temperature range over which the electrocaloric temperature change remains greater than 90% of the peak temperature change, for the materials studied in this paper and other systems chosen for comparison. The ferroelectric materials FELIX-017/000 and OB4HOB [10] were studied by Bsaibess et al., while Klemenčič et al. induced a temperature change at the isotropic to SmA phase transition in 12CB [25]. The ferroelectric ceramic, lead scandium tantalate, PST, [39] arranged in a multilayer capacitor MLC is also included. The temperature changes for 12CB and PST are direct measurements, and all other measurements are indirect.
| Material | PS (nC cm−2) | CE (MJ K−1 m−3) | ΔTmax (K) | ΔTmax/ΔE (K m MV−1) | Range Where ΔTEC/ΔTECmax > 0.9 (K) |
|---|---|---|---|---|---|
| SCE13 | 26 | 1.6 | 0.09 | 0.006 | 0.2 |
| LC 1 | 71 | 2.3 | 0.37 | 0.022 | 0.9 |
| LC 2 | 71 | 2.6 | 0.22 | 0.016 | 1.4 |
| FELIX-017/000 | 25 | 3.5 | 0.023 | 0.003 | 1.0 |
| OB4HOB | 60 | 7.1 | 0.17 | 0.021 | 0.1 |
| 12CB: I-SmA | - | - | 6.5 | 0.8 | <0.1 |
| PST MLC (Ferroelectric ceramic) | 30,000 | 2.7 | 3.3 | 0.19 | 73 |
Publisher’s Note: MDPI stays neutral with regard to jurisdictional claims in published maps and institutional affiliations. |
© 2022 by the authors. Licensee MDPI, Basel, Switzerland. This article is an open access article distributed under the terms and conditions of the Creative Commons Attribution (CC BY) license (https://creativecommons.org/licenses/by/4.0/).
Share and Cite
MDPI and ACS Style
Tipping, P.J.; Gleeson, H.F. Ferroelectric Smectic Liquid Crystals as Electrocaloric Materials. Crystals 2022, 12, 809. https://0-doi-org.brum.beds.ac.uk/10.3390/cryst12060809
AMA Style
Tipping PJ, Gleeson HF. Ferroelectric Smectic Liquid Crystals as Electrocaloric Materials. Crystals. 2022; 12(6):809. https://0-doi-org.brum.beds.ac.uk/10.3390/cryst12060809
Chicago/Turabian StyleTipping, Peter John, and Helen Frances Gleeson. 2022. "Ferroelectric Smectic Liquid Crystals as Electrocaloric Materials" Crystals 12, no. 6: 809. https://0-doi-org.brum.beds.ac.uk/10.3390/cryst12060809
Note that from the first issue of 2016, this journal uses article numbers instead of page numbers. See further details here.