2. Materials and Methods
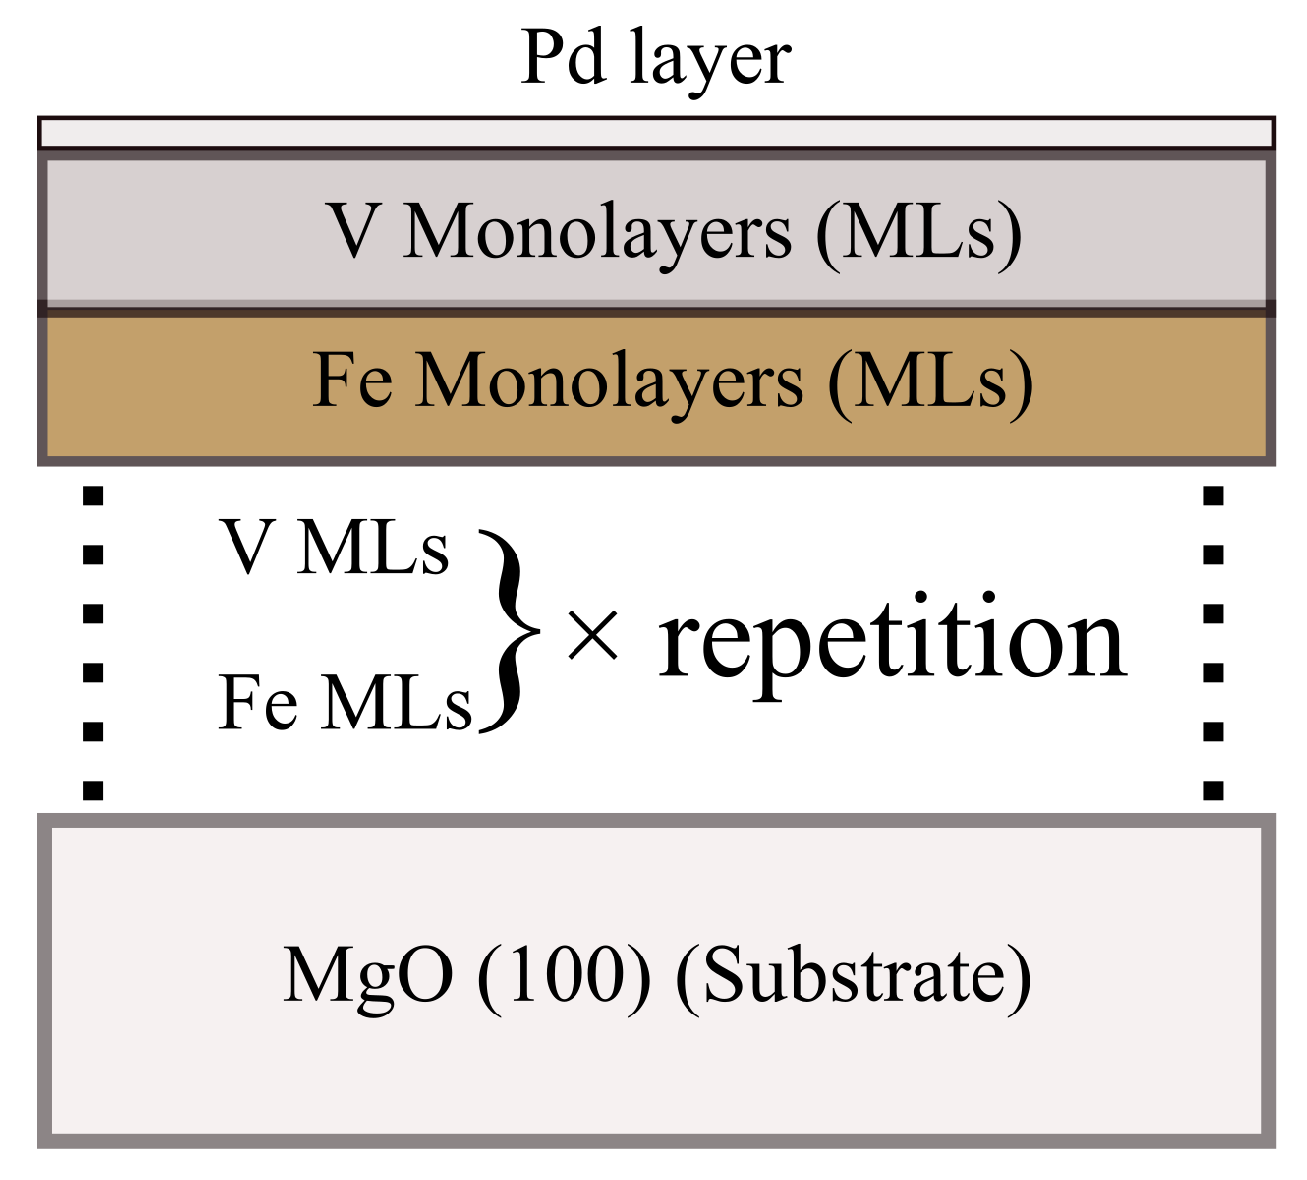
The Fe/V superlattices were grown in a custom-built DC magnetron sputtering chamber (Reykjavík, Iceland) on MgO (100) substrates held at 473 K. Base pressure of the chamber was below 10 Pa. Before sputtering, the MgO substrates were annealed for 30 min at 873 K and targets were pre-sputtered until a stable current was obtained. The Ar gas (99.999% purity) was held at 3.99 × Pa during deposition. The deposition rates were 0.38 Å/s and 0.33 Å/s for Fe- and V-layers, respectively, as calibrated using X-ray reflectivity (XRR). A ceramic boron-nitride plate heater was used to heat the sample on the rear side, in the distance from the heater by 7 mm. The applied power on the sputtering target was 70 W, 100 W and 50 W for Fe-, V- and Pd- target, respectively.
The superlattices were grown alternatively with metallic Fe- followed by V-layers under a certain repeating sequence. At room temperature (RT, 300 K), the lattice constants of the body-centred cubic (bcc) structure of Fe, V atoms and the face-centred cubic (fcc) structure of MgO are 0.287 nm, 0.303 nm and 0.421 nm, respectively. Rotating the bcc structures of the Fe and V atoms by 45
with respect to the MgO [100] axis, the lattice mismatches were reduced to ∼4% and 2% for bcc Fe- and V-layers, respectively [
19]. The superlattices are noted as X(Fe)/Y(V) × Z, where X, Y and Z represent the number of MLs of iron and vanadium, and repetition periods, respectively. Four superlattice samples, namely 16/16 × 13, 8/16 × 13, 4/16 × 25 and 8/8 × 25, were grown, with a thickness ≥70 nm for the ion-beam in order to avoid implantation into the MgO substrate during eMS measurements. In addition, a pure V-layer was grown directly on the substrate as a metallic vanadium sample. To prevent superlattices from oxidation, a top Pd layer 3.5 nm thick was deposited on each Fe/V superlattice sample at RT at the end of the growth.
Figure 1 gives a schematic of the superlattice structure.
The crystal structures of the superlattices were characterised with X-ray diffraction (XRD) and XRR with a Panalytical X’pert diffractometer (Cu Ka radiation wavelength of 0.15406 nm) mounted with a hybrid monochromator/mirror on the incident side and a 0.27 collimator on the diffraction side (Eindhoven, Netherlands). XRD scans were measured for the superlattice Fe/V (200) in high-angle region (–). Low angle XRR measurements were used to calibrate the growth rate of individual layer and then to characterize the quality of the superlattice structure.
Fe
eMS was performed at the ISOLDE facility at CERN (Geneva, Switzerland) following implantation of radioactive
Mn
(
s) through
-decay to
Fe
(
ns) 14.4 keV gamma rays. Beams of
Mn
ions were produced by 1.4 GeV proton-induced fission of uranium in a heated UCx target and element selective extraction using multi-photon laser ionization [
20]. After acceleration to 50 keV and through the magnetic mass separation, a pure beam of 2 × 10
Mn
/s was obtained and implanted at RT into the sample held in a vacuum chamber (∼10
Pa), at an incident angle (
) of 30
relative to the surface normal of the sample. The maximum implantation fluence is ca. 1 × 10
Mn
/cm
, <10
at.% to ensure the dilute concentration regime and avoid overlapping damage cascades. The eMS spectra were recorded using a parallel plate resonance detector containing enriched
Fe
stainless steel electrodes. The intrinsic line-shape of the detector was a Voigt profile with Lorentzian broadening of
mm/s and Gaussian broadening of
0.08 mm/s. The detector was mounted 90
relative to the beam. This gives an emission angle
(relative to the surface normal of the sample). The 8/8 × 25 sample was measured additionally at
where the sample was rotated after implantation and measured during the decay of
Mn
. Each spectrum was constantly recorded for several minutes with sufficient statistics needed for the fitting procedures.
CEMS measurement was performed at RT by mounting the sample in a parallel plate avalanche detector filled with acetone gas at 2500 Pa and applied voltage set at ∼1 kV [
21] (intrinsic Voigt line-shape of this detector has
of 0.10 mm/s and
of 0.05 mm/s). Samples were measured at an emission angle
(with the sample surface normal facing the source). The 16/16 × 13 sample was measured additionally at
.
Velocities and isomer shifts are calibrated relative to
-Fe at RT. Note that the velocity scale of the eMS spectra (usually inverted relative to CEMS spectra) has been interchanged to allow a direct visual comparison with the CEMS spectra in this paper. The spectra were analysed by a simultaneous fitting method using the analysis code Vinda [
22].
3. Results and Analysis
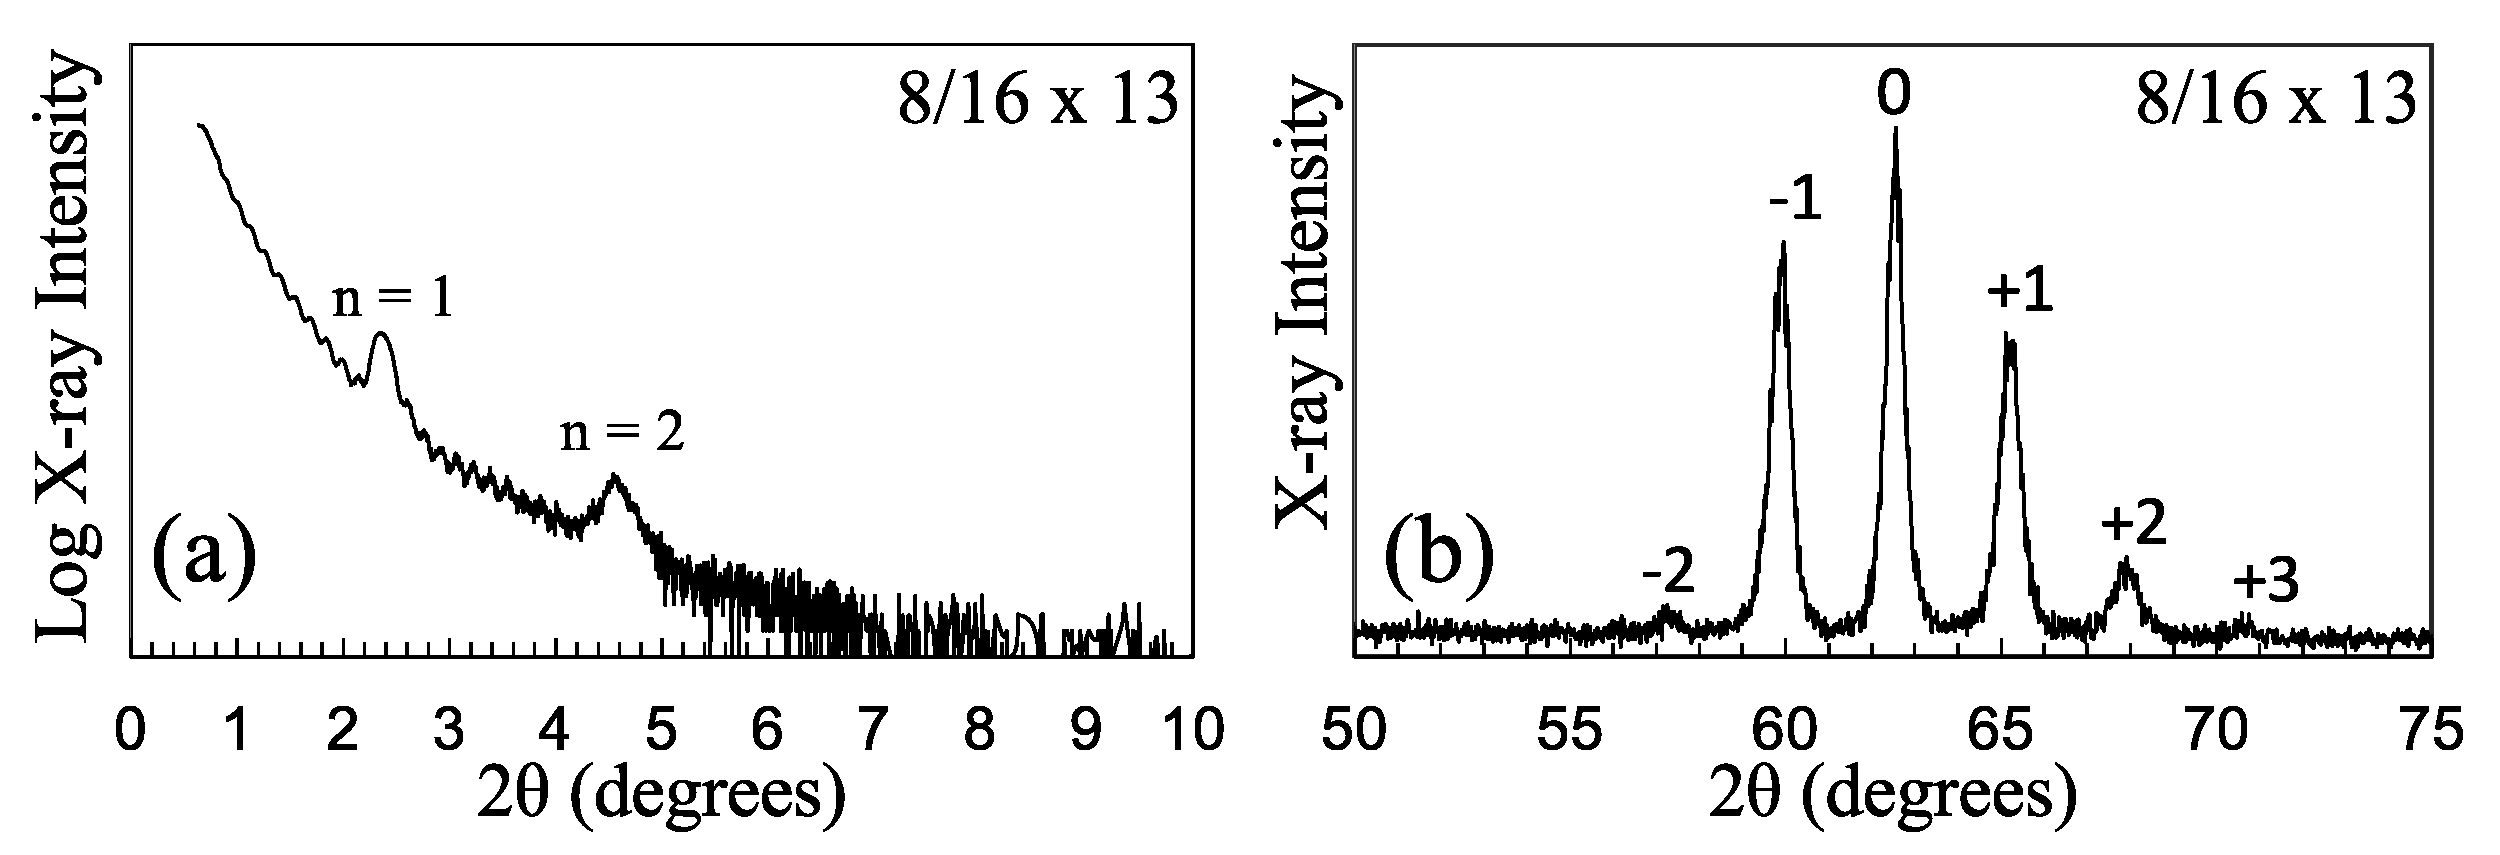
Figure 2 shows representative XRR low-angle (a) and XRD high-angle (b) spectra of the 8/16 × 13 sample, which proves the good single crystalline structure and the interface quality achieved [
4].
Simulation of the XRR low-angle spectra gave an interface quality or roughness of ±2 ML for all the Fe/V superlattices. The broadened second order superlattice peak as compared to the first order peak in XRR spectrum (n = 2 and 1 see
Figure 1) suggests that the superlattices have an improved interface sharpness and a reduced inter-diffusion. Interface diffusions in the Fe/V superlattices would have caused the second and the first order superlattice peaks to have the similar full width at half maximum [
23]. With a more precise local probe in eMS, the interface structure and the magnetic properties of the Fe/V superlattices can be further investigated based on the hyperfine magnetic field distribution.
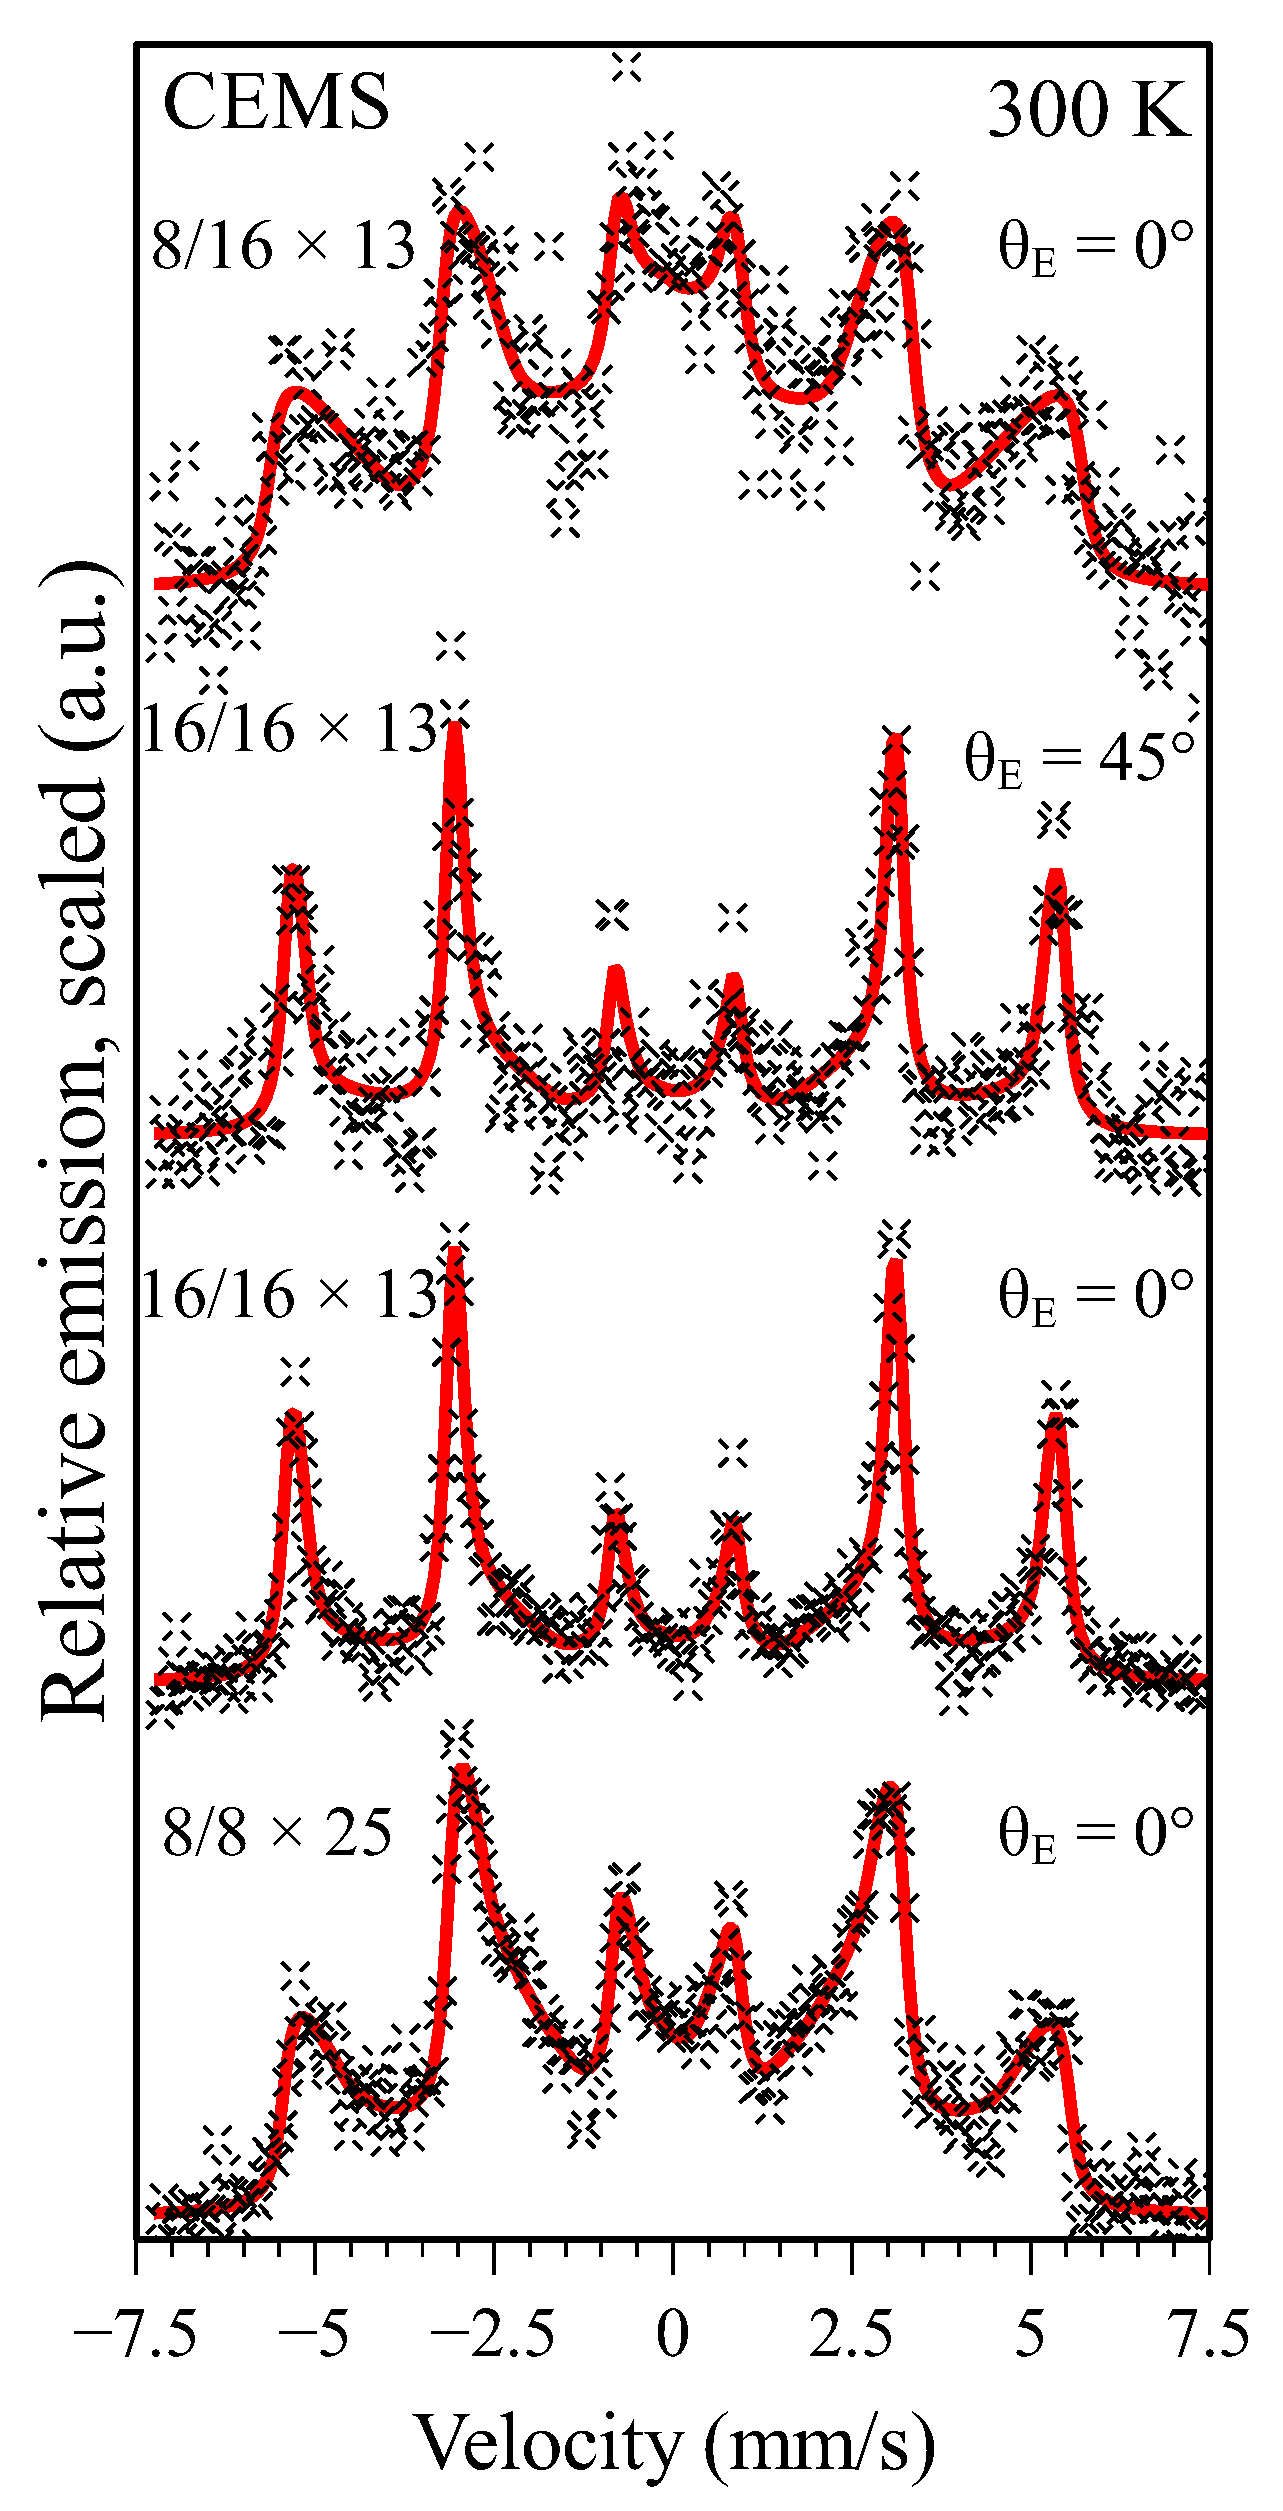
Figure 3 shows the RT (300 K)
Fe
CEMS spectra of the Fe/V superlattice samples measured at two different emission angles. As the CEMS probes only the Fe-layers in the Fe/V-lattices, the CEMS spectra exhibit clearly magnetically split sextet patterns for the superlattices with 8 and 16 ML Fe layers.
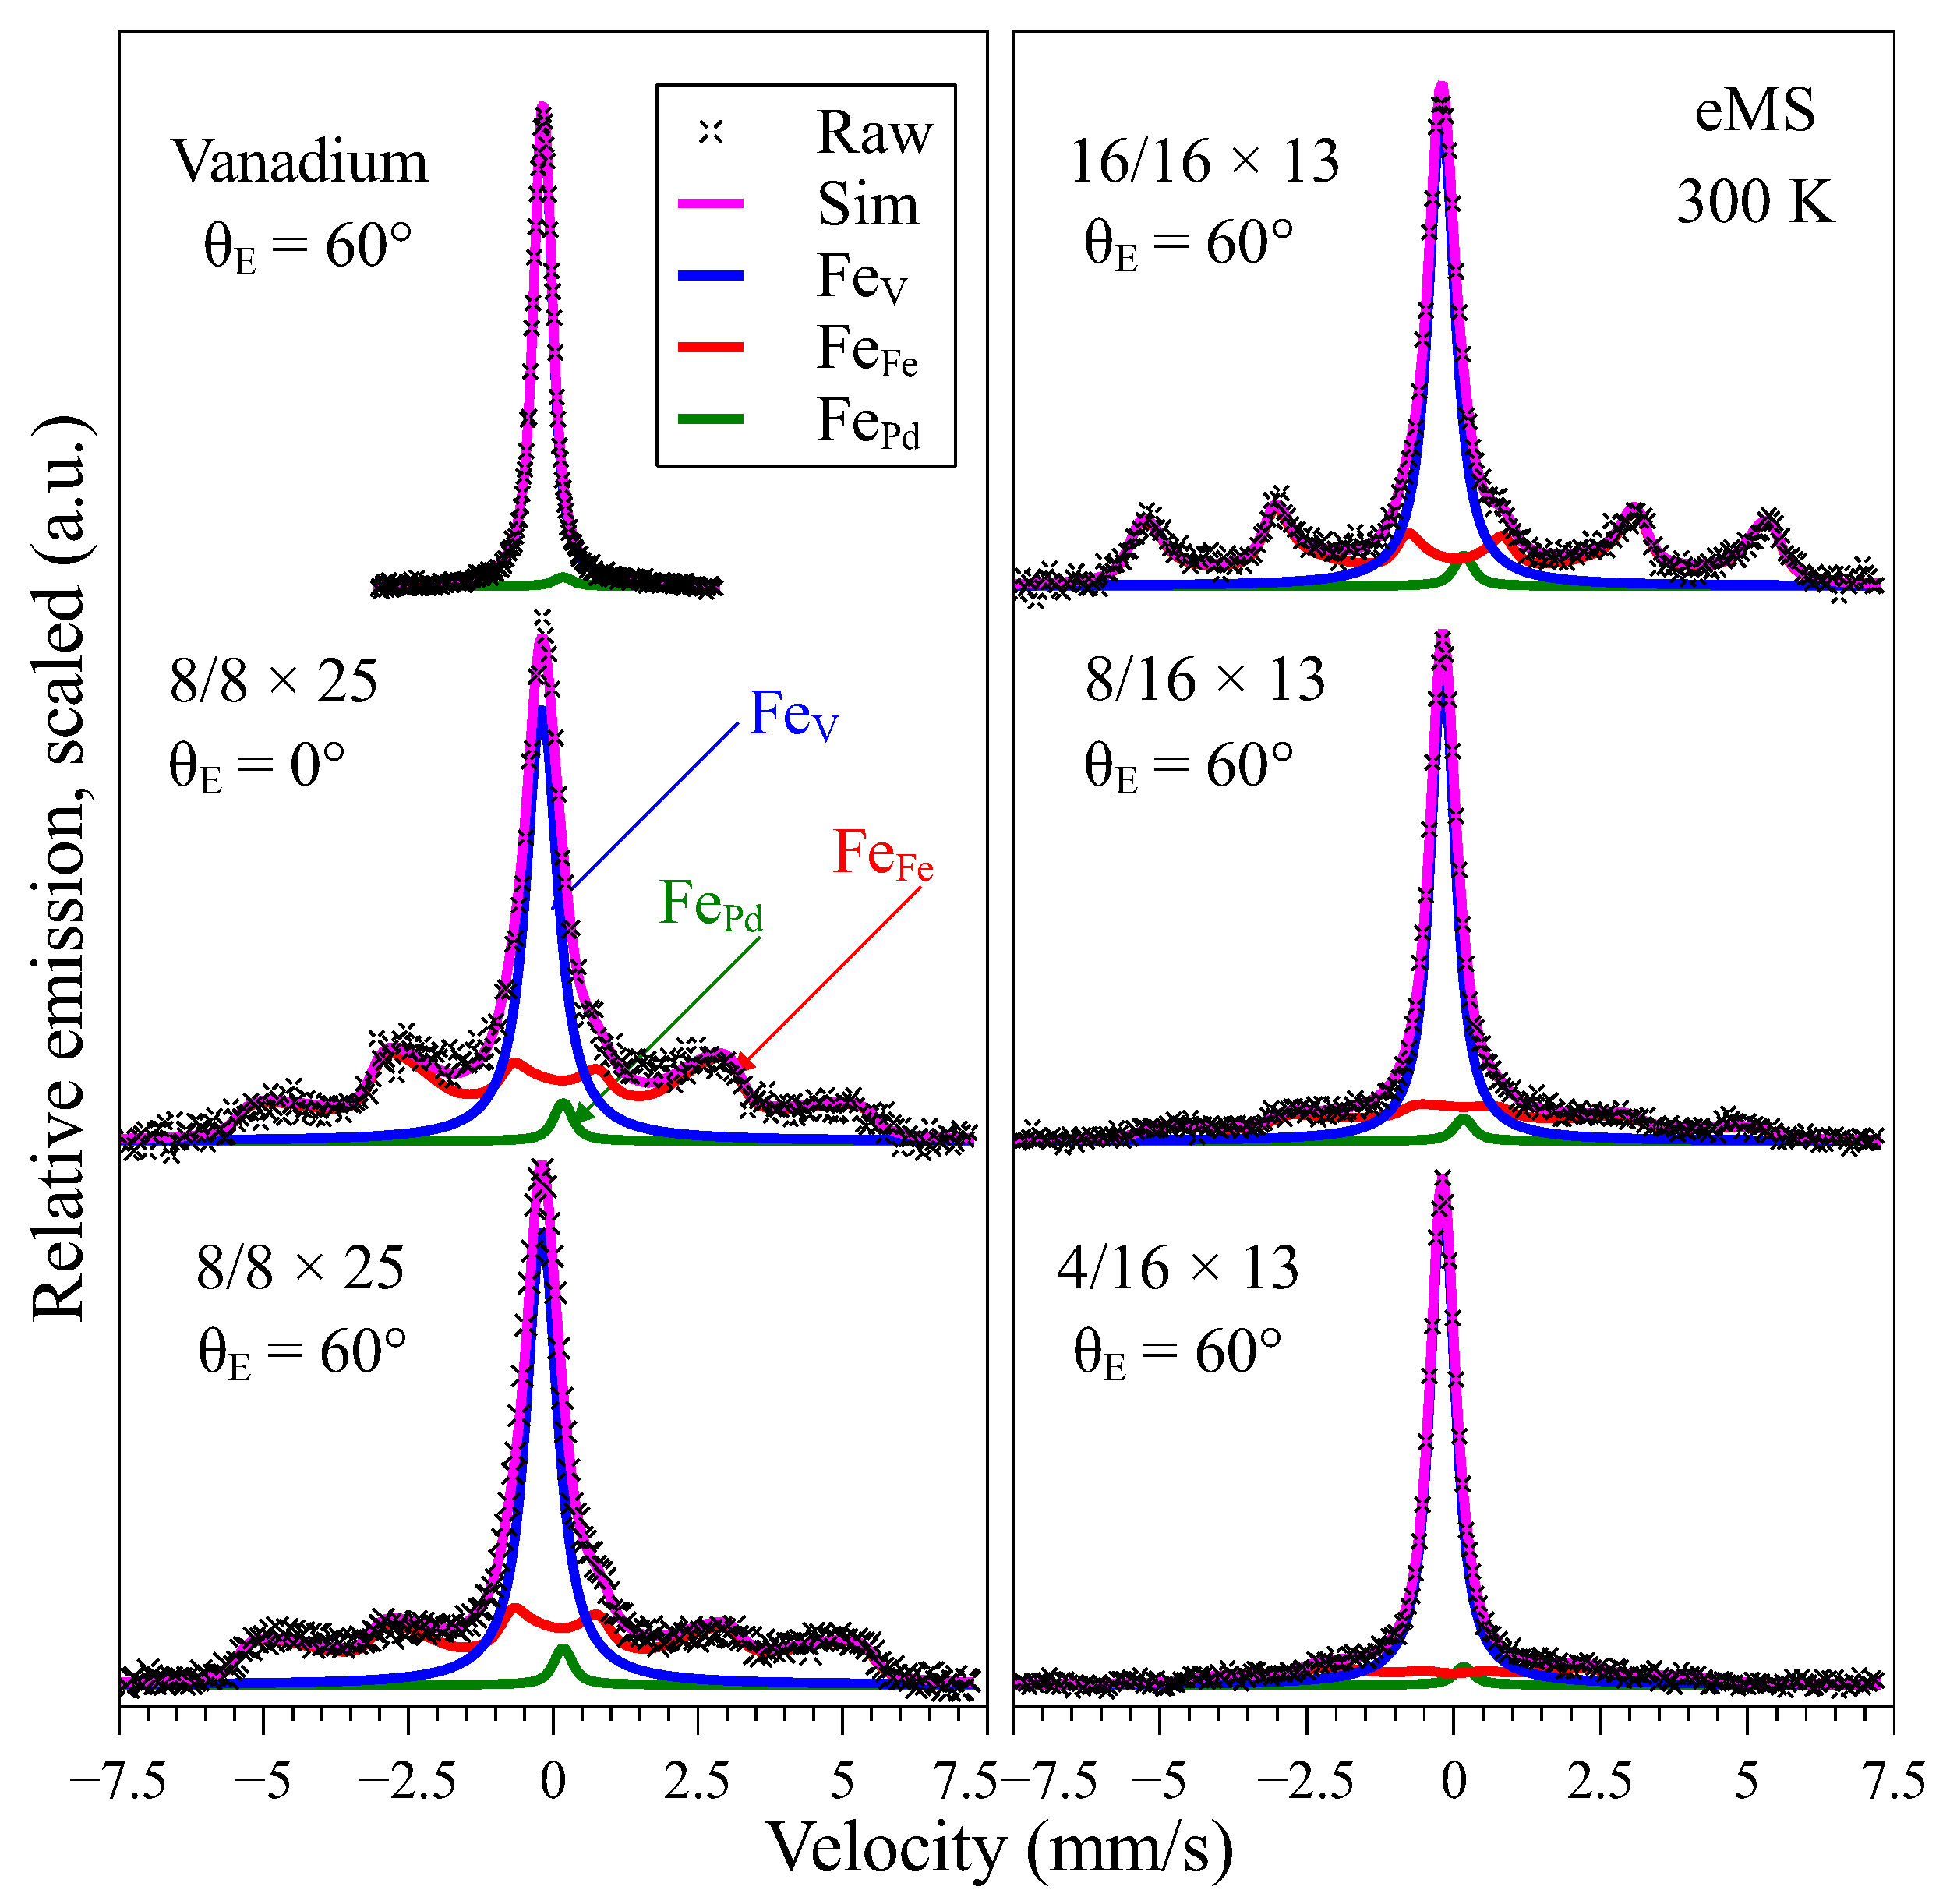
Figure 4 shows the RT (300 K)
Fe
eMS spectra of the Fe/V superlattices and the pure vanadium samples measured at two different emission angles. As compared to CEMS, the eMS is more depth-sensitive and can probe through the whole Fe/V superlattice structures, including V-layers. Therefore, the eMS spectra are additionally dominant with a single peak, similar to the pure vanadium sample, which shows only a single peak and non-magnetic.
The eMS spectra were therefore analysed with multi-components: magnetic sextet splitting lines assigned to
Fe
ions implanted in the Fe-lattice layers (Fe
) similar to the CEMS spectra in
Figure 3, a single Voigt line-shape assigned to
Fe
ions implanted in the V-lattice layers (Fe
) and a small single line contribution from Fe implanted into the Pd layer (Fe
) (based on the isomer shift
mm/s according to [
24], with a fixed area fraction of 2.0 % expected from the stopping of the
Mn
/
Fe
in that layer according to SRIM calculations [
25]). The Fe
component is not fully symmetric, similar to the observation reported by Kalska et al. [
12]. This feature can be described with a linear coupling between the isomer shift (
, central position of a resonance) and the magnetic hyperfine field (B
, sextet splitting of the resonance lines), namely magnetic hyperfine field distribution (MHFD) function [
22] as shown in Equation (
1).
where
and
refer to the centroid shift and the magnetic hyperfine field of the sextet feature (Fe
component).
refers to the isomer shift of the sextet line from the central Fe-layer (without any V neighbours), which would be bulk-like with
T.
is the coupling parameter. The item 33 T is the magnetic hyperfine field of bulk
-Fe. The coupling between magnetic hyperfine field and isomer shift shows that the isomer shift depends on the location of the Fe atoms in the Fe-lattice layer.
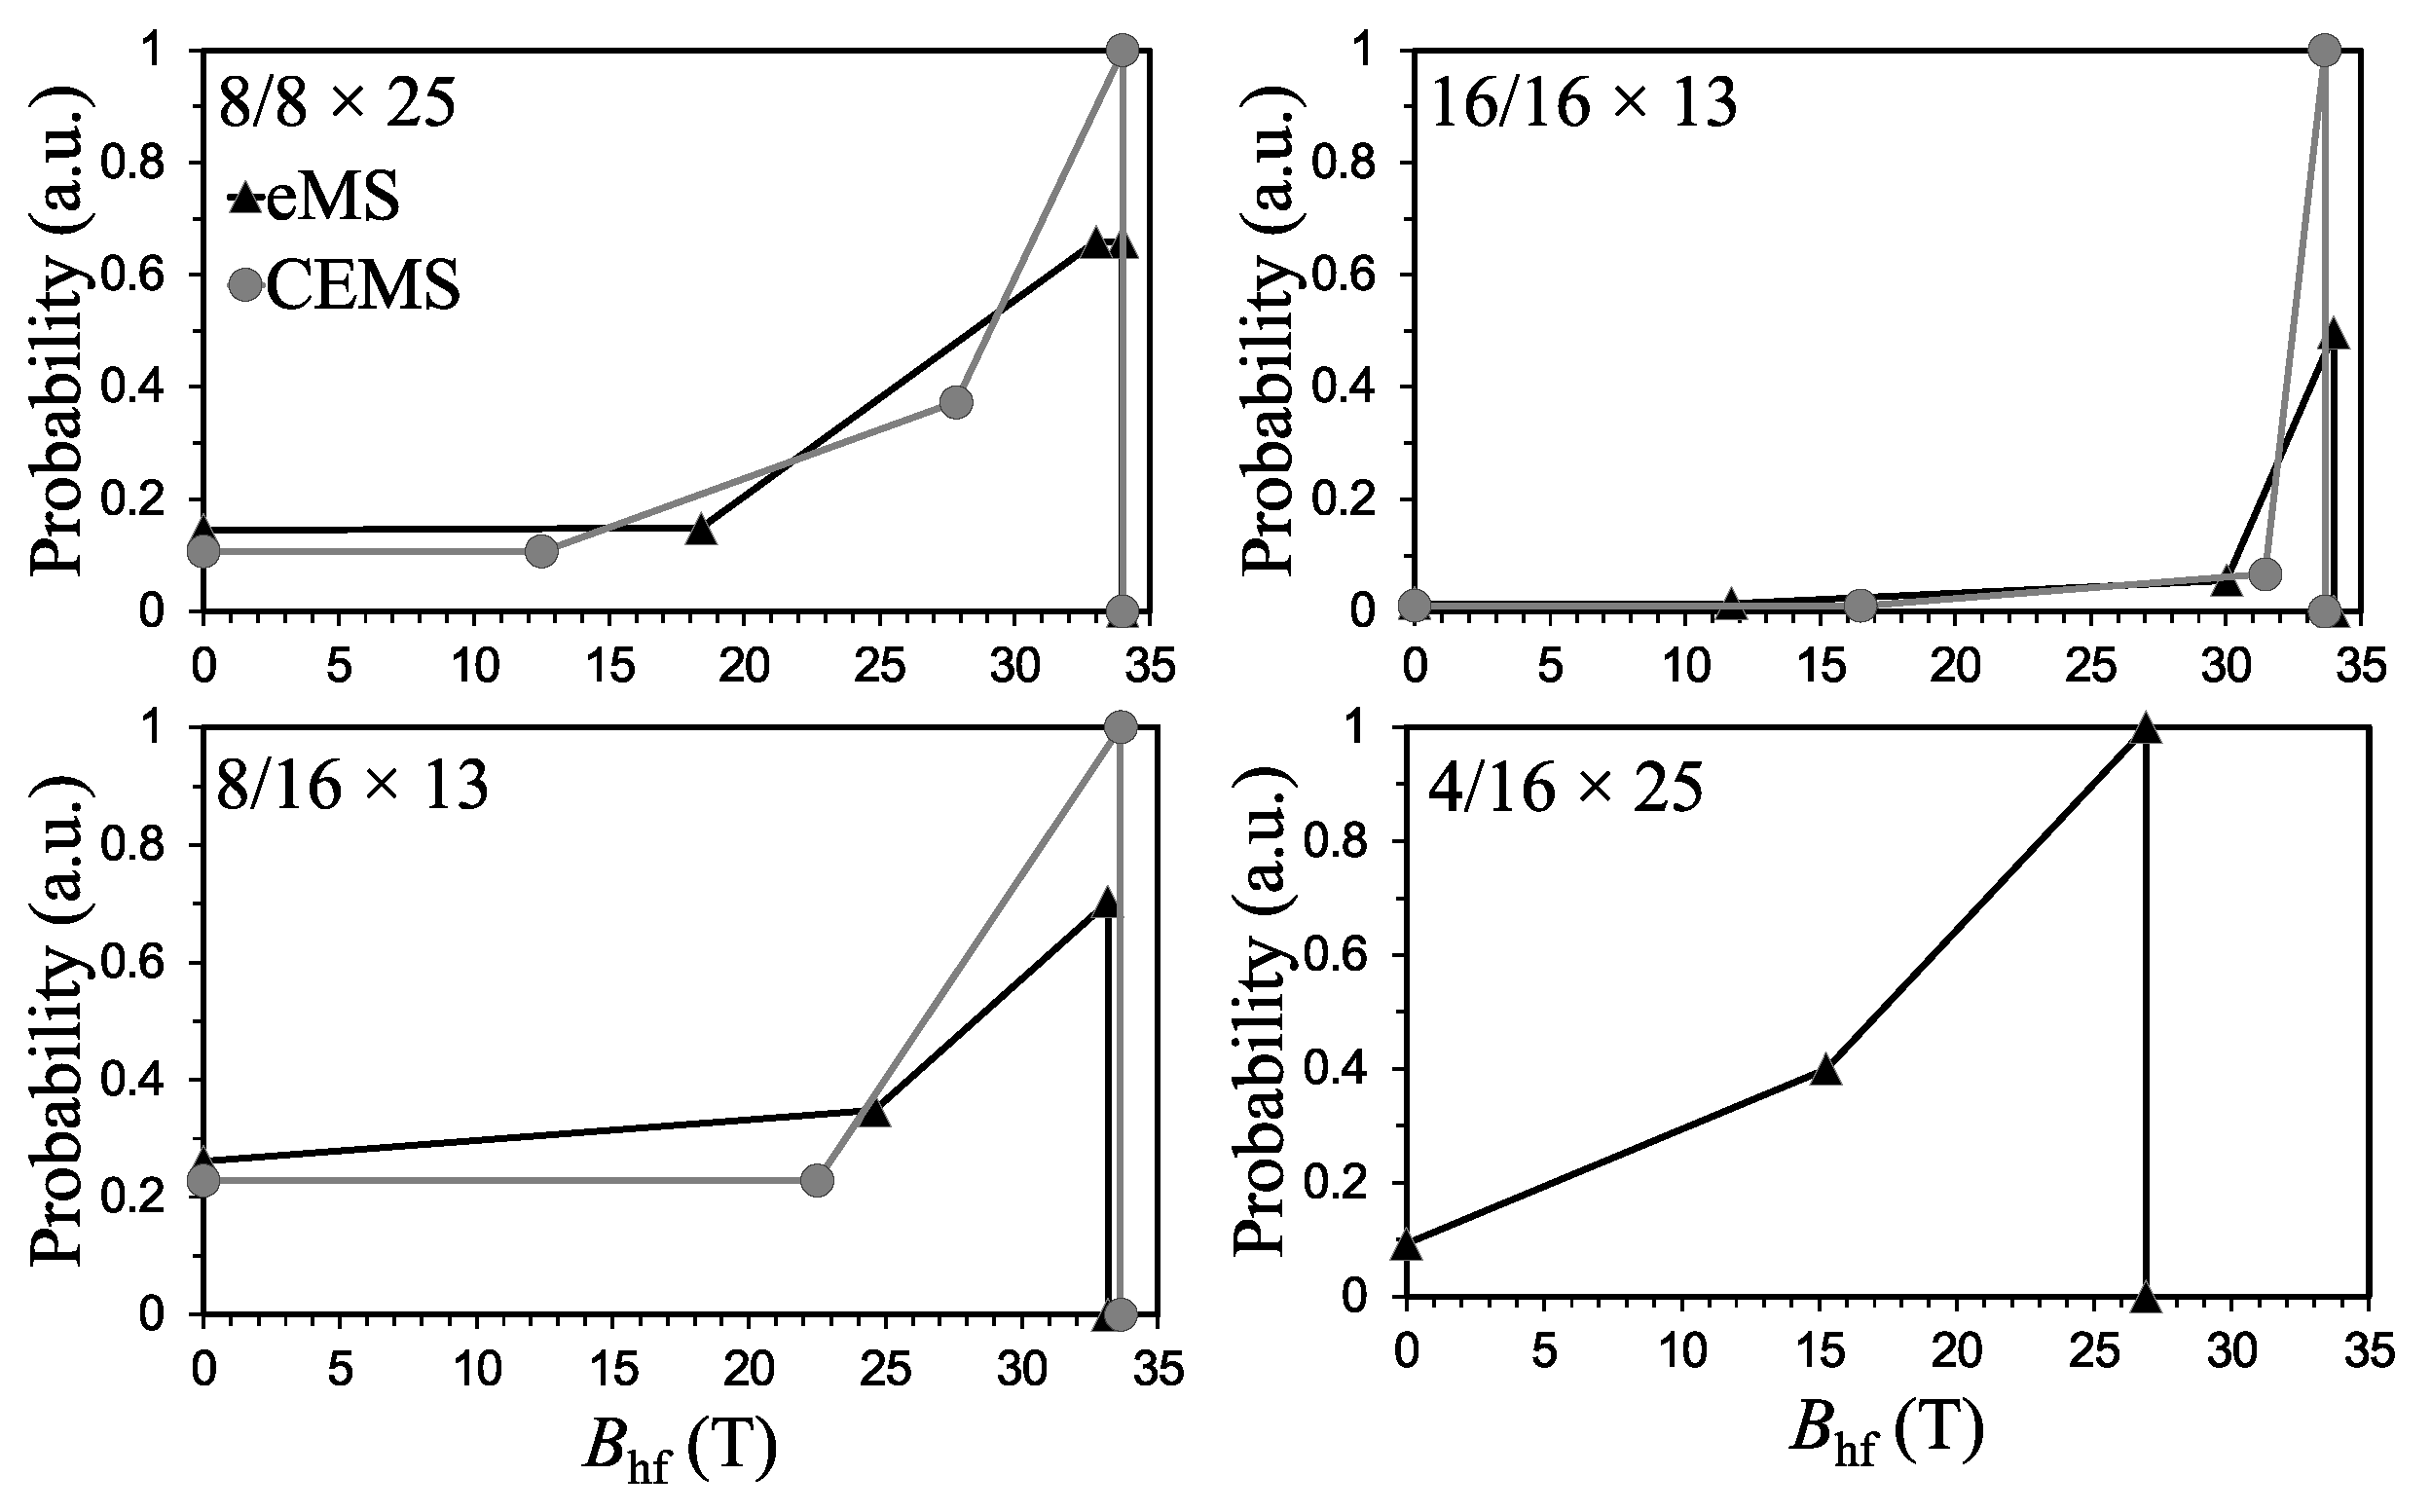
The eMS and CEMS spectra were then simultaneously analysed with MHFD the function with Equation (
1) and Voigt line profile. The extracted hyperfine parameters and spectral areas are summarized in
Table 1. The hyperfine field distributions of the spectra are shown in
Figure 5.
Figure 5 shows that the hyperfine field distribution is dependent on the superlattice structure. The B
from CEMS is generally higher than that from eMS. The penetration depth of the
Mn
beam in the Fe/V superlattices in this study was estimated to be ∼400 Å with a peak concentration at ∼200 Å by the code SRIM [
25]. The
Fe
probe ions in eMS passing through the Fe- or V-layers would also stop at the Fe/V interface. Therefore, with the CEMS probing only the Fe-layers, and the eMS probing through the whole Fe/V superlattice structures, the B
measured by the eMS would be attenuated and more distributed when compared with the CEMS. Thus, the eMS contains the information of both V-layers and the Fe/V interfaces.
4. Discussion
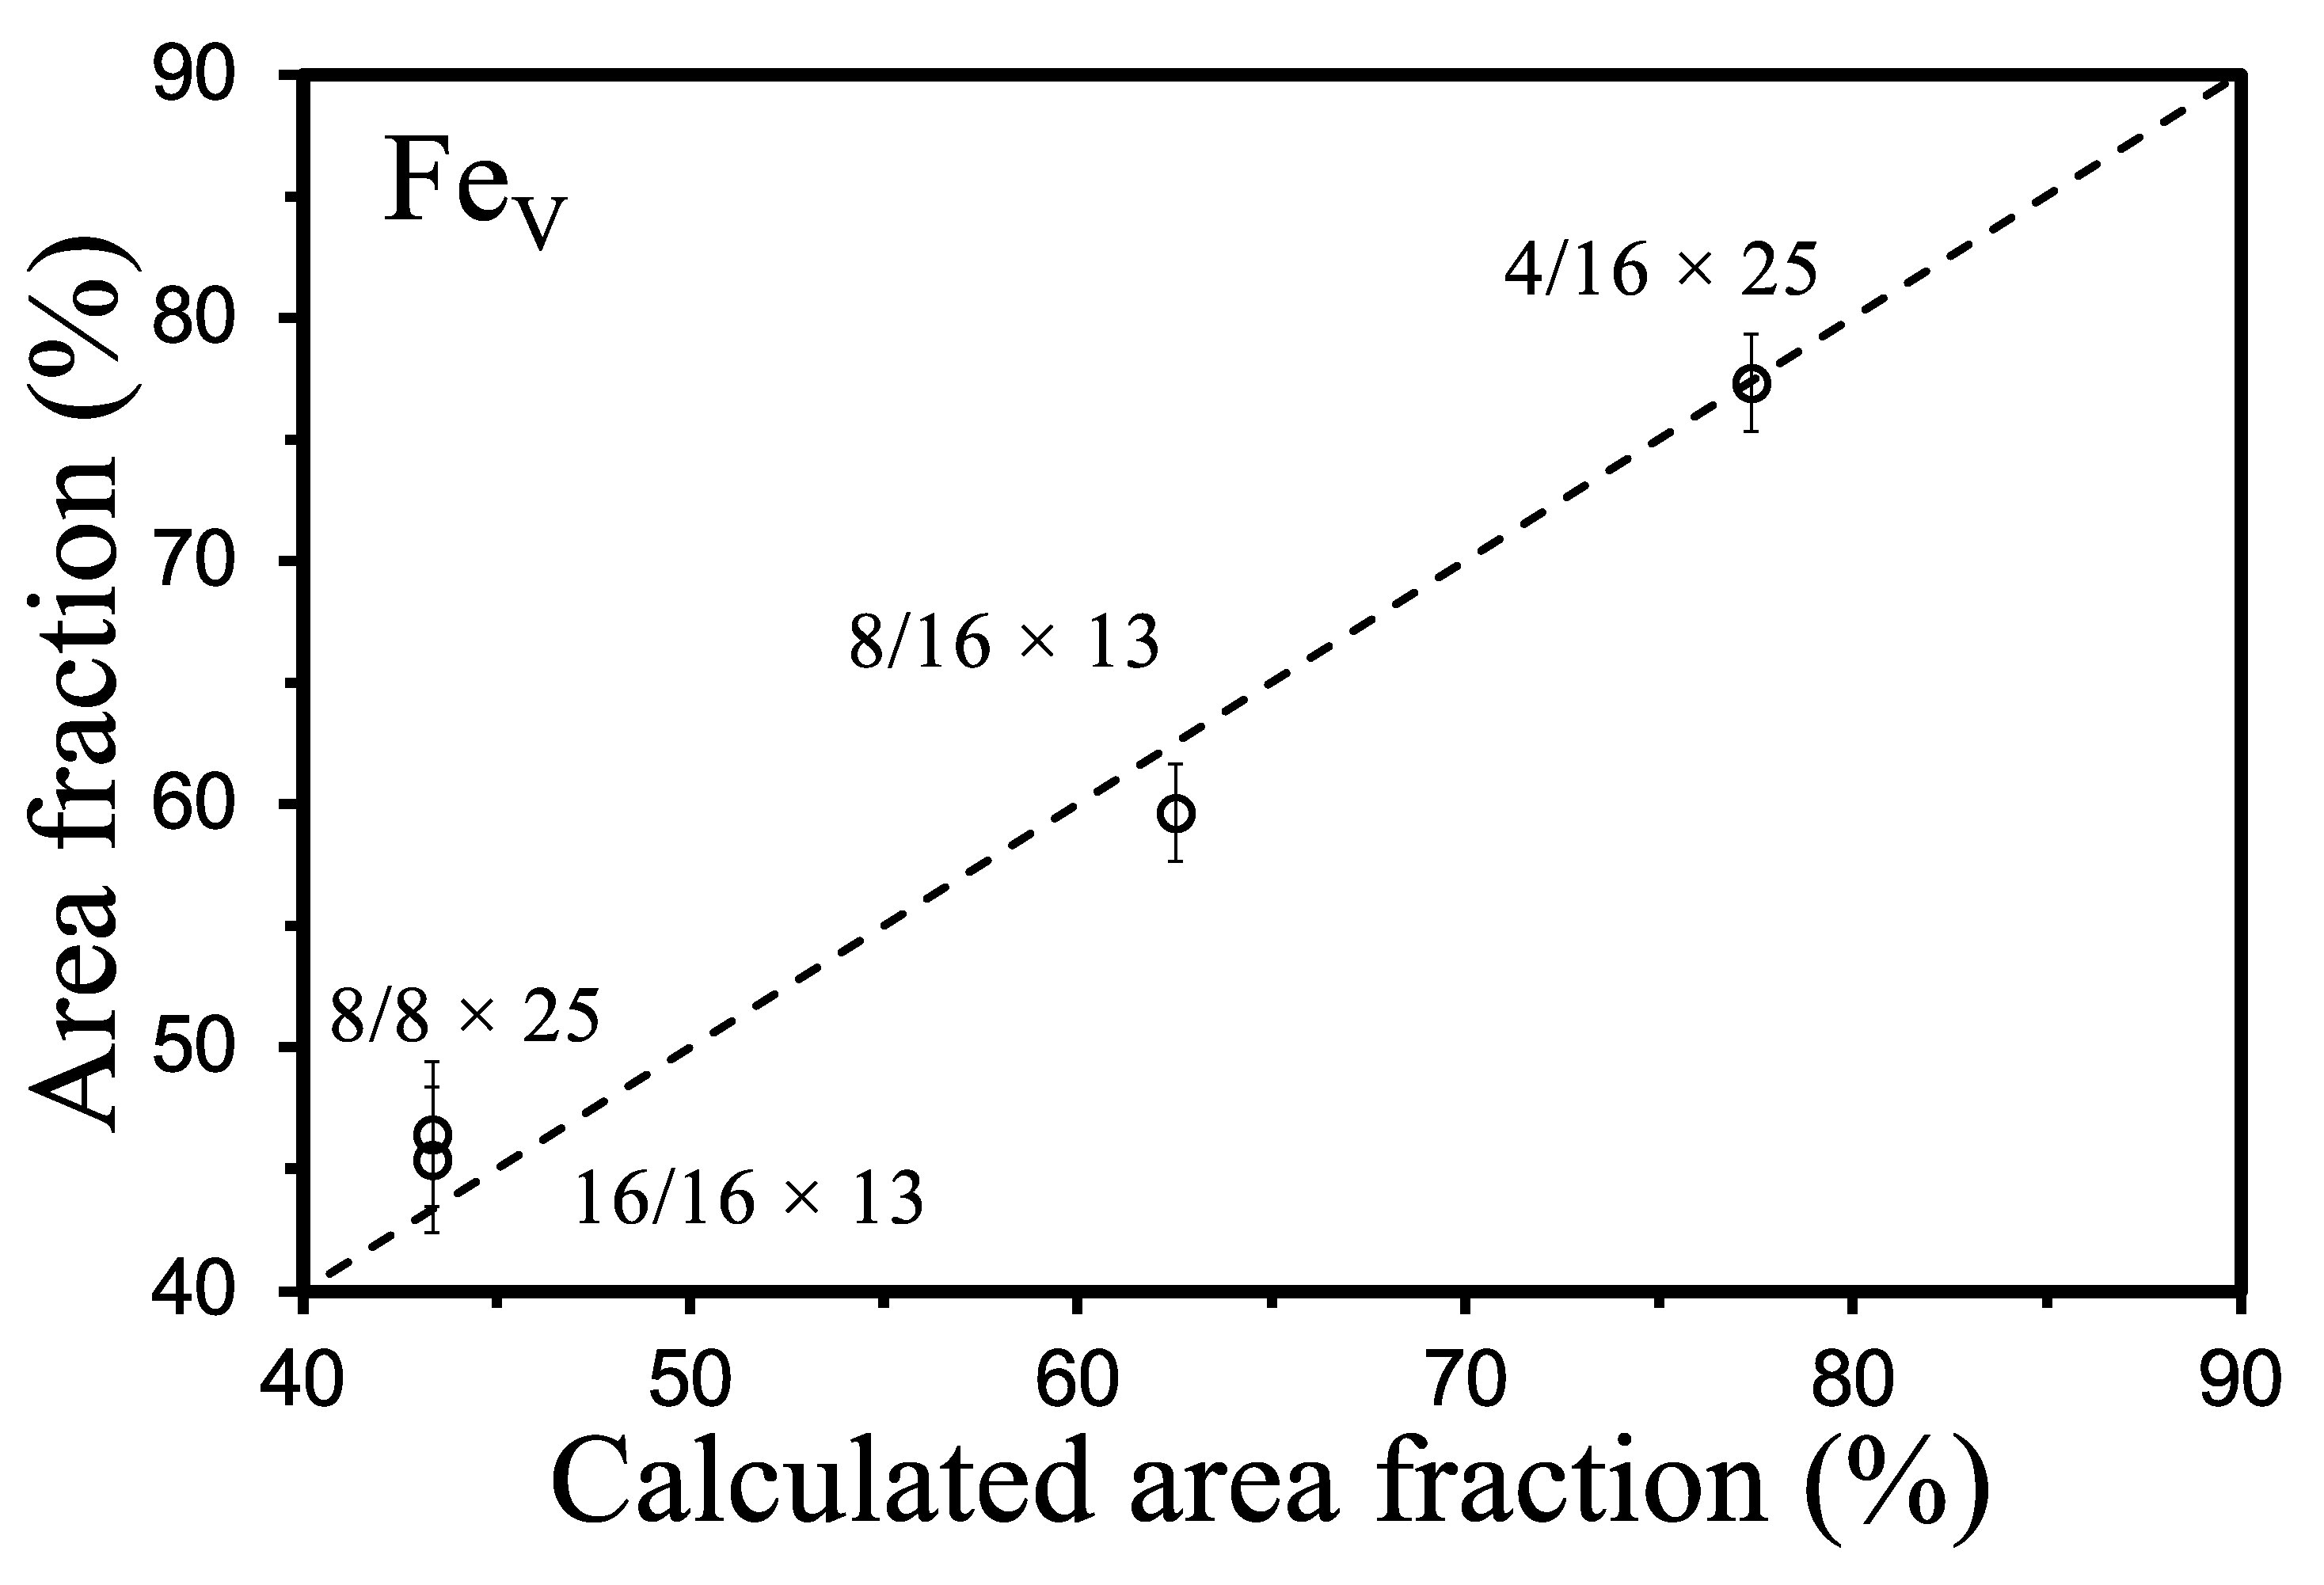
To further test the assignment of the Fe
component to the substitutional Fe in the V-layers in the eMS measurements, we compare the measured and the calculated area fractions of the Fe
component by taking into account the stoichiometry of the superlattice, implantation range and recoil free fractions (f-factors calculated using the Debye model for the reported Debye temperatures,
) of the
Fe
atoms in the superlattice structure. According to the SRIM calculations [
25], more
Mn
come to rest in the Fe-layers (4–8% depending on the stoichiometry) due to a higher stopping probability of
Mn
in the Fe-layers compared to the V-layers. The Debye temperatures of Fe in V-layers (
= 390 K [
26,
27]) and in Fe-layers (
= 460 K [
28]) were adopted in the mass defect approximation [
29].
Figure 6 shows the plot of the calculated versus the measured area fraction of the Fe
component in different superlattice structures.
The linear relationship in
Figure 6 supports that the Fe
signal originates only from the substitutional Fe atoms in V-layers. The Fe
component originates entirely from the Fe-layers. This is also supported by the eMS of the pure metallic vanadium sample, which is non-magnetic, as shown in
Figure 4 and
Table 1.
Table 2 gives the line intensity ratio of the sextet components for the superlattices measured at different emission angles (
). The results show that for all the superlattices, at the emission angle
, (i.e., with emission of
-ray perpendicular to magnetic field), the line intensity ratio follows 3:4:1, and only changes with
different from
. This indicates that the magnetic hyperfine fields are in the sample plane and perpendicular to the
-ray direction [
15]. A striking exception is that for the 8/16 × 13 sample, the line intensity ratio follows a ratio of 3:3.2:1 (at
) and 3:2.5:1 (at
). This indicates the Fe-layer in this sample has deviated from the single crystalline bcc structure and is in a textured structure. The texture feature of the Fe-layers would create multi-domain magnetic structures in the superlattice. This sample has lower Fe/V ratio and total thickness, and is more prone to intermixing of Fe with V atoms at the interface and more strain build up in the Fe-layers by the neighbouring V-layers in the superlattice. Both could weaken the magnetic hyperfine field of the Fe-layers in the superlattice.
The magnetic hyperfine field in
Figure 5 shows a broad distribution and varies with the Fe/V ratio and the number of the Fe-layers in the superlattice. One or two distinct high fields can be solved in the samples with the Fe-layers ⩾8 ML and correlated with the Fe atoms with zero, one or two V atoms as the nearest neighbours in the superlattice. The 4/16 × 25 sample has the lowest number of Fe-layers (4 MLs), which are barely enough to form a clear sextet-like pattern (
Figure 4) and the maximum
value is only ∼27 T, lower than the magnetic hyperfine field of bulk
-Fe (∼33 T). According to the results reported in [
30], for every Fe atom as the nearest and next nearest neighbour to the central Fe in a single-phase bcc structure of Fe-V alloys, that is replaced by V, the Fe hyperfine field in the alloy is suppressed approximately by 3 T. This confirms there is an interdiffusion of Fe and V atoms at the interface of about 1–2 ML in the Fe/V superlattices grown for this study. For the superlattices with 8 ML and 16 ML of Fe atoms, the resolved highest hyperfine field is above 30 T. The 16/16 × 13 sample has the highest number of Fe-layers (16 MLs), which exhibits a strong sextet-like MHFD pattern (
Figure 3 and
Figure 4) and a maximum hyperfine field of
> 33 T (the value expected for the bulk
-Fe, see
Figure 5). This agrees with the results reported in [
12], which can be interpreted as: (a) the interlayer ferromagnetic exchange interaction in the Fe-layer is weaker when the non-magnetic spacer V layer is thicker; (b) the intralayer ferromagnetic exchange interaction is weaker when the magnetic layer (Fe-layer) is thinner.
Different MHFDs are observed between the CEMS and eMS for the same sample. Generally, a lower average magnetic hyperfine field
was measured in eMS than that in CEMS. This is probably due to an extra ion-beam-induced intermixing of Fe and V atoms at the interface during the eMS measurements which is absent in CEMS measurements. Such a mixing can reduce the magnetic hyperfine field
of the central Fe-layers in the superlattice. This was observed in Fe/Zr multilayer [
31,
32] with CEMS, where much higher fluences (up to 4 × 10
protons/cm
and 2 × 10
Ar/cm
) than this study (<
Mn/cm
) were applied; the sextet-like component was greatly reduced and disappeared at the highest fluence.
In the eMS measurements, the final location of the implanted probe atoms in the superlattice is practically random. The probe atoms can end up in the V-layers, next to the Fe-layer (interfaces) or deep within the Fe-layers. The magnetic hyperfine field distributions are thus the superpositions of several distributions mainly from the interface layer and the next layer but also from the layers further into the superlattice (intralayer).
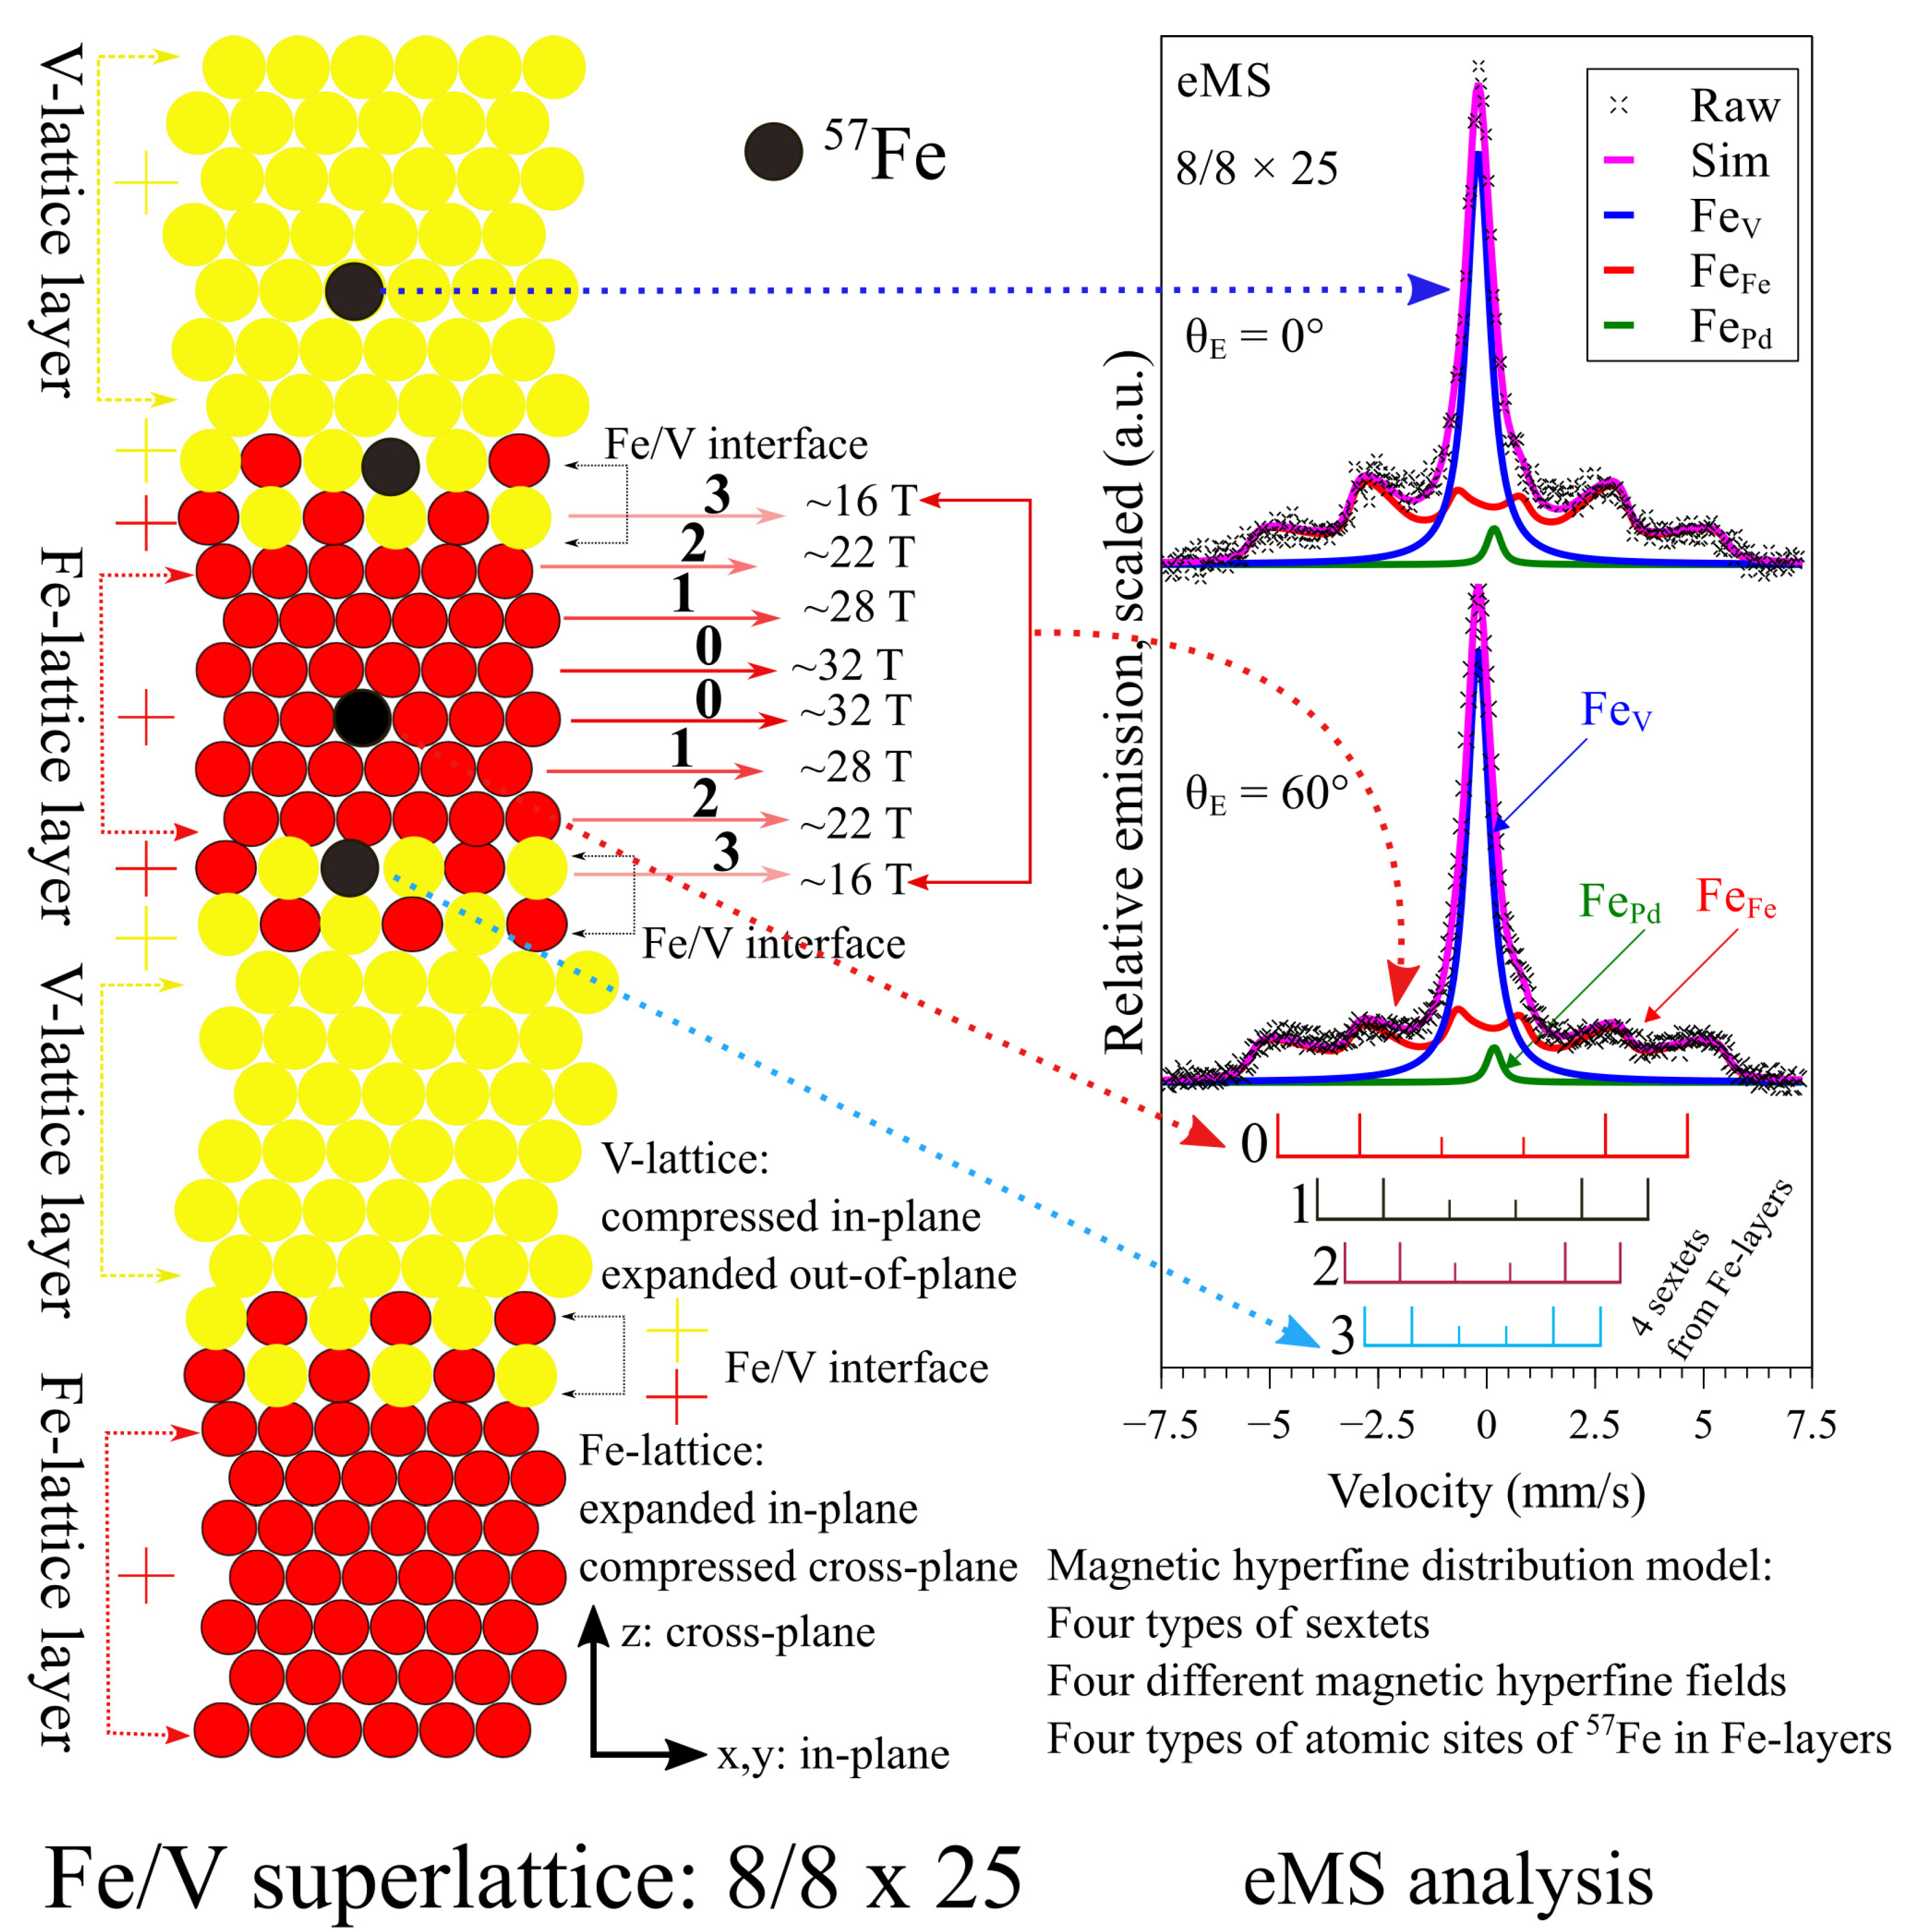
Figure 7 schematically illustrates the interdiffusion, structure and angle-dependent magnetic hyperfine field distribution of the 8/8 × 25 superlattice sample. At the interface there is possibly 1–2 monolayer intermixing of Fe and V atoms. Owing to the different lattice size of Fe and V atoms in bcc structure, in-plane lattices are expanded in Fe-layer and compressed in V-layers; and cross-plane lattices are compressed in Fe-layers and expanded in V-layer. As a result, the Fe-lattice volume increases, and the V-lattice volume decreases in the Fe/V superlattices as compared to the Fe- and V-lattice volumes in bulk bcc structure. In the most extreme case, the lattice mismatch between the Fe- and V-layers would result in a 5–6% distortion (a/c) of the bcc lattices at the Fe/V interface in the superlattices. Consequently, the lattice strain is built up in the Fe- and V- lattice layer and the misfit dislocations are created at the Fe/V interface to relax the strain with increasing thickness of the Fe- or V-layer [
33]. The thicker the layer, the more the strain is relaxed, the less the magnetic hyperfine field is affected/reduced. Therefore, the central Fe-lattice layer has the highest magnetic hyperfine field which decreases towards the Fe/V interface. The additional intermixing of Fe and V atoms due to the recoil of Fe probe atoms at and close to the Fe/V interface can also induce lattice disorder around the interface layer and cause a lower magnetic hyperfine field in eMS measurement than that in CEMS. This also agrees with the variation of the magnetic hyperfine field strength with the number of the Fe MLs in the superlattice structure.
According to the variation of the magnetic hyperfine field with the location of the Fe atoms with respect to the interface, the profile of the individual magnetic hyperfine field of the Fe component could be described. Fe probe atoms in the central Fe-ML give rise to the highest magnetic hyperfine field (probes fully surrounded by the Fe atoms). As it moves towards the Fe/V interface, the magnetic hyperfine field decreases and the Fe probe atoms at the interface surrounded by both the V and Fe atoms as the nearest neighbours give rise to the lowest magnetic hyperfine field. The Fe probe atoms surrounded fully by the V atoms exhibit no magnetic field splitting, but a single line in the eMS.
The isomer-shift of bulk Fe is 0 mm/s (from definition). However, the isomer shift of the Fe
component is found to depend slightly on the superlattice structure (
Figure 4 and
Table 1). This can be qualitatively explained by two main contributions: (i) lattice strain and (ii) neighbour effect.
- (i)
The lattice strain (relative to the unperturbed
-Fe-lattice) gives rise to a non-zero isomer shift of the Fe
component (
) [
34,
35,
36]. There is a lattice misfit of ∼5 % between
-Fe and V atoms at the Fe/V interface (the in-plane lattice constant is 0.287 nm for Fe, and 0.303 nm for V). This would create an in-plane compressive strain for V-lattices and tensile strain for Fe-lattices, leading to a body-centred tetragonal (bct) structure at the interface. This strain state in the superlattice structure depends on the thickness of each lattice layer and formation of misfit dislocations at the interface. In-plane lattice parameters are expanded for Fe-layers and compressed for V-layers; on the other hand, cross-plane lattice parameters are contracted for Fe-layers and expanded for V-layers, respectively. The Fe-lattice volume therefore increases, and the V-lattice volume decreases in the superlattice [
37]. The change in lattice volume will likewise change the electron density and isomer shift of the implanted
Fe
probe atoms in the lattice layers.
- (ii)
The isomer shift of Fe
depends on the type of neighbours around the probe atom, and this is defined as the neighbour effect (
). This effect arises from the different electronic configurations of Fe and V atoms. It depends on the relative amount of either element in the neighbourhood of the Fe probe atom. In the simplest case, the neighbour effect can be parameterized as:
where
is the relative number of V atoms (0 to 1) in the neighbourhood of the Fe probe atoms.
and
are the isomer shifts of Fe atoms in the V-layer and in the Fe-layer, respectively, neglecting the strain effects.
by the definition of the zero isomer shift of Fe in
-Fe (bulk-like Fe without strain).
The observed isomer shift
measured from the superlattice is then modelled as:
can be treated as constant throughout the superlattice free of lattice dislocations. can vary depending on the relative locations of the Fe probe atoms in the superlattices.
In the central Fe-layer which shows the highest saturated magnetic hyperfine field, the neighbour effect is minimal (
); only the strain (
) contributes to the changes of the isomer shift. The centroid shift of the magnetic hyperfine field from the central Fe-layer (corresponding to
) should therefore give a good estimation on the
value, i.e.,
.
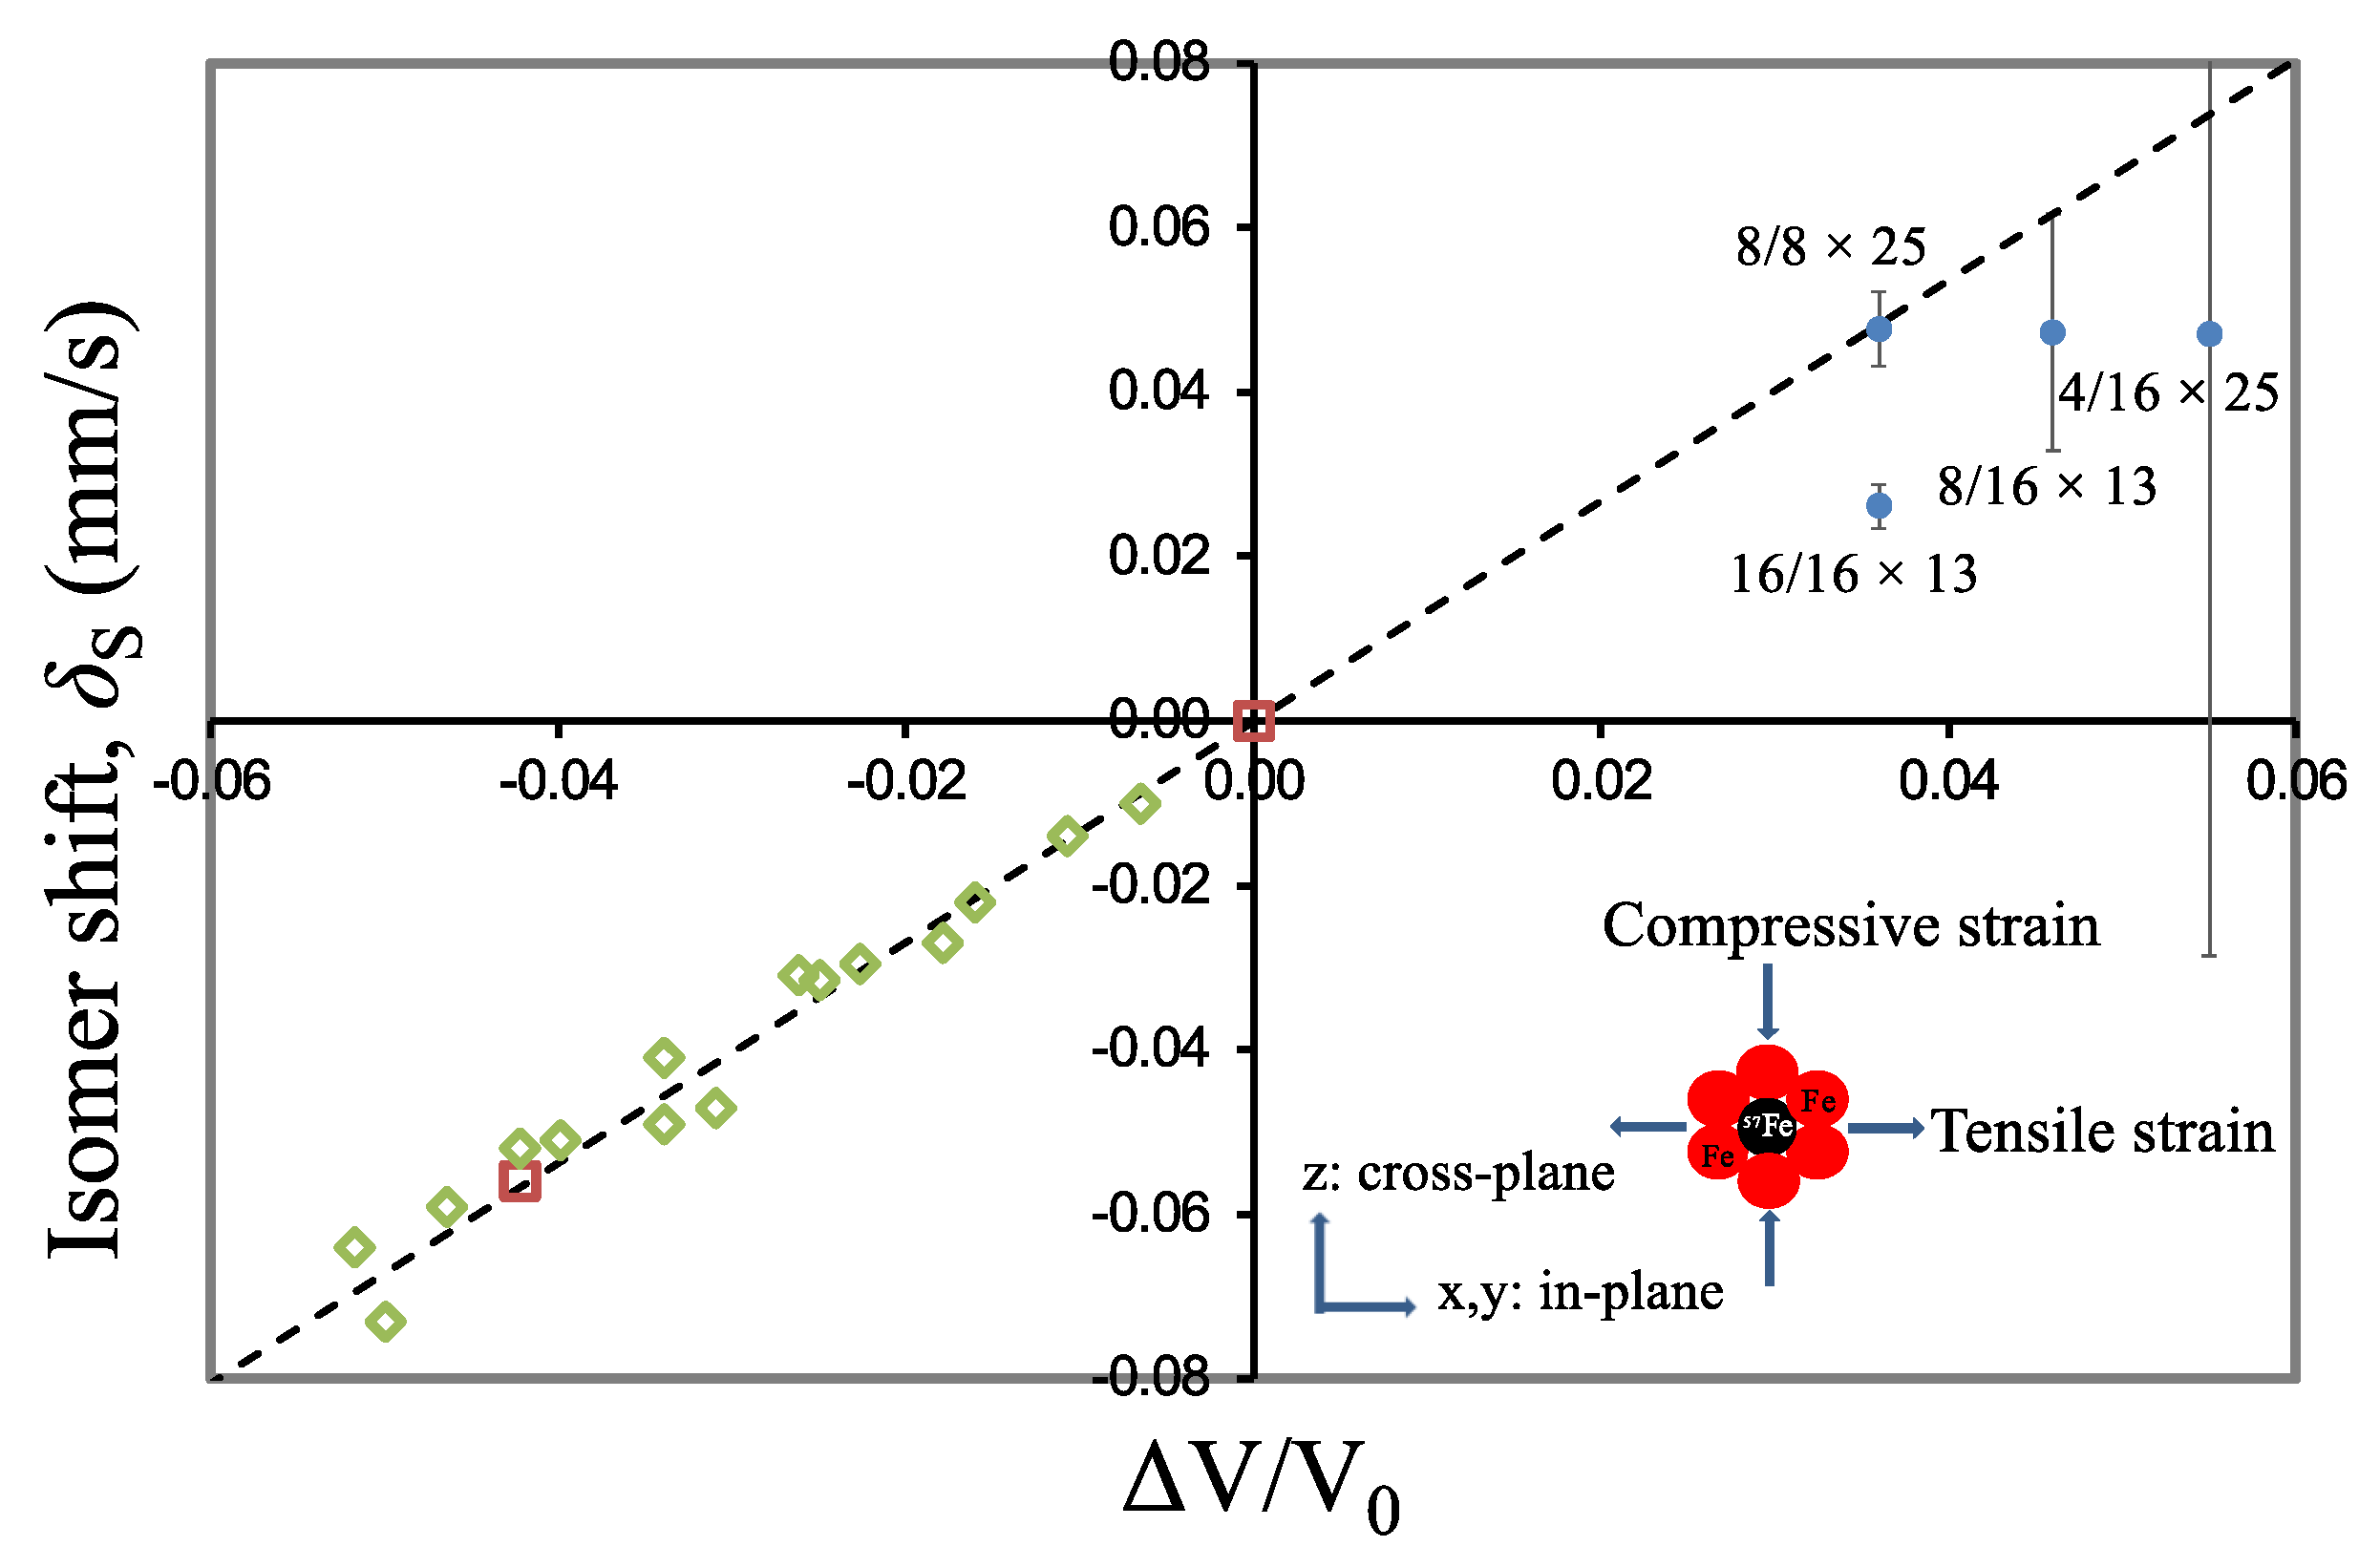
Figure 8 compares the isomer shifts of the Fe
component from the central Fe-layer (
) in the superlattice samples analysed with the MHFD function with the literature data obtained from the Fe-foils subjected to high pressures [
35,
36].
For the 4/16 × 25 sample, the isomer shift of the central Fe-layer (
) was obtained by extrapolation to
in the fitting analysis of the eMS with the MHFD function. A large error bar at this extrapolated data point is due to the low fraction of the Fe
component (lowest Fe/V ratio) in this sample. A negative
indicates a compression and a positive
expansion of the Fe-lattice (cross-plane) layer as compared to the bulk
-Fe. The dotted line follows the trend observed by Pipkorn et al. [
36] and Southwell et al. [
35] from the metallic Fe-layers under high pressure. The linear plot in
Figure 8 indicates that the isomer shift decreases linearly with the compression of the Fe-lattice in the superlattice. The data from the 8/8 × 25 sample follows the trend of the literature data, while the data from the 16/16 × 13 sample obviously deviates from the trend, and the value of strain in this sample cannot be deduced. However, based on the isomer shift measured for this sample, if the same linear trend is assumed, this sample should be less strained as compared to the 8/8 × 25 sample. The strain-related isomer shifts of the 4/16 × 25, 8/16 × 13 and 8/8 × 25 samples are comparable. Based on the linear trend in
Figure 8, this indicates that the Fe-layers in these superlattices should experience similar amount of strain. This is expected; during the epitaxy growth of the Fe/V superlattice, the energy will be created owing to the build-up strain and increases as the layer grows. When the layer thickness reaches a critical value (the strain build-up energy reaches the highest point), a high density of misfit dislocations will form at the interface to release the strain for the final layer. This suggests that the strain build-up has reached the maximum at the Fe-layer thickness of 8 ML. The Fe-layer in 16/16 × 13 sample has reached the critical thickness and has already released most of the strain at the final growth, as compared to the 8/8 × 25 sample. As for the 8/8 × 25 sample, both the Fe- and V-layer are not thick enough to reach the critical thickness to release the strain. The Fe-lattice and V-lattice layers are coherently aligned and still fully strained in this sample. The data for the 8/16 × 25 and the 4/16 × 25 samples seem to support this observation but are more difficult to interpret due to large errors, probably owing to lower number Fe-layers in these two samples.
At the Fe/V interface,
½,
. According to Equation (
3), there is:
is the isomer shift of the Fe
component extrapolated to
in the eMS analysed with the MHFD function. Therefore, we can also estimate the isomer shift of the Fe
component (
) with Equation (
4), using the
value determined in
Figure 8 for each superlattice sample.
The neighbour effect can be estimated from the isomer shift of the Fe
component by assuming that only the interface atoms are affected by the neighbour effect; the isomer shift at the interface
can be expressed as:
where
is the number of V-layers in the superlattice. Using
found for the Fe
component in Fe-layer (
Figure 8), and
measured from the eMS spectra, based on Equation (
5), one gets
mm/s for the 8/8×25 sample. This value is comparable to the isomer shift of the Fe
component
mm/s estimated with Equation (
4) for the same sample and the value
mm/s inferred from the data of Ingalls et al. [
34] at
(fully strained Fe/V superlattice) as shown in
Figure 9.
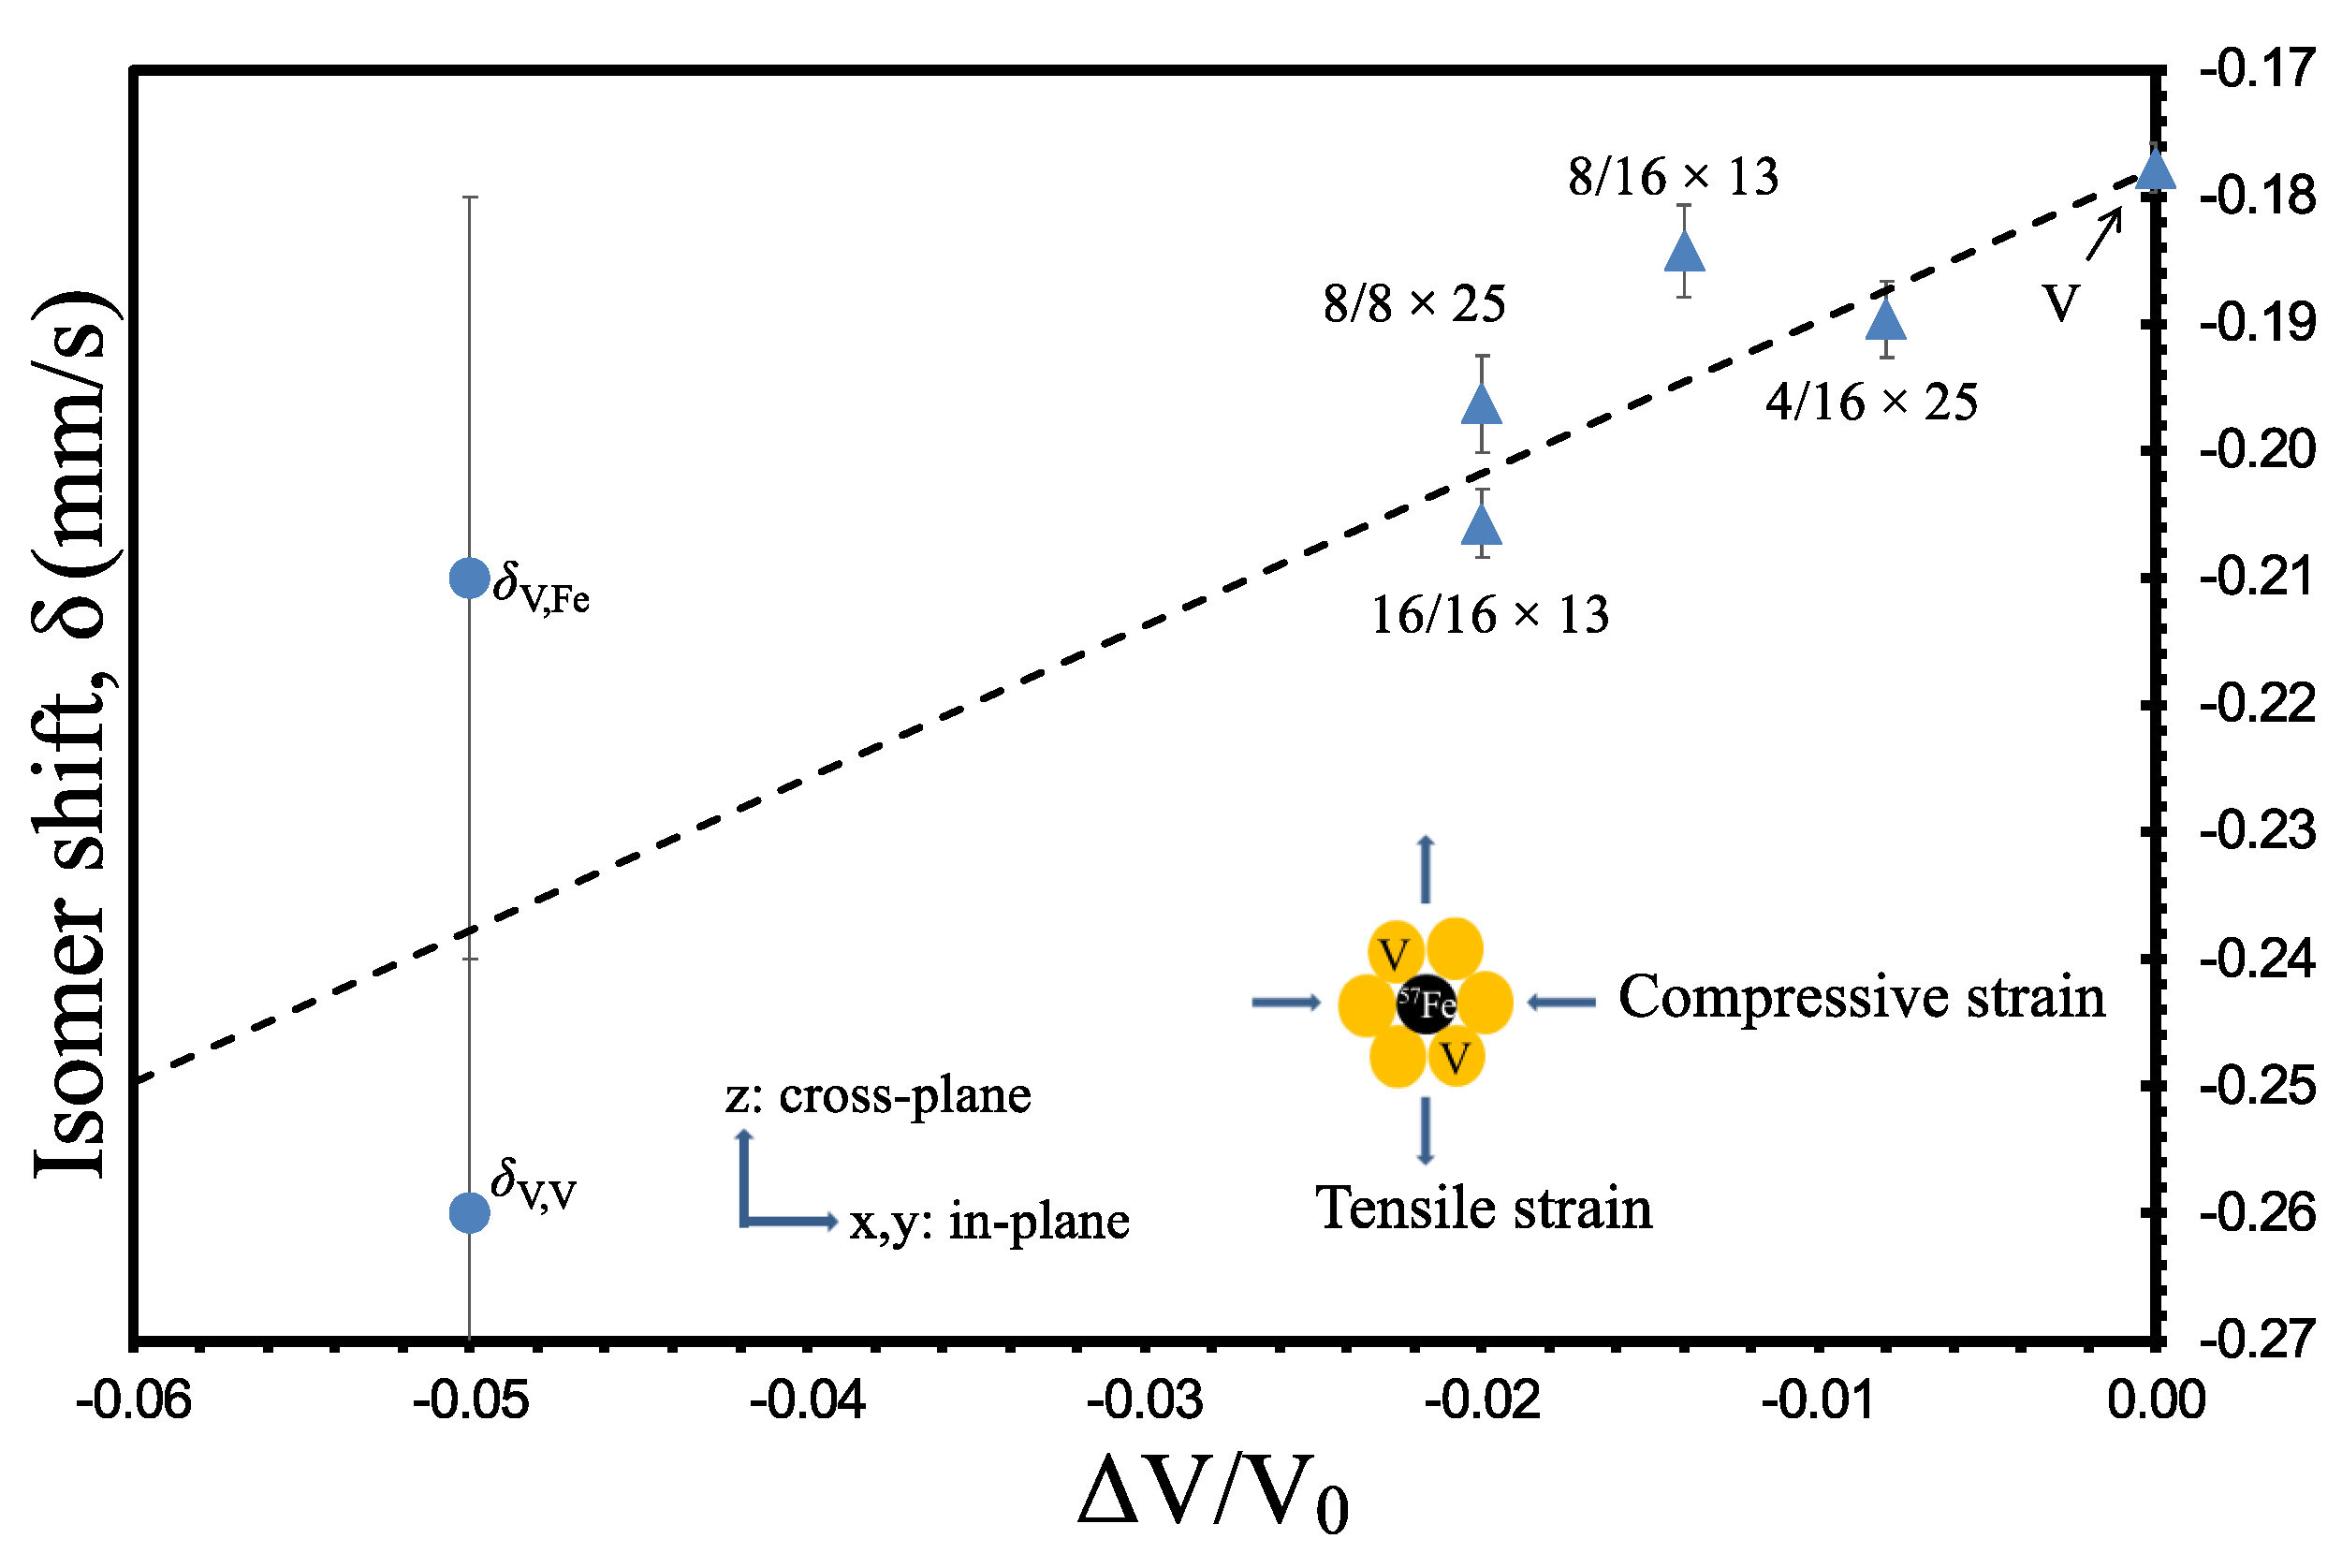
Figure 9 compares the observed isomer shift of the Fe
component (
) measured by eMS with the literature data obtained from the pure vanadium metal under high pressur reported by Ingalls et al. [
34]. In the plot, the reported
value on the dashed line should match the measured
value from our superlattice sample where the
Fe
probe atoms could experience a maximum 5% in-plane compressive strain from the neighbouring V-lattices. As shown in
Figure 9, for both the Fe/V superlattices and the pure V-layer, the data seem to follow the same trend as described by the dashed line despite that the neighbour effects at the interfaces were not considered in [
34]. An isomer shift of −0.178(2) mm/s was measured for the pure V-layer with eMS (see
Table 1). This value agrees well with the literature data of
mm/s [
34] from the pure vanadium metal. This confirms that to assign the single peak to the substitutional Fe in V-layers (Fe
) in our eMS is reasonable. The isomer shift ∼−0.19 mm/s is measured in the eMS for the 8/8 × 25 sample for the substitutional Fe in the V-layer. This approves the strain effects in the V-lattice planes on the isomer shift of the
Fe
probe atoms in the superlattice structure.
The results in
Figure 8 and
Figure 9 demonstrate that the strain status of the superlattices can be detected by the isomer shifts measured with eMS.
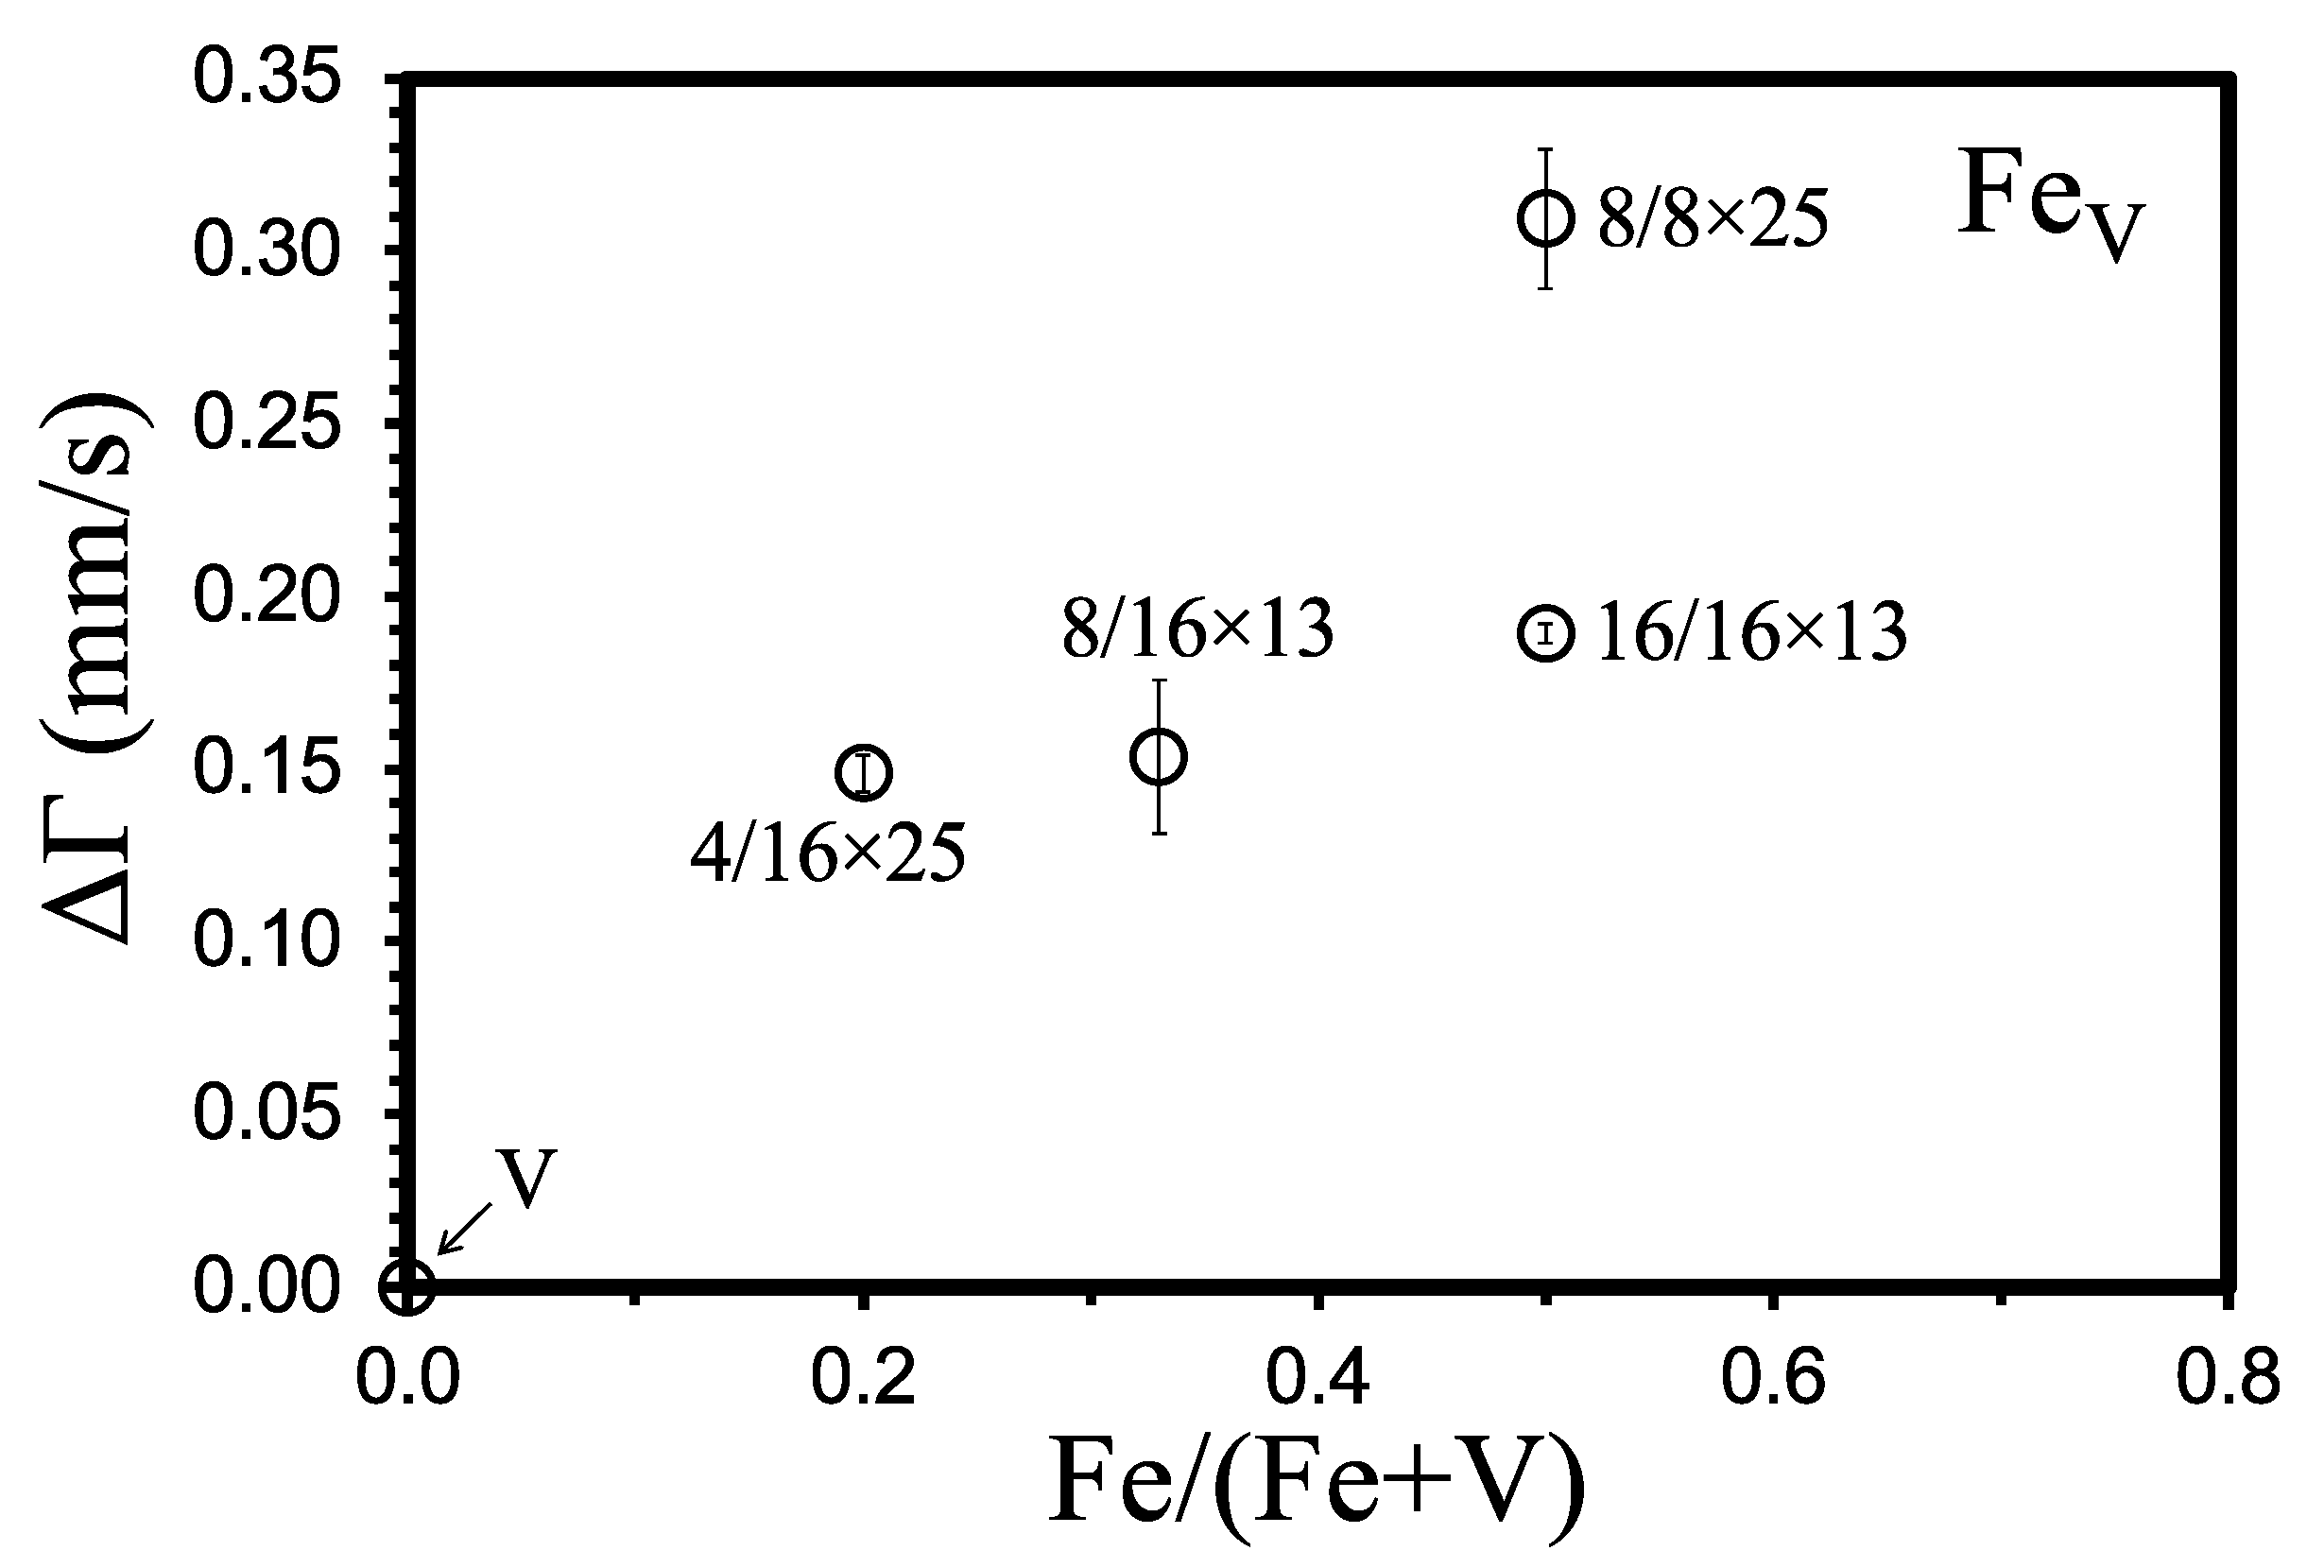
Figure 10 shows the fitted additional Lorentzian broadening of the line-width of the Fe
component in the eMS spectra versus the relative Fe content in the Fe/V superlattices, Fe/(Fe + V). When the line-width of the Fe
component is compared between the pure vanadium sample and the V-layer in the Fe/V superlattices, a tendency of increasing line width with the Fe content in the superlattice is observed. This also matches the trends shown in
Figure 8 and
Figure 9, which indicates that the 8/8 × 25 superlattice is fully strained and the 16/16 × 13 superlattice is less strained.
Only a slightly broadened single line Fe
component was observed in the eMS spectra of the superlattices in our study. This shows that there is no magnetic hyperfine field probed by the Fe atoms coming to rest in the V-layers in the superlattices at RT (see
Table 1 and
Figure 4). This agrees with the report [
38] that no magnetic polarization of the V atoms was induced in the superlattices grown in the direction of V on Fe interfaces. This confirms that the broadening of the single line Fe
component originated from the lattice strain in the V-layers.


 ,
, 


