
Diffusion of Tracer Atoms in Al4Ba Phases Studied Using Perturbed Angular Correlation Spectroscopy


1
Department of Physics and Astronomy, Washington State University, Pullman, WA 99164, USA
2
Department of Physics, Geology, and Engineering Technology, Northern Kentucky University, Highland Heights, KY 41099, USA
*
Author to whom correspondence should be addressed.
†
Deceased.
Crystals 2022, 12(8), 1152; https://0-doi-org.brum.beds.ac.uk/10.3390/cryst12081152
Submission received: 30 June 2022
/
Revised: 4 August 2022
/
Accepted: 10 August 2022
/
Published: 16 August 2022
(This article belongs to the Special Issue Radioactive Isotopes Based Materials Characterization)
Abstract
:The Al4Ba crystal structure is the most common structure among binary intermetallic compounds. It is well suited for accommodating large atoms of group II elements and is often the intermediate phase closest to the terminal phase. It is, therefore, of interest to characterize diffusion properties of compounds with this tetragonal crystal structure. In the present study, 111In perturbed angular correlation spectroscopy was used to study solute site occupation and atom movement in In4Ba, Al4Ba, Al4Eu, Al4Sr, and Ga4Sr. The indium tracer and its daughter cadmium were found to occupy only the two Al-type sublattices in these compounds through detection of nuclear quadrupole interactions with axially symmetric EFGs. Measurements with increasing temperature revealed merging of signals due to dynamical averaging of these interactions as Cd atoms jumped at increasing rates between alternating sublattices. The jump rates were estimated to be between 8 kHz and 2 MHz at about 350 °C for Al4Eu and at about 450 °C for In4Ba and Al4Ba. Fits of spectra using Blume’s stochastic model allowed determination of activation enthalpies for average Cd jump rates between alternating Al sublattices in Al4Sr and Ga4Sr to be 1.16(3) eV and 1.47(3) eV, respectively. This result was used to estimate transverse diffusivities of Cd.
1. Introduction
Atomic motion in solids can be studied macroscopically by measuring diffusivity of a tracer element through evolution of its concentration profile in a sample or microscopically by measuring effects such as nuclear magnetic resonance and mechanical vibration that are sensitive to atomic jumps of the tracer [1]. Alternatively, perturbed angular correlation (PAC) spectroscopy can be used as a microscopic method for studying diffusion by measuring nuclear quadrupole relaxation caused by the jumps [2]. In this work, 111In PAC was used to detect Cd movement in five compounds with the tetragonal Al4Ba (D13, tI10) structure: In4Ba, Al4Ba, Al4Eu, Al4Sr, and Ga4Sr. These measurements are of interest because they involve application of PAC to a system with non-cubic crystal structure, so that the physical origin of quadrupole relaxation differs from previous PAC work.
1.1. Diffusion Studied via Perturbed Angular Correlation Spectroscopy
PAC measures the angular correlation between directions in which two gamma-rays are emitted in a gamma-cascade following radioactive decay of a tracer nucleus. The electric quadrupole interaction between the quadrupole moment of the nucleus of a tracer atom and the local electric field gradient (EFG) leads to a time-dependence of the angular correlation. The EFG is essentially the second spatial derivative of the electrostatic potential produced by extranuclear charges and is highly sensitive to arrangement of atoms within a few angstroms of the tracer. When this arrangement changes, for example, due to jumping of the tracer atom among lattice sites on a timescale comparable to the lifetime of the intermediate nuclear state in the gamma-cascade, there is a relaxation of the measured angular correlation due to decoherence in the quadrupole interaction experienced by the ensemble of tracers.
One of the most commonly used PAC isotopes is 111In. It decays to 111Cd, and the quadrupole interaction is measured while Cd is in its 247 keV, 5/2-spin state, which has a mean lifetime of 120 ns. For such a 5/2-spin state, the perturbation function, which characterizes the time-dependence of the angular correlation, is given by
where is the fundamental quadrupole interaction frequency, which is dependent on the quadrupole moment of the nucleus, , main principal component of the EFG tensor at the lattice site, , and Planck’s constant . When PAC tracers are located at a lattice site having tetragonal point symmetry, they experience an axially symmetric EFG with three harmonic frequencies given by . For a polycrystalline sample, the symmetry axes have a uniform random orientational distribution, and the amplitudes are given by , , , and .
When EFGs experienced by tracers fluctuate, due, for example, to changes in orientation of the EFG symmetry axis as tracers jump among lattice sites, the measured perturbation function can be described to good approximation as the static perturbation function multiplied by an exponential damping factor as given by empirical expressions
in a slow-fluctuation regime where is proportional to the fluctuation rate and by
in a fast regime where varies inversely with the fluctuation rate [3,4]. The is equal to the frequency of the motionally averaged EFG.
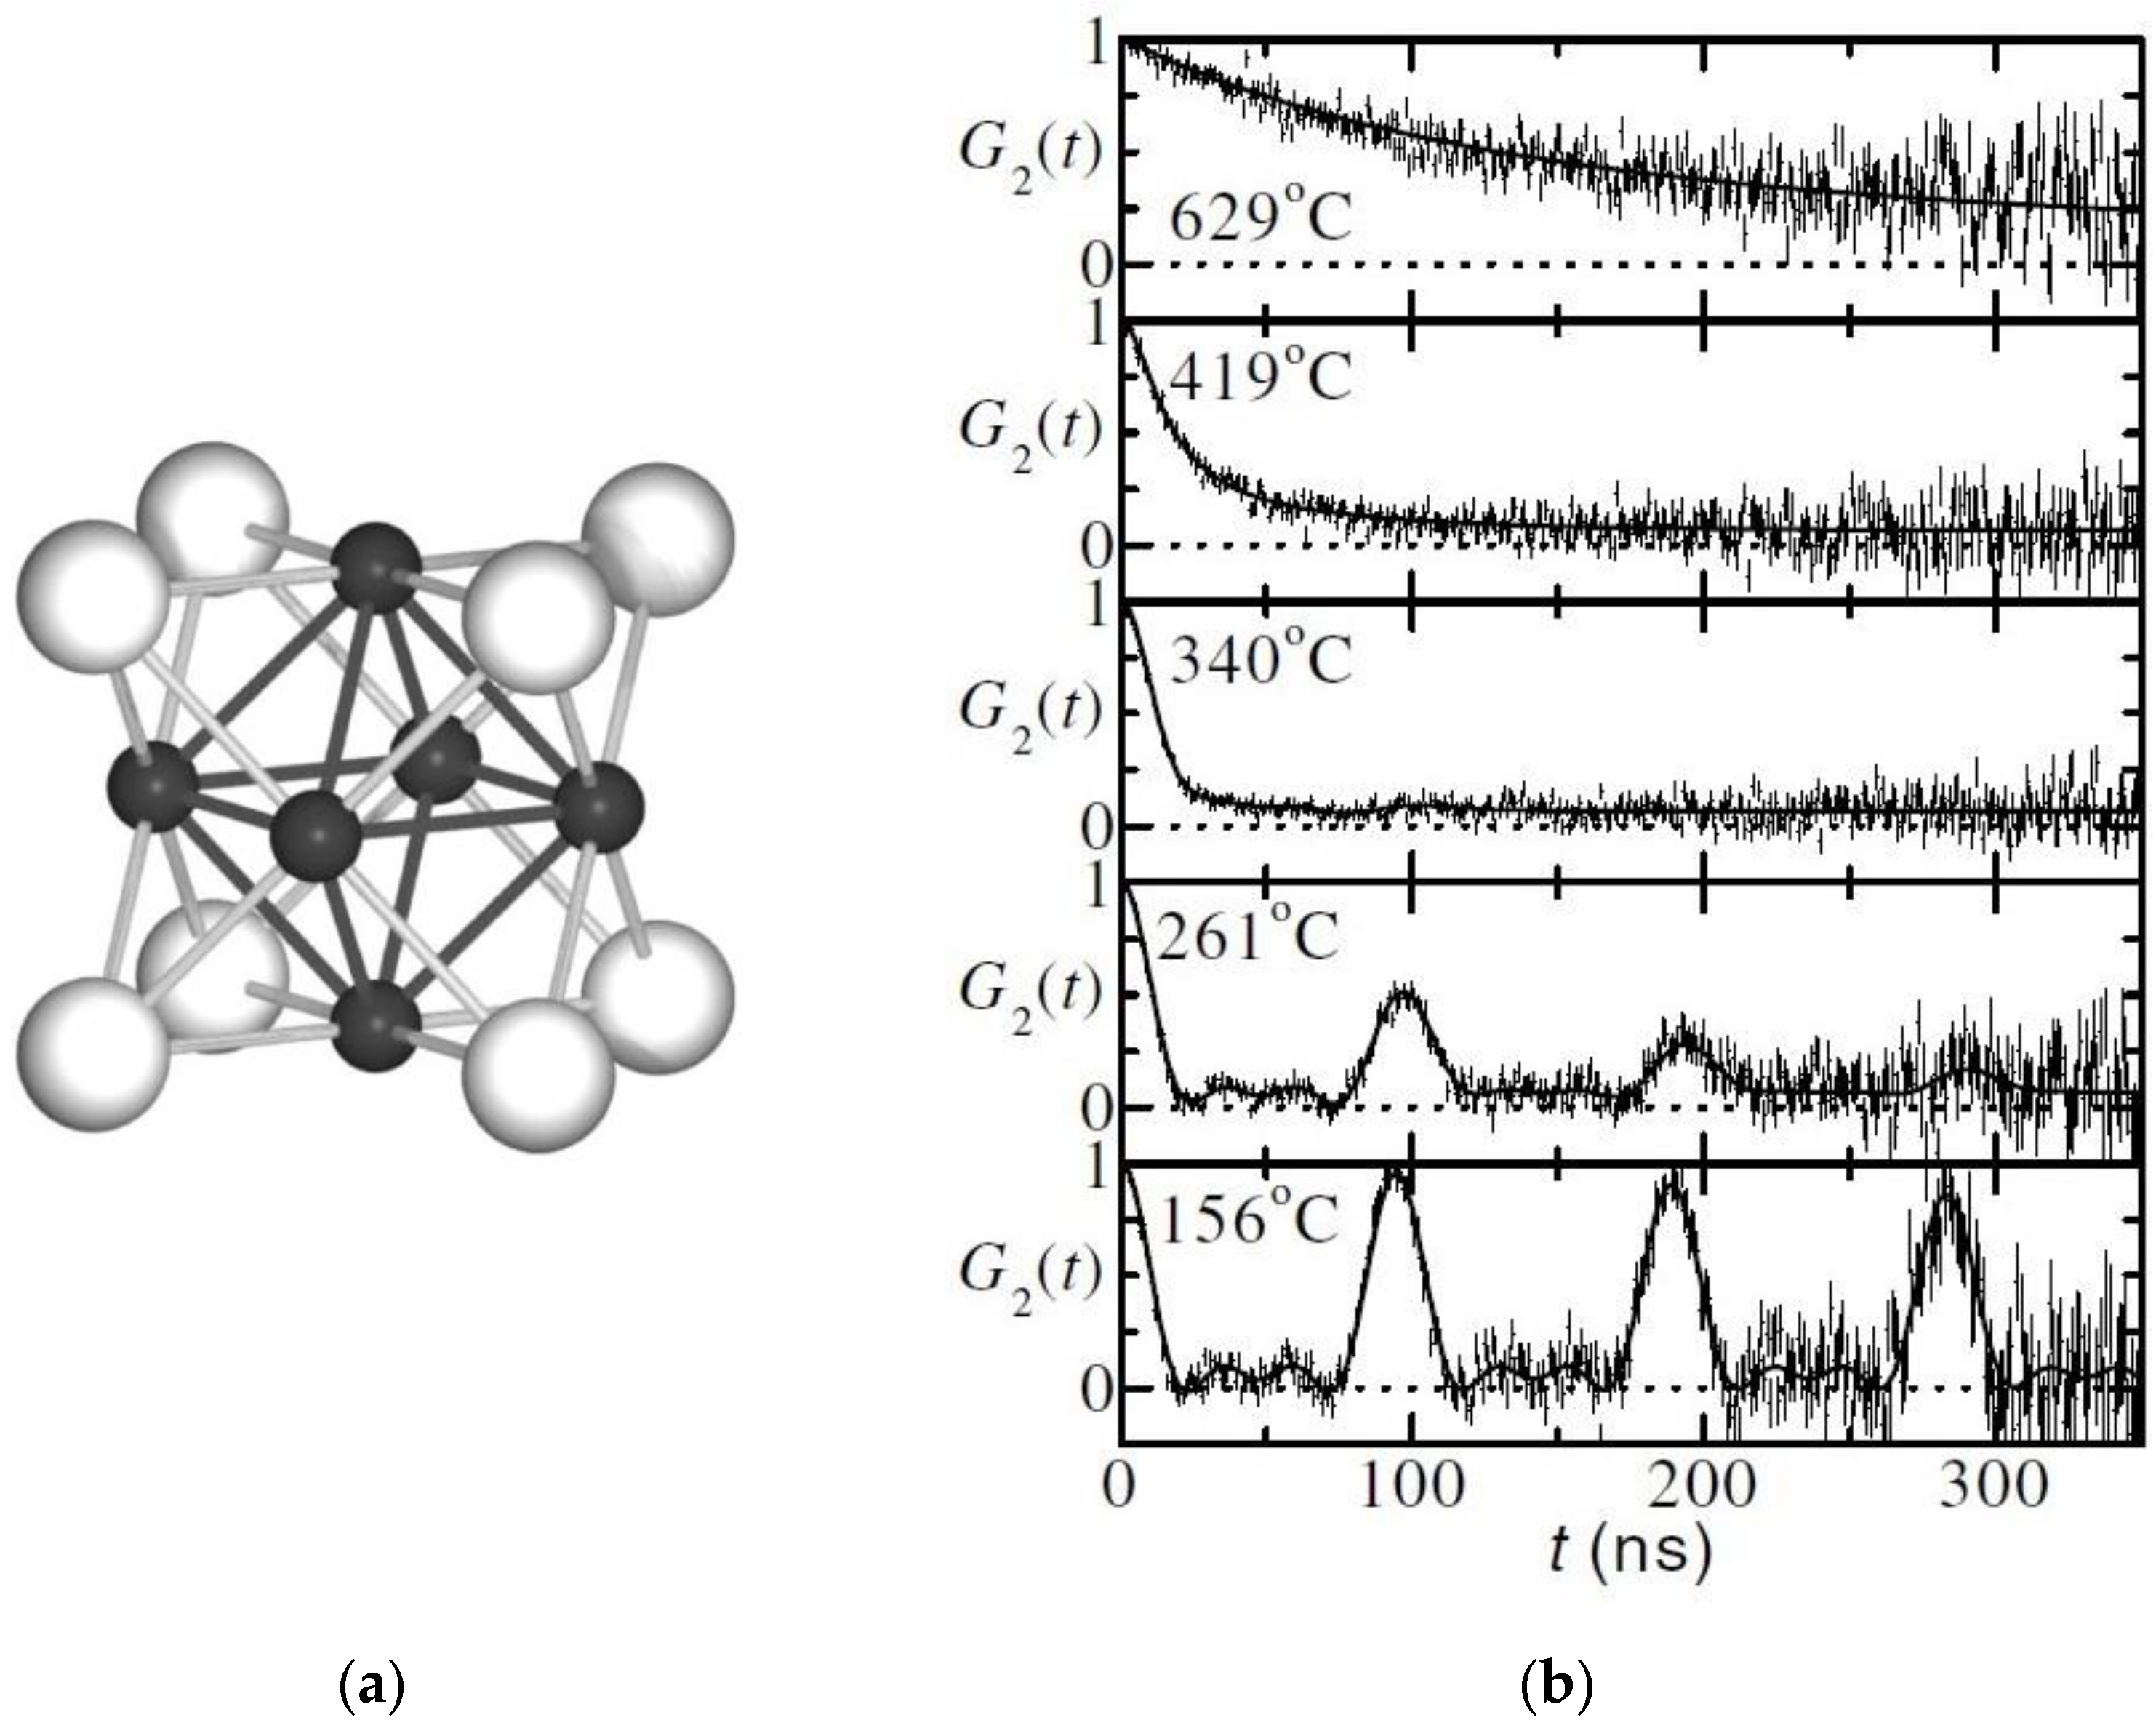
Use of PAC to study nuclear quadruple relaxation arising from movement of tracers was first reported for motion of 111Cd in In3La using 111In as the PAC parent isotope [5]. In3La has the familiar Cu3Au (L12, cF4) structure, shown in Figure 1a. Lattice positions occupied by In have tetragonal point symmetry, leading to an axially symmetric EFG, but there are three different orientations of the symmetry axis. This means that each first-neighbor jump among In-lattice sites (dark segments in Figure 1a) leads to reorientation of the EFG by 90°, which is the source of relaxation. This is manifested as damping of the PAC signal.
Spectra obtained using 111In in In3La are shown in Figure 1b. Below 156 °C, the perturbation function is essentially static. Spectra at 156 °C and 261 °C exhibit relaxation in the slow-fluctuation regime with relaxation factor proportional to the mean jump frequency of the tracer (i.e., to the inverse of the mean residence time of the tracer). Maximum relaxation is observed at 340 °C at which the temperature jump rate is roughly equal to the quadrupole interaction frequency. Above 340 °C, spectra exhibit relaxation in the fast regime, with inversely proportional to the mean jump frequency and = 0 because the motionally averaged EFG of three orthogonal axially symmetric EFGs is zero. As can be seen, diffusional reorientation of the EFG leads to dramatic changes in the shape and damping of measured perturbations.
111In-PAC measurements of Cd movement via this form of quadrupole relaxation have also been carried out in other compounds. These include many having the Cu3Au structure, including rare-earth stannides, aluminides, and other indides [2,6,7,8]. Also included are Ga7Pd3 [9] and Ga7Pt3 [10], which have the cubic Ge7Ir3 structure (D8f, cI40) with In/Cd tracer impurities distributed between two inequivalent Ga-sublattices, allowing simultaneous measurement of different degrees of relaxation due to different jump rates on two sublattices. Measurements also have been made in cubic -Mn [11] (A13, cP20). Jumps of the PAC tracer result in a reorientation of the EFG in all these systems.
PAC measurement of tracer jump rates through quadrupole relaxation has some advantages over other methods. Relaxation is measured by the degree of relaxation exhibited by a signal (or signals) that identifies the phase and lattice location(s) of the tracers. This makes it possible to use polycrystalline samples, because in the slow-fluctuation regime diffusion of tracers in grain boundaries would lead to signals distinguishable from those of tracers in the grain. It also makes it possible to distinguish behavior of tracers in one phase from another so that the phase-of-interest can be part of a two-phase mixture.
1.2. Al4Ba Crystal Structure
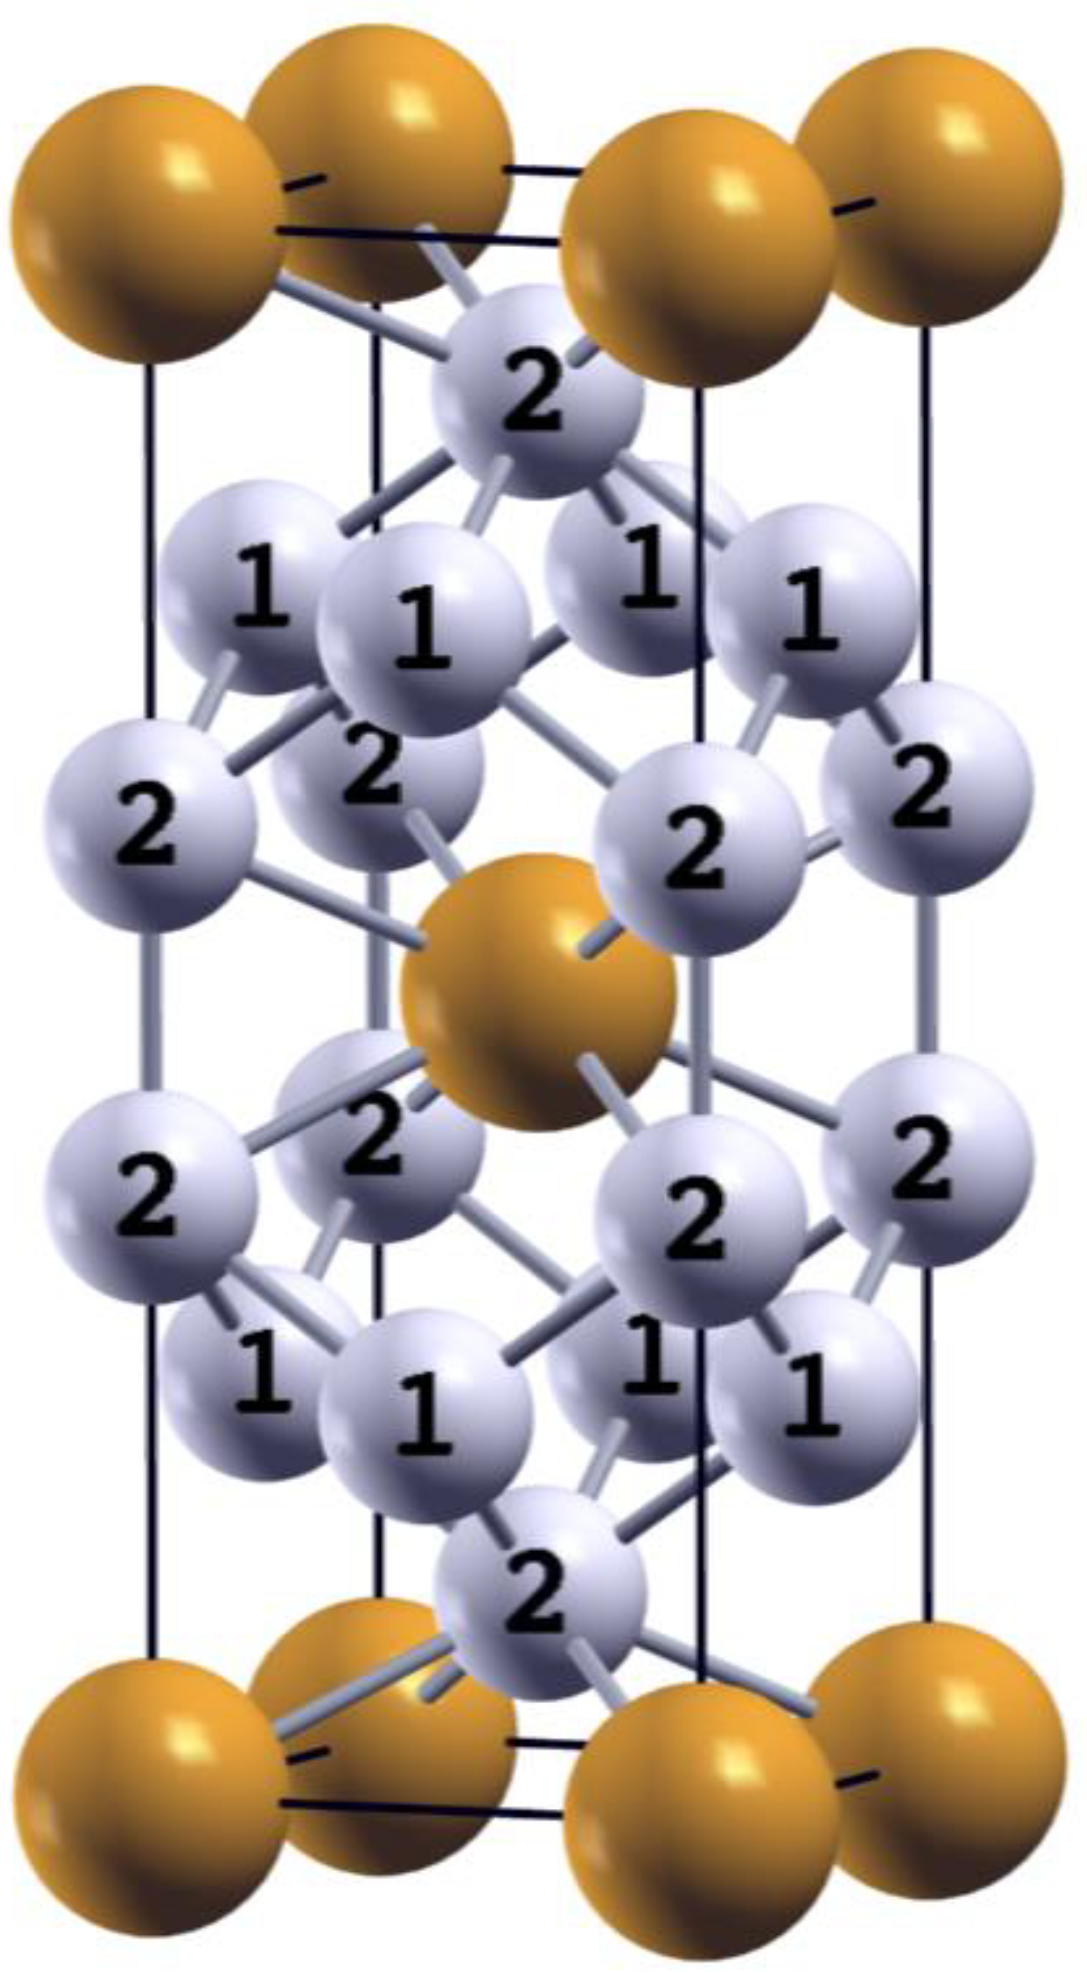
The Al4Ba crystal structure is favorable for accommodation of large atoms such as Ba or Sr and is the most common structure for intermetallic phases [12]. It is almost always the structure of the intermediate phase closest to the terminal phase of a binary system. The crystal structure is shown in Figure 2.
There are three sublattices, the Ba-type sublattice and two inequivalent Al-sublattices, each containing two Al-atoms per formula unit, and designated Al1 and Al2, as in the diagram [13]. In the following experiments, In/Cd tracers were observed to only occupy Al-type sites. The EFGs at both sites are oriented along the tetragonal axis, and, because of the different local environments, EFGs at the sites differ in magnitude and could have different signs.
As can be seen in Figure 2, Al1 sites have four nearest-neighbor Al2 sites while Al2 sites have four Al1 sites as well as one Al2 neighbor located along the tetragonal direction in the unit cell. Distances between near neighbors are given in Table 1. Diffusion via first-neighbor jumps allows atoms in Al1 sites to jump to only one of four neighboring Al2 sites, whereas atoms starting on Al2 sites can jump to one of four All sites or to the neighboring Al2 site along the long axis of the unit cell. Jumps between Al1 and Al2 sites lead to changes in magnitude (and possibly sign) of the EFG; but jumps between Al2 sites lead, by symmetry, to no change in EFG and are, therefore, “invisible” to the PAC measurement. For this structure, PAC is sensitive only to the alternating jumps between Al1 and Al2 sublattices.
Generally, diffusion in close-packed alloys comprised of elements with similar atomic radii is mediated by vacancies [14], and this likely is true for compounds with the Al4Ba structure. Very little information about point defects in Al4Ba-structured compounds is readily available in the literature. Recent density functional theory calculations for LaRu2P2, which has the Al4Ba structure, indicated that vacancy formation enthalpies are lower than interstitial formation enthalpies [15]. This is consistent with the expectation that the dominant contribution to diffusion will be mediated by vacancies.
As will be reported, no PAC signals were observed in the present work that could be attributed to vacancies or other point defects. This is typical of other PAC studies of tracer movement [2,5,6,7,8,9,10,11]. For a tracer to jump, there must be a vacancy at a neighboring lattice site. The probability that the tracer can jump between sublattices is proportional to , where is the number of first neighbors and is the vacancy concentration. Therefore, the jump rate of tracers will be a factor smaller than the jump rate of vacancies. This means that if tracers jump at a rate comparable to the inverse timescale of the PAC measurement, vacancies will be jumping much faster. In this case, vacancies make rapid enough “passages” past positions of probe atoms so that measured quadrupole interactions are unaffected by fleeting changes to EFGs caused by passing vacancies.
2. Materials and Methods
Samples of In4Ba, Al4Ba, Al4Eu, Al4Sr, and Ga4Sr were prepared by arc-melting high purity metals with 111In-activity under argon in a small arc-furnace. Indium concentrations were very dilute at about at.%. As will be shown below, PAC signals exhibited minimal frequency distributions, indicating that sample preparation led to highly ordered crystals having low concentrations of point defects. Spectra from In4Ba samples exhibited only two signals characteristic of the In4Ba phase, indicating volume fractions of any minority phases, if present, were minimal. For other samples, the lack of PAC signals from other phases does not necessarily mean minimal minority-phase volume-fractions, because the PAC tracer is an impurity and may preferentially dissolve into the Al4Ba-structured phases. In all cases, PAC signals from the Al4Ba-structured phases are not affected by the presence of minority phases, so further characterization of sample composition by, for example, X-ray diffraction was not deemed to be necessary.
In order to check whether or not spectra were influenced by composition, some samples were prepared that had mean compositions with 16–17 at.% divalent metal and with about 22 at.% divalent metal based on masses of metals before melting. All these compounds appear as line compounds in binary phase diagrams, and are, therefore, expected to have very narrow phase fields. This means that sample compositions likely fell in the two-phase fields on either side of the Al4Ba phases, in which case values for the degree of nonstoichiometry, x in Al4+5xBa1−5x, are not known based on mean composition. As will be shown, PAC measurements did not exhibit a variation with composition, so there was not a need to measure compositions of the Al4Ba phases; instead, samples are referred to as divalent-metal rich or divalent-metal poor.
PAC measurements were made using a four-detector spectrometer with BaF2 scintillators. More information about the setup and data reduction can be found in ref. [16].
When PAC tracers are distributed between two inequivalent lattice sites at low temperature, the perturbation function will be given by the weighted sum of perturbation functions of the static form given by Equation (1):
where and are fractions of tracers at each lattice site and quadrupole interaction frequencies and are, in general, different because of different EFGs at the two sites.
At elevated temperature, diffusion of PAC tracers on aluminum sublattices in the Al4Ba structure involves jumps between Al1 and Al2 sites. When such jumps occur at rates comparable to the inverse timescale of the PAC measurement, the perturbation function will exhibit features characteristic of stochastic fluctuations of the quadrupole interaction between the two EFG states. Fluctuations of this type, between two EFGs with collinear main principal axes of different magnitudes, were considered in detail by Achtziger and Witthuhn [17].
The jump rates of tracers between the two sublattices are proportional to and , the rates of EFG fluctuation from site 1 to 2 and from site 2 to 1, respectively. It is convenient to define a dynamic parameter , where is the difference in quadrupole interaction frequencies of the two sites. The negative sign is used when EFGs have the same sign. In equilibrium, the distribution of tracers experiencing the two EFGs are related to fluctuation rates between EFGs by detailed balance: .
Empirical forms of given in Equations (2) and (3) can be used as a convenient approximation to expressions given by Achtziger and Witthuhn. In the fast-fluctuation regime, , Equation (3) can be used as-is, with the interaction frequency given by the weighted average of the two site EFGs, where the negative sign is used when EFGs have opposite signs, and . In the slow-fluctuation regime, ,
where is a small unperturbed fraction, and interaction frequencies and are shifted from and toward with the degree of shift proportional to .
Achtziger and Witthuhn characterized progression of the perturbation function with increasing dynamic parameter in three regimes they called quasistatic, intermediate, and fast fluctuation domains corresponding to , , and , respectively. In order to describe results in the present work, it is convenient to consider the behavior divided into four regimes, which correspond to different ranges in temperature, as follows.
- Low temperature—static regime. A sum of two PAC signals as in Equation (4) due to tracers distributed among the two Al sublattices. Additional signals arising from point defects such as vacancies will not be observed if defect concentrations are less than around 1%, which can be expected for a well-ordered intermetallic compound at low temperature. The values of quadrupole interaction frequencies and likely will decrease with increasing temperature due to thermal expansion and effects of lattice vibrations [18]. Shifts of interaction frequencies and damping will be negligible because jump rates are very low.
- Moderate temperature—slow-fluctuation regime. Tracer jumps occur on the timescale of the PAC measurement with dynamic parameter . Just as in the static regime, a sum of two PAC signals will be observed, but the spectrum is more appropriately described by Equation (5), because jump rates are sufficiently high to induce apparent shifts of interaction frequencies, and, depending on , damping may be detectable. Degrees of shifts and damping, if visible, increase with increasing temperature. Maximum damping occurs when such that .
- Moderate temperature—rapid-fluctuation regime. Tracer jumps occur on the timescale of the PAC measurement with . A single PAC signal will be observed with damping due to fluctuating EFGs, as in Equation (3). Maximum damping occurs at , and damping now decreases with increasing temperature. The value of the dynamically averaged frequency will change with increasing temperature due to two effects: (1) changes in site fractions if r12 and r21 have different activation enthalpies and (2) further decreases in and due to their temperature dependences caused by thermal-expansion and lattice vibrations.
- High temperature—motionally averaged regime. The fluctuation rate is now so large that the PAC signal does not exhibit any damping. The value of will continue to change with increasing temperature due to both effects present in the rapid-fluctuation regime.
As will be seen, measurement conditions present for systems in this study did not allow one to observe all four relaxation regimes in a single sample.
A large obstacle in analyzing spectra comes from small values in , which puts a limit on maximum possible values of and in the slow-fluctuation regime, corresponding to . Small enough values of lead to exponential damping factors too small to measure. In studies of relaxation in the Au3Cu-structured compounds, it was found that damping parameters smaller than about 1 MHz could not be determined reliably [2,5,6,7,8]. For those systems, a single signal was present. In the current work, two signals are present in the slow-fluctuation regime. Interaction frequencies, site fractions, and fluctuation rates are correlated strongly enough to make it difficult to measure damping. Thus, the lower limit for measurable fluctuation rate in the slow-fluctuation regime is likely higher than in the previous work: 2 MHz, as an estimate.
Another obstacle comes from uncertainty in how much of observed temperature dependences of fitted quadrupole-interaction frequencies in the slow-fluctuation regime are due to thermal expansion and lattice vibrations and how much are due to EFG fluctuation. In two of the systems of the current work, it was possible to identify static and slow-fluctuation regimes, so that fluctuation rates could be extracted from fits.
Instead of using formulas from ref. [17] to relate frequency shifts and damping to fluctuation rates, one can fit spectra to perturbation functions calculated numerically via
where is the qth eigenvalue of the Blume matrix and Gq are time-independent factors that depend on projections of eigenvectors on the vector space and distribution of parent isotope among EFGs in the system [19,20]. The Blume matrix is constructed from Hamiltonians describing the quadrupole interactions experienced by probes in the two Al-sites and the rates of transition between the two interactions [21]. The form of the Blume matrix suitable for fluctuations between two collinear EFGs is given in Appendix A. Fits to Equation (6) were carried out using PolyPacFit [22] with quadrupole interaction frequencies and , transition rates r12 and r21, and fractions of 111In in each lattice site, f1 and f2, as adjustable parameters.
3. Results
With the expectation that atomic jump rates will only be large enough to lead to observable relaxation above room temperature, most measurements were made between room temperature and the temperature above which PAC tracers diffused out of the sample during data collection. This upper temperature varied from system to system. For In4Ba and Al4Ba, spectra also were collected at −196 °C. The −196 °C measurements did not contribute to understanding of temperature dependences of fitted parameters but are included for completeness.
In all five systems, two axially symmetric quadrupole interactions were observed at low temperatures where diffusional motion was negligible compared to the 120-ns lifetime of the PAC level. Axial symmetry indicates the signals arise from tracers that substitute at regular lattice site and do not have nearby point defects, as the presence of a point defect would tend to break axial symmetry. It is natural to attribute the two observed signals as arising from tracers on the two Al-type sites rather than one Al-type site and the Ba site because of (1) the chemical similarity of the tracer parent isotope to the host element occupying the Al-type site, and (2) the good match between tracer atomic size and volumes of Al-sites.
Measurements are reviewed first for In4Ba, in which 111In is a host-element so that PAC tracers must be distributed equally between Al-type sites. Then, results are given for Al4Ba and Al4Eu, which exhibit similar temperature-dependences of quadrupole interaction frequencies. Finally, results are given for Al4Sr and Ga4Sr, which have temperature dependences of interaction frequencies that allow calculation of mean EFG reorientation rates.
3.1. In4Ba
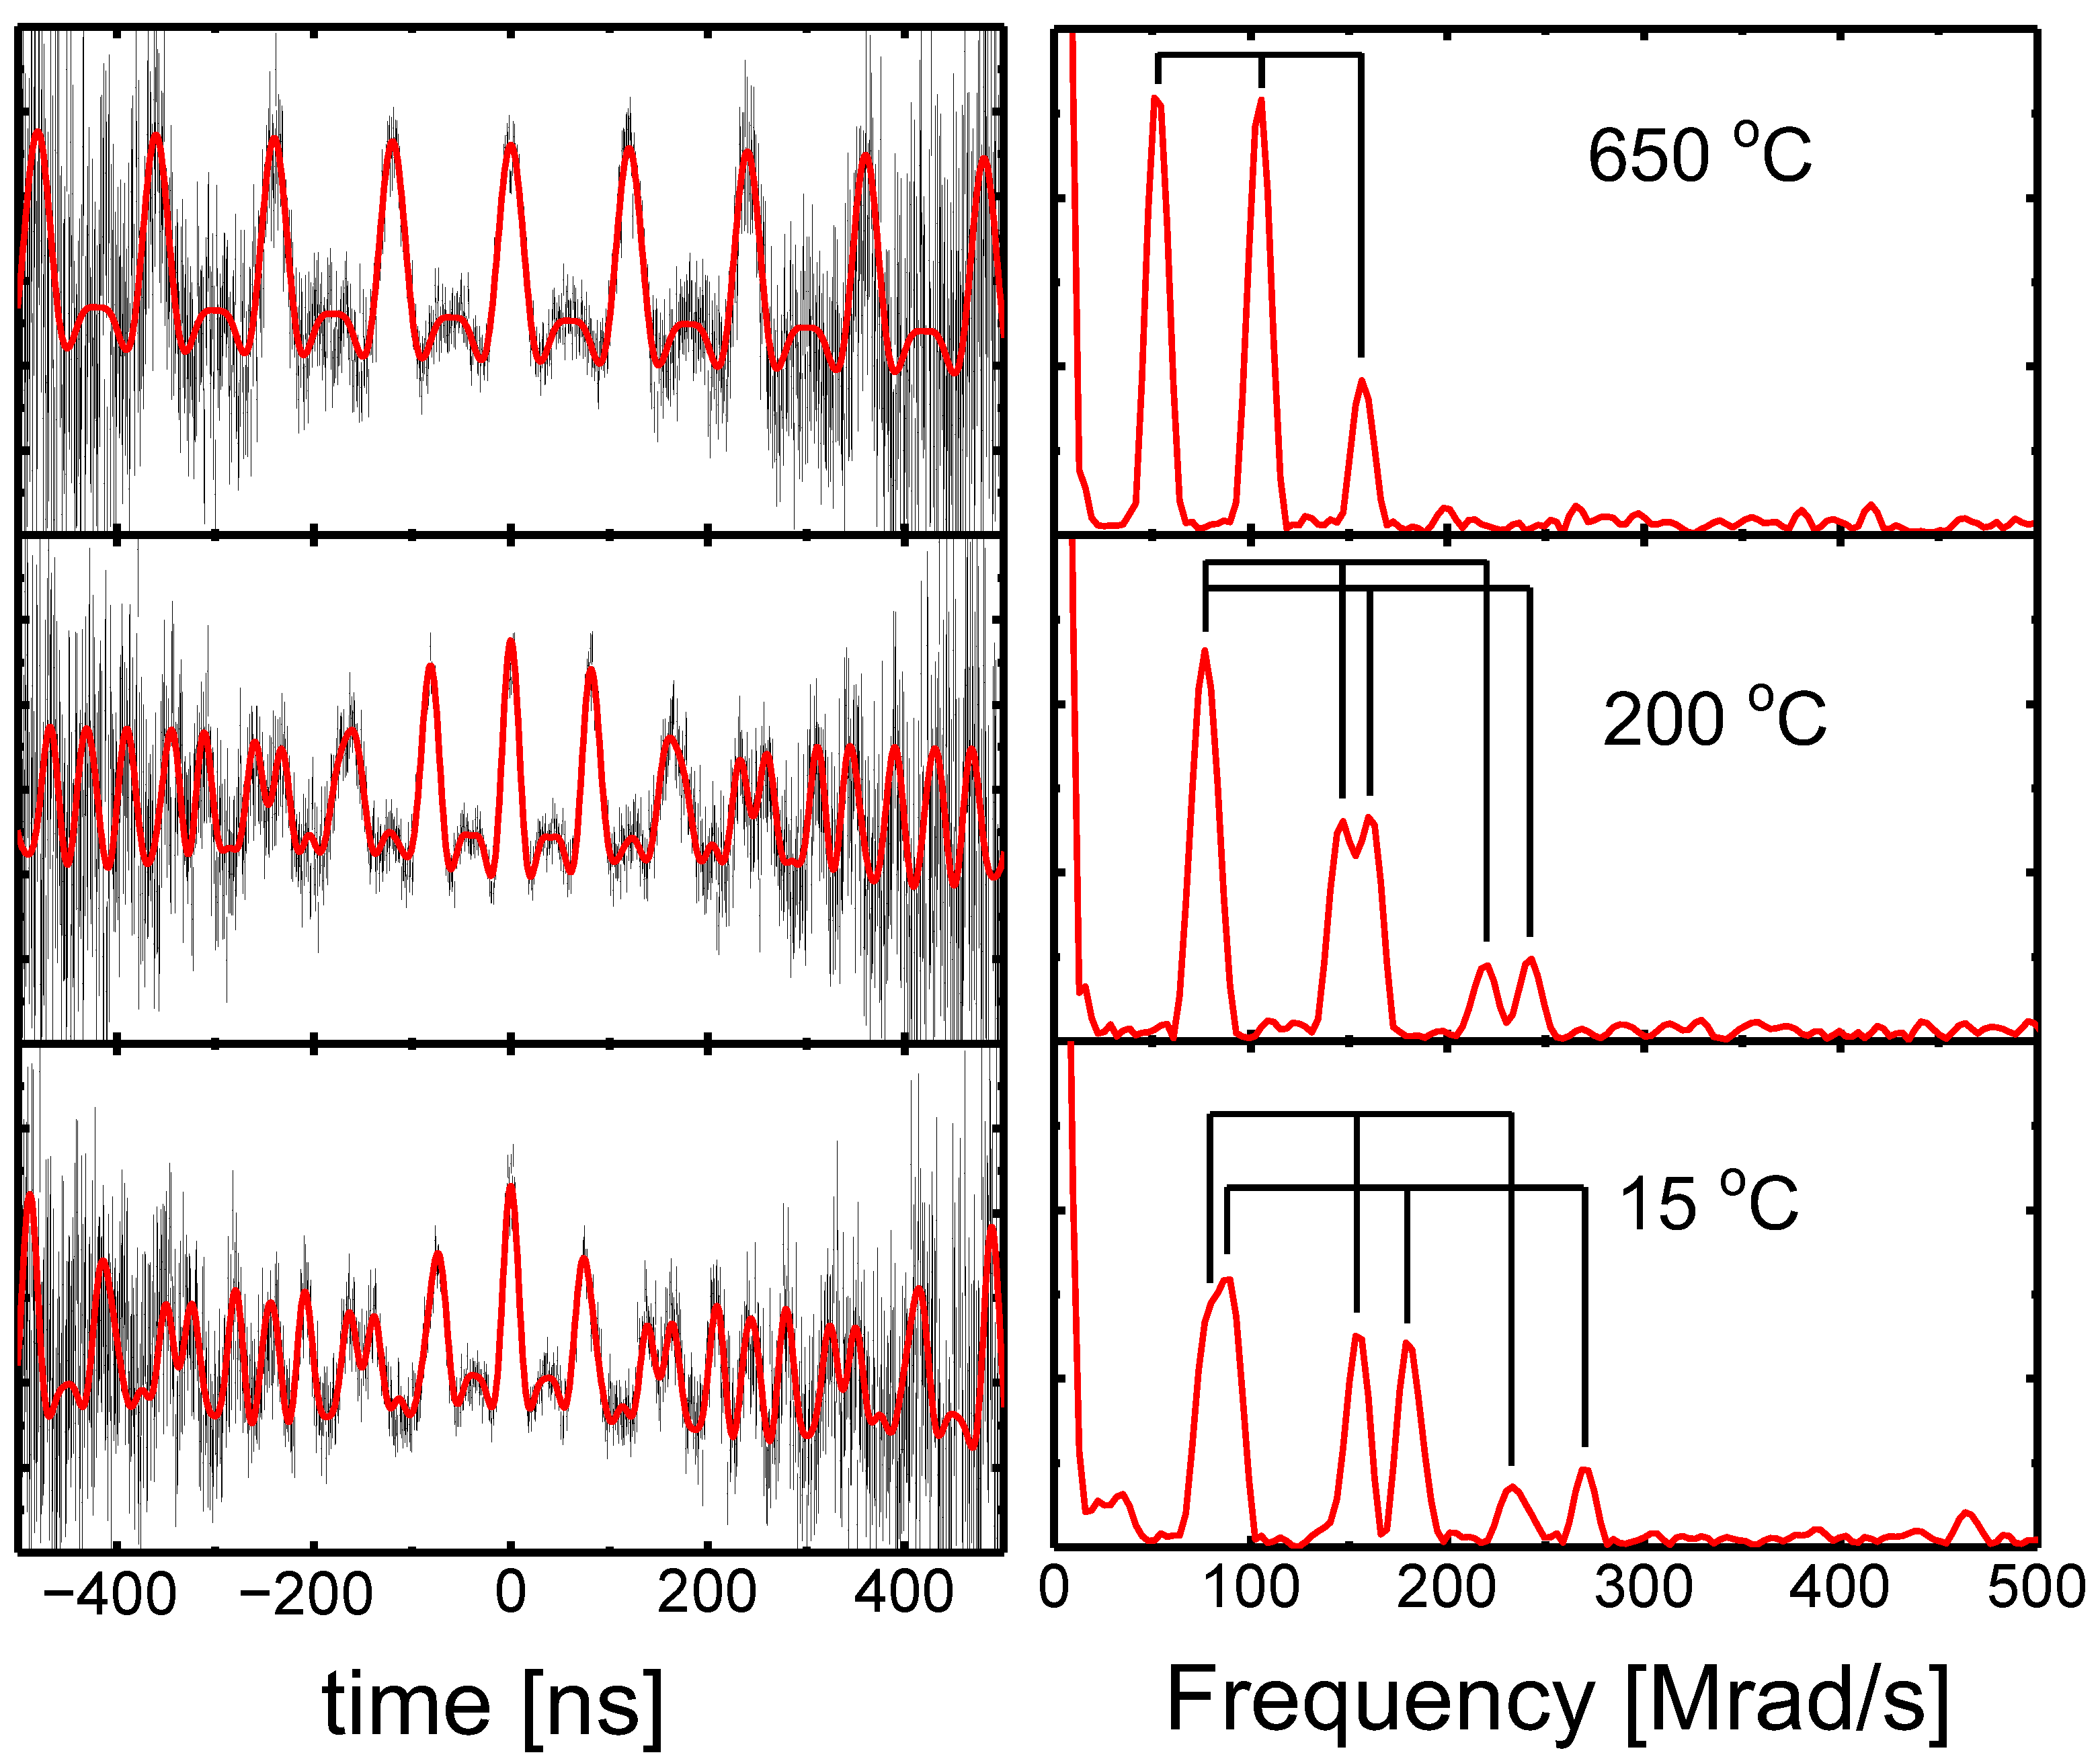
PAC spectra for In4Ba are shown in Figure 3. They exhibit features typical of spectra in most systems studied in the present work. At 15 °C, two signals with equal site fractions () were observed; they are most readily seen when spectra are plotted in the frequency domain, with the trio of harmonics for each signal marked using trident symbols. At 200 °C frequencies are only partially resolved while at 650 °C the signals are collapsed into a single, averaged interaction. Amplitudes of the three harmonics deviate from values for a random polycrystalline sample (, , , and ). This effect is known as texturing and occurs in samples that do not have uniform distribution of randomly oriented grains, which can be a result of sample preparation and annealing, especially for non-cubic materials.
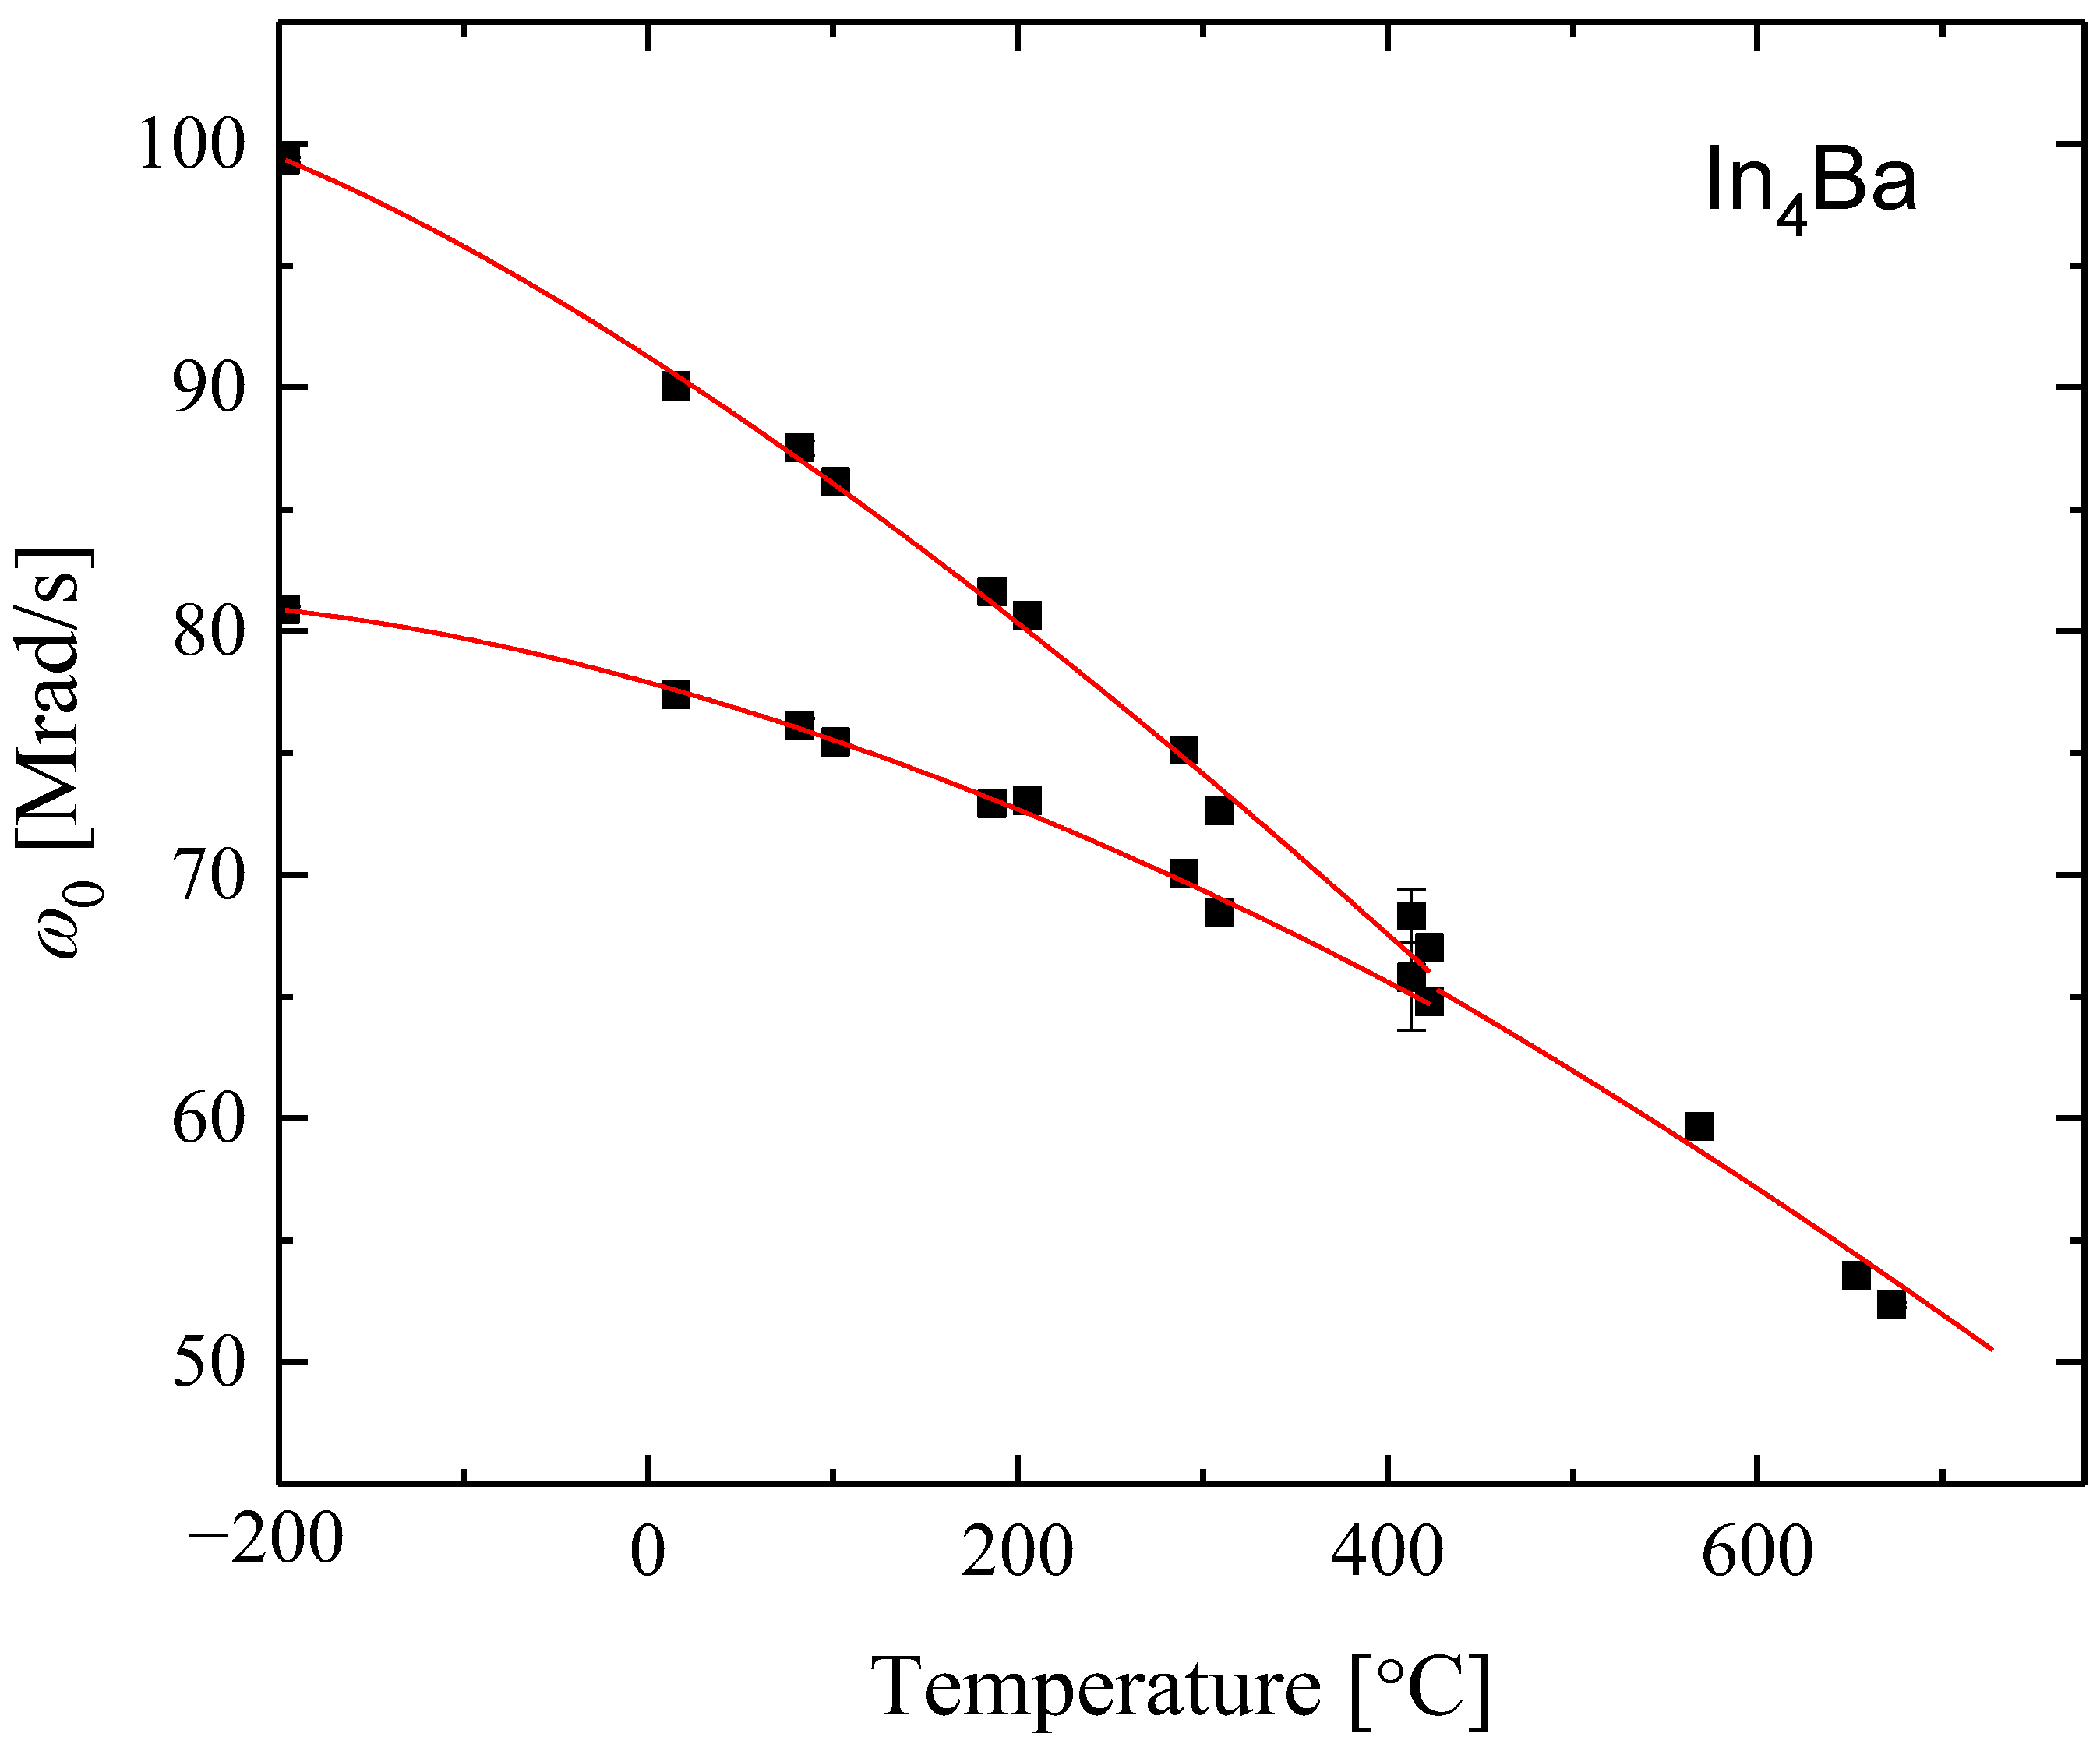
Figure 4 shows fitted values of the fundamental frequencies of signals as functions of temperature. As can be seen, two signals are observed at lower temperature, and their frequencies decrease with increasing temperature, as expected because of thermal-expansion and lattice-vibration effects. Density-functional theory calculations of EFGs for Cd on the two In-sublattices in In4Ba showed that the higher-frequency signal corresponds to tracers on In1 (i.e., Al1-type) sites [23]. With increasing temperature, the two signals have merged and only one signal is visible.
Merging of the two signals is attributed to frequency-averaging, as described in more detail in Appendix B. Tracer atoms jump back and forth between the two sublattices more and more rapidly as the temperature increases, going from the slow-fluctuation to fast-fluctuation regime at the merging temperature of about 450 °C. In the slow-fluctuation regime, spectra were fit well using values of in Equation (5). This does not mean fluctuation rates (and jump rates) were zero, but rates were less than about 2 MHz, as explained above.
Temperature dependences of measured interaction frequencies caused by relaxation shifts overlap temperature dependences of the (not directly measured) static interaction frequencies caused by thermal expansion and lattice vibrations, and, unfortunately, it is not possible to resolve the two dependences. Expressed differently, it is not possible to determine the value of at the temperature where measured frequencies merge (around 450 °C in Figure 4). If it were, then it would have been possible to determine the values of and accurately. The merging of signals indicates that EFG fluctuations must be on a timescale comparable to the 120-ns lifetime of the PAC level. That is, so that one can place 8 kHz as the lower limit for and . Thus, fluctuation rates and, by extension, tracer jump rates, are between 8 kHz and 2 MHz at 450 °C.
Based on typical diffusivity of metals in intermetallic compounds, one can reasonably assume that the spectrum measured at −196 °C corresponds to the static regime and that somewhere between that measurement and the signal merging spectra correspond to the slow-fluctuation regime. However, it is not possible to distinguish between these regimes in the In4Ba system. The upper three measurements correspond to the motionally averaged regime.
3.2. Al4Ba and Al4Eu
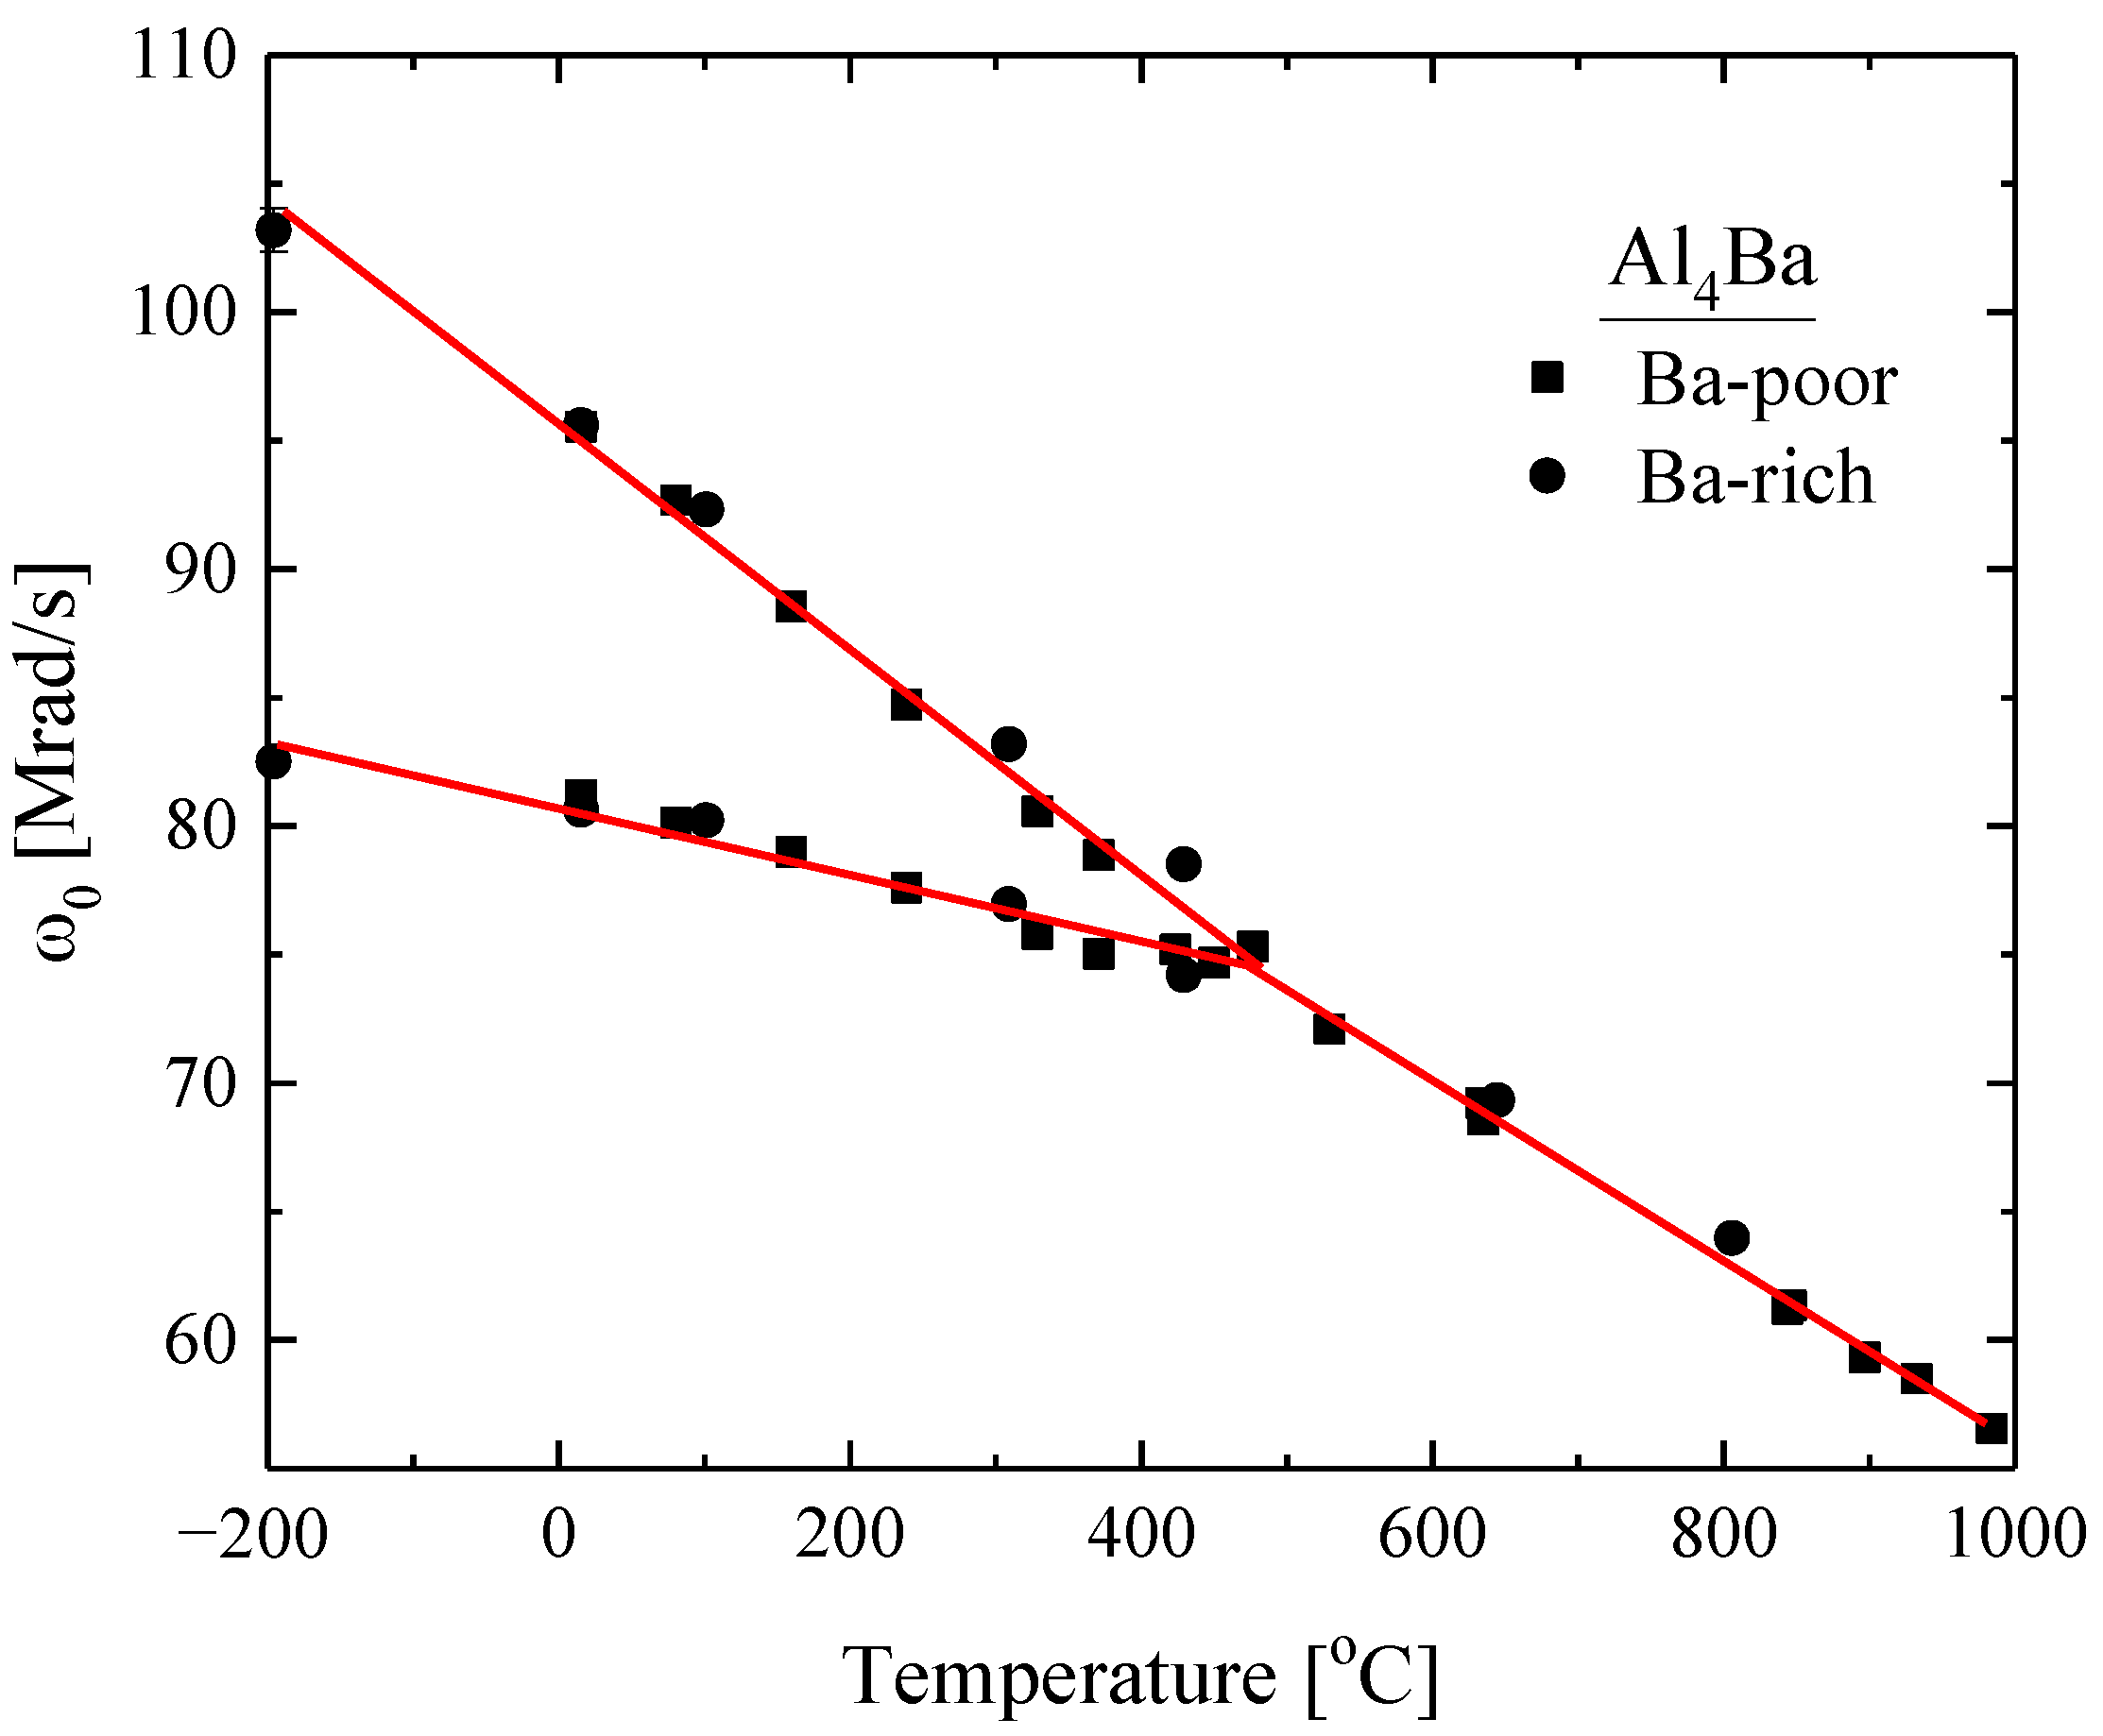
Temperature dependence of interaction frequencies of signals for Al4Ba obtained through fits to Equation (5) below about 450 °C (static- and slow-fluctuation regimes) and to Equation (2) above 450 °C (motionally averaged regime) are shown in Figure 5. The behavior is similar to that seen for In4Ba but with exceptionally linear temperature dependences from liquid-nitrogen temperature to the frequency-merging temperature at 450 °C and again to 1000 °C. Spectra were collected for two samples, one made to have a slightly Ba-rich composition and the other to have Ba-poor composition. As can be seen, measured frequencies for both samples are in excellent agreement.
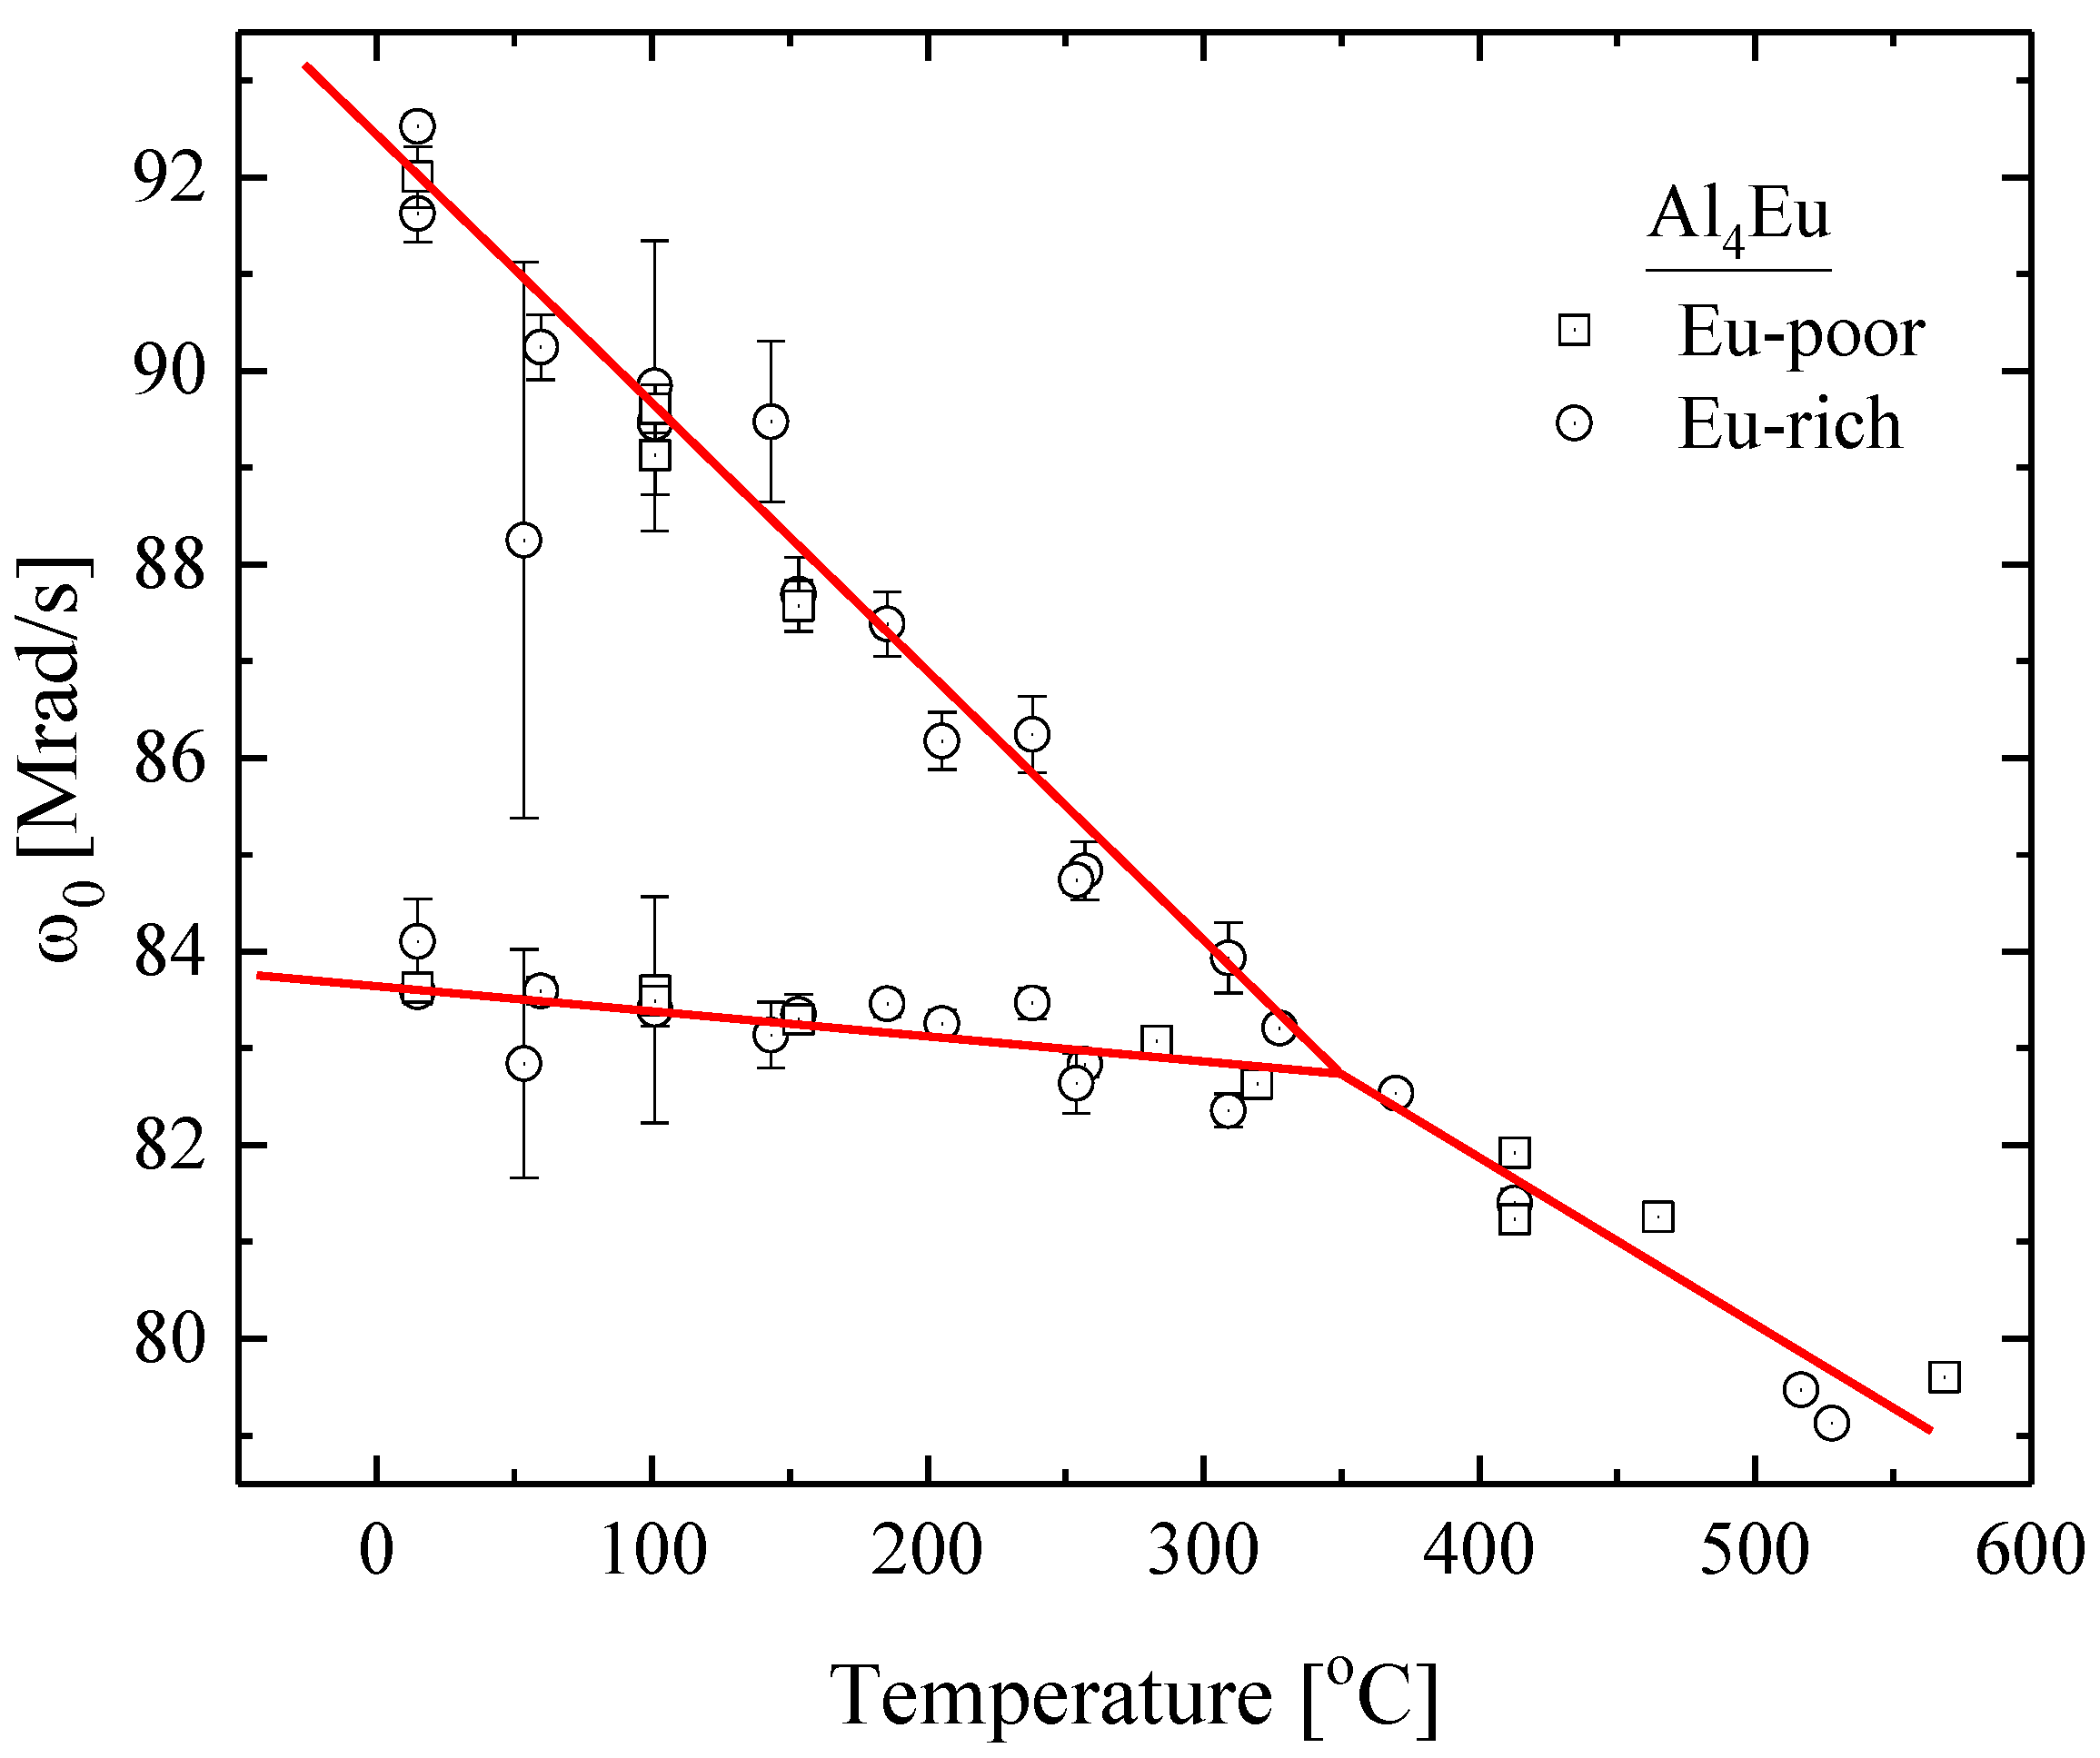
Figure 6 shows temperature dependences of measured quadrupole interaction frequencies in Al4Eu. The behavior is very similar to that observed for Al4Ba, again with very linear temperature dependences and good agreement between samples prepared to have Eu-rich and Eu-poor compositions. The temperature at which frequencies merge is lower, approximately 350 °C.
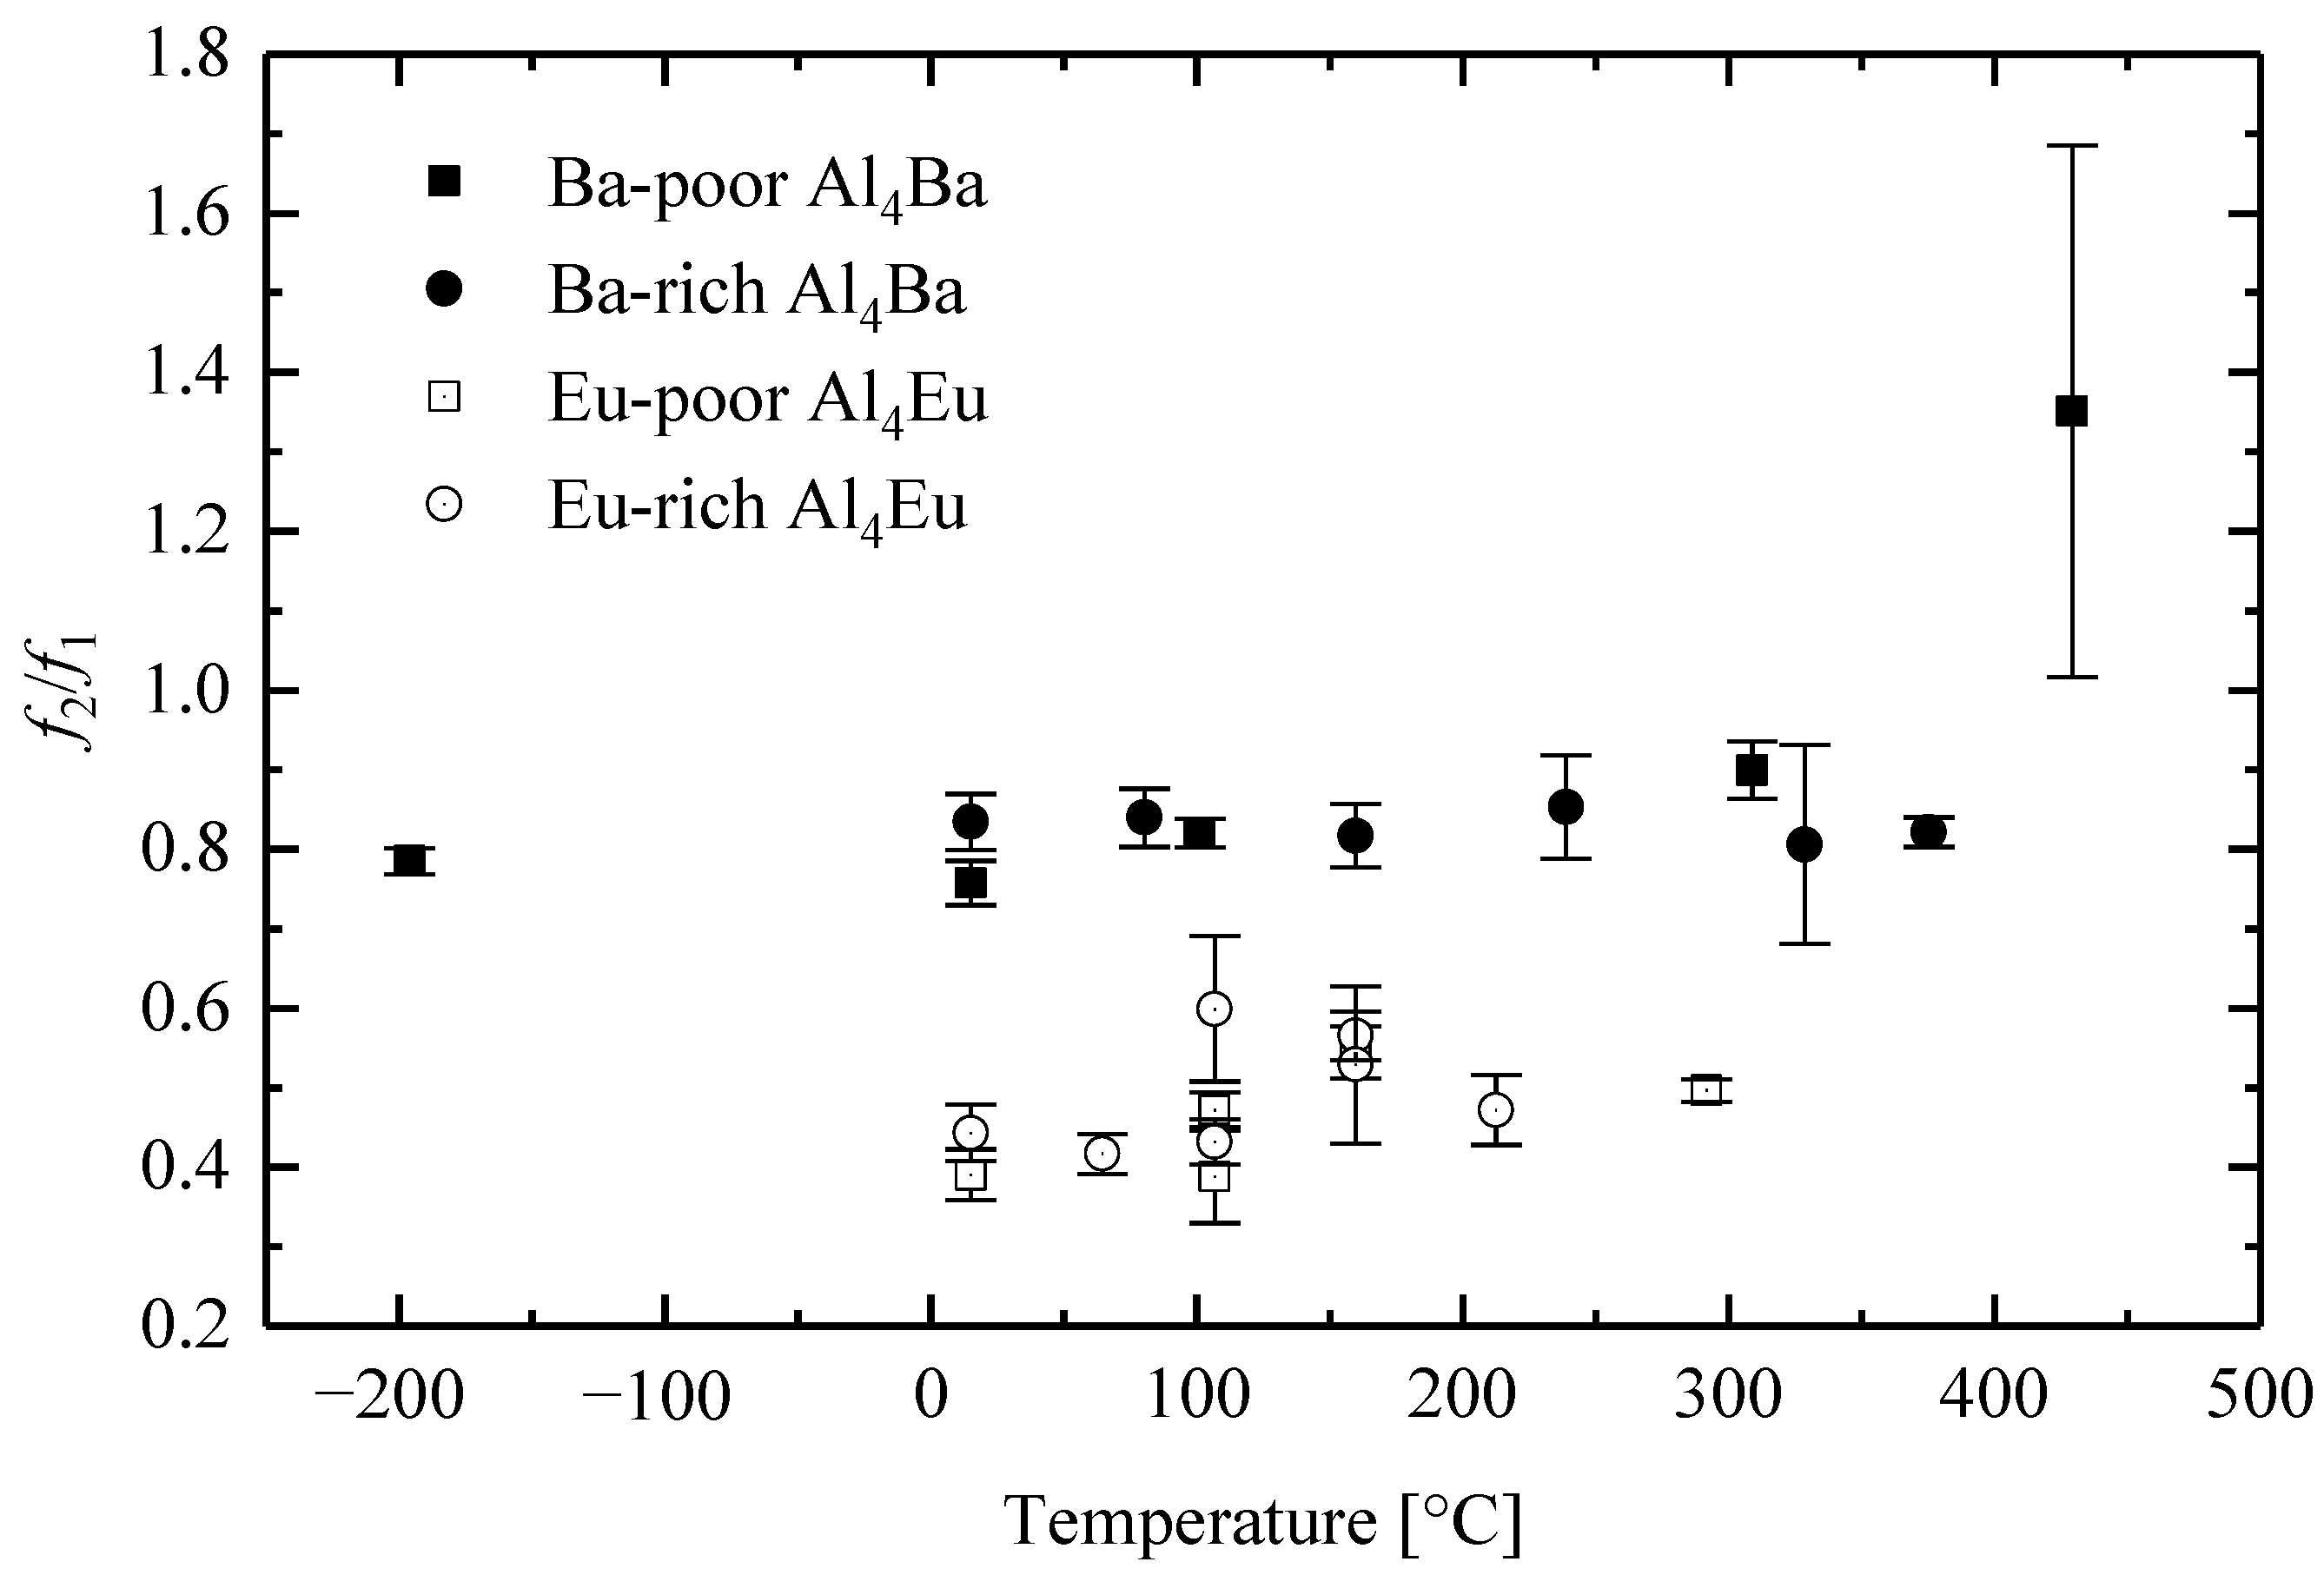
When the In PAC tracer is an impurity, as is the case for Al4Ba and Al4Eu, tracers will not, in general, be distributed equally between the two Al sublattices, as they must in the case of In4Ba. The distribution may have a temperature dependence if there is a difference in activation enthalpies of and , since . Site-fraction ratios for signals from Al4Ba and Al4Eu are plotted as a function of temperature in the slow-fluctuation regime in Figure 7. As can be seen, there is little-to-no dependence on temperature or composition. Average site-fraction ratios, excluding the value at 429 °C, are 0.82(1) and 0.49(2) for Al4Ba and Al4Eu, respectively, where is the fraction of tracers experiencing the larger quadrupole interaction frequency.
As was the case for In4Ba, damping factors in Equation (5) were too small to detect because temperature dependences of interaction frequencies led to small values of near . Thus, it was not possible to observe spectra characteristic of the rapid-fluctuation regime. Again, one can only place bounds on fluctuation rates at the merging temperature. That is, fluctuation rates are between 8 kHz and 2 MHz at 450 °C and 350 °C.
3.3. Al4Sr and Ga4Sr
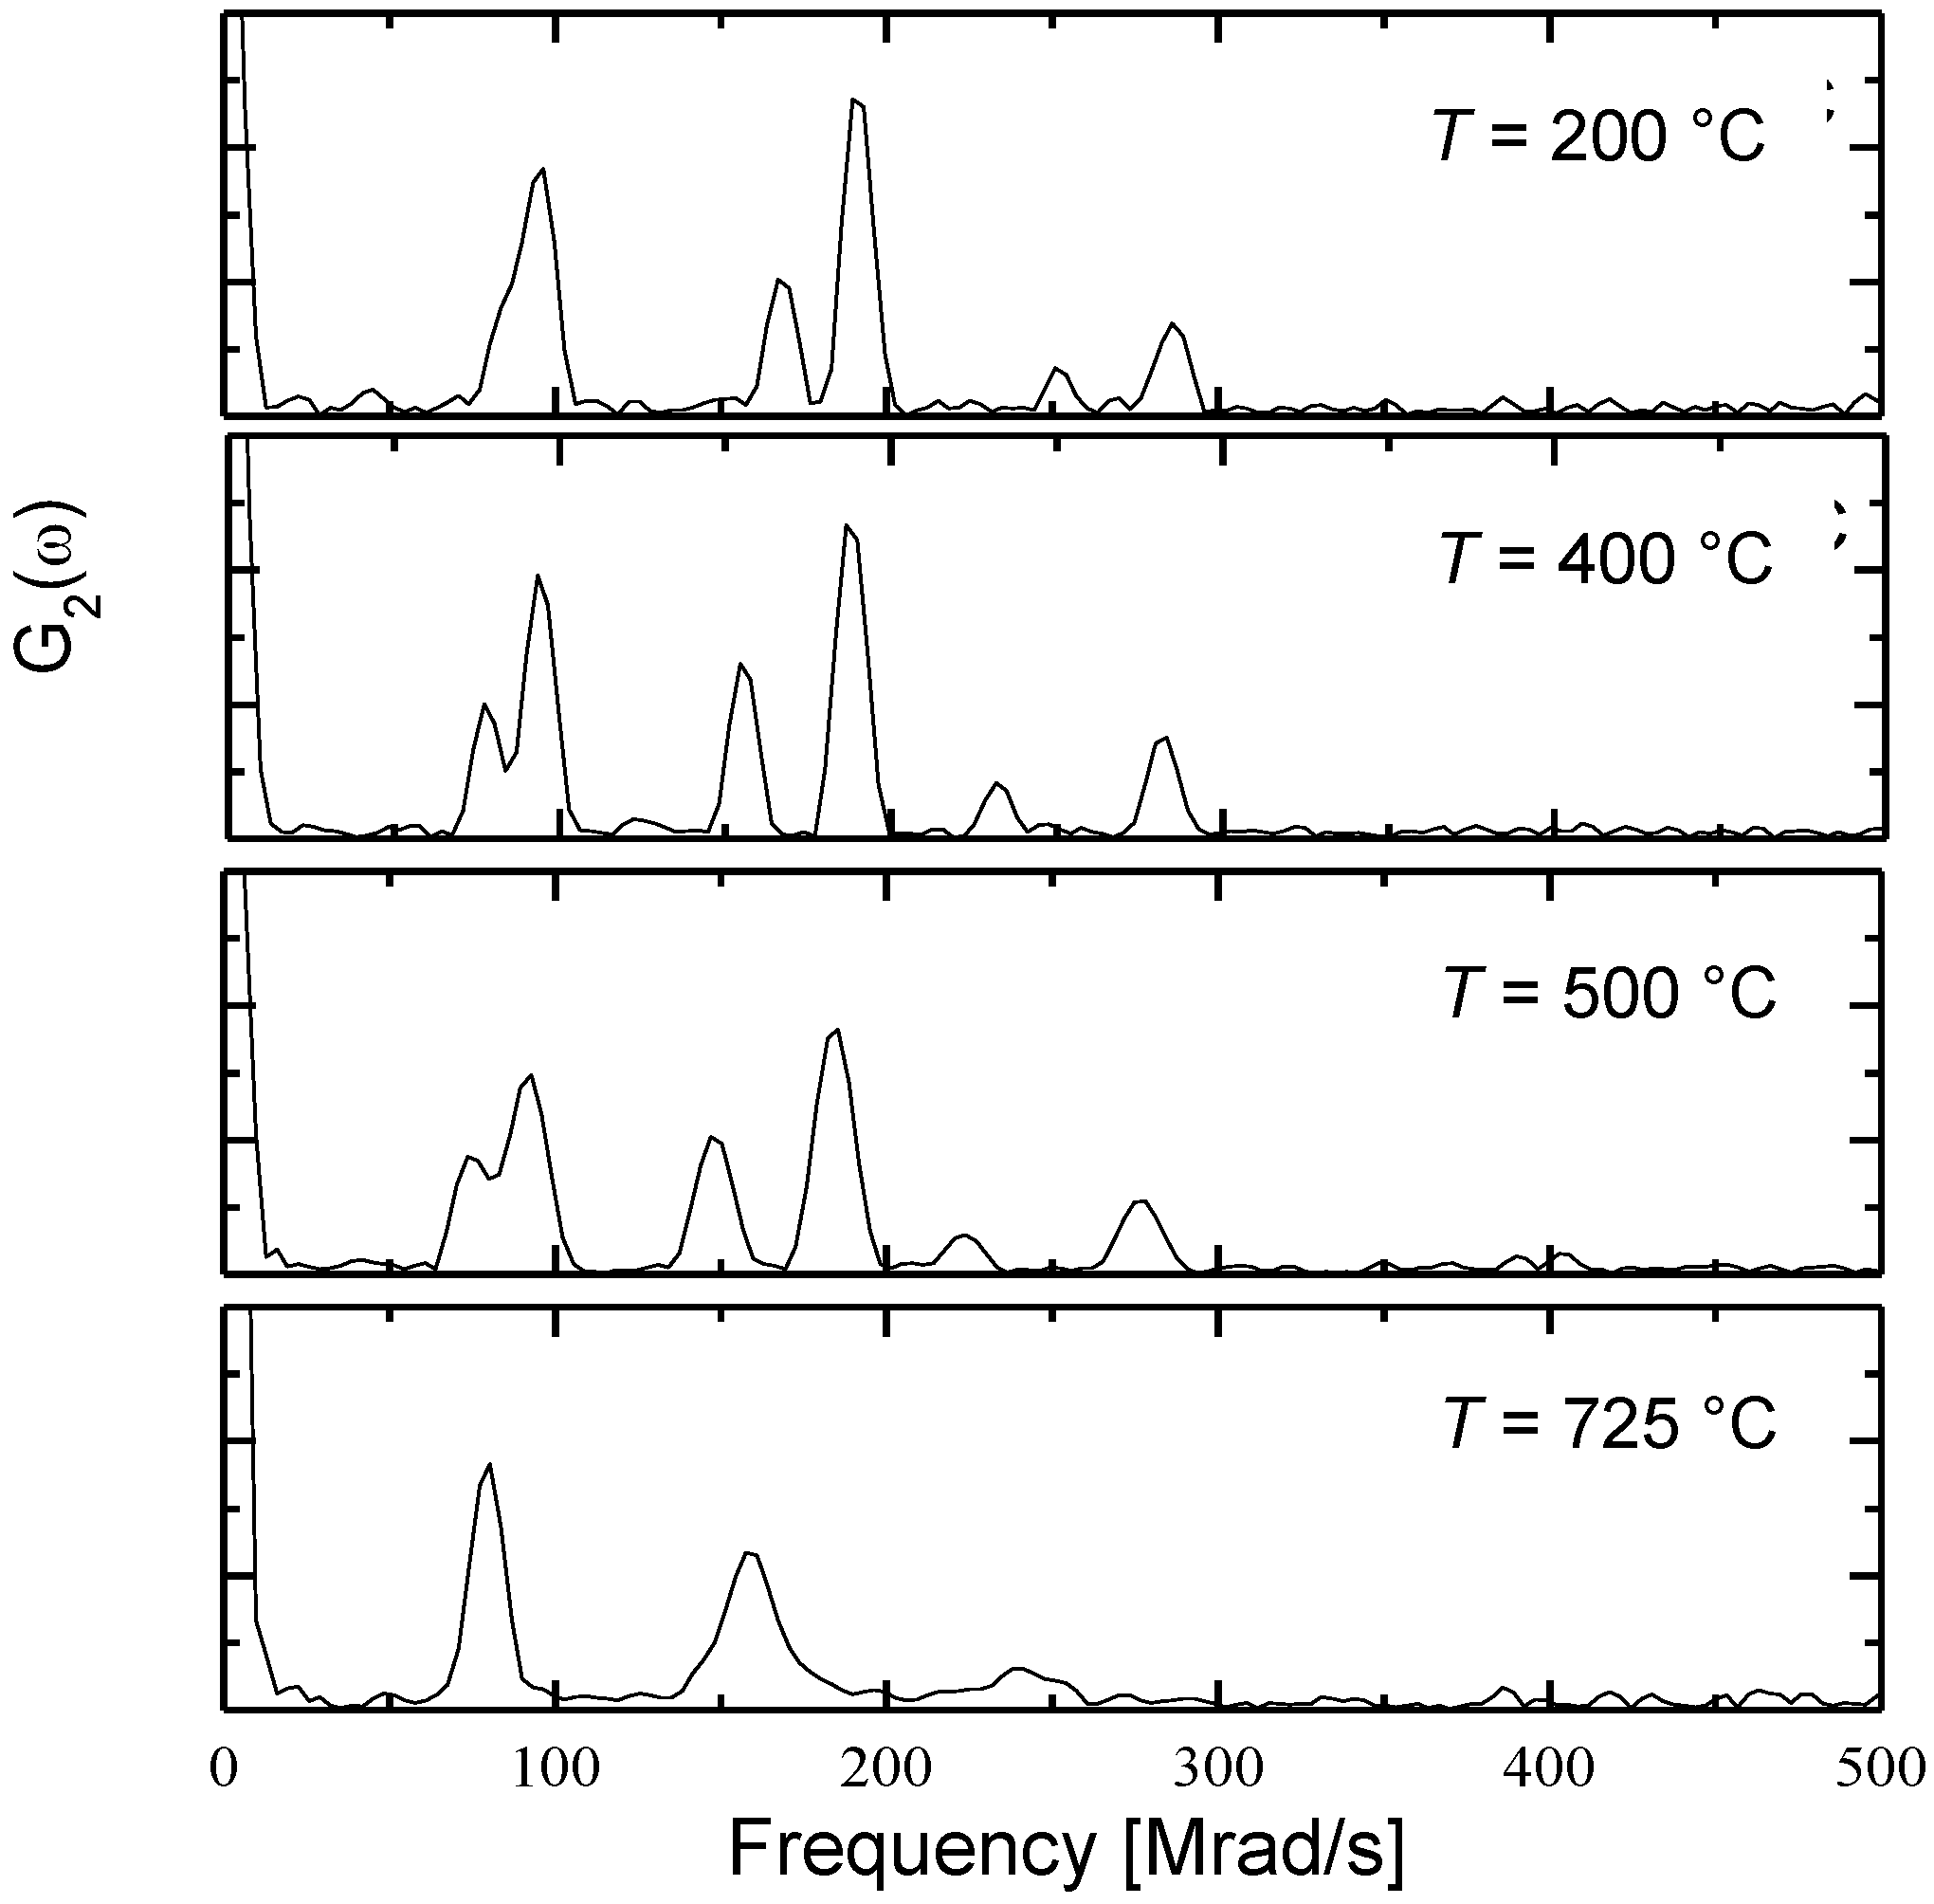
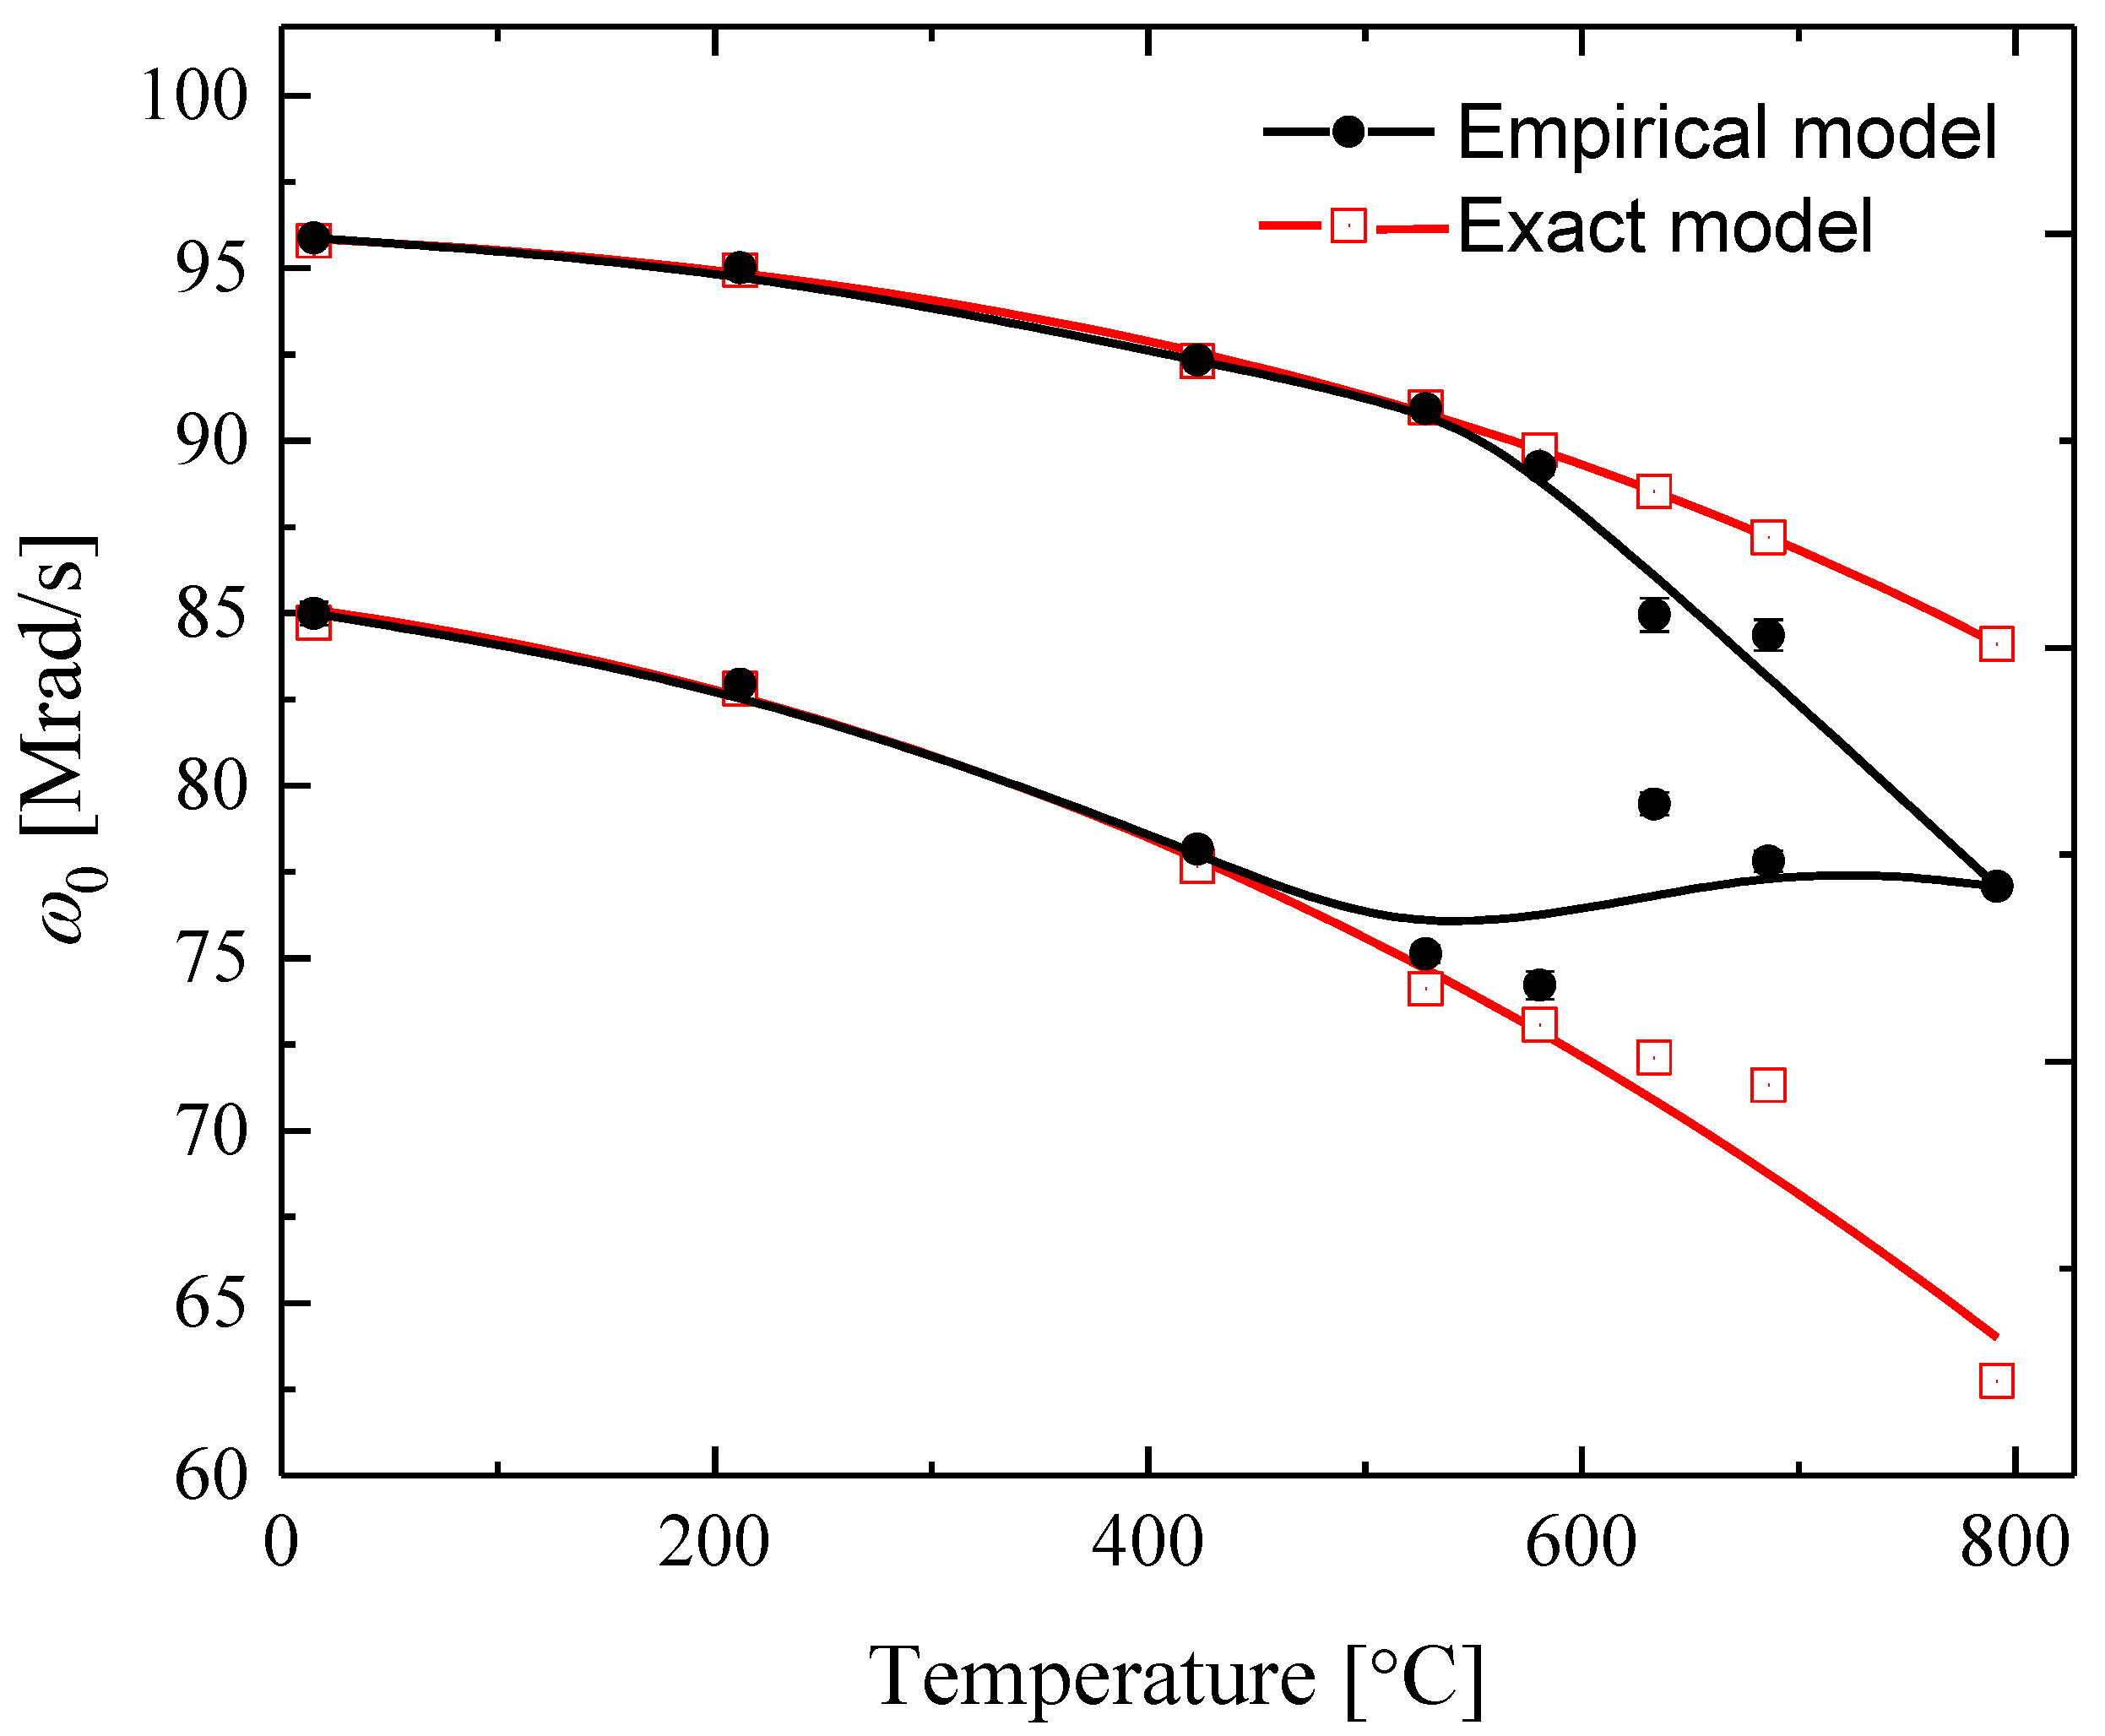
Figure 8 shows frequency spectra for Al4Sr measured at four temperatures. Below 725 °C, two signals were observed. As with Al4Ba and Al4Eu, there is little-to-no temperature dependence of site fractions with the average site fraction ratio of higher-frequency signal to lower-frequency = 2.1(4). At 725 °C and above, a single signal was observed. Temperature dependences of the two frequencies are shown in Figure 9.
Starting from low temperature, fundamental frequencies of both the signals decrease, but the lower frequency decreases faster than the upper one, so that frequencies initially diverge, at least up to 500 °C. For frequencies determined using empirical fits to Equation (5) (black dots and curves in Figure 9), measured frequencies converge between 500 and 800 °C. This is interpreted to mean that spectra are in the static regime below 500 °C and in the slow-fluctuation regime between 500 and 800 °C so that the convergence is due to dynamically averaged shifts towards the average frequency. At 800 °C, the single signal indicates that the spectrum is at the cusp of the rapid-fluctuation regime.
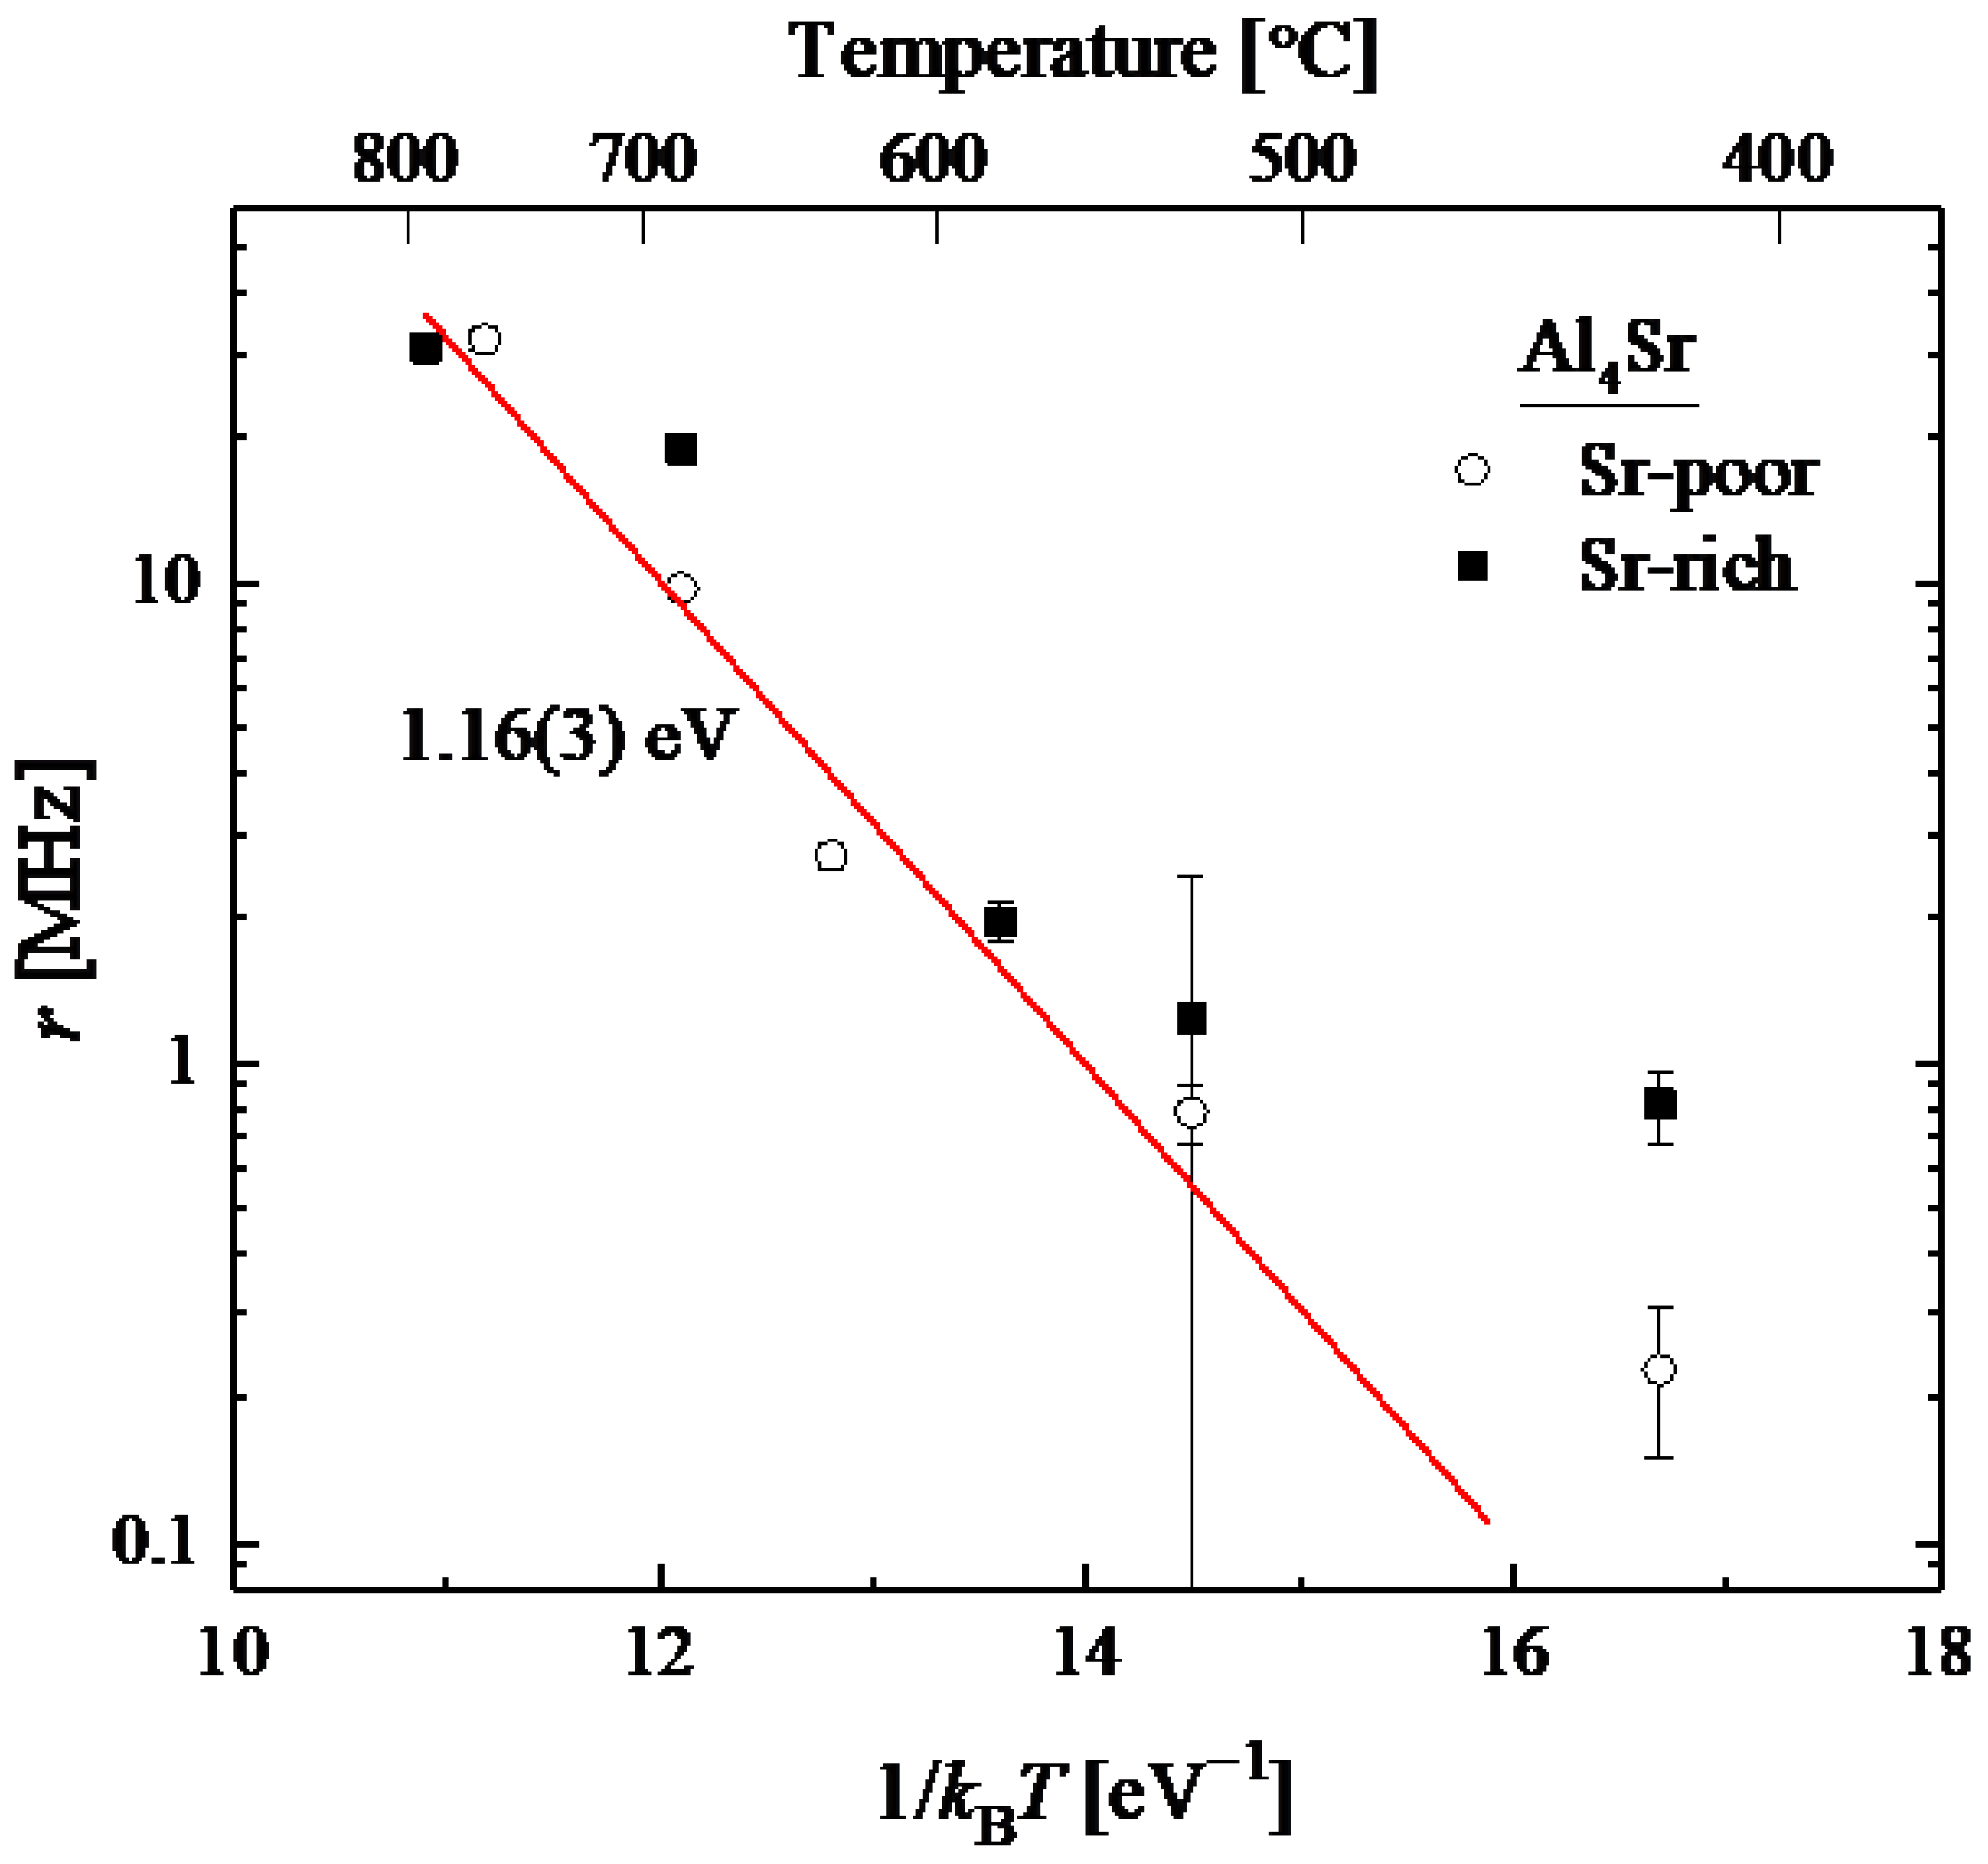
Fits using Equation (5) gave varying degrees of damping, with r12 or r21 on the order of 2 MHz. There is a strong correlation among fluctuation rates, interaction frequencies, and site fractions above 500 °C, so it is difficult to obtain reliable values for r12 or r21 using the empirical expression. Therefore, spectra were fitted using the rigorous method embodied in Equation (6). To help reduce uncertainties in best-fit parameters, one can first reduce the number of adjustable parameters by assuming that the distribution of Cd daughter-tracers is the same as that of In parent-tracers, at least as an approximation. Defining r as the average fluctuation rate, , one can write and . For consistency, is again taken to be the fraction of tracers in the Al site with higher interaction frequency. Since , site fractions can be fitted using the site fraction ratio so that and . Best-fit values of obtained using Equation (6) are shown in Figure 10 as an Arrhenius plot. The mean fluctuation rate, and hence the mean jump frequency, is seen to be thermally activated and has an activation enthalpy of 1.16(3) eV. Unlike fit results using Equation (5), fitted static quadrupole interaction frequencies and , unaffected by relaxation shifts, are shown in Figure 9 (red squares and curves).
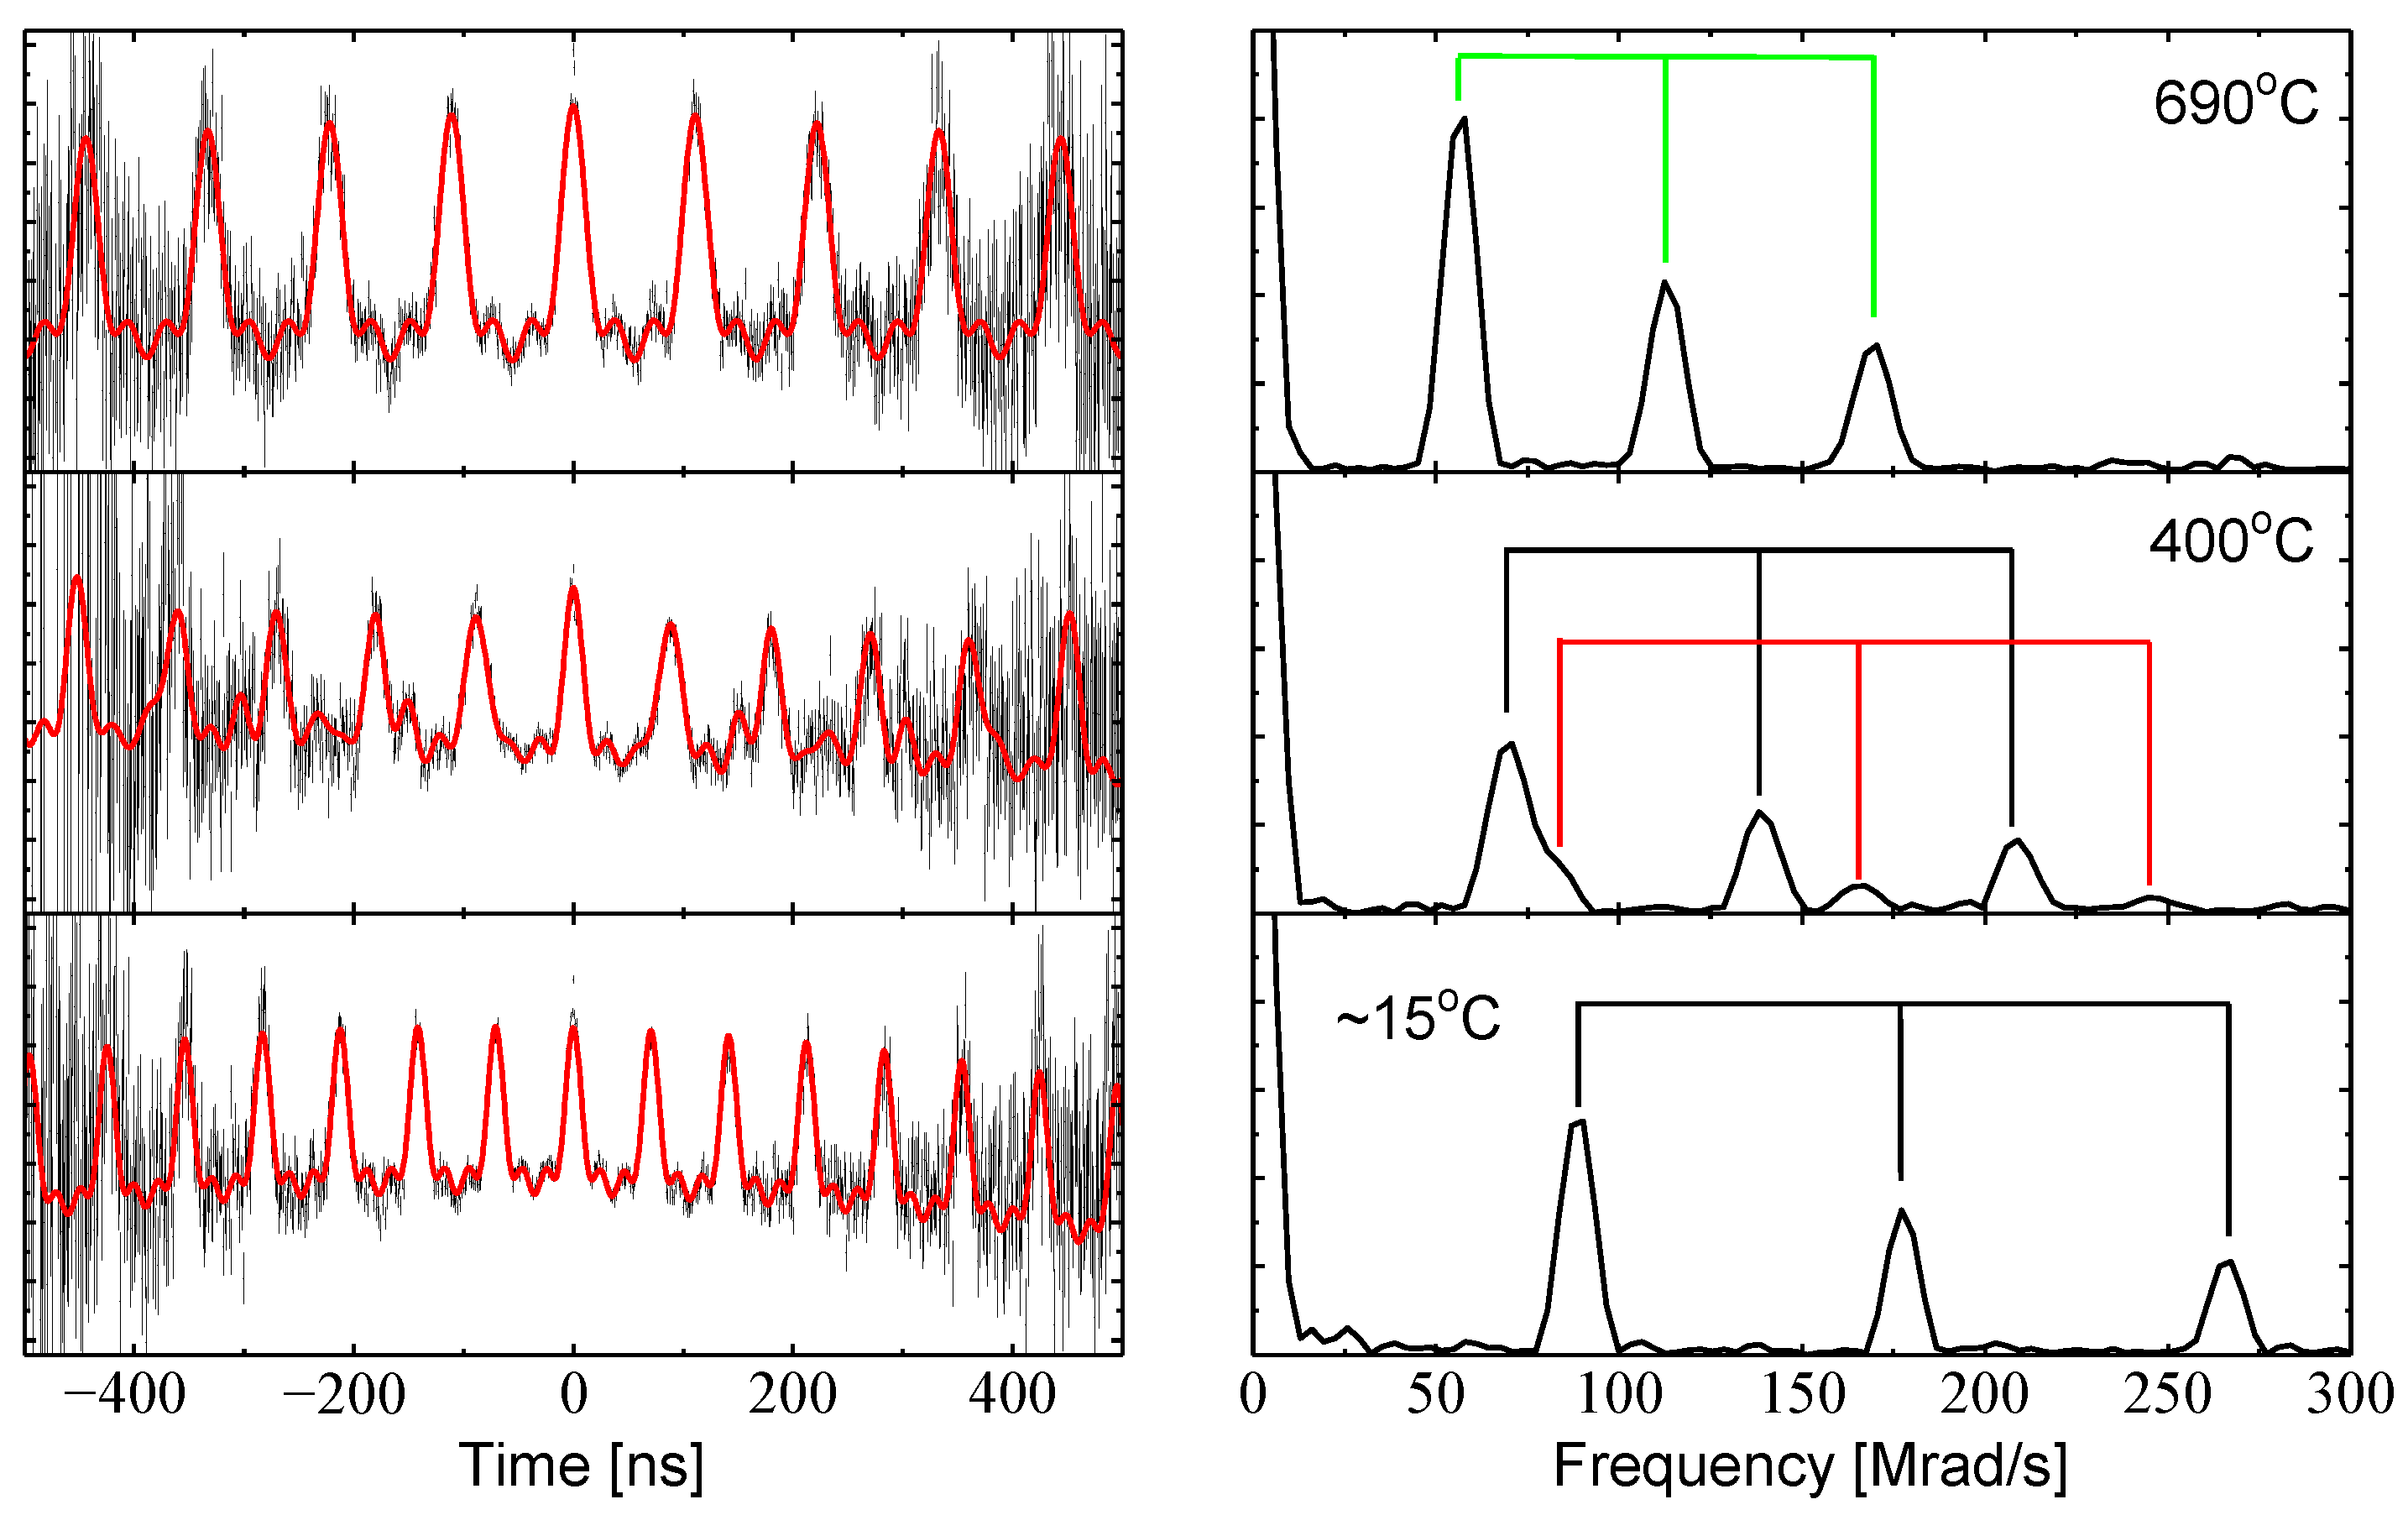
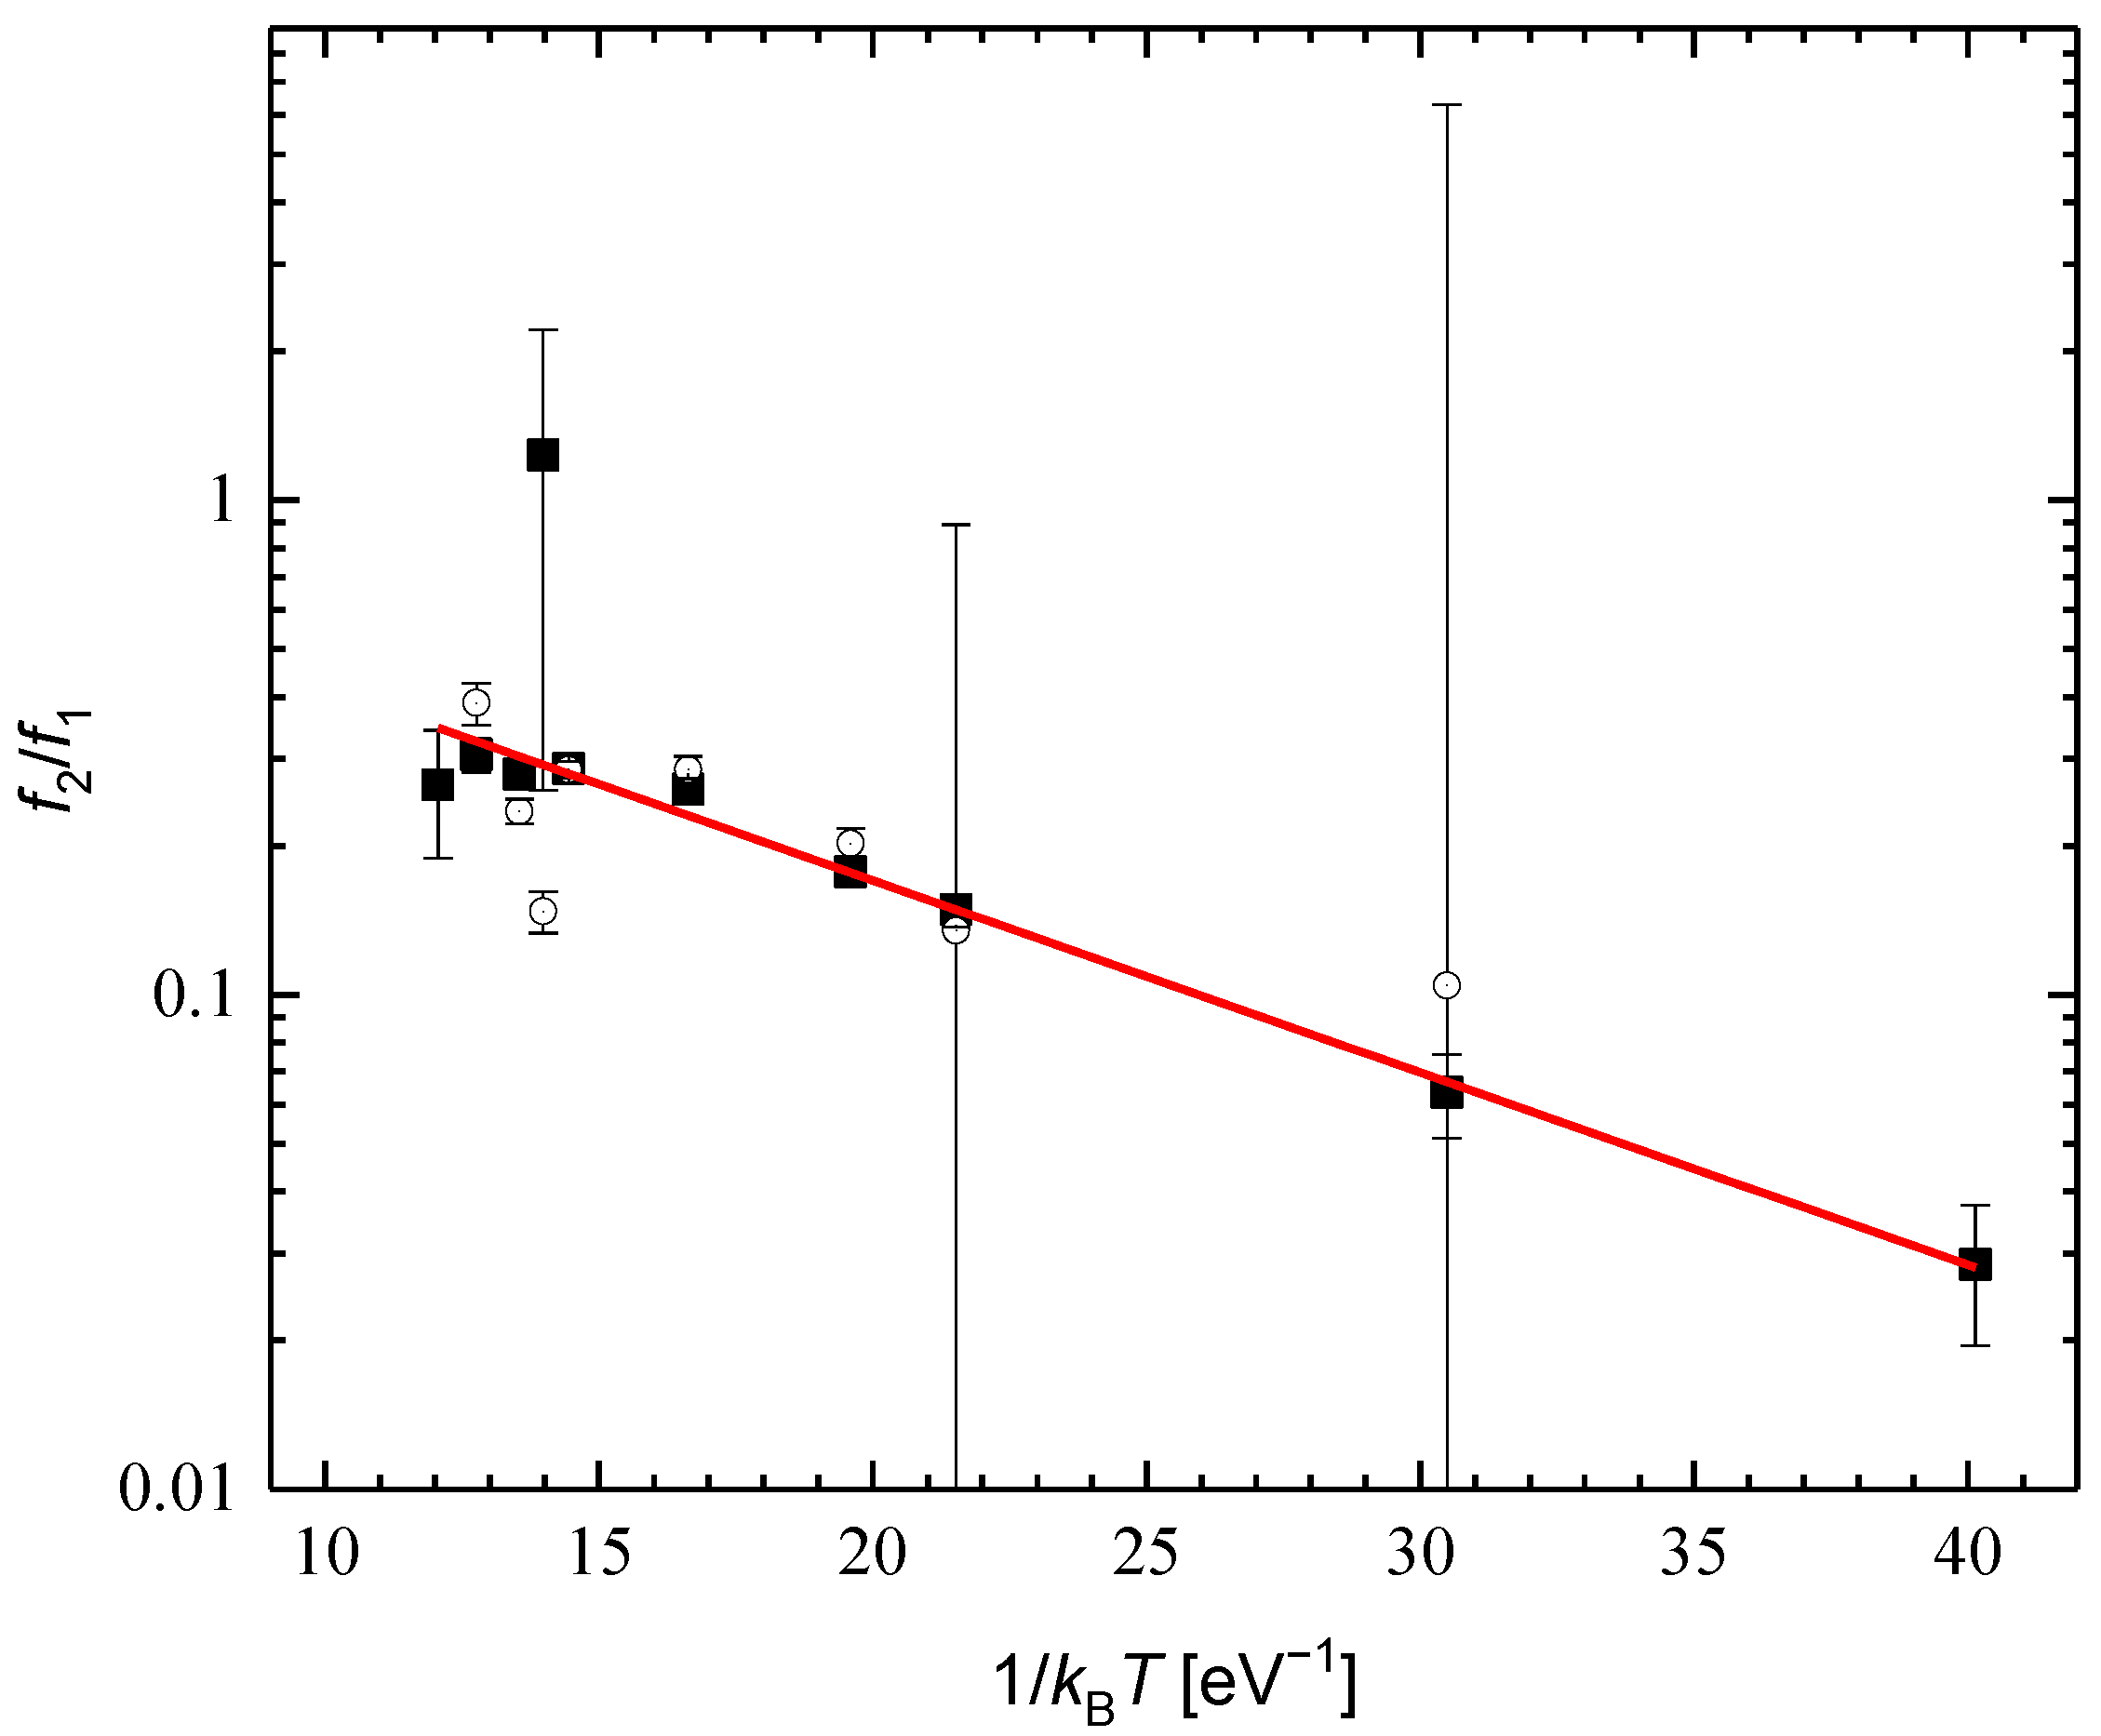
Figure 11 shows time-domain and corresponding Fourier-amplitude spectra for Ga4Sr at three temperatures. Unlike other compounds in this study, there is a strong temperature dependence of the site fractions. At room temperature, the spectrum is dominated by the lower-frequency signal. As temperature increases in the slow-fluctuation regime, the fraction of the higher frequency signal, , becomes visible and increases. At the highest temperature, 690 °C, it is not possible to resolve whether a fit to two signals, as appropriate for the upper-end of the slow-fluctuation regime, or a fit to one signal, as appropriate for the low end of the fast-fluctuation regime, is more appropriate. An Arrhenius plot of the site fraction ratio is shown in Figure 12. The activation enthalpy for , which is equal to the difference in activation enthalpies of and , is −0.089(6) eV.
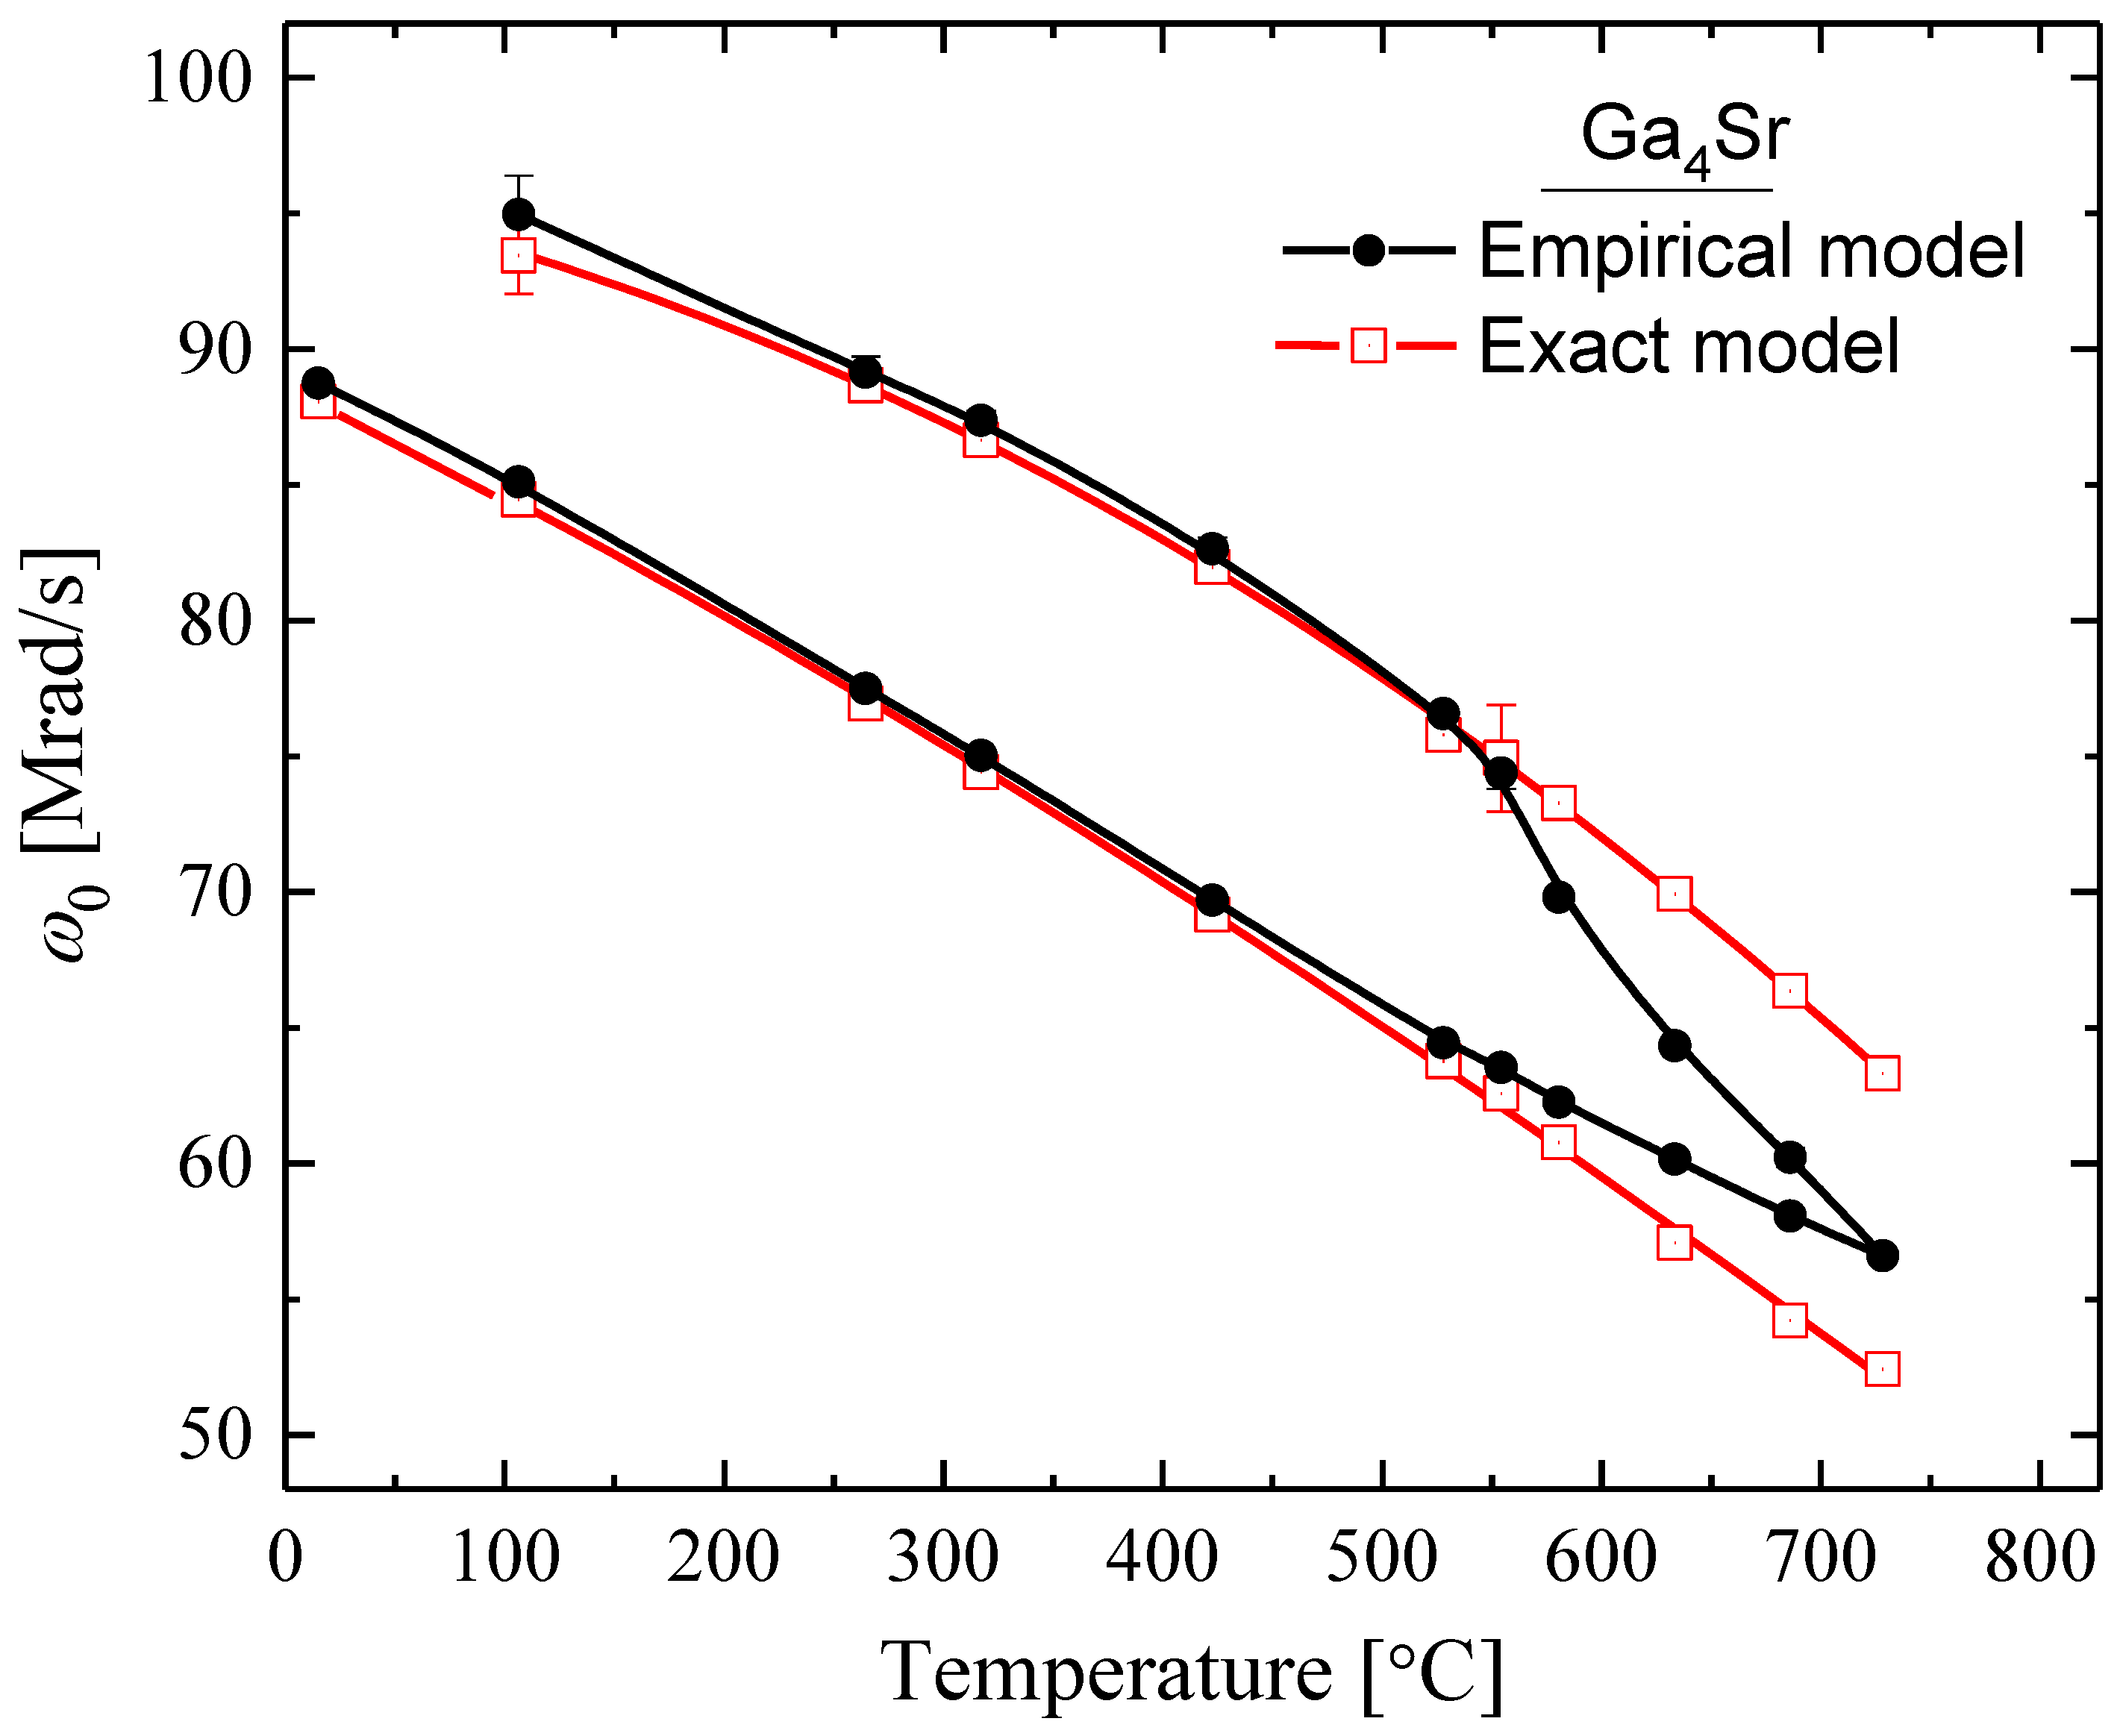
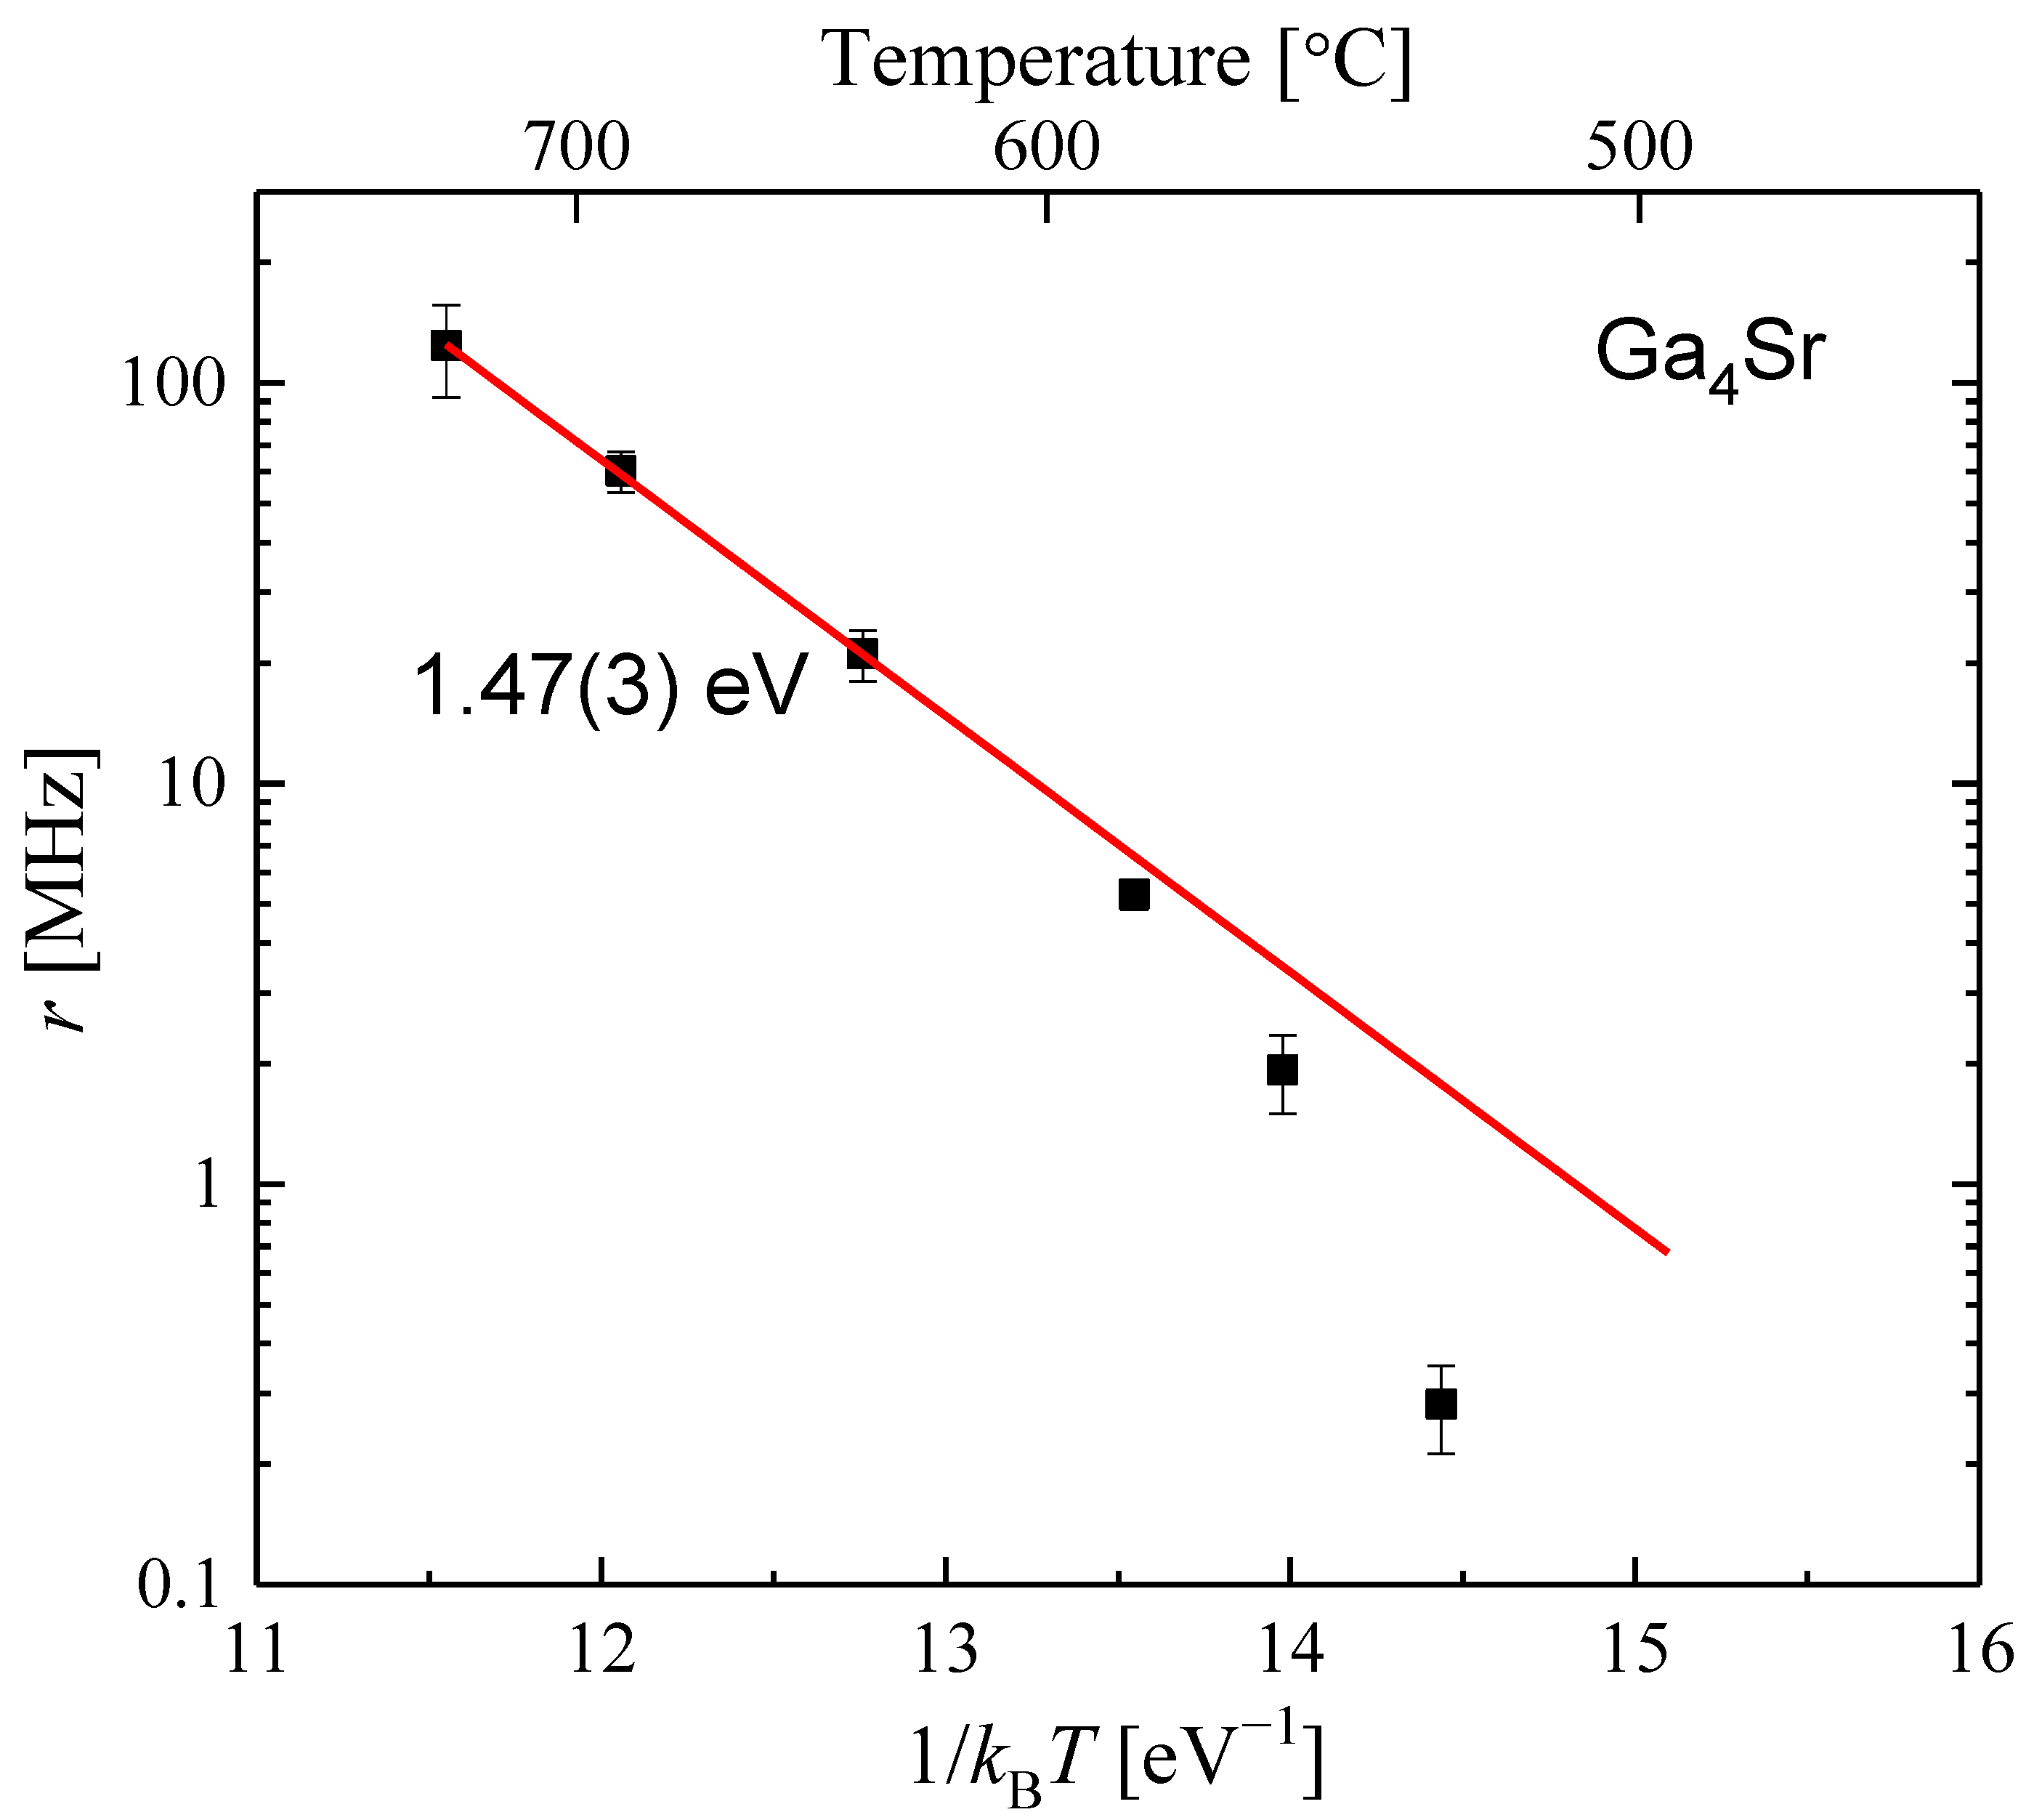
Figure 13 shows temperature dependences of the frequencies measured in Ga4Sr. Values obtained using fits to the empirical model given in Equation (5) show convergence due to relaxation shifts in the slow-fluctuation regime between about 550 and 730 °C, whereas fits to Equation (6) show the temperature dependence of the static quadrupole interaction frequencies. Best-fit values of r, defined as above, obtained using Equation (6) are shown in Figure 14 as an Arrhenius plot. The average fluctuation frequency is seen to be thermally activated and has an activation enthalpy of 1.47(3) eV.
4. Discussion
4.1. Temperature Dependences of Quadrupole Interaction Freqeuncies
It is interesting that temperature dependences of static quadrupole interaction frequencies led to such small values of at the transition between slow- and fast-fluctuation regimes so that fluctuation rates could not be determined in three of the five systems studied. Indeed, if fluctuation rates were much lower, interaction frequencies would have crossed in Figure 4, Figure 5 and Figure 6 and merged because of dynamical averaging at higher temperatures. The trend that static interaction frequencies result in small happened because temperature dependences of the two sites were not proportional to one another, as they more frequently are in other compounds.
The large difference in temperature dependences between the two Al sites in the Al4Ba structure is, perhaps, not unexpected. Local configurations of atoms around the two Al-type sites are notably different. The Al1-site is in a nearly perfect tetrahedron of Al2-sites [24], whereas Al2 sites have four Al1-sites in a square arrangement on one side and one Al2-site close on the other side. Second, there is a variable internal lattice parameter that controls distances between Al1 and Al2 planes along the tetragonal axis and that varies from phase to phase. In addition, highly anisotropic thermal expansion has been observed for Al4Sr [24]; it is a factor of 1.9 greater perpendicular than parallel to the tetragonal axis. This is likely to be a general feature of Al4Ba phases and, along with the other considerations, will lead to different temperature dependences of EFGs at the two Al-type sites.
4.2. Diffusivities
For Al4Sr and Ga4Sr, it was possible to determine an average EFG fluctuation rate, . The corresponding average total tracer jump rate (not including the “invisible” jump rate of tracers on Al2 sites making jumps along the tetragonal direction) is related by , where the 4 accounts for the fact that four different jump vectors lead to the same change in EFG and is a temporal correlation factor that takes into account the probability that multiple tracer–vacancy exchanges during an encounter result in the tracer ending up on the same type of lattice site it started on [25].
In compounds with the tetragonal Al4Ba structure, diffusivity will have different components parallel and perpendicular to the tetragonal axis. The jump rate between adjacent Al2-type sites (pictured vertically, one over the other in Figure 2) is not measurable using PAC, since there is no change of EFG in the jump. Thus, only qualitative statements can be made about the parallel diffusivity. Note from Table 1 that the distance between adjacent Al2-sites is comparable to that between Al1 and Al2 sites, so that the Al2-Al2 jump rate may be significant.
The perpendicular component of diffusivity is governed by jumps between Al1- and Al2-type sites, since jump distances between sites of the same type (e.g., Al1 to Al1) are much larger. Therefore, the fluctuation rate gives insight into the perpendicular component of the diffusivity. Reliable fluctuation rates were obtained for Al4Sr and Ga4Sr, as shown in Figure 10 and Figure 14. Each jump between Al1 and Al2 sites moves the probe atom by a perpendicular distance equal to , using the convention that unit cell parameter is parallel to the tetragonal axis and is perpendicular. Following Philibert [26], the perpendicular diffusivity will be given by . The is the correlation factor for the operative diffusion mechanism. Assuming a vacancy mechanism, the correlation factor is expected to be approximately the same as for self-diffusion in diamond, , [26] since the local atomic arrangement in Al4Ba is quasi-tetrahedral with coordination number 4. Here, represents jump distance, for which one uses the projected distance . This gives
Only limited information about temporal correlation factors is available. The value of is about 0.3 for the case of self-diffusion on the Cu sublattice in Cu3Au [25]. Using that value as an approximation, one can estimate perpendicular components of diffusivity to be 0.5 × 10⁻¹² m2/s and 3 × 10⁻¹² m2/s at 1000 K in Al4Sr and Ga4Sr, respectively, using room temperature lattice parameters.
Because the Al2-Al2 jump rate is “invisible” to PAC, one cannot calculate the diffusivity parallel to the tetragonal axis. However, an estimate can be made of the maximum possible value for the ratio by assuming that the Al2-Al2 jump rate is infinite. In effect, this conjoins adjacent Al2 atoms and diffusion takes place in a reduced lattice having the CaF2 fluorite structure (C1, cF12). Jumps are between Ca and F sites, with F sites analogous to Al1 sites and Ca sites to Al2 sites. The arrangement of Al2 sites around Al1 sites is very close to tetrahedral [24]. This means that in the conjoined structure so that the maximum ratio in the expanded structure will be given by for Al4Sr and Ga4Sr.
4.3. Signs of the Nuclear Quadrupole Interactions
It is not possible to determine the sign of the main principal component of an EFG using PAC; however, the present work illustrates a situation where it is possible to determine whether two EFGs have the same sign or opposite signs. When PAC tracers jump between sites that have EFGs with colinear main principal axes and when it is possible to make measurements in the static- or slow-fluctuation regime and in the fast fluctuation or motionally averaged regime, then it is possible to determine whether the EFGs have the same sign or opposite signs, as illustrated by the stark difference in measured interaction frequencies when for same-sign or opposite-sign EFGs in Figure A1 of Appendix B. Results show that EFGs at the two Al-type sites in all five compounds studied in the present work have the same sign.
4.4. Solute Site Occupation Behavior
In general, for indium solutes in a compound having the Al4Ba structure, equilibrium fractions of indium tracers on Al1 sites and Al2 sites can be related by applying the law of mass action to the pseudo-chemical reaction that describes exchange of tracers across sublattices:
This gives, in terms of fractional concentrations of indium on sublattices, and :
where and are the enthalpy and the entropy changes when going from the reactant to the product side of Equation (8). In terms of site fractions,
where and indicate the defect enthalpy and vibrational entropy of indium at lattice site .
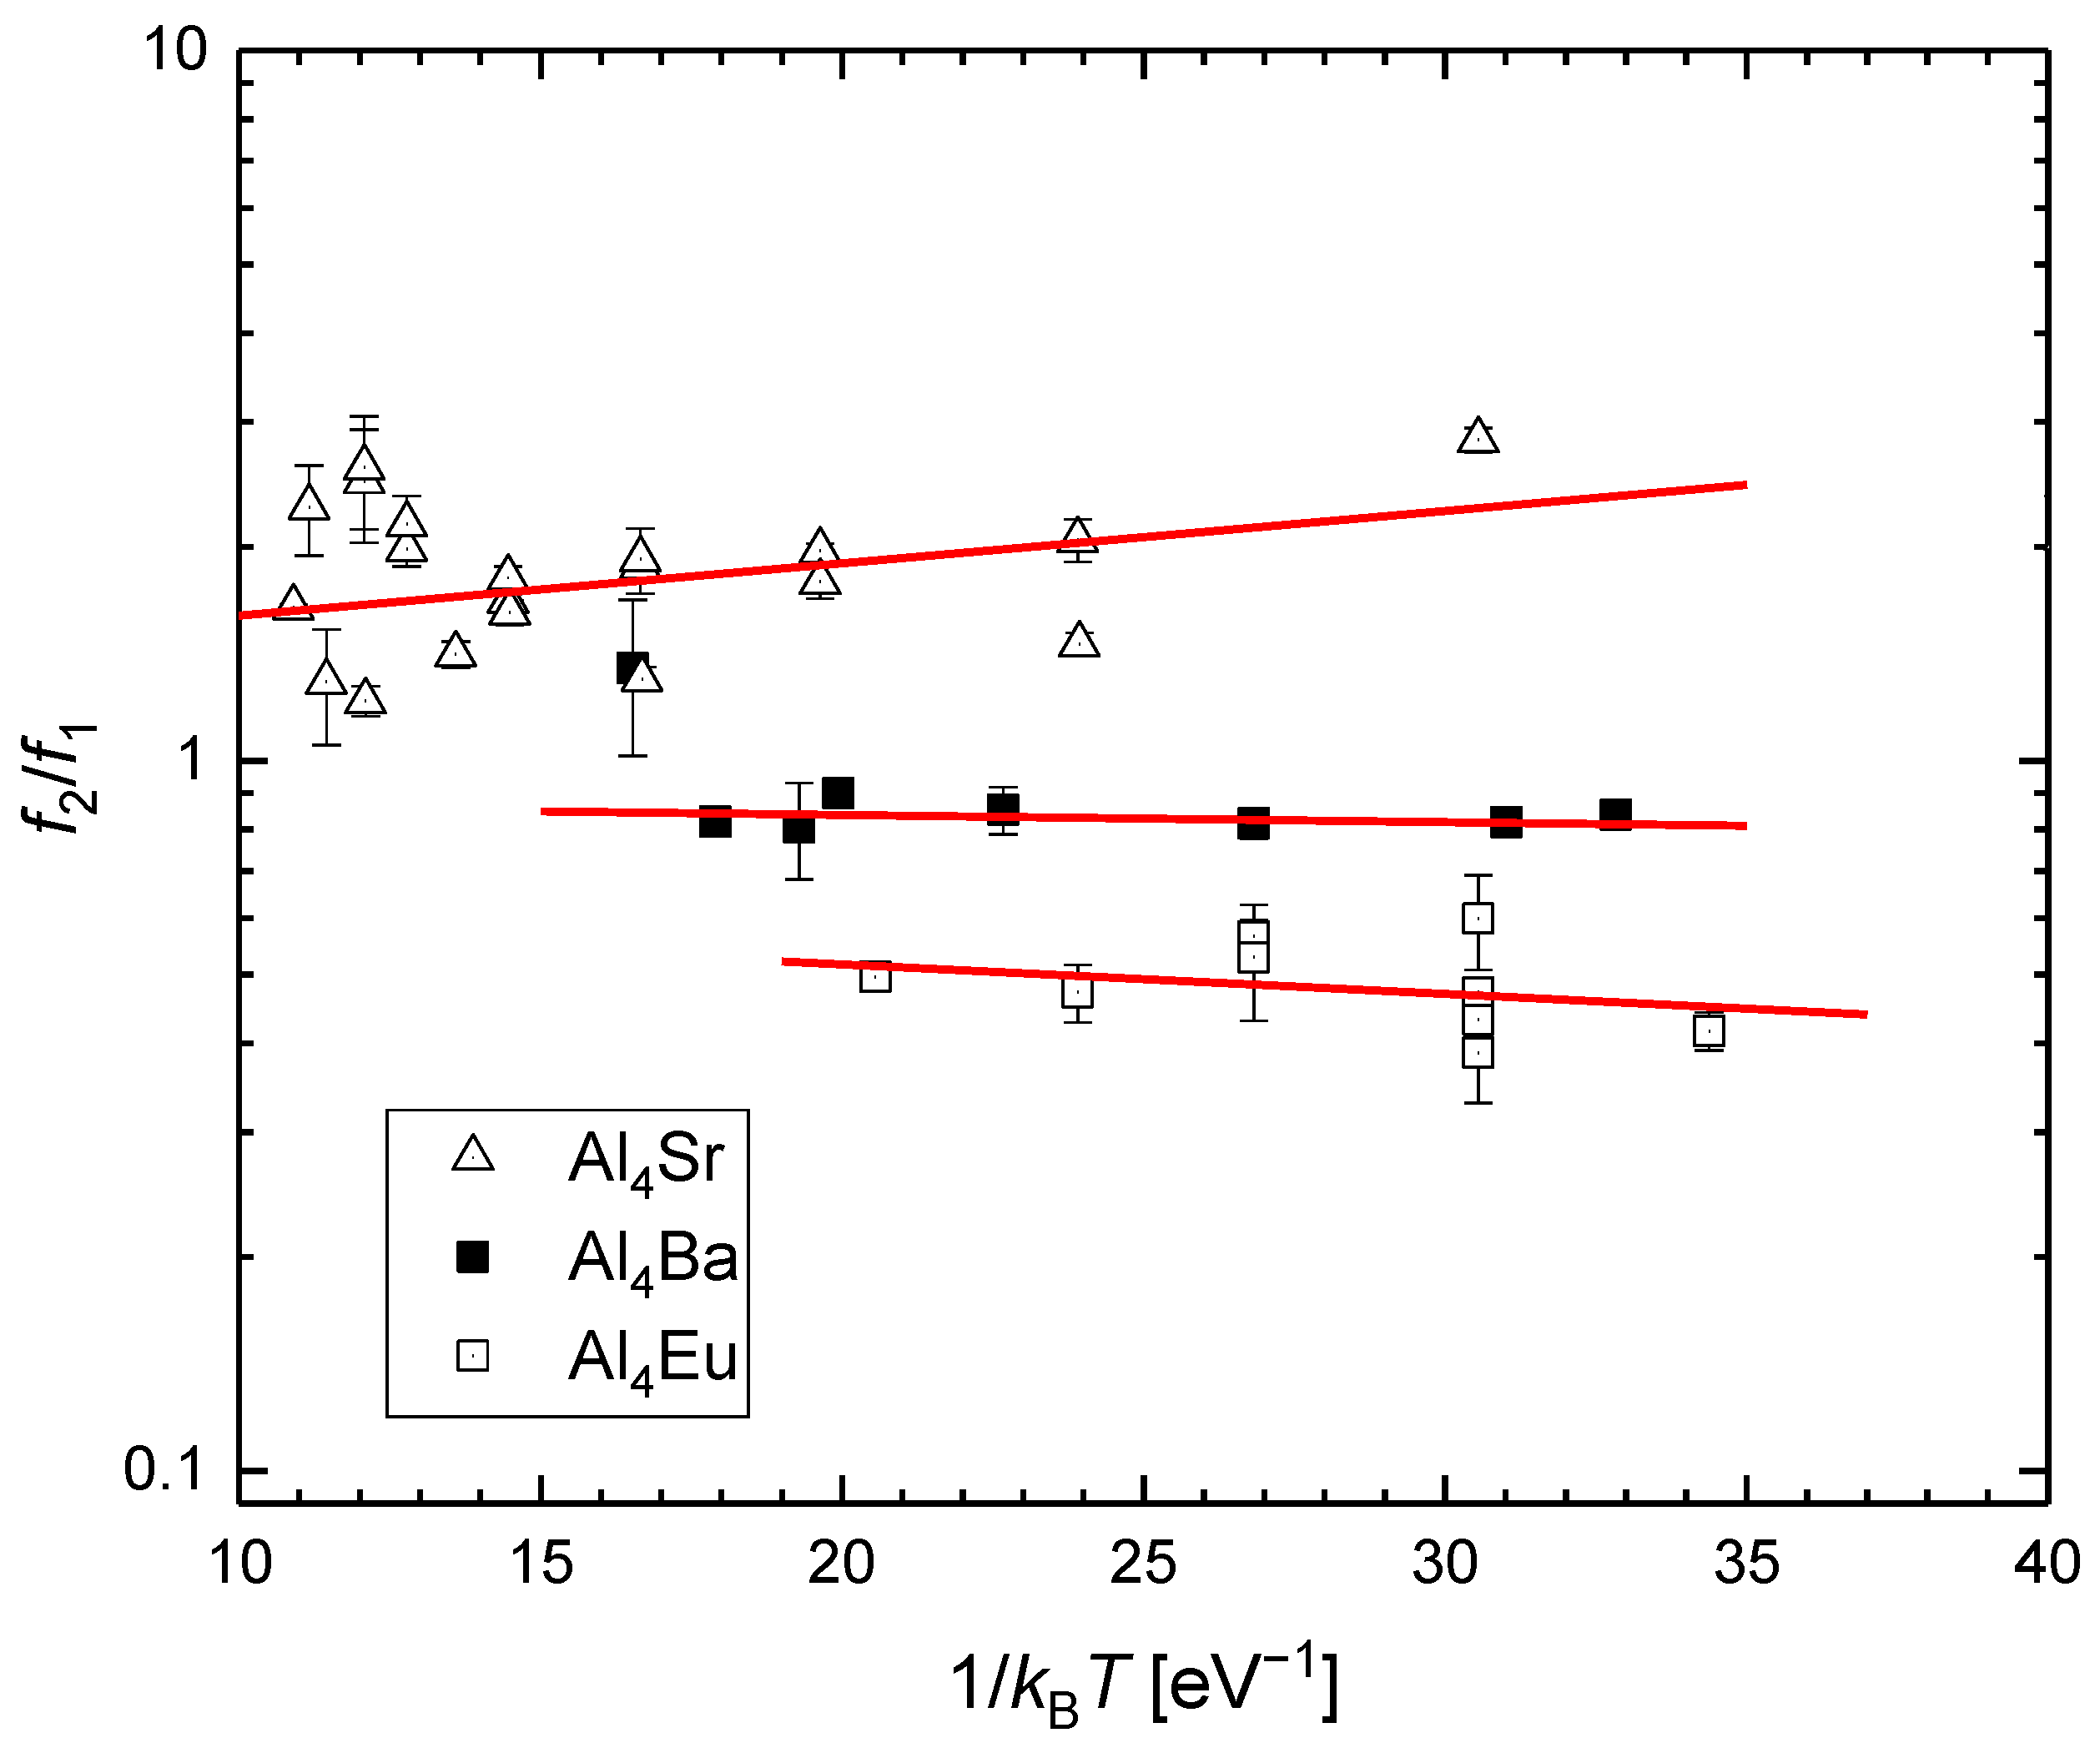
It is interesting that there is little, if any, temperature dependence in site fractions for three of the systems over the temperature range investigated (e.g., as shown in Figure 7). Averages of the measured site-fraction ratios in these systems are summarized in Table 2. To investigate possible temperature dependence, site fraction ratios of Al4Sr, Al4Ba, and Al4Eu are shown in an Arrhenius plot in Figure 15. Results of fitting with Equation (9) are summarized in Table 2, along with fit results of site fraction ratios measured in Ga4Sr.
Unequal distributions of tracers in Al4Ba, Al4Eu, and Al4Sr arise primarily due to differences in vibrational entropies between the two Al sites because enthalpy differences are close to zero. In contrast, the vibrational entropy difference obtained by fitting the temperature dependence of for Ga4Sr is, within uncertainty, equal to zero, indicating that the unequal distribution of tracers in Ga4Sr is due entirely to the difference in enthalpies between the two sites.
5. Conclusions
111In PAC was used to investigate tracer distribution and diffusion in five compounds with the Al4Ba structure. The measurements give the realization of a system in which dynamical averaging of two collinear EFGs is driven by tracer atoms jumping between two sublattices. In all compounds, two signals were observed at low temperature, and one signal was observed at high temperature. The quadrupole interaction frequencies of the signals were strongly temperature dependent.
For In4Ba, Al4Ba, and Al4Eu, differences in observed quadrupole frequencies decreased with increasing temperature until observed PAC signals merged. Above the merging temperature, a single PAC signal was observed due to motional averaging of the quadrupole interactions experienced by tracers as they jumped among sites with different interactions. Because the difference in interaction frequencies was small at the merge temperature, it was possible to conclude only that rates were between about 8 kHz and 2 MHz at the merge temperatures.
For Al4Sr and Ga4Sr, there was less decrease in the difference in static quadrupole interaction frequencies with increasing temperature caused by thermal expansion and lattice vibrations, so that it was possible to measure the degree of quadrupole relaxation and, by extension, interaction fluctuation rates as a function of temperature. The inter-sublattice jump frequencies were found to have activation enthalpies of 1.16 and 1.47 eV, respectively, for Al4Sr and Ga4Sr. This allowed determination of the rate at which tracers jump between unlike Al-type sites to within a correlation factor. This further allowed estimation of transverse diffusivity in these systems.
Author Contributions
Conceptualization, G.S.C.; Methodology, G.S.C., M.O.Z. and R.N.; Analysis Software, G.S.C. and M.O.Z.; Investigation, R.N., S.C. and G.S.C.; Writing—Original Draft, M.O.Z.; Writing—Review and Editing, M.O.Z. and G.S.C.; Administration, G.S.C.; Funding Acquisition, G.S.C. All authors have read and agreed to the published version of the manuscript.
Funding
This research was funded by the National Science Foundation under grants NSF DMR 05-04843, 09-04096, and 18-09531 at Washington State University and under grant NSF DMR 06-06006 at Northern Kentucky University.
Data Availability Statement
Original data and scans of results of initial fits of spectra are available in a data archive of the G.S.C research group housed at Washington State University, https://tinyurl.com/Collins-archive (accessed on 12 August 2022).
Acknowledgments
The authors are grateful to contributions to experimental work by John P. Bevington and Prastuti Singh.
Conflicts of Interest
The authors declare no conflict of interest.
Appendix A
The Blume matrix is constructed in the Liouville vector space defined by where a is an index that labels the hyperfine interaction, is spin of the intermediate state of the PAC tracer (5/2 for 111Cd), and and designate magnetic substates of the tracer’s intermediate spin state. Elements of the Blume matrix are given by
where is the transition rate matrix and is the Hamiltonian of the th quadrupole interaction. Because there are just two quadrupole interactions, the transition rate matrix is given by
Because the two quadrupole interactions are axially symmetric and main principal components are collinear, matrix elements of the Hamiltonians can be expressed as
When the initial distribution of tracers between states is equal to the equilibrium distribution, there are 14 distinct eigenvalues of the Blume matrix given by
where , , , and with negative signs used when EFGs have opposite signs.
Appendix B
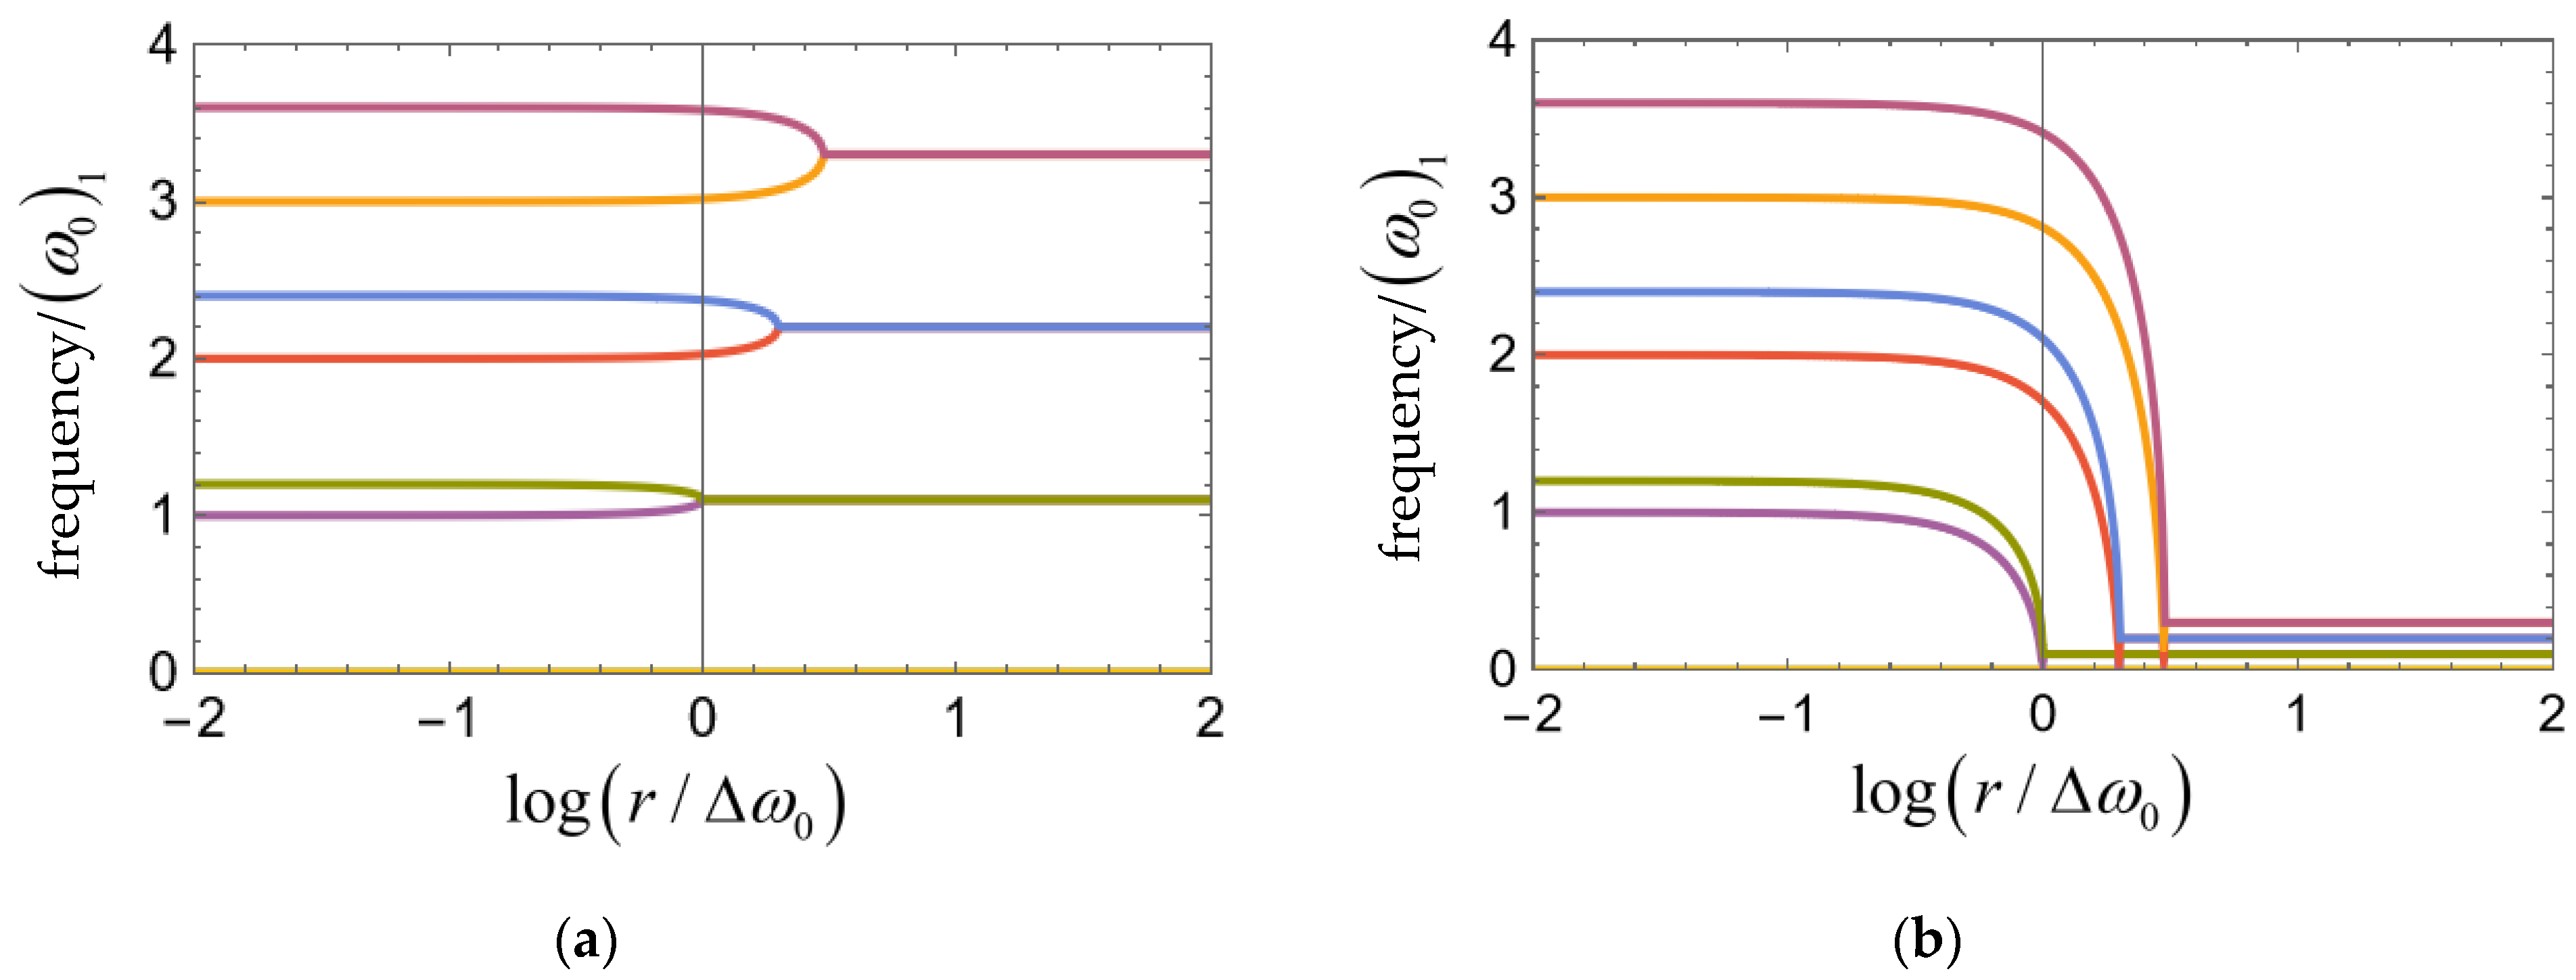
Frequencies of the cosine terms of Equation (6) are given by and in Equation (A4). The dependence of frequencies on average fluctuation rate are shown in Figure A1 for . At low fluctuation rate, there are two sets of frequencies with three harmonics given by with . As can be seen in Figure A1, whether the EFGs have the same sign or they have opposite signs is readily discernable by the merging behavior of the frequencies when .
This merging is attributed to frequency-averaging as the tracer-atoms jump back and forth between the two sublattices more rapidly with increasing temperature. It is analogous to frequency-shift keying, with shifts between two frequencies occurring at stochastically random times (when the tracer atom jumps). If the EFGs have the same sign, then, in a manner of speaking, the phase of the nuclear precession is preserved during the shift and the nucleus continues to precess in the same sense at the other frequency. If the EFGs have opposite sign, then the nucleus precesses in the reverse sense after each shift.
Figure A1.
Dependence of frequencies in cosine terms of Equation (6) as a function of average fluctuation rate , with frequencies scaled by the first fundamental frequency of the weaker quadrupole interaction, , and fluctuation rate scaled by the difference in fundamental frequencies, , where the negative sign is used when EFGs have the same sign. Two examples are shown for : EFGs with the same sign (a) and EFGs with opposite signs (b).

When EFGs have the same sign, then the merged frequency is given by the weighted average of the individual interaction frequencies . When they have opposite sign, the merged frequency is given instead by the weighted difference . Effects of this frequency merging on PAC spectra when EFGs have the same sign are illustrated in Figure A2.
Figure A2.
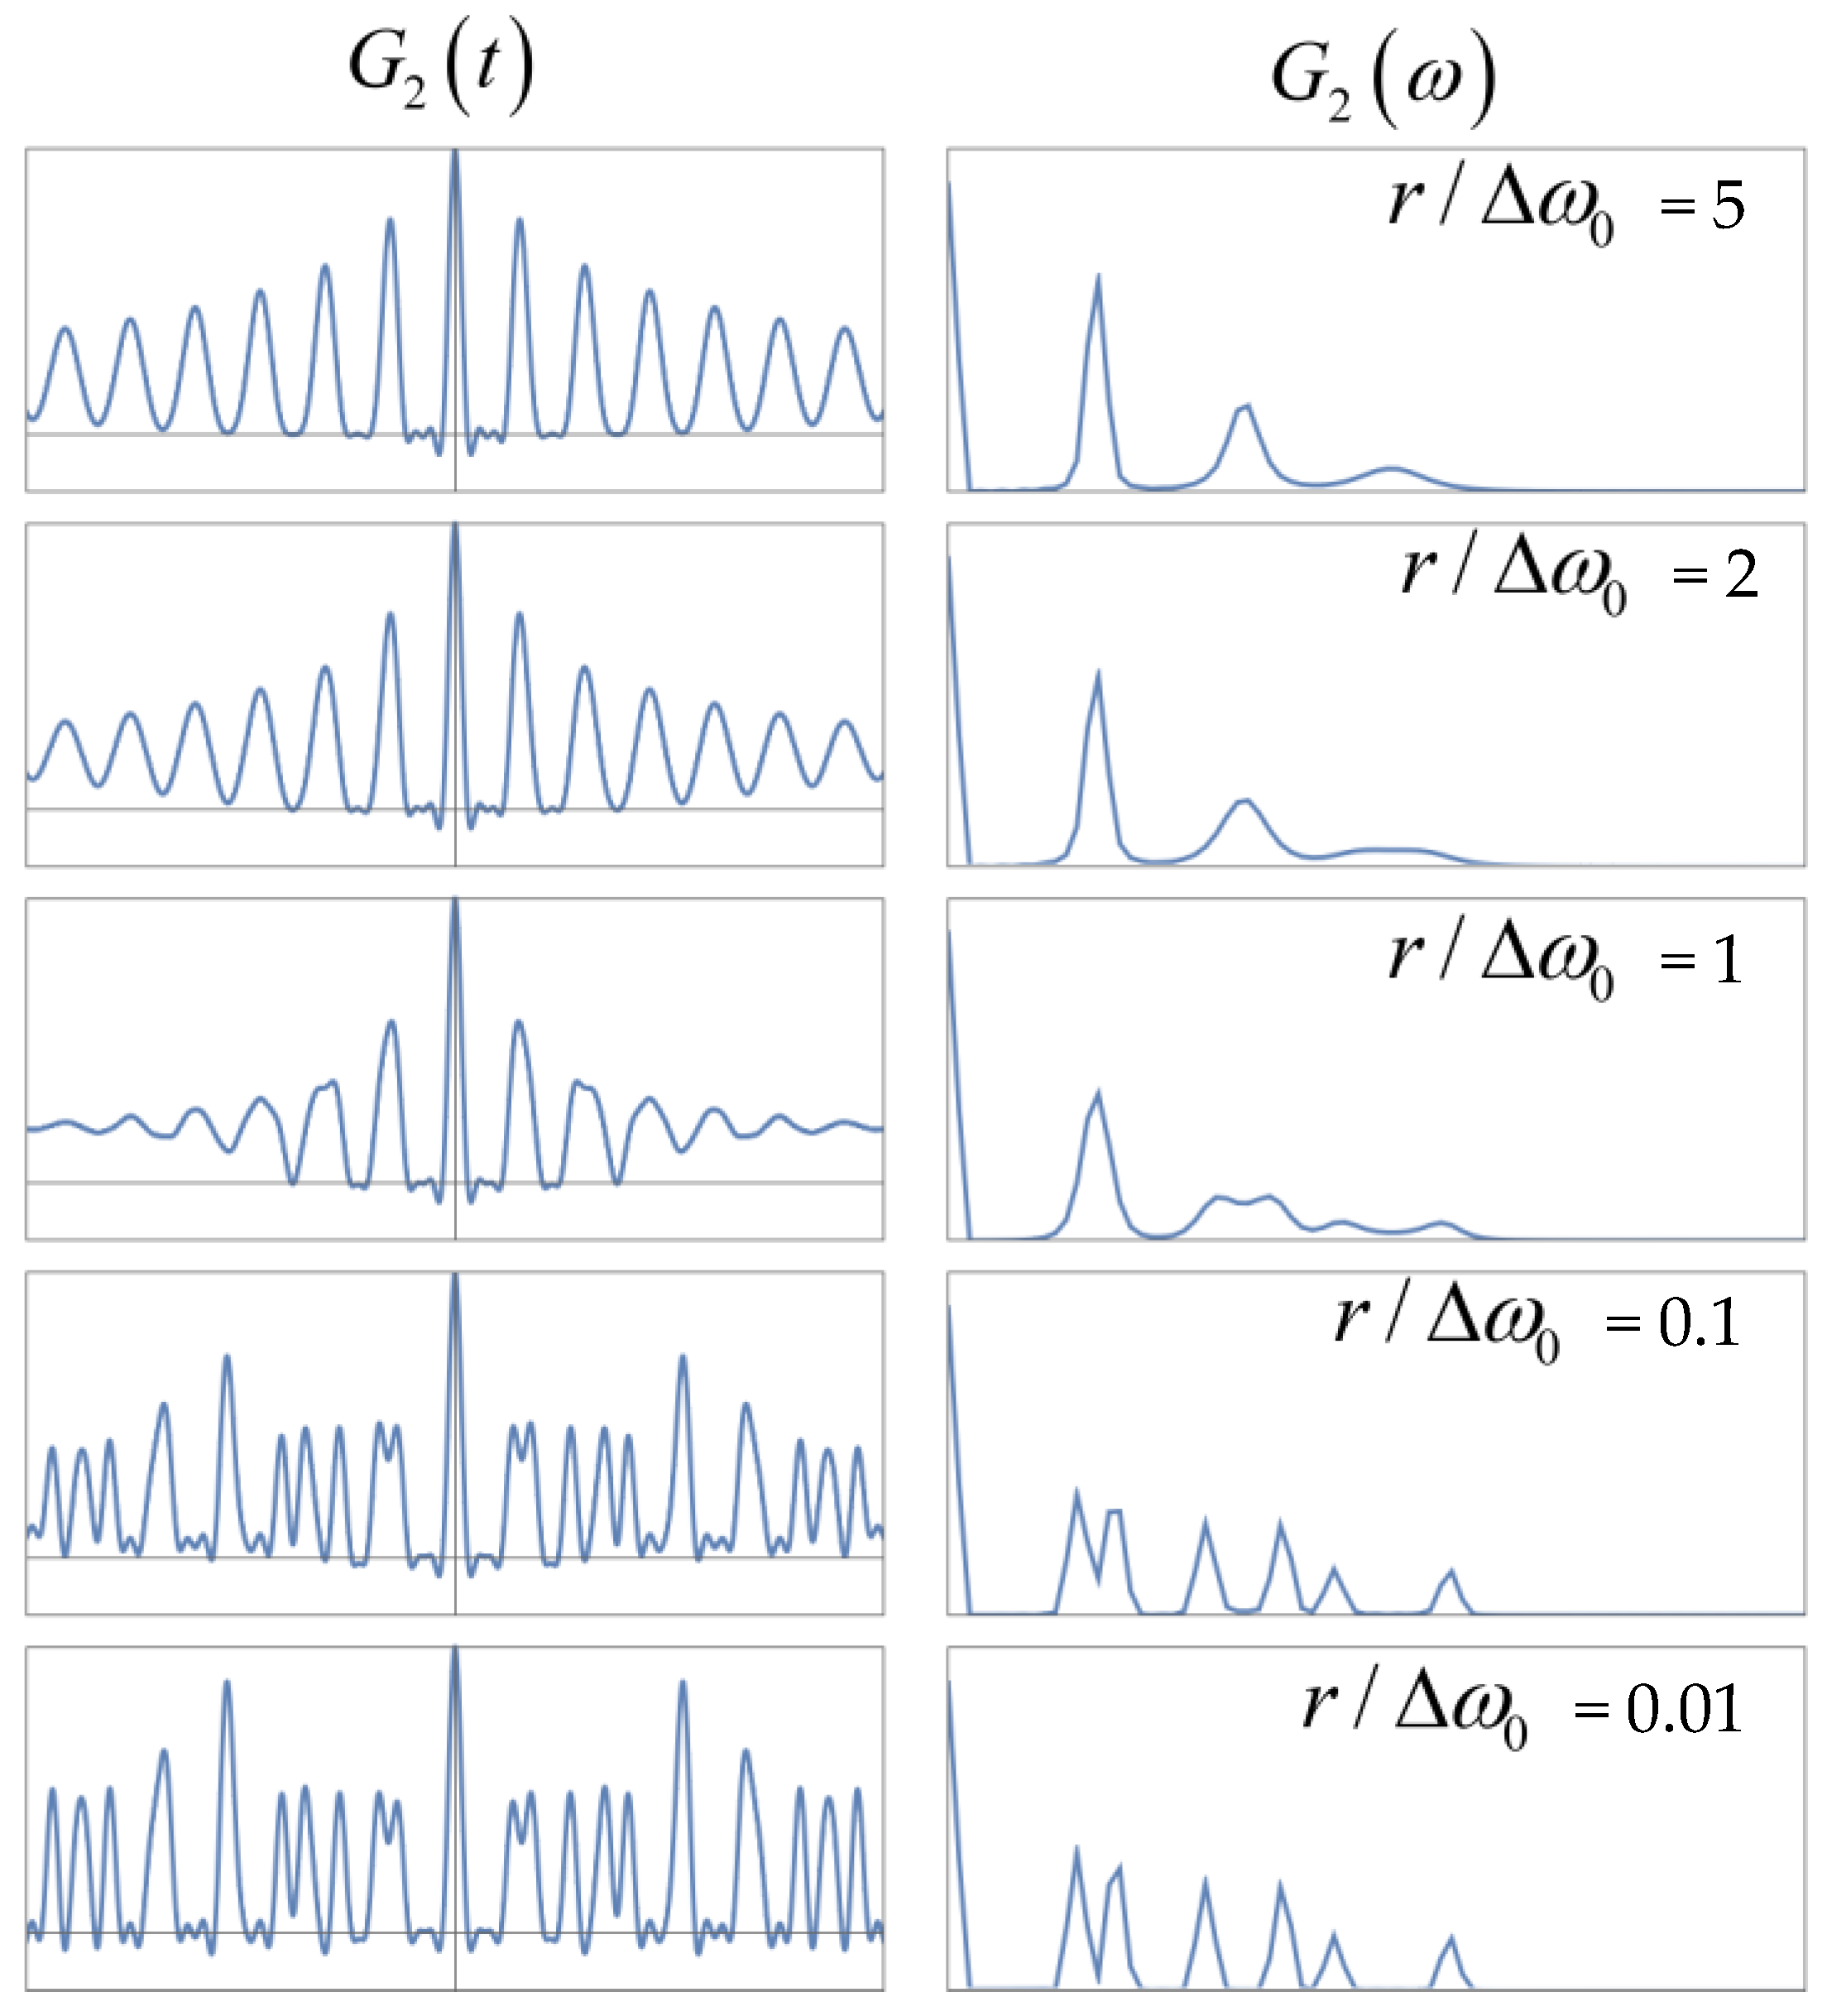
Simulations of PAC spectra for with same-sign EFGs for varying fluctuation rates. At low fluctuation rates , all three harmonics of both signals can be seen in the frequency plots. At the critical fluctuation rate, , the first harmonics of both signals have the same value, but the second and third harmonics are distinguishable. By the second harmonics have merged, and the third harmonics have not. By all harmonics have merged.
Figure A2.
Simulations of PAC spectra for with same-sign EFGs for varying fluctuation rates. At low fluctuation rates , all three harmonics of both signals can be seen in the frequency plots. At the critical fluctuation rate, , the first harmonics of both signals have the same value, but the second and third harmonics are distinguishable. By the second harmonics have merged, and the third harmonics have not. By all harmonics have merged.

References
- Heitjans, P.; Kärger, J. Diffusion in Condensed Matter; Springer: Berlin, Germany, 2005. [Google Scholar]
- Collins, G.S.; Favrot, A.; Kang, L.; Solodovnikov, D.; Zacate, M.O. Diffusion in Intermetallic Compounds Studied Using Nuclear Quadrupole Relaxation. Defect Diffus. Forum 2005, 237–240, 195–200. [Google Scholar] [CrossRef]
- Baudry, A.; Boyer, P. Approximation of Blume’s stochastic model by asymptotic models for PAC relaxation analysis. Hyperfine Interact. 1987, 35, 803–806. [Google Scholar] [CrossRef]
- Forker, M.; Herz, W.; Simon, D. Approximation of the theory of stochastic perturbations of angular correlations for fluctuating distributions of electric quadrupole interactions. Nucl. Instrum. Meth. A 1994, 337, 534–543. [Google Scholar] [CrossRef]
- Zacate, M.O.; Favrot, A.; Collins, G.S. Atom Movement in In3La Studied Via Nuclear Quadrupole Relaxation. Phys. Rev. Lett. 2004, 92, 22590, Erratum in Phys. Rev. Lett. 2004, 93, 49903. [Google Scholar] [CrossRef]
- Collins, G.S.; Favrot, A.; Kang, L.; Nieuwenhuis, E.R.; Solodovnkov, D.; Wang, J.; Zacate, M.O. PAC Probes as Diffusion Tracers in Compounds. Hyperfine Interact. 2004, 159, 1–8. [Google Scholar] [CrossRef]
- Jiang, X.; Zacate, M.O.; Collins, G.S. Jump frequencies of Cd tracer atoms in L12 lanthanide gallides. Defect Diffus. Forum 2009, 289–292, 725–732. [Google Scholar] [CrossRef]
- Collins, G.S.; Jiang, X.; Bevington, J.P.; Selim, F.; Zacate, M.O. Change of diffusion mechanism with lattice parameter in the series of lanthanide indides having L12 structure. Phys. Rev. Lett. 2009, 102, 155901. [Google Scholar] [CrossRef]
- Nieuwenhuis, E.R.; Zacate, M.O.; Collins, G.S. Simultaneous measurement of tracer jump frequencies on different sublattices in Ga7Pd3 using PAC. Defect Diffus. Forum 2007, 264, 27–32. [Google Scholar] [CrossRef]
- Selim, F.; Bevington, J.P.; Collins, G.S. Diffusion of 111Cd probes in Ga7Pt3 studied via nuclear quadrupole relaxation. Hyperfine Interact. 2007, 178, 87–90. [Google Scholar] [CrossRef]
- Zacate, M.O.; Collins, G.S. Jump Frequency of Cd Tracer Atoms in β-Mn. Defect Diffus. Forum 2005, 237–240, 396–401. [Google Scholar] [CrossRef]
- Pearson, W.B. The most populous of all crystal structure types—the tetragonal BaAl4 structure. J. Solid State Chem. 1983, 56, 278–287. [Google Scholar] [CrossRef]
- Perason, W.B. A Handbook of Lattice Spacings and Structures of Metals and Alloy; Pergamon Press: New York, NY, USA, 1958. [Google Scholar]
- Mehrer, H. Diffusion in Solids: Fundamentals, Methods, Materials, Diffusion Controlled Processes; Springer: Berlin, Germany, 2007. [Google Scholar]
- Bakst, I.N.; Dusoe, K.J.; Drachuck, G.; Neilson, J.R.; Canfield, P.C.; Lee, S.-W.; Weinberger, C.R. Effects of point defects on the mechanical response of LaRu2P2. Acta Mater. 2018, 160, 224–234. [Google Scholar] [CrossRef]
- Zacate, M.O.; Collins, G.S. Composition-Driven Changes in Lattice Sites Occupied by Indium Solutes in Ni2Al3 Phases. Phys. Rev. B 2004, 70, 24202. [Google Scholar] [CrossRef]
- Achtziger, N.; Witthuhn, W. Perturbed-angular-correlation spectroscopy of the fluctuating hyperfine interaction at Cd-donor pairs in silicon: An approach to electronic transitions at impurities in semiconductors. Phys. Rev. B 1993, 47, 6990–7004. [Google Scholar] [CrossRef]
- Torumba, D.; Parlinski, K.; Rots, M.; Cottenier, S. Temperature dependence of the electric-field gradient in hcp-Cd from first principles. Phys. Rev. B 2006, 74, 144304. [Google Scholar] [CrossRef]
- Blume, M. Stochastic theory of line shape: Generalization of the Kubo-Anderson model. Phys. Rev. 1968, 174, 351–357. [Google Scholar] [CrossRef]
- Zacate, M.O.; Evenson, W.E. Stochastic models of hyperfine interactions in nonequilibrium: An examination of the XYZ model with a trapping-detrapping mechanism. Hyperfine Interact. 2007, 178, 57–61. [Google Scholar] [CrossRef]
- Zacate, M.O.; Evenson, W.E. Stochastic hyperfine interactions modeling library. Comput. Phys. Commun. 2011, 182, 1061–1077. [Google Scholar] [CrossRef]
- Zacate, M.O.; Evenson, W.E.; Newhouse, R.; Collins, G.S. Fitting TDPAC Spectra with Stochastic Models: PolyPacFit. Hyperfine Interact. 2010, 197, 223–227. [Google Scholar] [CrossRef]
- Bevington, J.P.; (Washington State University, Pullman, WA, USA). Description of DFT Calculations in In4Ba. Private communication, 2009. [Google Scholar]
- Liss, K.D.; Harjo, S.; Kawasaki, T.; Aizawa, K. Anisotropic thermal lattice expansion and crystallographic structure of strontium aluminide within Al10Sr alloy as measured by in-situ neutron diffraction. J. Alloy Compd. 2021, 869, 159232. [Google Scholar] [CrossRef]
- Zacate, M.O.; Williams, J.D. Vacancy encounter model for stochastically fluctuating electric field gradients in the Cu3Au crystal structure. Philos. Mag. 2019, 99, 1933–2015. [Google Scholar] [CrossRef]
- Philibert, J. Atom Movements: Diffusion and Mass Transport in Solids; Éditions de Physique: Les Ulis, France, 1991. [Google Scholar]
Figure 1.
(a) Crystal structure of In3La with La atoms (light shading) at corners of the cubic unit cell, In atoms (dark) at centers of cube faces, and nearest neighbors connected by segments; the principal EFG axis with largest magnitude is perpendicular to the cube face of the In atom. (b) Perturbation functions for 111In in In3La measured at the indicated temperatures, showing nuclear quadrupole relaxation that increases with increasing temperature. Reprinted figures with permission from [5] Copyright 2004 by the American Physical Society.

Figure 2.
The tetragonal Al4Ba crystal structure, showing Ba-sites (orange) and two inequivalent Al-sublattices Al1 and Al2 (grey) identified with numbers that have different EFGs.
Figure 2.
The tetragonal Al4Ba crystal structure, showing Ba-sites (orange) and two inequivalent Al-sublattices Al1 and Al2 (grey) identified with numbers that have different EFGs.

Figure 3.
PAC spectra of In4Ba measured at three temperatures, with time-domain spectra on the left and Fourier-amplitude spectra on the right: 15 °C and 200 °C in the static or slow-fluctuation regime and 650 °C in the motionally averaged regime.
Figure 3.
PAC spectra of In4Ba measured at three temperatures, with time-domain spectra on the left and Fourier-amplitude spectra on the right: 15 °C and 200 °C in the static or slow-fluctuation regime and 650 °C in the motionally averaged regime.

Figure 4.
Temperature dependences of the fundamental quadrupole interaction frequencies of signals in In4Ba. Values were determined by fits using empirical expressions of Equations (2) and (5).
Figure 4.
Temperature dependences of the fundamental quadrupole interaction frequencies of signals in In4Ba. Values were determined by fits using empirical expressions of Equations (2) and (5).

Figure 5.
Temperature dependences of the fundamental quadrupole interaction frequencies of signals from two Al4Ba samples: one prepared to have a Ba-poor composition (squares) and one prepared to have a Ba-rich composition (circles).
Figure 5.
Temperature dependences of the fundamental quadrupole interaction frequencies of signals from two Al4Ba samples: one prepared to have a Ba-poor composition (squares) and one prepared to have a Ba-rich composition (circles).

Figure 6.
Temperature dependences of the fundamental quadrupole interaction frequencies of signals from two Al4Eu samples: one prepared to have a Eu-rich composition (squares) and one prepared to have a Eu-poor composition (circles).
Figure 6.
Temperature dependences of the fundamental quadrupole interaction frequencies of signals from two Al4Eu samples: one prepared to have a Eu-rich composition (squares) and one prepared to have a Eu-poor composition (circles).

Figure 7.
Site fraction ratios for signals in Al4Ba and Al4Eu in the slow-fluctuation regimes. Here, is the fraction of tracers in the Al site with higher interaction frequency and is the fraction in the other site.
Figure 7.
Site fraction ratios for signals in Al4Ba and Al4Eu in the slow-fluctuation regimes. Here, is the fraction of tracers in the Al site with higher interaction frequency and is the fraction in the other site.

Figure 8.
Frequency spectra for Al4Sr measured at four temperatures. The component signals have site fractions close to 2/3 and 1/3. With increasing temperature, the two frequencies first diverge from each other (200 °C and 400 °C in the static regime), then converge (500 °C at the onset of the slow-fluctuation regime), and then merge (725 °C at the onset of the rapid-fluctuation regime).

Figure 9.
Temperature dependence of fundamental quadrupole interaction frequencies in Al4Sr. Data represented by black circles were obtained using fits to the empirical expression of Equation (5). Data represented by open, red squares were obtained using fits to the exact, numerical expression of Equation (6) and represent the static quadrupole interaction frequencies.

Figure 10.
Arrhenius plot of the mean fluctuation rate between Al1 and Al2 sublattices in Al4Sr.

Figure 11.
PAC spectra of Ga4Sr measured at three temperatures, with time-domain spectra on the left and Fourier-amplitude spectra on the right: 15 °C (static regime), 400 °C (slow-fluctuation regime), and 690 °C (upper end of slow-fluctuation regime/lower end of rapid-fluctuation regime). Trios of harmonics for signals are indicated with trident symbols (black for the low frequency signal, red for the high frequency signal, and green for the nearly dynamically averaged signal).

Figure 12.
Arrhenius plot of the site fraction ratio in Ga4Sr. Note the logarithmic scale. Results obtained from fits using Equation (5) are shown as solid squares, and those from fits using Equation (6) are shown as open circles.
Figure 12.
Arrhenius plot of the site fraction ratio in Ga4Sr. Note the logarithmic scale. Results obtained from fits using Equation (5) are shown as solid squares, and those from fits using Equation (6) are shown as open circles.

Figure 13.
Temperature dependence of quadrupole interaction frequencies in Ga4Sr. Data represented by black circles were obtained using fits to the empirical expression of Equation (5). Data represented by open, red squares were obtained using fits to the exact, numerical expression of Equation (6).

Figure 14.
Arrhenius plot of mean fluctuation rate between Ga1 and Ga2 sublattices in Ga4Sr.

Figure 15.
Arrhenius plot of site-fraction ratios for Al4Sr (open triangles), Al4Ba (filled squares), and Al4Eu (open squares). Lines indicate results to fitting ratios with Equation (9).
Figure 15.
Arrhenius plot of site-fraction ratios for Al4Sr (open triangles), Al4Ba (filled squares), and Al4Eu (open squares). Lines indicate results to fitting ratios with Equation (9).


Table 1.
First neighbor Al sites to Al sites in Al4Ba (calculated using structural information in [13]).
Table 1.
First neighbor Al sites to Al sites in Al4Ba (calculated using structural information in [13]).
| Site Type | Neighbor Type | Number | Distance |
|---|---|---|---|
| Al1 | Al1 | 0 | n/a * |
| Al1 | Al2 | 4 | 2.69 Å |
| Al2 | Al1 | 4 | 2.69 Å |
| Al2 | Al2 | 1 | 2.67 Å |
* n/a = not applicable.
Table 2.
Distribution of tracers on Al-type sublattices given by ratio of fraction with the larger room-temperature quadrupole interaction frequency to the fraction with lower frequency, , averaged over the temperature range of measurements.
Table 2.
Distribution of tracers on Al-type sublattices given by ratio of fraction with the larger room-temperature quadrupole interaction frequency to the fraction with lower frequency, , averaged over the temperature range of measurements.
| Compound | |||
|---|---|---|---|
| In4Ba | 1.0(1) | n/a * | n/a |
| Al4Ba | ~0.82(1) | −0.13(5) | 0.002(2) |
| Al4Eu | ~0.49(2) | −0.5(1) | 0.010(04) |
| Al4Sr | ~2.2(2) | 0.30(8) | −0.017(6) |
| Ga4Sr | T-dependent | 0.0(1) | 0.086(8) |
* n/a = not applicable
Publisher’s Note: MDPI stays neutral with regard to jurisdictional claims in published maps and institutional affiliations. |
© 2022 by the authors. Licensee MDPI, Basel, Switzerland. This article is an open access article distributed under the terms and conditions of the Creative Commons Attribution (CC BY) license (https://creativecommons.org/licenses/by/4.0/).
Share and Cite
MDPI and ACS Style
Newhouse, R.; Cawthorne, S.; Collins, G.S.; Zacate, M.O. Diffusion of Tracer Atoms in Al4Ba Phases Studied Using Perturbed Angular Correlation Spectroscopy. Crystals 2022, 12, 1152. https://0-doi-org.brum.beds.ac.uk/10.3390/cryst12081152
AMA Style
Newhouse R, Cawthorne S, Collins GS, Zacate MO. Diffusion of Tracer Atoms in Al4Ba Phases Studied Using Perturbed Angular Correlation Spectroscopy. Crystals. 2022; 12(8):1152. https://0-doi-org.brum.beds.ac.uk/10.3390/cryst12081152
Chicago/Turabian StyleNewhouse, Randal, Samantha Cawthorne, Gary S. Collins, and Matthew O. Zacate. 2022. "Diffusion of Tracer Atoms in Al4Ba Phases Studied Using Perturbed Angular Correlation Spectroscopy" Crystals 12, no. 8: 1152. https://0-doi-org.brum.beds.ac.uk/10.3390/cryst12081152
Note that from the first issue of 2016, this journal uses article numbers instead of page numbers. See further details here.