
Molecular Dynamics Simulation of the Crystallization Behavior of Octadecane on a Homogeneous Nucleus


Thermal Energy Storage Group, Bavarian Center for Applied Energy Research (ZAE Bayern), 85748 Garching, Germany
*
Authors to whom correspondence should be addressed.
Crystals 2022, 12(7), 987; https://0-doi-org.brum.beds.ac.uk/10.3390/cryst12070987
Submission received: 10 June 2022
/
Revised: 8 July 2022
/
Accepted: 12 July 2022
/
Published: 15 July 2022
(This article belongs to the Special Issue Crystals for Thermal Energy Storage)
Abstract
:Latent heat storages have the ability to contribute to a more sustainable energy supply network. However, phase change materials (PCM) used for latent heat storages often show supercooling. This phenomenon takes place whenever the PCM begins crystallizing below the freezing point and is one of the biggest drawbacks holding back the widespread use of PCM. Nucleation agents (NA) can be used to avoid the supercooling, yet the choice of an effective NA is not straightforward. In this work, molecular dynamics (MD) simulation was tested in order to simulate the crystallization of Octadecane on a NA. The simulation results include density, phase change temperature and enthalpy as well as the crystal structure and lie in good agreement with literature values and the authors’ own experimental data. Further simulations of the crystallization process on different surfaces of homogeneous nuclei acting as a NA were performed. The results reflect the hypothesis that liquid molecules start crystallizing easier on surfaces exposing the whole chain side rather than the chain ends. With the result, that the choice of parameters for the MD simulation represent the Octadecane system reliably and further studies can be performed including heterogeneous NA.
1. Introduction
Thermal energy storages are one of many energy storage possibilities that need to be assessed in order to implement a sustainable energy provision. One type of thermal energy storage is latent heat storage, which makes use of the latent energy released with the phase change of a material. Commonly, phase change materials (PCM) that transition from solid to liquid and vice versa are used.
The widespread use of PCM applications is often hindered by the negative impact of supercooling. The supercooling effect can be lowered or even prevented by the use of a suitable crystallization triggering method. Next to triggering by a mechanical shock or electric nucleation, nucleation agents (NA) are investigated [1]. A NA can be an additional material mixed into the PCM typically in a light by weight percentage to not alter the phase change properties significantly. In order to act sufficiently as a NA, the material properties must somehow create a local environment, which facilitates the crystallization of the surrounding PCM. The successful search for NA is still often an empirical process.
The complexity of the NA effect was shown within the work of the joint project LWSNet [2]. The supercooling behavior of salt hydrates was studied extensively. The role of the epitaxy relation between the crystal surfaces of the NA and the PCM could be identified, yet this property alone is not enough for identifying a suitable NA. Nevertheless, within this work the understanding of the NA effect on salt hydrates was improved. In large compartments or storages, paraffinic PCM commonly do not show a supercooling behavior. This changes significantly once small compartments like microcapsules or emulsions are used. Huang et al. prepared emulsions containing Tetradecane, Hexadecane as well as RT20, a commercial paraffin blend from Rubitherm Technologies GmbH, which all show a large supercooling in the range of 9–15 K [3]. Gschwander et al., give a detailed analysis on influences on the storage capacity of a range of emulsions consisting of alkanes with an even- and odd-numbered carbon chain. The supercooling of emulsions with Hexadecane and Octadecane was 6.34 K and 4.48 K, respectively, whereas for Heptadecane and Nonadecane it was 3.87 K and 3.22 K, respectively, all with the same purity and from the same supplier. These results indicate that alkanes with an even number of carbon atoms (16 and 18) show a higher degree of supercooling (6.34 K and 4.48 K, respectively) than odd-numbered ones, as well as that shorter alkanes tend to have a higher degree of supercooling. Further measurement showed that emulsions consisting of purer material led to a higher supercooling [4].
An interpretation on the arising supercooling in micro capsulated and emulsified alkanes can be found in the nucleation theory. A nucleation barrier has to be overcome in order to spontaneously transition from liquid phase to solid. This barrier is described by the bulk free energy and the interface free energy. The interface area refers to the surface area between the two phases, here liquid and solid. Both terms depend on the radius r, hence the volume, of the nucleus. The two terms depend inversely on r, resulting in a critical value r* for which the free energy has a minimum. Once a nucleus with r* is formed, with addition of molecules, the free energy reduces and the nucleus is more probable [5]. The nucleation barrier, and hence the formation of nuclei, can be overcome by thermal fluctuations. Therefore, the process is a probabilistic phenomenon. The number of nucleation formation events per time and volume is called the nucleation rate. The nucleation rate depends on the temperature as well, giving a temperature interval from which the rate changes from few nuclei in the long term to many events in the short term. Once the latter state is reached, nucleation can be expected. The corresponding temperature of this specific system is called the nucleation temperature. By applying this theory on the emulsions of paraffinic PCM, Günther et al. [6] explained the supercooling by the isolated nucleation sites given by the small compartments of PCM. This means that, in a large storage, one nucleation side, whether homogeneous or heterogeneous, can lead to the solidification of the whole system, whereas for emulsion one crystallized compartment will not lead to a phase change in another one inside the emulsion system.
As mentioned above, the use of NA can avoid the supercooling of the PCM. For the case of micro capsulated Octadecane, it was reported by Fan et al. [7] that two NA—Sodium chloride and 1-Octadecanol—could prevent supercooling, yet lead to drawbacks such as rough capsule surfaces. The best results could be observed with 20 wt% of paraffin as NA. It should be mentioned that not only a NA but also the surfactant could help reduce the supercooling. Hagelstein and Gschwander [8] reported that using polyvinyl alcohols as surfactants could reduce the degree of supercooling by 10 K. In order to achieve a more holistic understanding on how the NA works, a real time investigation of the crystallization process itself might provide new understandings. The possibilities to study NA-PCM-mixtures experimentally are limited. The crystallization of a material can be investigated for example by X-ray crystallography or Atomic Force Microscopy. Whereas these techniques give information about the progress of crystallization over time, it does not give detailed information about how the NA is supporting the crystallization of the PCM. This information lies on a molecular scale that might be gained by molecular dynamics (MD) simulation.
In recent years, MD simulation has been explored for different paraffin materials. Ewen et al. studied Hexadecane as a lubricant [9]. He compared, among others, the density and viscosity computed with different force fields used in MD simulation. The results lead to the suggestion that for long-chained alkanes the all-atom OPLS force field for long hydrocarbons, L-OPLS-AA, should be used. Glova et al. [10] gives a detailed study comparing in total 10 all-atom and united-atom force fields. They simulated an Eicosane system and computed thermal, structural and dynamic properties such as the density, viscosity and crystal structure. Regarding the density values, the united-atom force fields TraPPE, NERD and PYS represented the experimental values the best, among the all-atom force fields OPLS-AA, L-OPLS-AA, and CHARMM36. The result of the temperature-dependent density, simulated for a large temperature range from below and above the freezing point, show for PYS and L-OPLS-AA a rather smooth shift. Whereas for most of the force fields TraPPE, NERD, OPLS-UA, GAFF, GAFF2, CHARMM36 and OPLS-AA show an abrupt transition in the dependency, representing the phase change from liquid to solid. The crystal structure has been reproduced qualitatively by most of the force fields. GROMOS force field being the only exception. Wentzel et al. performed an extensive study on Tricosane, both pure and mixed with Heneicosane, with close attention on the rotator phases [11,12]. Using the Flexible Williams force field good results were obtained including structural and thermodynamic properties. A parametric screening of the nucleation on real and hypothetical heterogeneous NA surfaces were conducted by Bourque et al. [11]. To do so, a variable lattice was simulated in contact with Pentacontane and the crystal growth was studied. Identifying that next to a matching lattice, also the adhesion strengths is a potential parameter to consider for the NA choice. Li et al. [12] simulated a simplified waxy crude oil with and without ethylene-vinyl acetate EVA in contact with a copper wall using the OPLS-AA force field. The results indicate a reduced crystallization of the wax molecules (Octadecane) on the copper surface when EVA is added.
The aim of this study was to assess the usability of MD simulation as a tool for observing the crystallization process of PCM on a NA surface. The PCM of choice was Octadecane C18, due to previous work on enclosed C18 microcapsules [13,14,15]. Physical properties of a C18 system such as the density, the phase change temperature and the enthalpy as well as the crystal structure were computed and compared to literature values and the authors’ own experimental data in order to verify the simulation method. As a first approach, homogeneous mixtures of solid and liquid C18 were created. This means that a solid C18 nucleus immersed into liquid C18 surroundings acted as a homogeneous NA.
The results are in line with the hypothesis demonstrating that the homogeneous NA grows, if its surface exposes the chain sides rather than the chain ends. With this work, the applicability and therefore the potential of MD simulation to help in a better understanding of the effect of a NA on PCM could be shown.
2. Materials and Methods
The MD simulation principle is based on Newton’s equations of motion solved for a system consisting of a number of atoms. The equations’ solvation is performed considering short time steps. After each time step, the coordinates of each atom are new computed, and the trajectories of the atoms are determined. During the whole simulation time, the predefined number of atoms, temperature and pressure remain in case of a NPT ensemble. Once an equilibrium state is reached, the physical properties of the system can be calculated. To perform the MD simulation the freeware Gromacs® (Version 2019.4) was used.
The solvation of the interaction between atoms is based on force fields, representing both the non-bonded and bonded interactions. The first considers the repulsion, dispersion and Coulomb terms, whereas the second is based on the bond stretching, bond angle and dihedral angle interactions. In order to estimate atom–atom interactions, the parameters to describe the specific force field functions must be available and can be determined empirically or theoretically [16]. A number of force fields exist that may be suitable for different atomic and molecular systems. As the current study deals with the C18 alkane, the OPLS force field adapted for long hydrocarbons, L-OPLS-AA, after Siu et al. [17], is chosen. This OPLS is an all-atom force field and uses empirical data and ab initio calculations from a range of alkanes to describe their force field parameters. Aside from the applied force fields, it is necessary to define a cut-off radius. For atoms located within the cut-off range, the non-bonded and bonded forces are calculated. The cut-off radius was chosen to be 1.0 nm (1.0 × 10⁻⁹ m). Periodic boundary conditions in all three directions were applied.
In order to calculate a system with constant temperature and pressure, the system is coupled to a thermostat, a “pressure bath” [18]. The chosen thermostat was the velocity rescaling temperature coupling with a time constant of 0.1 ps (1.0 × 10⁻¹² s). The “pressure bath” was realized by Berendsen pressure coupling and set to 1 atm. The time constant was 10.0 ps and the compressibility uniform in all directions with 8.7 × 10⁻⁵ bar−1. This value was obtained for C18 by taking the experimental data from Dutour [19] determined for the range of 40 °C to 70 °C and extrapolating the linear correlation to the melting point for which the compressibility was taken. The Berendsen pressure coupling gives a robust simulation box when temperature annealing is applied and quick changes in the box shape due to phase change occur. Nevertheless, the results were validated carefully, as this coupling algorithm stands under the critique of maybe not representing the thermodynamic ensemble correctly [18].
The validation of the selected force field and parameters was performed by computing the density and phase change enthalpy. Both are properties that can be calculated by Gromacs® for each time step. A system of 216 C18 molecules was exposed to a range of temperatures below and above the melting point. The density was calculated by averaging the density values within a 0.2 ns duration once the system was in an equilibrated state. The results were compared with literature values available for C18 and the authors’ own laboratory measurements. For liquid C18 a densimeter (device: Anton Paar DMA 4500 M; material: Parafol 18-97) was used. The density of the solid C18 was measured via the Archimedes’ Principle using a density kit with a balance (Mettler Toledo). The simulated systems enthalpy was determined in the same manner and duration as the density and was compared with experimental data obtained by DSC measurements (device: TA Instruments DSC Q2000; heating/cooling rate: 2 K min−1, material: Parafol 18-97). The onset temperature of the heating peak given in the DSC thermogram was used for the melting point.
Besides the density and phase change enthalpy, the lattice parameter was determined for a 20 × 4 × 20 C18 system at 6.85 °C. The determination of the distances and angles of the unit cell were done based on the coordinate files of the atoms in the system. The length of the lattice unit cell in the x, y and z directions were calculated by the distance of the Vector between the ninth C-atom of neighboring C18 molecules. In order to determine the angle of the unit cell, the vector between the first and last C-atom of each molecule and its orientation with respect to the x, y and z planes was calculated on the basis of its coordinates.
In order to investigate the crystallization process of liquid C18 molecules onto a solid C18 surface, different solid liquid interfaces were created. The initial system was a 20 × 4 × 20 C18 ensemble. The solid C18 molecules in the initial system are called the NA in the following. Four different cases were defined. Its properties in terms of contact area and number of molecules are given in Table 1. Figure 1a illustrates the system and the four NA cases. For a right perception, the NA orientation due to the periodic boundary condition is explained in the following. The NA of case 1 ranges continuously in the x and z direction. The resulting contact area is a plane parallel to the x–z-plane and consists only of chain ends. Case 2 covers a contact area parallel to the y–z direction and its interface area exposes only chain sides. The small NA of case 3 is fully surrounded by PCM (Figure 1b) and is continuously repeated with every simulation box. The case 4 NA is like a rod infinitely ranging along the z direction (Figure 1c).
In order to create two phases of C18 molecules next to each other, it was necessary to create two temperature groups representing liquid and solid molecules. By exposing the NA molecules to a temperature far below the freezing point and the remaining molecules to a temperature above the melting point, a system could be provided in which a solid NA exists next to liquid C18 molecules. This configuration was the initial condition, which was used for further simulations in which the temperature was the same for both temperature groups. Three different system temperatures were simulated at −3.15 °C, 6.85 °C and slightly above the melting point at 28.85 °C. A NA-free system was simulated for all three temperatures, to distinguish if the crystallization onset is due to the NA or if it would also happen spontaneously. Contrary to the cases with an already existing NA, nucleation in the NA free case would occur stochastically. For that reason, this case was simulated for each temperature three times and average values were used.
The overall simulation time at a given temperature was 7.2 ns. All simulations were performed with a time step of 0.002 ps. Next to a visual observation of the nucleation process by VMD, a quantitative analysis of the crystallized molecules per time were performed. To distinguish if a C18 molecule was liquid or solid, the length between the first and last C-atom was measured with the Gromacs® distance function. The threshold length was chosen to be 2.1 nm, based on the results for the lattice constant given in Section 3.1. Both the molecules of the initial NA and the crystallized molecules were counted. The rate of crystallized molecules at three points of the simulation time were determined and compared for the different NA versions and temperature settings.
3. Results
3.1. Physical Properties
The density was determined for 6.85 °C, 16.85 °C, 26.85 °C, 36.85 °C and 46.85 °C. The results are given in Figure 2a. The density computed for the solid C18 system is in the scope of the variation of the literature values [20,21] and the experimental data. The density of the liquid C18 is a factor of 2.2% at 26.85 °C to 3.2% at 46.85 °C lower than the literature values [19,20,21,22] and the experimental data. A regression line (dashed line in Figure 2a) based on the literature values was calculated in order to estimate the deviation of the simulation.
For the same temperature values, the enthalpy of the system was determined. The enthalpy curve is given in Figure 2b. The enthalpy values both determined by simulation and experiment are given with reference to the enthalpy at 35 °C The red line represents the enthalpy curve determined during melting of C18, the blue during crystallization. The simulation is in very good agreement with the experimental data, both in the phase change temperature and enthalpy. Additionally, the melting point was determined to be at 26.97 °C.
The results for the triclinic unit cell parameters of the C18 crystal lattice are given in Table 2. The edge length of the simulated unit cell are mainly larger compared to the literature values [23]. The deviation of the lengths a and b are 4% and below, for length c it is less than 10%. The unit cell angle α is 12% smaller than the literature value, β 9% and γ 1% smaller. At the end of the represented study, further works were published also reporting good results for the simulation of the crystal structure of alkanes with different force fields [24,25,26]. The united-atom TraPPE seems promising with some limitations in representing the crystals and phase change. Even though the L-OPLS-AA used within this work showed good results for the studied system and temperature range, further works might also consider the less computation expensive TraPPE force field for comparison.
3.2. Crystallization Behavior
Figure 3a–e shows an overview of the percentile of crystallized molecules within the total system for the four different NA cases and the NA-free reference system. For all temperatures, the NA-free system never reaches a percentile of crystalized molecules of more than 4%. Figure 4a displays a snapshot of the system after being in an environment of −3.15 °C showing no crystals for 7.2 ns. Hence, in this case the percentile of molecules with a chain length longer than the threshold of 2.1 nm only occurs without formation of a nucleus and account for the random distribution of the chain shape.
The surface of case 1 is not inducing the crystallization of the liquid molecules within the simulation time. At the end of the simulation there is even for a supercooling of 30.12 K nearly no growth in the NA compared to the initial NA (Figure 4b). Nevertheless, it can be seen that the higher the supercooling the more molecules crystallize.
On the contrary, having a similar interface area as case 1, but built up only by the chain sides (case 2), the crystal grows steadily during the simulation. It is quite likely that by continuing the simulation the whole system would be in solid state. Even if there is no supercooling, the NA induces the crystallization process. The molecules must not necessarily crystallize in the same orientation as the molecules on the NA interface. Figure 5 illustrates that some molecules are rotated, mainly about 90°, to the chain sides, on the interface. These molecules might lead to a polycrystalline solid system with ongoing simulation time.
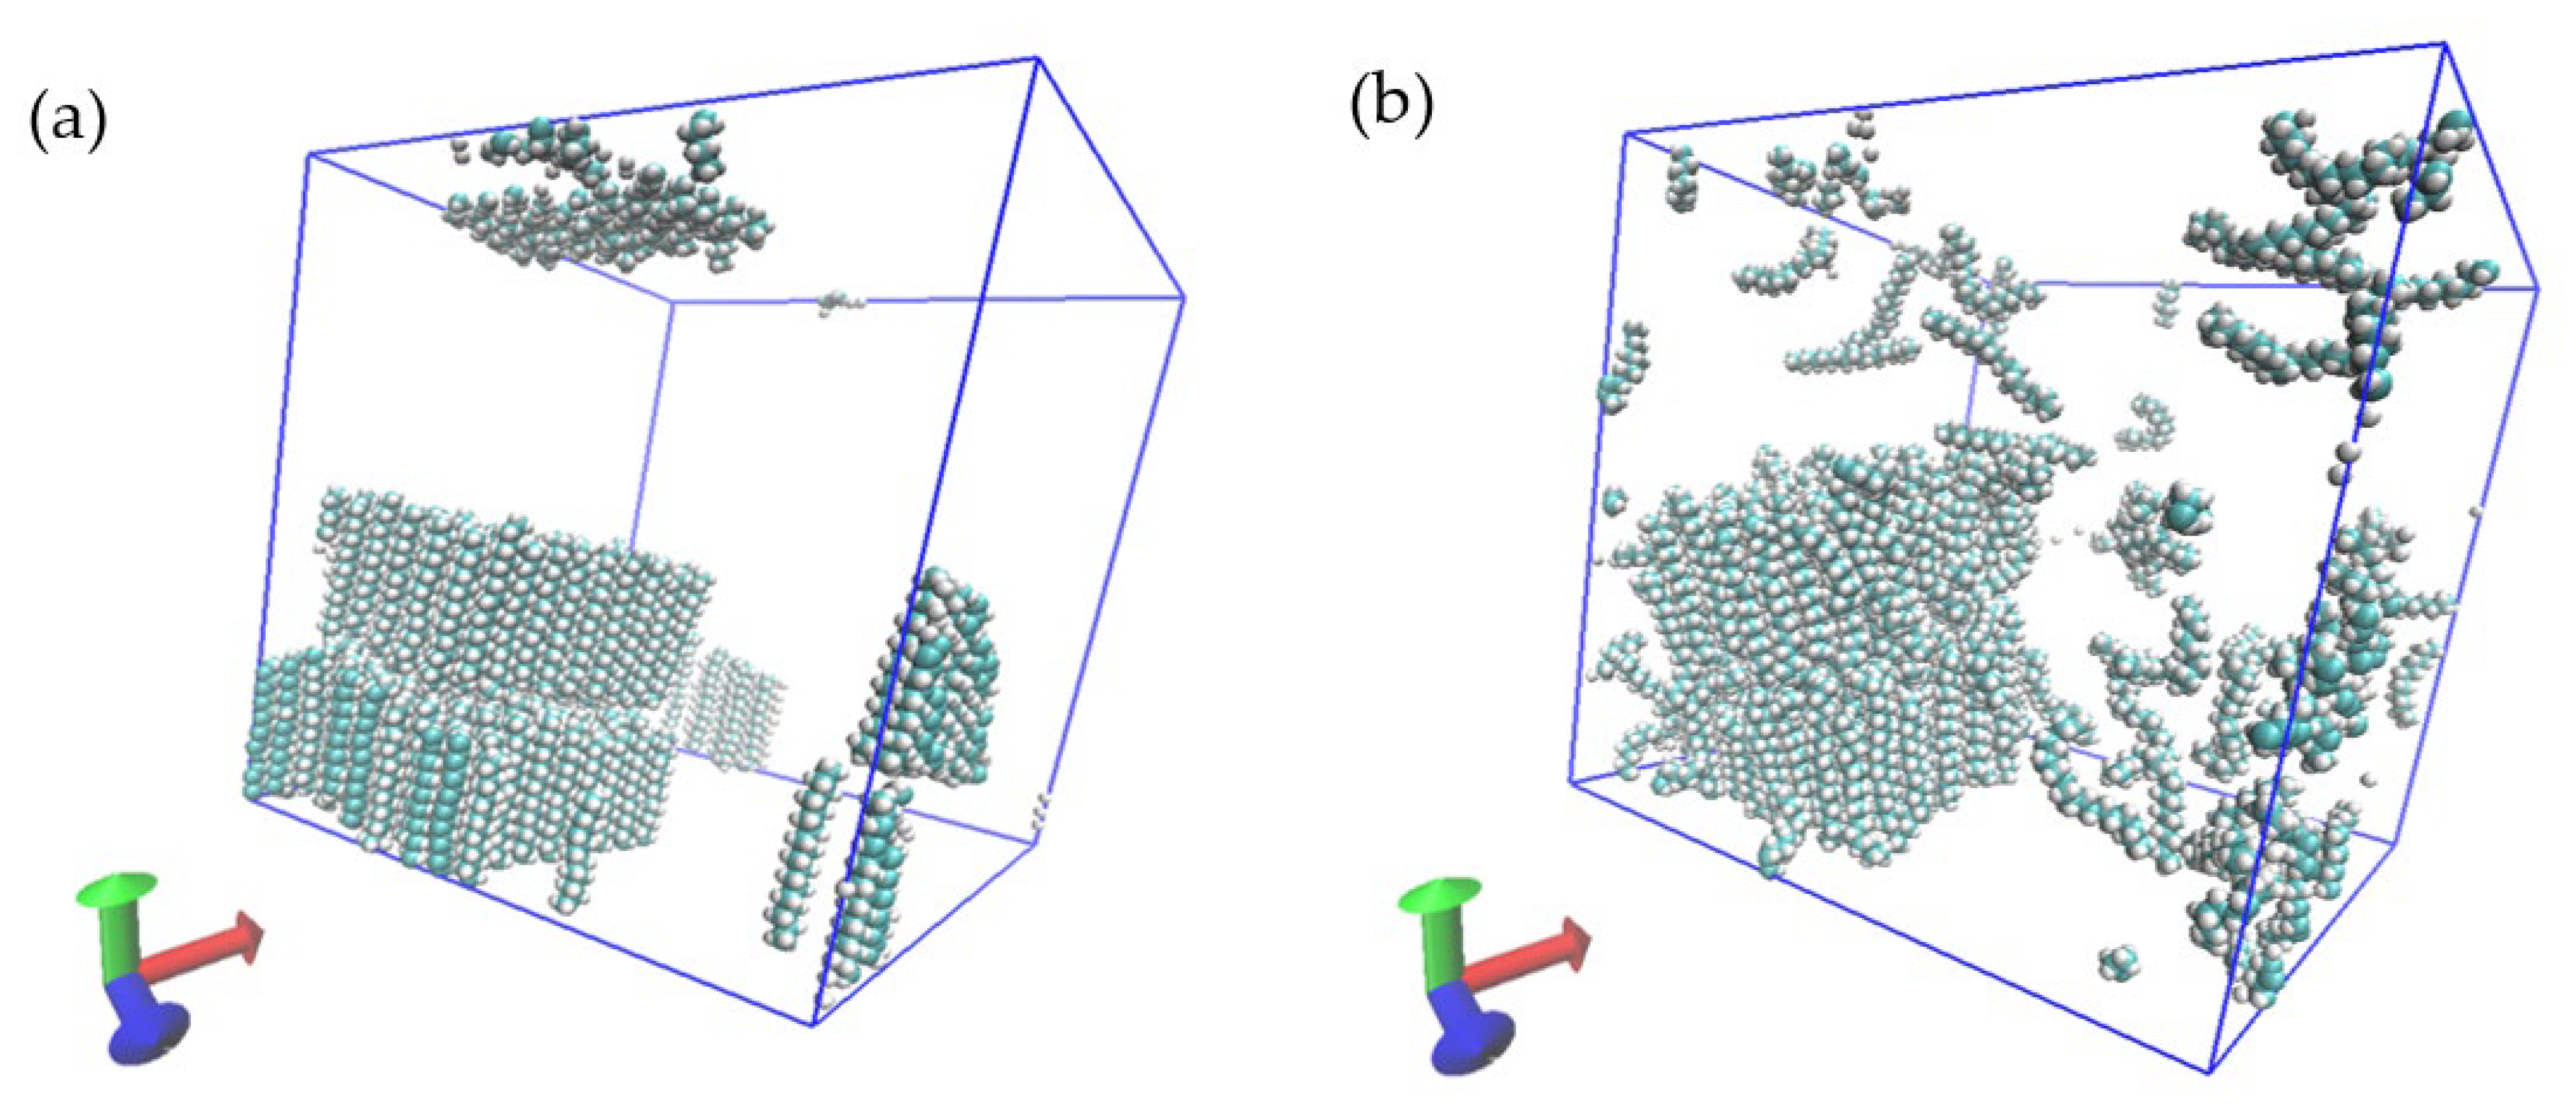
The crystallization behavior on the small NA (case 3), which offers both chain ends and sides at the interface and which is fully surrounded by liquid PCM, shows the strongest temperature dependence. The higher the supercooling the faster is the crystallization process. As opposed to this, for a temperature close the melting point the number of crystallized molecules reduces with time, which means that the initial NA is melting. This observation becomes more visible in Figure 6a,b, which shows snapshots of only the initial NA molecules after 7.2 ns at a supercooling of 30.12 K, a temperature slightly above the melting point 28.85 °C. With the supercooling, all molecules are straight, ordered next to each other and hence, part of a crystal. Whereas the temperature close to the melting onset leads to less ordered orientation and a random shape of the molecules.
The NA of case 4 offers similar as case 3, both interfaces with chain ends and sides, but the NA is not fully surrounded by liquid PCM. Other than the NA of case 3, the NA is not melting at 28.85 °C. The rate of crystallized molecules per time does not represent any temperature dependency and is similar to the rate of case 2.
Overall, the results could show that an interface area formed by chain sides will lead more successfully to crystallization of the liquid PCM onto the NA surface than the chain ends. The NA of cases 2 and 4 given an infinite surface successfully induced crystallization for a temperature close to the melting point, hence without supercooling. Further, Case 3 clearly demonstrates the correlation between the NA stability and the temperature.
4. Discussion and Conclusion
4.1. Physical Properties
The results in Section 3.1 were obtained in order to understand how well the simulation represents the liquid and solid phase of C18 close to the melting temperature. The results are in good agreement with the literature and the authors’ own experiments, yet possible reasons for the deviations shall be subsequently discussed. The deviations seen for the density of liquid C18 might be explained by the assumption of a continuous bulk, which does not include interfaces with the surroundings and effects like surface tension. The density of the solid state was higher than the literature values and experimental data. This observation is to be expected as no voids or impurities exists in the simulated solid bulk. Nevertheless, the results show in the temperature region of interest a deviation in comparison to the literature that is less than 3.2%.
Same accounts for the crystal structure of the simulated C18 bulk crystal. The unit cell distances are slightly better represented than the angles. From the simulation, a nearly perfect mono-crystal is produced, whereas it could be discussed if this is the case for experimentally investigated C18 crystals. As just mentioned, the lack of interactions with impurities or interfaces might explain the deviations.
Overall, the results show that with the good agreement in density the distance of the molecules are represented well. The phase change temperature resulting from the simulations is in good agreement with the experimental data and leads to the conclusion that the energetic description of the system is right. The results satisfy the depiction of the solid and liquid C18.
4.2. Crystallization Behavior
The crystallization behavior resulting for the different homogeneous NA interfaces is in line with the hypothesis. It was clearly shown that the preferable NA surfaces for crystallization are built up by the chain sides. If both chain sides and chain ends are given as a NA surface, the crystallization starts at the chains sides interface. A NA with only chain ends on its interface with the PCM does not induce its crystallization even for a high supercooling of 30.12 K. If the NA volume small, it can be shown that it is not stable enough at a temperature close to the melting point, which may indicate that for this environment the NA is smaller than the critical nucleus. However, for the other two temperature values below the melting point it acts as a NA. The system without a NA crystalized at no time for any of the simulated temperatures.
The aim of this work was to understand and validate the applicability of the chosen MD simulation for an enhanced study on the crystallization onto a NA. The promising result give a positive outlook and further simulation on PCM systems with heterogeneous NA.
Author Contributions
Conceptualization, methodology, validation, formal analysis, investigation and resources, S.T. and S.H.; simulations, data curation and writing—original draft preparation and visualization, S.T.; writing—review and editing, supervision, project administration and funding acquisition, S.H. All authors have read and agreed to the published version of the manuscript.
Funding
This research was funded by German Federal Ministry for Economic Affairs and Climate Action, grant number 03ET1596B.
Data Availability Statement
Not applicable.
Acknowledgments
The authors acknowledge the discussions and collaboration within this project with their associates from Fraunhofer-Institute ISE.
Conflicts of Interest
The authors declare no conflict of interest.
References
- Beaupere, N.; Soupremanien, U.; Zalewski, L. Nucleation triggering methods in supercooled phase change materials (PCM), a review. Thermochim. Acta 2018, 670, 184–201. [Google Scholar] [CrossRef]
- Ebert, H.-P.; Bauer, T.; Langer, W.; Sextl, G.; Voigt, W.; Mach, R.; Keuper, M.; Günther, E. Netzwerk zur Überwindung Grundlegender Probleme bei der Entwicklung Hocheffizienter Latentwärmespeicher auf Basis Anorganischer Speichermaterialien; Technische Informationsbibliothek u Universitätsbibliothek; Bayerisches Zentrum für Angewandte Energieforschung e.V. (ZAE Bayern): Würzburg, Germany, 2008. [Google Scholar]
- Huang, L.; Günther, E.; Dötsch, C.; Mehling, H. Subcooling in PCMemulsions—Part1: Experimental. Thermochim. Acta 2010, 509, 93–99. [Google Scholar] [CrossRef]
- Gwschander, S.; Niedermaier, S.; Gamisch, S.; Kick, M.; Klünder, F.; Haussmann, T. Storage Capacity in Dependency of Supercooling and Cycle Stability of Different PCM Emulsions. Appl. Sci. 2021, 11, 3612. [Google Scholar] [CrossRef]
- Karthika, S.; Radhakrishnan, T.K.; Kalaichelvi, P. A Review of Classical and Nonclassical Nucleation Theories. Cryst. Growth Des. 2016, 16, 6663–6681. [Google Scholar] [CrossRef]
- Günther, E.; Huang, L.; Mehling, H.; Dötsch, C. Subcooling in PCM emulsions—Part 2: Interpretation in terms of nucleation theory. Thermochim. Acta 2011, 522, 199–204. [Google Scholar] [CrossRef]
- Fan, Y.; Zhang, X.; Wang, X.; Li, J.; Zhu, Q. Super-cooling prevention of microencapsulated phase change material. Thermochim. Acta 2004, 413, 1–6. [Google Scholar] [CrossRef]
- Hagelstein, G.; Gschwander, S. Reduction of supercooling in paraffin phase change slurry by polyvinyl alcohol. Int. J. Refrig. 2017, 84, 67–75. [Google Scholar] [CrossRef]
- Ewen, J.P.; Gattinoni, C.; Thakkar, F.M.; Morgan, N.; Spikes, H.A.; Dini, D. A Comparison of Classical Force-Fields for Molecular Dynamics Simulations of Lubricants. Materials 2016, 9, 651. [Google Scholar] [CrossRef] [Green Version]
- Glova, A.D.; Volgin, I.V.; Nazarychev, V.M.; Lyulin, S.V.; Gurtovenko, A.A. Toward realistic computer modeling of paraffin-based composite materials: Critical assessment of atomic-scale models of paraffins. RSC Adv. 2019, 9, 38834–38847. [Google Scholar] [CrossRef] [Green Version]
- Wentzel, N.; Milner, S.T. Crystal and rotator phases of 𝑛-alkanes: A molecular dynamics study. J. Chem. Phys. 2010, 132, 044901. [Google Scholar] [CrossRef]
- Wentzel, N.; Milner, S.T. Simulation of multiple ordered phases in C23 n-alkane. J. Chem. Phys. 2011, 134, 224504. [Google Scholar] [CrossRef] [PubMed]
- Bourque, A.J.; Locker, R.C.; Rutledge, G.C. Heterogeneous Nucleation of an n-Alkane on Tetrahedrally Coordinated Crystals. J. Chem. Phys. 2017, 121, 904–911. [Google Scholar] [CrossRef] [PubMed] [Green Version]
- Li, Q.; Deng, X.; Liu, Y.; Cheng, Q.; Liu, C. Gelation of waxy crude oil system with ethylene-vinyl acetate on solid surface: A molecular dynamics study. J. Mol. Liq. 2021, 331, 115816. [Google Scholar] [CrossRef]
- Hiebler, S.; Hoock, P.; Schmit, H. Unterkühlung in Mikro-Kompartierten Organischen PCM: MIKOPUK, Bayerisches Zentrum für Angewandte Energieforschung e.V.; Bereich Energiespeicherung: Würzburg, Germany, 2017. [Google Scholar]
- González, M.A. Force fields and molecular dynamics simulations. Collection SFN 2011, 12, 169–200. [Google Scholar] [CrossRef]
- Siu, S.W.I.; Pluhackova, K.; Böckmann, R.A. Optimization of the OPLS-AA Force Field for Long Hydrocarbons. J. Chem. Theory Comput. 2012, 8, 1459–1470. [Google Scholar] [CrossRef]
- Abraham, M.; Hess, B.; van der Spoel, D.; Lindhal, E.; GROMACS Development Team. GROMACS Reference Manual Version 2016.4; University of Groningen: Groningen, The Netherlands, 2017. [Google Scholar]
- Dutour, S.; Daridon, J.L.; Lagourette, B. Pressure and Temperature Dependence of the Speed of Sound and Related Properties in Normal Octadecane and Nonadecane. Int. J. Thermophys. 2000, 21, 173–184. [Google Scholar] [CrossRef]
- Carruthers, J.C. The electrophoresis of certain hydrocarbons and their simple derivatives as a function of pH. Trans. Faraday Soc. 1938, 34, 300–307. [Google Scholar] [CrossRef]
- Rubitherm. Data Sheet RT28HC. 2020. Available online: https://www.rubitherm.eu/media/products/datasheets/Techdata_-RT28HC_EN_09102020.PDF (accessed on 10 May 2022).
- Caudwell, D.R.; Trusler, J.P.M.; Vesovic, V.; Wakeham, W.A. The viscosity and density of n-dodecane and n-octadecane at pressures up to 200 MPa and temperatures up to 473 K. Int. J. Thermophysics 2004, 25, 1339–1352. [Google Scholar] [CrossRef]
- Hayashida, T. Crystal Structure of Triclinic Form of n-Octadecane. J. Phys. Soc. 1962, 17, 306–315. [Google Scholar] [CrossRef]
- Burrows, S.A.; Korotkin, I.; Smoukov, S.K.; Boek, E.; Karabasov, S. Benchmarking of Molecular Dynamics Force Fields for Solid−Liquid and Solid−Solid Phase Transitions in Alkanes. J. Phys. Chem. 2021, 125, 5145–5159. [Google Scholar] [CrossRef]
- Dai, L.; Rutkevych, P.P.; Chakraborty, S.; Wu, G.; Ye, J.; Lau, Y.H.; Ramanarayan, H.; Wu, D.T. Molecular dynamics simulation of octacosane for phase diagrams and properties via the united-atom scheme. Phys. Chem. Chem. Phys. 2021, 23, 21262–21271. [Google Scholar] [CrossRef] [PubMed]
- Wang, J.; Hao, Y.; Zhu, B.; Han, T.; Li, Z.; Zhang, J. Crystalline Behavior of Paraffin Wax. J. Phys. Chem. 2022, 126, 985–995. [Google Scholar] [CrossRef] [PubMed]
Figure 1.
(a) Simulated C18 system. Boxes indicate the initial molecules that form the NA. Red: case 1. Green: case 2. Orange, full line: case 3 and orange, dashed line: case 4. (b) Multiple periodic NA of case 3 and (c) of case 4.
Figure 1.
(a) Simulated C18 system. Boxes indicate the initial molecules that form the NA. Red: case 1. Green: case 2. Orange, full line: case 3 and orange, dashed line: case 4. (b) Multiple periodic NA of case 3 and (c) of case 4.

Figure 2.
(a) density values for C18 from literature, the authors’ own experiments and MD simulation as well as regression fit from density values of the liquid state (dotted line) (b) enthalpy curve of C18 obtained by DSC measurement and MD simulation with reference to the enthalpy at 35 °C.
Figure 2.
(a) density values for C18 from literature, the authors’ own experiments and MD simulation as well as regression fit from density values of the liquid state (dotted line) (b) enthalpy curve of C18 obtained by DSC measurement and MD simulation with reference to the enthalpy at 35 °C.

Figure 3.
Percentile of crystallized C18 molecules in simulation box for (a) no NA, (b) Na with a surface consisting of chain ends, (c) NA with surfaces consisting only of chain sides, (d) small NA with surfaces of both chain sides and ends and (e) a large NA with surfaces of both chain sides as well as (f) the simulated C18 system with boxes indicating the initial NA.


Figure 4.
Snapshot of (a) one NA-free case and (b) case 1 at 7.2 ns at −3.15 °C.

Figure 5.
Snapshot of the crystallized molecules on the NA of case 2 at −3.15 °C and a simulation duration of 7.2 ns.
Figure 5.
Snapshot of the crystallized molecules on the NA of case 2 at −3.15 °C and a simulation duration of 7.2 ns.

Figure 6.
Snapshot of the initial NA molecules of case 3 at 7.2 ns at (a) −3.15 °C and (b) 28.85 °C. Molecules are cutoff due to the periodic boundary condition.
Figure 6.
Snapshot of the initial NA molecules of case 3 at 7.2 ns at (a) −3.15 °C and (b) 28.85 °C. Molecules are cutoff due to the periodic boundary condition.


Table 1.
Overview of initial number of molecules per NA and surface area surrounded by liquid PCM for one box with a total number of 1600 C18 molecules.
Table 1.
Overview of initial number of molecules per NA and surface area surrounded by liquid PCM for one box with a total number of 1600 C18 molecules.
| Case 1 | Case 2 | Case 3 | Case 4 | |
|---|---|---|---|---|
| Number of molecules NA | 800 | 800 | 200 | 400 |
| Surface area chain ends | - | 8.8 nm2 | 4.4 nm2 | 4.4 nm2 |
| Surface area chain front | 9.4 nm2 | - | 9.4 nm2 | 4.7 nm |
Table 2.
Unit cell parameter of the C18 lattice taken from [23] and computed by MD simulation.
Table 2.
Unit cell parameter of the C18 lattice taken from [23] and computed by MD simulation.
| Length a | Length b | Length c | Angle α | Angle β | Angle γ | |
|---|---|---|---|---|---|---|
| Literature | 0.435 nm | 0.489 nm | 2.50 nm | 83.0° | 67.0° | 111.4° |
| MD simulation | 0.44 ± 0.060 nm | 0.51 ± 0.076 nm | 2.27 ± 0.14 nm | 72.8° ± 1.4° | 60.8° ± 1.7° | 112.9° ± 1.8° |
Publisher’s Note: MDPI stays neutral with regard to jurisdictional claims in published maps and institutional affiliations. |
© 2022 by the authors. Licensee MDPI, Basel, Switzerland. This article is an open access article distributed under the terms and conditions of the Creative Commons Attribution (CC BY) license (https://creativecommons.org/licenses/by/4.0/).
Share and Cite
MDPI and ACS Style
Tafelmeier, S.; Hiebler, S. Molecular Dynamics Simulation of the Crystallization Behavior of Octadecane on a Homogeneous Nucleus. Crystals 2022, 12, 987. https://0-doi-org.brum.beds.ac.uk/10.3390/cryst12070987
AMA Style
Tafelmeier S, Hiebler S. Molecular Dynamics Simulation of the Crystallization Behavior of Octadecane on a Homogeneous Nucleus. Crystals. 2022; 12(7):987. https://0-doi-org.brum.beds.ac.uk/10.3390/cryst12070987
Chicago/Turabian StyleTafelmeier, Stefanie, and Stefan Hiebler. 2022. "Molecular Dynamics Simulation of the Crystallization Behavior of Octadecane on a Homogeneous Nucleus" Crystals 12, no. 7: 987. https://0-doi-org.brum.beds.ac.uk/10.3390/cryst12070987
Note that from the first issue of 2016, this journal uses article numbers instead of page numbers. See further details here.