
In Vitro Physical Characterizations and Docking Studies on Carvedilol Nanocrystals

 ,
,  , ,
, ,  , , , , and
Abstract
:1. Introduction
2. Materials and Methods
2.1. Materials
2.2. Phase Solubility Studies
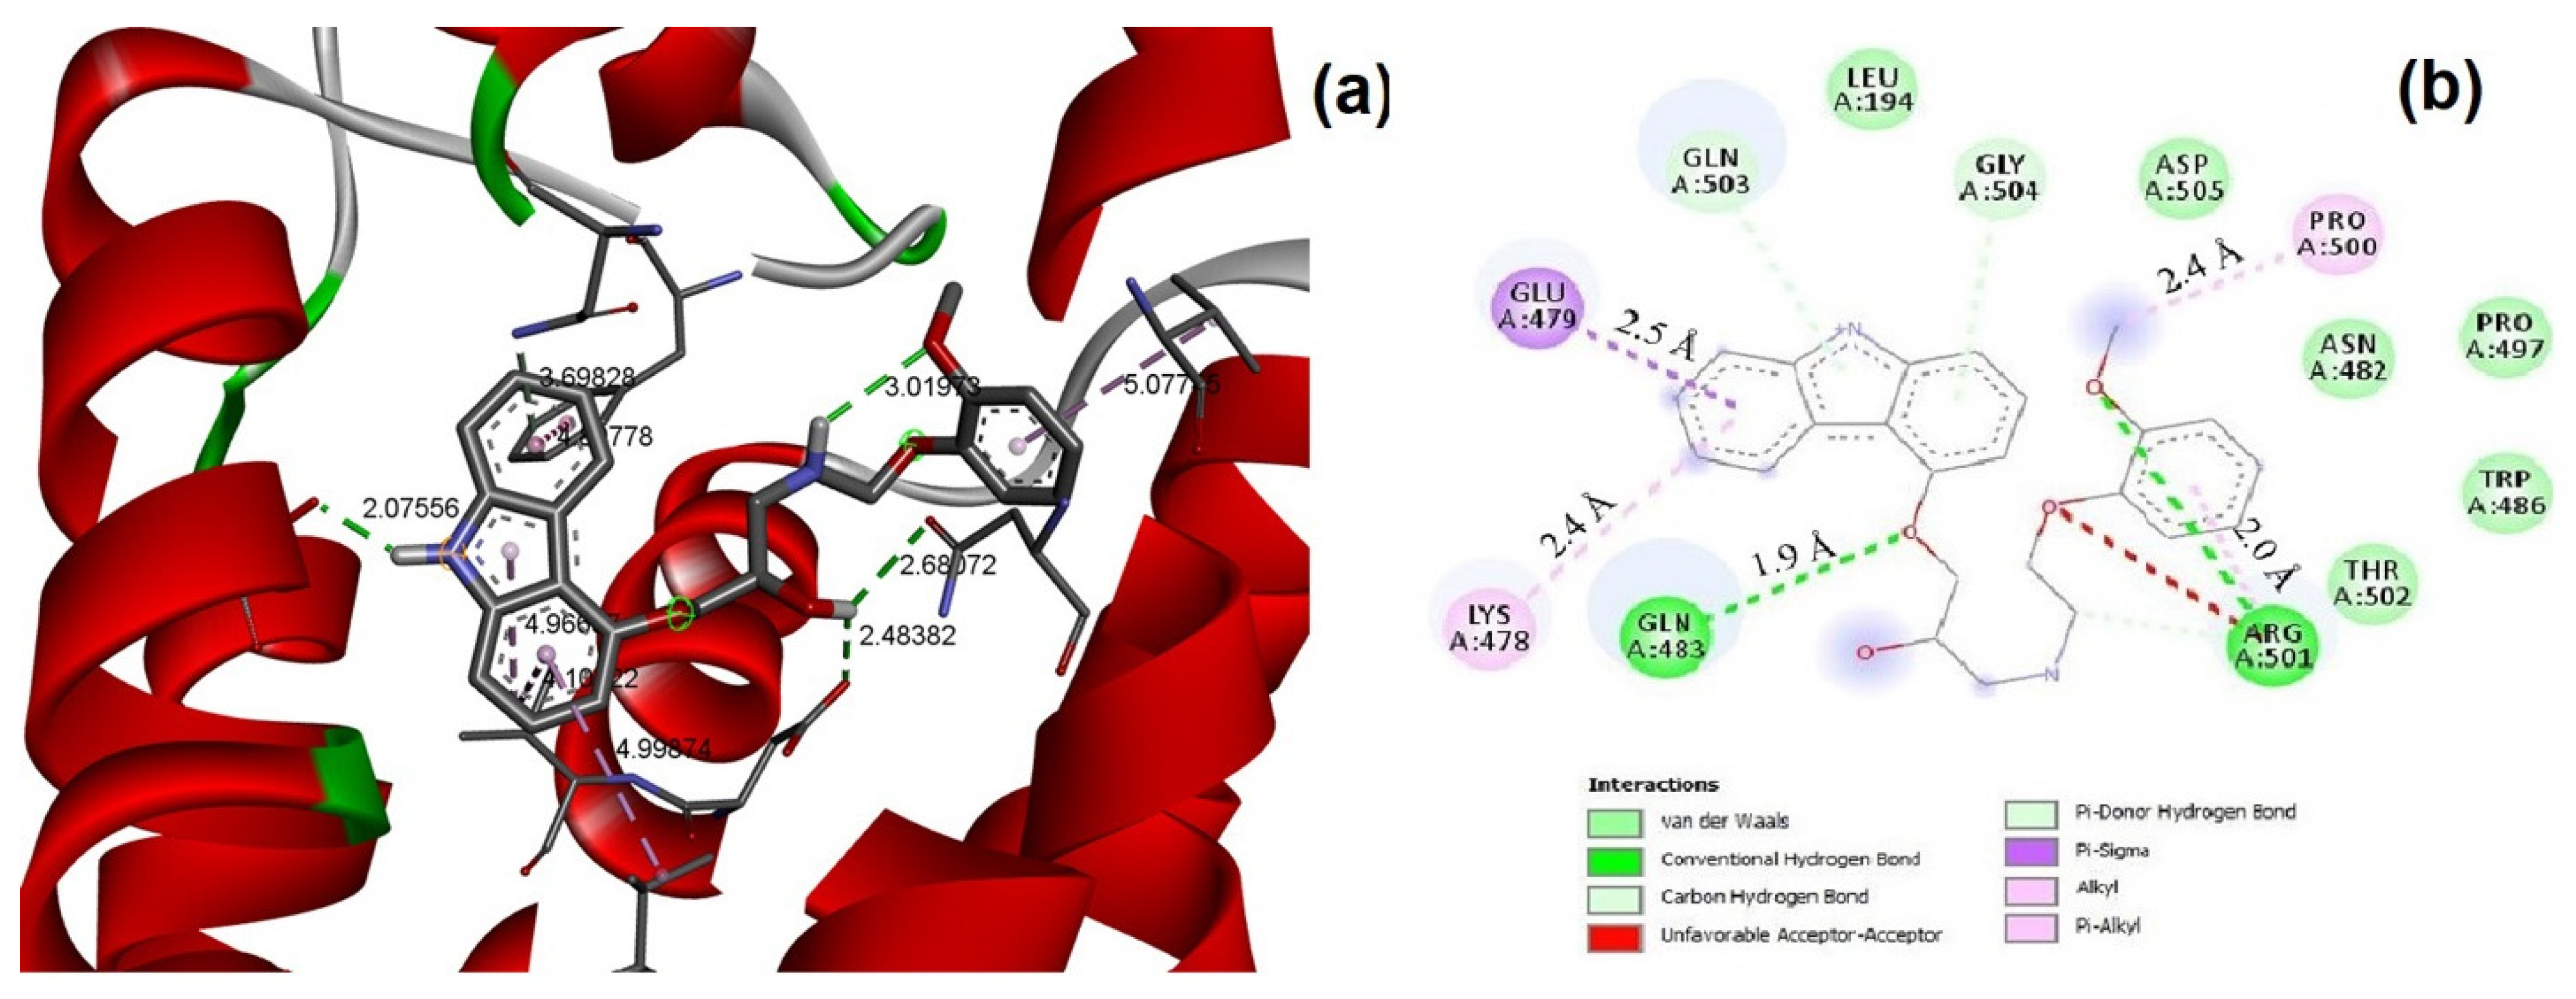
2.3. Docking Study
2.4. Preparation of CRL Nanocrystals (CRL-NCs)
2.5. Percentage Yield and Drug Content
2.6. Drug Entrapment Efficiency (EE)
CRL)/(Total concentration of PVP/SDS) × 100
2.7. Particle Size (PS) Analysis
2.8. Dynamic Light Scattering
2.9. Scanning Electron Microscopy (SEM)
2.10. Solid State Profile
2.10.1. Fourier Transform Infrared (FT-IR) Spectroscopy
2.10.2. X-ray Diffraction (XRD) Study
2.10.3. Differential Scanning Calorimetry (DSC)
2.11. In Vitro Dissolution Study
Dissolution Kinetic Study
2.12. Stability Studies
2.13. Analytical Statistics
3. Results and Discussion
3.1. Preparation of NCs
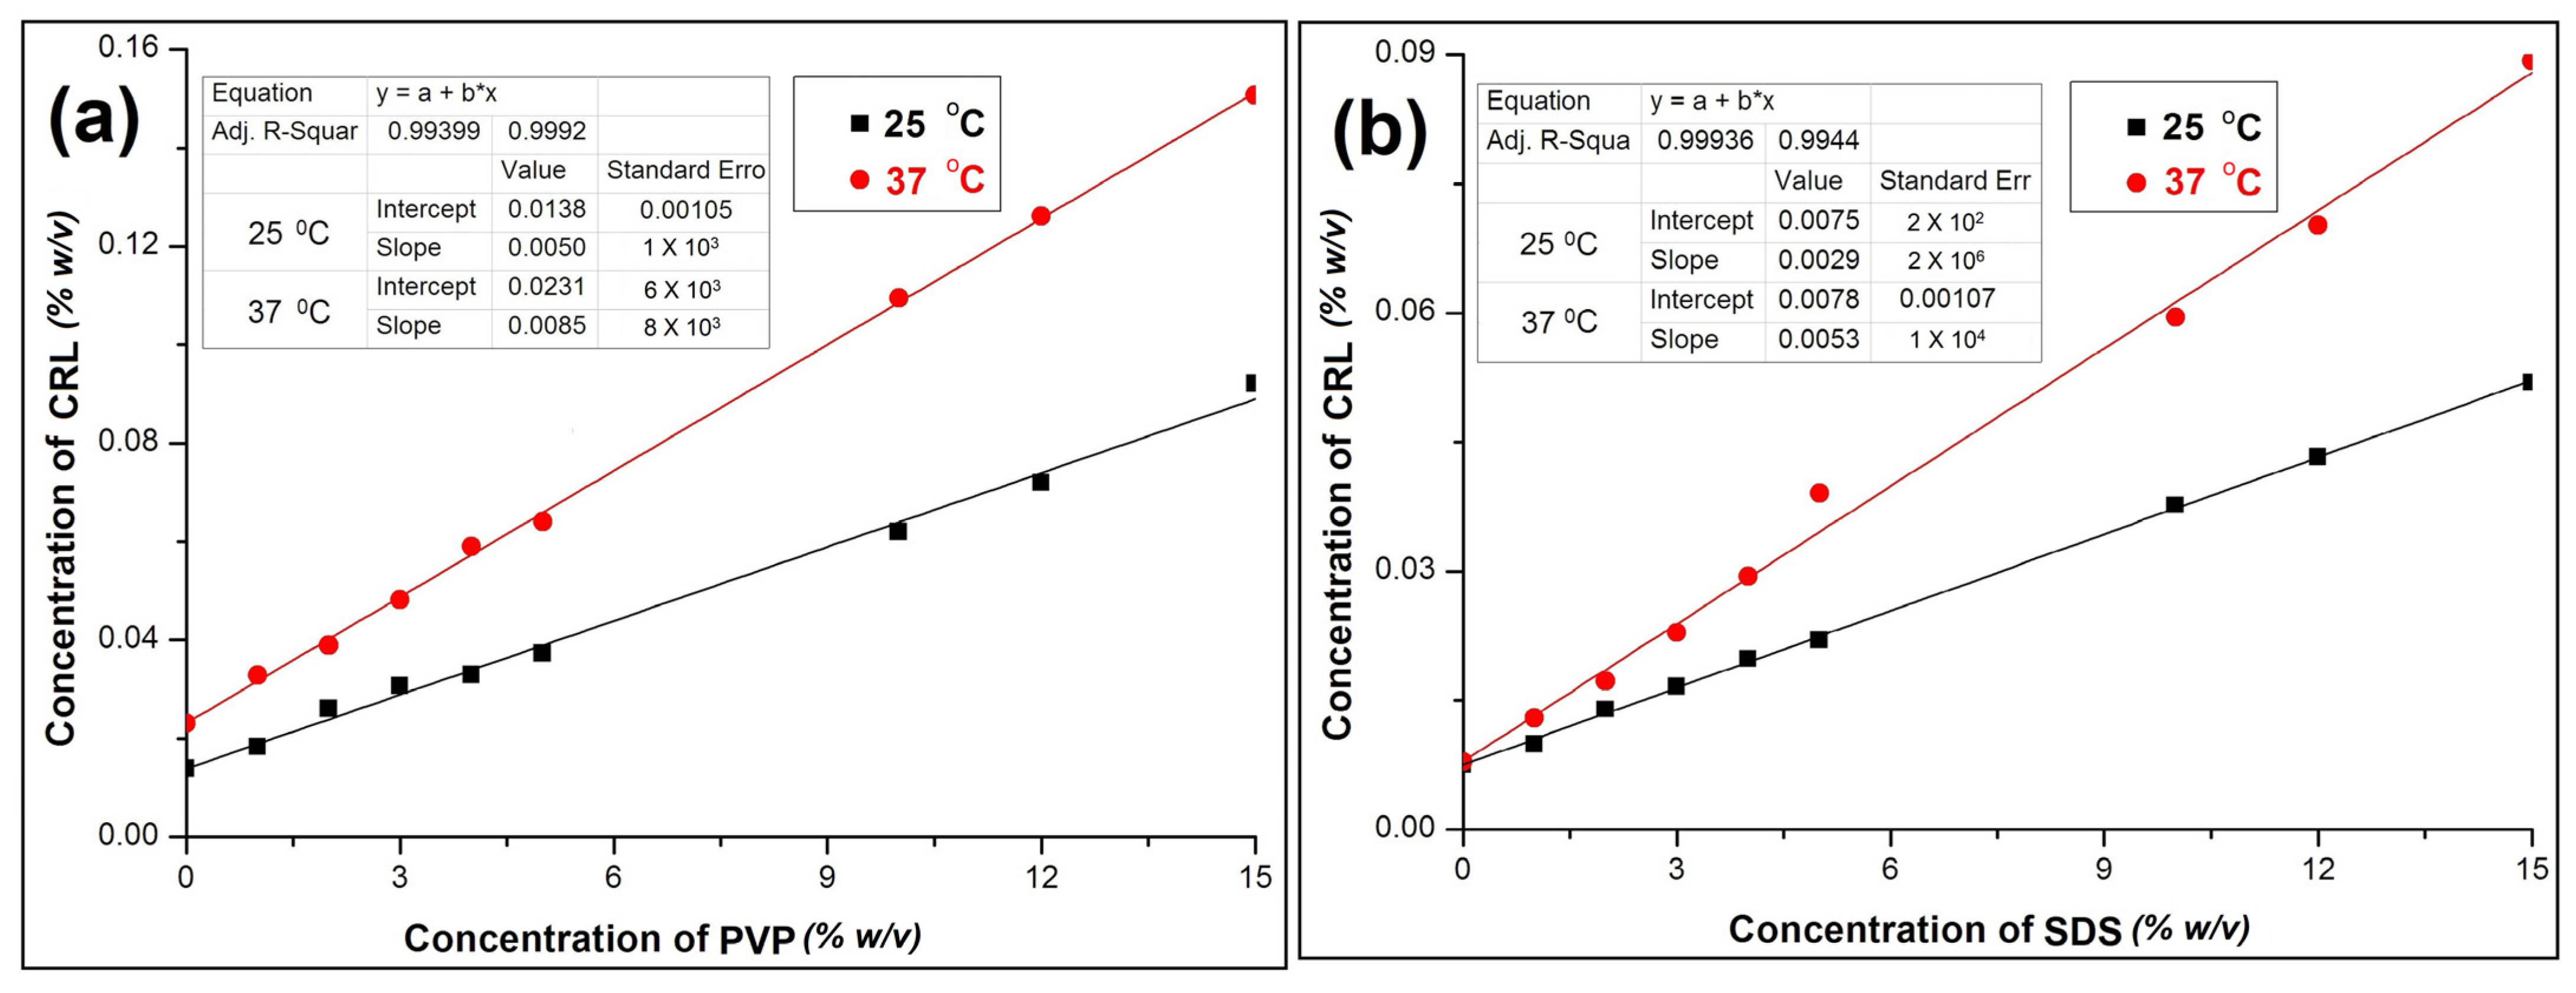
3.2. Thermodynamics Outcome
3.3. Docking Outcome
3.4. Percent Yield, Drug Content and % EE
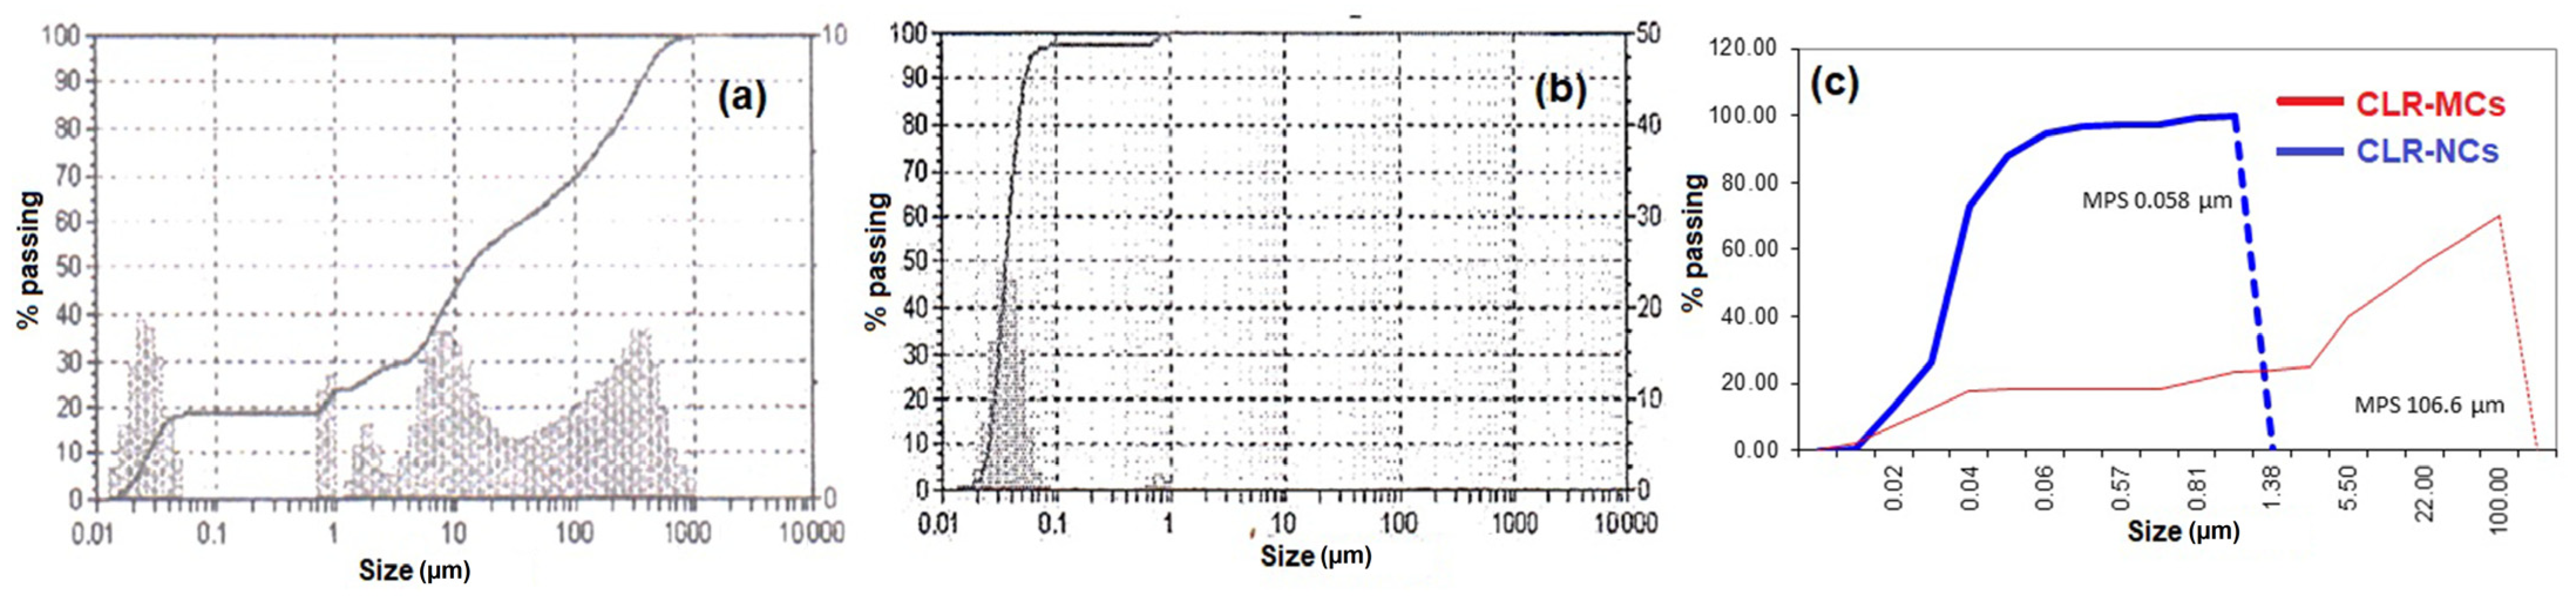
3.5. PS Analysis
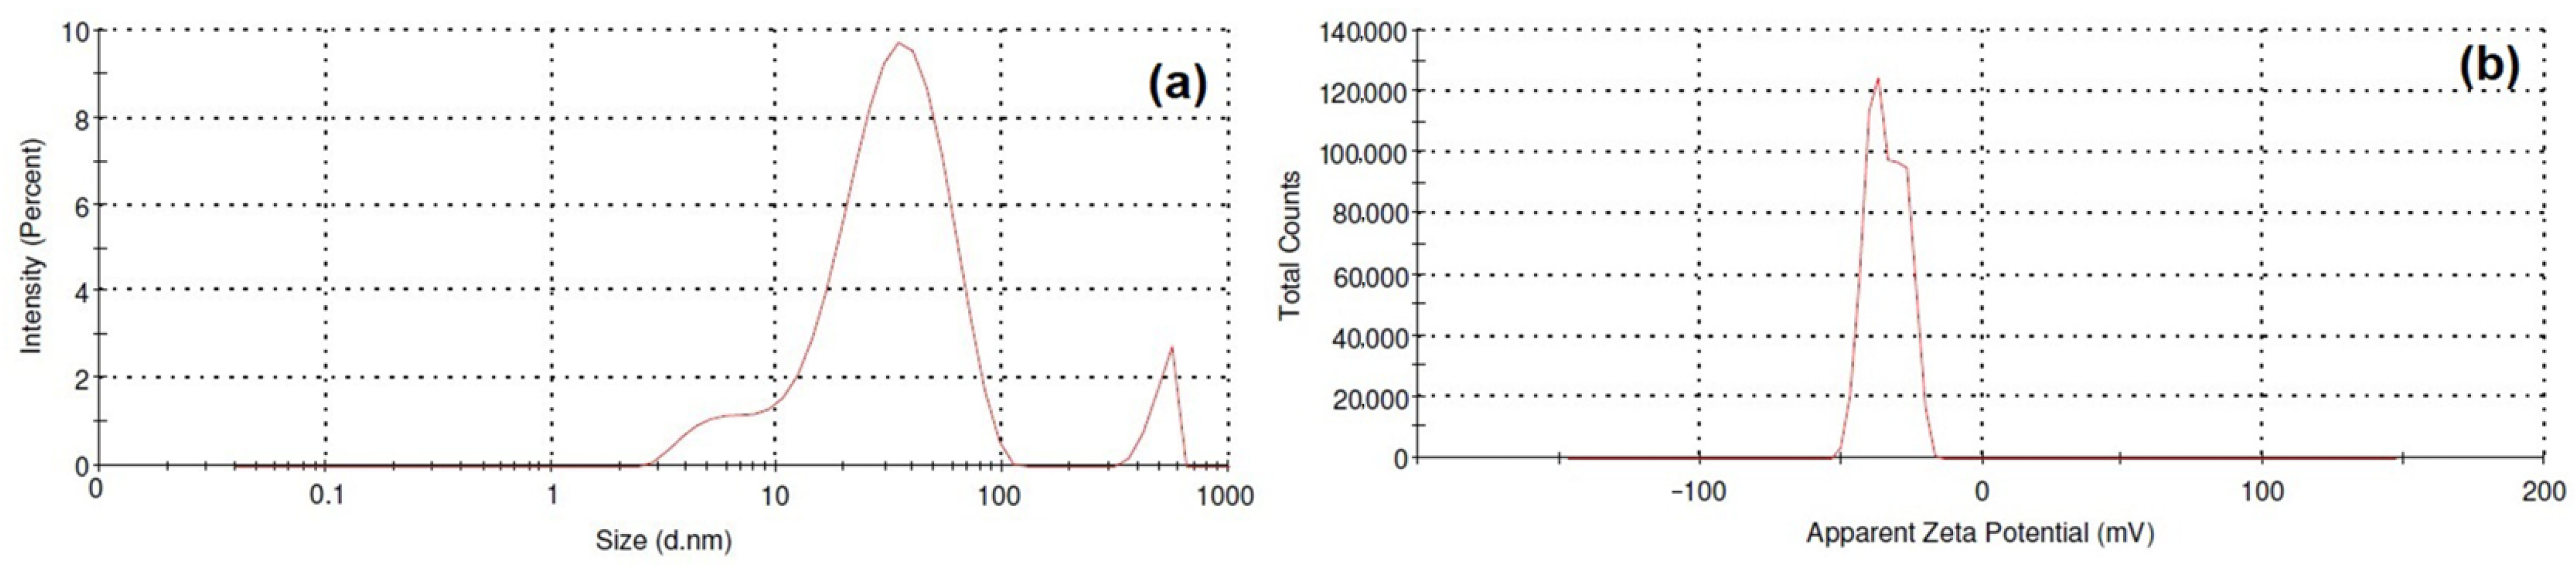
3.6. PS, PDI and ZP
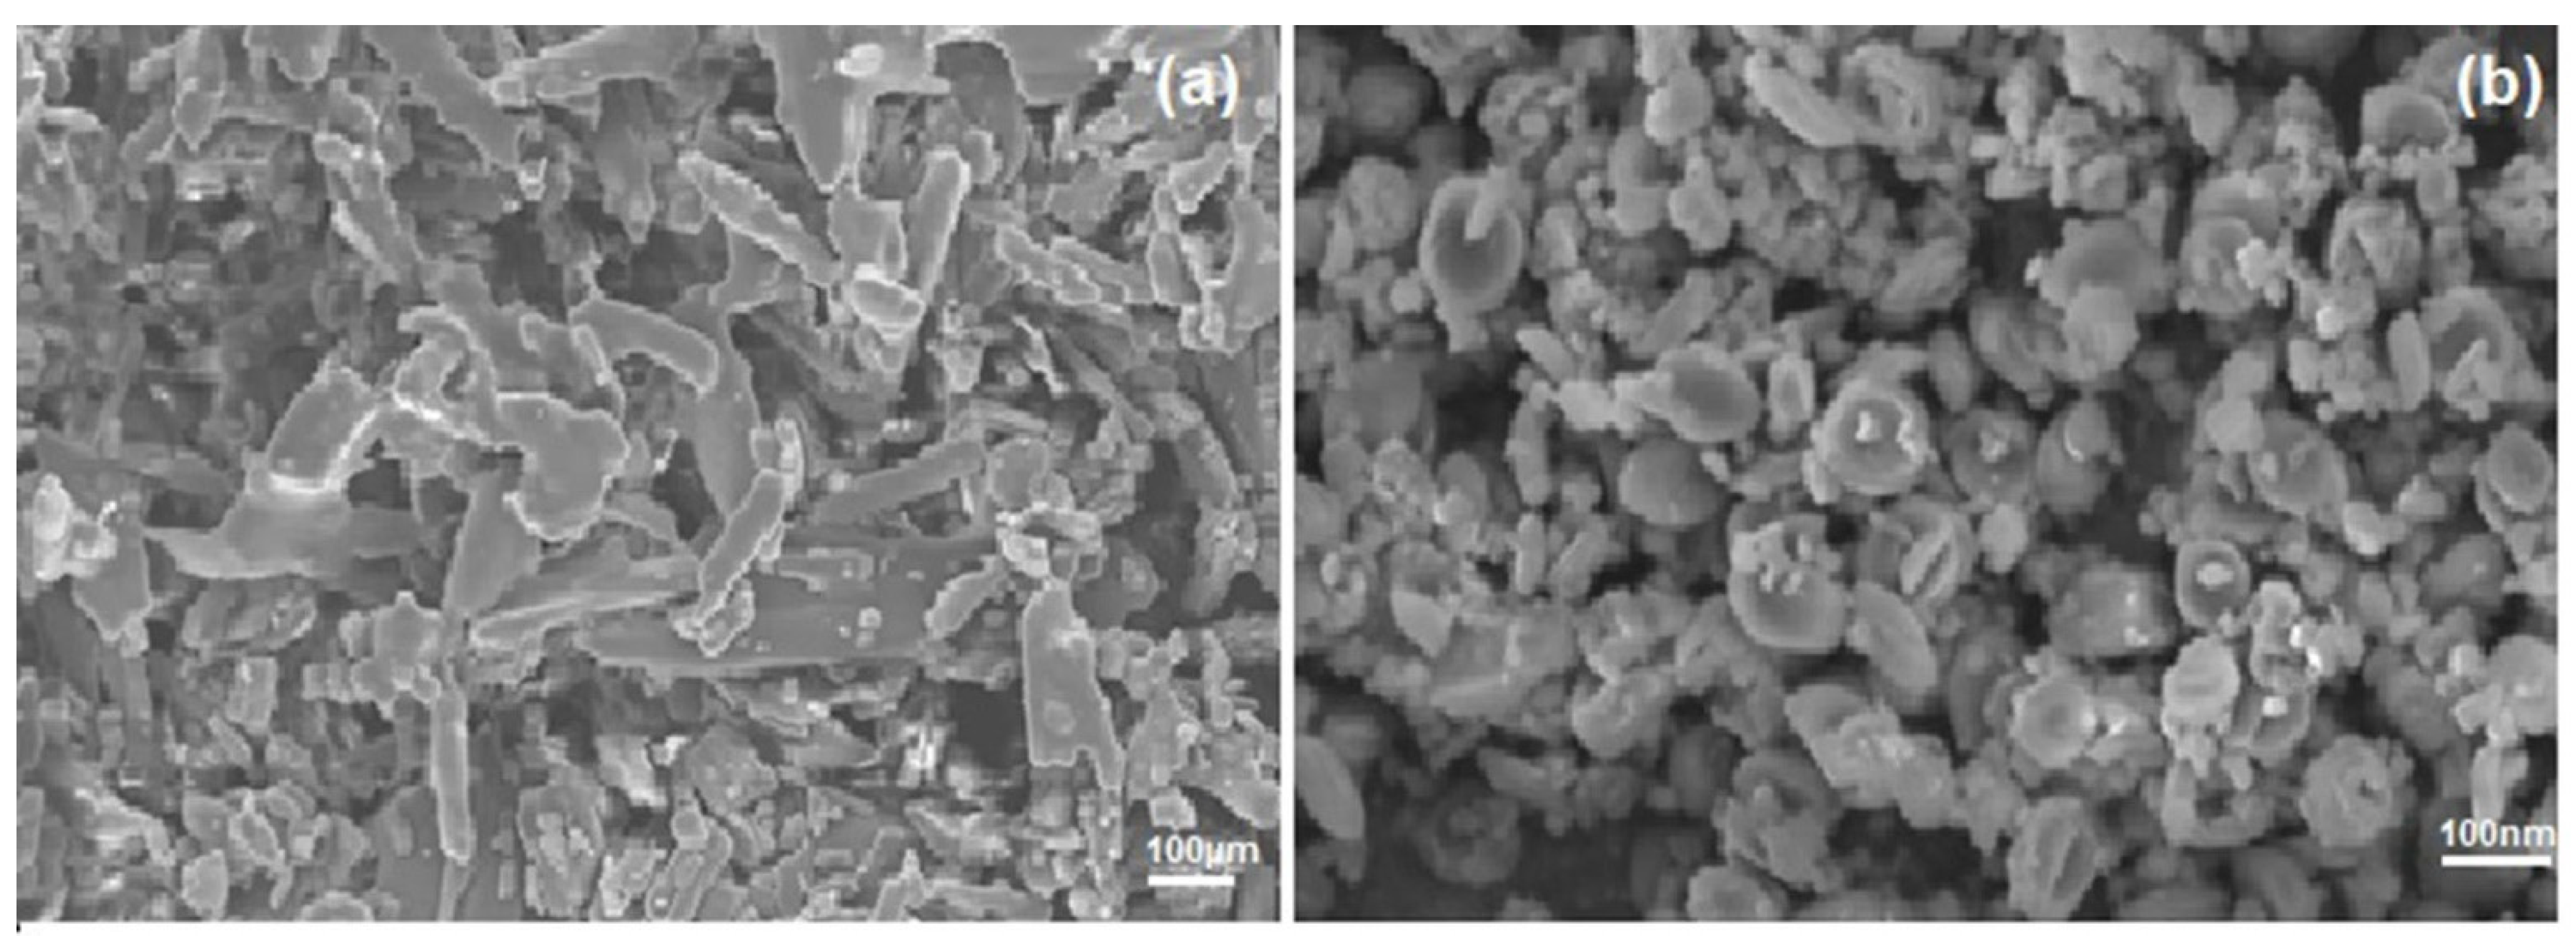
3.7. SEM
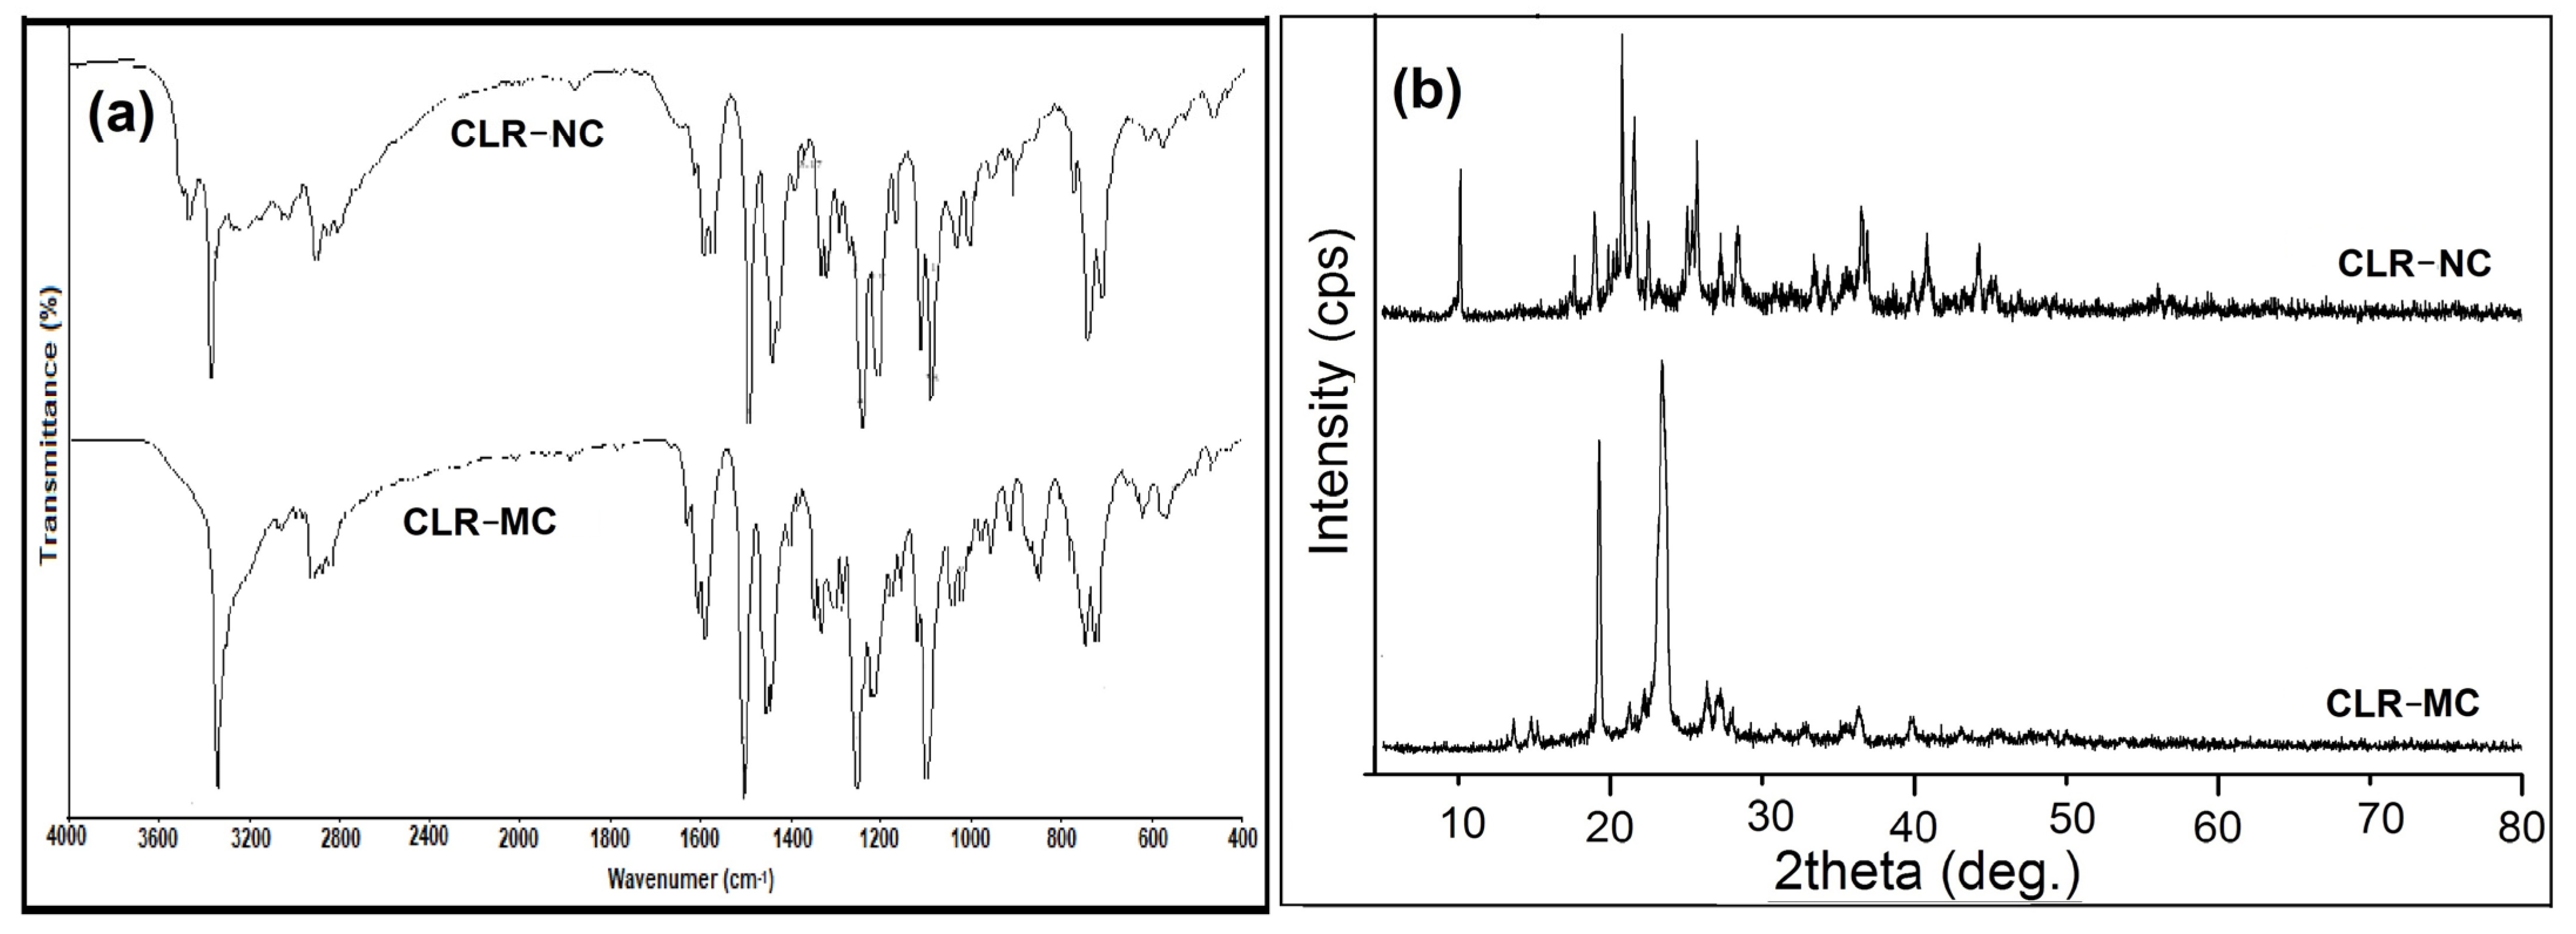
3.8. FT-IR
3.9. XRD
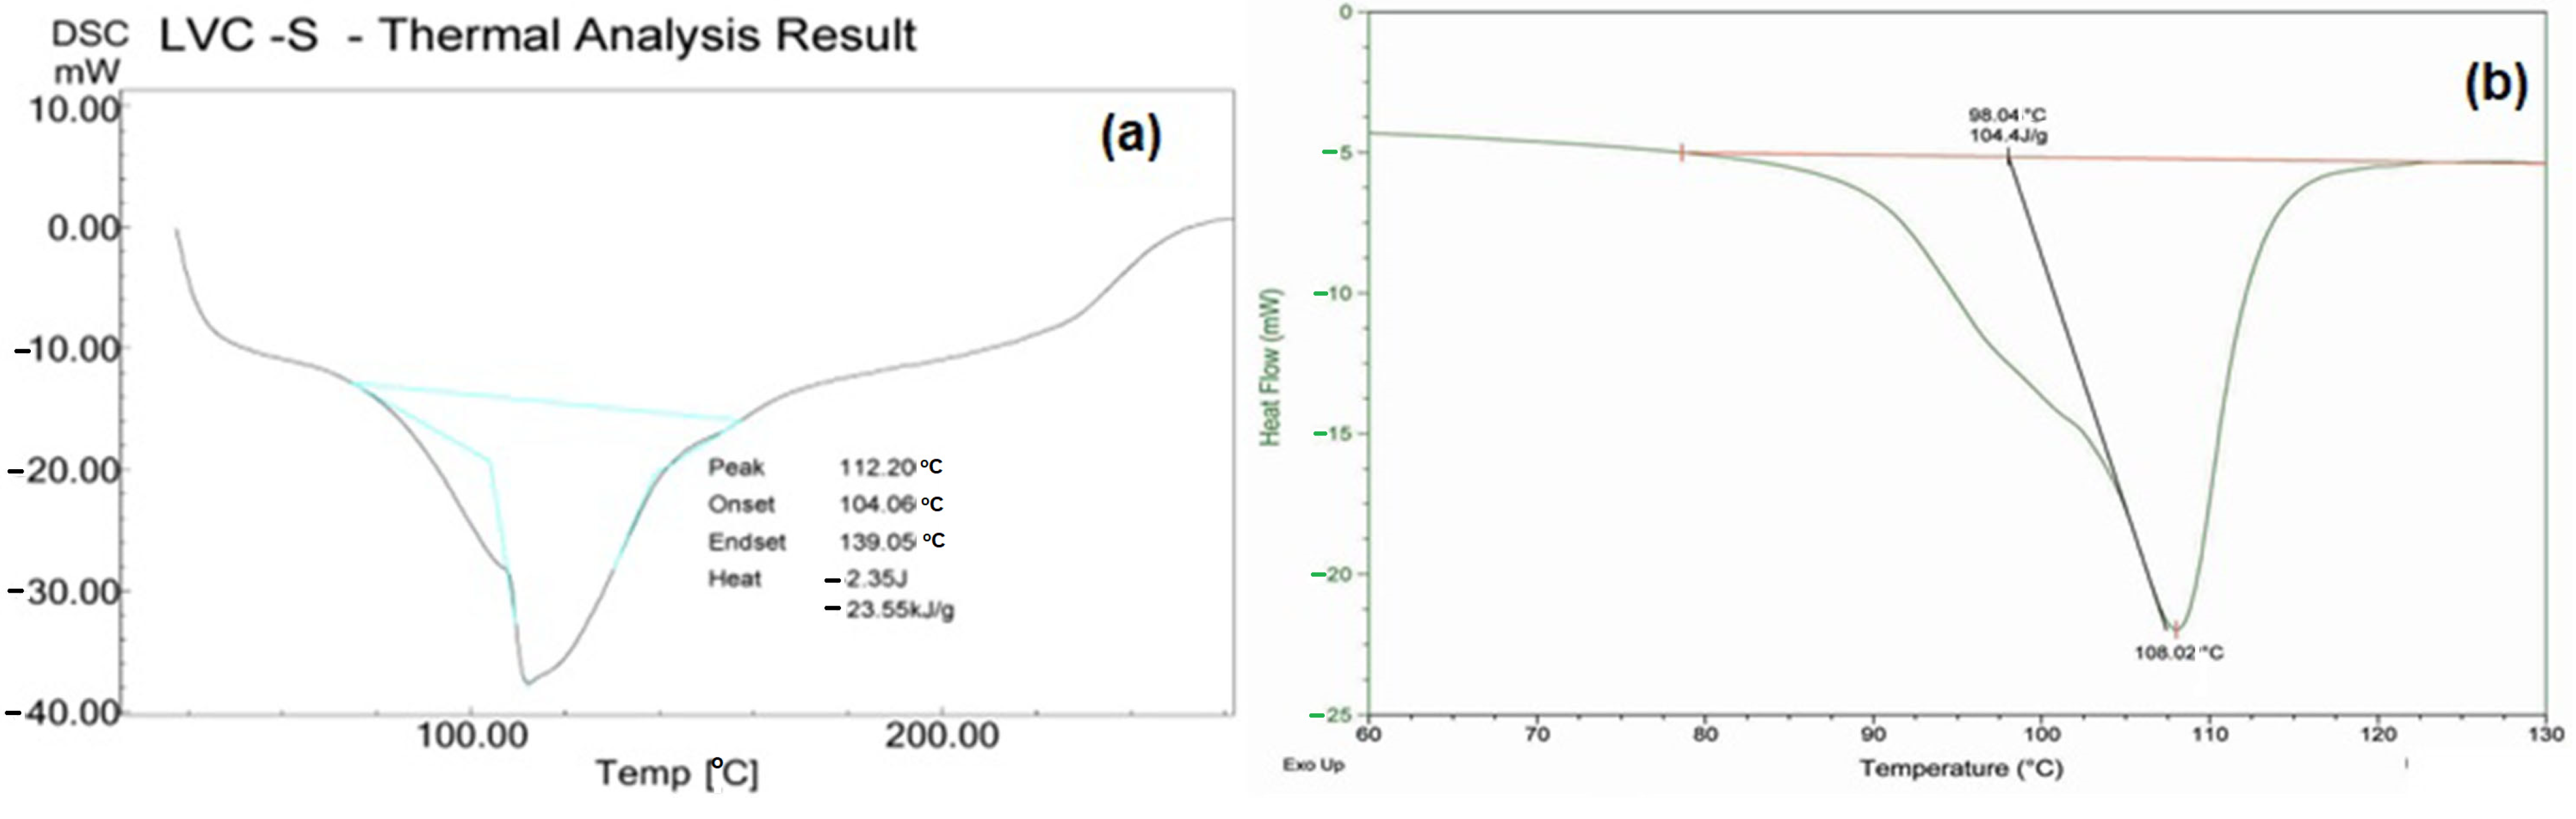
3.10. DSC
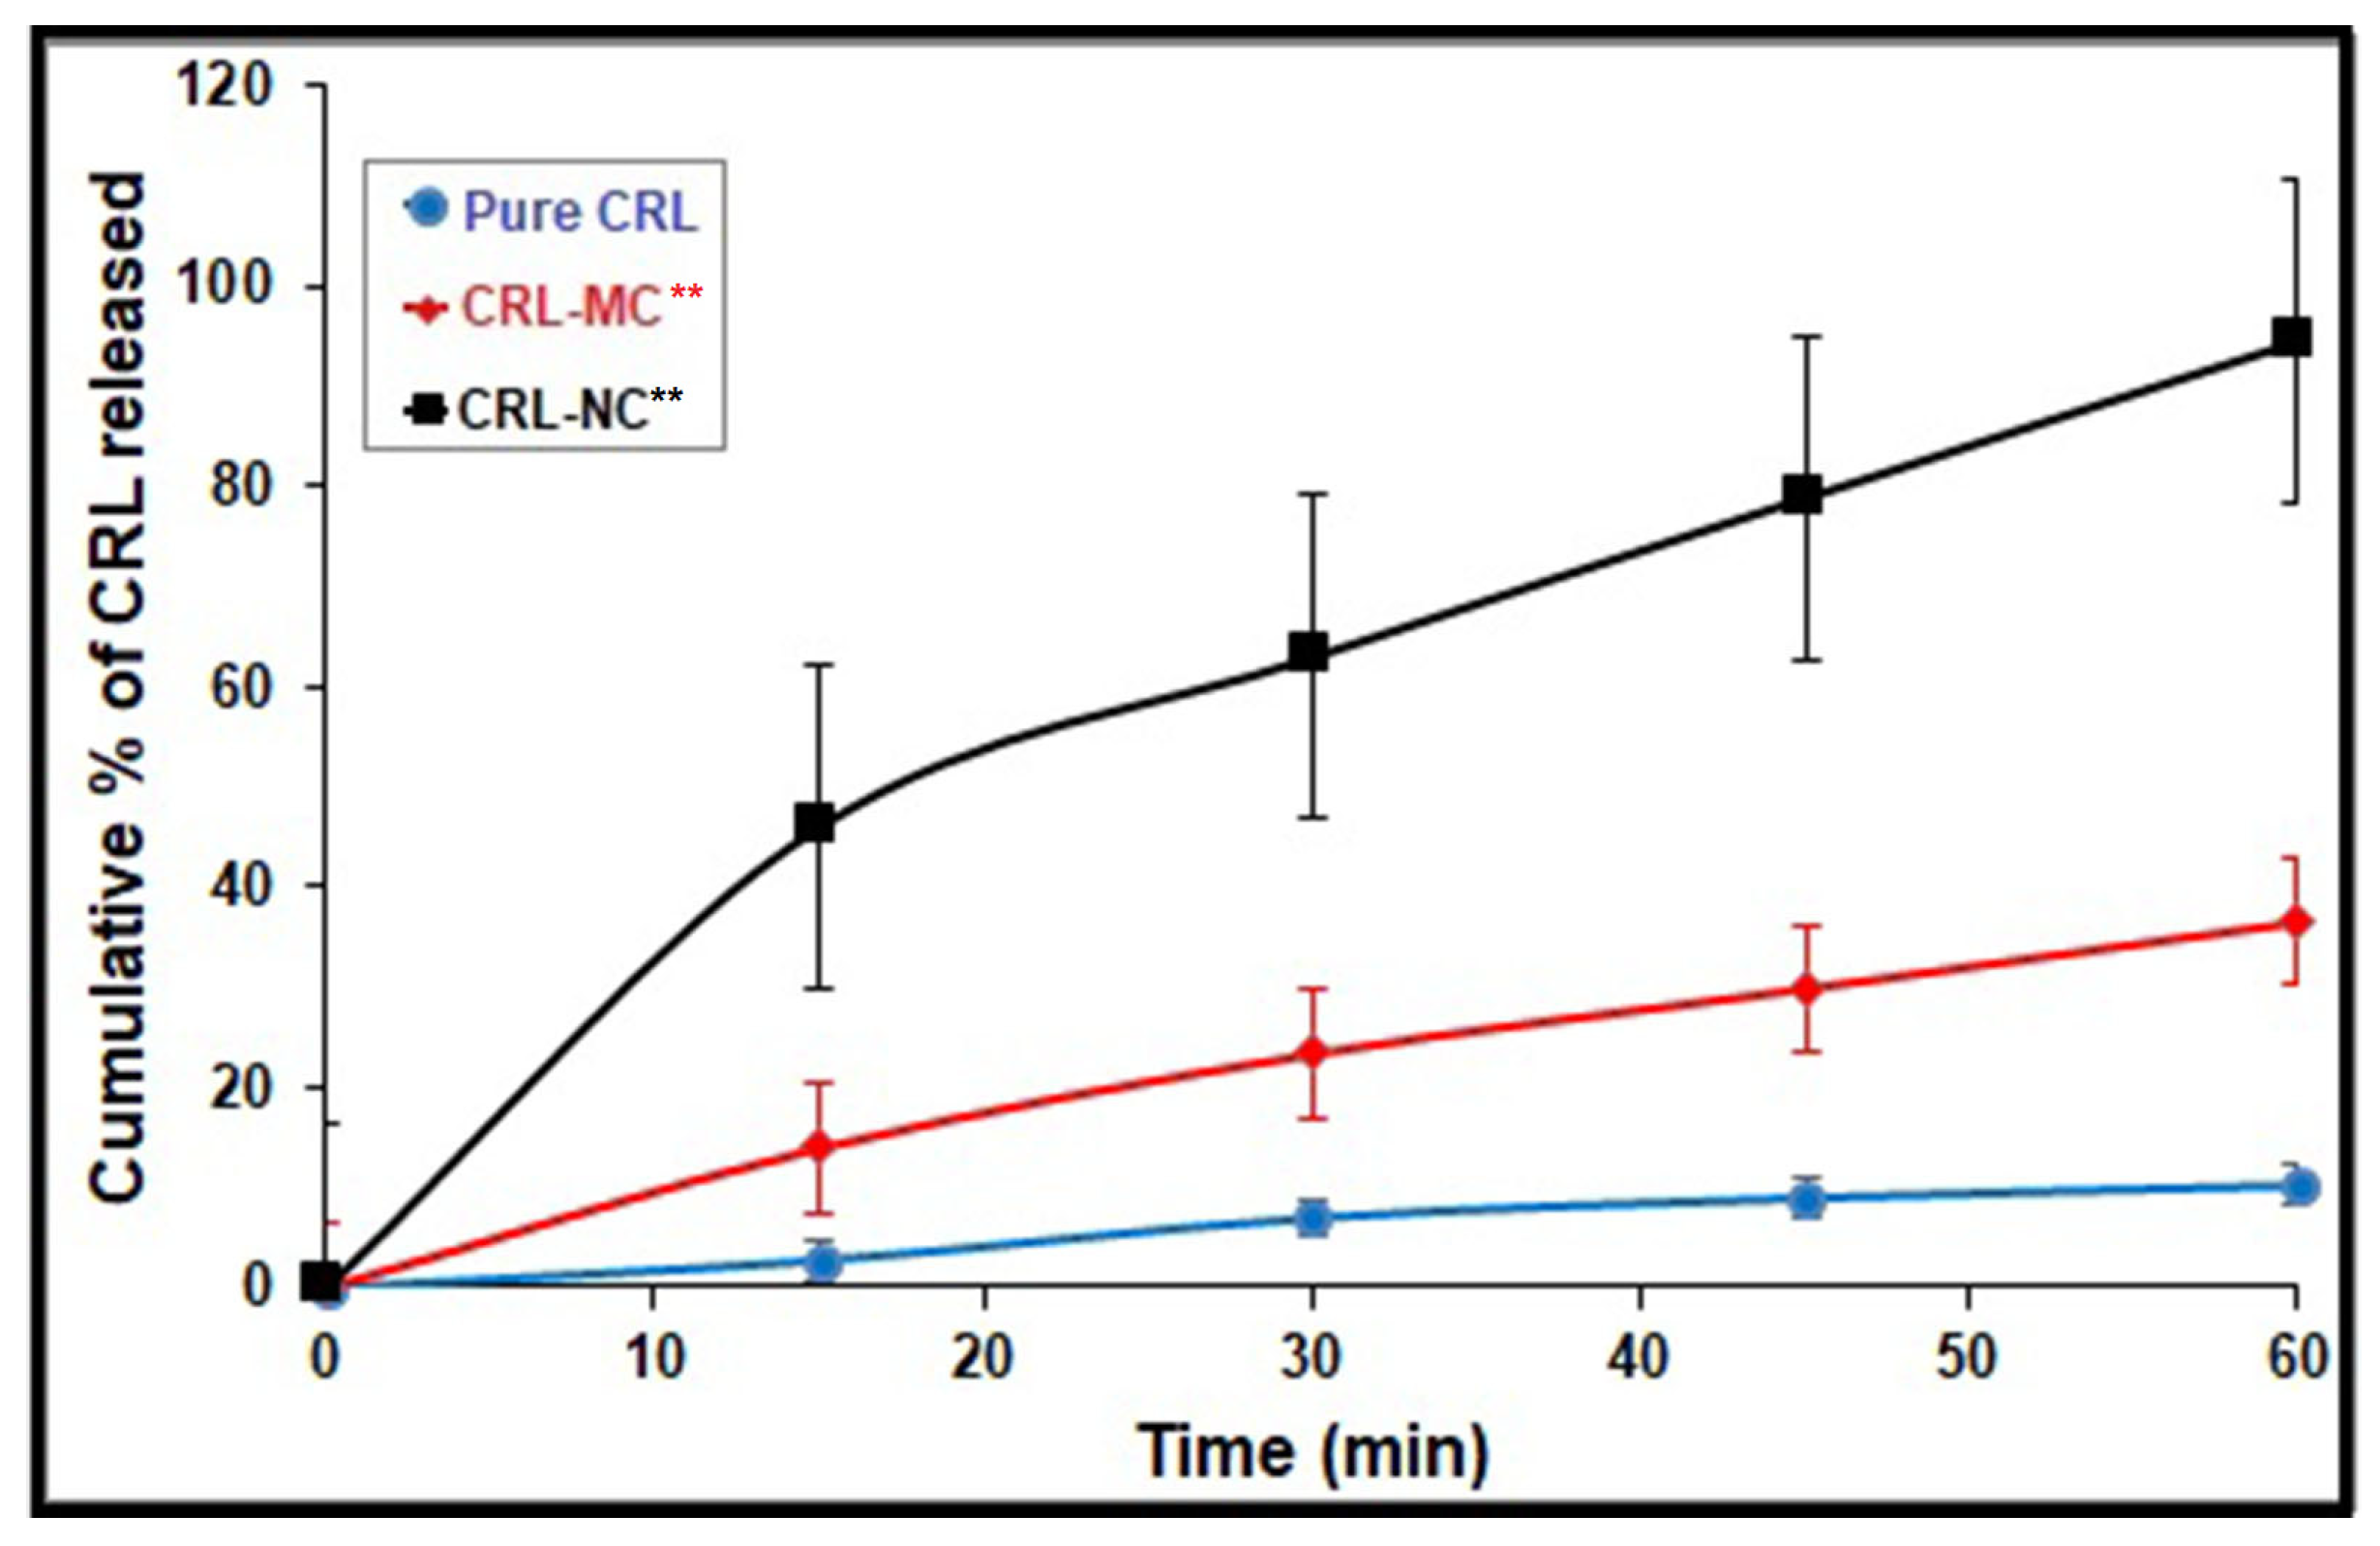
3.11. In Vitro Dissolution Study
3.12. Stability Studies
4. Conclusions
Author Contributions
Funding
Institutional Review Board Statement
Informed Consent Statement
Data Availability Statement
Acknowledgments
Conflicts of Interest
References
- Ali, M.A.; Kataoka, N.; Ranneh, A.H.; Iwao, Y.; Noguchi, S.; Oka, T.; Itai, S. Enhancing the Solubility and Oral Bioavailability of Poorly Water-Soluble Drugs Using Monoolein Cubosomes. Chem. Pharm. Bull. 2017, 65, 42–48. [Google Scholar] [CrossRef] [PubMed] [Green Version]
- Zhang, Q.W.; Lin, L.G.; Ye, W.C. Techniques for extraction and isolation of natural products: A comprehensive review. Chin. Med. 2018, 13, 20. [Google Scholar] [CrossRef] [PubMed] [Green Version]
- Sun, J.; Wang, F.; Sui, Y.; She, Z.; Zhai, W.; Wang, C.; Deng, Y. Effect of particle size on solubility, dissolution rate, and oral bioavailability: Evaluation using coenzyme Q₁₀ as naked nanocrystals. Int. J. Nanomed. 2012, 7, 5733–5744. [Google Scholar] [PubMed] [Green Version]
- Jacob, S.; Nair, A.B.; Shah, J. Emerging role of nanosuspensions in drug delivery systems. Biomater. Res. 2020, 24, 3. [Google Scholar] [CrossRef] [Green Version]
- Ashok, K.J.; Ramkanth, S.; Lakshmana, P.S.; Gopal, V. Enhancement of Saturation Solubility and In Vitro Dissolution of Carvedilol Nanoparticles by High Pressure Homogenization Technique. Int. J. Curr. Pharm. Rev. Res. 2015, 6, 269–273. [Google Scholar]
- Tofail, S.A.M.; Koumoulos, E.P.; Bandyopadhyay, A.; Bose, S.; O’Donoghue, L.; Charitidis, C. Additive manufacturing: Scientific and technological challenges, market uptake and opportunities. Mater. Today 2018, 21, 22–37. [Google Scholar] [CrossRef]
- Li, J.; Wang, Z.; Zhang, H.; Gao, J.; Zheng, A. Progress in the development of stabilization strategies for nanocrystal preparations. Drug Deliv. 2021, 28, 19–36. [Google Scholar] [CrossRef]
- Higuchi, T.; Connors, K.A. Phase solubility techniques. Adv. Anal. Chem. Instrum. 1965, 4, 117–212. [Google Scholar]
- Balasubramaniyan, S.; Irfan, N.; Umamaheswari, A.; Puratchikody, A. Design and virtual screening of novel fluoroquinolone analogs as effective mutant DNA GyrA inhibitors against urinary tract infection causing fluoroquinolone resistant Escherichia coli. RSC Adv. 2018, 8, 23629–23647. [Google Scholar] [CrossRef] [Green Version]
- Mohamed, J.M.M.; Mahajan, N.; El-Sherbiny, M.; Khan, S.; Al-Serwi, R.H.; Attia, M.A.; Altriny, Q.A.; Arbab, A.H. Ameliorated Stomach Specific Floating Microspheres for Emerging Health Pathologies Using Polymeric Konjac Glucomannan-Based Domperidone. BioMed Res. Int. 2022, 2022, 1–12. [Google Scholar] [CrossRef]
- Lefroy, K.S.; Murray, B.S.; Ries, M.E. Advances in the use of microgels as emulsion stabilisers and as a strategy for cellulose functionalisation. Cellulose 2021, 28, 647–670. [Google Scholar] [CrossRef]
- Mohamed, J.M.; Alqahtani, A.; Ahmad, F.; Krishnaraju, V.; Kalpana, K. Pectin co-functionalized dual layered solid lipid nanoparticle made by soluble curcumin for the targeted potential treatment of colorectal cancer. Carbohydr. Polym. 2020, 252, 117180. [Google Scholar] [CrossRef] [PubMed]
- Teeranachaideekul, V.; Junyaprasert, V.B.; Souto, E.B.; Müller, R.H. Development of ascorbyl palmitate NCs applying the nanosuspension technology. Int. J. Pharm. 2008, 354, 227–234. [Google Scholar] [CrossRef] [PubMed]
- Mohamed, J.M.; Alqahtani, A.; Ahmad, F.; Krishnaraju, V.; Kalpana, K. Stoichiometrically governed curcumin solid dispersion and its cytotoxic evaluation on colorectal adenocarcinoma cells. Drug Des. Deliv. Ther. 2020, 14, 4639–4658. [Google Scholar] [CrossRef]
- Potluri, R.H.K.; Bandari, S.; Jukanti, R.; Veerareddy, P.R. Solubility enhancement and physicochemical characterization of carvedilol solid dispersion with Gelucire 50/13. Arch. Pharm. Res. 2011, 34, 51–57. [Google Scholar] [CrossRef]
- Bathool, A.; Vishakante, G.D.; Khan, M.S.; Shivakumar, H.G. Development and characterization of atorvastatin calcium loaded chitosan nanoparticles for sustain drug delivery. Adv. Mater. Lett. 2012, 3, 466–470. [Google Scholar] [CrossRef]
- Moideen, J.M.M.; Alqahtani, A.; Venkatesan, K.; Ahmad, F.; Krisharaju, K.; Gayasuddin, M.; Shaik, R.A. Application of the Box-Behnken design for the production of soluble curcumin: Skimmed milk powder inclusion complex for improving the treatment of colorectal cancer. Food Sci. Nutr. 2020, 8, 6643–6659. [Google Scholar] [CrossRef]
- Muthu, M.J.; Kavitha, K.; Chitra, K.S.; Nandhineeswari, S. Soluble curcumin prepared by solid dispersion using four different carriers: Phase solubility, molecular modelling and physicochemical characterization. Trop. J. Pharm. Res. 2019, 18, 1581–1588. [Google Scholar]
- Mohamed, J.M.M.; Alqahtani, A.; Kumar, T.V.A.; Fatease, A.A.; Alqahtani, T.; Krishnaraju, V.; Ahmad, F.; Menaa, F.; Alamri, A.; Muthumani, R.; et al. Superfast synthesis of stabilized silver nanoparticles using aqueous allium sativum (garlic) extract and isoniazid hydrazide conjugates: Molecular docking and in-vitro characterizations. Molecules 2022, 27, 110. [Google Scholar] [CrossRef]
- Bergström, C.A.S.; Strafford, M.; Lazorova, L.; Avdeef, A.; Luthman, A.K.; Artursson, P. Absorption classification of oral drugs based on molecular surface properties. Med. Chem. 2003, 46, 558–570. [Google Scholar] [CrossRef]
- Mohamed, J.M.; Ahmad, F.; Kishore, N.; Al-Subaie, A.M. Soluble 1: 1 stoichiometry curcumin binary complex for potential apoptosis in human colorectal adenocarcinoma cells (SW480 and Caco-2 cells). Res. J. Pharm. Technol. 2021, 14, 129–135. [Google Scholar]
- Mohamed, J.M.M.; Ahmad, F.; Alqahtani, A.; Alqahtani, T.; Krishnaraju, V.; Anusuya, M. Studies on preparation and evaluation of soluble 1:1 stoichiometric curcumin complex for colorectal cancer treatment. Trends Sci. 2021, 18, 1403. [Google Scholar] [CrossRef]
- Goshain, O.; Ahmed, B. Antihypertensive activity, toxicity and molecular docking study of newly synthesized xanthan derivatives (xanthonoxypropanolamine). PLoS ONE 2019, 14, e0220920. [Google Scholar] [CrossRef] [PubMed] [Green Version]
- Avula, P.R.; Asdaq, S.M.; Asad, M. Effect of aged garlic extract and s-allyl cysteine and their interaction with atenolol during isoproterenol induced myocardial toxicity in rats. Indian J. Pharmacol. 2014, 46, 94–99. [Google Scholar]
- Mohamed, J.M.M.; Alqahtani, A.; Khan, B.A.; Fatease, A.; Alqahtani, T.; Venkatesan, K.; Ahmad, F.; Alzghoul, B.I.; Alamri, A. Preparation of soluble complex of curcumin for the potential antagonistic effects on human colorectal adenocarcinoma cells. Pharmaceuticals 2021, 4, 939. [Google Scholar] [CrossRef]
- Mohamed, J.M.M.; Alqahtani, A.; Fatease, A.; Alqahtani, T.; Khan, B.A.; Asmitha, B.; Vijaya, R. Human hair keratin composite scaffold: Characterisation and biocompatibility study on nih 3t3 fibroblast cells. Pharmaceuticals 2021, 14, 781. [Google Scholar] [CrossRef]
- Mohamed, J.M.; Bharathidasan, P.; Raffick, M.M. Preformulation and development of curcumin magnetic nanosuspension using magnetite (Fe3O4) and methyl cellulose. Int. J. Pharma Bio Sci. 2012, 3, 419–432. [Google Scholar]
- Senthilvel, C.K.; Karupiayan, K.; Moideen, M.M.J. Development of capsules filled with phenytoin and berberine loaded nanoparticles- A new approach to improve consultant therapy. Indian J. Pharm. Educ. Res. 2019, 53, 468–479. [Google Scholar] [CrossRef] [Green Version]
- Tozuka, Y.; Ito, A.; Seki, H.; Oguchi, T.; Yamamoto, K. Characterization and quantitation of clarithromycin polymorphs by powder X-ray diffractometry and solid-state NMR spectroscopy. Chem. Pharm. Bull. 2002, 50, 1128–1130. [Google Scholar] [CrossRef] [Green Version]
- Dolenc, A.; Kristl, J.; Baumgartner, S.; Planinšek, O. Advantages of celecoxib nanosuspension formulation and transformation into tablets. Int. J. Pharm. 2009, 376, 204–212. [Google Scholar] [CrossRef]
- Kumar, C.S.; Raja, M.D.; Sundar, D.S.; Antoniraj, M.G.; Ruckmani, K. Hyaluronic acid co-functionalized gold nanoparticle complex for the targeted delivery of metformin in the treatment of liver cancer (HepG2 cells). Carbohydr. Polym. 2015, 128, 63–74. [Google Scholar] [CrossRef] [PubMed]
- Phan, H.T.; Haes, A.J. What Does Nanoparticle Stability Mean? J. Phys. Chem. C Nanomater. Interfaces 2019, 123, 16495–16507. [Google Scholar] [CrossRef] [PubMed]


| Carriers | T (Kelvin) | Intercept (Mm) | K(1:1) (M−1) | ΔG (kJ/mol) | ΔH (kJ/mol) | ΔS (kJ/molK−1) |
|---|---|---|---|---|---|---|
| PVP | 210 | 3.66 × 10⁻⁴ | 0.05029 | 144.29 ± 6.67 | 13.9 ± 0.672 | 0.08891 ± 0.003 |
| 310 | 6.19 × 10⁻⁴ | 0.09928 | 176.17 ± 7.78 | |||
| SDS | 210 | 2.06 × 10⁻⁴ | 0.01989 | 102.31 ± 5.22 | 7.31 ± 0.776 | 0.06254 ± 0.007 |
| 310 | 2.21 × 10⁻⁴ | 0.02323 | 121.17 ± 7.31 |
| Batches | % Yield | Drug Content * (%) | % EE * | PS (µm) * | PS (nm) * | PDI * | Zeta Potential (mV) * |
|---|---|---|---|---|---|---|---|
| CLR-MCs | 79.6 ± 2.58 | 98.90 ± 4.32 | 84.12 ± 2.33 | 106.60 ± 3.27 | 1102.13 ± 8.22 | 0.206 ± 0.017 | −25.6 ± 3.19 |
| CLR-NCs | 78.7 ± 3.41 | 96.81 ± 3.64 | 83.61 ± 1.80 | 0.058 ± 0.074 | 58.29 ± 0.034 | 0.181 ± 0.012 | −27.2 ± 2.29 |
| Coefficient of Correlation (r2) | ||||||
|---|---|---|---|---|---|---|
| Preparations | Zero Order | First Order | Hixon Crowell | Higuchi | Korsmeyer-Peppas | Release Exponent (n) |
| Pure CRL | 0.9834 ± 0.62 | 0.7356 ± 0.78 | 0.8891 ± 0.33 | 0.9678 ± 0.46 | 0.8891 ± 0.21 | 0.441 ± 0.47 |
| CRL-MCs | 0.9769 ± 0.32 ** | 0.7589 ± 0.41 * | 0.8849 ± 0.87 * | 0.9897 ± 0.54 ** | 0.8793 ± 0.58 * | 0.417 ± 0.36 ** |
| CRL-NCs | 0.9866 ± 0.98 ** | 0.7892 ± 0.54 | 0.9471 ± 0.62 | 0.9759 ± 0.77 ** | 0.9359 ± 0.22 | 0.466 ± 0.35 ** |
| Evaluations | 0 Month | 1 Month | 3 Month | 6 Month |
|---|---|---|---|---|
| Drug content * | 98.90 ± 0.32 | 97.94 ± 1.43 | 96.11 ± 1.57 | 93.65 ± 2.45 * |
| PS * (nm) | 58.29 ± 0.034 | 60.78 ± 0.22 | 62.78 ± 1.19 | 68.39 ± 3.88 |
| PDI * | 0.181 ± 0.012 | 0.235 ± 0.045 | 0.241 ± 0.02 | 0.334 ± 0.091 |
| ZP * (mV) | −27.2 ± 2.29 | −24.1 ± 3.12 | −22.4 ± 4.41 | −19.2 ± 4.66 |
| EE (%) * | 83.61 ± 1.80 | 80.12 ± 1.22 | 79.35 ± 2.81 | 76.40 ± 4.74 ** |
| In vitro release (after 60 min) * | 94.56 ± 3.27 | 92.22 ± 4.16 | 89.33 ± 5.28 | 85.71 ± 5.53 ** |
Publisher’s Note: MDPI stays neutral with regard to jurisdictional claims in published maps and institutional affiliations. |
© 2022 by the authors. Licensee MDPI, Basel, Switzerland. This article is an open access article distributed under the terms and conditions of the Creative Commons Attribution (CC BY) license (https://creativecommons.org/licenses/by/4.0/).
Share and Cite
Mohamed, J.M.M.; Alqahtani, A.; Menaa, F.; Kayarohanam, S.; Fatease, A.A.; Alqahtani, T.; Alamri, A.; El-Sherbiny, M.; Ramkanth, S.; Janakiraman, A.K. In Vitro Physical Characterizations and Docking Studies on Carvedilol Nanocrystals. Crystals 2022, 12, 988. https://0-doi-org.brum.beds.ac.uk/10.3390/cryst12070988
Mohamed JMM, Alqahtani A, Menaa F, Kayarohanam S, Fatease AA, Alqahtani T, Alamri A, El-Sherbiny M, Ramkanth S, Janakiraman AK. In Vitro Physical Characterizations and Docking Studies on Carvedilol Nanocrystals. Crystals. 2022; 12(7):988. https://0-doi-org.brum.beds.ac.uk/10.3390/cryst12070988
Chicago/Turabian StyleMohamed, Jamal Moideen Muthu, Ali Alqahtani, Farid Menaa, Saminathan Kayarohanam, Adel Al Fatease, Taha Alqahtani, Ali Alamri, Mohamed El-Sherbiny, Sundarapandian Ramkanth, and Ashok Kumar Janakiraman. 2022. "In Vitro Physical Characterizations and Docking Studies on Carvedilol Nanocrystals" Crystals 12, no. 7: 988. https://0-doi-org.brum.beds.ac.uk/10.3390/cryst12070988