Article

Nanomechanical Characterization of Enzyme Induced Carbonate Precipitates

by
Vinay Krishnan
1,*,
Hamed Khodadadi Tirkolaei
1,
Maryam Kazembeyki
2,
Leon A. van Paassen
1,
Christian G. Hoover
1,
Jong Seto
3,4 and
Edward Kavazanjian, Jr.
1
1
School of Sustainable Engineering and the Built Environment, Arizona State University, Tempe, AZ 85281, USA
2
Department of Mechanical Engineering, Stanford University, Stanford, CA 94305, USA
3
School for Engineering of Matter, Transport, and Energy, Arizona State University, Tempe, AZ 85281, USA
4
Molecular Foundry, Lawrence Berkeley National Laboratory, Berkeley, CA 94720, USA
*
Author to whom correspondence should be addressed.
Submission received: 12 June 2022 / Revised: 12 July 2022 / Accepted: 14 July 2022 / Published: 17 July 2022

Abstract

:
The mechanical properties of calcium carbonate minerals formed by enzyme-induced carbonate precipitation (EICP) were studied using nanoindentation. Two types of precipitates were considered: (i) a “baseline” precipitate, synthesized via urea hydrolysis in an aqueous solution of urease enzyme, urea, and calcium chloride; and (ii) a “modified” precipitate, synthesized from a similar solution, but with the inclusion of nonfat dry milk. While both precipitates predominantly comprised calcite, X-ray diffraction and Raman spectroscopy indicated broader peaks in the modified precipitate, implying differences in the crystal structure of the two precipitates. Both precipitates were polycrystalline and had a higher average indentation hardness (H) and a lower indentation modulus (M) compared with the values for single calcite crystals reported in the literature. The ductility of the precipitates was quantified by the ratio M/H. The modified precipitate had a higher average M/H, implying greater ductility. The increased ductility of the modified precipitate results in higher resistance to crack propagation. In sands biocemented using the modified EICP solution, the increased ductility of the precipitate, in addition to preferential precipitation at interparticle contacts, may contribute to relatively high unconfined compressive strengths at low carbonate contents.

Graphical Abstract

1. Introduction

Enzyme-induced carbonate precipitation (EICP) is a biochemical process used for soil stabilization that involves the addition of a solution comprising urea, calcium chloride, and urease enzyme to granular soil. The urease catalyzes the hydrolysis of urea, which increases the alkalinity of the reaction solution by production of dissolved inorganic carbon and ammonium. Sufficient alkalinity production, in the presence of dissolved calcium (Ca2+) cations, will lead to precipitation of CaCO3. The precipitated CaCO3 can improve the strength and stiffness of the soil by binding the particles together. There has been a growing interest in EICP over the past two decades, mainly in the context of development of new ground improvement technologies that draw inspiration from naturally occurring biomineralization processes.
The use of nonfat dry milk in EICP solution was first reported by Nemati and Voordouw [1] and subsequently employed as an enzyme stabilizer (i.e., an agent that delays the denaturation of the urease) by several researchers [2,3,4]. More recent studies [5,6] have shown that the unconfined compressive strength (UCS) of a sand treated by EICP can be significantly enhanced, often by up to an order of magnitude, by the addition of a relatively small concentration of nonfat dry milk to the treatment solution. This finding is significant because in order to be commercially viable as a ground improvement technique, EICP treatment of soil should result in relatively high strengths at low carbonate contents. Almajed et al., [5] treated specimens of Ottawa 20–30 silica sand using both a baseline EICP solution (i.e., without nonfat dry milk) and a modified EICP solution (i.e., with nonfat dry milk). Except for the concentration of nonfat dry milk, the composition of the baseline and modified EICP solutions were identical. These investigators reported an order of magnitude increase in UCS for Ottawa 20–30 sand specimens treated with the modified solution compared with specimens treated with the baseline solution, from an average of 138 kPa to an average of 1.75 MPa. Using scanning electron microscopy (SEM), Almajed et al., [5] showed that the modified EICP treatment resulted in the precipitation of larger calcite polycrystals (compared with the baseline EICP treatment) at the interparticle contacts. Almajed et al., [5] concluded that the increased UCS of the biocemented sand following the modified EICP treatment was due to the increased amount of precipitate at the interparticle contacts. Martin et al., [6] concurred with this conclusion after evaluating the UCS of four different granular materials treated with the same baseline and modified EICP solutions as Almajed et al., [5].
The CaCO3 precipitated during EICP treatment (both baseline and modified) is usually composed of polycrystalline particles of calcite and/or vaterite. In general, biopolymers in milk (comprising proteins such as casein and whey) may be adsorbed to the surface of these particles or may be occluded within the crystals. Martin et al., [6] submerged glass slides in beakers containing baseline and modified EICP solutions and qualitatively evaluated the adhesion of the precipitate to the glass slides. This evaluation showed that the adhesion between precipitate from the modified EICP solution and the glass slide was stronger compared with the adhesion between precipitate from the baseline EICP solution and the glass slide. These observations suggest that the modified EICP treatment may result in the precipitation of a composite of CaCO3 and milk biopolymers that may have different properties compared with the precipitate from the baseline EICP treatment. In this paper, we explore this phenomenon in greater detail by investigating the following research questions:
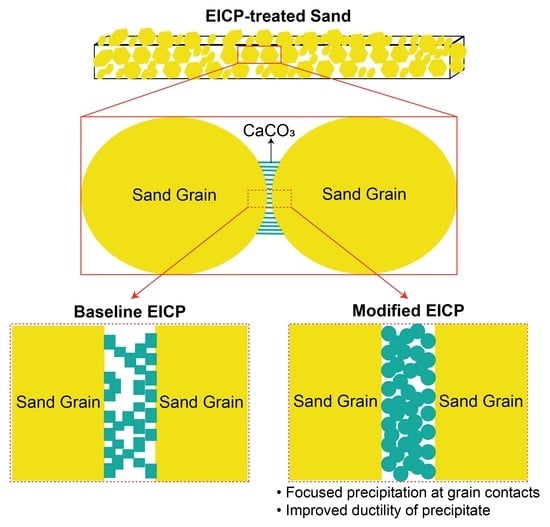
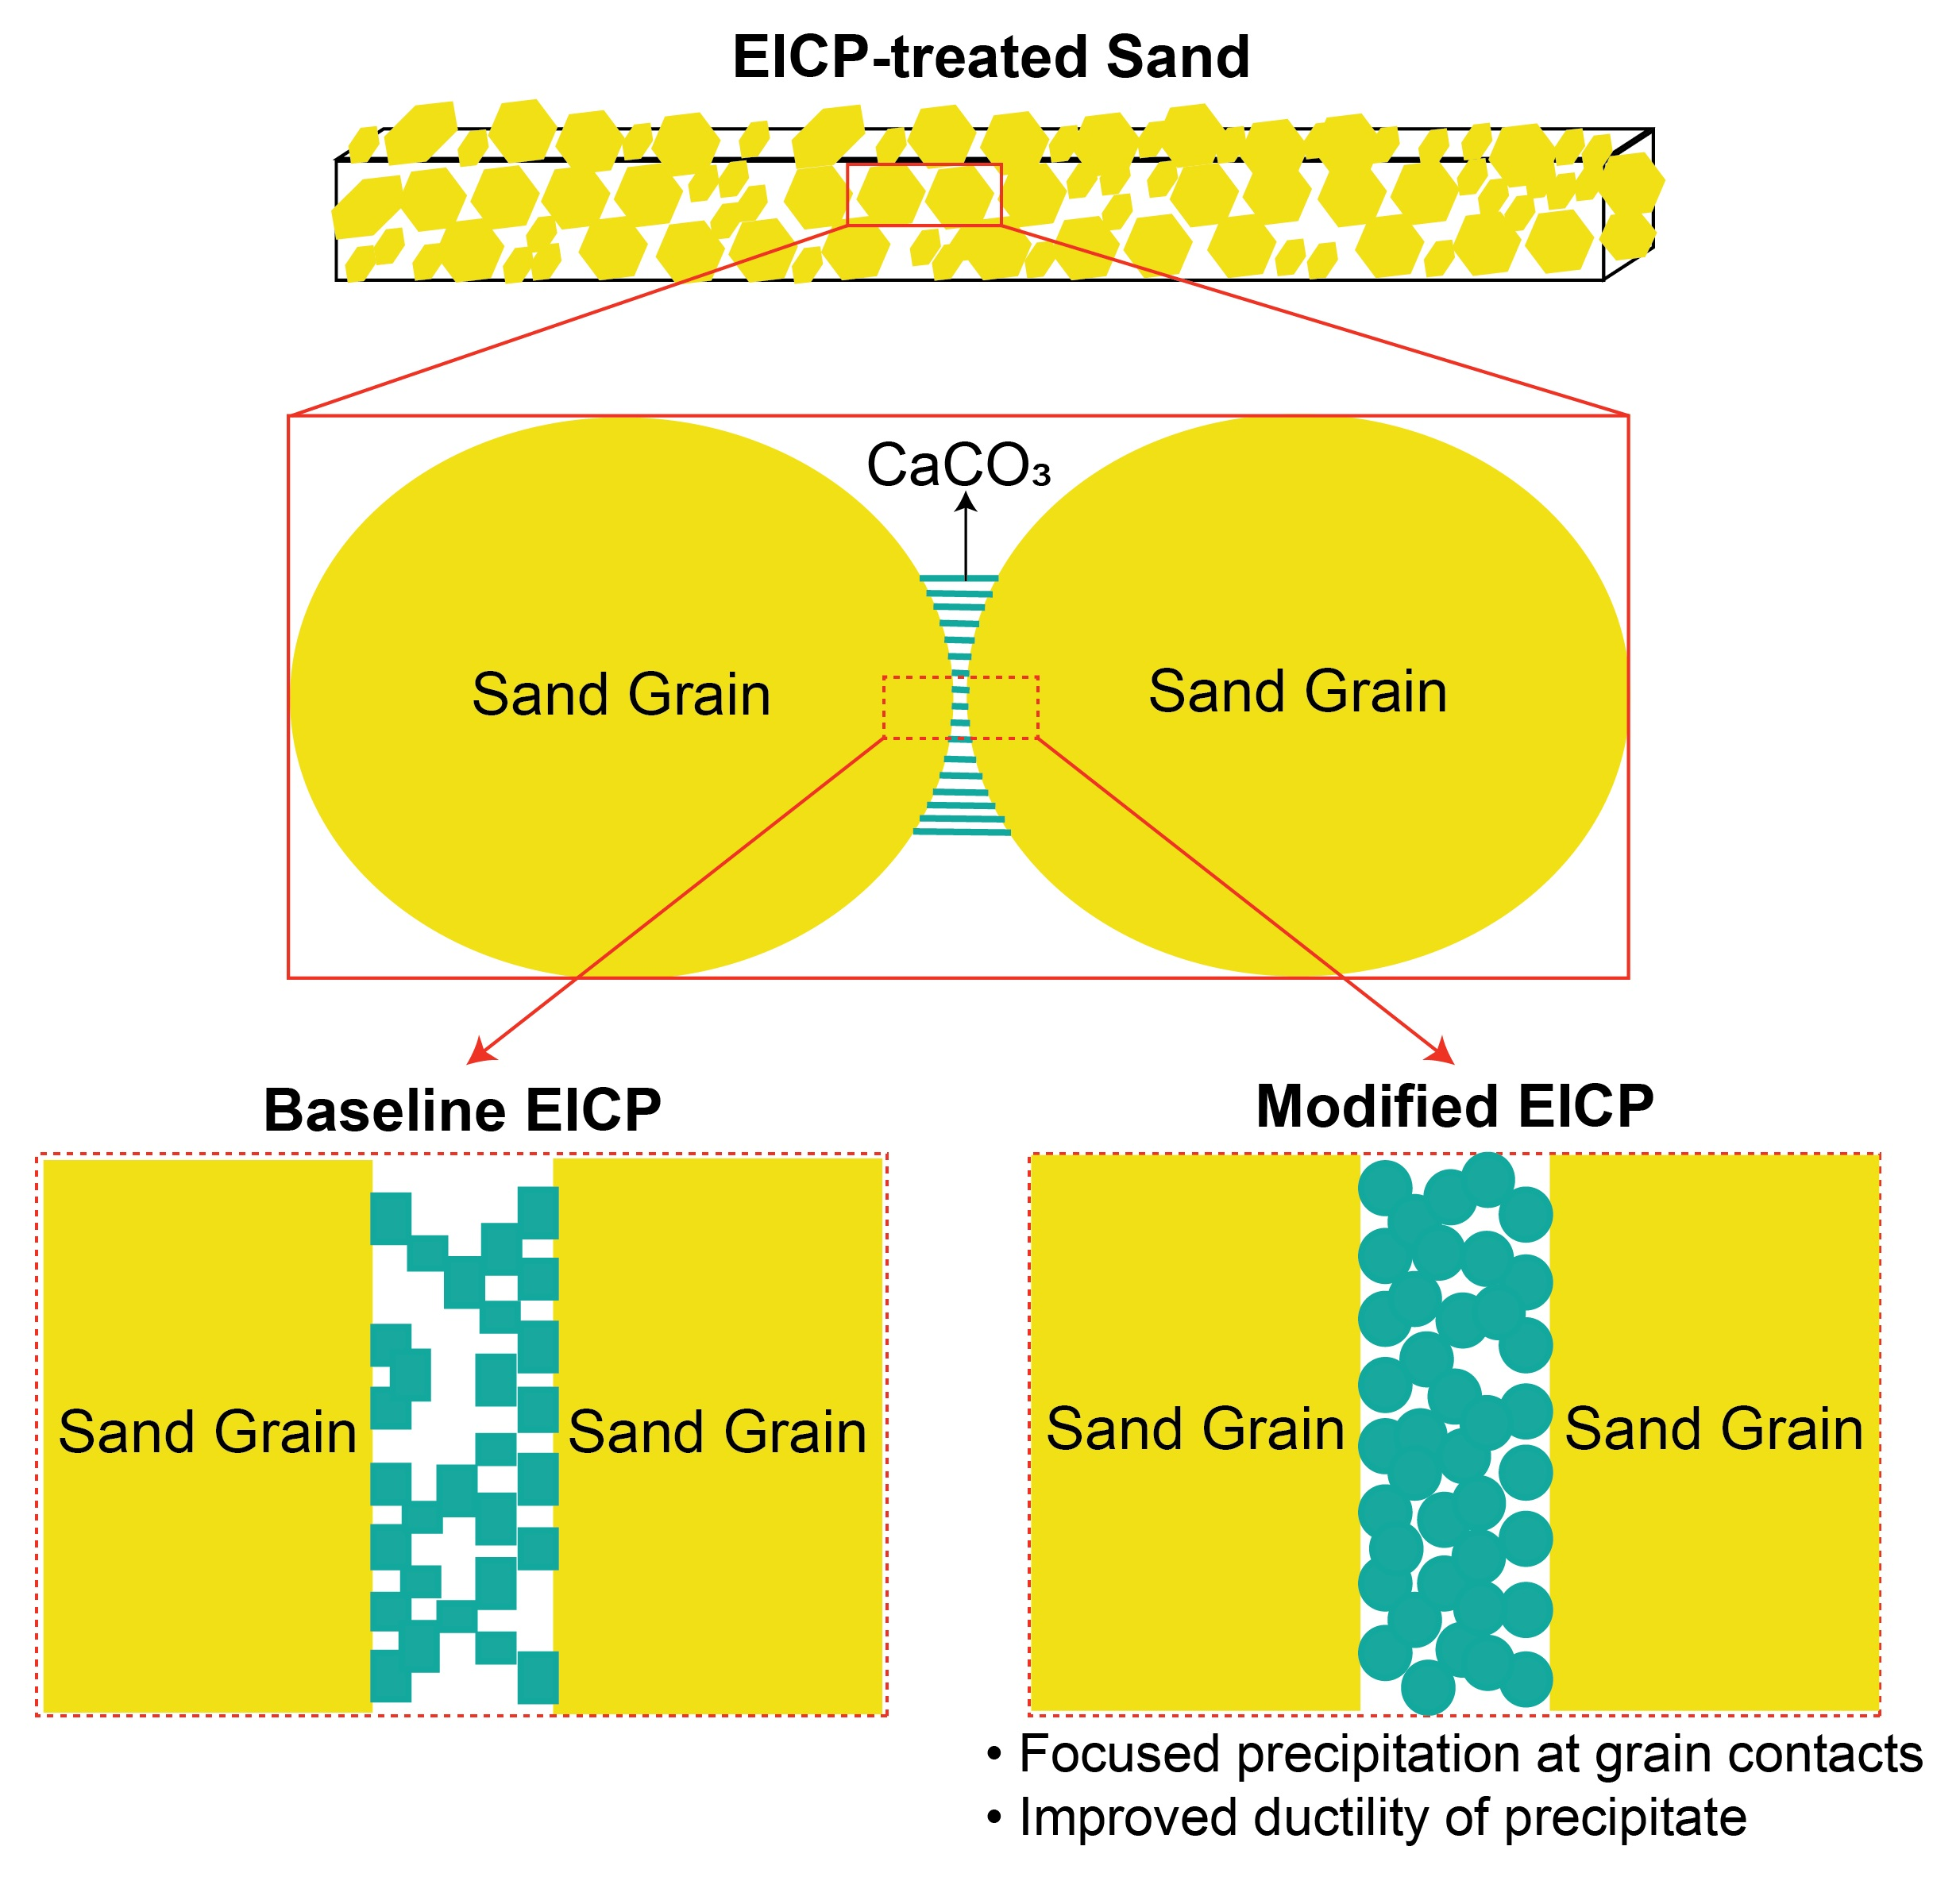
  • How are the mechanical and chemical properties of the modified precipitate different from that of the baseline precipitate?
  • Apart from favoring the precipitation to occur at interparticle contacts, does the modified EICP treatment contribute to higher UCS also by virtue of the different mechanical characteristics of the precipitate?
To answer these questions, we evaluate the mechanical properties of the baseline and modified precipitates at the sub-micron scale using instrumented indentation. We also evaluate the crystal habit and structure of the precipitates using SEM, X-ray diffraction (XRD), Raman spectroscopy, and infrared spectroscopy.

2. Materials and Methods

2.1. EICP Solution

The baseline EICP solution used in this study comprised 1.0 M urea, 0.67 M calcium chloride dihydrate, and 3.0 g/L urease enzyme (manufactured by Thermo Fisher Scientific, Waltham, MA, USA, urease activity ≈ 4200 U/g [7]). The urea and calcium chloride were reagent grade (purchased from VWR International, Radnor, PA, USA) and had a purity greater than 99%. The modified EICP solution used in this study was identical to the baseline EICP solution with respect to the grade and concentration of urea, calcium chloride, and urease. In addition to these reagents, the modified EICP solution contained 4.0 g/L nonfat dry milk (manufactured by Boston BioProducts, Ashland, MA, USA). The baseline and modified EICP solutions were stored in capped 50-mL centrifuge tubes (without shaking or stirring) at room temperature for 72 h. At the end of this period, each tube was centrifuged at 1500 rpm for 10 min and the supernatant was discarded. The precipitate remaining in the tubes was washed thrice by adding 45 mL deionized water each time. After each washing, the tubes were centrifuged at 1500 rpm for 10 min and the supernatant was discarded. Finally, the precipitates were airdried at room temperature until constant mass was achieved.

2.2. Mineralogical Characterization

The mineral phases in the baseline and modified precipitates were identified using XRD. The precipitates were ground into a fine powder using a mortar and pestle. The powder was placed on a glass slide and transferred to an X-ray diffractometer (Aeris Research Edition, manufactured by Malvern Panalytical Inc., Westborough, MA, USA). The X-rays were generated in the diffractometer using a copper anode (Kα1 wavelength = 1.540598 Å; Kα2 wavelength = 1.544426 Å; Kα2/Kα1 intensity ratio = 0.5; X-ray tube voltage = 40 kV; emission current = 15 mA). The diffractograms were recorded at room temperature from 10° to 80° 2θ (where 2θ is the angle between the diffracted and transmitted X-ray beam). The scan step was 0.010866° and the time per step was 3.57 s. Rietveld refinement of calcite peaks was performed using MAUD (Materials Analysis Using Diffraction, v. 2.991, Luca Lutterotti, Trento, Italy). Using Rietveld refinement, we evaluated the crystallite size, lattice microstrain, and the lattice unit cell parameters of calcite in the baseline and modified precipitates.
The baseline and modified precipitates were also characterized using Raman microspectroscopy (laser excitation wavelength of 532 nm; 1200 grooves/mm diffraction grating; 300 mm spectrometer focal length; 50x objective with laser spot size dimension of ≈ 2 μm; ≈1.5 cm−1/pixel spectral dispersion; spectra collected between 1980–80 cm−1). Raman spectra were recorded at five locations each on the baseline and modified precipitates. The position and width of the peaks (i.e., full width at half maximum (FWHM)) were analyzed by fitting a Lorentzian function to the measured spectral line (see Section A of Supplementary Information). The plots of the Lorentzian fitting curves are presented in Section B of Supplementary Information. The precipitates were also characterized using Fourier-transform infrared spectroscopy (FTIR; Nicolet 6700, manufactured by Thermo Fisher Scientific, Waltham, MA, USA). The FTIR system used a single-reflection attenuated total reflectance (ATR) accessory (diamond ATR crystal, KBr beamsplitter, DTGS/KBr detector; DTGS: deuterated triglycine sulfate). The IR spectra were collected between 4000–525 cm−1 (32 scans at 4 cm−1 resolution). The various crystal habits in the baseline and modified precipitates were studied using SEM (Helios 5 UX, manufactured by Thermo Fisher Scientific, Waltham, MA, USA).

2.3. Indentation Testing

Indentation tests were used to evaluate two material properties: indentation hardness (H, defined as Pmax/Ac; Pmax: peak indentation load; Ac: area of elastic contact projected on the horizontal plane) and indentation modulus (M). The elastic unloading stiffness measured in indentation tests is a combined effect of the indentation moduli of the test material and the indenter probe. The indentation modulus of the test material is then derived using equations in Oliver and Pharr [8]. For isotropic materials, the indentation modulus is equal to the plane stress modulus (i.e., E/(1−ν2); E: Young’s modulus; ν: Poisson’s ratio). Specimens for indentation testing were prepared by embedding the airdried precipitates in epoxy. Approximately 2 g each of the baseline and modified precipitates were used to prepare epoxy-embedded specimens of diameter 3.2 cm (1.25 in). The specimens were then ground using silicon carbide abrasive pads of increasing fineness (grit size 120 to 1200). The grinding process eroded portions of the CaCO3 particles and exposed their interior. Here “particles” of CaCO3 refer to polycrystals (or aggregates of polycrystals). Following the grinding, the specimens were polished using aluminum oxide polishing pads with abrasive particles of diameters 12 μm, 9 μm, 3 μm, 1 μm, and 0.3 μm.
Indentation tests were performed at room temperature on the exposed surfaces of the CaCO3 particles using an Ultra Nanoindentation Tester (UNHT3, Anton Paar USA, Inc., Ashland, VA, USA). The UNHT3 device was placed inside a closed acoustic vibration isolation chamber, with the chamber situated on top of a piezo-corrected antivibration table. The indenter probe was a diamond Berkovich tip (Young’s modulus (EIN) = 1141 GPa; Poisson’s ratio (νIN) = 0.07; correction factor (β) = 1.034). Grids of indents were performed on seven particles in the baseline precipitate specimen and on eight particles in the modified precipitate specimen. The peak indentation load was 2.0 mN (except in two particles of the modified precipitate, where 2.5 mN was applied). Each indent consisted of the following loading protocol: (i) a 30-s loading phase, where the load was ramped up at a constant rate to the peak load; (ii) a 5-s holding phase, where the load was held constant at the peak load; and (iii) a 30-s unloading phase, where the load was ramped down at a constant rate to zero. The loading rate (and unloading rate) was 66.7 μN/s in indents with peak load of 2.0 mN and 83.3 μN/s in indents with peak load of 2.5 mN. The resulting indentation curves were analyzed using the Oliver and Pharr [8,9] method, which came preinstalled in the Anton Paar postprocessing software, to obtain the indentation hardness and indentation modulus of the particles. Any indentation curve that significantly deviated from the ideal load-displacement profile (due to, for example, rough surface topography) was eliminated from the dataset and designated as an outlier. Further experimental details on the indentation testing are provided in Section A of Supplementary Information. Indentation load-displacement curves and images of indentation footprints are presented in Section C of Supplementary Information.
The measured values of indentation hardness and modulus of the baseline and modified precipitates were modeled as a bivariate normal distribution. Using the maximum likelihood estimates of the distribution parameters (mean vector and covariance matrix), we constructed 95% prediction intervals (i.e., prediction ellipses in the M, H space) for the indentation hardness and modulus. Details of the statistical procedure are provided in Section D of Supplementary Information.

3. Results and Discussion

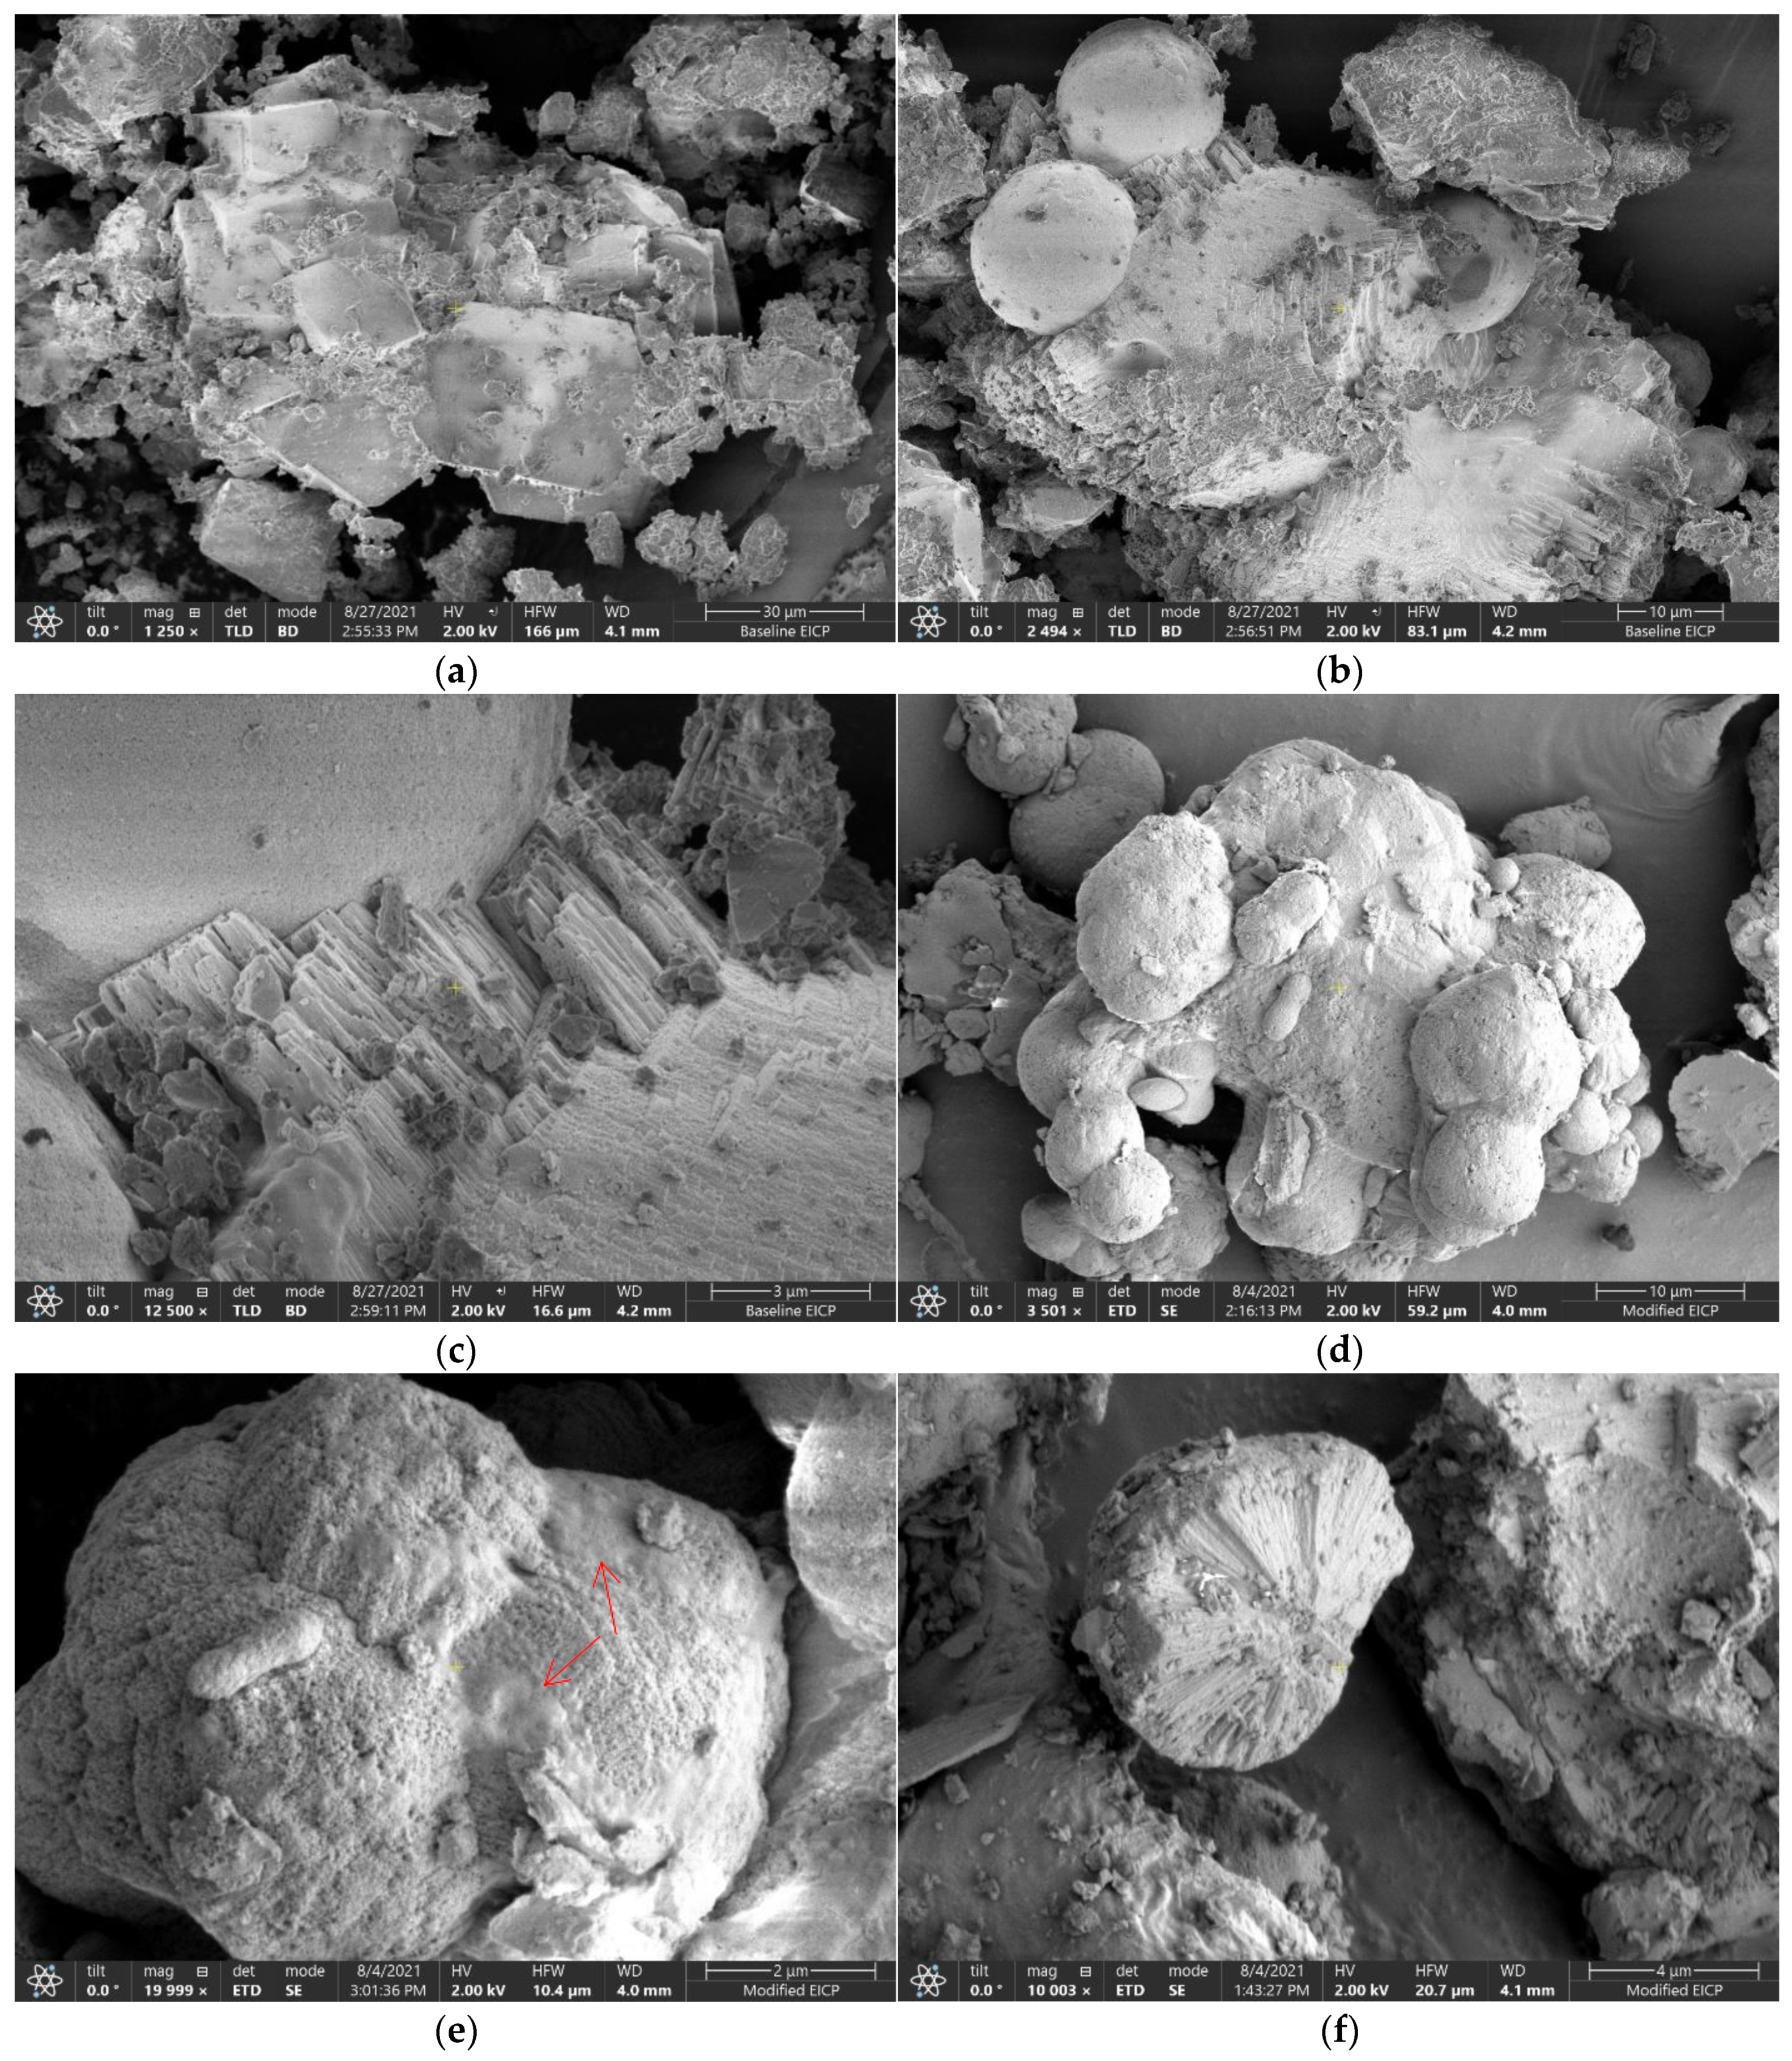
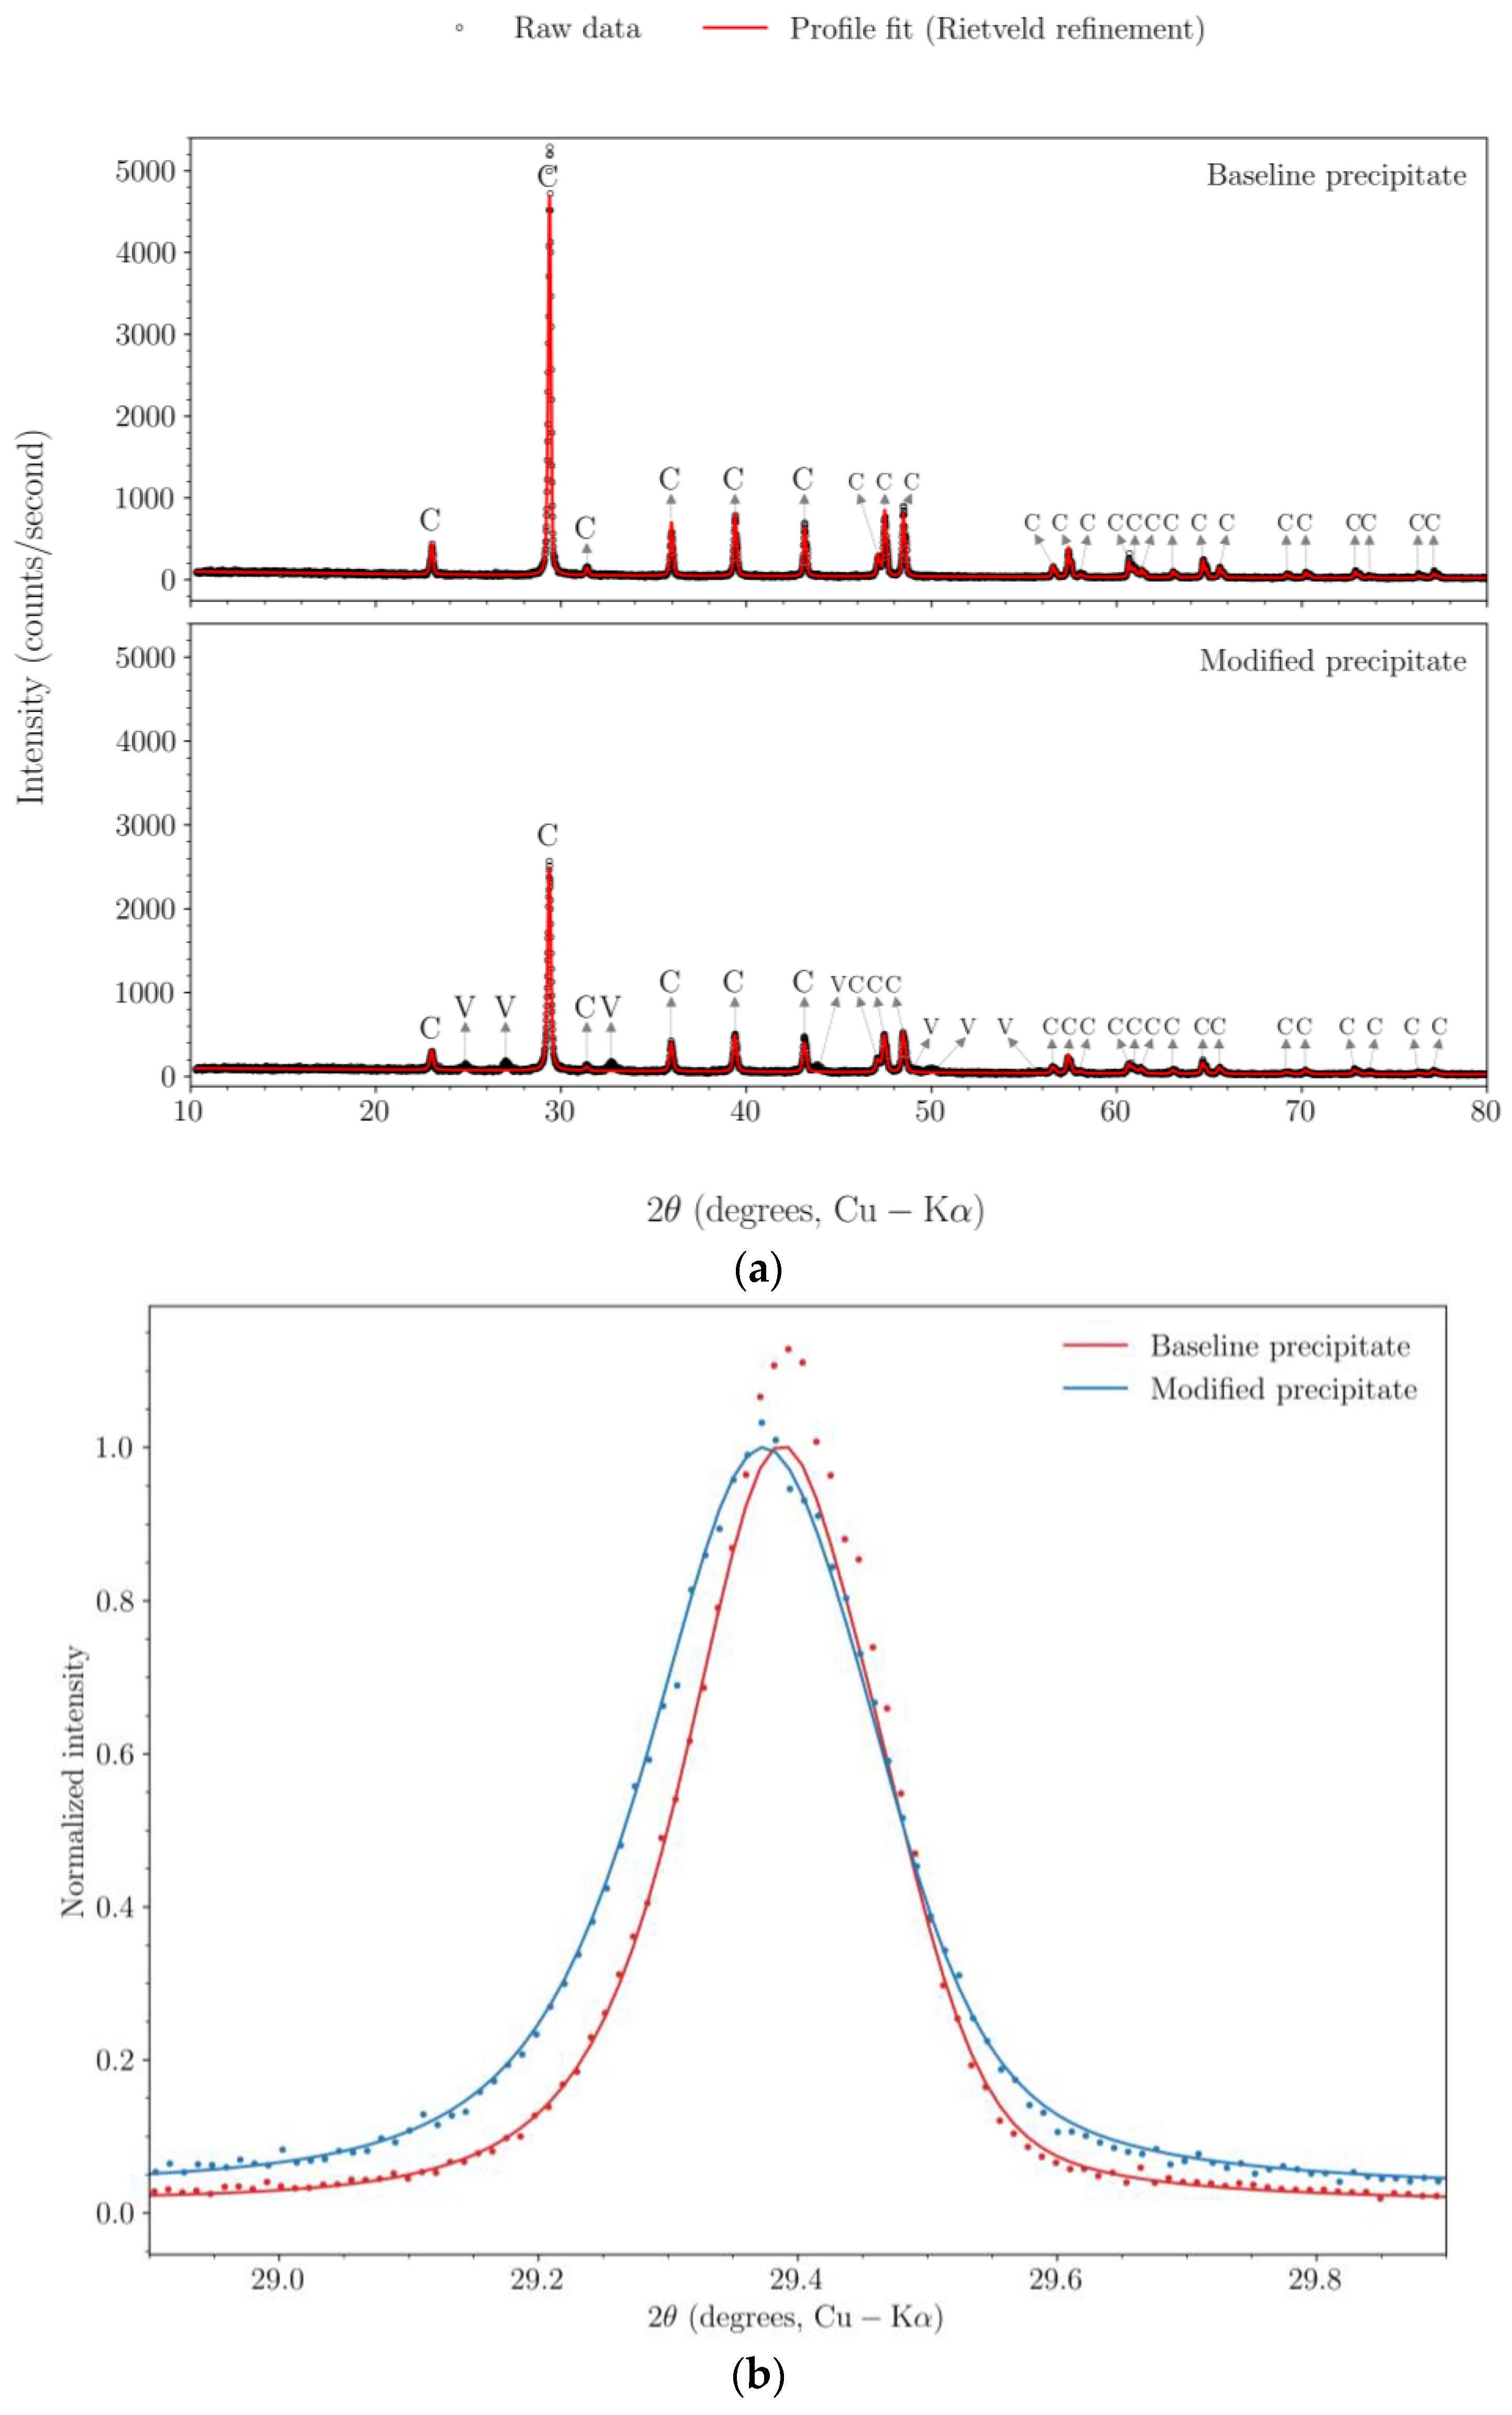
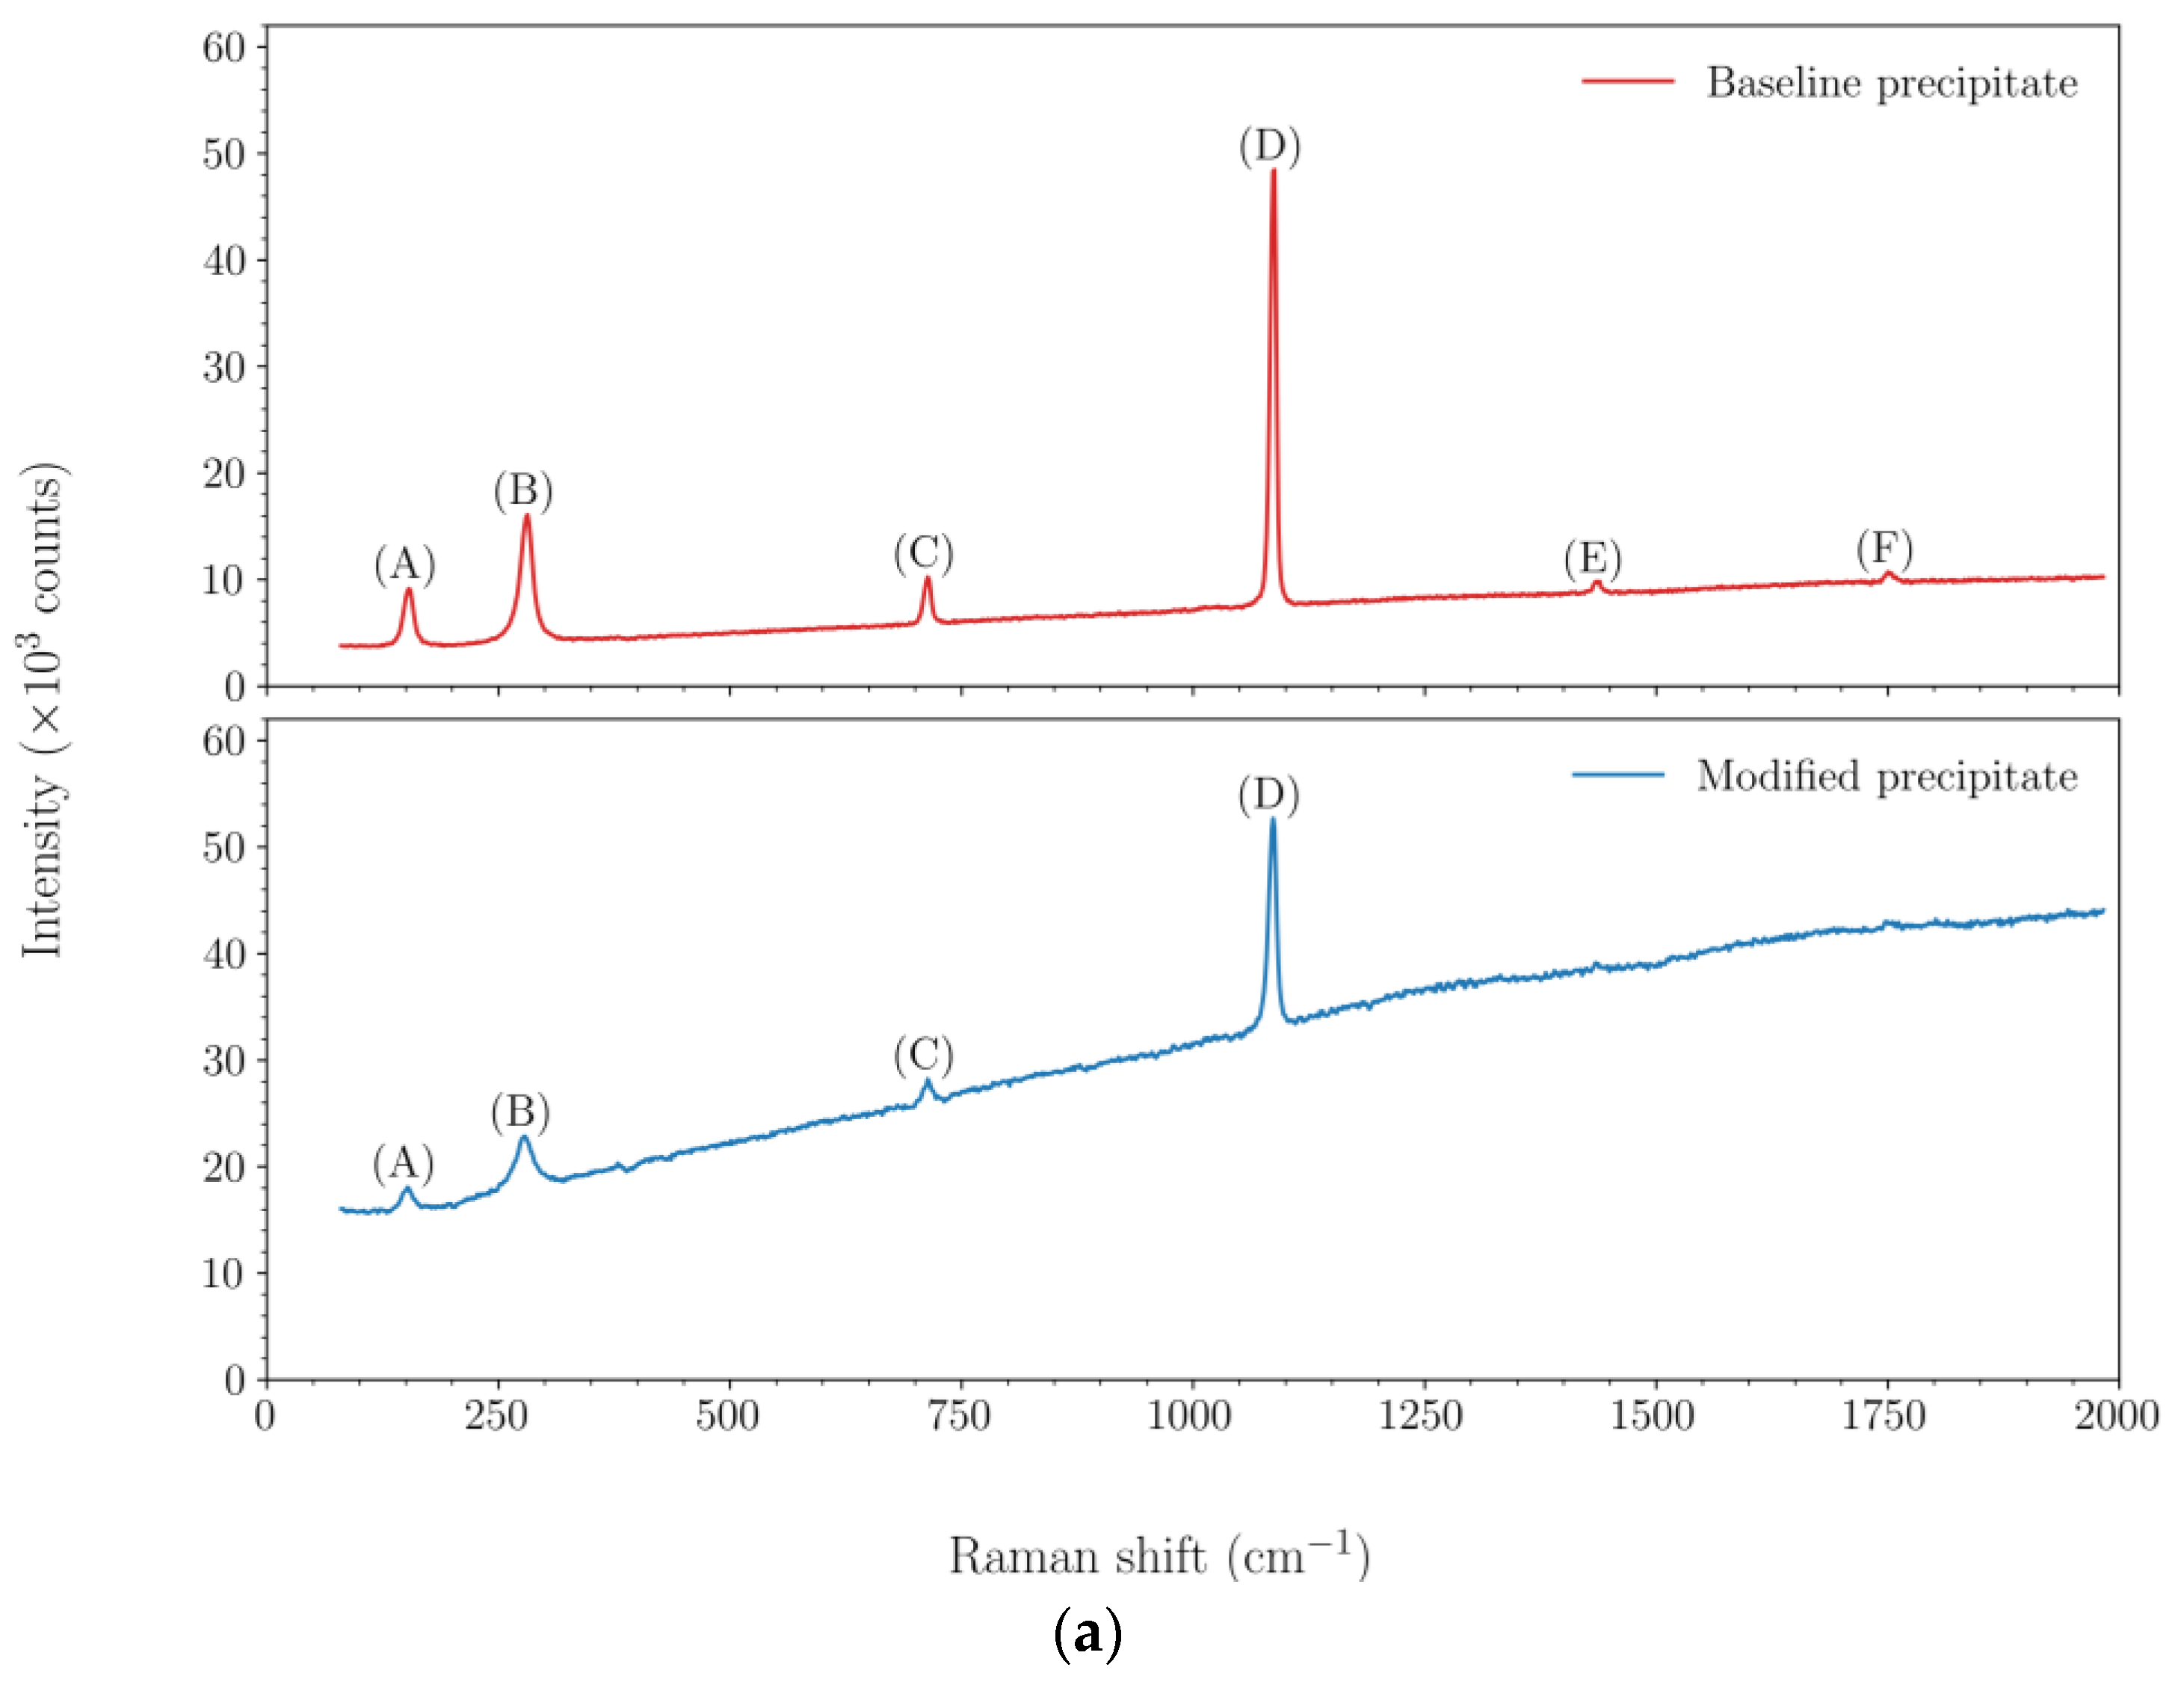
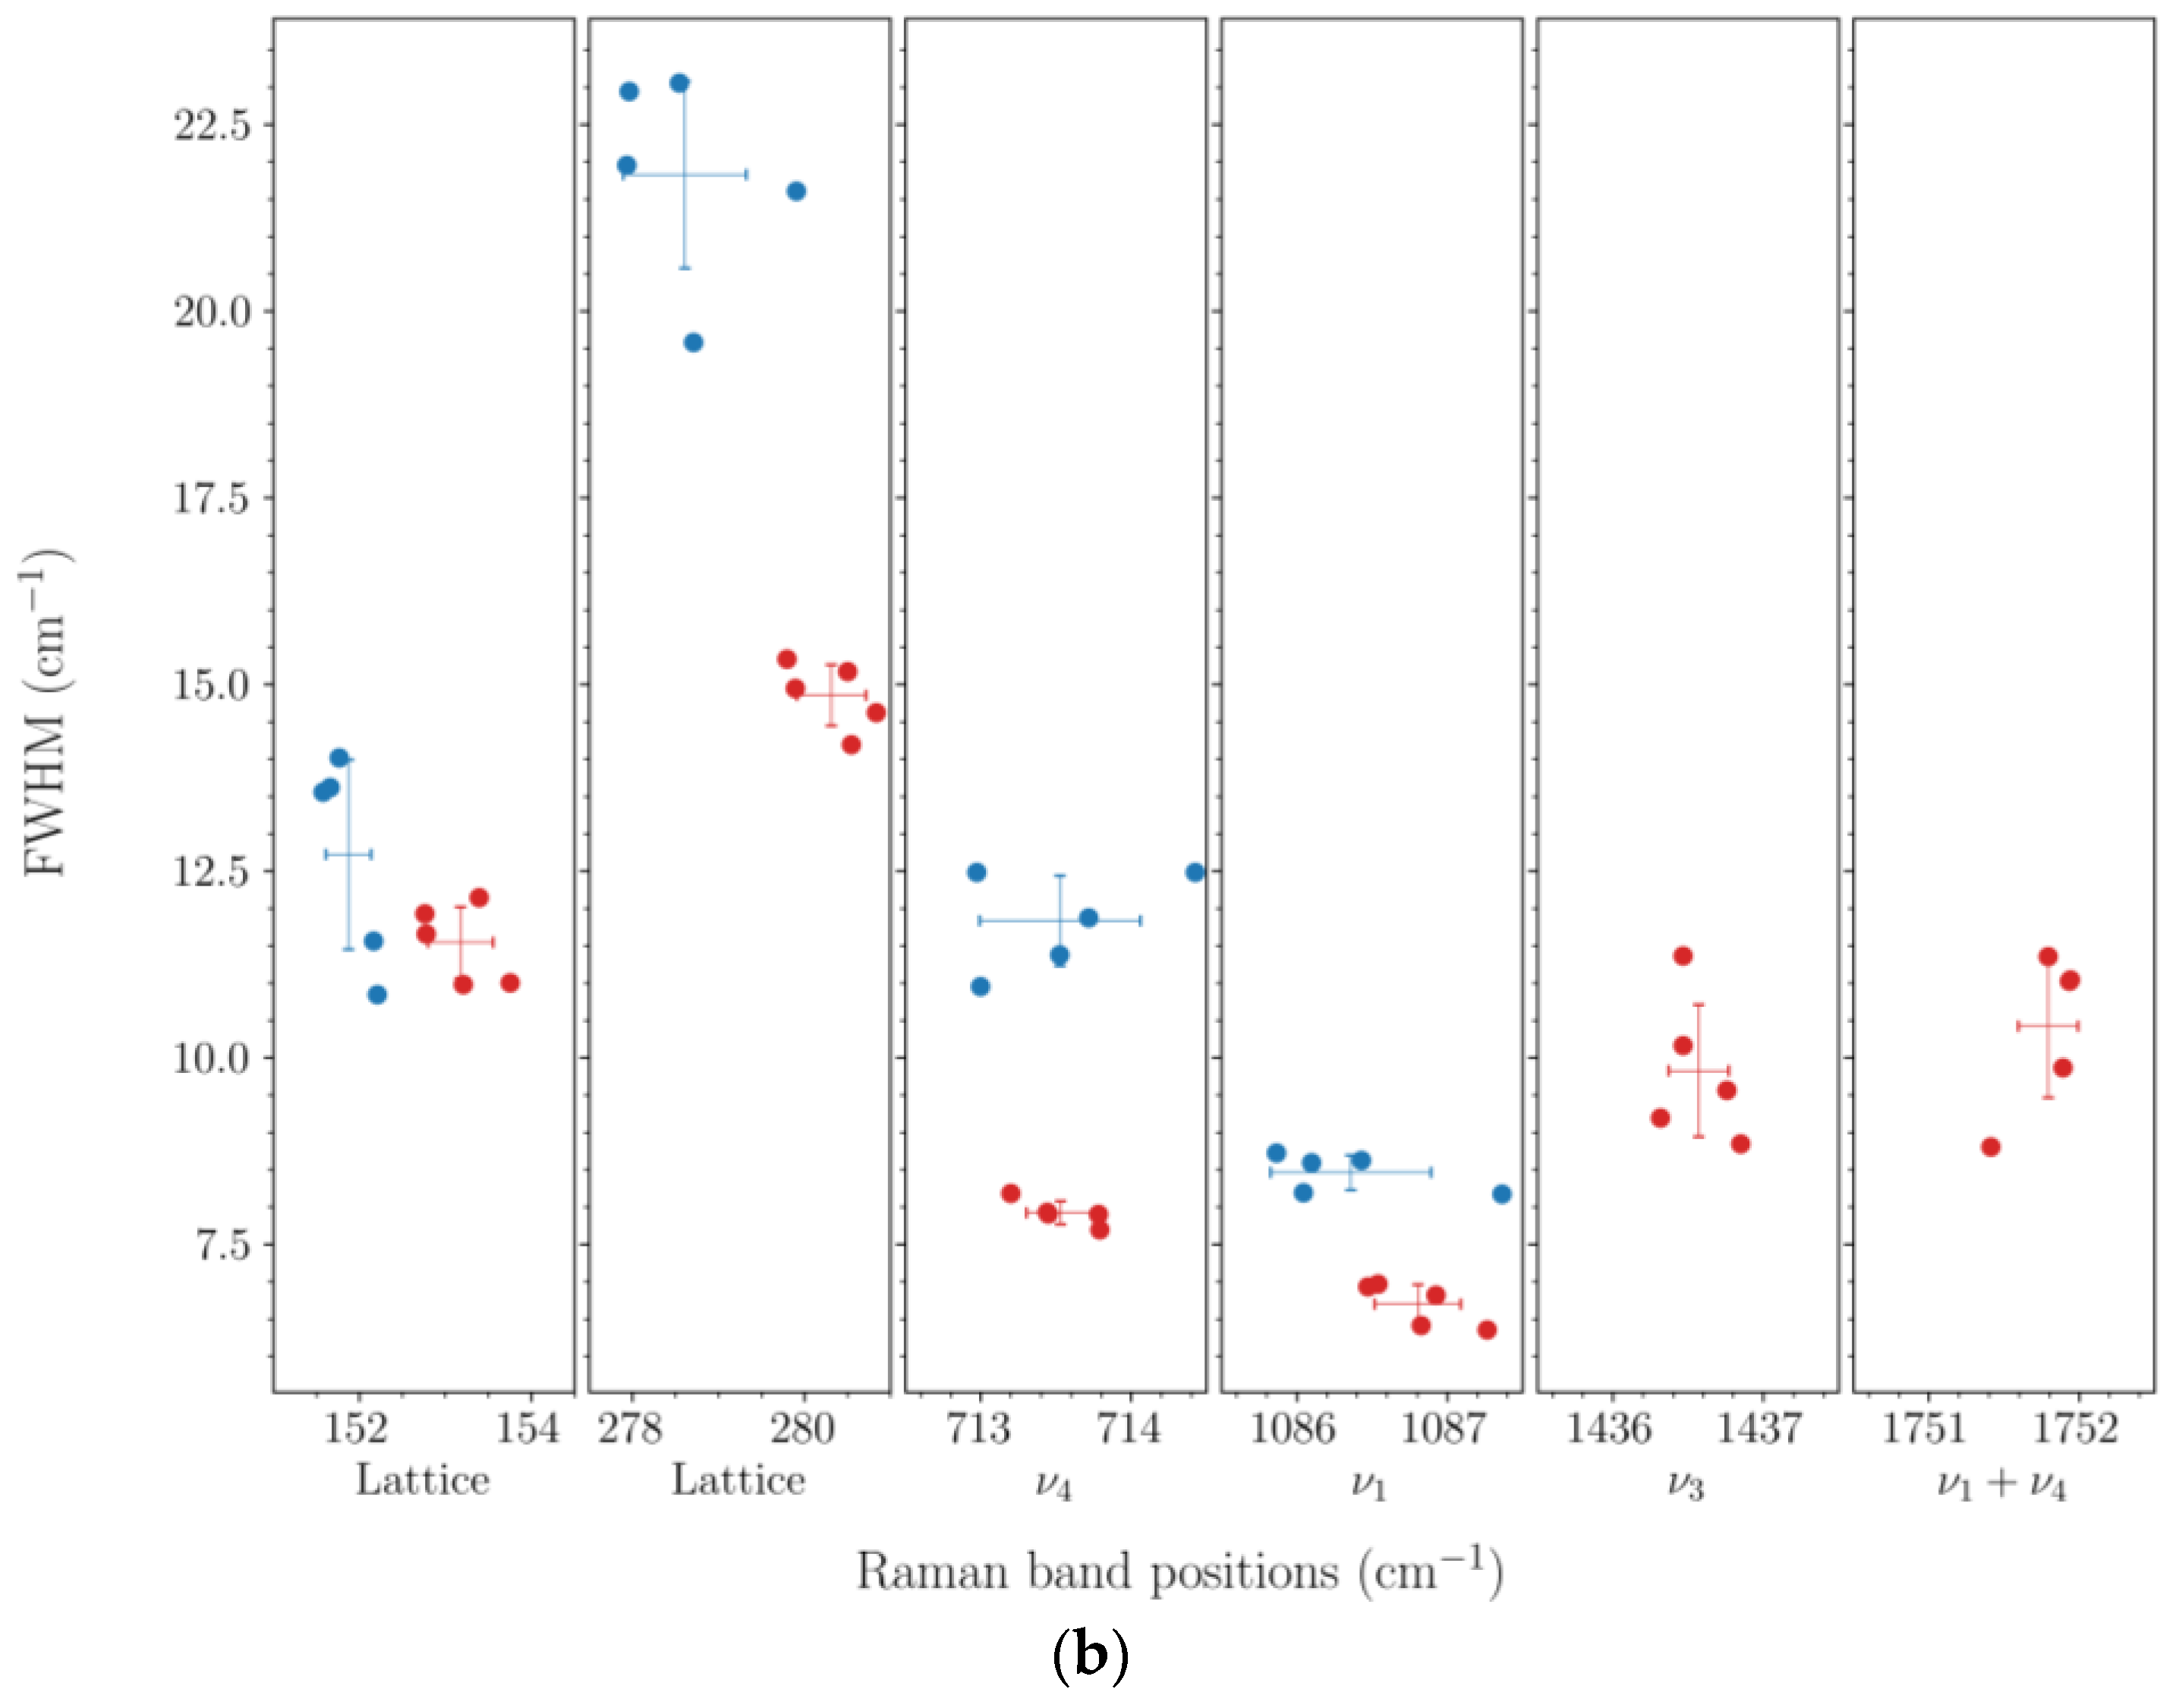
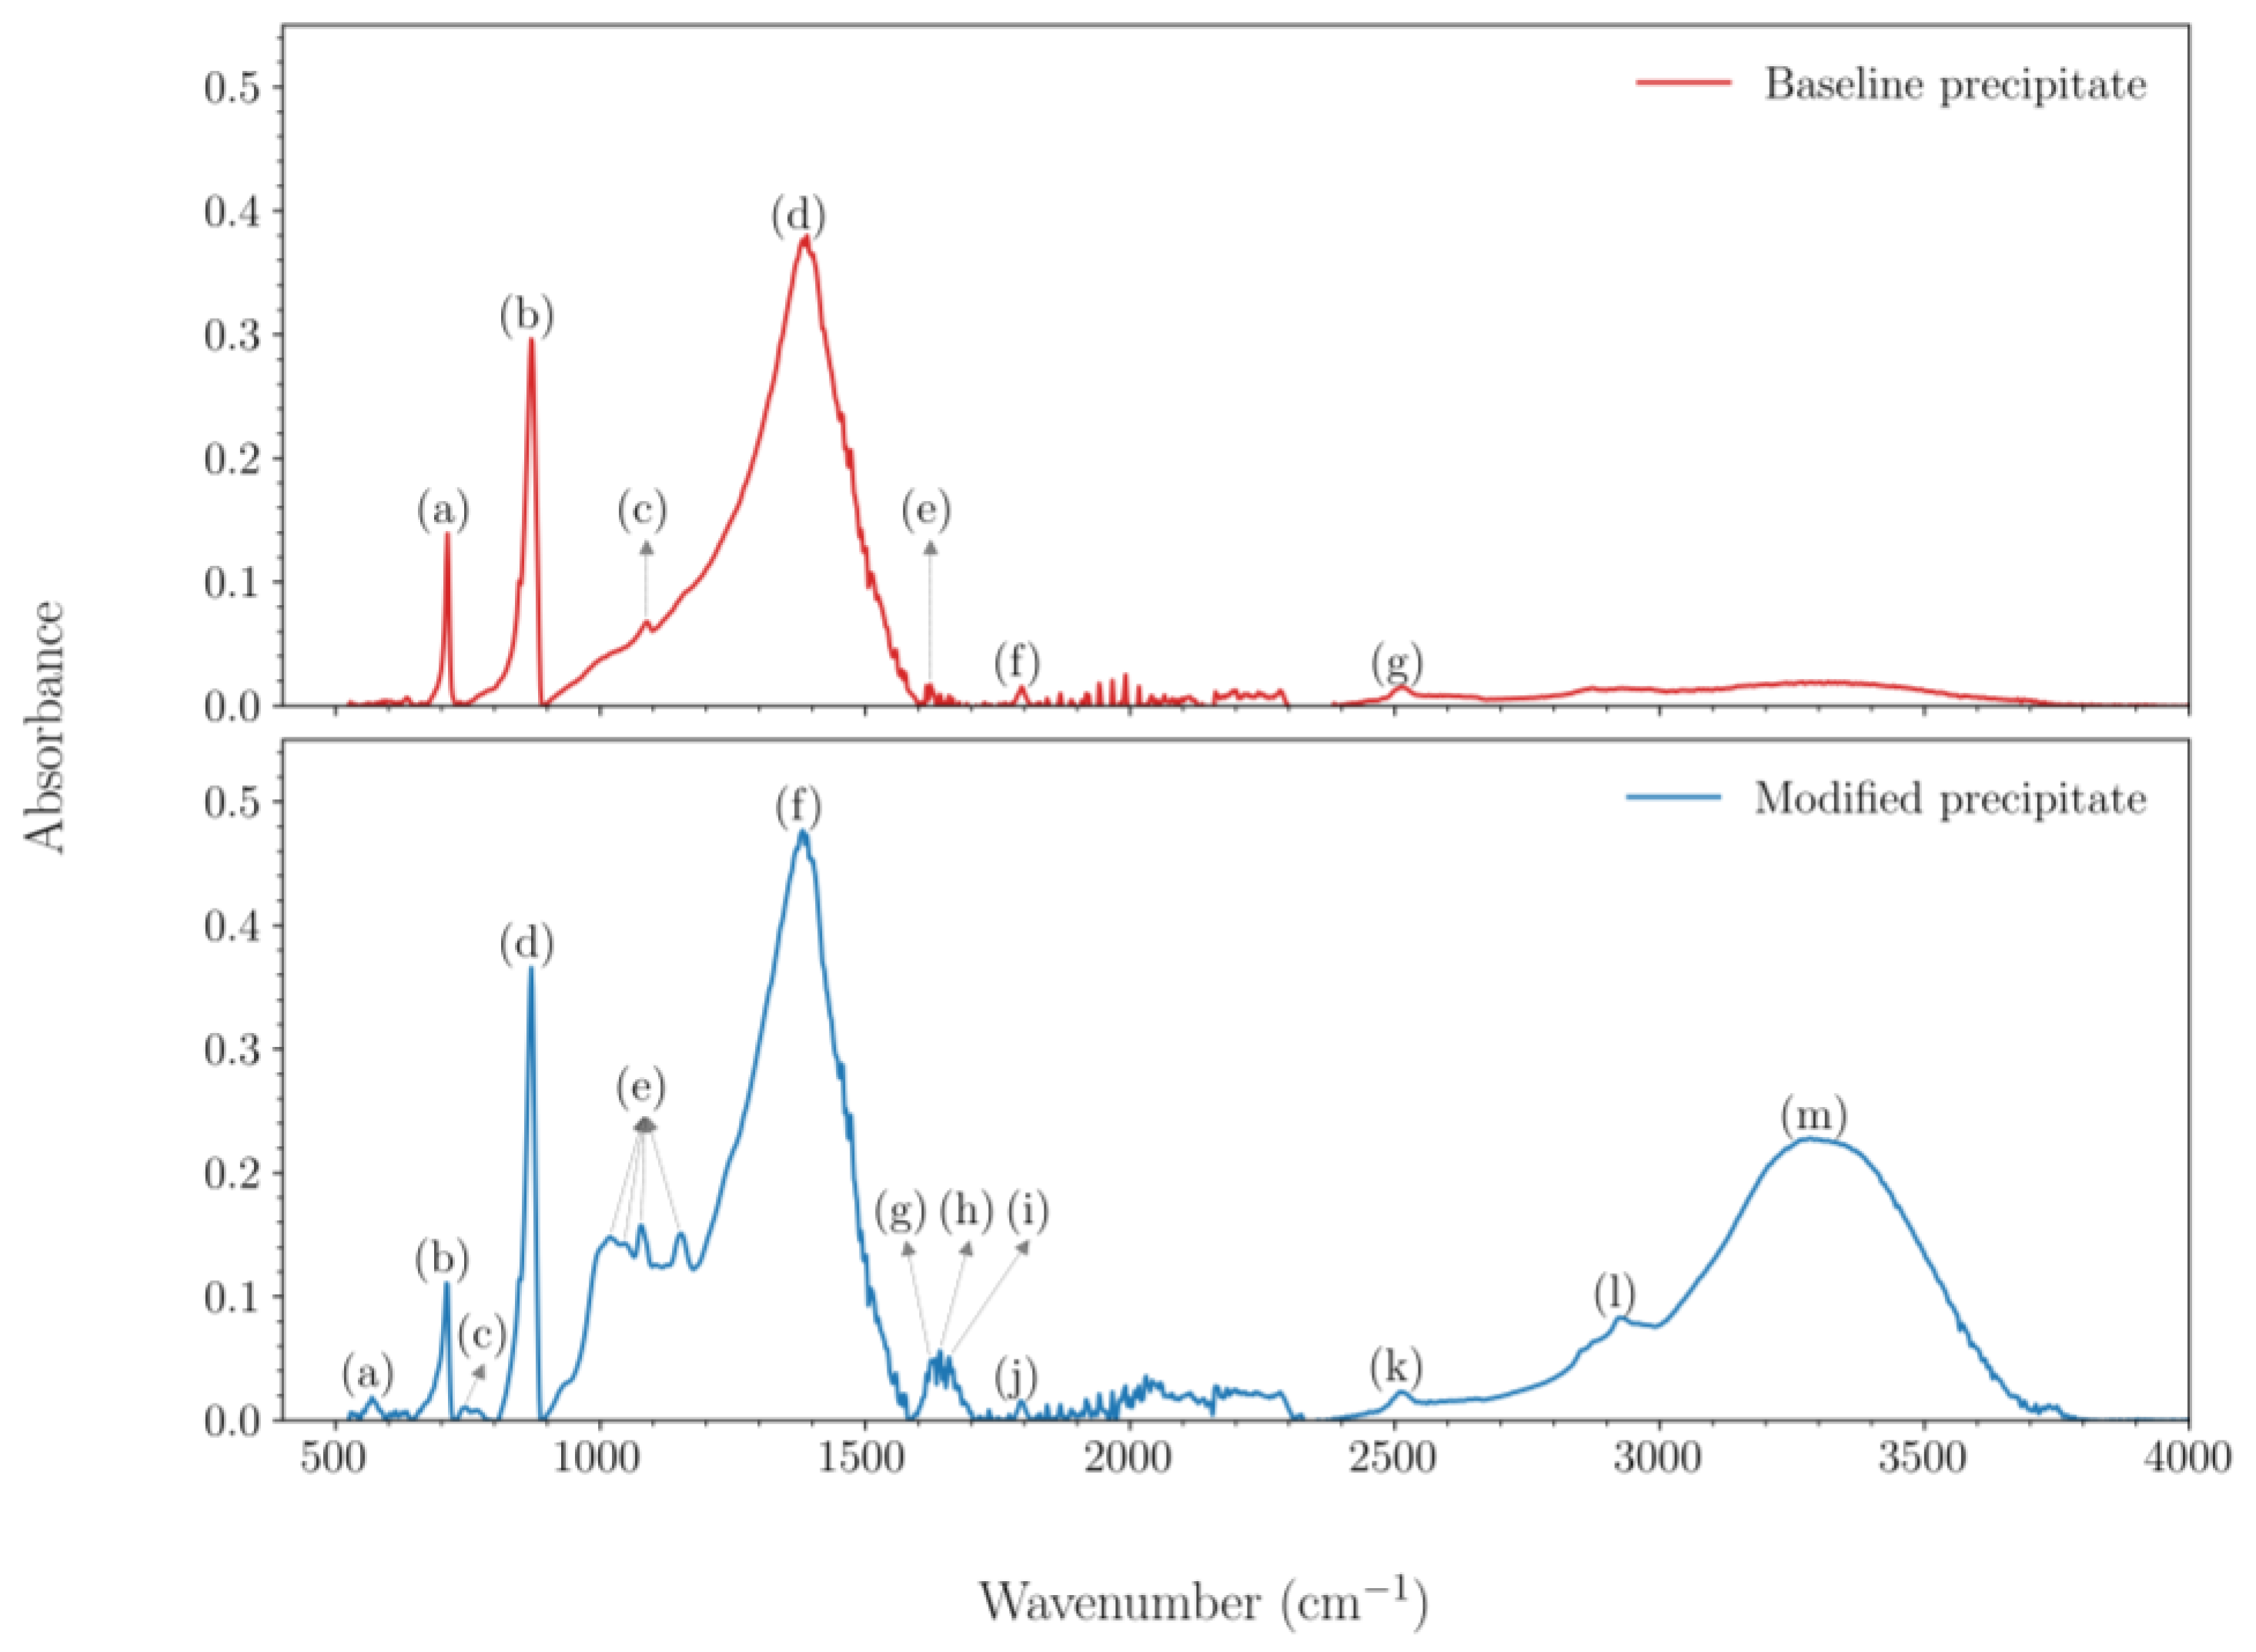
3.1. Mineralogical Characteristics

Representative SEM images of the baseline and modified precipitate are shown in Figure 1. It is well known that the presence of organic compounds (such as proteins and biopolymers) during CaCO3 precipitation can modify the morphology and crystal habit of the precipitate [10,11]. Various crystal habits can be observed in Figure 1, e.g., overlapping rhombohedra, elongated and rounded, spherulites. The size of the polycrystalline precipitate particles ranged from on the order of a few microns to approximately 100 microns.
Figure 2a presents the X-ray diffractograms of the baseline and modified precipitate. The baseline precipitate was composed entirely of calcite, whereas the modified precipitate was composed predominantly of calcite with a small amount of vaterite. Compared with the baseline precipitate, the diffractogram of the modified precipitate exhibited minor broadening of calcite peaks, illustrated in Figure 2b. Peak broadening may result from a decrease in mean coherent domain size (i.e., smaller crystallite size) and/or an increase in lattice microstrain, e.g., strains at grain boundaries, from ion substitution, or from occlusion of organic compounds [12]. The results of the Rietveld refinement are presented in Table 1. The Rietveld analysis indicated that while the lattice strains in both precipitates were almost equal, the modified precipitate had a smaller crystallite size and larger lattice parameters (a-axis expansion of 0.03%; c-axis expansion of 0.07%). Note that the vaterite peaks in the diffractogram of the modified precipitate were excluded from the Rietveld analysis because the crystal structure of vaterite is still under debate, i.e., several polytypes and space groups have been proposed for vaterite [13,14,15].
Figure 3a presents the Raman spectra of the baseline and modified precipitates. Compared with the baseline precipitate, the modified precipitate had a large background signal (resulting from laser-induced fluorescence) and a lower signal-to-noise ratio. The spectra of both the baseline and modified precipitate exhibited only calcite peaks. Further, due to the large background signal in the modified precipitate, the Raman bands of calcite that had low intensity (ν3 and (ν1 + ν4)) were indiscernible. Two explanations are possible for the absence of vaterite peaks in the spectra of the modified precipitate specimen: (i) the five microscopic spots in the specimen where spectra were acquired did not contain vaterite; or (ii) the vaterite peaks were small and were masked by the background signal. Figure 3b plots the position and the width of the calcite peaks (i.e., FWHM), both estimated from the Lorentzian fitting curves. While the positions of peaks in the baseline and modified precipitates were nearly equal, the peaks of the modified precipitate were broader compared with the baseline precipitate. Broader peaks indicate greater short-range atomic disorder in the calcite crystals of the modified precipitate.
Figure 4 presents the IR spectra of the baseline and modified precipitates. Peaks corresponding to calcite were observed in the baseline precipitate and peaks corresponding to calcite and vaterite were observed in the modified precipitate. Compounds occurring naturally in milk, such as lactose, milk proteins, and calcium phosphates [16], were also observed in the IR spectrum of the modified precipitate. These compounds were not detected in the Raman spectrum of the modified precipitate for the same possible reasons vaterite was not detected, i.e., small scan volume and/or large background signal.

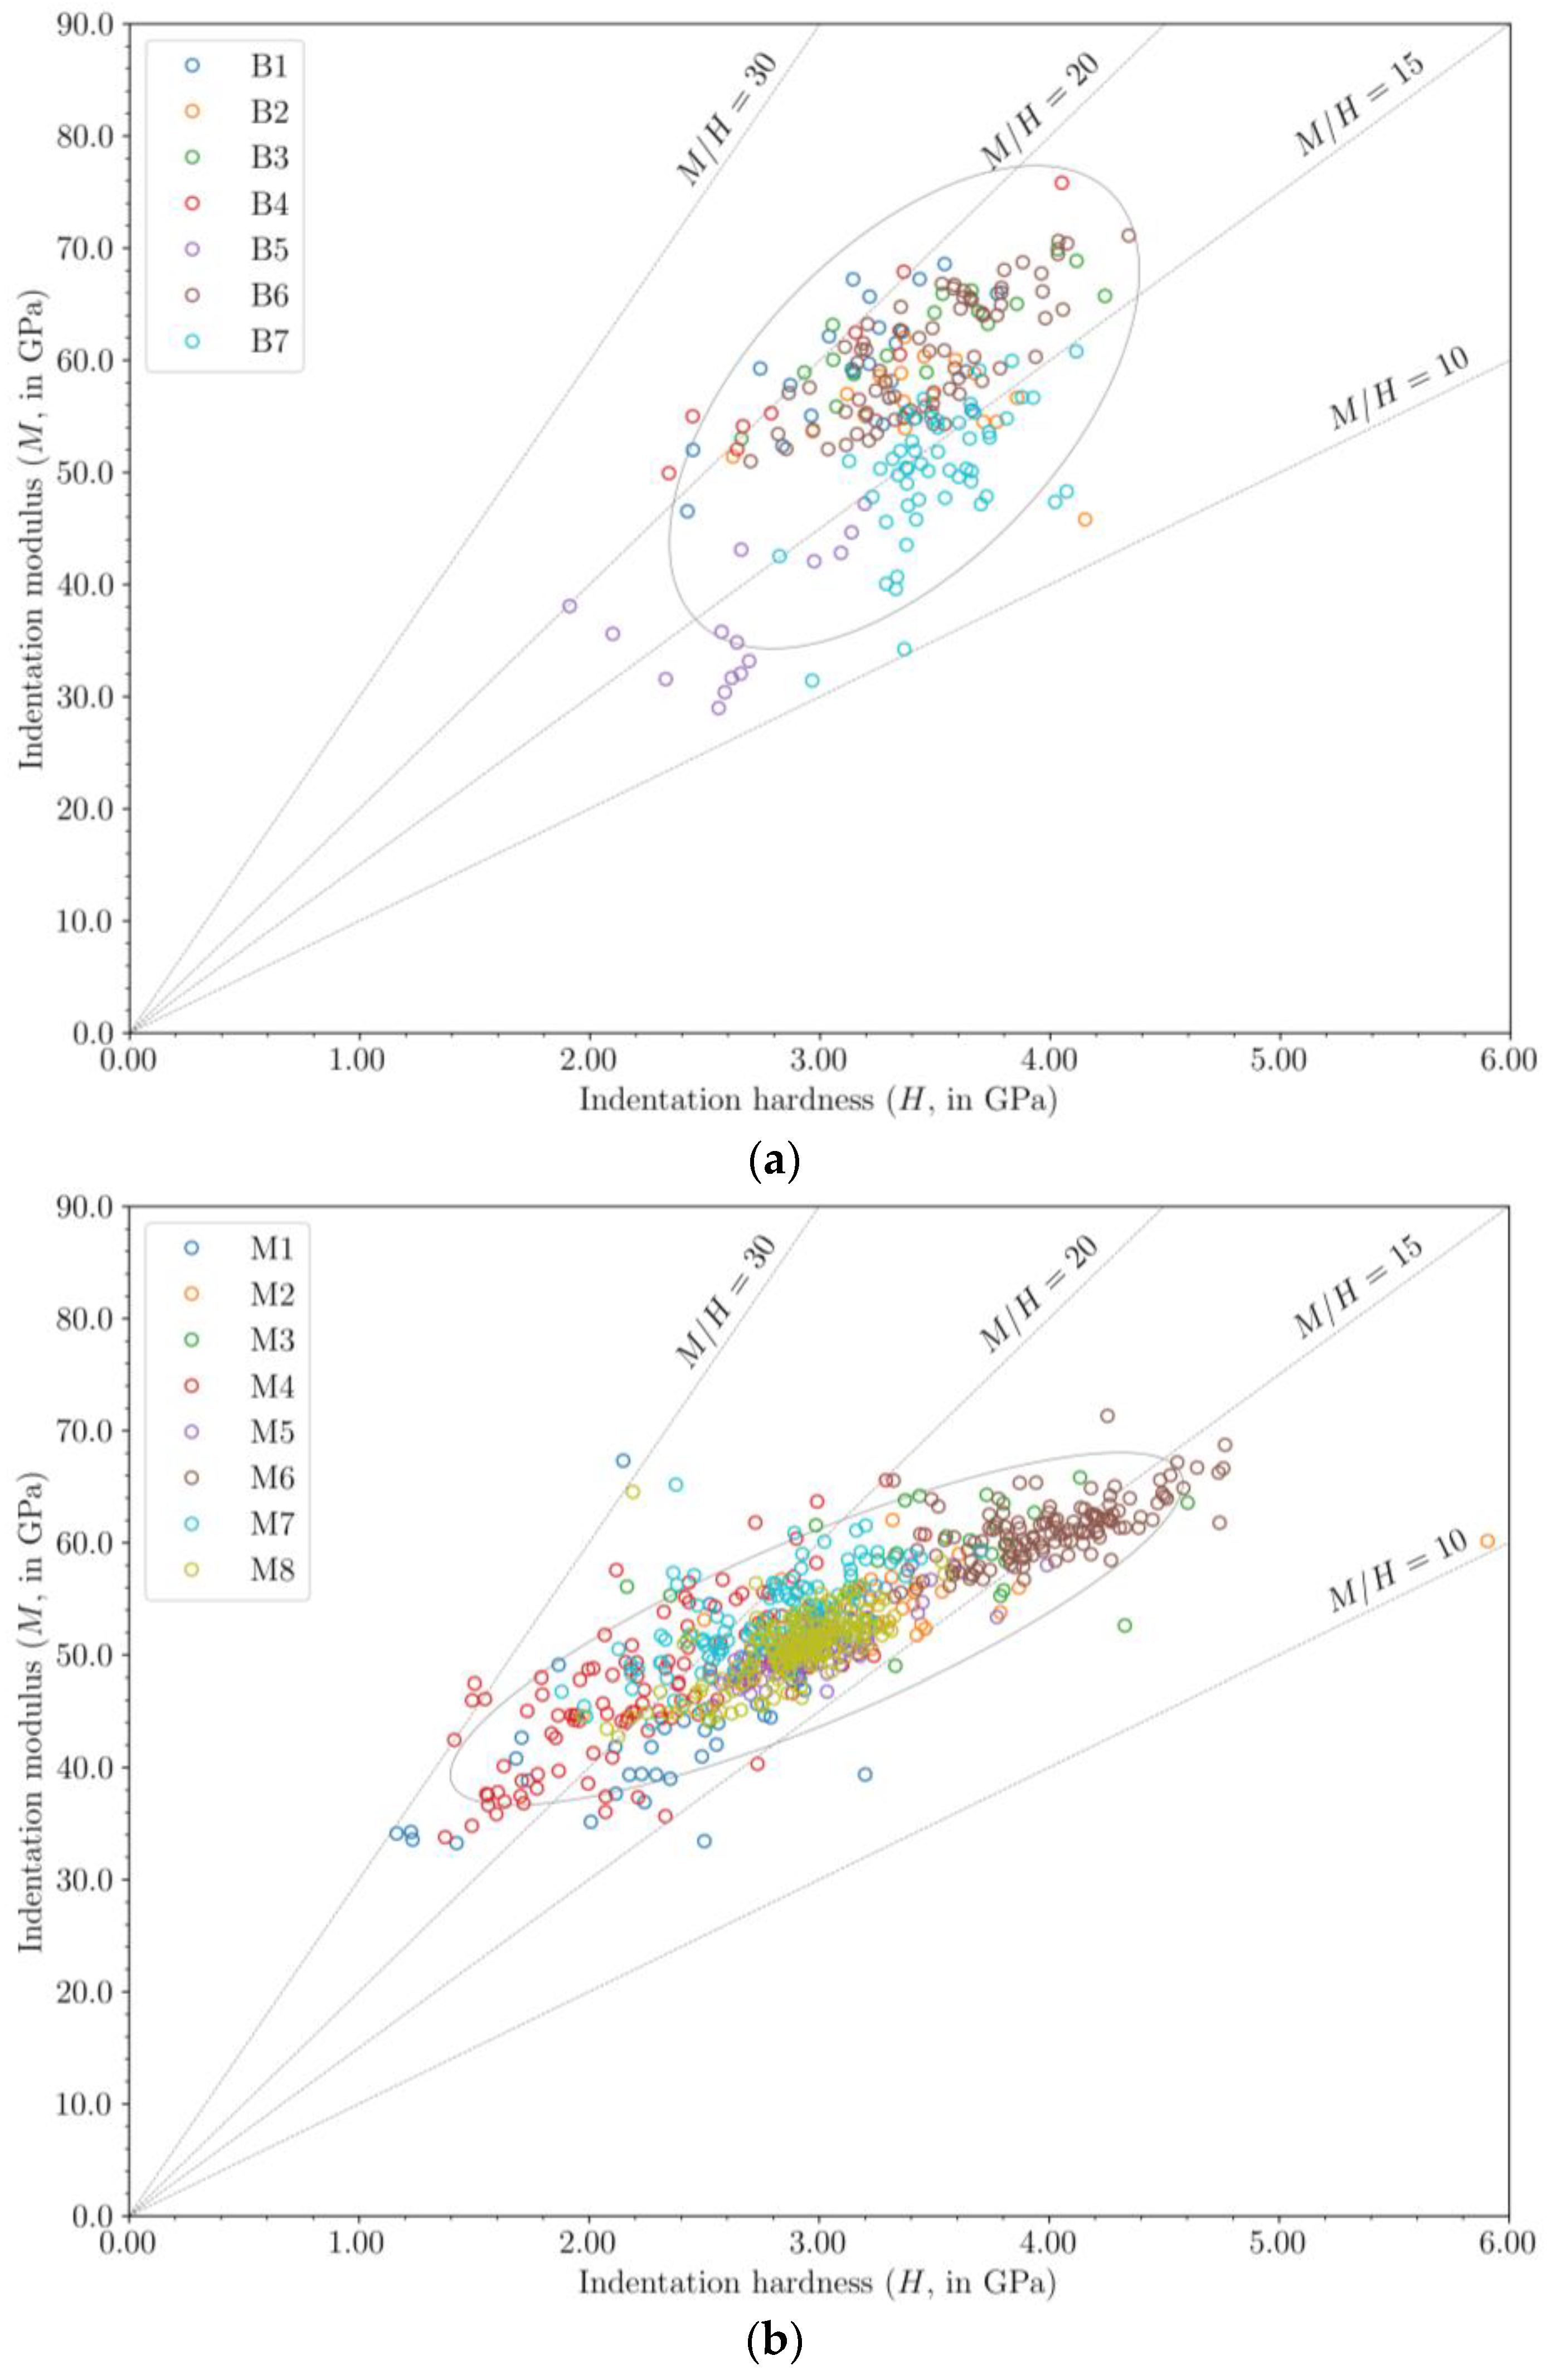
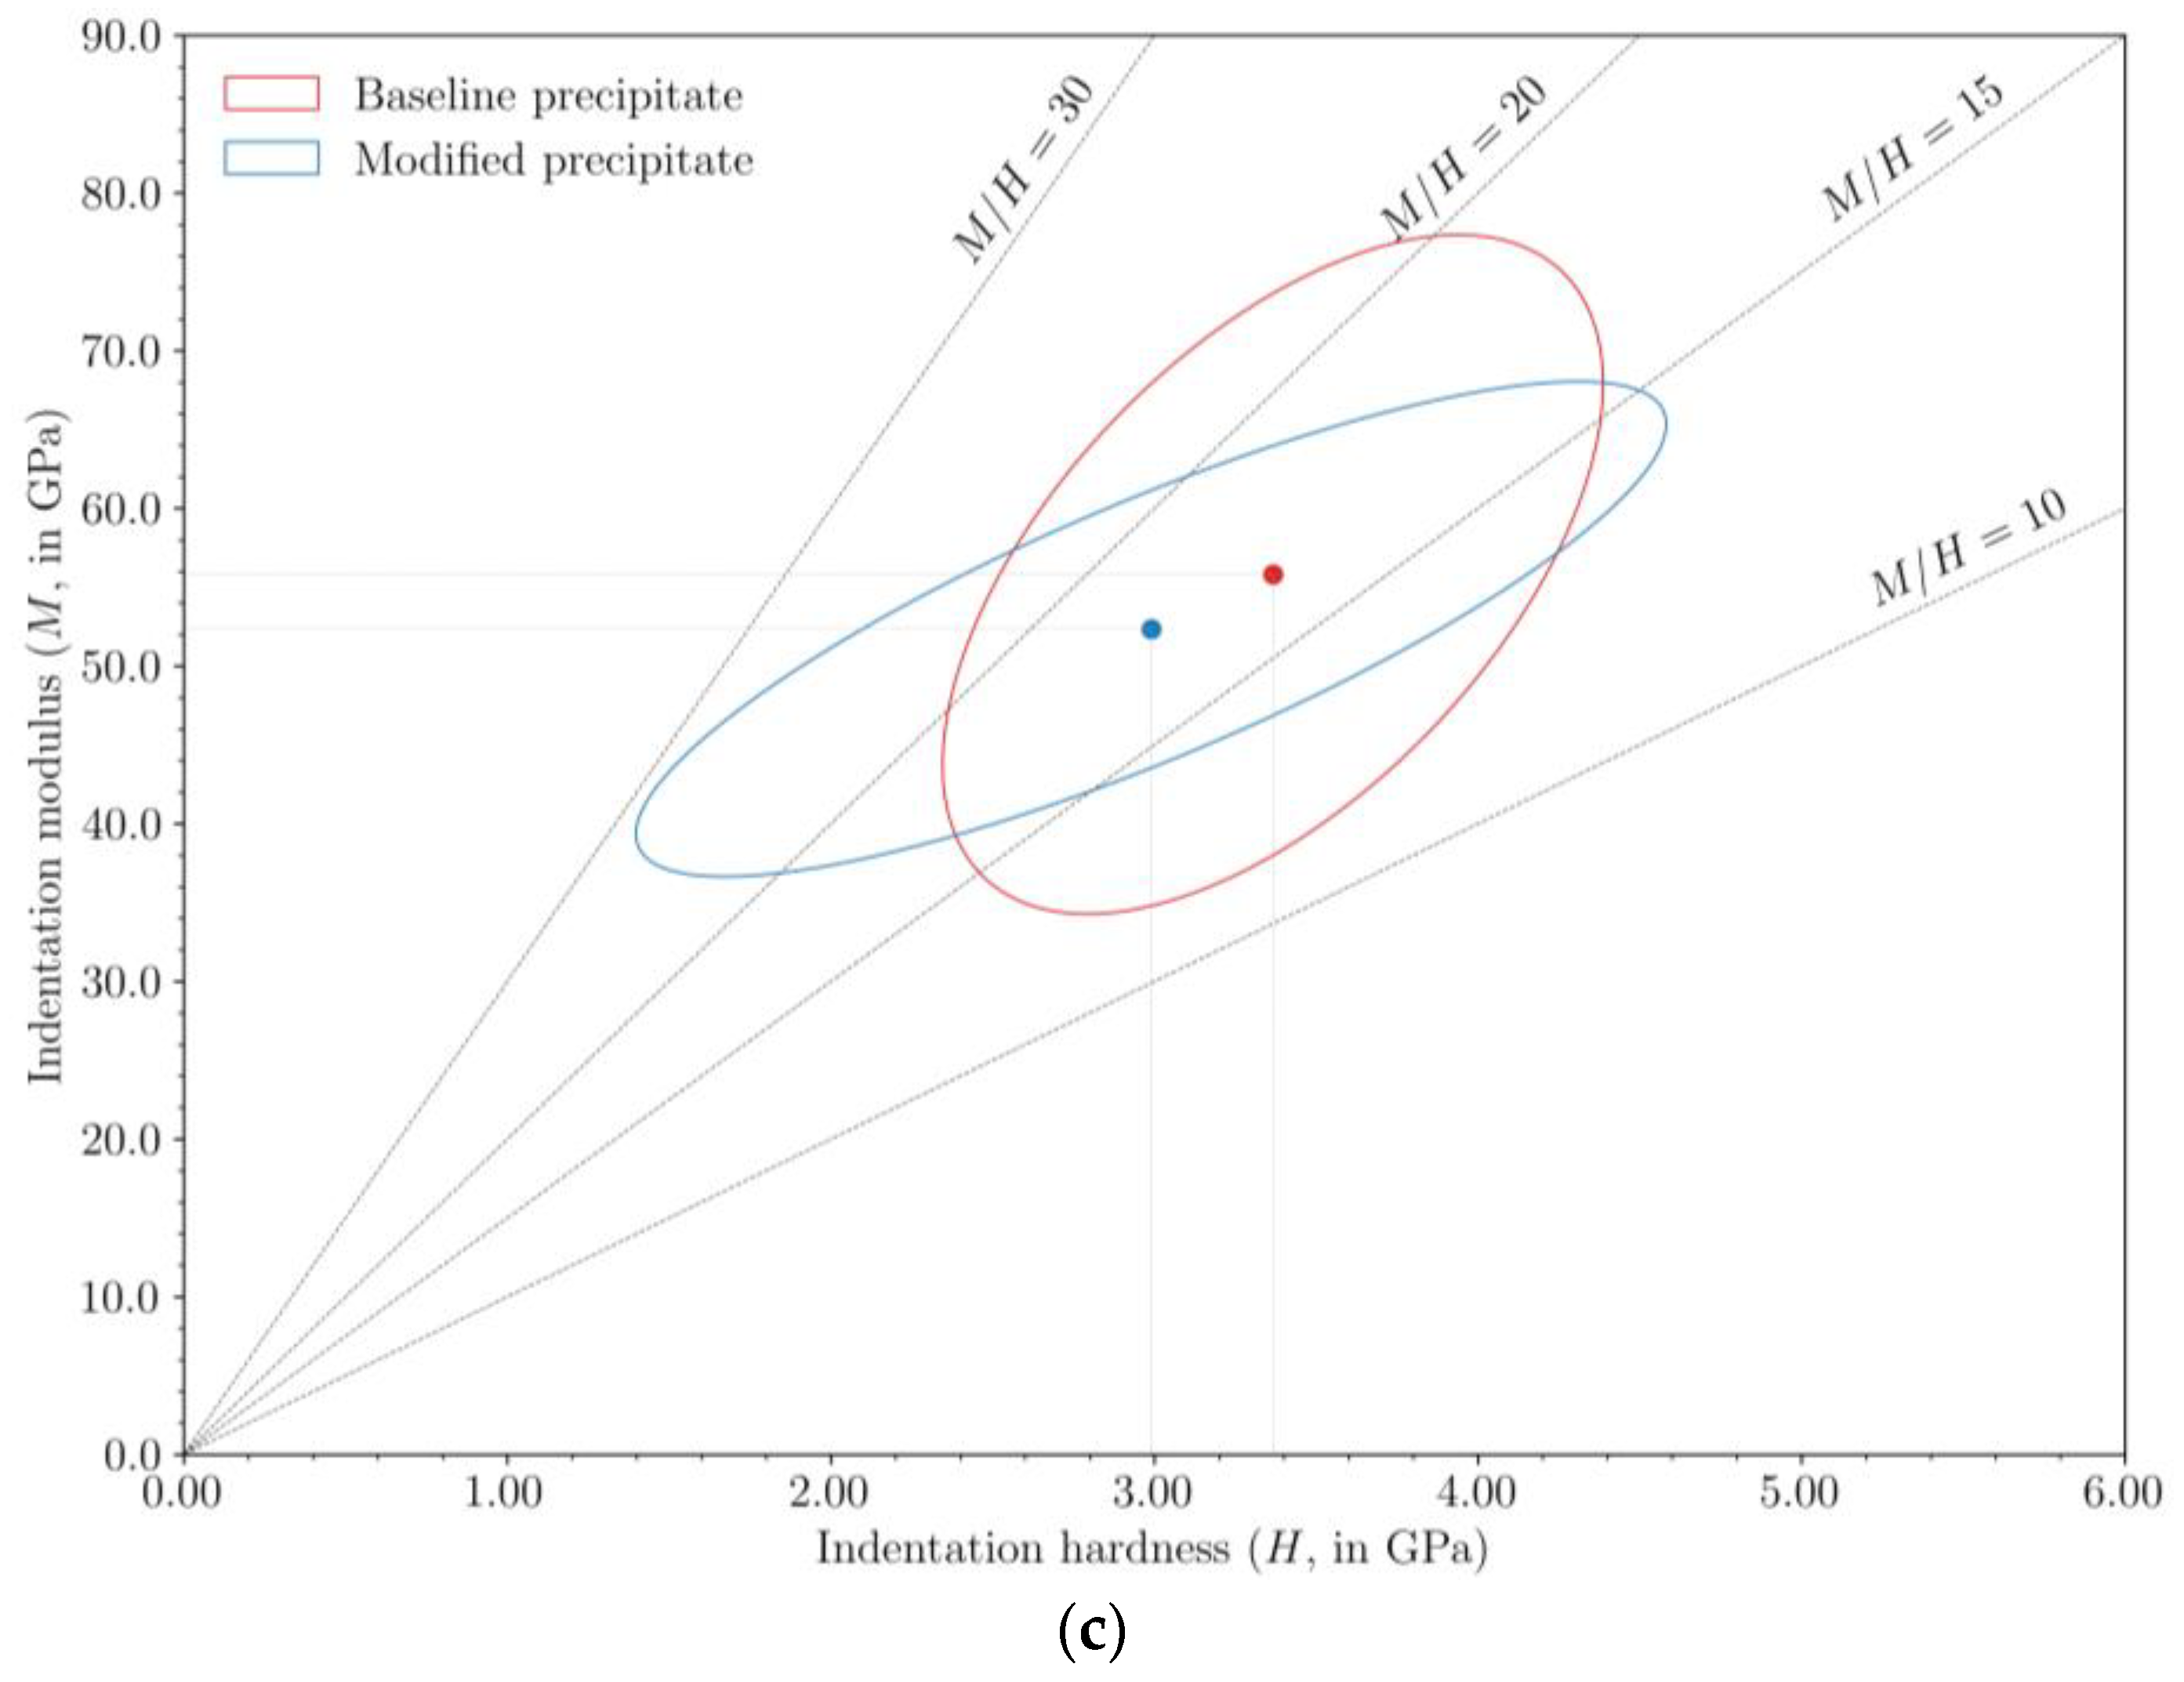
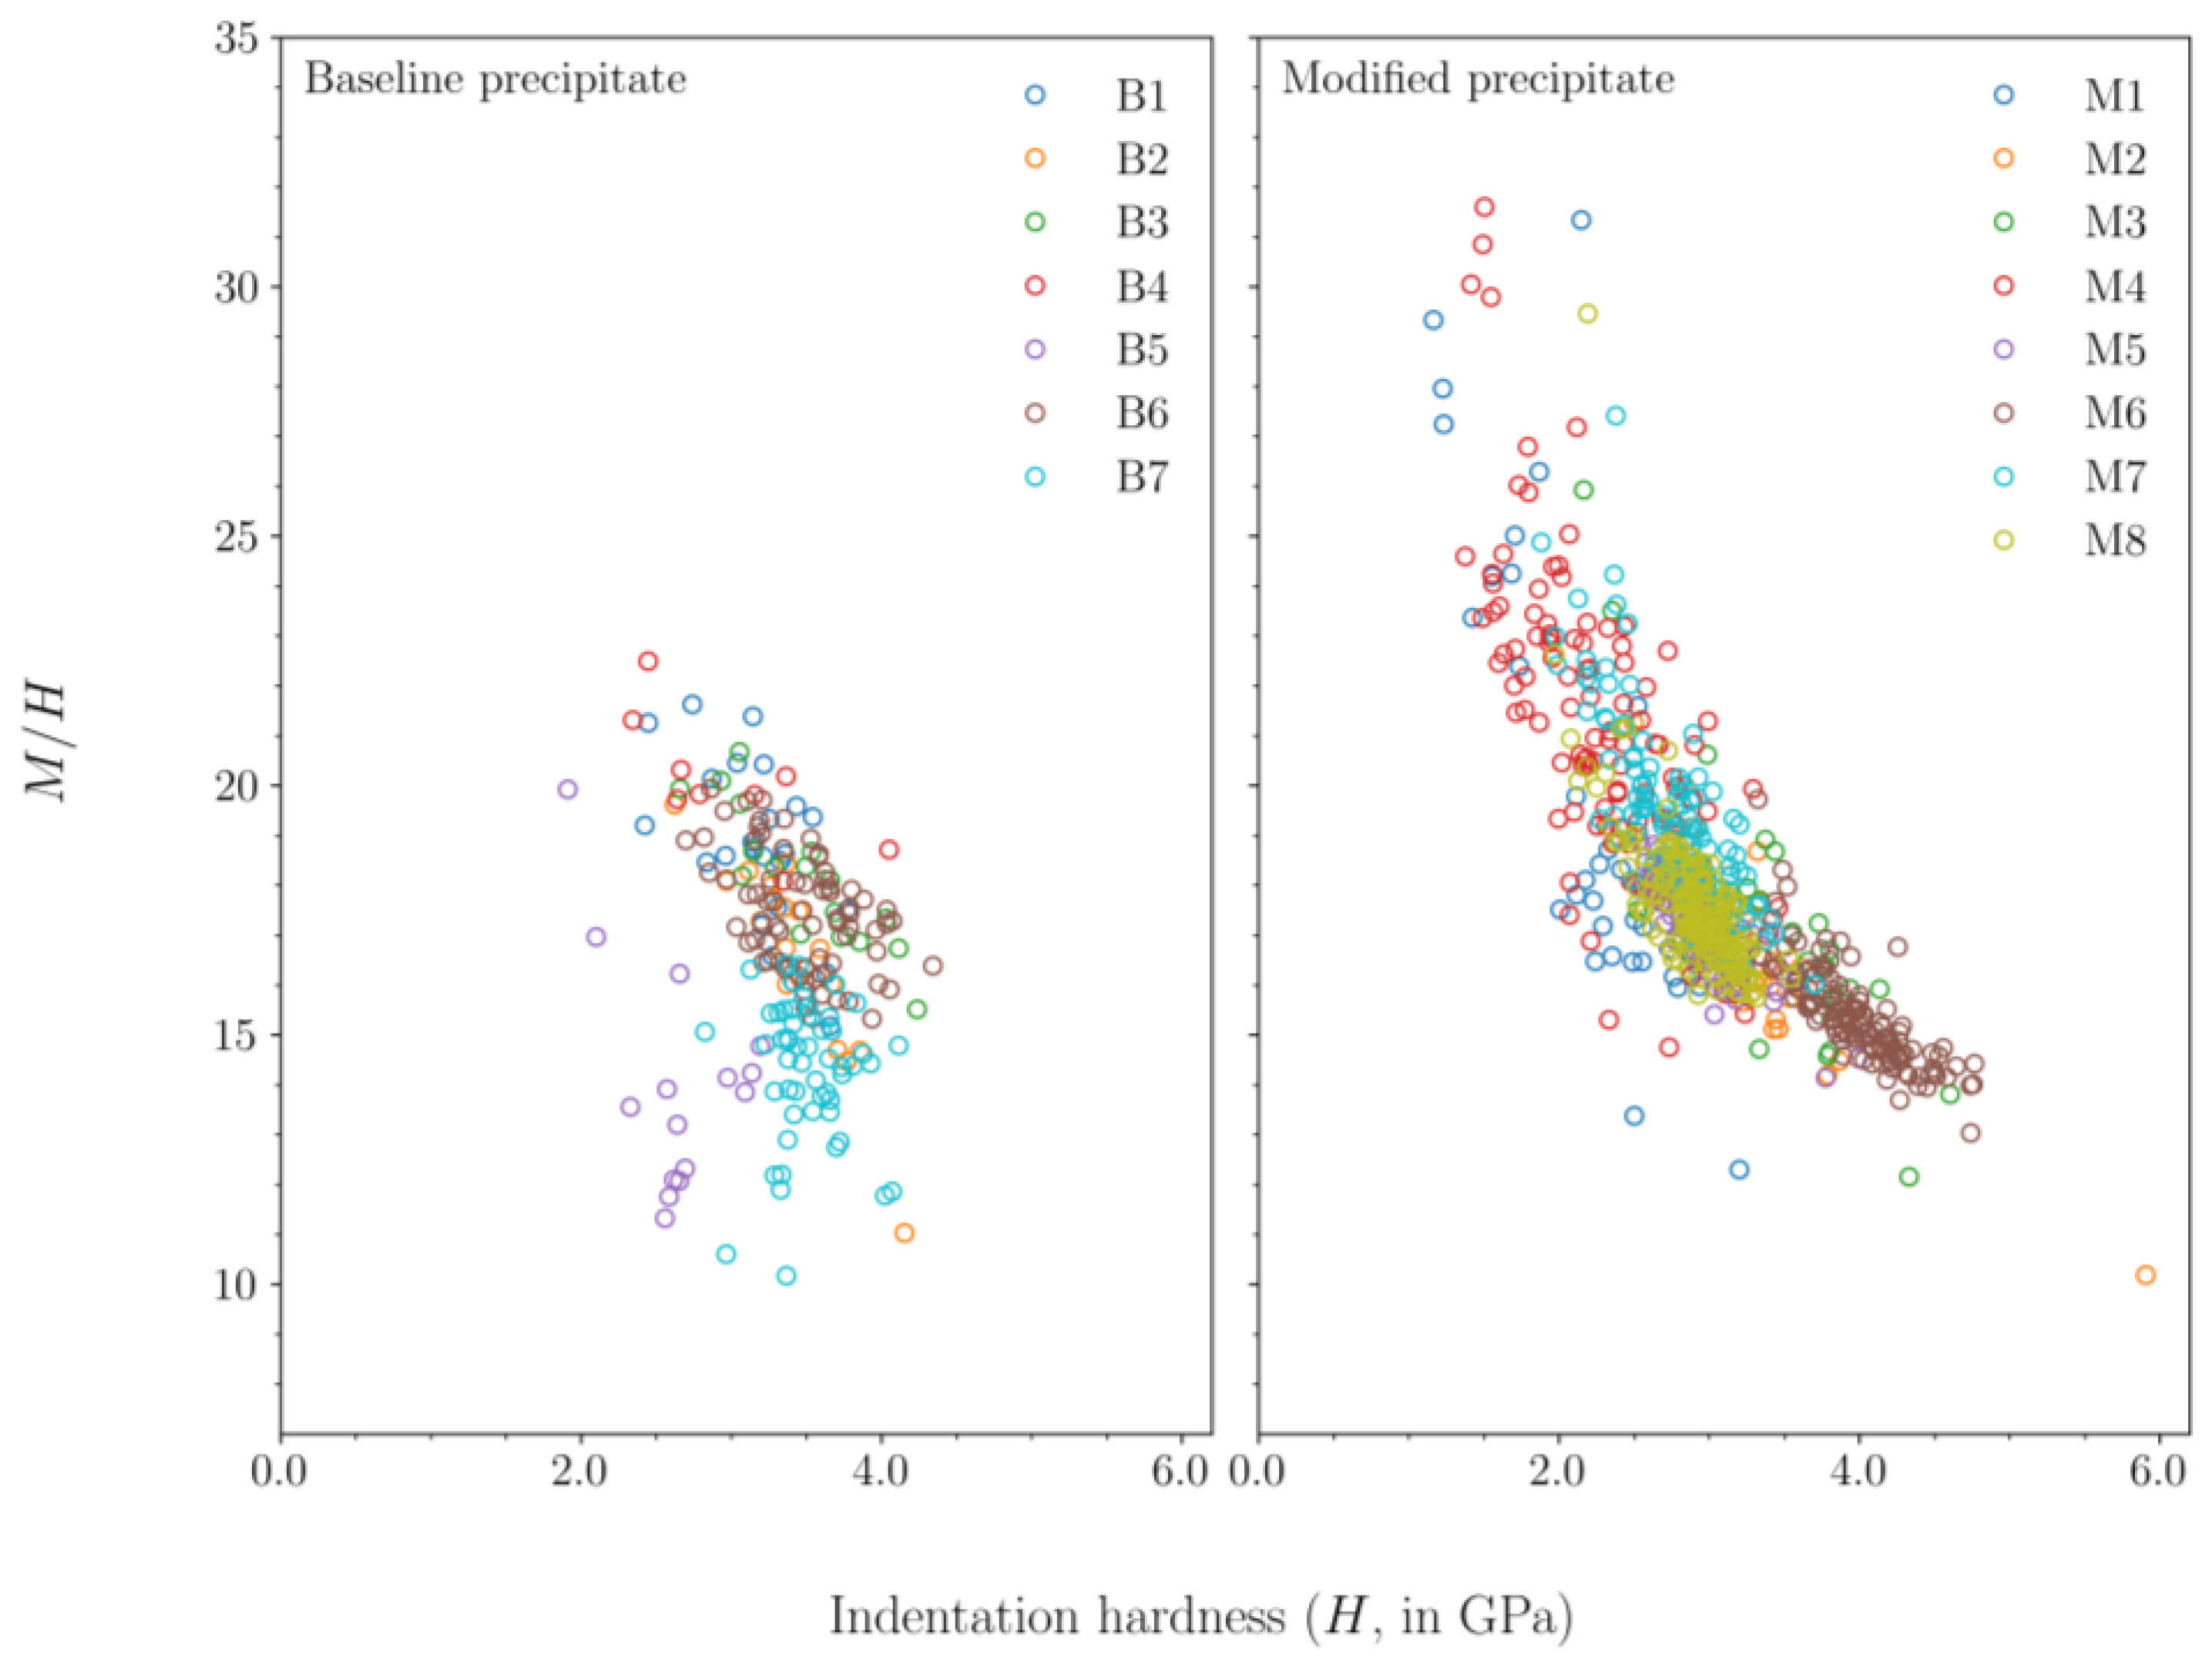
3.2. Mechanical Properties

Table 2 presents a summary of the indentation hardness and modulus of calcite reported in the literature. There is some variability in the reported indentation properties, possibly due to differences in the calcite crystal face tested and variability in sample preparation techniques. The measured indentation hardness and modulus of the baseline and modified precipitates is summarized in Table 3 and Table 4, respectively. The M, H data cluster and the corresponding 95% prediction ellipses for the baseline and modified precipitates are plotted in Figure 5. In general, the variability in the indentation properties of the baseline and modified precipitates can be attributed to: (i) differences in the crystal face tested; (ii) variability associated with sample preparation (e.g., scratches and asperities on the particle surface resulting from grinding/polishing); and (iii) intrinsic variability in the particle structure and composition (e.g., crystallite sizes, grain boundary effects, ion substitution, adsorption/occlusion of organic compounds from milk and/or urease source). In both the baseline and the modified precipitates, the indentation hardness and modulus were positively correlated. The computed correlation coefficients for the particles of the baseline and modified precipitates are listed in Table 3 and Table 4, respectively.
Several particles of both the baseline and the modified precipitate have a higher hardness compared with the values reported in Table 2. Typically, plastic deformation in single calcite crystals occurs via dislocation motion. Single calcite crystals can be hardened by inhibiting dislocation motion via: (i) ion (e.g., Mg2+) substitution [24]; and (ii) occlusion of organic compounds at relatively low volume fractions [20,25]. Additionally, in polycrystalline particles (as is the case with the baseline and modified precipitates), the grain boundaries can also significantly impede dislocation motion, resulting in increased hardness.
To investigate the question of whether the higher strengths observed in sands treated by the modified EICP treatment could be linked to possible improvements in the mechanical properties of the precipitates, we considered the ratio of the indentation modulus over indentation hardness (M/H), which is directly correlated to ductility. The M/H ratio has been used to evaluate the ductility characteristics of many different materials, including cement paste [26], clay minerals [27], and glass [28]. For purely elastic materials, the value of M/H depends only on indenter geometry and equals 2tanθIN, where θIN is the half-cone angle of the indenter (for Berkovich tip, θIN = 70.32°, 2tanθIN = 5.59). The value of M/H of elastoplastic materials is greater than 2tanθIN (with no theoretical maximum). Qomi et al., [29] interpreted M/H as proportional to the inverse of a yield strain, i.e., high M/H indicates a material of low elastic strain limit. Further, Hoover and Ulm [26] suggested that as M/H increases, a greater proportion of energy is dissipated as plastic flow (rather than stored as elastic potential energy), resulting in higher ductility. Ductile materials typically have a higher resistance to crack propagation due to several reasons (e.g., delayed onset to cracking, more stress transfer, larger fracture process zones, etc.). Figure 6 plots the values of M/H vs. H for the baseline and modified precipitates. In both precipitates, soft regions tended to have a higher M/H. However, some particles of the modified precipitate (e.g., Particle 1, 4, and 7) had a lower average hardness and covered a wider range of hardness values. These particles were softer than the baseline precipitate and had a significantly higher M/H, inferring that the modified precipitate had a higher ductility. A related observation regarding the ductility of the precipitates is that the indentation curves of the baseline precipitate exhibited “pop-ins” (i.e., irregular loading response with small jump(s) in displacement due to brittle fracture) more frequently compared with the modified precipitate. Even in particles of modified precipitate that had a relatively low M/H (such as Particle 6), pop-ins occurred less frequently compared with particles of the baseline precipitate. Both the presence of particles with high M/H ratio and the relative absence of pop-ins in the modified precipitate suggest that the modified precipitate is more cohesive and has a higher average ductility compared to the baseline precipitate.

3.3. Role of Casein in EICP

Casein proteins in modified EICP solution are significantly impacted by the interaction between various EICP reagents and the solvent water. Chaotropic solutes (such as urea) break hydrogen bonds between water molecules and suppress water structure formation; this facilitates the dispersion of casein micelles in the EICP solution. Kosmotropic solutes, on the other hand, are well hydrated and enhance the hydrogen bond network in water; this facilitates the dehydration of casein micelles, followed by hydrophobic aggregation (“curdling”) and precipitation (“salting out”). The products of urea hydrolysis, CO32− (aq), HCO3 (aq), and NH4+ (aq), are kosmotropic [30]. As a result, once a sufficiently high concentration of urea is hydrolyzed, the EICP solution transforms from chaotropic to kosmotropic, resulting in the aggregation (and precipitation) of casein.
Rodriguez-Blanco et al., [31] showed that the crystallization of amorphous calcium carbonate (ACC) into calcite is a two-step process: (i) dehydration of ACC followed by an internal structural reorganization into vaterite; and (ii) dissolution of vaterite followed by reprecipitation on the surface of growing calcite crystals. Casein slows down both these steps by stabilizing ACC and vaterite. The predominant mechanism of stabilization is via phosphoserine residues, which are present in all caseins. Phosphoproteins can induce (i.e., nucleate) ACC precipitation and stabilize the ACC precipitate, i.e., slow down crystallization to other polymorphs [32,33]. Liu et al., [34,35] studied the precipitation of calcium carbonate in the presence of casein. These investigators showed that the phosphoserine residues in casein stabilized ACC and vaterite by binding to the Ca2+ ions at the surface of these minerals. However, despite the stabilizing effect of casein, the conversion to calcite was favored under certain reaction conditions, including: (i) high supersaturation; (ii) excess dissolved inorganic carbon (compared to Ca2+); and (iii) high temperature. In addition, casein at low concentrations was ineffective in stabilizing ACC and vaterite. Based on this review, we postulate that in the initial stages of modified EICP, the precipitated ACC and vaterite is stabilized by casein. However, as the ureolysis progresses, the ionic activity product {Ca2+}{CO32−} increases, resulting in increased supersaturation with respect to CaCO3 minerals. These reaction conditions may facilitate the recrystallization of ACC and vaterite to calcite.

3.4. EICP in Porous Media

The precipitation conditions in clean granular media (e.g., Ottawa 20–30 sand) are somewhat different compared with a reaction in pure liquid conditions (such as in a beaker or, as in this study, a centrifuge tube). Pore networks typically have a much higher surface area-to-volume ratio compared to a reaction vessel. As a result, a greater fraction of casein in the EICP solution is adsorbed to the porous medium (or filtered by the medium during injection of EICP solution). The filtered casein typically accumulates around particle contacts or at the pore throats. The casein that remains in the pore solution is precipitated during the course of ureolysis (due to the increased concentration of kosmotropic products) and is deposited by gravity on the sand grains. Subsequently, the precipitated casein micelles dehydrate, clump together, and adhere to the sand. These casein micelles influence the CaCO3 precipitation by facilitating nucleation and slowing down the recrystallization of ACC and vaterite to calcite. However, it is improbable that the casein micelles directly adsorbed to the sand (via physisorption or chemisorption) sequester Ca2+ ions (to nucleate CaCO3) or bind to Ca2+ ions on the surface of ACC/vaterite (to stabilize these intermediates). As a result, the “effective” concentration of casein available to regulate CaCO3 precipitation in granular media is less compared with the reaction in pure liquid conditions. This variation in the reaction conditions may result in changes to the mineralogy and crystal structure of the precipitate (compared with precipitation in a reaction vessel). For example, Krishnan et al., [36] observed calcite, but not vaterite, in X-ray diffractograms of Ottawa 20–30 sand treated with the modified EICP solution.
As observed in Figure 6, the modified precipitate has particles that are significantly softer (and more ductile) compared with the baseline precipitate. The softness of these particles is likely due to the presence of casein at the surface of polycrystals, in between polycrystals, or at the grain boundaries of a polycrystal. Modified precipitate in granular media will also be a composite of casein and CaCO3. In this case, some of the casein will be adsorbed to the sand grains and the remaining casein will be adhered at the surface of the calcite polycrystal or in between the polycrystal and the sand grain. Based on this argument, we postulate that the modified precipitate in porous media will also have a higher ductility compared with the baseline precipitate in porous media. However, the ductility of modified precipitate in porous media will be lower compared with the ductility of modified precipitate in pure liquid conditions (due to the lower “effective” casein concentration).
Biocemented sand loaded in compression may fail in three different ways: (i) shear failure; (ii) tensile cracking; (iii) failure due to stress concentrations at the boundary (where the specimen makes contact with the loading platens). In all cases, at the particle scale, failure occurs due to fracture within the binding precipitate or at the sand–precipitate interface. In this context, improved ductility in the precipitate, or in the “adhesion zone” between the precipitate and the sand grains, results in higher resistance to crack propagation and can increase the strength of the biocemented sand specimen. Consequently, in addition to preferential precipitation at interparticle contacts, an increase in ductility of the precipitate may also be a contributing factor to the high UCS at low carbonate contents observed by Almajed et al., [5] and Martin et al., [6] when testing sands treated by the modified EICP solution.

4. Conclusions

The addition of nonfat dry milk to the baseline EICP solution results in significant changes to the crystal habit and structure of the calcium carbonate precipitate. Mineral characterization showed that precipitates from both the baseline and modified solutions predominantly comprised calcite. However, broader peaks in the X-ray diffractogram and Raman spectra of the modified precipitate indicated that the modified precipitate had a smaller average crystallite size and greater short-range atomic disorder. Both the baseline and modified precipitate had a higher average indentation hardness and a lower indentation modulus compared with the values for single calcite crystals reported in the literature. The modified precipitate had a higher ductility compared with the baseline precipitate, as evidenced by the higher average M/H ratio and smaller frequency of pop-ins during indentation loading. The increased ductility implies greater resistance to crack propagation in the precipitate, which, in addition to preferential precipitation at interparticle contacts, might be instrumental in the development of high strengths at low carbonate contents in sands treated by the modified EICP solution. Further investigations into the mineralogy of enzyme-induced carbonate precipitates in porous media, such as determination of the preferred orientation (if any) of crystallites, and evaluation of the distribution of casein in the polycrystals of modified precipitate can provide additional insights into the strengthening mechanisms of the modified EICP solution.

Supplementary Materials

The following supporting information can be downloaded at: https://0-www-mdpi-com.brum.beds.ac.uk/article/10.3390/cryst12070995/s1: (A) experimental details of Rietveld refinement, Raman microspectroscopy, and nanoindentation; (B) Lorentzian fitting curves to the measured spectral lines of the Raman spectra; (C) load-displacement curves for indents, images of indentation footprints, and scatter plots of indentation modulus vs. indentation hardness for each particle; (D) methodology of computation of prediction ellipses.

Author Contributions

Conceptualization, V.K.; funding acquisition, L.A.v.P., C.G.H. and E.K.J.; investigation, V.K., H.K.T., M.K., L.A.v.P. and C.G.H.; methodology, V.K., H.K.T., M.K., L.A.v.P. and C.G.H.; project administration, E.K.J.; visualization, J.S.; writing—original draft, V.K.; writing—review and editing, H.K.T., M.K., L.A.v.P., C.G.H., J.S. and E.K.J. All authors have read and agreed to the published version of the manuscript.

Funding

The material in this research study is based upon work primarily supported by the National Science Foundation (NSF) under NSF Cooperative Agreement No. EEC-1449501. The authors are grateful for the NSF support. Any opinions, findings, and conclusions or recommendations expressed in this material are those of the authors and do not necessarily reflect those of the NSF. Christian G. Hoover and Maryam Kazembeyki would also like to thank support from the National Science Foundation under NSF Grant No. CMMI-1826050.

Institutional Review Board Statement

Not applicable.

Informed Consent Statement

Not applicable.

Data Availability Statement

All data generated or analyzed during this study are included in this published article (and its supplementary information files).

Acknowledgments

The authors acknowledge the use of facilities within the Eyring Materials Center (EMC) at Arizona State University. The EMC is supported in part by NSF Cooperative Agreement No. ECCS-1542160.

Conflicts of Interest

The authors declare no conflict of interest.

References

  1. Nemati, M.; Voordouw, G. Modification of porous media permeability, using calcium carbonate produced enzymatically in situ. Enzyme Microb. Technol. 2003, 33, 635–642. [Google Scholar] [CrossRef]
  2. Larsen, J.; Poulsen, M.; Lundgaard, T.; Agerbaek, M. Plugging of fractures in chalk reservoirs by enzyme-induced calcium carbonate precipitation. SPE Prod. Oper. 2008, 23, 478–483. [Google Scholar] [CrossRef]
  3. Bang, S.S.; Bang, S.; Frutiger, S.; Nehl, L.M.; Comes, B.L. Application of novel biological technique in dust suppression. In Proceedings of the Transportation Research Board 88th Annual Meeting Compendium of Papers, Transportation Research Board, Washington, DC, USA, 11–15 January 2009. [Google Scholar]
  4. Hamdan, N.; Kavazanjian, E., Jr. Enzyme-induced carbonate mineral precipitation for fugitive dust control. Géotechnique 2016, 66, 546–555. [Google Scholar] [CrossRef]
  5. Almajed, A.; Khodadadi Tirkolaei, H.; Kavazanjian, E., Jr.; Hamdan, N. Enzyme induced biocementated sand with high strength at low carbonate content. Sci. Rep. 2019, 9, 1135. [Google Scholar] [CrossRef] [Green Version]
  6. Martin, K.; Khodadadi Tirkolaei, H.; Kavazanjian, E., Jr. Enhancing the strength of granular material with a modified enzyme-induced carbonate precipitation (EICP) treatment solution. Constr. Build. Mater. 2021, 271, 121529. [Google Scholar] [CrossRef]
  7. Khodadadi Tirkolaei, H.; Javadi, N.; Krishnan, V.; Hamdan, N.; Kavazanjian, E., Jr. Crude urease extract for biocementation. J. Mater. Civil Eng. 2020, 32, 04020374. [Google Scholar] [CrossRef]
  8. Oliver, W.C.; Pharr, G.M. Measurement of hardness and elastic modulus by instrumented indentation: Advances in understanding and refinements to methodology. J. Mater. Res. 2004, 19, 3–20. [Google Scholar] [CrossRef]
  9. Oliver, W.C.; Pharr, G.M. An improved technique for determining hardness and elastic modulus using load and displacement sensing indentation experiments. J. Mater. Res. 1992, 7, 1564–1583. [Google Scholar] [CrossRef]
  10. Braissant, O.; Cailleau, G.; Dupraz, C.; Verrecchia, E.P. Bacterially induced mineralization of calcium carbonate in terrestrial environments: The role of exopolysaccharides and amino acids. J. Sediment Res. 2003, 73, 485–490. [Google Scholar] [CrossRef]
  11. Jimenez-Lopez, C.; Rodriguez-Navarro, A.; Dominguez-Vera, J.M.; Garcia-Ruiz, J.M. Influence of lysosyme on the precipitation of calcium carbonate: A kinetic and morphologic study. Geochim. Cosmochim. Acta 2003, 67, 1667–1676. [Google Scholar] [CrossRef]
  12. Kim, Y.-Y.; Schenk, A.S.; Ihli, J.; Kulak, A.N.; Hetherington, N.B.J.; Tang, C.C.; Schmahl, W.W.; Griesshaber, E.; Hyett, G.; Meldrum, F.C. A critical analysis of calcium carbonate mesocrystals. Nat. Commun. 2014, 5, 4341. [Google Scholar] [CrossRef] [PubMed] [Green Version]
  13. Kabalah-Amitai, L.; Mayzel, B.; Kauffmann, Y.; Fitch, A.N.; Bloch, L.; Gilbert, P.U.P.A.; Pokroy, B. Vaterite crystals contain two interspersed crystal structures. Science 2013, 340, 454–457. [Google Scholar] [CrossRef] [PubMed] [Green Version]
  14. Demichelis, R.; Raiteri, P.; Gale, J.D.; Dovesi, R. The multiple structures of vaterite. Cryst. Growth Des. 2013, 13, 2247–2251. [Google Scholar] [CrossRef]
  15. Christy, A.G. A review of the structures of vaterite: The impossible, the possible, and the likely. Cryst. Growth Des. 2017, 17, 3567–3578. [Google Scholar] [CrossRef] [Green Version]
  16. Holt, C. The Milk Salts and Their Interaction with Casein. In Advanced Dairy Chemistry Volume 3: Lactose, Water, Salts and Vitamins, 2nd ed.; Fox, P.F., Ed.; Springer: Boston, MA, USA, 1997; pp. 233–256. ISBN 978-1-4757-4409-5. [Google Scholar] [CrossRef]
  17. Zügner, S.; Marquardt, K.; Zimmermann, I. Influence of nanomechanical crystal properties on the comminution process of particulate solids in spiral jet mills. Eur. J. Pharm. Biopharm. 2005, 62, 194–201. [Google Scholar] [CrossRef]
  18. Merkel, C.; Deuschle, J.; Griesshaber, E.; Enders, S.; Steinhauser, E.; Hochleitner, R.; Brand, U.; Schmahl, W.W. Mechanical properties of modern calcite- (Mergerlia truncata) and phosphate-shelled brachiopods (Discradisca stella and Lingula anatina) determined by nanoindentation. J. Struct. Biol. 2009, 168, 396–408. [Google Scholar] [CrossRef] [PubMed]
  19. Kim, Y.-Y.; Ganesan, K.; Yang, P.; Kulak, A.N.; Borukhin, S.; Pechook, S.; Ribeiro, L.; Kröger, R.; Eichhorn, S.J.; Armes, S.P.; et al. An artificial biomineral formed by incorporation of copolymer micelles in calcite crystals. Nat. Mater. 2011, 10, 890–896. [Google Scholar] [CrossRef] [PubMed]
  20. Kunitake, M.E.; Mangano, L.M.; Peloquin, J.M.; Baker, S.P.; Estroff, L.A. Evaluation of strengthening mechanisms in calcite single crystals from mollusk shells. Acta. Biomater. 2013, 9, 5353–5359. [Google Scholar] [CrossRef]
  21. Ren, D.; Meyers, M.A.; Zhou, B.; Feng, Q. Comparative study of carp otolith hardness: Lapillus and asteriscus. Mater. Sci. Eng. C 2013, 33, 1876–1881. [Google Scholar] [CrossRef]
  22. Kim, Y.-Y.; Semsarilar, M.; Carloni, J.D.; Cho, K.R.; Kulak, A.N.; Polishchuk, I.; Hendley IV, C.T.; Smeets, P.J.M.; Fielding, L.A.; Pokroy, B.; et al. Structure and properties of nanocomposites formed by the occlusion of block copolymer worms and vesicles within calcite crystals. Adv. Funct. Mater. 2016, 26, 1382–1392. [Google Scholar] [CrossRef] [Green Version]
  23. Kabacińska, Z.; Yate, L.; Wencka, M.; Krzyminiewski, R.; Tadyszak, K.; Coy, E. Nanoscale effects of radiation (UV, X-ray, and γ) on calcite surfaces: Implications for its mechanical and physico-chemical properties. J. Phys. Chem. C 2017, 121, 13357–13369. [Google Scholar] [CrossRef]
  24. Kunitake, M.E.; Baker, S.P.; Estroff, L.A. The effect of magnesium substitution on the hardness of synthetic and biogenic calcite. MRS. Commun. 2012, 2, 113–116. [Google Scholar] [CrossRef] [Green Version]
  25. Kim, Y.-Y.; Carloni, J.D.; Demarchi, B.; Sparks, D.; Reid, D.G.; Kunitake, M.E.; Tang, C.C.; Duer, M.J.; Freeman, C.L.; Pokroy, B.; et al. Tuning hardness in calcite by incorporation of amino acids. Nat. Mater. 2016, 15, 903–910. [Google Scholar] [CrossRef] [PubMed] [Green Version]
  26. Hoover, C.G.; Ulm, F.-J. Experimental chemo-mechanics of early-age fracture properties of cement paste. Cem. Concr. Res. 2015, 75, 42–52. [Google Scholar] [CrossRef]
  27. Berthonneau, J.; Hoover, C.G.; Grauby, O.; Baronnet, A.; Pellenq, R.J.-M.; Ulm, F.-J. Crystal-chemistry control of the mechanical properties of 2:1 clay minerals. Appl. Clay Sci. 2017, 143, 387–398. [Google Scholar] [CrossRef]
  28. Kazembeyki, M.; Bauchy, M.; Hoover, C.G. New insights into the indentation size effect in silicate glasses. J. Non-Cryst. Solids 2019, 521, 119494. [Google Scholar] [CrossRef]
  29. Qomi, M.J.A.; Krakowiak, K.J.; Bauchy, M.; Stewart, K.L.; Shahsavari, R.; Jagannathan, D.; Brommer, D.B.; Baronnet, A.; Buehler, M.J.; Yip, S.; et al. Combinatorial molecular optimization of cement hydrates. Nat. Commun. 2014, 5, 4960. [Google Scholar] [CrossRef]
  30. Mazzini, V.; Craig, V.S.J. What is the fundamental ion-specific series for anions and cations? Ion specificity in standard partial molar volumes of electrolytes and electrostriction in water and non-aqueous solvents. Chem. Sci. 2017, 8, 7052–7065. [Google Scholar] [CrossRef] [Green Version]
  31. Rodriguez-Blanco, J.D.; Shaw, S.; Benning, L.G. The kinetics and mechanisms of amorphous calcium carbonate (ACC) crystallization to calcite, via vaterite. Nanoscale 2011, 3, 265–271. [Google Scholar] [CrossRef]
  32. Bentov, S.; Weil, S.; Glazer, L.; Sagi, A.; Berman, A. Stabilization of amorphous calcium carbonate by phosphate rich organic matrix proteins and by single phosphoamino acids. J. Struct. Biol. 2010, 171, 207–215. [Google Scholar] [CrossRef]
  33. Alvares, K. The role of acidic phosphoproteins in biomineralization. Connect. Tissue Res. 2014, 55, 34–40. [Google Scholar] [CrossRef] [PubMed] [Green Version]
  34. Liu, Y.; Cui, Y.J.; Guo, R. Amphiphilic phosphoprotein-controlled formation of amorphous calcium carbonate with hierarchical superstructure. Langmuir 2012, 28, 6097–6105. [Google Scholar] [CrossRef] [PubMed]
  35. Liu, Y.; Cui, Y.J.; Mao, H.Y.; Guo, R. Calcium carbonate crystallization in the presence of casein. Cryst. Growth Des. 2012, 12, 4720–4726. [Google Scholar] [CrossRef]
  36. Krishnan, V.; Khodadadi Tirkolaei, H.; Martin, K.; Hamdan, N.; van Paassen, L.A.; Kavazanjian, E., Jr. Variability in the unconfined compressive strength of EICP-treated ‘standard’ sand. J. Geotech. Geoenviron. Eng. 2021, 147, 06021001. [Google Scholar] [CrossRef]
Figure 1. (ac) SEM images of the baseline precipitate: (a) Imbricated rhombohedral clusters of calcite polycrystals. Smaller overgrown crystals are observed predominantly along corners and edges of the calcite crystal substrate. (b) Elongated (with curved surfaces) and spherulitic calcite crystals. (c) Magnified image of (b) showing overgrown needle fiber calcite. (df) SEM images of the modified precipitate: (d) Aggregate of spherulitic calcite crystals. (e) Coalesced calcite spherulites at higher magnification. Deposits of organic solids (from milk, urease source) are observed on the grain (red arrows). (f) Broken particle of spherulitic calcite or vaterite. Radial groove-like features can be seen in the interior section of the particle.
Crystals 12 00995 g001
Figure 2. (a) X-ray diffractograms of the baseline and modified precipitate (C—calcite peaks; V—vaterite peaks). (b) Line broadening of calcite (104) peak in baseline and modified precipitates. The markers indicate experimentally measured intensities normalized by the maximum fitted intensity (using Rietveld refinement) of the calcite (104) diffraction line. Further details are presented in Section A of Supplementary Information.
Crystals 12 00995 g002
Figure 3. (a) Representative Raman spectra of the baseline and modified precipitates (see Section A of Supplementary Information for complete spectra). Calcite vibrational modes: (A, B) lattice modes; (C) ν4: doubly degenerate in-plane bending; (D) ν1: nondegenerate symmetric stretching; (E) ν3: doubly degenerate asymmetric stretching; (F) ν1 + ν4. Note that the ν1 mode of calcite is IR-inactive and the ν2 mode (nondegenerate out-of-plane bending) is Raman inactive. (b) Positions and widths of calcite peaks in the Raman spectra acquired from five locations each in the baseline and modified precipitates. Red markers represent the baseline precipitate and blue markers represent the modified precipitate.
Crystals 12 00995 g003aCrystals 12 00995 g003b
Figure 4. FTIR spectra of the baseline and modified precipitates. Baseline precipitate peaks: (a) 711.6 cm−1: calcite (ν4); (b) 869.7 cm−1: calcite (ν2); (c) 1088 cm−1: calcite (combination band); (d) 1383 cm−1: calcite (ν3); (e) 1624 cm−1: calcite (combination band); (f) 1795 cm−1: calcite (ν1 + ν4); (g) 2513 cm−1: calcite (ν1 + ν3). Modified precipitate peaks: (a) 568.9 cm−1: calcium phosphates (HPO42-/PO43-, ν4); (b) 709.7 cm−1: calcite (ν4); (c) 742.5 cm−1: vaterite (ν4); (d) 869.7 cm−1: calcite (ν2) (and vaterite (ν2)); (e) 1018 cm−1, 1045 cm−1, 1078 cm−1, 1151 cm−1: calcium phosphates (HPO42−/PO43−, ν3) and/or lactose (C–O stretch); (f) 1383 cm−1: calcite (ν3) (and vaterite (ν3)); (g) 1624 cm−1: calcite (combination band); (h) 1641 cm−1: milk protein (amide I band); (i) 1658 cm−1: water (H–O–H scissor); (j) 1793 cm−1: calcite (ν1 + ν4); (k) 2511 cm−1: calcite (ν1 + ν3); (l) 2924 cm−1: lactose (C–H stretch); (m) 3300 cm−1: water (O–H asymmetric stretch) and/or lactose (O–H stretch).
Crystals 12 00995 g004
Figure 5. Measured indentation hardness and modulus of: (a) baseline precipitate; and (b) modified precipitate. Legend shows the particle number. Scatter plots of indentation modulus vs. indentation hardness for each particle are presented in Section C of Supplementary Information. (c) Comparison of 95% prediction ellipses derived from the M, H data cluster of the baseline and modified precipitates.
Crystals 12 00995 g005aCrystals 12 00995 g005b
Figure 6. Plots of M/H vs. H for the baseline and modified precipitates. Legend shows particle number.
Crystals 12 00995 g006
Table 1. Results of Rietveld refinement.
ParameterBaseline PrecipitateModified Precipitate
Crystallite size (nm)411(5)149(2)
Microstrain (%)0.047(1)0.046(3)
Calcite unit cell a (Å)4.98774(11)4.98939(17)
Calcite unit cell c (Å)17.0659(5)17.0770(8)
Table 2. Indentation properties of calcium carbonate reported in the literature.
ReferenceDescriptionNo. of IndentsPmax (mN)H (GPa)M (GPa)
Zügner et al., [17]Geological calcite (ground to diameter 500 μm)NA0.20–1.02.8–3.483–88 a
Merkel et al., [18]Inorganic calcite (single crystal, (104) plane)NANote b2.0–2.862–78 c
Kim et al., [19]Synthetic calcite (single crystal, (104) plane)10Note d2.6 ± 0.189.9 ± 12.4 e
Kunitake et al., [20]Geological calcite (Iceland spar, single crystal)
(001) face, 0° azimuth between Berkovich tip and crystal face92.52.30 ± 0.1476.9 ± 3.1
(001) face, 60° azimuth between Berkovich tip and crystal face92.52.46 ± 0.0367.5 ± 1.1
(104) face, average of azimuths from 0° to 120°632.52.54 ± 0.0788.1 ± 1.7
Ren et al., [21]Pure vaterite crystals in an organic matrix31303.2 ± 0.1957 ± 4.0
Kim et al., [22]Synthetic calcite (single crystal)9102.45 ± 0.2491.1 ± 5.7
Kabacińska et al., [23]Single calcite crystal from Wojcieszów quarry, Poland36102.74 ± 0.1770.23 ± 1.35 f
a Reported values correspond to Young’s modulus. Poisson’s ratio of calcite not reported. b Displacement-controlled indents performed to a maximum depth of 300 nm. c Reported values correspond to Young’s modulus. Poisson’s ratio of calcite assumed as 0.3 (isotropic). d Displacement-controlled indents performed to a maximum depth of 500 nm. e Reported values correspond to Young’s modulus. Poisson’s ratio of calcite assumed as 0.28. f Reported value corresponds to the reduced modulus. Indents were performed using a diamond Berkovich tip.
Table 3. Summary of indentation properties of precipitate obtained from baseline EICP solution.
Particle No.No. of Indents aNo. of OutliersPmax (mN)Hardness (H)Modulus (M)M, H Correlation (ρ)
Mean (GPa)SD (GPa)Mean (GPa)SD (GPa)
12 × 13 − 202.03.180.3359.35.340.61
24 × 522.03.420.3456.33.660.14
35 × 432.03.470.4362.54.410.86
43 × 5 − 512.02.980.5259.27.890.96
51832.02.650.3536.85.620.56
610 × 832.03.470.3360.35.250.75
79 × 612.03.510.2550.25.790.55
Overall21313-3.370.4155.88.670.56
a Number of indents is listed in the format m × nq, representing a grid comprising m rows, n columns, and q indents outside the particle.
Table 4. Summary of indentation properties of precipitate obtained from modified EICP solution.
Particle No.No. of Indents aNo. of OutliersPmax (mN)Hardness (H)Modulus (M)M, H Correlation (ρ)
Mean (GPa)SD (GPa)Mean (GPa)SD (GPa)
14 × 4 + 4 × 502.52.260.5242.36.580.46
25 × 602.53.310.5754.72.890.45
34 × 882.03.510.5758.85.070.45
48 × 1562.02.290.4747.36.600.73
58 × 1502.02.950.2450.62.390.79
69 × 16152.03.990.3361.12.800.66
710 × 1202.02.780.3453.23.910.67
812 × 1612.02.900.2650.83.020.64
Overall76430-2.990.6552.36.390.83
a Number of indents is listed in the format m × n, representing a grid comprising m rows and n columns.
Publisher’s Note: MDPI stays neutral with regard to jurisdictional claims in published maps and institutional affiliations.

