Article

The Effect of Annealing Treatment on the Microstructure and Texture of a Cold-Rolled TiNiFe Shape Memory Alloy Tube

1
State Key Laboratory of Nonferrous Metals and Processes, China GRINM Group Co., Ltd., Beijing 100088, China
2
GRIMAT Engineering Institute Co., Ltd., Beijing 101407, China
3
General Research Institute for Nonferrous Metals, Beijing 100088, China
*
Author to whom correspondence should be addressed.
Submission received: 22 February 2024 / Revised: 6 March 2024 / Accepted: 12 March 2024 / Published: 14 March 2024
(This article belongs to the Section Crystalline Metals and Alloys)

Abstract

:
The effect of annealing treatment on the microstructure and texture of a Ti50Ni47Fe3 shape memory alloy tube was studied. The results show that the recrystallization process of a cold-rolled Ti50Ni47Fe3 alloy tube occurs at 600 °C. The microstructure changes from long striped grains to equiaxed recrystallized grains. The main texture of the alloy tube is the fiber texture <111> parallel to RD. With the increase in the annealing temperature, the crystal orientation of the alloy gradually turned to (111)<112>, and a series of secondary textures were distributed along the γ orientation line when the alloy was annealed at a lower temperature (450~600 °C). When the alloy was annealed at 650 °C, the growth of recrystallized grains made the grain orientation change, which led to the weakening of the γ-fiber texture and the formation of recrystallization textures.

1. Introduction

Because of their good shape memory effect (SME) and superelasticity (SE), TiNi-based shape memory alloys (SMAs) have been widely used for coupling joints, aircraft structures, actuators, etc. [1,2,3,4]. Both the SME and SE are based on the martensitic transformation and its reverse transformation, which is called a thermoelastic martensitic transformation [5,6]. Many efforts have been made to improve the strength and toughness of SMAs, for instance, plastic deformation and alloying [7,8,9].
Cold deformation is widely used in the processing of TiNi-based SMAs, such as cold rolling (CR), cold drawing, high-pressure torsion, and local canning compression [10,11,12,13]. By introducing high-density dislocations, nanophases, or amorphous phases, the recovery stress, recovery strain, and tensile strength of TiNi-based SMAs can be improved [14]. For example, cold rolling shows a significant effect on the morphology of the β-Nb phase and the fraction of the precipitated phase in a Ti44.5Ni44.5Nb9Co2 alloy, leading to a dramatic improvement in the yield stress and recovery properties [15]. However, large residual stresses and high-density defects in the SMA are obtained by cold processing [16], which is unfavorable to the plasticity of the alloy, so the subsequent annealing treatment is of great significance to maintaining the plasticity. Furthermore, the annealing process after deformation is highly related to the microstructure, mechanical properties, and SME of the alloys [14]. Therefore, appropriate heat treatment is needed to reduce the internal stress and homogenize the grains to improve the microstructure and mechanical properties [17,18].
An intermetallic compound can be formed because of the addition of Fe elements by replacing Ni atoms, resulting in a lattice distortion and atomic relaxation [19,20]. TiNiFe SMAs have good SMEs and mechanical properties and a relatively low martensitic transformation temperature [21], so they are also widely used in aerospace and other fields. At present, research on TiNiFe SMAs mainly focuses on their alloying, phase transformation behavior, mechanical properties, and SMEs. Chun-Hsiang Tu et al. found that Ti3Ni4 precipitation and the content change of Fe and Ni in the matrix during the aging process will affect the two-stage R phase transformation [22]. Lai Y et al. found that a two-stage phase transformation is induced by Fe in the matrix [23]. Wang T et al. found that synergistic reinforcement combines Fe element doping, and a high-density grain boundary promotes the high superelastic stress of TiNiFe SMA [24]. Liu X et al. studied the microstructure, recovery properties, and transformation temperature of a hot-forged Ti50Ni47Fe3 alloy with different annealing temperatures and found that an excessive heat treatment temperature reduces the number of grain boundaries and the texture density, which affects the recovery properties of the alloy [25].
It Is also necessary to study the effects of twinning, dislocation slips, and texture on the SME and properties of TiNi-based SMAs. Kuranova NN et al. found that a Ti50Ni49Fe1 alloy forms a banded dislocation and twin structure, initiating the thermoelastic martensitic transformation [26]. Liu X et al. found that the deformation behavior of the R phase and martensitic phase reorientation and detwinning are some of the main deformation mechanisms of TiNiFe alloys [27]. In the cold-rolled TiNi SMA sheets, an altering <100> slip and {114}<221> twinning promotes the formation of the γ-fiber texture [28].
Most of the research on TiNiFe alloys focuses on the plate [29], wire [30], and rod [31]. Due to the high strain hardening index of a TiNiFe alloy, it is difficult for it to be processed by cold deformation. The research on TiNiFe alloy tubes has not been very comprehensive. An appropriate annealing temperature can mean that the alloy maintains good comprehensive mechanical properties. So, it is necessary to study the effect of the annealing temperature on the microstructure and texture of a Ti50Ni47Fe3 shape memory alloy tube.

2. Materials and Methods

The tube billet was obtained by processing the Ti50Ni47Fe3 alloy ingot prepared by vacuum induction melting. The as-received Ti50Ni47Fe3 alloy tube was φ18 × 3 mm and processed by cold rolling. The cold rolling reduction ratio of the billet is 25%. The chemical composition of the as-received tube is listed in Table 1. The cold-rolled Ti50Ni47Fe3 alloy tube was annealed at 450~650 °C for 60 min followed by air-cooling (AC), with a temperature interval of 50 °C.
Most of the research studies the texture of the tube by testing the longitudinal- and cross-section [32]. When the grain orientation of the alloy tube is preferentially distributed along the radial direction, the grains are arranged in a circular outward radial arrangement, and it is difficult to measure the texture directly. Therefore, an expansion method was conducted to prepare the electron backscattered diffraction (EBSD) samples, as shown in Figure 1. The intermediate ring of the tube with a thickness of 0.5 mm was obtained by mechanical thinning first, and then it was thinned to less than 0.1 mm by pickling. The EBSD sample of the circumferential plane of the tube with a size of 7 × 5 mm was obtained after cutting and elastic expansion. The radial, circumferential, and axial directions of the tube were determined as the RD, TD, and ND of the sample, respectively. The specimen surfaces were grounded on a series of SiC papers and subsequently electrochemically polished using a solution of 5 vol% HClO4 + 95 vol% CH3COOH. The microstructure and texture of the circumferential plane for the tube were characterized by EBSD techniques at a step size of 0.3 μm using a JEOL JSM-7900F equipped with TSL OIM Analysis 8 software.
The microhardness test of alloy tubes after heat treatment was carried out by using a WILSON VH1150 Vickers durometer. Five points were taken from the outer circumference to the inner circumference along the radial direction, and the average of the five measured values was taken as the microhardness of the tube. The load force was 5 kg, and the loading time was 10 s.

3. Results and Discussion

3.1. Microstructure of Cold-Rolled TiNiFe SMA Tube

The microstructure of the circumferential plane of the as-rolled alloy tube is shown in Figure 2. The microstructure of the alloy is mainly composed of long strip grains along the rolling direction. The grain orientation spread (GOS) map shows that 48% of the area is composed of grains with severe plastic deformation. The total fraction of LAGBs is 71%, indicating that there is a high dislocation density and a large number of sub-grain boundaries within the grains. According to the inverse pole figure (Figure 2f), the main orientation direction of the as-rolled alloy is the <111> parallel to RD, which is a common γ-fiber texture in TiNi-based SMAs [33].

3.2. Microstructure Evolution of Alloy Tube Annealed at Different Temperatures

The microstructure of the cold-rolled alloy tube after different annealing treatments was analyzed, and the statistical data, including IPF figures, image quality figures, grain orientation spread (GOS) maps, average grain size, and misorientation angle chart are illustrated in Figure 3, Figure 4, Figure 5, Figure 6 and Figure 7. Accordingly, with the increase in the annealing temperature, three different conditions can be observed. When the annealing temperature was lower than 550 °C, as shown in Figure 3, Figure 4 and Figure 5, the microstructures of the alloy were similar to that of the CR alloy, which is composed of long strip grains, and the fraction of LAGBs remained constant at about 70%. It is noted that the average grain size of the alloy after annealing at 550 °C decreased dramatically to 1.13 µm, compared to the 1.57 µm of the as-rolled alloy. Moreover, fine grains were generated from the grain boundaries of the deformed long stripe-shaped grains when annealing at 550 °C, as seen from the GOS maps in Figure 5f. When the annealing temperature reached 600 °C, the average grain size increased to 2.37 μm, while the fraction of LAGBs decreased to 46%, indicating that the alloy was in the recrystallization stage. When the annealing temperature increased to 650 °C, the microstructure of the alloy was already mainly composed of equiaxed grains with an average grain size of 4.05 μm. Furthermore, the grain boundaries became clear, and the fraction of LAGBs was decreased to approximately 32%.
It is well known that the cold-rolled alloy will undergo three stages, recovery, recrystallization, and grain growth during annealing at different temperatures [29]. Large quantities of deformed grains are induced by cold working and will store a large amount of deformation energy. When annealed at a lower temperature (450~550 °C), the grains are mainly in a recovery process, and recrystallized nuclei occur at some severely deformed grains with large residual stored energy at 550 °C. Due to a large number of crystal defects that are generated during CR and the high energy at the grain boundary, the position of the recrystallization nucleation increases significantly at the deformed grain boundaries. This leads to a decrease in the recrystallized grain size. These driving forces of recrystallization nucleation increase greatly with the increase in the annealing temperature. When annealing at 600 °C, the stored internal deformation energy is almost released, and the residual stress and dislocation density are sharply decreased, which leads to a decrease in LAGBs. At this time, the grains of the alloy are mostly finely recrystallized, indicating that the alloy is under the recrystallization stage at 600 °C. Furthermore, when the alloy is annealed at 650 °C, the higher annealing temperature promotes the growth of fine recrystallized grains, and thus increases the average grain size, as shown in Figure 7.
The GOS is the average difference in orientation between the average grain orientation and all measurements within a single grain [34]. This value is small for recrystallized grains, so the recrystallization fraction can be calculated from the EBSD-GOS figures. In our experimental work, the grains will be defined as recrystallized grains when the GOS is less than 2. When the GOS value is between 2 and 7, recovery grains will be defined, and deformed grains will be defined for 7 and higher [21]. As shown in Figure 5, the fraction of deformed grains is still very high when annealed at 550 °C, so the alloy is still in the recovery stage. However, after annealing at 600 °C, the fraction of recrystallized grains is increased to 63%, indicating that the alloy is in the recrystallization stage.
Figure 8 shows the schematic diagram of the proportion of twins and their parent phases of the alloy at different annealing temperatures. The Kernel Average Misorientation (KAM) figures of the alloy when annealed at different temperatures are also illustrated, which can reflect the degree of plastic deformation and the dislocation density. KAM is widely used in plasticity characterization, and it is closely related to Geometrically Necessary Dislocations (GNDs) [35]. The dislocation density of the alloy analyzed by KAM can also reflect the stage of the alloy in the annealing process. The calibration results show that <110> twins are the main type of twins. With the increase in the annealing temperature, the proportion of grains without twins gradually increases, and the proportion of twins gradually decreases to a certain level. When annealing at a lower temperature, for instance, below 600 °C, the alloy is mainly in the recovery stage, the density of deformation twins remains unchanged, and the defect energy of the dislocations increases, and some of the dislocations begin to move. The softening effect is the priority of the recovery process. When the alloy is annealed at 600 °C, the alloy recrystallization occurs, and most of the lattice distortion is effectively eliminated; consequently, the twin density decreases greatly.
Due to the limitation of the length, size, and inner surface state of the tube, it is difficult to test the mechanical properties of the tube. In a previous study, it was proven that the changing trend of microhardness is similar to that of mechanical properties [29]. Therefore, it is feasible to study the effect of the annealing temperature on the mechanical properties of the tube by analyzing the change in the microhardness of the tube. The microhardness of the alloy at different annealing temperatures is shown in Table 2. When the annealing temperature is below 600 °C, the microhardness of the alloy decreases with the increase in the annealing temperature. When the annealing temperature is above 600 °C, the microhardness of the alloy remains stable. Twins and dislocations can significantly affect the strength of the alloy. The recovery and recrystallization process significantly increases the defect energy of the dislocations and promotes the dislocations to move, thus reducing the internal defects and twin density of the alloy, resulting in a decrease in the strength of the alloy. This is consistent with the microhardness of the alloy at different annealing temperatures.

3.3. Texture Evolution of Alloy Tube Annealed at Different Temperatures

The fiber texture in the rolled plate of the SMA can promote the specific orientation to have a higher recovery strain [36]. Similarly, a tube with a strong radial direction texture has strong recovery stress. To better understand the changes in texture during the annealing process at different temperatures, the IPFs and (111) PFs of the alloy are shown in Figure 9 and Figure 10. With the increase in the annealing temperature, the <111> is the main texture in the alloy. The main texture orientation and texture intensity exhibit no obvious change. When the annealing temperature exceeds 600 °C, as shown in Figure 11d, there is also a texture existing along the axial direction.
Figure 11 shows the ODF cross-section φ2 = 45° of the alloy after annealing at different temperatures. The main reason for selecting the ODF cross-section of φ2 = 45° for the texture observation is that this cross-section can easily display the most preferred orientations existing in the alloy [33]. The results show that the texture is mostly located on the γ orientation line (φ1 = 0–90°; Φ = 54.7°; φ2 = 45°). With the increase in the annealing temperature, the main texture of the alloy is (111)[uvw], distributed along the γ orientation line. The distribution map of the orientation intensity along the γ orientation line of the as-annealed alloy is shown in Figure 12 for convenient analysis. The f(g) is for the orientation density. The alloy has a strong single (111)[2 3 ¯ 1] texture at 450 °C. When the annealing temperature is over 500 °C, the texture density decreases first and then remains unchanged. It can be seen that texture (111)<1 1 ¯ 0> and texture (111)< 1 ¯ 1 ¯ 2> exist when the alloy is annealed at 500 °C. A series of secondary textures, distributed along the γ orientation line, occurs when the alloy is annealed at 550 °C. This is to a certain extent similar to the conclusion obtained from a study on the microstructure and texture of a TiNi rolled plate [37]. Then, when the alloy is annealed at 600 °C, the main texture of the alloy transforms into (111)< 1 ¯ 1 ¯ 2>. The texture of the alloy gradually transforms into a single texture. When the alloy is annealed at 650 °C, according to Figure 11e, it can be seen that the main texture of the alloy is (111)<1 2 ¯ 1>, and the texture density is similar to the texture density (111)< 1 ¯ 1 ¯ 2> when the alloy is annealed at 600 °C. According to the change in the orientation density in Figure 12, it can be seen that with the increase in the annealing temperature, the orientation {111}<110> decreased, and the crystal orientation of the alloy gradually turned to {111}<112>.
As for the recrystallization texture formed in the annealing process of the alloy, the main theories, such as orientated nucleation and orientated growth, are well accepted. Generally, the capability of storing the deformation energy would increase in the order of {100} < {112} < {111} < {110}, and the nucleation by sub-grain growth mechanisms should be the fastest where the stored energy is the greatest [38]. Therefore, the orientation density of the {111} orientation is the highest after the recrystallization stage when the alloy is annealed at 600 °C and 650 °C. During the recrystallization process, there is a Coincident Site Lattices (CSLs) relationship between orientation {111}<110> and {111}<112>, resulting in a competitive nucleation and growth. In the BCC-structured alloy, the growth of the recrystallized nuclei is generally carried out by merging the deformation regions with the same orientation first, and then merging the deformation orientation regions nearby [39]. The recrystallized nucleation of orientation {111}<112> is formed in orientation {111}<110>, which leads to the advantage of orientation {111}<112> in the subsequent grain growth process. Therefore, a strong texture {111}<112> is formed in the alloy.
The IPF figures of the recrystallized grains of the alloy annealed at 550–650 °C are illustrated in Figure 13. When the alloy is annealed at 650 °C, both <101> and <111> orientation grains exist, as shown in Figure 13c. The growth of the recrystallized grains makes the grain orientation change, which leads to the weakening of the γ-fiber texture and the formation of other new textures (Figure 10e). As the annealing temperature continues to increase or extend the annealing time, according to the study by Inagaki H [40], the {111}<110> orientation will be the final stable orientation during the recrystallization process. Moreover, the tube is subjected to both axial compressive stress and radial stress during the cold rolling process, resulting in a more complicated stress state. Further research on the mechanical properties of the tube is needed. In addition, the relationship between the microstructure, texture, and mechanical properties is also an aspect that needs to be further studied in the future.

4. Conclusions

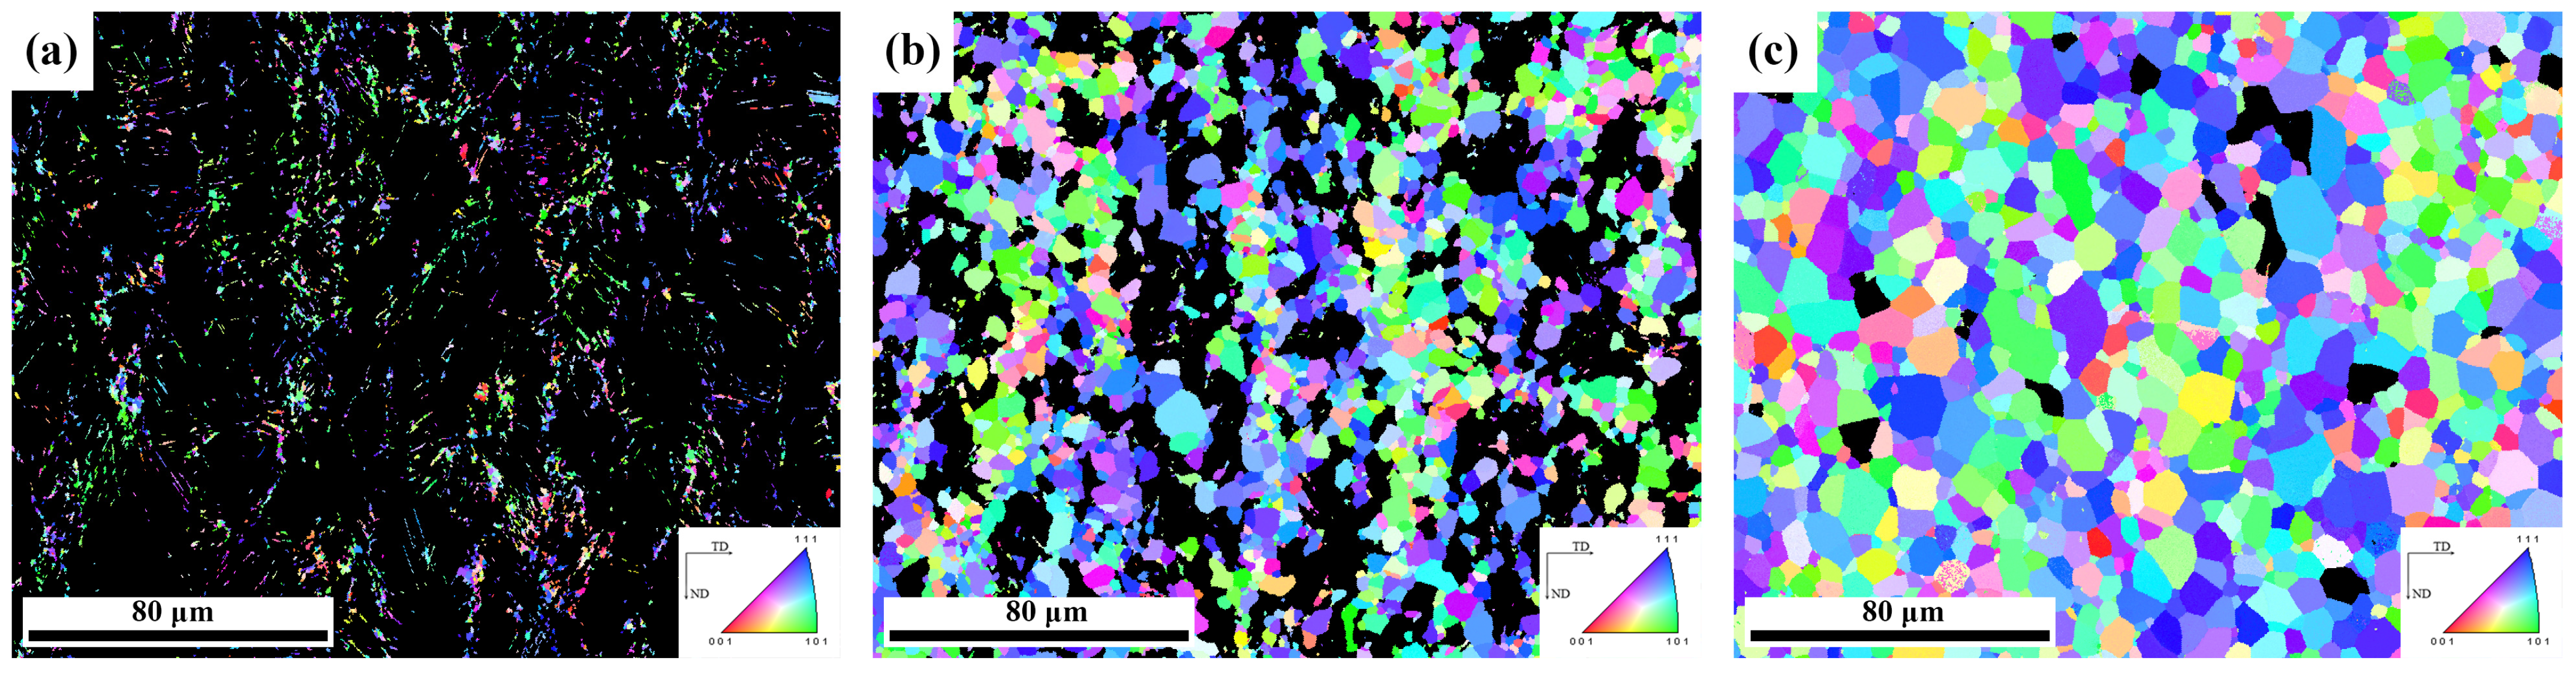
  • With the increase in the annealing temperature, the cold-rolled Ti50Ni47Fe3 alloy tube undergoes a recovery, recrystallization, and grain growth process, and the microstructure changes from long striped grains to equiaxed grains. The recrystallization mainly occurs at 600 °C.
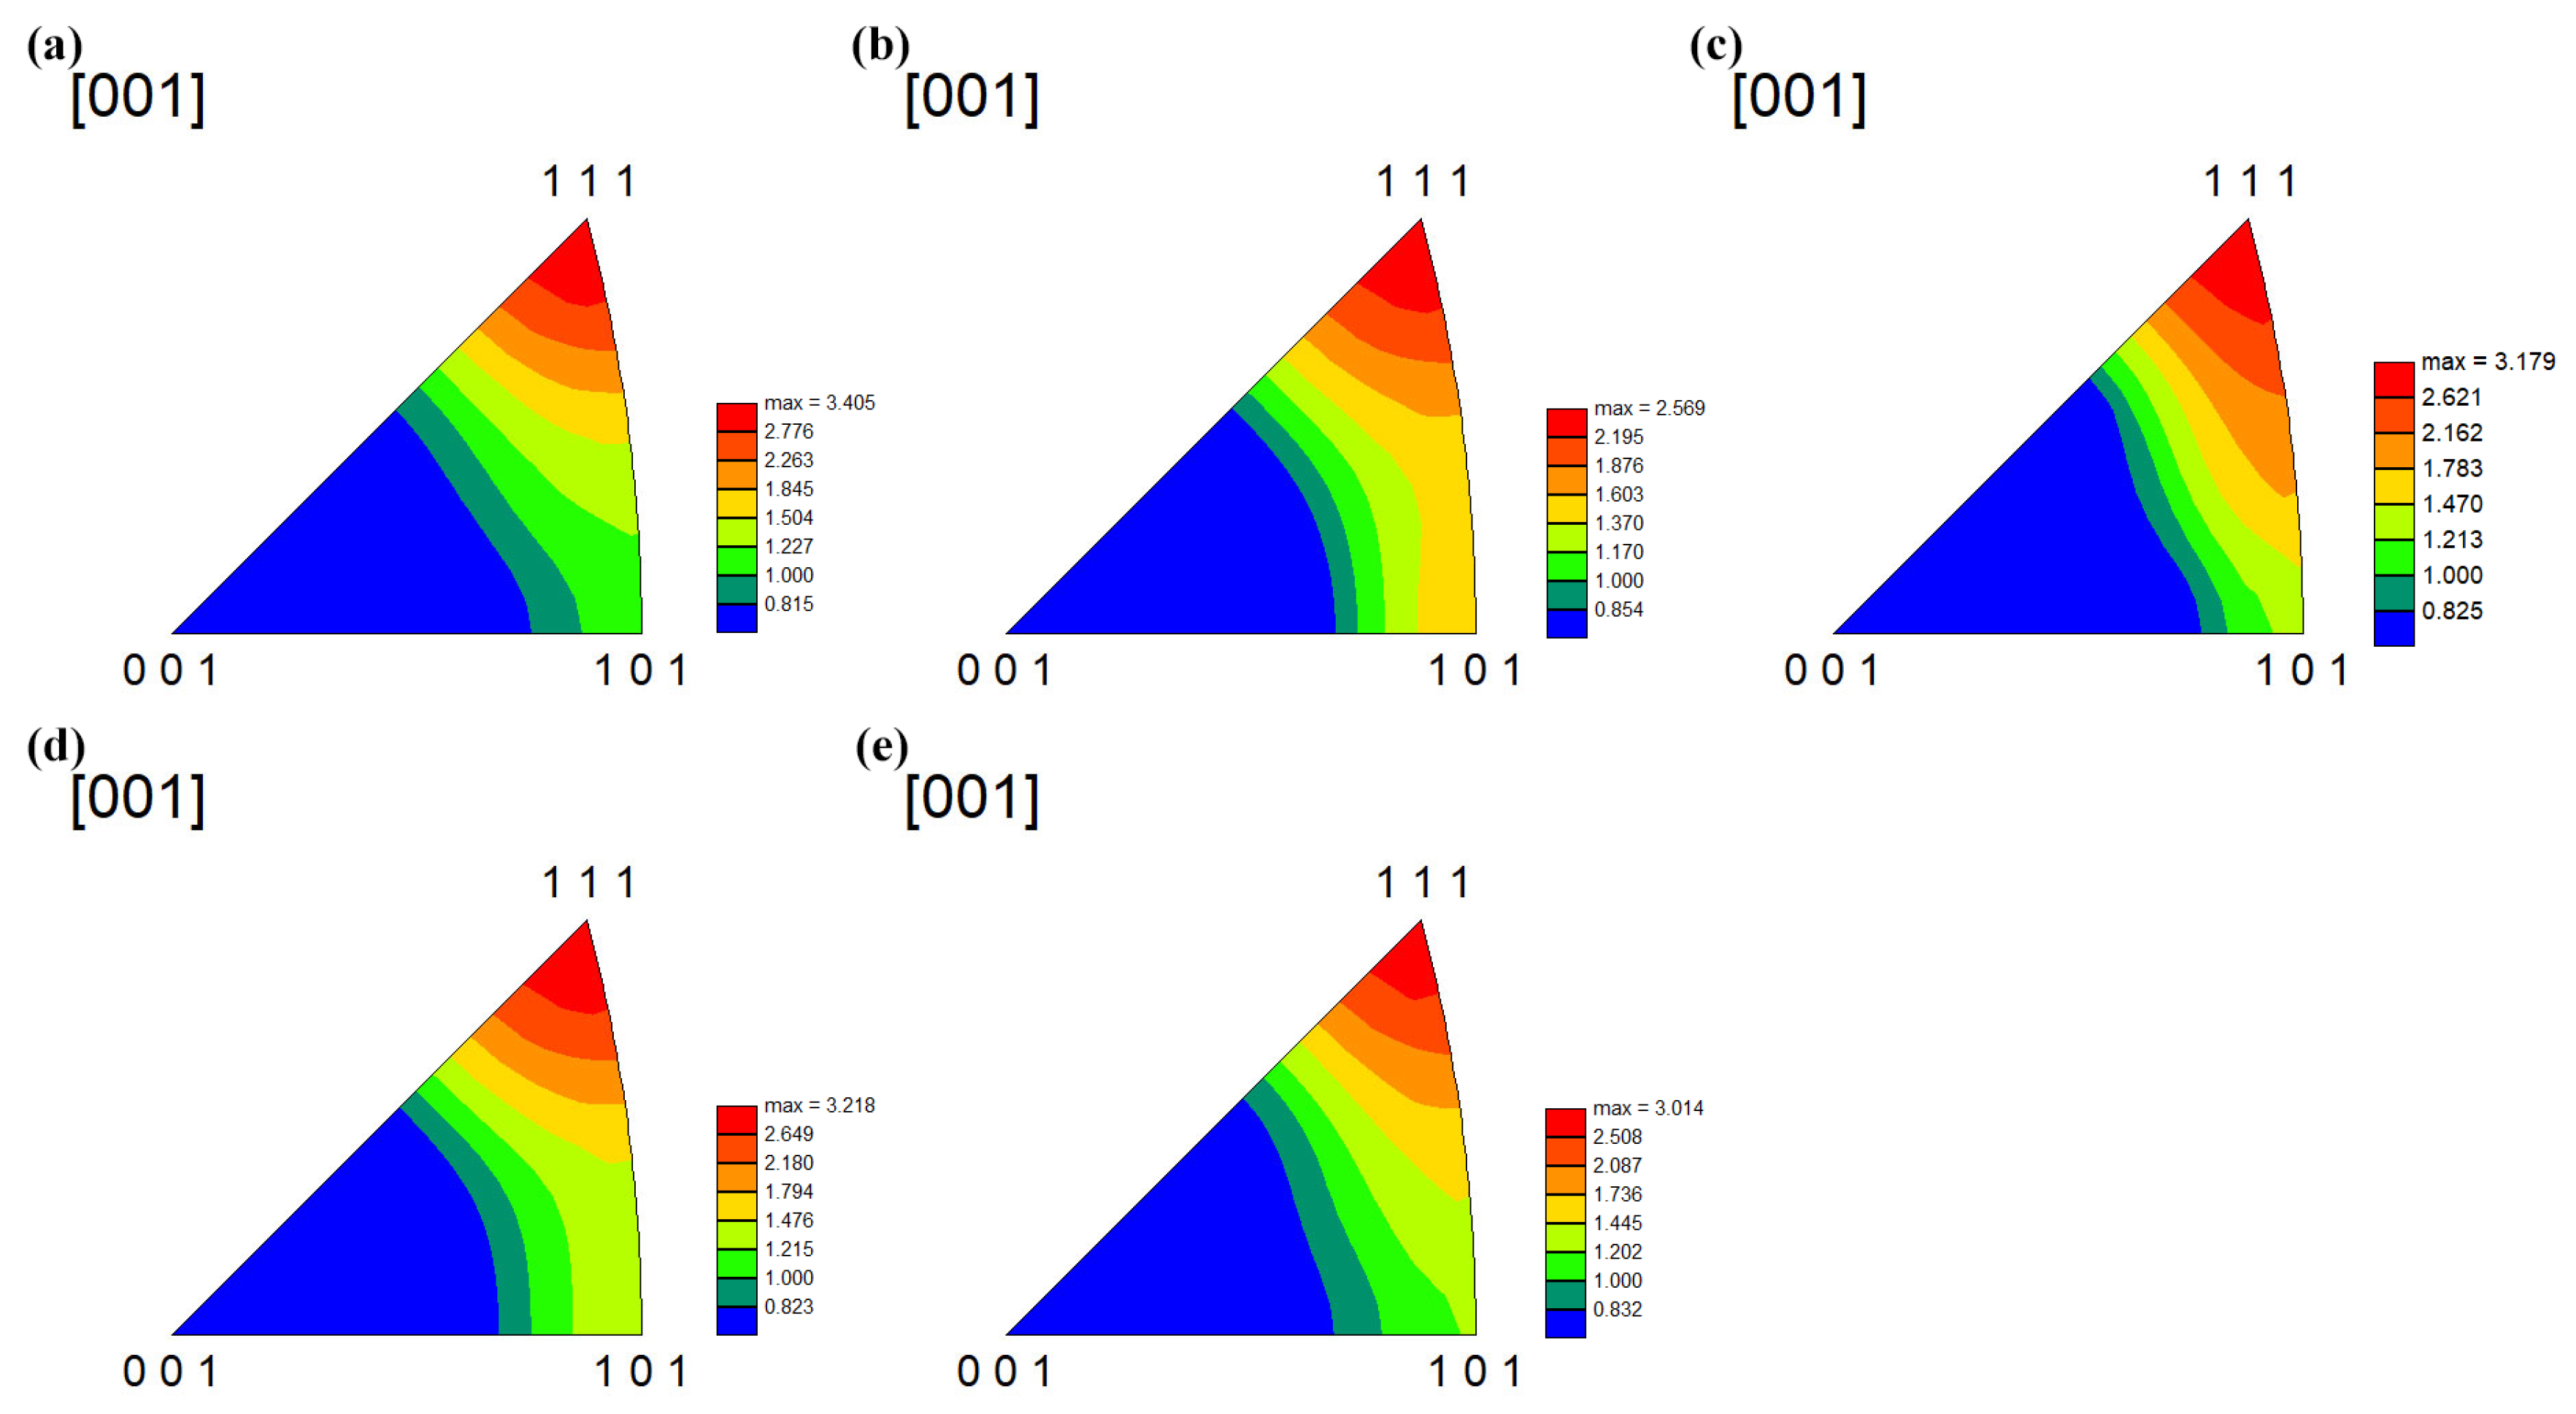
  • The main texture of the as-annealed alloy tube is (111)<uvw>, distributed along the γ orientation line. With the increase in the annealing temperature, the orientation density dramatically decreases first and then remains stable. The orientation (111)<110> decreases, and the crystal orientation of the alloy gradually turns to (111)<112>. A series of secondary textures are distributed along the γ orientation line when the alloy is annealed at a lower temperature (450~600 °C).
  • A recrystallization texture (111)<112> is formed during the recrystallization process. When the alloy is annealed at 650 °C, <101> and <111> orientation grains appear, which promotes the generation of recrystallization textures and weakens the fiber texture that is formed in the CR process.

Author Contributions

Conceptualization, X.S., Y.L. and W.Y.; methodology, J.W. and S.H.; formal analysis, J.W., X.S., S.L., Y.Y. and W.Y.; resources, X.S.; writing—original draft preparation, J.W.; writing—review and editing, X.S. All authors have read and agreed to the published version of the manuscript.

Funding

This research received no external funding.

Data Availability Statement

The data supporting the findings of this study are available from the corresponding author upon reasonable request.

Conflicts of Interest

All authors were employed by the company State China GRINM Group Co., Ltd. The authors declare that the research was conducted in the absence of any commercial or financial relationships that could be construed as potential conflict of interest.

References

  1. Cai, W.; Meng, X.L.; Zhao, L.C. Recent development of TiNi-based shape memory alloys. Curr. Opin. Solid State Mater. Sci. 2005, 9, 296–302. [Google Scholar] [CrossRef]
  2. Otsuka, K.; Ren, X. Recent developments in the research of shape memory alloys. Intermetallics 1999, 7, 511–528. [Google Scholar] [CrossRef]
  3. Otsuka, K.; Ren, X. Physical metallurgy of Ti–Ni-based shape memory alloys. Prog. Mater. Sci. 2005, 50, 511–678. [Google Scholar] [CrossRef]
  4. Wang, Z.; Xu, X.-W.; Wang, K.-S.; Wang, W. Preparation and hot compression deformation of biomedical Ni-Ti alloy. Chin. J. Eng. 2019, 41, 238–245. [Google Scholar] [CrossRef]
  5. Huo, X.; Chen, P.; Lahkar, S.; Jin, M.; Han, X.; Song, Y.; Wang, X. Occurrence of the R-phase with increased stability induced by low temperature precipitate-free aging in a Ni50.9Ti49.1 alloy. Acta Mater. 2022, 227, 117688. [Google Scholar] [CrossRef]
  6. Yu, H.; Qiu, Y.; Young, M.L. Influence of Ni4Ti3 precipitate on pseudoelasticity of austenitic NiTi shape memory alloys deformed at high strain rate. Mater. Sci. Eng. A 2021, 804, 140753. [Google Scholar] [CrossRef]
  7. Rao, W.-F.; Wuttig, M.; Khachaturyan, A.G. Giant Nonhysteretic Responses of Two-Phase Nanostructured Alloys. Phys. Rev. Lett. 2011, 106, 105703. [Google Scholar] [CrossRef]
  8. Yang, R.; Ma, W.; Wang, C.; Wang, T.-M.; Wang, Q.-H. Effect of hot rolling on microstructure and tribology behaviors of Ti−50.8Ni alloy. Trans. Nonferrous Met. Soc. China 2021, 31, 967–979. [Google Scholar] [CrossRef]
  9. Nii, Y.; Arima, T.-h.; Kim, H.Y.; Miyazaki, S. Effect of randomness on ferroelastic transitions: Disorder-induced hysteresis loop rounding in Ti-Nb-O martensitic alloy. Phys. Rev. B 2010, 82, 214104. [Google Scholar] [CrossRef]
  10. Sharifi, E.M.; Karimzadeh, F.; Kermanpur, A. The effect of cold rolling and annealing on microstructure and tensile properties of the nanostructured Ni50Ti50 shape memory alloy. Mater. Sci. Eng. A 2014, 607, 33–37. [Google Scholar] [CrossRef]
  11. Yu, C.; Aoun, B.; Cui, L.; Liu, Y.; Yang, H.; Jiang, X.; Cai, S.; Jiang, D.; Liu, Z.; Brown, D.E.; et al. Synchrotron high energy X-ray diffraction study of microstructure evolution of severely cold drawn NiTi wire during annealing. Acta Mater. 2016, 115, 35–44. [Google Scholar] [CrossRef]
  12. Shahmir, H.; Nili-Ahmadabadi, M.; Huang, Y.; Myun Jung, J.; Seop Kim, H.; Langdon, T.G. Shape memory effect in nanocrystalline NiTi alloy processed by high-pressure torsion. Mater. Sci. Eng. A 2015, 626, 203–206. [Google Scholar] [CrossRef]
  13. Jiang, S.; Hu, L.; Zhang, Y.; Liang, Y. Nanocrystallization and amorphization of NiTi shape memory alloy under severe plastic deformation based on local canning compression. J. Non-Cryst. Solids 2013, 367, 23–29. [Google Scholar] [CrossRef]
  14. Liang, Y.; Jiang, S.; Zhang, Y.; Hu, L.; Zhao, C. Microstructure evolution and deformation mechanism of NiTiFe shape memory alloy based on plane strain compression and subsequent annealing. Mater. Chem. Phys. 2018, 215, 112–120. [Google Scholar] [CrossRef]
  15. Cui, B.; Yao, J.; Wu, Y.; Cai, W. Effect of cold rolling ratio on the microstructure and recovery properties of Ti-Ni-Nb-Co shape memory alloys. J. Alloys Compd. 2019, 772, 728–734. [Google Scholar] [CrossRef]
  16. Liang, Q.; Zhao, S.; Liang, C.; Zhao, T.; Wang, D.; Ding, X.; Li, S.; Wang, Y.; Zheng, Y.; Ren, X.; et al. Strain states and unique properties in cold-rolled TiNi shape memory alloys. Acta Mater. 2022, 231, 117890. [Google Scholar] [CrossRef]
  17. Sergueeva, A.V.; Song, C.; Valiev, R.Z.; Mukherjee, A.K. Structure and properties of amorphous and nanocrystalline NiTi prepared by severe plastic deformation and annealing. Mater. Sci. Eng. A 2003, 339, 159–165. [Google Scholar] [CrossRef]
  18. Ishida, A.; Sato, M. Microstructure and shape memory behaviour of annealed Ti51.5Ni(48.5-x)Cux (x  = 6.5–20.9) thin films. Philos. Mag. 2007, 87, 5523–5538. [Google Scholar] [CrossRef]
  19. Lee, H.-C.; Shen, J.-J.; Chang, Y.-T.; Wu, C.-T.; Chen, C.-H. Evolutions of superelasticity and elastocaloric effect of Ti50Ni48Fe2 and aged-hardened Ni-rich Ti49.2Ni49.3Fe1.5 shape memory alloys under cyclic compressive deformation. J. Alloys Compd. 2022, 893, 162352. [Google Scholar] [CrossRef]
  20. Li, P.; Jia, Y.; Wang, Y.; Li, Q.; Meng, F.; He, Z. Effect of Fe Addition on Microstructure and Mechanical Properties of As-cast Ti49Ni51 Alloy. Materials 2019, 12, 3114. [Google Scholar] [CrossRef]
  21. Liu, S.; Hui, S.; Li, Y.; Song, X.; Yu, Y.; Ye, W. Equivalent Heat Treatments and Mechanical Properties in Cold-Rolled TiNiFe Shape-Memory Alloys. Materials 2023, 16, 7395. [Google Scholar] [CrossRef]
  22. Tu, C.-H.; Wu, S.-K.; Lin, C.; Huang, B.-Y. A study on two R-phase transformations in intermediate temperature aged Ni-rich TiNiFe-based shape memory alloys. Intermetallics 2021, 132, 107123. [Google Scholar] [CrossRef]
  23. Lai, Y.-C.; Wu, S.-K. A Study on Phase Transformation Exhibited in Ti49±xNi49∓xFe2 (x = 0 to 1) Shape Memory Alloys. Metall. Mater. Trans. A 2021, 52, 4636–4648. [Google Scholar] [CrossRef]
  24. Wang, T.; Guo, F.; Ai, T.; Li, Y. Superelastic stability of nanocrystalline Ni47Ti50Fe3 shape memory alloy. J. Mater. Res. Technol. 2023, 24, 3048–3054. [Google Scholar] [CrossRef]
  25. Liu, X.; Li, H.; Guan, H.; Yang, Z.; Zhang, Y.; Gu, Q.; Yang, J. Degradation of recovery properties after heat treatment in hot-forged NiTiFe alloy. J. Alloys Compd. 2022, 928, 167171. [Google Scholar] [CrossRef]
  26. Kuranova, N.; Pushin, A.; Pushin, V.; Uksusnikov, A.; Kourov, N. Formation of nanostructured states in ternary TiNiFe-based shape memory alloys during megaplastic deformation and subsequent heat treatment. Tech. Phys. 2014, 59, 685–691. [Google Scholar] [CrossRef]
  27. Liu, X.; Li, H.; Zhang, Y.; Yang, Z.; Gu, Q.; Wang, X.; Zhang, Y.; Yang, J. Cryogenic temperature deformation behavior and shape memory mechanism of NiTiFe alloy. Intermetallics 2023, 162, 107997. [Google Scholar] [CrossRef]
  28. Laplanche, G.; Kazuch, A.; Eggeler, G. Processing of NiTi shape memory sheets—Microstructural heterogeneity and evolution of texture. J. Alloys Compd. 2015, 651, 333–339. [Google Scholar] [CrossRef]
  29. Liu, S.; Li, Y.; Song, X.; Yu, Y.; Ye, W.; Hui, S. Microstructures and Mechanical Properties of Annealed Ti50Ni47Fe3 Shape Memory Alloy. Crystals 2023, 13, 706. [Google Scholar] [CrossRef]
  30. Chen, Y.; Li, A.; Ma, Z.; Wang, T.; Liu, Y.; Yu, K.; Yang, F.; Jiang, D.; Zhao, K.; Yang, H.; et al. Step-wise R phase transformation rendering high-stability two-way shape memory effect of a NiTiFe-Nb nanowire composite. Acta Mater. 2021, 219, 117258. [Google Scholar] [CrossRef]
  31. Zhang, Y.; Jiang, S.; Tang, M.; Yan, B.; Yu, J.; Zhao, C. Mechanisms for influence of post-deformation annealing on microstructure of NiTiFe shape memory alloy processed by local canning compression. J. Mater. Process. Technol. 2021, 291, 116998. [Google Scholar] [CrossRef]
  32. Zhou, D.-D.; Zeng, W.-D.; Xu, J.-W.; Luo, D.-C.; Li, H. Evolution of Microstructure and Texture in Cold-Rolled Ti Tube under Annealing. Chin. J. Rare Met. 2019, 43, 470–475. [Google Scholar] [CrossRef]
  33. Chang, S.H.; Wu, S.K. Textures in cold-rolled and annealed Ti50Ni50 shape memory alloy. Scr. Mater. 2004, 50, 937–941. [Google Scholar] [CrossRef]
  34. Field, D.P.; Bradford, L.T.; Nowell, M.M.; Lillo, T.M. The role of annealing twins during recrystallization of Cu. Acta Mater. 2007, 55, 4233–4241. [Google Scholar] [CrossRef]
  35. Rui, S.-S.; Han, Q.-N.; Wang, X.; Li, S.; Ma, X.; Su, Y.; Cai, Z.; Du, D.; Shi, H.-J. Correlations between two EBSD-based metrics Kernel Average Misorientation and Image Quality on indicating dislocations of near-failure low alloy steels induced by tensile and cyclic deformations. Mater. Today Commun. 2021, 27, 102445. [Google Scholar] [CrossRef]
  36. Inoue, H.; Miwa, N.; Inakazu, N. Texture and shape memory strain in TiNi alloy sheets. Acta Mater. 1996, 44, 4825–4834. [Google Scholar] [CrossRef]
  37. Mao, S.C.; Han, X.D.; Luo, J.F.; Zhang, Z. Microstructure and texture evolution of ultra-thin TiNi hot-rolled sheets studied by automated EBSD. Mater. Lett. 2005, 59, 3567–3571. [Google Scholar] [CrossRef]
  38. Zhao, H.; Rama, S.C.; Barber, G.C.; Wang, Z.; Wang, X. Experimental study of deep drawability of hot rolled IF steel. J. Mater. Process. Technol. 2002, 128, 73–79. [Google Scholar] [CrossRef]
  39. Ray, R.K.; Jonas, J.J.; Hook, R.E. Cold rolling and annealing textures in low carbon and extra low carbon steels. Int. Mater. Rev. 1994, 39, 129–172. [Google Scholar] [CrossRef]
  40. Inagaki, H. Nucleation of a {111} Recrystallized Grain at the Grain Boundary of Cold Rolled Polycrystalline Iron. Trans. Jpn. Inst. Met. 1987, 28, 251–263. [Google Scholar] [CrossRef]
Figure 1. Schematic diagram of (a) direction of the tube and (b) EBSD specimen preparation by expansion method.
Crystals 14 00274 g001
Figure 2. Microstructure of cold-rolled alloy tube: (a) inverse pole figure (IPF); (b) image quality figures with LAGBs and HAGBs; (c) grain orientation spread (GOS) map; (d) average grain size chart; (e) misorientation angle chart; (f) inverse pole figure along radial direction.
Crystals 14 00274 g002
Figure 3. Microstructure of alloy tube annealed at 450 °C/60 min/AC: (a) inverse pole figure (IPF); (b) image quality (IQ) figure with LAGBs and HAGBs; (c) grain orientation spread (GOS) figure; (d) average grain size chart; (e) misorientation angle distribution chart.
Crystals 14 00274 g003
Figure 4. Microstructure of alloy tube annealed at 500 °C/60 min/AC: (a) inverse pole figure (IPF); (b) image quality (IQ) figure with LAGBs and HAGBs; (c) grain orientation spread (GOS) figure; (d) average grain size chart; (e) misorientation angle distribution chart.
Crystals 14 00274 g004
Figure 5. Microstructure of alloy tube annealed at 550 °C/60 min/AC: (a) inverse pole figure (IPF); (b) image quality (IQ) figure with LAGBs and HAGBs; (c) grain orientation spread (GOS) figure; (d) average grain size chart; (e) misorientation angle distribution chart; (f) region 1 in (c).
Crystals 14 00274 g005
Figure 6. Microstructure of alloy tube annealed at 600 °C/60 min/AC: (a) inverse pole figure (IPF); (b) image quality (IQ) figure with LAGBs and HAGBs; (c) grain orientation spread (GOS) figure; (d) average grain size chart; (e) misorientation angle distribution chart.
Crystals 14 00274 g006
Figure 7. Microstructure of alloy tube annealed at 650 °C/60 min/AC: (a) inverse pole figure (IPF); (b) image quality (IQ) figure with LAGBs and HAGBs; (c) grain orientation spread (GOS) figure; (d) average grain size chart; (e) misorientation angle distribution chart.
Crystals 14 00274 g007
Figure 8. Schematic diagrams of the proportion of twins and their parent phases: (a1) 450 °C/60 min/AC; (b1) 500 °C/60 min/AC; (c1) 550 °C/60 min/AC; (d1) 600 °C/60 min/AC; (e1) 650 °C/60 min/AC and KAM figures: (a2) 450 °C/60 min/AC; (b2) 500 °C/60 min/AC; (c2) 550 °C/60 min/AC; (d2) 600 °C/60 min/AC; (e2) 650 °C/60 min/AC in the alloy annealed at different temperatures.
Crystals 14 00274 g008
Figure 9. IPFs of the Ti50Ni47Fe3 alloy tube annealed at different temperatures: (a) 450 °C/60 min/AC; (b) 500 °C/60 min/AC; (c) 550 °C/60 min/AC; (d) 600 °C/60 min/AC; (e) 650 °C/60 min/AC.
Crystals 14 00274 g009
Figure 10. Pole figures (PFs) of the alloy annealed at different temperatures: (a) 450 °C/60 min/AC; (b) 500 °C/60 min/AC; (c) 550 °C/60 min/AC; (d) 600 °C/60 min/AC; (e) 650 °C/60 min/AC.
Crystals 14 00274 g010
Figure 11. ODF sections in the Euler space with a constant φ2 = 45° of the Ti50Ni47Fe3 alloy tube annealed at different temperatures: (a) 450 °C/60 min/AC; (b) 500 °C/60 min/AC; (c) 550 °C/60 min/AC; (d) 600 °C/60 min/AC; (e) 650 °C/60 min/AC.
Crystals 14 00274 g011
Figure 12. Orientation density of the alloy annealed at different temperatures along the γ orientation line.
Crystals 14 00274 g012
Figure 13. IPF figures of the recrystallized grains of the annealed alloys: (a) 550 °C/60 min/AC; (b) 600 °C/60 min/AC; (c) 650 °C/60 min/AC.
Crystals 14 00274 g013
Table 1. Chemical compositions of Ti50Ni47Fe3 alloy tube.
ElementFeNiCOTi
Content (wt.%)3.2752.160.0028<0.002Bal.
Table 2. Microhardness of Ti50Ni47Fe3 alloy after annealing at different temperatures.
Annealing Temperature (°C)450500550600650
Microhardness (HV5)284.4268.9251.8223.4226.3
289.2267.4253.4225.2225.2
284.4264.9254.4227.4228.7
278.5264.9250.5228.0229.1
283.4264.9252.1228.3227.3
Average microhardness (HV5)284.0266.2252.4226.5227.3
Disclaimer/Publisher’s Note: The statements, opinions and data contained in all publications are solely those of the individual author(s) and contributor(s) and not of MDPI and/or the editor(s). MDPI and/or the editor(s) disclaim responsibility for any injury to people or property resulting from any ideas, methods, instructions or products referred to in the content.

