Article

Crystal Structures and High-Temperature Vibrational Spectra for Synthetic Boron and Aluminum Doped Hydrous Coesite

1
State Key Laboratory of Geological Processes and Mineral Resources, China University of Geosciences, Wuhan 430074, China
2
Department of Geological Sciences, University of Colorado, Boulder, CO 80309, USA
3
School of Earth Sciences, China University of Geosciences, Wuhan 430074, China
*
Author to whom correspondence should be addressed.
Submission received: 5 November 2019 / Revised: 2 December 2019 / Accepted: 3 December 2019 / Published: 5 December 2019
(This article belongs to the Special Issue Mineralogical Crystallography)

Abstract

:
Coesite, a high-pressure SiO2 polymorph, has drawn extensive interest from the mineralogical community for a long time. In this study, we synthesized hydrous coesite samples with different B and Al concentrations at 5 and 7.5 GPa (1273 K). The B concentration could be more than 400 B/106Si with about 300 ppmw H2O, while the Al content can be as much as 1200 to 1300 Al/106Si with CH2O restrained to be less than 10 ppmw. Hence, B-substitution may prefer the mechanism of Si4+ = B3+ + H+, whereas Al-substitution could be dominated by 2Si4+ = 2Al3+ + OV. The doped B3+ and Al3+ cations may be concentrated in the Si1 and Si2 tetrahedra, respectively, and make noticeable changes in the Si–O4 and Si–O5 bond lengths. In-situ high-temperature Raman and Fourier Transformation Infrared (FTIR) spectra were collected at ambient pressure. The single crystals of coesite were observed to be stable up to 1500 K. The isobaric Grüneisen parameters (γiP) of the external modes (<350 cm−1) are systematically smaller in the Al-doped samples, as compared with those for the Al-free ones, while most of the OH-stretching bands shift to higher frequencies in the high temperature range up to ~1100 K

1. Introduction

Coesite, a high-pressure polymorph of SiO2, was firstly synthesized at 3.5 GPa (773–1073 K) in 1953 [1], and subsequently discovered in many locations, such as in the shocked sandstone ejecta samples from craters [2,3] as well as in eclogite [4,5,6]. Coesite is a very important index silica mineral for ultrahigh-pressure metamorphism [7,8], which provides key clue for the continental dynamics such as lithospheric subduction, exhumation, and reentry in extreme depths of more than 100 km. Furthermore, the physical and chemical properties of coesite at high-pressure and high-temperature conditions also attract a lot of interest from the community of mineral physics, like thermo-elasticity [9,10,11,12], phase transitions [13,14,15], and vibrational spectra under high-pressure (P) and high-temperature (T) conditions [16,17,18,19,20].
Water (OH) incorporation into coesite has a significant impact on the stability of coesite at high-P/T conditions [21,22], which is important for exploring preservation of coesite in the deep mantle. There could be up to 200–300 ppm ppmw H2O in synthetic coesite samples [19,23,24,25,26] resulted from hydro-garnet substitution (Si4+ + 4O2− = V + 4OH) as well as electrostatically coupled substitution with M3+ incorporation (Si4+ = M3+ + H+; M = B, Al), although natural coesite has been found to be nearly dry so far [27,28].
In this study, we synthesized hydrous coesite samples with various compositions (Si-pure, B-doped, Al-doped, as well as B plus Al-doped), and explored the effects of B and Al on the hydration mechanism and internal structure of coesite. Taking advantage of in-situ high-temperature Raman and FTIR vibrational spectra, we have also studied thermal response of lattice vibration with the contributions from the trace elements of H, Al, and B, which may provide important constraints on thermodynamic properties of coesite (such as heat capacities and entropy) under deep mantle conditions.

2. Materials and Methods

2.1. Sample Synthesis and Characterization

A total of five coesite samples were synthesized at the P-T conditions of 5 and 7.5 GPa and 1273 K with heating durations of 9–12 hours (Table 1), using welded Pt capsules in sintered MgO octahedron assemblies in the 1000-ton multi-anvil press at China University of Geosciences (Wuhan). The corner truncation of the 25.4-mm tungsten carbide cubes was 12 mm for synthetic experiments at 5 GPa and 8 mm for the runs conducted at 7.5 GPa, respectively. Temperature was monitored with a W5Re95–W2Re74 (C-type) thermocouple, and a graphite furnace was used in our experiments. Analytical reagent SiO2, Al(OH)3, B(OH)3 (purity of >99.99%) were adopted as the starting materials to synthesize hydrous coesite samples with different compositions: Si-pure (Run 503), B-doped (R663), Al-doped (R749), and B,Al-doped (R694 and R712). Excess liquid water (1 μL) was added in each capsule to guarantee the water fugacity. Single crystals up to 300 μm were recovered from these synthetic experiments, while no other crystallized phases were detected (by Raman spectra) in the run products.
In-situ analyses of the trace elements of B and Al in these synthetic coesite samples were conducted on an Agilent 7900 inductively coupled plasma mass spectrometry (ICP-MS) (Agilent Technology, Tokyo, Japan) combined with a Yb femtosecond laser ablation (fs-LA) system (GeoLas 2005, Lambda Physik, Göttingen, Germany), without applying an internal standard [29]. The ICP-MS works at a power of 1350 W with a plasma and an auxiliary gas flow rate of 15.0 and 1.0 L/min, respectively; while the fs-LA system (λ = 257 nm) is operated at a repetition rate of 8 Hz and a pulse length of 300 fs. The spot size is 24 μm with an energy density of 2.8 J/cm2, and a mixture of He and Ar is used as the carrier gas. The element contents of B and Al were calibrated against multiple-reference materials (BCR-2G, BIR-1G, and BHVO-2G) using the 100% oxide normalization method [30] with the detection limits of 0.1 ppmw for B and 0.8 ppmw for Al, and the determined average B and Al concentrations in these reference materials show relative deviations of −5 to about −10% from the recommended values [31]. The derived B and Al concentrations are listed in Table 1.
Because the Al concentration in R749 is as high as about 400 ppmw as indicated by fs-LA–ICP-MS, we further checked the Al composition by a JEOL JXA-8100 electron probe micro analyzer (EPMA) (JEOL Ltd., Akishima, Japan), which is equipped with four wavelength-dispersive spectrometers (WDS). The EPMA system is operated at an accelerating voltage of 15 kV and a beam current of 5 nA, while the spot size is reduced to 10 nm to minimize the fluctuations of X-ray intensity as well as sample damage [32]. The certified mineral standards of pyrope garnet (for Al) and olivine (for Si) were adopted for quantification using ZAF wavelength-dispersive corrections. Totally, twelve points were selected for measurements on the sample of R749, and the derived Al2O3 content is 0.0742 ± 0.0096 wt.% with a detection limit of 100 ppmw (corresponding to 393 ± 51 ppmw for the Al element), which is consistent with the result from fs-LA–ICP-MS within the experimental uncertainties.

2.2. Single-Crystal X-ray Diffraction (XRD)

A single grain (with a diameter of 100–120 μm) from each synthetic sample was selected for XRD at ambient conditions. The unit-cell parameters (Table 2) were refined on a Rigako XtalAB mini diffractometer (Rigaku, Akishima, Japan) with a 600-W rotating Mo-anode X-ray source, which is operated at 50 kV and 20 mA. A Saturn 724 HG CCD detector (with a resolution of 1024 × 1024) was mounted on this diffractometer. The average wavelength of Mo Kα1Kα2 was calibrated to 0.71073 Å, and intensity data were collected in the 2θ scanning range of up to 52°. The refinements of atomic positions (Table 3) and anisotropic displacement parameters (Table S1) were conducted using the software package of CrysAlisPro/Olex2 [33]. The data collection parameters are also listed in Table 2, including the numbers of the measured equivalent and unique reflections, as well as the model fit values for Goof, R1, and Rint. For all these synthetic single crystals, the Goof parameters remain below 1.1, while the R1 and Rint values are lower than 2.9% and 1.5%, respectively. The Si4+ [34] and O2 [35] ionic scattering factors were adopted, and the Si1 and Si2 occupancies were fixed at 1 (full) during the structural refinement procedures.

2.3. Vibrational Spectra at Room and High Temperatures

Single grains of a diameter less than 150 μm were chosen for in-situ high-temperature Raman measurement, using a Horiba LabRAM HR Evolution system (HORIBA JobinYvon S.A.S., Paris, France) with a Ar+ laser excitation source (λ = 532 nm) and a micro-confocal spectrometer. Each crystal piece was loaded on a sapphire plate in a Linkam TS 1500 heating stage (Linkam Scientific Instruments Ltd., Tadworth, Surrey, UK). High temperatures were generated by a resistance heater from 300 K up to 1500 K, with an increment of 50 K and a heating rate of 20 K/min. To further test the temperature dependence of these lattice vibrational modes, we also chose another grain from R503 for low-temperature Raman measurement. The sample piece was loaded on a sapphire window in a Linkam THMS 600 heating/cooling stage, and low temperatures were cooled down to 80 K by liquid nitrogen with a cooling rate of 15 K/min. The temperatures were automatically controlled with uncertainties less than 5 K. Each target temperature was maintained at least 5 minutes before measurement to guarantee thermal equilibrium.
To analyze the water contents in these synthetic coesite samples, 7–9 cleaned crystal pieces (in a diameter of 100–160 μm) were selected from each sample source for Mid-FTIR measurement at ambient condition. All these crystals were double-side polished to a thickness of 60–80 μm before measurements, and the water contents for each of these coesite samples are estimated as an average of these measured pieces in the following discussion. The IR spectra were collected using a Nicolet iS50 FTIR instrument (Thermofisher, Madison, WI, USA) coupled with a Continum microscope, a KBr beam-splitter, and a MCT-A detector cooled by liquid N2. For in-situ high-T FTIR measurement, four polished sample pieces (R503, R663, R694 and R749) was selected and loaded at the sapphire window of a custom HS1300G-MK2000 external heating stage (INSTC, Boulder, CO, USA). The FTIR spectra were obtained in the wavelength range above 3200 cm−1, with a resolution of 4 cm−1 and an accumulation of 256 scans. Temperatures were measured from room temperature to about 1200 K with an interval of 50 K and a heating rate of 15 K/min. Background was also obtained after the measurement on the sample for each step.

3. Results and Discussion

3.1. Hydration and B/Al Concentrations

The representative FTIR spectra for these synthetic coesite samples at ambient condition are shown in Figure 1. Four OH-stretching bands of v1 (3572 cm−1), v2a,b (3522 cm−1), v3 (3458 cm−1), and v4 (3300 cm−1) are detected for all these synthetic samples, which are independent of presence of B or Al. The mode v6 (3500 cm−1) is clearly observed with most absorbance for the B-doped samples (R663, R694, R712), as compared to the B-free samples (R503 and R749), which is caused by B-substitution in coesite (Si4+ = B3+ + H+) [25]. It should be noted that the B concentrations in this study are much higher than those synthesized in Koch-Müller et al. [25] (BR01-03), and the v6 absorbance is consequently significantly stronger than that for v2a,b.
The total H2O content in coesite (CH2O, wt%) can be calculated on the basis of Lambert–Beer law [24]:
C H 2 O = 1.8 × A i ρ × ε i × d ,
where ρ is density (2.93 g/cm3), d is the thickness of sample (cm−1), while εi is the integrated molar absorption coefficient for H2O, which was calibrated to be 190000 ± 30000 L·mol−1·cm−2 for coesite [24]. The integrated absorbance Ai in the wavenumber range from v1 to v2 is expressed as
A i = v 1 v 2 log ( I 0 I ) d v
where I0 and I are the intensities of incoming and transmitted radiation, respectively. For each coesite sample, several unoriented crystal pieces were selected and polished for FTIR measurement at room temperature, and similar Iv3/Iv1 and Iv2/Iv1 intensity ratios are observed among these FTIR spectra. The averaged hydration concentrations are listed in Table 1 with statistical uncertainties.
The hydration concentrations in these synthetic samples show a general trend: R663 (B-doped) > R503 (B,Al-free) > R694/R712 (B,Al-doped) > R749 (Al-doped). This observation can be satisfactorily interpreted as results of different incorporation mechanisms between B and Al in coesite. The predominant B-substitution mechanism in coesite should be an electrostatically coupled substitution Si4+ = B3+ + H+ [25], which could increase hydration solubility, as compared with the Si-pure sample R503. In contrast, most of Al cations were incorporated into the internal structure of coesite by causing oxygen vacancies (2Si4+ = 2Al3+ + OV), which is similar to the Al-substitution mechanism in stishovite [36,37]. Such Al-corporation may have an effect of reducing water solubility in coesite, according to the estimated water content in the sample R749. In the case of R749, the atomic concentration ratio of Al:H reaches more than 24:1, while in the B,Al-doped samples (R694 and R712), the sums of B and Al atomic concentrations are still four or five times of that for hydrogen. In addition, we also tried to collect Raman spectra on these samples in the similar frequency range of 3200–3700 cm−1, but no OH-stretching modes were detected due to the low water concentrations (no more than 60 ppmw).
The magnitudes of the B/106Si and Al/106Si concentrations in this study are about one order of magnitude higher than those (BR01, BR02, BR03, and BRcal2) from Koch-Müller et al. [25], whereas the magnitudes of the measured water contents from both studies are in the same range (H/106Si in a few hundred atomic ppm). The synthetic conditions (including pressure, temperature, heating duration, as well as excessive B and Al in the starting materials) are similar or comparable for both studies, while the main difference is that the Ni:NiO buffer was adopted in Koch-Müller et al. [25] to control water (oxygen) fugacity. However, it should be also noted that Deon et al. [26] also synthesized a coesite sample with 1600 atomic ppm B (B/106Si) and 900 atomic ppm H (H/106Si), both of which are even higher than those in our sample R663, at a P-T condition of 9.1 GPa and 1673 K.
Hence, the B and Al solubilities in coesite at high P-T conditions still need to be carefully examined, and the effect of oxygen fugacity should also be taken into consideration. What is more important, Koch-Müller et al. [25] measured B and Al concentrations by ion microprobe [38], whereas we used fs-LA–ICP-MS in this study, as well as EPMA to cross check the Al content in the sample R749. Hence, discrepancies between different analytical methods in different laboratories should also be considered.

3.2. Crystal Structures

The space group of coesite is C2/c, and SiO4 tetrahedra form an infinite three-dimensional framework of a (b-unique) monoclinic structure (Figure 2). There are a total of two Si sites (Si1 and Si2) and five O sites (special O1 and O2 sites, as well as general O3, O4, and O5 ones) in the lattice. The refined crystal structures in this study are consistent with the previous studies [10,39,40,41,42,43]. The measured unit-cell volumes of the B-doped (R663), B,Al-doped (R694 and R712), and Al-doped (R749) samples differ −0.15%, −0.3 to about −0.4%, and +0.1%, away from that for the Si-pure one (R503), respectively, while such differences are significantly larger than the experimental uncertainty from single-crystal XRD. Hence, even a few hundred ppm concentrations of B and Al trace elements could have noticeable impact on the volume of coesite, and a similar phenomenon was also noted by Koch-Müller et al. [25].
To further investigate any B and Al effects on the internal structure of coesite, we conducted structure refinements on these five synthetic samples. The calculated bond lengths and angles are listed in Table 4, using the software package XTALDRAW [44]. As compared with the Si-pure sample (R503), the B-doped (R663) and B,Al-doped (R694 and R712) ones exhibit significantly shorter Si1–O4 and Si1–O5 bond lengths, while the Al-doped one (R749) shows noticeably longer Si2–O4 and Si2–O5 bond lengths, which are generally consistent with the order of cation sizes of B3+ < Si4+ < Al3+. The Si2–O3 bond length for R503 is longer than those for other samples. In addition, there are no significant differences for the O–Si–O bond angles among these samples. Hence, we proposed that the B3+ cations may concentrate in the smaller Si1 tetrahedra, while the Al3+ cations would prefer the larger Si2 tetrahedra. The B,Al-coupled substitution seems to collapse the lattice structure even more, as compared with the case with only B substitution in coesite.

3.3. Lattice Vibrations and Grüneisen Parameters γiP

The Raman spectra measured at ambient condition (in the frequency range up to 1200 cm−1) are shown in Figure 3 for these synthetic samples. The fitted peak positions are listed in Table S2, and the vibrational bands at 521 cm−1 are always detected with most intensity. The Raman spectra are essentially the same among these coesite samples, while the most noticeable difference is that for the Al-doped samples (R694, R712, and R749). The intensities of the Raman modes at 151 and 178 cm−1 are relatively stronger and even comparable to the one at 119 cm−1, as compared with those for the Al-free samples (R503 and R663). There are a total of 33 Raman-active modes (16 Ag(R) + 17 Bg(R)) as well as 36 IR-active modes (18 Au(IR) + 18 Bu(IR)) predicted for coesite [16,17], while fewer peaks are detected in this Raman measurement.
Next, we carried out in-situ high-temperature Raman experiments on the Si-pure (R503), B-doped (R663), Al-doped (R749), and B,Al-doped (R712) samples, as well as low-temperature measurement on R503. The representative Raman spectra for R503 at various temperatures are shown in Figure 4A as an example, while the high-T spectra for other coesite samples are deposited in the supplementary Figure S1 (See Supplementary Materials). The R503 sample was heated up to the temperature of 1500 K, and no phase transition was detected throughout the heating procedure. Although the signals got weaker and the background radiation became stronger especially at high temperatures above 1300 K, most of the Raman peaks could still be distinguished and fitted at the high temperatures. Another spectrum was recorded when the temperature was quenched to room temperature, and no clear shifts were observed among these Raman bands compared with those before heating (Figure 4B). Meanwhile, Bourova et al. [11] superheated a coesite sample to the temperature of 1776 K (at ambient pressure), which was 900 K higher than the predicted metastable melting point [45], and the coesite sample remained stable without any significant phase transition, melting, or amorphization. On the other hand, Liu et al. [19] reported amorphization of a hydrous coesite sample at a relatively low temperature of 1473 K. (See Supplementary Materials).
Variation of these Raman-active modes for R503 is plotted as a function of temperature in Figure 5A–C, and the data points at low temperatures are in consistence with those at high temperatures (Figures S2–S4 for R663, R712, and R749, individually). All these bands systematically shift to a lower frequency at elevated temperature, and linear regression was fitted to each mode with the negative slopes (δνiT) (at P = 0 GPa) (Table S2). The values of (δνiT)P are typically in the range of −0.01 to about −0.03 (cm−1·K−1) for the modes below 350 cm−1 or above 700 cm−1, while −0.002 to about −0.007 (cm−1·K−1) for the ones in the range from 350 to 700 cm−1. Our result is essentially in agreement with the previous high-temperature Raman studies on SiO2-pure coesite [17,46].
The isobaric mode Grüneisen parameter (γiP) is defined as
γ i P = 1 α v i ( v i T ) P ,
where α is the averaged volumetric thermal expansion coefficient (α = 8.4 × 10⁻⁶ K−1 for coesite [11]). The calculated γiP parameters are shown in Figure 6A for the samples of R503, R663, R712, and R749. The Raman-active modes above 400 cm−1 are mostly associated with the internal bending and stretching vibrations of SiO4 tetrahedra linked in a three-dimensional framework for coesite [17,19,47]. The corresponding γiP parameters (1.4–3.2) are systematically larger than those internal modes (0–1.4) for isolated SiO4 units as in forsterite (Mg-pure olivine) [48,49] and pyrope garnet [50], as well as a one-dimensional Si2O6 chain as in enstatite (MgSiO3-orthorpyroxene) [51], which are the most abundant minerals in the upper mantle above 410-km seismic discontinuity. Although the magnitudes of the (δνiT)P slopes are similar among these studies, the thermal expansion coefficient for coesite [11] is much smaller as compared with these silicate minerals [52,53,54]. On the other hand, for the bands below 350 cm−1, which are typically attributed to the external vibrations of SiO4 tetrahedra in coesite, the values of γiP Grüneisen parameters are distributed in a much wider value range from −5 to 20.
Next, the differences of the γiP parameters among the samples of R663, R712, R749, and R503 (reference) are plotted in Figure 6B. The most significant difference is that in the frequency range below 350 cm−1, the γiP parameters for the Al-doped samples (R712 and R749) are systematically lower than those for the Al-free ones (R503 and R663), while no such differences are observed above 400 cm−1. When the Al3+ cations take the place of Si4+ in the tetrahedra, the thermal response of the enlarged tetrahedra units could get hindered to some extent at high temperature, while the smaller B3+ cations do not show such an effect on the external vibrations of the tetrahedra units in coesite.

3.4. OH-Stretching Modes at High Temperature

The selected high-temperature FTIR spectra for R503 are shown in Figure 7A in the temperature range up to 1150 K (Figure S5 for other coesite samples). The IR signal became weaker and broader at a higher temperature, which might be caused by rapid proton hopping between adjacent O atoms [55,56], as well as a black body radiation effect. Above 700 K, the broadened OH-stretching modes of v1, v2a,b, and v3 (in the frequency range of 3450–3600 cm−1) merge to be a broad hump and could not be distinguished from each other. The weak and discrete v4 band (around 3300 cm−1) vanishes very quickly and cannot be detected above 500 K. Another FTIR spectrum was collected when quenched to room temperature, and all these four OH-stretching bands could be clearly identified at the same positions as before heating (Figure 7B). The integrated absorbance for all these OH modes is about 80% of that before heating, and then 20% of the OH groups in the sample could be dehydrated during the heating procedure up to 1150 K. On the other hand, 30–40% dehydration was also observed for other samples at temperatures of up to 1000–1100 K, by comparing the integrated IR absorbance of the OH-stretching modes before and after heating. Meanwhile, Liu et al. [19] also conducted high-T FTIR measurement on hydrous coesite, and they observed noticeable dehydration above 870 K as well as completed dehydration at the temperature of 1473 K. In addition, we also conducted reflectance FTIR measurements [56,57] on these coesite samples. Nevertheless, due to the low water contents, the signals are significantly weaker as compared with those collected in the transmission method at ambient condition, and the OH bands could not be observed in the reflectance IR spectra above 500 K.
Variations of the OH bands with temperature are plotted in Figure 8A–D for samples R503, R663, R694, and R749. Throughout the high-T measurments, the modes of v2a,b, v3, as well as v6 (for B-doped samples of R663 and R712) were observed to show a ‘blue-shift’ with a slope (δνiT)P of +0.01 to about +0.20 cm−1·K−1, whereas a slight ‘red shift’ is detected for the v1 mode (at a high frequency of around 3600 cm−1) with a temperature derivative of –0.08 to about –0.20 cm−1·K−1. Above 600–700 K, these OH vibrations cannot be distinguished from each other, and the broad hump is observed to gradually move to a higher frequency at a higher temperature, with a temperature dependence of +0.05 to about +0.09 cm−1·K−1. In addition, the v4 mode also shows a ‘blue shift’ with temperature increasing to below 500 K.
The OH-stretching modes observed in this study (in the frequency range above 3300 cm−1 with O...O distance of >2.74 cm−1) should be attributed to protonation outside SiO4 tetrahedra with the OH bonds pointing away from the centers of the tetrahedra [24,25,26]. The oxygen anion, that belong to different SiO4 tetrahedra, may try to get away from each other during the thermal expansion and relaxation procedure at high temperature (i.e., the O...O distance between tetrahedra becomes larger). Consequently, we observe a ‘blue shift’ for most of the OH-stretching bands in the high-temperature FTIR measurements. On the other hand, Koch-Müller et al. [25] reported that some other OH-stretching modes (v7, v8, v9, and v10 in the wavenumber range of 3370–3470 cm−1) shift to higher frequencies at a high pressure of up to 10 GPa.

4. Conclusions

(1)
We synthesized several hydrous coesite samples with different B and Al compositions at pressures of about 5–7.5 GPa (1273 K) in the multi-anvil press. The concentrations of the B/Al trace elements were measured by fs-LA–ICP-MS, while H2O contents were estimated by FTIR. The B concentrations are more than 400 atomic ppm (B/106Si) with ~350 ppmw H2O, while the Al3+ contents are about 1100–1300 atomic ppm, which were cross checked by both ICP-MS and EPMA. Al-substitution significantly reduces the hydrogen concentration in coesite. Hence, the mechanism controlled by oxygen vacancies (2Si4+ = 2Al3+ + OV) may be dominant for the Al incorporation, which is similar to that in aluminous stishovite, while the B incorporation may prefer the electrostatically coupled substitution (Si4+ = B3+ + H+);
(2)
The doped B3+ and Al3+ cations would prefer the Si1 and Si2 tetrahedra, respectively, and the single-crystal structure refinements reveal that B3+ significantly shortens the Si1–O4 and Si1–O5 bond lengths, whereas Al3+ noticeably elongates the Si2–O4 and Si2–O5 distances;
(3)
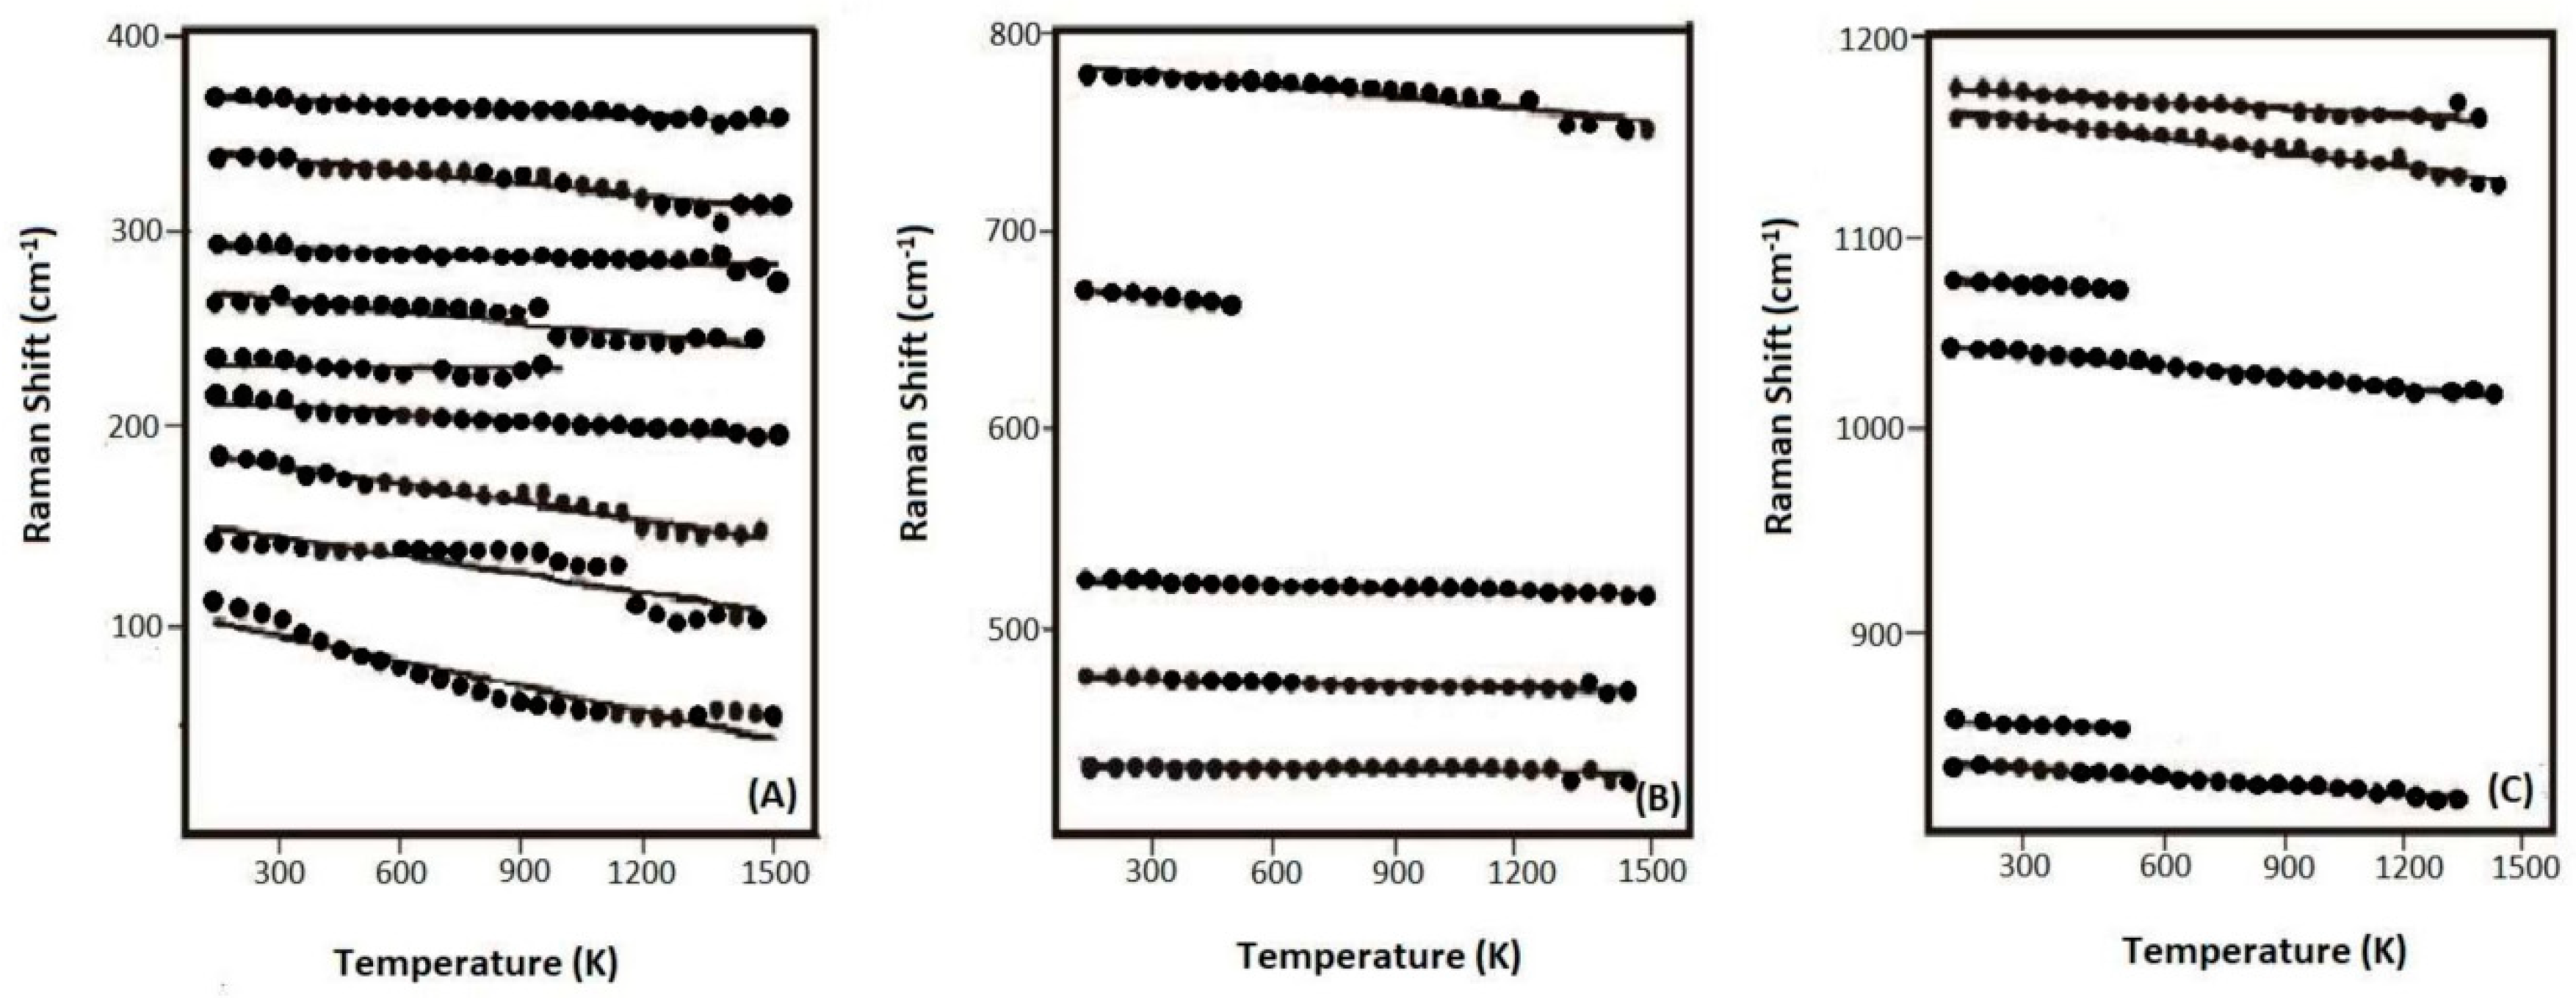
In-situ high-temperature Raman spectra were collected on these synthetic samples of up to 1500 K (at ambient condition), and no amorphization of phase transition was observed throughout the heating procedures. The derived isobaric mode Grüneisen parameters (γiP) for the external vibrations of SiO4 units (below 350 cm−1) are significantly reduced for the Al-doped samples, as compared with the Al-free ones. Hence, the relaxation of the SiO4 units might be hindered to some extent due to the enlarged tetrahedra units by Al-substitution. On the other hand, the γiP parameters for the internal bending and stretching modes of SiO4 tetrahedra in coesite (above 400 cm−1) are significantly larger than those of most silicate minerals, due to the abnormally small thermal expansion coefficient for coesite;
(4)
The OH-stretching modes v1, v2a,b, v3, and v4 are observed for all these hydrous samples with the various compositions, and another strong band v6 is also observed for the B-doped ones. Most of these OH vibrational modes shift to higher frequencies at elevated temperatures (except the weak v1 mode around 3600 cm−1), implying that the O...O distances between different SiO4 gets longer during the thermal relaxation of the lattice framework at a high temperature. On the other hand, about 20–40% dehydration of OH groups were observed for these hydrous coesite samples at high temperatures above 1000 K at ambient pressure.

Supplementary Materials

The following are available online at https://0-www-mdpi-com.brum.beds.ac.uk/2073-4352/9/12/642/s1, Figure S1. Selected high-temperature Raman spectra as well as the pattern taken when quenched to room temperature for the samples of (A) R663, (B) R712 and (C) R749. Figure S2. The frequencies for the Raman-active modes as a function of temperature for the sample of R712: (A) 0–400 cm−1, (B) 400–800 cm−1 and (C) 800–1200 cm−1. Linear regression is fitted for each dataset. Figure S3. The frequencies for the Raman-active modes as a function of temperature for the sample of R663: (A) 0–400 cm−1, (B) 400–800 cm−1 and (C) 800–1200 cm−1. Linear regression is fitted for each dataset. Figure S4. The frequencies for the Raman-active modes as a function of temperature for the sample of R749: (A) 0–400 cm−1, (B) 400–800 cm−1 and (C) 800–1200 cm−1. Linear regression is fitted for each dataset. Figure S5. Representative FTIR spectra obtained at high temperatures as well as when quenched to room temperature for the samples of (A) R663, (B) R694 and (C) R749. Table S1. Anisotropic displacement parameters (Å2) for the synthetic coesite samples in this study. Table S2. The frequencies of the Raman-active modes at ambient condition, as well as the temperature dependence and γiP parameters. Table S3. The frequencies of the OH bands by FTIR measurement at ambient temperature if not noted, as well as their temperature dependence. The cif files are for the single-crystal structure refinements for the five coesite samples (R503, R663, R694, R712 and R749).

Author Contributions

Conceptualization, Y.Y.; methodology and investigation, Y.M., Y.P., D.L., X.W., and X.Z.; writing—original draft preparation, Y.M.; writing—review and edition, Y.Y., J.R.S., and J.Z.; visualization, Y.M. and Y.Y.; supervision, Y.Y.; project administration, Y.Y.; funding acquisition, Y.Y. All authors discussed the results and commented on the manuscript.

Funding

This research was funded by the National Key Research and Development Program of China (Grant No. 2016YF0600204), the National Natural Science Foundation of China (Grant Nos. 41590621 and 41672041).

Acknowledgments

The multi-anvil press synthesis, fs-LA–ICP-MS, EPMA, and high-temperature Raman measurements were conducted at China University of Geosciences (CUG) at Wuhan; the single-crystal X-ray diffraction experiments were carried out at Huazhong University of Science and Technology (HUST); while the high-temperature FTIR spectra were collected at Zhejiang University. Many thanks to Tao Luo (CUG), Yan Qin (HUST), and Xiaoyan Gu (Zhejiang University) for their experimental assistance.

Conflicts of Interest

The authors declare no conflict of interest.

References

  1. Coes, L. A new dense crystalline silica. Science 1953, 118, 131–132. [Google Scholar] [CrossRef] [PubMed]
  2. Kieffer, S.W.; Phakey, P.P.; Christie, J.M. Shock processes in porous quartzite: Transmission electron microscope observations and theory. Contrib. Mineral. Petrol. 1976, 59, 41–93. [Google Scholar] [CrossRef]
  3. Folco, L.; Mugnaioli, E.; Gemelli, M.; Masotta, M.; Campanale, F. Direct quartz-coesite transformation in shocked porous sandstone from Kamil Crater (Egypt). Geology 2018, 9, 739–742. [Google Scholar] [CrossRef]
  4. Smyth, J.R.; Hatton, C.J. A coesite-sanidine grospydite from the Roberts-Victor Kimberlite. Earth Planet. Sci. Lett. 1977, 34, 284–290. [Google Scholar] [CrossRef]
  5. Wang, X.M.; Liou, J.G.; Mao, H.K. Coesite-bearing eclogite from the Dabie mountains in central China. Geology 1989, 17, 1085–1088. [Google Scholar] [CrossRef]
  6. Bi, H.; Song, S.; Dong, J.; Yang, L.; Qi, S.; Allen, M.B. First discovery of coesite in eclogite from East Kunlun, northwest China. Sci. Bull. 2018, 63, 1536–1538. [Google Scholar] [CrossRef] [Green Version]
  7. Mosenfelder, J.L.; Bohlen, S.R. Kinetics of the coesite to quartz transformation. Earth Planet. Sci. Lett. 1997, 153, 133–147. [Google Scholar] [CrossRef]
  8. Chopin, C. Coesite and pure pyrope in high-grade blueschists of the Western Alps: A first record and some consequences. Contrib. Mineral. Petrol. 1984, 86, 107–118. [Google Scholar] [CrossRef]
  9. Angel, R.J.; Mosenfelder, J.L.; Shaw, C.S.J. Anomalous compression and equation of state of coesite. Phys. Earth Planet. Inter. 2001, 124, 71–79. [Google Scholar] [CrossRef]
  10. Angel, R.J.; Shaw, C.S.J.; Gibbs, G.V. Compression mechanisms of coesite. Phys. Chem. Miner. 2003, 30, 167–176. [Google Scholar] [CrossRef]
  11. Bourova, E.; Pichet, P.; Petitet, J.-P. Coesite (SiO2) as an extreme case of superheated crystal: An X-ray diffraction study up to 1776 K. Chem. Geol. 2006, 229, 57–63. [Google Scholar] [CrossRef]
  12. Chen, T.; Gwanmesia, G.D.; Wang, X.; Zou, Y.; Liebermann, R.C.; Michaut, C.; Li, B. Anomalous elastic properties of coesite at high pressure and implications for the upper mantle X-discontinuity. Earth Planet. Sci. Lett. 2015, 412, 42–51. [Google Scholar] [CrossRef] [Green Version]
  13. Haines, J.; Leger, J.M.; Gorelli, F.; Hanfland, M. Crystalline post-quartz phase in silica at high pressure. Phys. Rev. Lett. 2001, 87, 155503. [Google Scholar] [CrossRef]
  14. Černok, A.; Ballaran, T.B.; Caracas, R.; Miyajima, N.; Bykova, E.; Prakapenka, V.; Libermann, H.P.; Dubrovinsky, L. Pressure-induced phase transitions in coesite. Am. Miner. 2014, 99, 755–763. [Google Scholar] [CrossRef] [Green Version]
  15. Hu, Q.Y.; Shu, J.-F.; Cadien, A.; Meng, Y.; Yang, W.G.; Sheng, H.W.; Mao, H.-K. Polymorphic phase transition mechanism of compressed coesite. Nat. Commun. 2015, 6, 6630. [Google Scholar] [CrossRef] [PubMed]
  16. Hemley, R.J. Pressure dependence of Raman spectra of SiO2 polymorphs: α-quartz, coesite, and stishovite. In High Pressure Research in Mineral Physics; Manghnani, M.H., Syono, Y., Eds.; Geophysics Monograph Series 39; AGU: Washington, DC, USA, 1987; pp. 347–359. [Google Scholar]
  17. Gillet, P.; Le, C.A.; Madon, M. High-temperature Raman spectroscopy of SiO2 and GeO2 polymorphs: Anharmonicity and thermodynamic properties at high-temperatures. J. Geophys. Res. 1990, 95, 21635–21655. [Google Scholar] [CrossRef] [Green Version]
  18. Williams, Q.; Hemley, R.L.; Kruger, M.B.; Jeanloz, R. High pressure infrared spectra of α-quartz, coesite, stishovite and silica glass. J. Geophys. Res. 1993, 98, 157–170. [Google Scholar] [CrossRef]
  19. Liu, X.; Ma, Y.; He, Q.; He, M. Some IR features of SiO4 and OH in coesite, and its amorphization and dehydration at ambient pressure. J. Asian Earth Sci. 2017, 148, 315–323. [Google Scholar] [CrossRef]
  20. He, M.; Yan, W.; Chang, Y.; Liu, K.; Liu, X. Fundamental infrared absorption of α-quartz: An unpolarzied single-crystal absorption infrared spectroscopic study. Vib. Spectrosc. 2019, 101, 52–63. [Google Scholar] [CrossRef]
  21. Mosenfelder, J.L.; Schertl, H.-P.; Smyth, J.R.; Liou, J.G. Factors in the preservation of coesite: The importance of fluid infiltration. Am. Miner. 2005, 90, 779–789. [Google Scholar] [CrossRef]
  22. Lathe, C.; Koch-Müller, M.; Wirth, R.; Van Westrenen, W.; Mueller, H.-J.; Schilling, F.; Lauterjung, J. The influence of OH in coesite on the kinetics of the coesite-quartz phase transition. Am. Miner. 2005, 90, 36–43. [Google Scholar] [CrossRef] [Green Version]
  23. Mosenfelder, J.L. Pressure dependence of hydroxyl solubility in coesite. Phys. Chem. Miner. 2000, 27, 610–617. [Google Scholar] [CrossRef]
  24. Koch-Müller, M.; Fei, Y.; Hauri, E. Location and quantitative analysis of OH in coesite. Phys. Chem. Miner. 2001, 28, 693–705. [Google Scholar] [CrossRef]
  25. Koch-Müller, M.; Dera, P.; Fei, Y.; Reno, B.; Sobolev, N.; Hauri, E.; Wysoczanski, R. OH in synthetic and natural coesite. Am. Miner. 2003, 88, 1436–1445. [Google Scholar] [CrossRef]
  26. Deon, F.; Koch-Müller, M.; Hövelmann, J.; Rhede, D.; Thomas, S.-M. Coupled boron and hydrogen incorporation in coesite. Eur. J. Mineral. 2009, 21, 9–16. [Google Scholar] [CrossRef]
  27. Rossman, G.R.; Smyth, J.R. Hydroxyl contents of accessory minerals in mantle eclogites and related rocks. Am. Miner. 1990, 75, 775–780. [Google Scholar]
  28. Zhang, J.F.; Shi, F.; Xu, H.J.; Wang, L.; Feng, S.Y.; Liu, W.L.; Wang, Y.F.; Green, H.W. Petrofabric and strength of SiO2 near the quartz-coesite phase boundary. J. Metamorph. Geol. 2013, 31, 83–92. [Google Scholar] [CrossRef]
  29. Luo, T.; Ni, Q.; Hu, Z.; Zhang, W.; Shi, Q.; Günther, D.; Liu, Y.; Zong, K.; Hu, S. Comparison of signal intensities and elemental fractionation in 257 nm femtosecond LA-ICP-MS using He and Ar as carrier gases. J. Anal. At. Spectrom. 2017, 32, 2217–2225. [Google Scholar] [CrossRef]
  30. Li, Z.; Hu, Z.; Liu, Y.; Gao, S.; Li, M.; Zong, K.; Chen, H.; Hu, S. Accurate determination of elements in silicate glass by nanosecond and femtosecond laser ablation ICP-MS at high spatial resolution. Chem. Geol. 2015, 400, 11–23. [Google Scholar] [CrossRef]
  31. Jochum, K.P.; Willbold, M.; Raczek, I.; Stoll, B.; Herwig, K. Chemical characterization of the USGS reference glasses GSA-1G, GSC-1G, GSD-1G, GSE-1G, BCR-2G, BHVO-2G and BIR-1G using EPMA, ID-TIMS, ID-ICP-MS and LA-ICP-MS. Geostand. Geoanal. Res. 2005, 29, 285–302. [Google Scholar] [CrossRef]
  32. Wang, X.; Xu, X.; Ye, Y.; Wang, C.; Liu, D.; Shi, X.; Wang, S.; Zhu, X. In-situ high-temperature XRD and FTIR for calcite, dolomite and magnesite: Anharmonic contribution to the thermodynamic properties. J. Earth Sci. 2019, 30, 964–976. [Google Scholar] [CrossRef]
  33. Dolomanov, O.V.; Blake, A.J.; Champness, N.R.; Schroder, M. Olex: New software for visualization and analysis of extended crystal structures. J. Appl. Crystallogr. 2003, 36, 1283–1284. [Google Scholar] [CrossRef] [Green Version]
  34. Cromer, D.T.; Mann, J. X-ray scattering factors computed from numerical Hartree-Fock wave functions. Acta Crystallogr. 1968, A24, 321–325. [Google Scholar] [CrossRef] [Green Version]
  35. Tokonami, M. Atomic scattering factor for O2−. Acta Crystallogr. 1965, 19, 486. [Google Scholar] [CrossRef]
  36. Pawley, A.R.; McMillan, P.F.; Holloway, J.R. Hydrogen in stishovite, with implications for mantle water content. Science 1993, 261, 1024–1026. [Google Scholar] [CrossRef]
  37. Litasov, K.D.; Kagi, H.; Shatskiy, A.; Ohtani, E.; Lakshtanov, D.L.; Bass, J.D.; Ito, E. High hydrogen solubility in Al-rich stishovite and water transport in the lower mantle. Earth Planet. Sci. Lett. 2007, 262, 620–634. [Google Scholar] [CrossRef]
  38. Shimizu, N.; Hart, S.R. Applications of the ion microprobe to geochemistry and cosmochemistry. Annu. Rev. Earth Planet. Sci. 1982, 10, 483–526. [Google Scholar] [CrossRef]
  39. Araki, T.; Zoltai, T. Refinement of a coesite structure. Z. Krist. 1969, 129, 381–387. [Google Scholar] [CrossRef] [Green Version]
  40. Levien, L.; Prewitt, C.T. High-pressure crystal structure and compressibility of coesite. Am. Miner. 1981, 66, 324–333. [Google Scholar]
  41. Smyth, J.R.; Artioli, G.; Smith, J.V.; Kvick, A. Crystal structure of coesite, a high-pressure form of SiO2, at 15 and 298 K from single-crystal neutron and X-ray diffraction data: Test of bonding models. J. Phys. Chem. 1987, 91, 988–992. [Google Scholar] [CrossRef]
  42. Sasaki, S.; Chen, H.K.; Prewitt, C.T.; Nakajima, Y. Re-examination of “P21/a coesite”. Z. Krist. 1983, 164, 67–77. [Google Scholar] [CrossRef]
  43. Ikuta, D.; Kawame, N.; Banno, S.; Hirajima, T.; Ito, K.; Rakovan, J.F.; Downs, R.T.; Tamada, O. First in situ X-ray diffraction identification of coesite and retrograde quartz on a glass thin section of an ultrahigh-pressure metamorphic rock and their crystal structure details. Am. Miner. 2007, 92, 57–63. [Google Scholar] [CrossRef]
  44. Downs, R.T.; Bartelmehs, K.L.; Gibbs, G.V.; Boisen, M.B. Interactive software for calculating and displaying X-ray or neutron power diffractometer patterns of crystalline materials. Am. Miner. 1993, 78, 1104–1107. [Google Scholar]
  45. Richet, P. Superheating, melting and vitrification through decompression of high-pressure minerals. Nature. 1988, 331, 56–58. [Google Scholar] [CrossRef]
  46. Liu, L.G.; Mernagh, T.P.; Hibberson, W.O. Raman spectra of high-pressure polymorphs of SiO2 at various temperatures. Phys. Chem. Miner. 1997, 24, 396–402. [Google Scholar] [CrossRef]
  47. Kieffer, S.W. Thermodynamics and lattice vibrations of minerals: Lattice dynamics and an approximation for minerals with application to simple substances and framework silicates. Rev. Geophys. 1979, 17, 35–39. [Google Scholar] [CrossRef]
  48. Gillet, P.; Daniel, I.; Guyot, F. Anharmonic properties of Mg2SiO4-forsterite measured from the volume dependence of the Raman spectrum. Eur. J. Mineral. 1997, 9, 255–262. [Google Scholar] [CrossRef]
  49. Yang, Y.; Wang, Z.; Smyth, J.R.; Liu, J.; Xia, Q. Water effects on the anharmonic properties of forsterite. Am. Miner. 2015, 100, 2185–2190. [Google Scholar] [CrossRef]
  50. Gillet, P.; Fiquet, G.; Malezieux, J.M.; Geiger, C.A. High-pressure and high-temperature Raman spectroscopy of end-member garnets: Pyrope, grossular and andradite. Eur. J. Mineral. 1992, 4, 651–664. [Google Scholar] [CrossRef]
  51. Zucker, R.; Shim, S.-H. In situ Raman spectroscopy of MgSiO3 enstatite up to 1550 K. Am. Miner. 2009, 94, 1638–1646. [Google Scholar] [CrossRef]
  52. Kroll, H.; Kirfel, A.; Heinemann, R.; Barbier, B. Volume thermal expansion and related thermophysical parameters in the Mg, Fe olivine solid-solution series. Eur. J. Mineral. 2012, 24, 935–956. [Google Scholar] [CrossRef]
  53. Du, W.; Clark, S.M.; Walker, D. Thermo-compression of pyrope-grossular garnet solid solutions: Non-linear compositional dependence. Am. Miner. 2015, 100, 215–222. [Google Scholar] [CrossRef]
  54. Jackson, J.M.; Palko, J.W.; Andrault, D.; Sinogeikin, S.V.; Lakshtanov, D.L.; Wang, J.; Bass, J.D.; Zha, C.-S. Thermal expansion of natural orthoenstatite up to 1472 K. Eur. J. Mineral. 2003, 97, 6842–6866. [Google Scholar]
  55. Keppler, H.; Bagdassarov, N.S. High-temperature FTIR spectra of H2O in rhyolite melt to 1300 °C. Am. Miner. 1993, 78, 1324–1327. [Google Scholar]
  56. Grzechnik, A.; McMillan, P.F. Temperature dependence of the OH absorption in SiO2 glass and melt to 1975 K. Am. Miner. 1998, 83, 331–338. [Google Scholar] [CrossRef]
  57. Moore, G.; Chizmshya, A.; McMillan, P.F. Calibration of a reflectance FTIR method for determination of dissolved CO2 concentration in rhyolitic glasses. Geochim. Gosmochim. Acta 2000, 64, 3571–3579. [Google Scholar] [CrossRef]
Figure 1. Representative FTIR spectra obtained at ambient conditions with the OH-stretching bands noted.
Crystals 09 00642 g001
Figure 2. Crystal structure of coesite sketched on the basis of the structure refinement for the sample R503 in this study. The smaller (at centers of tetrahedra) and larger balls represent Si and O atoms, respectively.
Crystals 09 00642 g002
Figure 3. Raman spectra obtained at ambient condition for these synthetic coesite samples.
Crystals 09 00642 g003
Figure 4. (A) Selected Raman spectra for the sample of R503 at various temperatures; (B) comparison of the Raman spectra taken before and after heating.
Crystals 09 00642 g004
Figure 5. Variation of the frequencies for the Raman-active modes (R503) with temperature, in the frequency ranges of (A) 0–400 cm−1, (B) 400–800 cm−1, and (C) 800–1200 cm−1. Linear regression is fitted for each dataset.
Crystals 09 00642 g005
Figure 6. (A) The isobaric mode Grüneisen parameters (γiP) for the synthetic samples of R503, R663, R712, and R749; (B) comparison among the γiP parameters with the ones for the sample R503 set as reference.
Crystals 09 00642 g006
Figure 7. (A) Representative spectra for the sample of R503 at elevated temperatures; (B) comparison of the OH-stretching bands measured before and after heating.
Crystals 09 00642 g007
Figure 8. The frequencies of the OH-stretching modes as a function of temperature for the samples of (A) R503, (B) R663, (C) R694, and (D) R749. Linear regression lines are fitted (Table S3), and the vertical error bars represent the full-width of half maximum for each OH-stretching mode.
Crystals 09 00642 g008
Table 1. Starting composition and synthetic condition for each run. The B and Al element concentrations are mainly measured by femtosecond laser ablation (fs-LA)–ICP-MS, while the H contents are estimated by FTIR.
Run No. Starting Materials
(wt.%)
Pressure
(GPa)
Temperature
(K)
Time
(h)
B
(ppmw)
B/106SiAl
(ppmw)
Al/106SiH2O
(ppmw)
H/106Si
R503:  SiO2 + 1 μL H2O7.512731232.3 ± 14.2215 ± 95
R663:  SiO2 (96) + H3BO3 (4) + 1 μL H2O512731074.6 ± 3.5445 ± 2151.0 ± 19.8340 ± 132
R694:  SiO2 (94) + H3BO3 (3) + Al(OH)3 (3) + 1 μL H2O 512731073.4 ± 9.0437 ± 54115.6 ± 52.0343 ± 15422.8 ± 11.7152 ± 78
R712:  SiO2 (94) + H3BO3 (3) + Al(OH)3 (3) + 1 μL H2O7.51273939.7 ± 8.2237 ± 49139.8 ± 31.7415 ± 9424.1 ± 10.9161 ± 73
R749:  SiO2 (96) + Al(OH)3 (4) + 1 μL H2O512739445.8 ± 86.5 a
392.7 ± 50.8 b
1323 ± 257 a
1166 ± 151 b
7.2 ± 2.948 ± 19
a: measured by ICP-MS; b: determined by an electron probe micro analyzer (EPMA).
Table 2. Intensity data collection and unit-cell parameters for the synthetic coesite samples.
R503R663R694R712R749
a (Å)7.1458 (5)7.1332 (9)7.1355 (5)7.1426 (13)7.1437(7)
b (Å)12.3922 (10)12.3886 (5)12.3678 (5)12.3698 (8)12.3964 (6)
c (Å)7.1778 (8)7.1828 (16)7.1763 (8)7.1788 (16)7.1858 (12)
β (°)120.293 (11)120.31 (2)120.358 (10)120.37 (2)120.292 (15)
V3)548.82 (10)548.01 (18)546.47 (9)547.24 (19)549.46 (13)
No. total refl.102877721179111346
No. unique total366436523467487
No. unique I > 4σ348427511446461
Goof1.0841.0591.0211.0511.041
R1 for all (%)2.452.892.912.672.83
R1 for I > 4σ (%)2.332.842.862.572.72
Rint (%)1.330.621.041.231.47
The unit-cell angles: α = γ = 90°.
Table 3. Refined atomic position coordinates.
R503R663R694R712R749
Si1x0.14027 (12)0.14048 (13)0.14044 (9)0.14049 (11)0.14050 (11)
y0.10826 (6)0.10833 (5)0.10835 (4)0.10832 (5)0.10829 (5)
z0.07226 (10)0.07240 (15)0.07242 (9)0.07232 (11)0.07242 (11)
Si2x0.50653 (12)0.50655 (13)0.50668 (9)0.50682 (11)0.50675 (11)
y0.15808 (6)0.15794 (5)0.15796 (8)0.15798 (5)0.15795 (5)
z0.54061 (10)0.54028 (15)0.54069 (8)0.54073 (11)0.54079 (10)
O2x0.50.50.50.50.5
y0.1162 (2)0.1164 (2)0.1164 (15)0.1163 (2)0.11656 (17)
z0.750.750.750.750.75
O3x0.7340 (3)0.7333 (3)0.7336 (2)0.7334 (3)0.7335 (3)
y0.12289 (16)0.12287 (15)0.12290 (12)0.12284 (15)0.12280 (13)
z0.5603 (3)0.5593 (4)0.5594 (3)0.5594 (3)0.5595 (3)
O4x0.3115 (3)0.3103 (4)0.3109 (2)0.3112 (3)0.3107 (3)
y0.10385 (17)0.10397 (15)0.10386 (11)0.10372 (15)0.10377 (12)
z0.3282 (3)0.3278 (4)0.3278 (2)0.3282 (3)0.3276 (3)
O5x0.0172 (3)0.0168 (3)0.0174 (2)0.0175 (3) 0.0175 (3)
y0.21182 (17)0.21177 (15)0.21174 (11)0.21173 (15)0.21168 (13)
z0.4784 (3)0.4787 (4)0.4786 (2)0.4786 (3)0.4786 (3)
The O1 site is at the inversion center with x = y = z = 0.
Table 4. Bond lengths (Å), bond angles (°), and polyhedral volumes (Å3).
R503R663R694R712R749
Si1–O11.5966 (8)1.5968 (7)1.5949 (5)1.5953 (7)1.5980 (6)
Si1–O31.6134 (16)1.6130 (20)1.6105 (15)1.6120 (20)1.6134 (17)
Si1–O41.6146 (19)1.6090 (30)1.6088 (16)1.6120 (20)1.6106 (19)
Si1–O51.6230 (20)1.6184 (19)1.6191(14)1.6205 (19)1.6229 (16)
<Si1–O>1.6119 (22)1.6093 (19)1.6083 (13)1.6100 (16)1.6112 (16)
Poly. Vol.2.1485 (25)2.1382 (30)2.1344 (24)2.1415 (21)2.1457 (20)
Si2–O21.6130 (12)1.6147 (12)1.6109 (7)1.6121 (11)1.6121 (9)
Si2–O31.6194 (18)1.6125 (19)1.6150 (14)1.6150 (20)1.6160 (16)
Si2–O41.6050 (20)1.6060 (30)1.6049 (15)1.6046 (19)1.6111 (18)
Si2–O51.6200 (20)1.6213 (19)1.6191 (14)1.6194 (19)1.6283 (17)
<Si2–O>1.6144 (23)1.6136 (22)1.6125 (14)1.6128 (12)1.6169 (6)
Poly. Vol.2.1579 (24)2.1563 (30)2.1515 (18)2.1522 (22)2.1645 (20)
O1–Si1–O3110.37 (9)110.28 (9)110.35 (6)110.41 (8)110.32 (7)
O1–Si1–O4109.41 (8)109.34 (8)109.33 (5)109.28 (8)109.32 (6)
O1–Si1–O5109.94 (8)110.03 (16)109.83 (6)109.75 (8)109.80 (7)
O4–Si1–O3110.26 (11)110.51 (12)110.34 (9)110.30 (11)110.39 (10)
O4–Si1–O5108.86 (10)108.81 (12)108.91 (8)108.92 (10)108.92 (9)
O3–Si1–O5107.97 (10)107.84 (11)108.05 (7)108.14 (10)108.05 (9)
O2–Si2–O4109.30 (11)109.41 (10)109.37 (7)109.30 (10)109.48 (8)
O2–Si2–O5110.35 (11) 110.22 (12)110.21 (8)110.22 (12)110.17 (10)
O3–Si2–O2109.42 (8)109.56 (10)109.75 (7)109.75 (9)109.55 (8)
O3–Si2–O4108.80 (10)108.93 (12)108.71 (8)108.69 (11)108.72 (10)
O3–Si2–O5109.47 (10)109.35 (10)109.45 (7)109.54 (10)109.55 (8)
O5–Si2–O4109.45 (11)109.35 (11)109.25 (7)109.31 (10)109.23 (9)

