Article

Isomorphous Crystals Formed by the Similar Supramolecular Motifs in Sorafenib Hydrochloride and Regorafenib Hydrochloride Salts

1
Department of Chemistry, Zhejiang University, Hangzhou 310028, China
2
Faculty of Chemical Technology—Environment, University of Technology and Education, The University of Danang, Danang 550000, Vietnam
*
Authors to whom correspondence should be addressed.
Submission received: 14 November 2019 / Revised: 4 December 2019 / Accepted: 4 December 2019 / Published: 6 December 2019
(This article belongs to the Special Issue Pharmaceutical Crystals and Its Application)

Abstract

:
Sorafenib and regorafenib (or fluoro-sorafenib) are multikinase inhibitors active in the treatment of various human cancers, but their solubilities are very poor. To improve their solubilities, in this study, sorafenib hydrochloride (Sor·HCl, I) and regorafenib hydrochloride (Reg·HCl, II) have been prepared and their crystal structures were characterized. Their solubility properties in water were evaluated. Intriguingly, they are isomorphous crystal structures with the same space group and the similar unit cell dimensions, which were caused by the similar supramolecular patterns resulted by the formation of N–H···Cl hydrogen bond instead of hydrogen bond between the protonated pyridinium cation and counterion. Moreover, the solubility properties displayed identical profiles. It may be concluded that a similar crystal structure leads to a comparable solubility profile.

Graphical Abstract

1. Introduction

Low solubility is considered to be one of the most challenging issues in drug development. In fact, about 40% of approved active pharmaceutical ingredients (APIs) and 70–90% of API candidates are thought to have low solubility in water [1]. Thus, improving the solubility of drugs with poor water solubility is critical in terms of enhancing their pharmacokinetic and pharmacodynamic properties in order to increase bioavailability [2]. There are many approaches to improve solubility, such as salt or cocrystal formation. One of the benefits of these methods is that the intrinsic pharmacological properties of drugs remain undisturbed [3]. Therefore, solubility improvement of insoluble drugs can be typically achieved by salt formation in pharmaceutical therapy [4] such as hydrochloride, sulfonate, sulfate, maleate, fumarate, etc. Among these salts, hydrochloride of drugs is preferred and also the most commonly used salt form clinically for its low toxicity and high biocompatibility [5].
Sorafenib and Regorafenib have been used as the target therapy for the treatment of a large range of tumor types [6]. They inhibit tumor cell growth, proliferation, and tumor angiogenesis [7,8]. Sorafenib is medically approved by the US Food and Drug Administration (FDA) as the first-line treatment for patients with advanced renal cancer carcinoma, advanced hepatocellular carcinoma, etc., and regorafenib for the treatment of advanced gastrointestinal stromal tumor and metastatic colorectal cancer [9]. Furthermore, regorafenib has been recommended as second-line antitumor drug for patients with advanced hepatocellular carcinoma who are resistant to or cannot tolerate sorafenib [10]. These two oral administration drugs are classified in the Biopharmaceutics Classification System (BCS) class II [11,12], which have the problem of poor aqueous solubility. Some pharmaceutical salts were reported in patents, such as sorafenib hydrochloride, hydrobromide, methylsulfonate, sulfate, tosylate salts [13,14] or regorafenib hydrochloride, mesylate, phenylsulfonate salts [15]. However, until now, sorafenib tosylate is the only salt form of sorafenib used as clinical medicine, but it could be transformed to solvate form when crystallized in methanol solvent [16]. On the other hand, the preparation and characterization of sorafenib hydrochloride salt and regorafenib hydrochloride salt have been described in these literatures, but the crystal structures and soluble properties of them are not reported.
Herein, to explore the crystal structures and estimate solubilities and dissolution rates of two salts, we prepared single crystals of sorafenib hydrochloride salt and regorafenib hydrochloride salt. The supramolecular motifs of (I) and (II) was analyzed, and the electrostatic affinity was also investigated. The Hirshfeld surface and fingerprint plot analysis was used to determine the weak intermolecular interactions in crystal structures. The Hirshfeld surface was plotted with dnorm to study the hydrogen bond and effect of fluoro (on central phenyl ring) atom. Shape index and curvedness maps were used to revise the π···π interplanar stacking. Moreover, their thermal analysis was performed; their solubilities and dissolution rates were measured.

2. Materials and Methods

2.1. Synthesis and Crystallization

Drug hydrochloride salts (I) and (II) were prepared by slurry method. In brief, sorafenib or Regorafenib (0.5 g) and methanol (3 mL) were added into a 50 mL round bottom flask and stirred at 50 °C for 5 min. Methanolic HCl (3 mL with an excess mount of HCl) was dropped to the above reaction mixture. The solid immediately dissolved and subsequently formed in around 5 min. After being kept at 50 °C with stirring for 60 min, the mixture was cooled to room temperature and the crystals of salts were obtained. The single crystals of (I) and (II) were obtained by recrystallization method in methanol.

2.2. Single-Crystal X-ray Diffraction (SC-XRD)

Single crystal X-ray diffraction (SC-XRD) data of (I) and (II) were carried out using a Bruker APEX-II CCD with Mo Kα radiation (λ = 0.71073 Å) [17]. Integration and scaling of intensity data were accomplished using the SAINT program [18]. The structure was solved by direct method, refined and graphed molecularly using SHELXL-97 [19,20] and graphically represented using DIAMOND [21]. The topology of the hydrogen bond structures was determined and classified with the programs ADS and IsoTest of the TOPOS package [22] in the manner described by Baburin and Blatov (2007) [23]. In two structures, H atom bound to N atom (N3) of pyridinium ring were found in difference Fourier maps and restrained with N–H = 0.90 Å, refined using the riding model. All other H atoms were found at difference Fourier maps but placed at calculated positions and refined using the riding model.
The unit cell similarity index (Π) and the mean elongation (ε) between (I) and (II) are calculated using Equations (1) and (2) [24,25].
Π = (a1 + b1 + c1)/(a2 + b2 + c2) − 1,
ε = (V1/V2)1/3 − 1,
for a1 + b1 + c1 > a2 + b2 + c2 and V1 > V2, where a1, b1, c1, V1 and a2, b2, c2, V2 are the orthogonal lattice parameters and the cell volumes of (II) and (I), respectively.

2.3. Hirshfeld Surface and Fingerprint Plot Calculation

To study the similarity of non-covalent interactions (including hydrogen bond and π···π planar stacking), the Hirshfeld surface for (I) and (II) was generated using CrystalExplorer 3.1 program [26]. In order to determine the kinds of hydrogen bonds, dnorm (the normalized contact distances) were mapped into the Hirshfeld surfaces. The Hirshfeld surface fingerprint plots of (I) and (II) were generated, and two-dimensional histograms of the di and de distances were calculated. Shape index and curvedness were plotted to screen the π···π intermolecular inter­actions.

2.4. Thermal Analysis

The differential scanning calorimeter (DSC) was performed on a TA DSC Q100 differential scanning calorimeter. The sample (2~4 mg) was placed in an aluminum pan, and the heating was carried out at rate of 10 °C/min under a nitrogen flow of 50 cm3/min. A temperature range of 30~300 °C was scanned. The thermogravimetric analysis (TGA) was carried out using a SDTQ600 from room temperature to 280 °C, at a heating rate of 10 °C /min, and under a nitrogen gas stream with a flow rate of 120 mL/min.

2.5. Solubility and Dissolution Measurement

The solubility and dissolution rate studies of sorafenib, regorafenib, Sor.HCl, and Reg.HCl in distilled water (in the presence of 0.2% sodium lauryl sulfate-SLS) at 37 °C were measured by Thermo Scientific Evolution 300 UV–Vis spectrometer (Thermo Scientific Evolution 300, Thermo Scientific, Waltham, MA, USA). For solubility, excess quantities of drugs were dispersed in 10 mL of water in screw-capped vials and stirred at 100 rpm, 37 °C for 24 h to obtain saturated solutions; and then they were filtered through a Whatman’s 0.45 μm syringe filter. For dissolution rate measurement, excess quantities of samples were poured into 250 mL of water that was preheated to 37 °C and rotated at 150 rpm. In all experiments, 3 mL of dissolved sample was withdrawn at specific time intervals for 240 min and replaced with an equal volume of the fresh medium to maintain a constant total volume. The absorbance of all solutions was measured at their λmax.

3. Results

3.1. Isomorphous Phenomenon

Isomorphism is when the crystal structures of two or more related compounds have the same space group, similar unit-cell parameters as well as conformation of molecules, and, thus, the identical position of atoms (molecules) in the crystal structures [27]. Several organic compounds were reported to be isomorphous crystals [28,29,30], for example, desmethylselegiline hydrochloride and p-fluorodesmethylselegiline hydrochloride have similar crystal structures [28], or phenyl benzoate and phenyl ortho-fluoro-benzoate are isomorphous [31]. In addition, the isomorphous phenomenon is often observed in similar types of compounds with comparable functionalities, such as –H, −CH3, –F, –Cl, –Br, and –I [32,33].
The molecular structures of sorafenib and regorafenib are very similar, but crystal structures of sorafenib and regorafenib show that they are neither isomorphous nor isostructural, because of the different conformations (Figure 1a) [9,34]. Even though both sorafenib and regorafenib crystallize in the space group P 21/c, their cell parameters and the molecule stacking directions in unit cells are rather different. The two adjacent molecules in the crystal packing of sorafenib show inversion direction while those in the case of regorafenib show same directions.
With regard to (I) and (II), they crystallize in the same triclinic crystal system with space group P-1. Their unit-cell parameters and the cell volumes of two salts are found to be similar. As detailed in Table 1 and Table S1, the unit cell similarity index (Π) and the mean elongation (ε) between (I) and (II) are close to zero, being 0.0037 and 0.0038, respectively.
Moreover, an overlay of Sor·H+ and Reg·H+, which are found in their hydrochloride salts, displays a perfect overlap of the positions of drug cation in the crystal structures (Figure 1b). In other words, the conformation of two drug·H+ cations are similar. These results indicate that (I) and (II) are isomorphous. The details are discussed below.

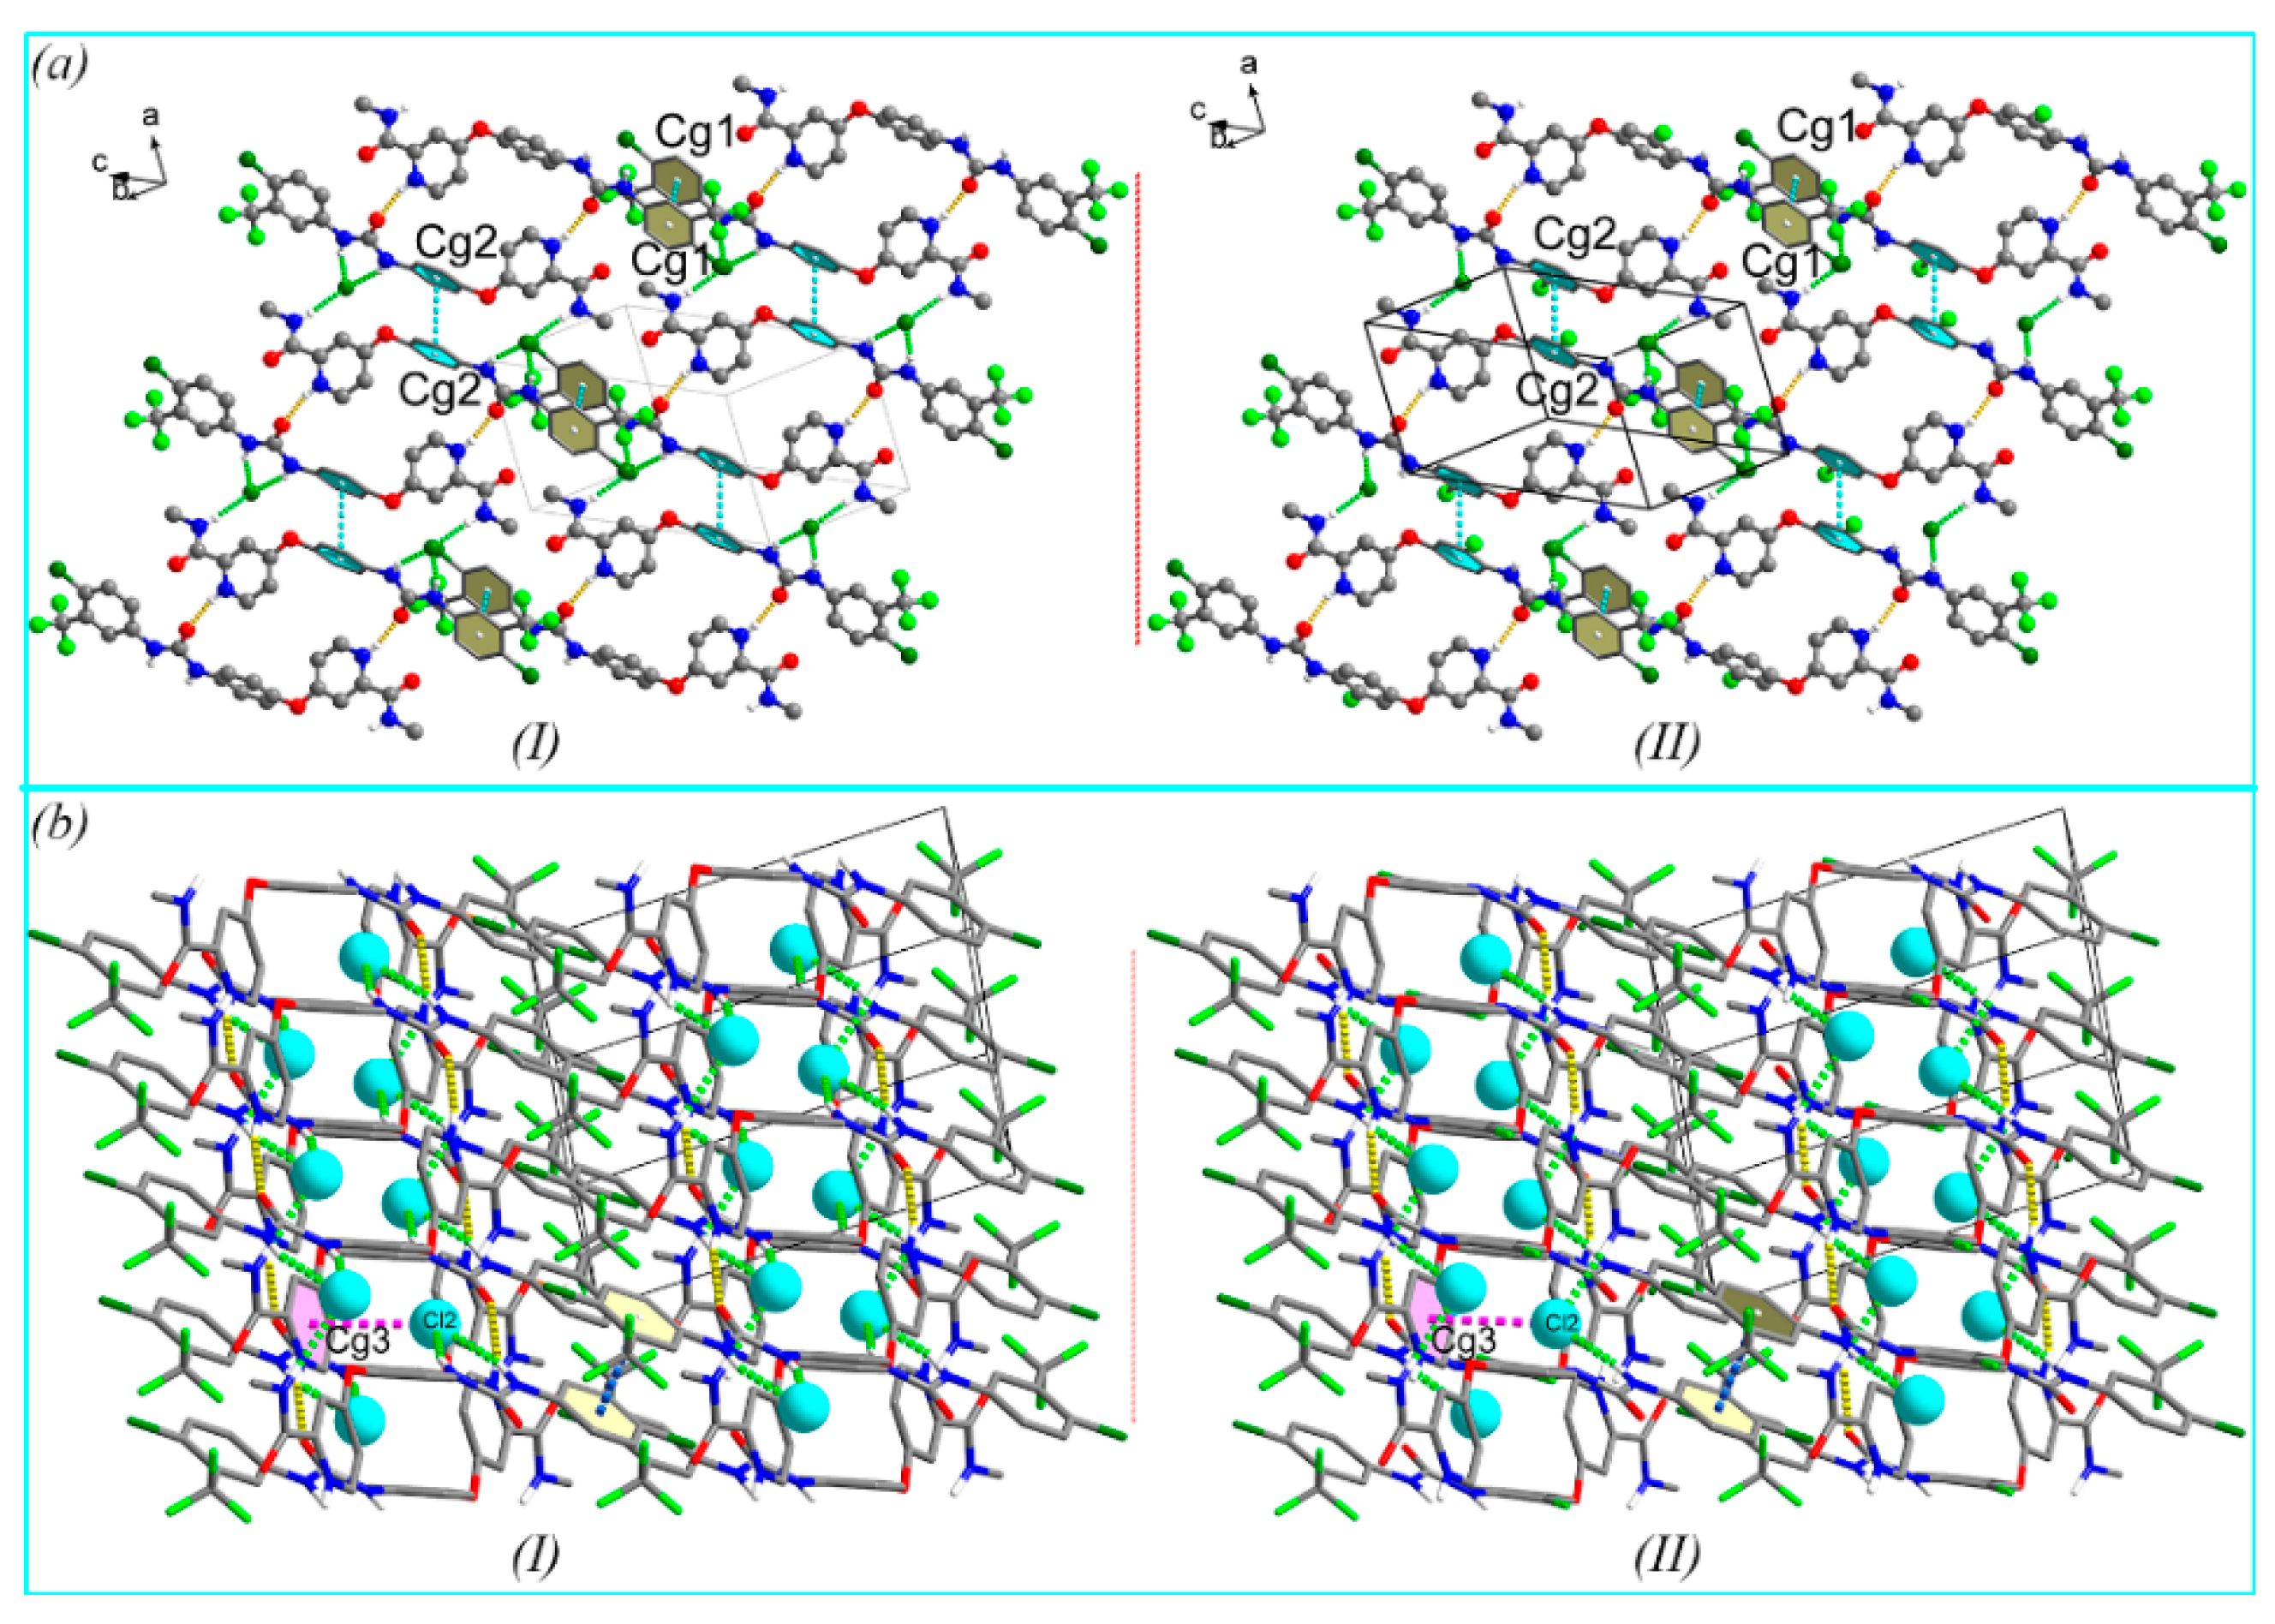
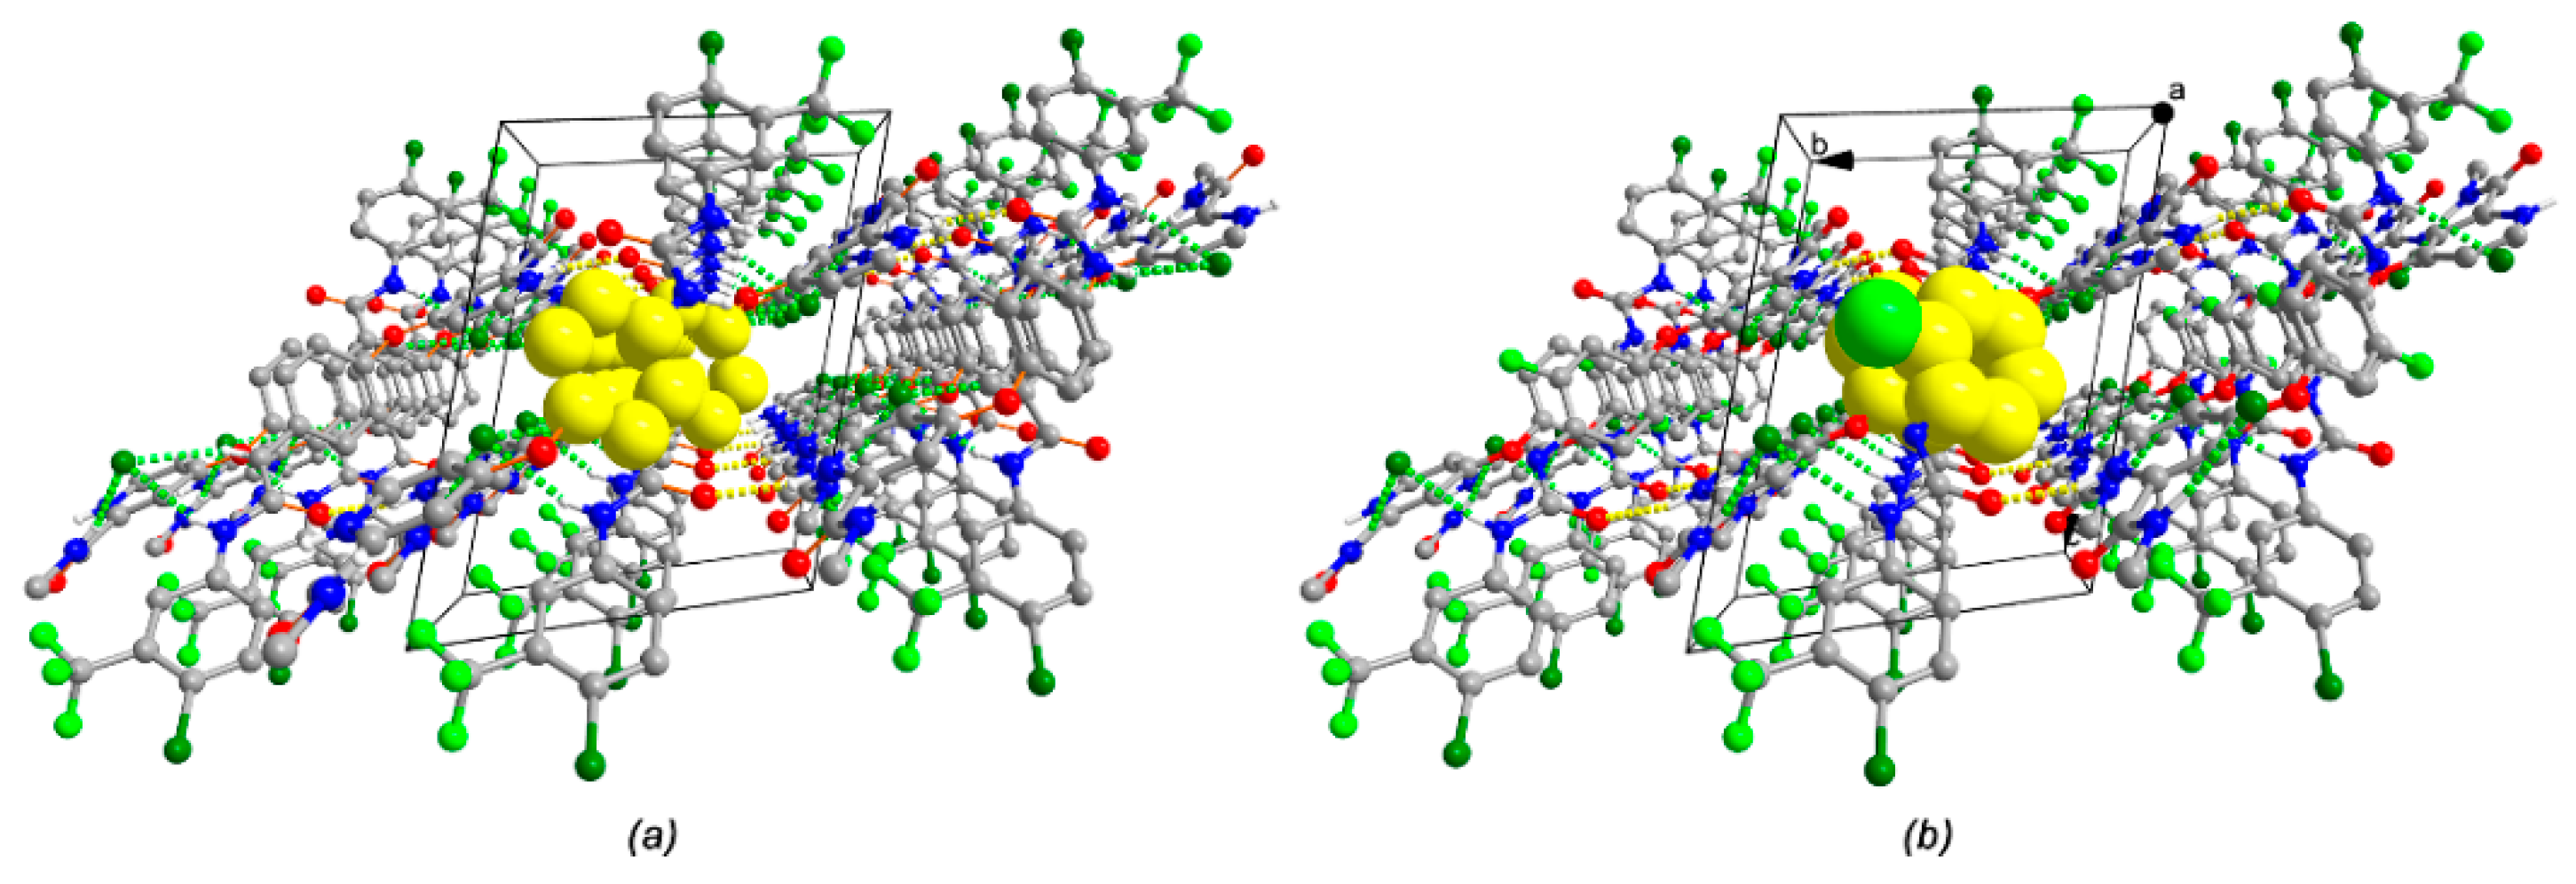
3.2. Crystal Structure

For exploring crystal structures of (I) and (II); the hydrogen bonds, electrostatic affinity and the effect of the fluoro atom on the central phenyl ring (in the case of regorafenib) of (I) and (II) in the solid state have been investigated.
Firstly, the hydrogen bond motifs of the salts are explored. In both crystal structures, the proton from the hydrochloric acid was transferred to the drug, in which the pyridine N3 atom is protonated to give pyridinium, resulting in a drug·H+ cation, but no hydrogen bonds between Cl and protonated N3+ were formed in the common way. The asymmetric unit includes one protonated drug cation and one chloride anion. Figure 2 displays the asymmetric unit of (I) and (II), with atom labeling.
Figure 3 shows that the significant repulsion among amide NH and pyridinium NH causes the change of amide group’s orientation, with the torsion angles N3–C18–C20–N4 of base form changing into salt form with variations of [176.64°] and [153.45°] in sorafenib and regorafenib, respectively [9,34]. This variety facilitates the formation of an intramolecular pseudohydrogen bond N3–H3···O3. Moreover, the internal angles at protonated pyridine N3 [C17–N3–C18] are increased from 116.01° in neutral sorafenib molecule and 115.7° in the regorafenib molecule to 121.47° in (I) and 121.87° in (II) [9,34].
Due to the formation of salts, abundant hydrogen bonds between adjacent molecules are formed (Figure 4a). In detail, in one direction, the protonated pyridine forms intermolecular hydrogen bonds to the carbonyl group O1 atom of a neighboring molecule (N3–H3···O1i, see Table 2 for symmetry code), connecting two drug molecules to form a R22(26) pattern. In the opposite direction, two chloride counterions are situated between two drug molecules, acting as bridge atoms and hydrogen bond acceptors to link atom N4 of amine group and atoms N1, N2 of bi­aryl­urea group via N1–H1···Cl2, N2–H2···Cl2 and N4–H4···Cl2ii (see Table 2 for symmetry code) hydrogen bonds. Thus, an inter­molecular ring motif R42(32) between two protonated sorafenib molecules is formed. With regard to (II), due to the weak repulsive effect of the fluoro atom on the phenyl ring upon chloride ion, N2–H2···Cl2 interaction is weaker than that of (I), which is displayed from the distance of H2···Cl2 (0.2518 nm) and N2···Cl2 (0.3337 nm). Therefore, hydrogen bonds via chloride bridges between Reg·H+ cations, including N1–H1···Cl2 and N4–H4···Cl2ii (see Table 2 for symmetry code), are formed to enclose ring R42(32) motifs. Moreover, the distances of H1···Cl2 and H4···Cl2ii (see Table 2 for symmetry code) become shorter compared to those in (I). These hydrogen bonds play important roles in the solid-state conformation; they administer the overall shape of drug molecules, which is in a stretched conformation in both structures. Furthermore, these hydrogen bonds also govern the drug molecules’ parallel stacking, forming one-dimensional zigzag chains of drug molecules.
To obtain a general view of the hydrogen bond network, the topological net of (I) and (II) representing their hydrogen bond networks was analyzed. Figure 4b shows that the topological nets of (I) and (II) are identical. Each drug cation of (I) and (II) represents a di-connected node within the drug.H+–drug.H+ connected by one hydrogen bond, and the distances of drug cation–drug cation in (I) and (II) are comparable to 0.9124 and 0.9149 nm, respectively. Additionally, one drug.H+ links to two chloride anions via three hydrogen bonds in (I) and two hydrogen bonds in (II) with the distances of drug.H+ and anion are similar to 0.9131, 0.4745 and 0.9212, 0.4672 nm, respectively. The chloride anion is two-connected node and bridges two drug cations. Thus the hydrogen bond chains of (I) and (II) exhibit the topology of the di-nodal 2,3-connected 1D net, which can be described as C32.43 and C22.33, respectively. In (I) and (II), this zigzag chain propagates parallel to the [100] face.
Beside hydrogen bond, electrostatic affinity (including π···π stacking among symmetry related rings and anion···π interactions) additionally stabilizes and organizes a two-dimensional supra­molecular array. Figure 5a shows π···π planar stacking between two (tri-fluoromethyl) phenyl rings and two central phenyl rings, namely Cg1···Cg1ii and Cg2···Cg2iii (Cg1 and Cg2 are centroids of C1–C6 ring and C9–C14, respectively; see Table 2 for Cg1 symmetry code and Cg2 symmetry code: 2 − x, 1 − y, 1 − z). The distances of Cg1···Cg1 are 0.3691 and 0.3728 nm in (I) and (II), respectively, and those of Cg2···Cg2 are 0.3854 and 0.3815 nm in (I) and (II), respectively. This interaction connects the above zigzag chains, leading to the formation of a two-dimensional (2D) network in the {−1−12} plane. Furthermore, these 2D networks are linked by anion···π inter­actions, which comprise the chloride anion and the pyridinium cation moiety (Figure 5b). The distance of Cl2···Cg3iii (Cg3 is centroid of pyridinium cation; Symmetry code: x, −y + 1, z) in (I) solid state is 3.521 Å, and this value is 3.581 Å in (II) solid state. This phenomenon could be explained by the fact that the chloride anion moves to the pyridinium cation to counteract the surplus amount of positive charge, consequently, establishing anion···π interactions in these compounds. Moreover, the contiguous molecules are also linked via C6–H6···O3i and C17–H17···Cg1i (see Table 2 for symmetry code) weak interactions, which further stabilize the solid state of (I) and (II).
Finally, the effect of the hydrogen/fluoro atom on the central phenyl ring, upon the molecular stacking interaction is examined. The fluoro atom on the phenyl ring is located in a large space, and the nearest partial negative charge atoms were amide O3iii (Symmetry code: x, −y + 1, z) and biphenyl­urea O1iv (Symmetry code: −x + 1, −y + 1, −z + 1), in which F4···O3 = 0.3553 nm and F4···O1 = 0.3038 nm. It is a fact that these distances are longer than the sum of the appropriate van der Waals radii of fluoro and oxygen atoms (rF = 0.147 nm, rO = 0.152 nm), thus, O1iii and O3iv atoms almost have no repulsion interaction upon F4. In addition, Figure 6 shows that the central ring of either sorafenib or regorafenib is located in the same channel which is formed by two ring motifs R22(26) and R42(32).

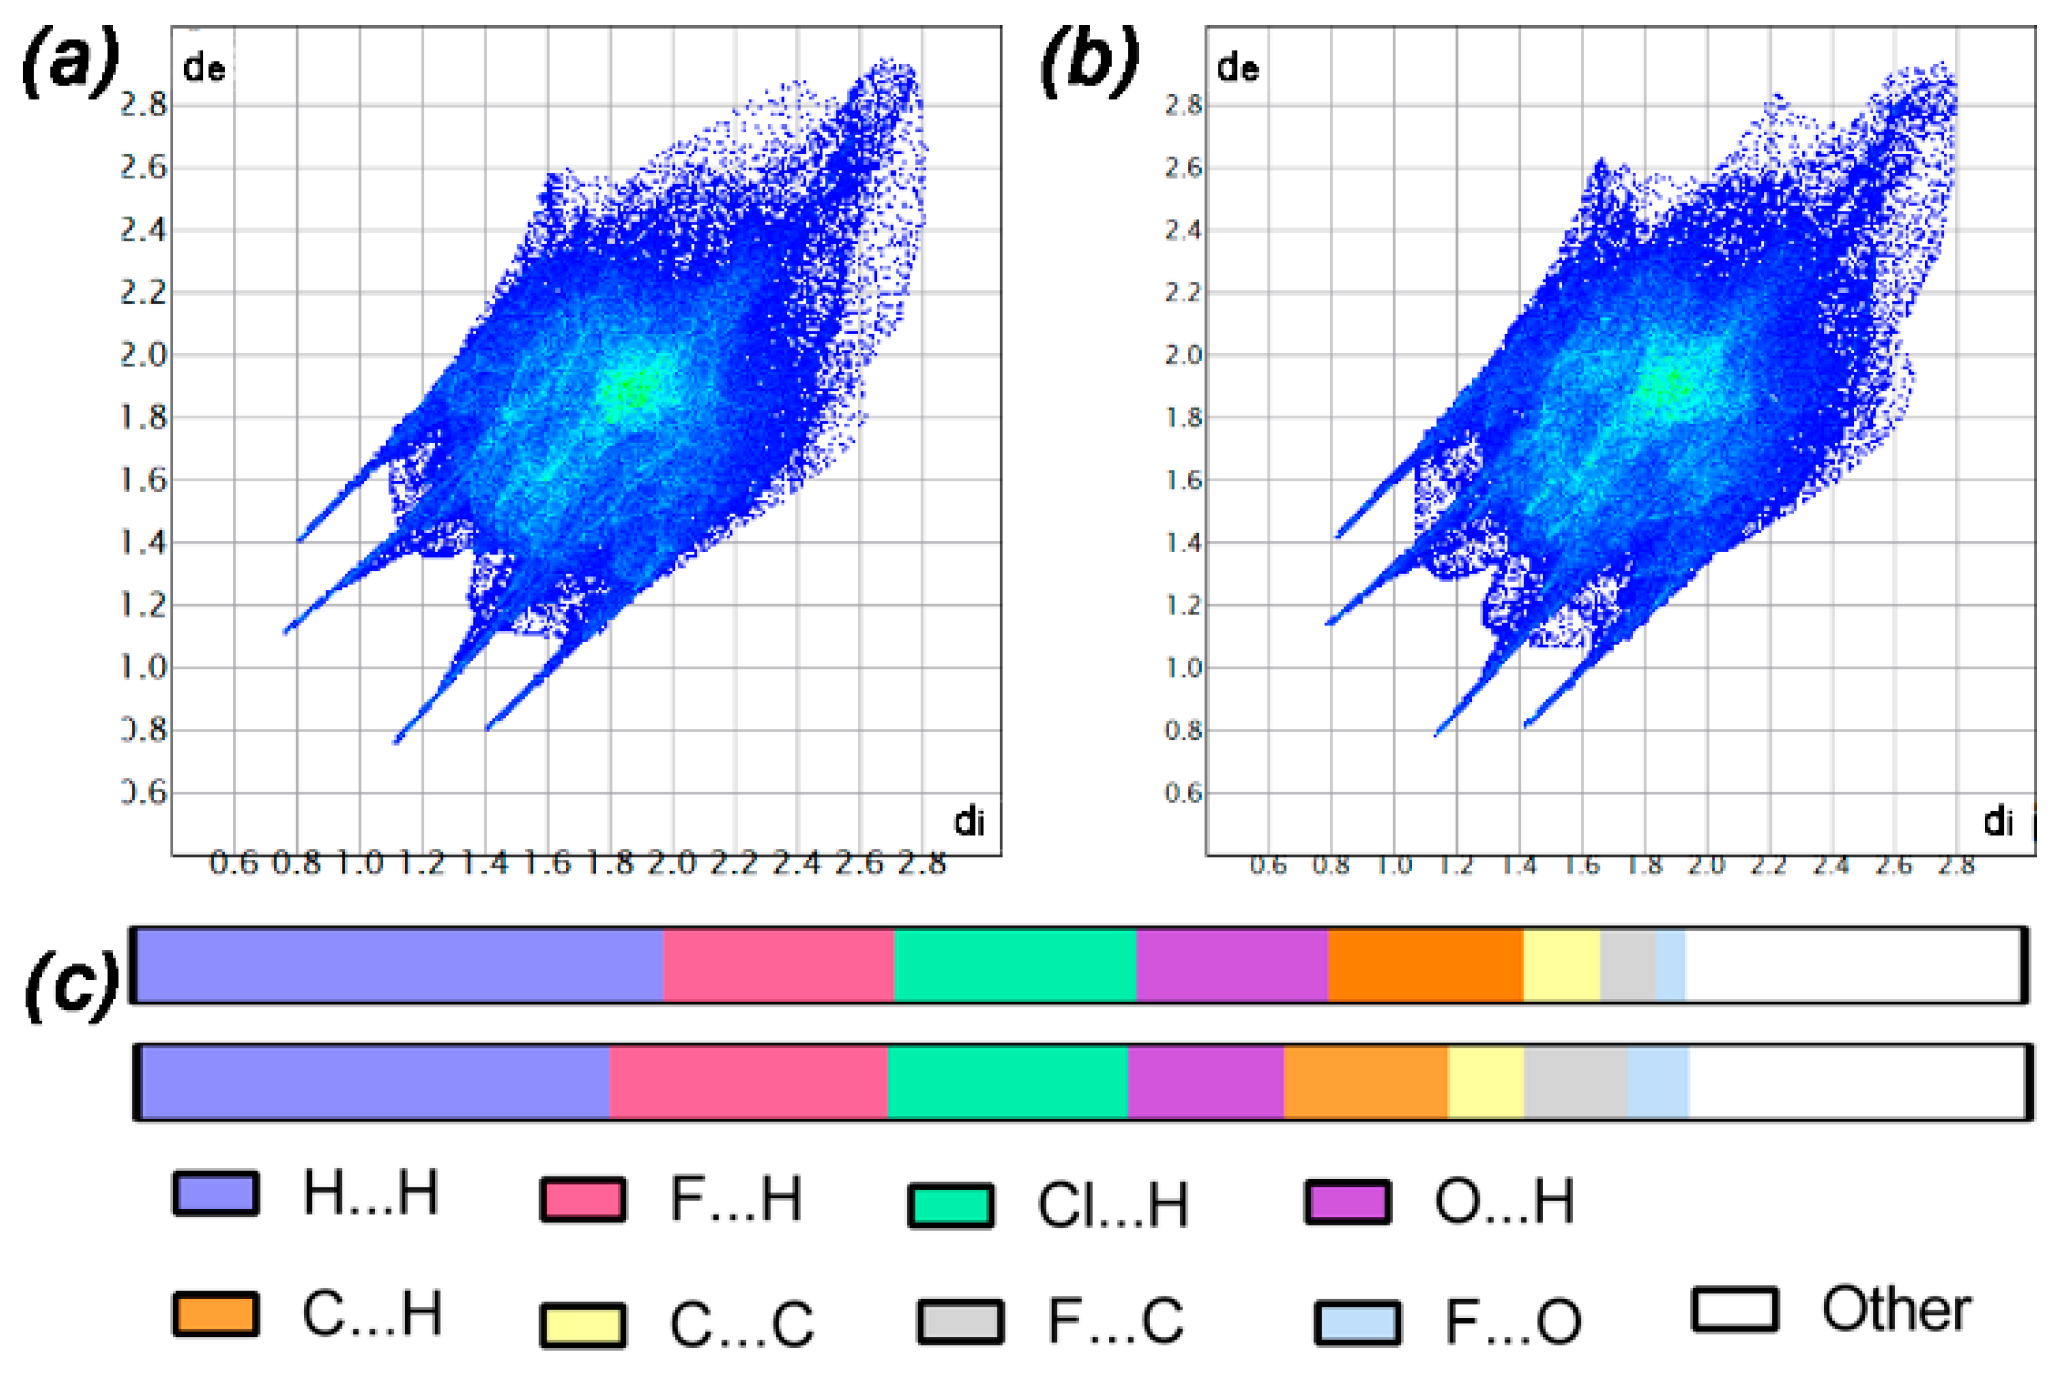
3.3. Hirshfeld Surface and Non-Covalent Interactions in Crystal Structure Analysis

The above analysis is based on the general arrangement of the drug molecules in crystal structures. To acquire insights of the intermolecular interactions of crystal structure, Hirshfeld surface analysis was further performed. This method provides information about the non-covalent interactions in crystal structure [35].
For hydrogen-bond, dnorm analysis [36] was generated for the asymmetric unit of the Sor·HCl and Reg·HCl structures (Figure 7). It is obvious that the Hirshfeld surfaces of (I) and (II) were similar. In detail, there were four big red spots, corresponding to two N3–H3···O1i hydrogen bonds, where pyridinium cations N3 present as the donors; and two N4–H4···Cl2ii hydrogen bonds, where chloride anions play the role of hydrogen atom acceptors. In two structures, the shortest contact, which shows the minimum values of (de + di), is less than 2 Å of N3–H3···O1 hydrogen bond, indicating the importance of these hydrogen bonds in forming crystal structures of (I) and (II). It is worth mentioning that C6–H6···O3i, C16–H16···Cliii contacts and C17–H17···C10i contact (belonging to C–H···π type) are shown as hydrogen bonds by the CrystalExplorer3.1 program without any change in the default settings. The distances dC···O, dC···Cl−, and dC···C are 0.3027, 0.3377, and 0.3651 nm in (I), respectively, and those in (II) are 0.3024, 0.3363, and 0.3597 nm, respectively. Therefore, many small reddish spots are depicted on the Hirshfeld surfaces. Additionally, in the case of one drug·H+ cation (Figure S1), the region of the hydrogen or fluoro atom (on C14) position exhibits light blue color, indicating that fluoro atom forms van der Waals inter­actions with the neighbor molecules, or that there is no repulsion effect between the fluoro atom on central phenyl ring of regorafenib and other adjacent molecules in other words.
The Hirshfeld surfaces of two sides of (I) and (II) have also been mapped over shape index and curvedness to explore π···π interactions in their crystal structures [35]. The shape index map shows red points (identified as hollow) and blue points (represented as bumps), where a molecular surface touches an adjacent molecular surface. Curvedness possesses large regions of green (relatively flat) divided by blue boundaries (large positive curvature). Figure 8 shows that sorafenib and regorafenib have three phenyl rings in molecules, two of which show π···π interactions. In detail, the curvedness surfaces present two broads from the front view (Figure 8a,c), corresponding to flat regions characteristic of π···π interaction between drug–drug. Moreover, the shape index surfaces are presented by the yellow ellipses and pink rectangles, which describe the complementary regions on surfaces of central rings and trifluoromethyl phenyl rings, respectively, of (I) and (II). In both cases, the shape index maps exhibit two self-complementary regions with adjacent red and blue triangles, illustrating the inversion center of π···π interplanar stacking. In contrast, from the back view (Figure 8b,d), they are very different. There is no flat region displayed in curvedness surfaces, and no evidence of the complementary red and blue patches on the shape index maps, indicating that no planar stacking of molecules occurs through this direction.
The fingerprint plots of (I) and (II) appear to be very similar (Figure 9: di refers to distance between the Hirshfeld surface and the nearest atom inside surface, de presents distance from the Hirshfeld surface to the nearest atom outside surface) [37]. The spikes in the two-dimensional fingerprint plot correspond to Cl···H/H···Cl and O···H/H···O intermolecular interactions, which is exhibited in the decomposition of the fingerprint plots (Figure S2). The histograms of (I) and (II) show the percentage of area of the various inter­actions’ contributions on Hirshfeld surface. The results reveal the domination of H···H contacts in both molecules, and the effect of the fluoro atom on the distribution on the Hirshfeld surface of various interactions in (II) molecular structure when compared with those in (I).

3.4. Thermal Analyses

DSC-TGA curves of (I) and (II) are analyzed. As shown in Figure 10a, one broad endothermic peak of (I) or (II) in the DSC is associated with weight loss in TGA of 7.30% for (I), 7.06% for (II), corresponding to one hydrochloric molecule. Thus, this broad peak may be caused by the simultaneous appearance of dual processes, including dissociation of the salt and the melting process. TGA-DSC results present that two salts are stable at room temperature.

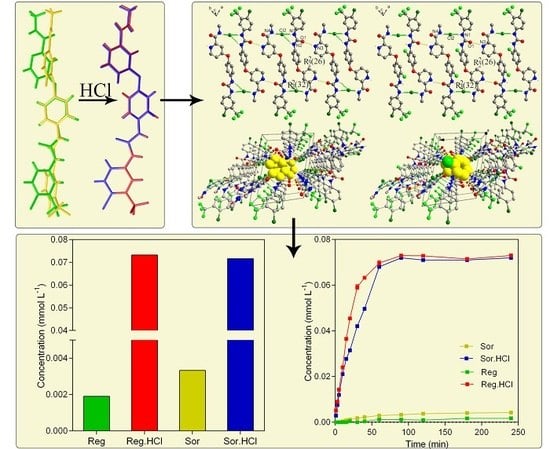
3.5. Solubility and Dissolution Rate of (I) and (II)

We estimated the solubility and dissolution rate of sorafenib, regorafenib, (I), and (II) in water. As expected, their solubility and dissolution rate were improved, and it is not surprising that their solubility behaviors in water are similar. Solubility of sorafenib and regorafenib in water differed 1.75 times, while solubility of (I) and (II) (Figure 10b) are almost comparable. Furthermore, (I) and (II) exhibited significantly higher dissolution rates than sorafenib and regorafenib in water (Figure 10c). It was found that there was a burst release during the first 60 min followed by a slower release of the drug for (I) and (II). In the initial stage (before 10 min) and late stage (after 60 min), the dissolution profiles of (I) and (II) were almost overlapping. In contrast, sorafenib and regorafenib dissolved very slowly in water. These results showed that hydrochloride salt of sorafenib and regorafenib have improved their solubility, which might enhance their bioavailability. Moreover, due to their similar solubility and dissolution rate, their properties in vivo might be similar. However, the solubility of sorafenib from Sor.HCl is still lower than that of sorafenib from sorafenib tosylate in the co-existence of poly (vinylpyrrolidone-vinyl acetate) [38]. Therefore, the solubilities of the two free drugs can be enhanced by combining the two salts with poly (vinylpyrrolidone-vinyl acetate).

4. Discussion

Sorafenib hydrochloride and regorafenib hydrochloride salts were recrystallized from methanol, the experimental and calculated Powder X-Ray Diffraction (PXRD) patterns showed that the structures of the two salts were not changed (Figure S3). The isomorphous phenomenon is contributed to the significant hydrogen bond arrays between the drug cations and the counterions. The chloride anions are connected with amide groups of drug·H+ via N–H···Cl hydrogen bonds, but not connected to protonated N atoms of pyridine rings by means of the classical hydrogen bond N+–H···Cl, forming a ring motif R42(32) [39,40,41]. Furthermore, the protonated N atom of the pyridine ring acting as a donor forms hydrogen bonds with atom O of the carbonyl group from urea, creating a ring motif R22(26) between drug cations. These two ring motifs build large channels that include the central rings, and the effect of the fluoro atom on the central ring is then reduced. The crystal structures of the two salt forms are further stabilized by electrostatic affinities, which were explored by Hirshfeld surface. Interestingly, the solubility and dissolution rate of hydrochloride salt of sorafenib and regorafenib improved and achieved the comparable values which might be caused by their similar crystal structures. Hygroscopicity analyses of the two salts were conducted at 92.5% RH (relative humidity) and 25 °C for seven days. The results showed that two salts were almost non-hygroscopic and mass gains were less than 5%. Moreover, the crystal forms of the two salts did not change after moisture absorption. See Figures S4 and S5.

5. Conclusions

This study reported the crystal structures and solubility properties of sorafenib hydrochloride and regorafenib hydrochloride comparing to those of free drugs. The crystal structures reveal that Sor.HCl and Reg.HCl are isomorphous with the comparable cell parameters and the similar conformations. In both structures, it is noteworthy that instead of forming the common N+–H···Cl hydrogen bonds between the protonated drug cations and chloride counterions, the N–H···Cl hydrogen bonds are formed, resulting in their similar supramolecular motifs and molecular stacking. The solubility experiments exhibited that the hydrochloride salt forms significantly improved solubility and dissolution rate of sorafenib and regorafenib. Interestingly, the solubility and dissolution rate profiles in water of two salt forms are almost identical, while these values of free drugs are very different. These results might be attributed to the similar structures of the two salt forms. The similar crystal structures and the comparable solubility property might suggest resembling biological activities of Sor.HCl and Reg.HCl [42].

Supplementary Materials

The following are available online at https://0-www-mdpi-com.brum.beds.ac.uk/2073-4352/9/12/649/s1, Table S1. Crystallographic data for (I) and (II); Figure S1. Hirshfeld surface mapped with dnorm (a) (I) and (b) (II); Figure S2. Decomposition of Hirshfeld surface mapped with dnorm and fingerprint plots of (a) (I) and (b) (II). Figure S3. The overlay of experimental and calculated PXRD patterns of sorafenib, regorafenib, (I), and (II). Figure S4. The overlay of PXRD patterns of (I) and (II) at Day 0, Day 4, and Day 8 under high humility (92.5% RH) and 25 °C. Figure S5. Mass measurements as a function of time, for (I) and (II) under high humility (92.5% RH) and 25 °C.

Author Contributions

Writing—review and editing, C.U.P.; Formal analysis, J.S.; Investigation, J.L.; conceptualization, J.M.; supervision, X.H. and G.T.

Funding

This research was funded by the National Natural Science Foundation of China (grant no. 51573161 and 51873185).

Acknowledgments

The authors would like to thank Eastchina Pharm. Co., Ltd., China for providing us with sorafenib and regorafenib.

Conflicts of Interest

The authors state that there is no conflict of interest.

References

  1. Poovi, G.; Damodharan, N. Lipid nanoparticles: A challenging approach for oral delivery of BCS Class-II drugs. Future J. Pharm. Sci. 2018, 4, 191–205. [Google Scholar] [CrossRef]
  2. Suresh, K.; Mannava, M.K.; Nangia, A. Cocrystals and alloys of nitazoxanide: Enhanced pharmacokinetics. Chem. Commun. 2016, 52, 4223–4226. [Google Scholar] [CrossRef] [PubMed]
  3. Rajput, L. Stable Crystalline Salts of Haloperidol: A Highly Water-Soluble Mesylate Salt. Cryst. Growth Des. 2014, 14, 5196–5205. [Google Scholar] [CrossRef]
  4. Zhou, X.; Hu, X.; Wu, S.; Ye, J.; Sun, M.; Gu, J.; Zhu, J.; Zhang, Z. Structures and physicochemical properties of vortioxetine salts. Acta Crystallogr. B Struct. Sci. Cryst. Eng. Mater. 2016, 72, 723–732. [Google Scholar] [CrossRef]
  5. Stahl, P.H.; Wermuth, C.G. Handbook of Pharmaceutical Salts: Properties, selection and use. Chem. Int. 2002, 24, 21. [Google Scholar] [CrossRef]
  6. Alfazari, A.S.; Almarzooqi, S.; Albawardi, A.; Saraswathiamma, D.; Abdul-Kader, H.M.; Shaban, S.; Souid, A.-K. Modulation of Cardiomyocyte and Hepatocyte Bioenergetics by Biguanides. J. Clin. Toxicol. 2014, 4, 203–209. [Google Scholar] [CrossRef] [Green Version]
  7. Takimoto, C.H.; Awada, A. Safety and anti-tumor activity of sorafenib (Nexavar) in combination with other anti-cancer agents: A review of clinical trials. Cancer Chemother Pharm. 2008, 61, 535–548. [Google Scholar] [CrossRef]
  8. Iyer, R.; Fetterly, G.; Lugade, A.; Thanavala, Y.; Sorafenib. A clinical and pharmacologic review. Expert Opin. Pharm. 2010, 11, 1943–1955. [Google Scholar] [CrossRef]
  9. Sun, M.Y.; Wu, S.X.; Zhou, X.B.; Gu, J.M.; Hu, X.R. Comparison of the crystal structures of the potent anticancer and anti-angiogenic agent regorafenib and its monohydrate. Acta Crystallogr. Sect. C Struct. Chem. 2016, 72, 291–296. [Google Scholar] [CrossRef]
  10. Liu, Z.; Lin, Y.; Zhang, J.; Zhang, Y.; Li, Y.; Liu, Z.; Li, Q.; Luo, M.; Liang, R.; Ye, J. Molecular targeted and immune checkpoint therapy for advanced hepatocellular carcinoma. J. Exp. Clin. Cancer Res. 2019, 38, 447. [Google Scholar] [CrossRef]
  11. Giglio, V.; Viale, M.; Bertone, V.; Maric, I.; Vaccarone, R.; Vecchio, G. Cyclodextrin polymers as nanocarriers for sorafenib. Invest. New Drugs 2018, 36, 370–379. [Google Scholar] [CrossRef] [PubMed]
  12. Sawicki, E.; Schellens, J.H.; Beijnen, J.H.; Nuijen, B. Inventory of oral anticancer agents: Pharmaceutical formulation aspects with focus on the solid dispersion technique. Cancer Treat. Rev. 2016, 50, 247–263. [Google Scholar] [CrossRef] [PubMed] [Green Version]
  13. Gidwani, R.M.; Wakchaure, V.S.; Striegel, H.G.; Albrecht, W. Polymorphorphs of 4-[4-[[4-chloro-3-(trifluoromethyl)phenyl]carbamoylamino]phenoxy]-n-methyl-pyridine-2-carboxamide, WO Patent 2010/142678 A2, 16 December 2010. [Google Scholar]
  14. Jaryal, J.S.; Sathyanarayana, S.; Thaper, R.K.; Prasad, M. Polymorphs of Sorafenib Acid Addition Salts. US Patent 2012/0264789 A1, 18 October 2012. [Google Scholar]
  15. Jacques, D.; Stephen, B.; Bernd, R.; Scott, W. Fluoro Substituted Omege-Carboxyaryl Diphenyl Urea for the Treatment and Prevention of Diseases and Conditions. WO Patent 2005/009961 A2, 3 February 2005. [Google Scholar]
  16. Yang, P.; Qin, C.; Du, S.; Jia, L.; Qin, Y.; Gong, J.; Wu, S. Crystal Structure, Stability and Desolvation of the Solvates of Sorafenib Tosylate. Crystals 2019, 9, 367. [Google Scholar] [CrossRef] [Green Version]
  17. Bruker AXS announces novel APEX(TM) DUO. The most versatile system for small molecule X-ray crystallography. Anti-Corros. Methods Mater. 2007, 54, 375.
  18. Dolomanov, O.V.; Bourhis, L.J.; Gildea, R.J.; Howard, J.A.K.; Puschmann, H.; OLEX2. A complete structure solution, refinement and analysis program. J. Appl. Crystallogr. 2009, 42, 339–341. [Google Scholar] [CrossRef]
  19. Sheldrick, G.M. SHELXT - integrated space-group and crystal-structure determination. Acta Crystallogr. A Found. Adv. 2015, 71, 3–8. [Google Scholar] [CrossRef] [Green Version]
  20. Sheldrick, G.M. Crystal structure refinement with SHELXL. Acta Crystallogr. C Struct. Chem. 2015, 71, 3–8. [Google Scholar] [CrossRef]
  21. Farrugia, L.J. WinGX and ORTEP for Windows: An update. J. Appl. Crystallogr. 2012, 45, 849–854. [Google Scholar] [CrossRef]
  22. Blatov, V.A. Multipurpose crystallochemical analysis with the program package TOPOS. IUCr Compcomm Newsl. 2006, 7, 4–38. [Google Scholar]
  23. Baburin, I.A.; Blatov, V.A. Three-dimensional hydrogen-bonded frameworks in organic crystals: A topological study. Acta Crystallogr. Sect. B Struct. Sci. 2007, 63, 791–802. [Google Scholar] [CrossRef]
  24. Kálmán, A.; Párkányi, L.; Argay, G. Classification of the isostructurality of organic molecules in the crystalline state. Acta Crystallogr. Sect. B 1993, 49, 1039–1049. [Google Scholar] [CrossRef]
  25. Fábián, L.; Kálmán, A. Volumetric measure of isostructurality. Acta Crystallogr. Sect. B 1999, 55, 1099–1108. [Google Scholar] [CrossRef] [PubMed]
  26. CrystalExplorer; Version 3.1; University of Western Australia: Crawley, AU, Australia, 2005–2013.
  27. Nath, N.K.; Nangia, A. Isomorphous Crystals by Chloro–Methyl Exchange in Polymorphic Fuchsones. Cryst. Growth Des. 2012, 12, 5411–5425. [Google Scholar] [CrossRef]
  28. Simon, K.; Harmat, V.; Török, Z.; Böcskei, Z.; Hermecz, I. Isostructural Metabolites of Two Anti-Parkinson Drugs. Acta Crystallogr. Sect. C 1998, 54, 811–813. [Google Scholar] [CrossRef]
  29. Thakur, A.; Kumar, D.; Thipparaboina, R.; Shastri, N.R. Exploration of crystal simulation potential by fluconazole isomorphism and its application in improvement of pharmaceutical properties. J. Cryst. Growth 2014, 406, 18–25. [Google Scholar] [CrossRef]
  30. Bacchi, A.; Carcelli, M.; Pelizzi, G. Sampling rifamycin conformational variety by cruising through crystal forms: Implications for polymorph screening and for biological models. New J. Chem. 2008, 32, 1725–1735. [Google Scholar] [CrossRef]
  31. Dey, D.; Chopra, D. Evaluation of the Role of Isostructurality in Fluorinated Phenyl Benzoates. Cryst. Growth Des. 2017, 17, 5117–5128. [Google Scholar] [CrossRef]
  32. Ebenezer, S.; Muthiah, P.T.; Butcher, R.J. Design of a Series of Isostructural Co-Crystals with Aminopyrimidines: Isostructurality through Chloro/Methyl Exchange and Studies on Supramolecular Architectures. Cryst. Growth Des. 2011, 11, 3579–3592. [Google Scholar] [CrossRef]
  33. Capacci-Daniel, C.; Dehghan, S.; Wurster, V.M.; Basile, J.A.; Hiremath, R.; Sarjeant, A.A.; Swift, J.A. Halogen/methyl exchange in a series of isostructural 1,3-bis(m-dihalophenyl)ureas. CrystEngComm 2008, 10, 1875–1880. [Google Scholar] [CrossRef]
  34. Ravikumar, K.; Sridhar, B.; Bhujanga Rao, A.K.S.; Pulla Reddy, M. Sorafenib and its tosylate salt: A multikinase inhibitor for treating cancer. Acta Crystallogr. Sect. C 2011, 67, o29–o32. [Google Scholar] [CrossRef]
  35. Spackman, M.A.; Byrom, P.G. A novel definition of a molecule in a crystal. Chem. Phys. Lett. 1997, 267, 215–220. [Google Scholar] [CrossRef]
  36. Spackman, M.A.; McKinnon, J.J.; Jayatilaka, D. Electrostatic potentials mapped on Hirshfeld surfaces provide direct insight into intermolecular interactions in crystals. CrystEngComm 2008, 10, 377–388. [Google Scholar] [CrossRef]
  37. Angira, D.; Shaik, A.; Kirubakaran, S.; Thiruvenkatam, V. Exploring a solvated dimer of Gefitinib: A quantitative analysis. Acta Crystallogr. C Struct. Chem. 2018, 74, 944–950. [Google Scholar] [CrossRef] [PubMed]
  38. Liu, C.; Chen, Z.; Chen, Y.; Lu, J.; Li, Y.; Wang, S.; Wu, G.; Qian, F. Improving Oral Bioavailability of Sorafenib by Optimizing the “Spring” and “Parachute” Based on Molecular Interaction Mechanisms. Mol. Pharm. 2016, 13, 599–608. [Google Scholar] [CrossRef] [PubMed]
  39. Etter, M.C. Encoding and decoding hydrogen-bond patterns of organic compounds. Acc. Chem. Res. 1990, 23, 120–126. [Google Scholar] [CrossRef]
  40. Etter, M.C.; MacDonald, J.C.; Bernstein, J. Graph-set analysis of hydrogen-bond patterns in organic crystals. Acta Crystallogr. Sect. B 1990, 46, 256–262. [Google Scholar] [CrossRef]
  41. Bernstein, J.; Davis, R.E.; Shimoni, L.; Chang, N.L. Patterns in Hydrogen Bonding: Functionality and Graph Set Analysis in Crystals. Angew. Chem. Int. Ed. Engl. 1995, 34, 1555–1573. [Google Scholar] [CrossRef]
  42. Thiagarajan, D.; Mehta, D.P. Faster Algorithms for Isomer Network Generation. J. Chem. Inf. Modeling 2016, 56, 2310–2319. [Google Scholar] [CrossRef]
Figure 1. A superposition of the molecular conformations of (a) sorafenib and regorafenib in base form (b) protonated drugs in hydrochloride salt form. Sorafenib is shown in yellow; regorafenib is displayed in green; protonated sorafenib is revealed in blue and protonated regorafenib is exhibited in red.
Crystals 09 00649 g001
Figure 2. The asymmetric unit of (a) (I) and (b) (II) with the atom-labeling scheme. Displacement ellipsoids are drawn at 50% probability level.
Crystals 09 00649 g002
Figure 3. Protonation of drug in base form (X = H: sorafenib, X = F: regorafenib).
Crystals 09 00649 g003
Figure 4. (a) Part of the crystal packing of (I) and (II). Hydrogen bonds are shown as green and yellow dashed lines. H atoms not involved in the hydrogen bond have been omitted for clarity. (b) 2, 3-Connected tri-nodal topological 1D net representing the hydrogen bond chain structure of (I) and (II).
Crystals 09 00649 g004
Figure 5. Part of the crystal packing of (I) and (II). (a) π···π interactions are shown as blue dashed lines, (b) anion···π interactions are shown as purple dashed lines. Hydrogen bonds are shown as green and yellow dashed lines. H atoms not involved in the hydrogen bond have been omitted for clarity.
Crystals 09 00649 g005
Figure 6. The central phenyl ring of (a) (I) and (b) (II) in the channels which are formed by hydrogen bond motifs R22(26) and R42(32). The yellow spheres indicate carbon atoms on the central ring and green spheres exhibit fluoro atoms on the central phenyl rings (in the case of (II)). H atoms not involved in the hydrogen bond have been omitted for clarity.
Crystals 09 00649 g006
Figure 7. Hirshfeld surface mapped with dnorm of (a) (I) and (b) (II).
Crystals 09 00649 g007
Figure 8. Hirshfeld surface mapped with shape index, curvedness from front ((a) (I), (b) (II)) and back ((c) (I), (d) (II)) view.
Crystals 09 00649 g008
Figure 9. Fingerprint plot of (a) (I), (b) (II) and (c) relative contributions of the contacts in (I) (above) and (II) (under).
Crystals 09 00649 g009
Figure 10. (a) Thermogravimetry- differential scanning calorimetry (TG-DSC) plots of (I) and (II); (b) solubility and (c) dissolution rate of (I) and (II) in water compared with sorafenib and regorafenib.
Crystals 09 00649 g010
Table 1. Crystallographic data for (I) and (II).
Parameter(I)(II)
Chemical formulaC21H17ClF3N4O3·ClC21H16ClF4N4O3·Cl
Crystal system,
space group
Triclinic, P-1Triclinic, P-1
Temperature (K)170170
a, b, c (nm)0.94153 (2), 1.05000 (3), 1.24470 (3)0.9458 (2), 1.0488 (3), 1.2538 (3)
α, β, γ (°)75.089 (1), 86.160 (1), 66.078 (1)75.282 (11), 86.190 (13), 66.055 (10)
V (nm3)1.08597 (5)1.0984 (5)
Z22
µ (Mo Kα, mm−1)0.360.36
Rint0.0500.038
R[F2 > 2σ(F2)], wR(F2), S0.046, 0.120, 1.030.053, 0.156, 1.02
No. of reflections633716140
The Cambridge Crystallographic Data Centre (CCDC) number19483521948353
Table 2. Hydrogen-bond geometry (nm, °) for (I) and (II).
D–H···AD–HH···AD···AD–H···A
Sor.HCl (I)
N3–H3···O1i0.0880.1980.283165.0
N1–H1···Cl20.0880.2300.315162.9
N2–H2···Cl20.0880.2470.330157.0
N4–H4···Cl2ii0.0880.2310.315160.0
C6–H6···O30.0950.2330.293120.4
Reg.HCl (II)
N3–H3···O1i0.0890.2000.285158.9
N1–H1···Cl20.0880.2260.313170.0
N2–H2···Cl20.0880.2520.333155.2
N4–H4···Cl2ii0.0880.2320.316158.6
C6–H6…O30.0950.2340.294120.5
Symmetry code: (i) −x + 1, −y + 2, −z + 1, (ii) −x + 2, −y + 1, −z + 1.

