Application of Dimming Compensation Technology Via Liquid Crystal Lens for Non-Imaging Projection Laser Systems


1
Department of Mechanical and Automation Engineering, National Kaohsiung First University of Science and Technology, Kaohsiung City 824, Taiwan
2
Graduate Institute of Precision Engineering, National Chung Hsing University, Taichung City 402, Taiwan
3
Department of Computer and Communication, Shu-Te University, No.59, Hengshan Rd., Yanchao, Kaohsiung County 82445, Taiwan
*
Author to whom correspondence should be addressed.
Crystals 2019, 9(3), 122; https://0-doi-org.brum.beds.ac.uk/10.3390/cryst9030122
Submission received: 24 November 2018
/
Revised: 16 February 2019
/
Accepted: 23 February 2019
/
Published: 26 February 2019
(This article belongs to the Special Issue Advanced LED Solid-State Lighting Optics)
Abstract
:The main purpose of this paper is to explore a newly developed optical design, then to further improve the overhead lighting contrast in the laser projector module. In terms of the structural design of the projector, a liquid crystal lens array was used as the local dimming system for the light source, in order to achieve the objective, which was to significantly improve the contrast facility of the projection system. Second, in terms of the design of the light source, the output method for the light source was a laser light source employing arrays of micro-scanning. The main purpose was to compensate for the dim spots in the hole between the lenses in each unit of the liquid crystal when the liquid crystal lens array was locally dimmed, and thus significantly improving the contrast facility of the projection system. In terms of the software simulation, a liquid crystal lens array was used to simulate a pore size of 2.0 mm and focal lengths of 9 cm and 23 cm. The end effect gave good control and adjustment of the bright and dark areas during local dimming of the projector’s imaging chip components. For a single laser source, the maximum contrast for local dimming was about 128:1, 438:1, and 244:1, for the Red (R), Green (G), and Blue (B) optical paths, respectively. The light efficiency scores were approximately 20.91%, 20.05%, and 24.45%, for the R, G, and B optical paths, respectively. After compensation using a micro-scanning light source, the defect of having dim spots between the pores was remedied, and the light adjustment area became more uniform while the contrasts became smaller. The maximum contrasts were approximately 52:1, 122:1, and 110:1, for the R, G, and B optical paths, respectively. For the projector, when the liquid crystal lenses were not transmissive, the maximum uniformity scores were 82.25%, 87.15%, and 88.43%, for the R, G, and B optical paths, respectively.
1. Introduction
Digital projectors have been in use for some time. Recently, there has been a trend to integrate them into many systems, and it is likely that in the future, everyone can have a portable projector to use for presentations, education, recreation, and other purposes. Sometimes the demands made of a projector require some of its characteristics to be significantly enhanced [1,2,3,4]. For example, if the light is switched on while the projector is in use, it should substantially increase the brightness of the projector. Or a substantial increase in the contrast may be required to suggest a more three-dimensional quality. Or a reduction in size to something more like a portable micro projector may be required. Other requirements may also include a reduction the thermal properties, etc. In terms of the optical design in a projector, the four main areas on which the design may focus are: reduce the size of the optics, improve the light efficiency, improve uniformity, and increase contrast. Each area presents its own challenge and the design has to be balanced to avoid an area being compromised by another.
In terms of the light source for illumining projectors, light-emitting diode (LED) projectors have made a position for themselves in the market since they are small in size, inexpensive, quick to light up and fade out, and consume little power. Recently, however, the laser diode technology has gradually progressed. With the same advantages of small size and fast lighting and extinguishing times, these add to the advantages of a highly efficient light collection, an ultra-wide color gamut, and a higher light output, etc. The light source of lasers has slowly begun to move from industrial applications to display-related aspects of the technology.
The liquid crystal lens [5,6,7,8,9,10,11] is a type of microlens component that has been developed in recent years. The zooming principle is mainly based on applying an external electric field to drive the rotation of the liquid crystal molecules and present a gradient arrangement with an appropriate direction in the liquid crystal layer. Using the birefringence property of liquid crystals, changes in the refractive index of the liquid crystal lens are made in order to modify the focal length. In addition, a laser diode lens has the ability to converge or diverge light, without the need to use a lens combination to produce a zooming effect by mechanical movement.
Unlike a conventional lens, which has considerable size requirements, it also has the advantage of offering silent zoom. Many people have already begun to integrate it in opto-mechanical systems.
This study mainly uses the liquid-crystal display (LCD) backlight dimming technology in the illumination design for optical projectors. Through the use of a liquid crystal lens array, local dimming is performed. A liquid crystal lens dimming system is inserted between the light source illumination system and the imaging chip component, so that the light source illumination system can provide more contrast for the imaging chip component. This improves upon the light source illumination systems generally used in projectors. It offers uniformity in the illumination for light sources, and also controls and adjusts the light source to produce considerable lighting contrast facilities, in order to achieve the purpose of the design, which is to significantly improve the contrast of the projector. Second, in terms of the design of the light source, the output method for the light source was changed. In other words, the light source was designed to output as a laser light source that uses a micro-scanning array. The main purpose was to compensate for the dim spots in the pores between the lenses in each unit of the liquid crystal when the liquid crystal lens array performs local dimming, as well as to compensate for the uniformity when adjusting the light.
2. Design Simulation
2.1. Light Source Configuration
In terms of light source configuration, this study mainly focuses on the design for using a laser projector in a non-imaging projection illumination system. Laser diodes were selected as the light source, and the RGB wavelengths were 660 nm, 532 nm, and 450 nm, respectively. Detailed specifications are as shown in Table 1. When RGB lasers were full brightness, the white color temperature was located approximately at the 7000 K color temperature for blackbody radiation.
2.2. System Output Design for Micro-Scanning Light Source
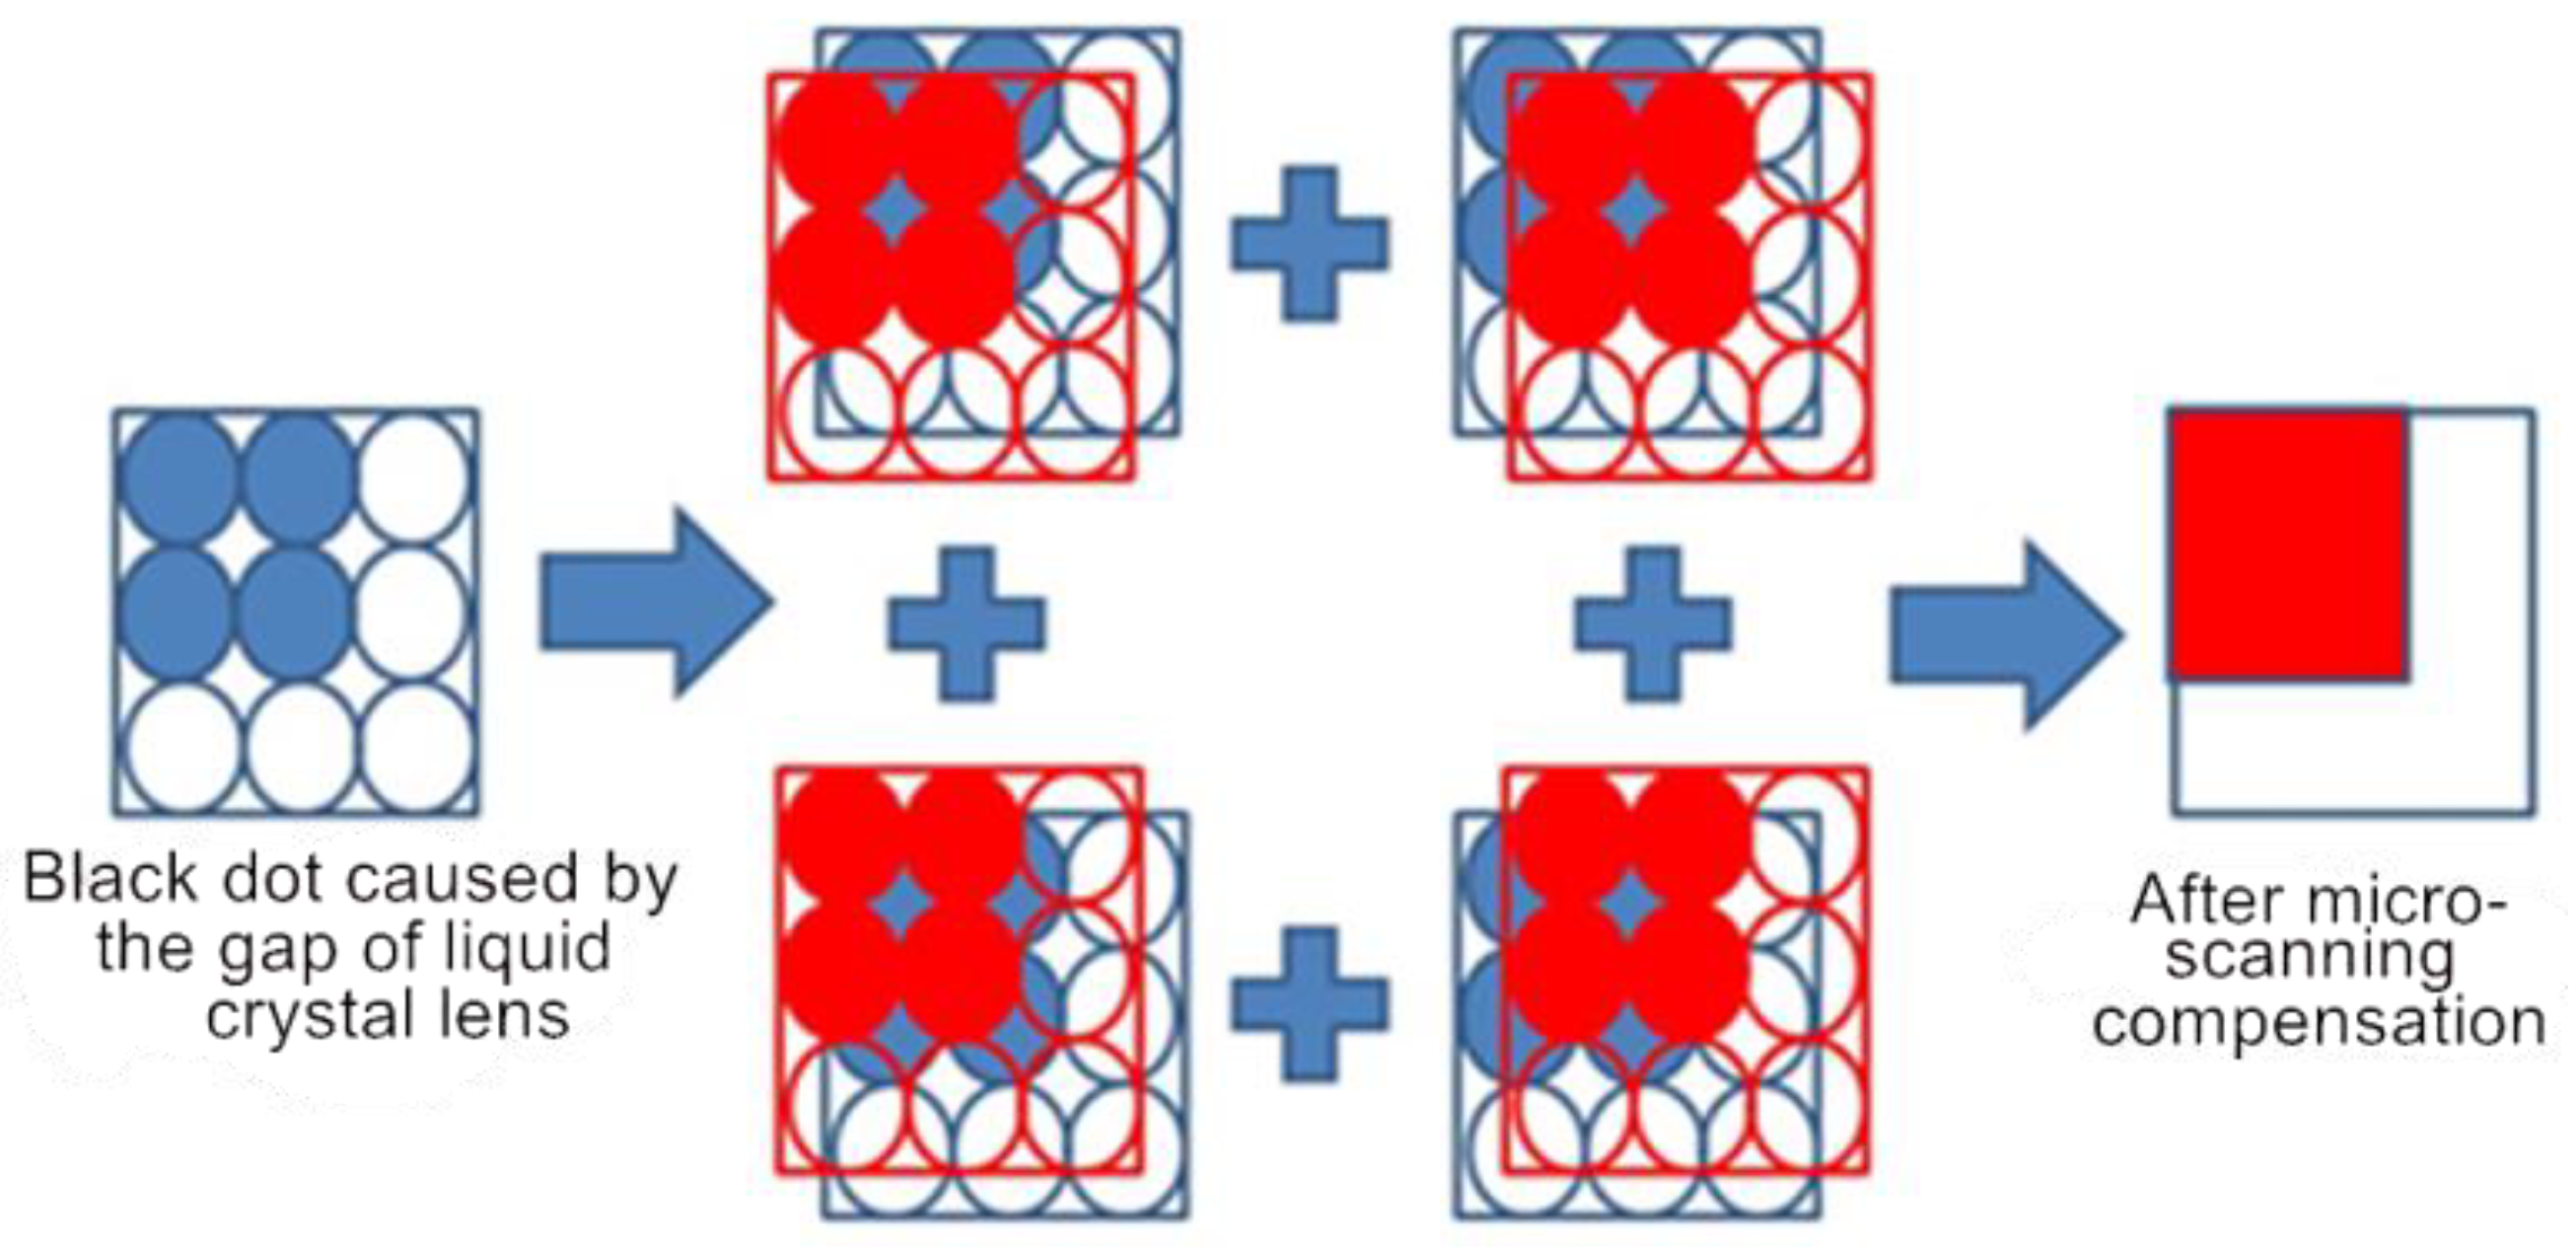
Micro-scanning technology (similar to subpixel rendering) is used to perform micro offset to the entire picture in order to compensate for the gaps between pixels. Relatively speaking, each pixel is small for the image, and hence the resolution is improved, as shown in Figure 1. In this projector, micro-scanning technology was used. The light projection lighting system was designed as per micro-scan technology, and the R, G and B light sources were designed as a 2 × 2 rectangular array of micro-scanning light sources, in order to achieve the effect of micro offset for the light sources. Its purpose was to compensate for dim spots in the pores caused by local dimming, and the resultant defects in terms of uniformity, while focusing on the light source uniformity for the imaging chip components. Subpixel rendering is a newly developed method to increase the apparent resolution of liquid crystal displays (LCDs) or organic light-emitting diode (OLED) displays by rendering pixels. It takes advantage of the fact that each pixel on a color LCD is actually composed of individual red, green, and blue or other color subpixels to apply anti-aliasing to text with greater detail or to increase the resolution of all image types on layouts which are specifically designed to be compatible with subpixel rendering technology. Some subpixel rendering technologies were supported by electronic circuits working with algorism. Some were specially designed via highly precise opto-mechatronical system.
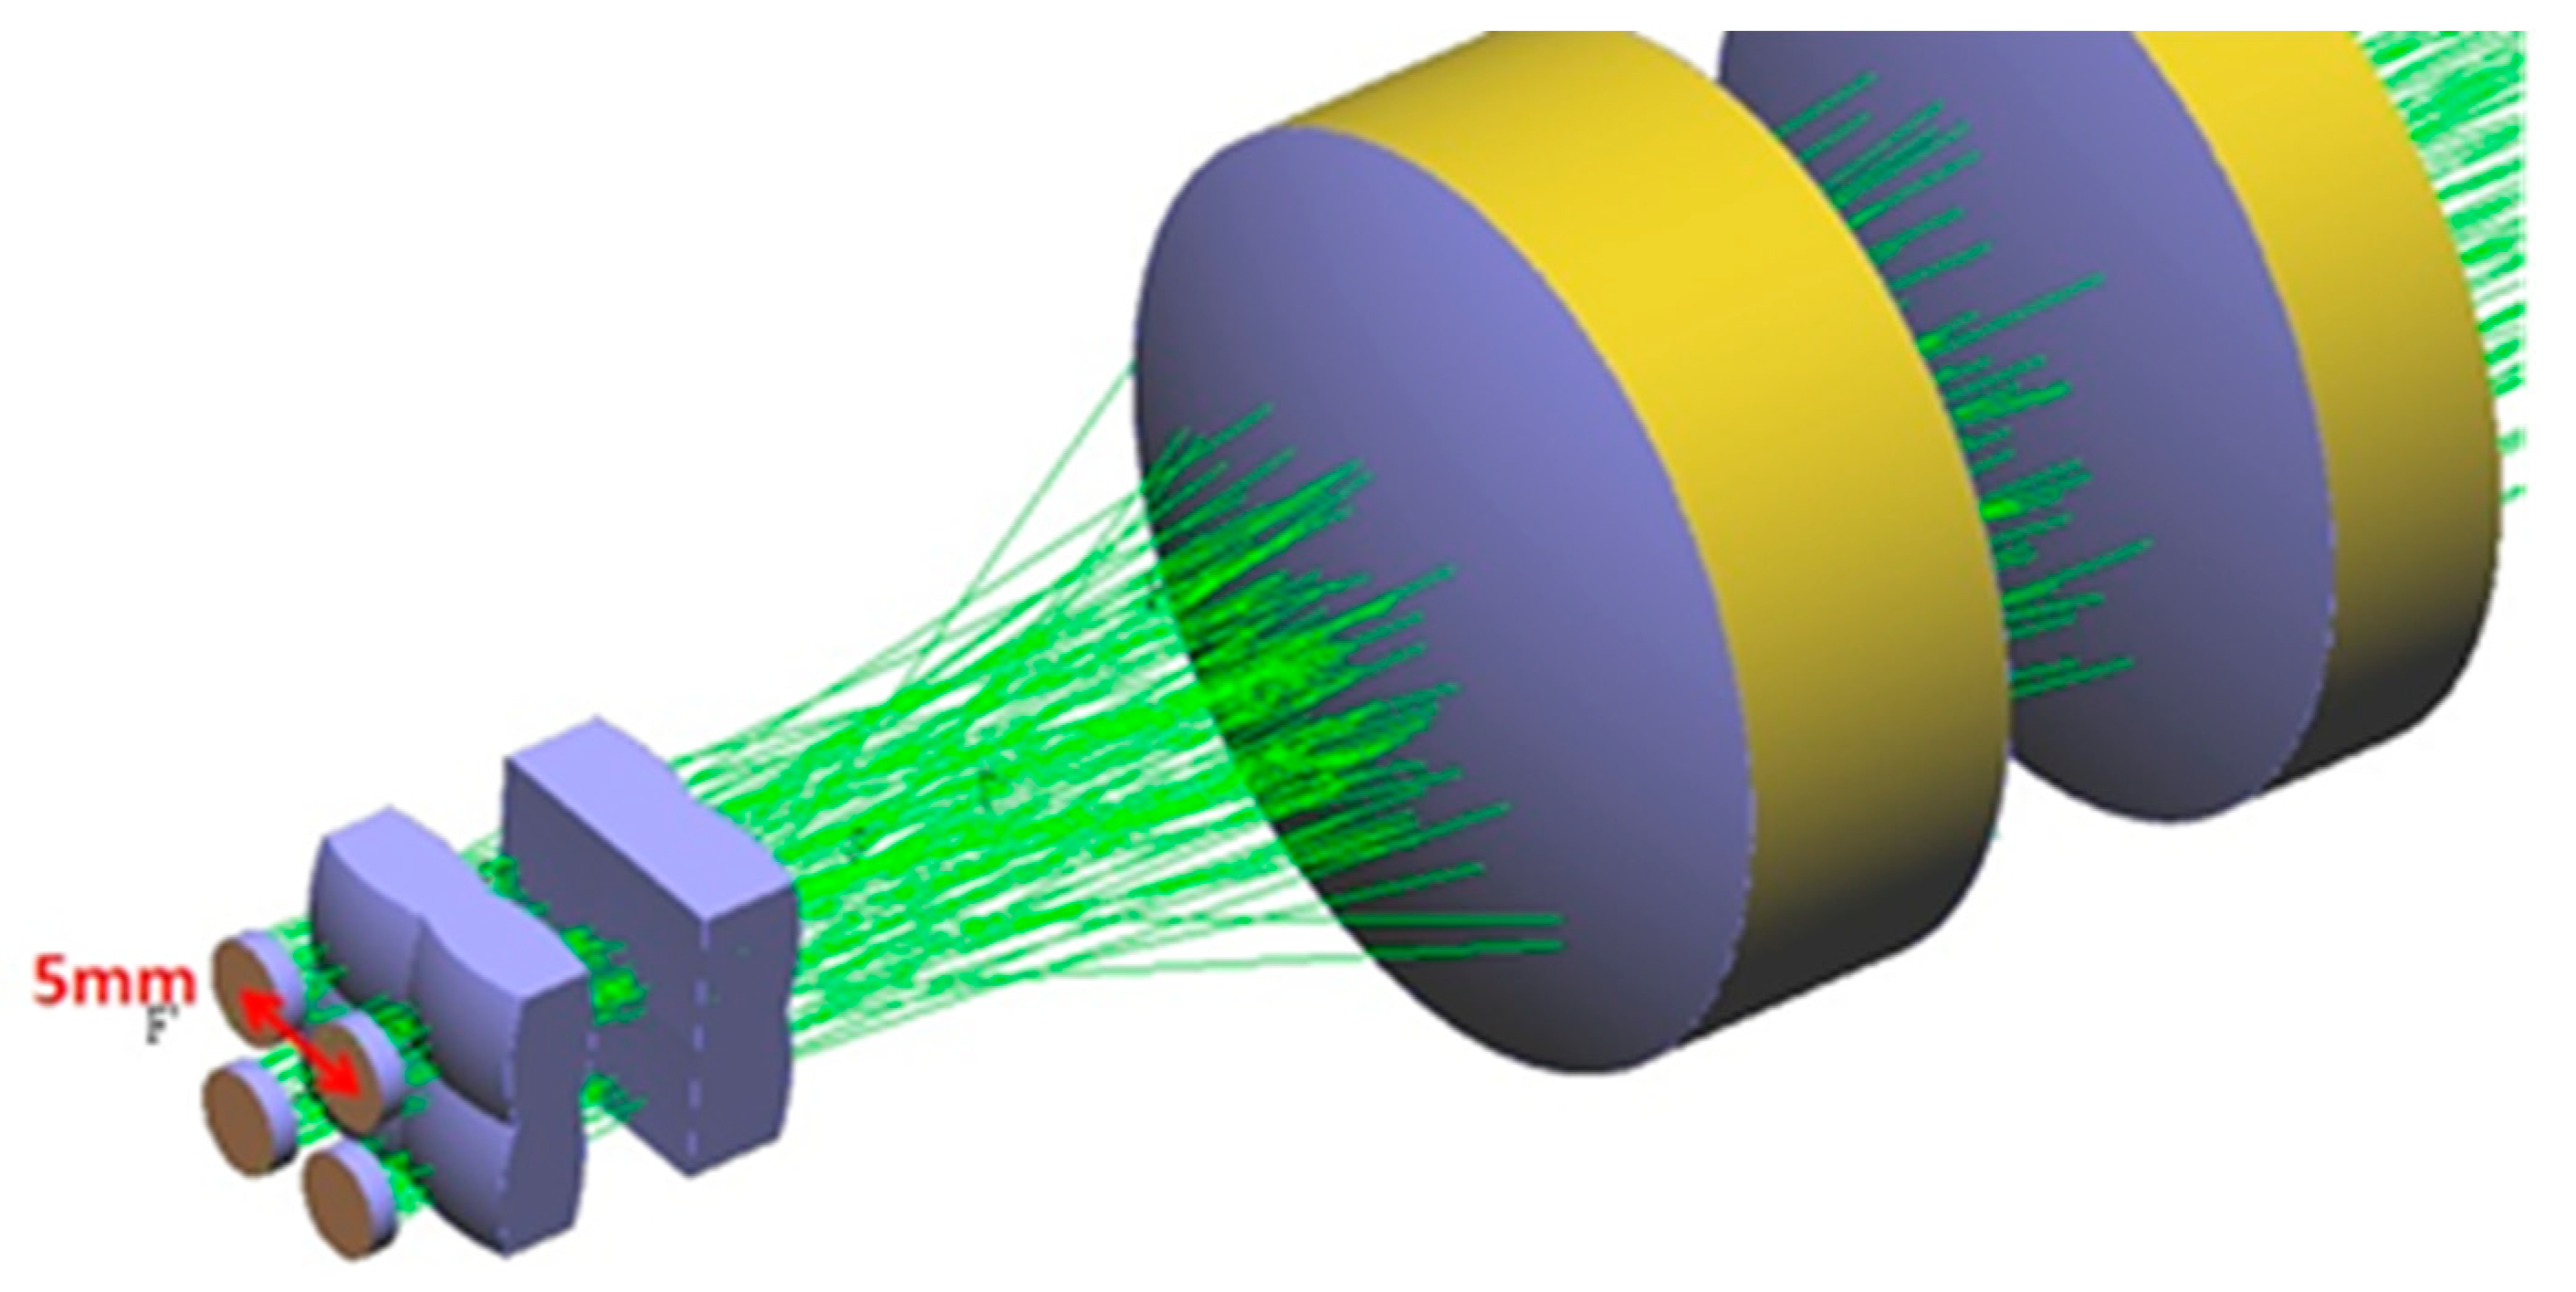
The R, G and B light sources each had four laser diodes arranged in a rectangular manner, symmetrically aligned with the main axis. When the array distance is 5 mm, as shown in Figure 2, a better optical superposition area can be achieved. However, for lenses that are closer to the light sources, micro lenses with a pore size of 5 mm are designed to accommodate the light source. In terms of the light source, the space between the arrays should not be too large; otherwise, the location of the light spot would shift too far and result in a failure to compensate. However, the distance should not be too small either. The size of the volume occupied by the hardware, as well as the size of the lens should be taken into consideration. If the lens is too small, then the light would diverge too much, reducing light efficiency excessively. In addition to the distance used in the light source arrangement, another factor that impacts on the optical superposition area is the length of the optical path from the light emission point of the entire light source to the imaging chip components. Throughout the projection illumination system, the lengths of the optical paths for R, G and B were all 130 mm.
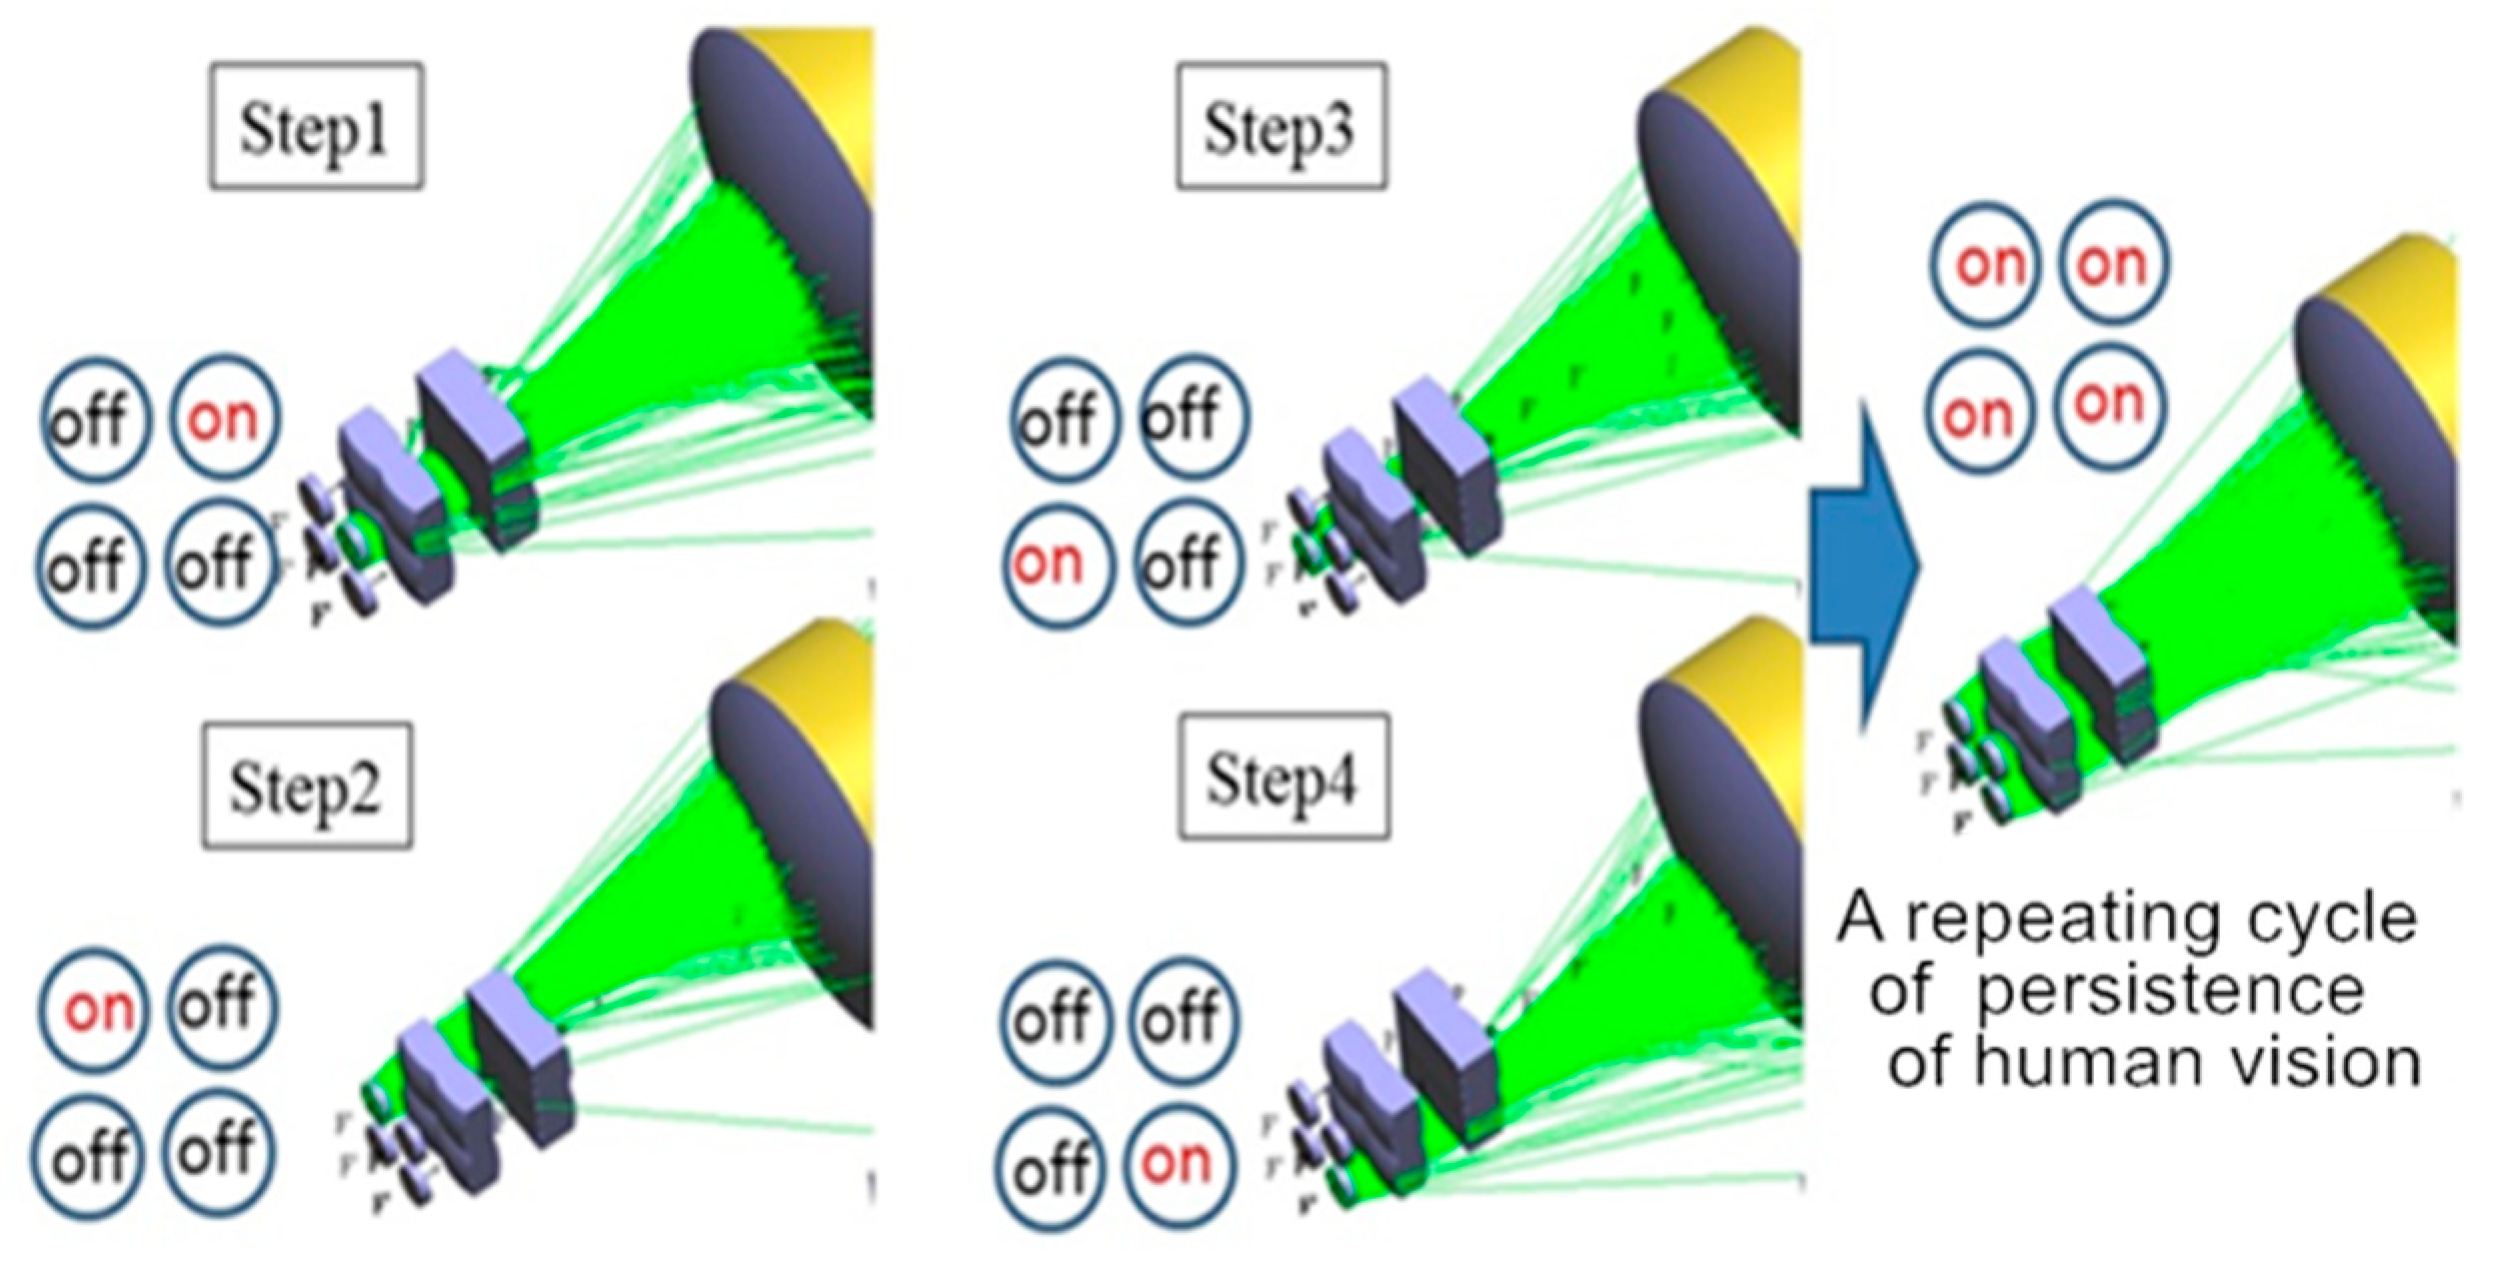
The mode of operation of the four light sources was based on the use of the lighting and extinguishing cycle of the output light source. The main purpose was to project the four light sources in a slanted manner—due to the light source being off-axis—onto the imaging chip components. As a result, a micro-offset effect was achieved for the light source projected onto the imaging chip components. The design of light source micro-scanning was thus achieved. Such a design uses the persistence of vision effect for optical superposition, so was not true optical superposition.
In addition, such an effect can be used for compensating for uniformity. Figure 3 shows a mode of operation of a micro-scanning cycle for a light source. Using the microprocessor system, four light sources were adjusted to go through rapid cycles of lighting and extinguishing. Figure 4 is a schematic diagram of light source compensation. The operating mechanism was not true optical superposition. It was in fact the persistence of the vision effect of four light sources going through cycles of lighting and extinguishing, resulting in effective light source compensation achieved by adjusting light on the imaging chip components.
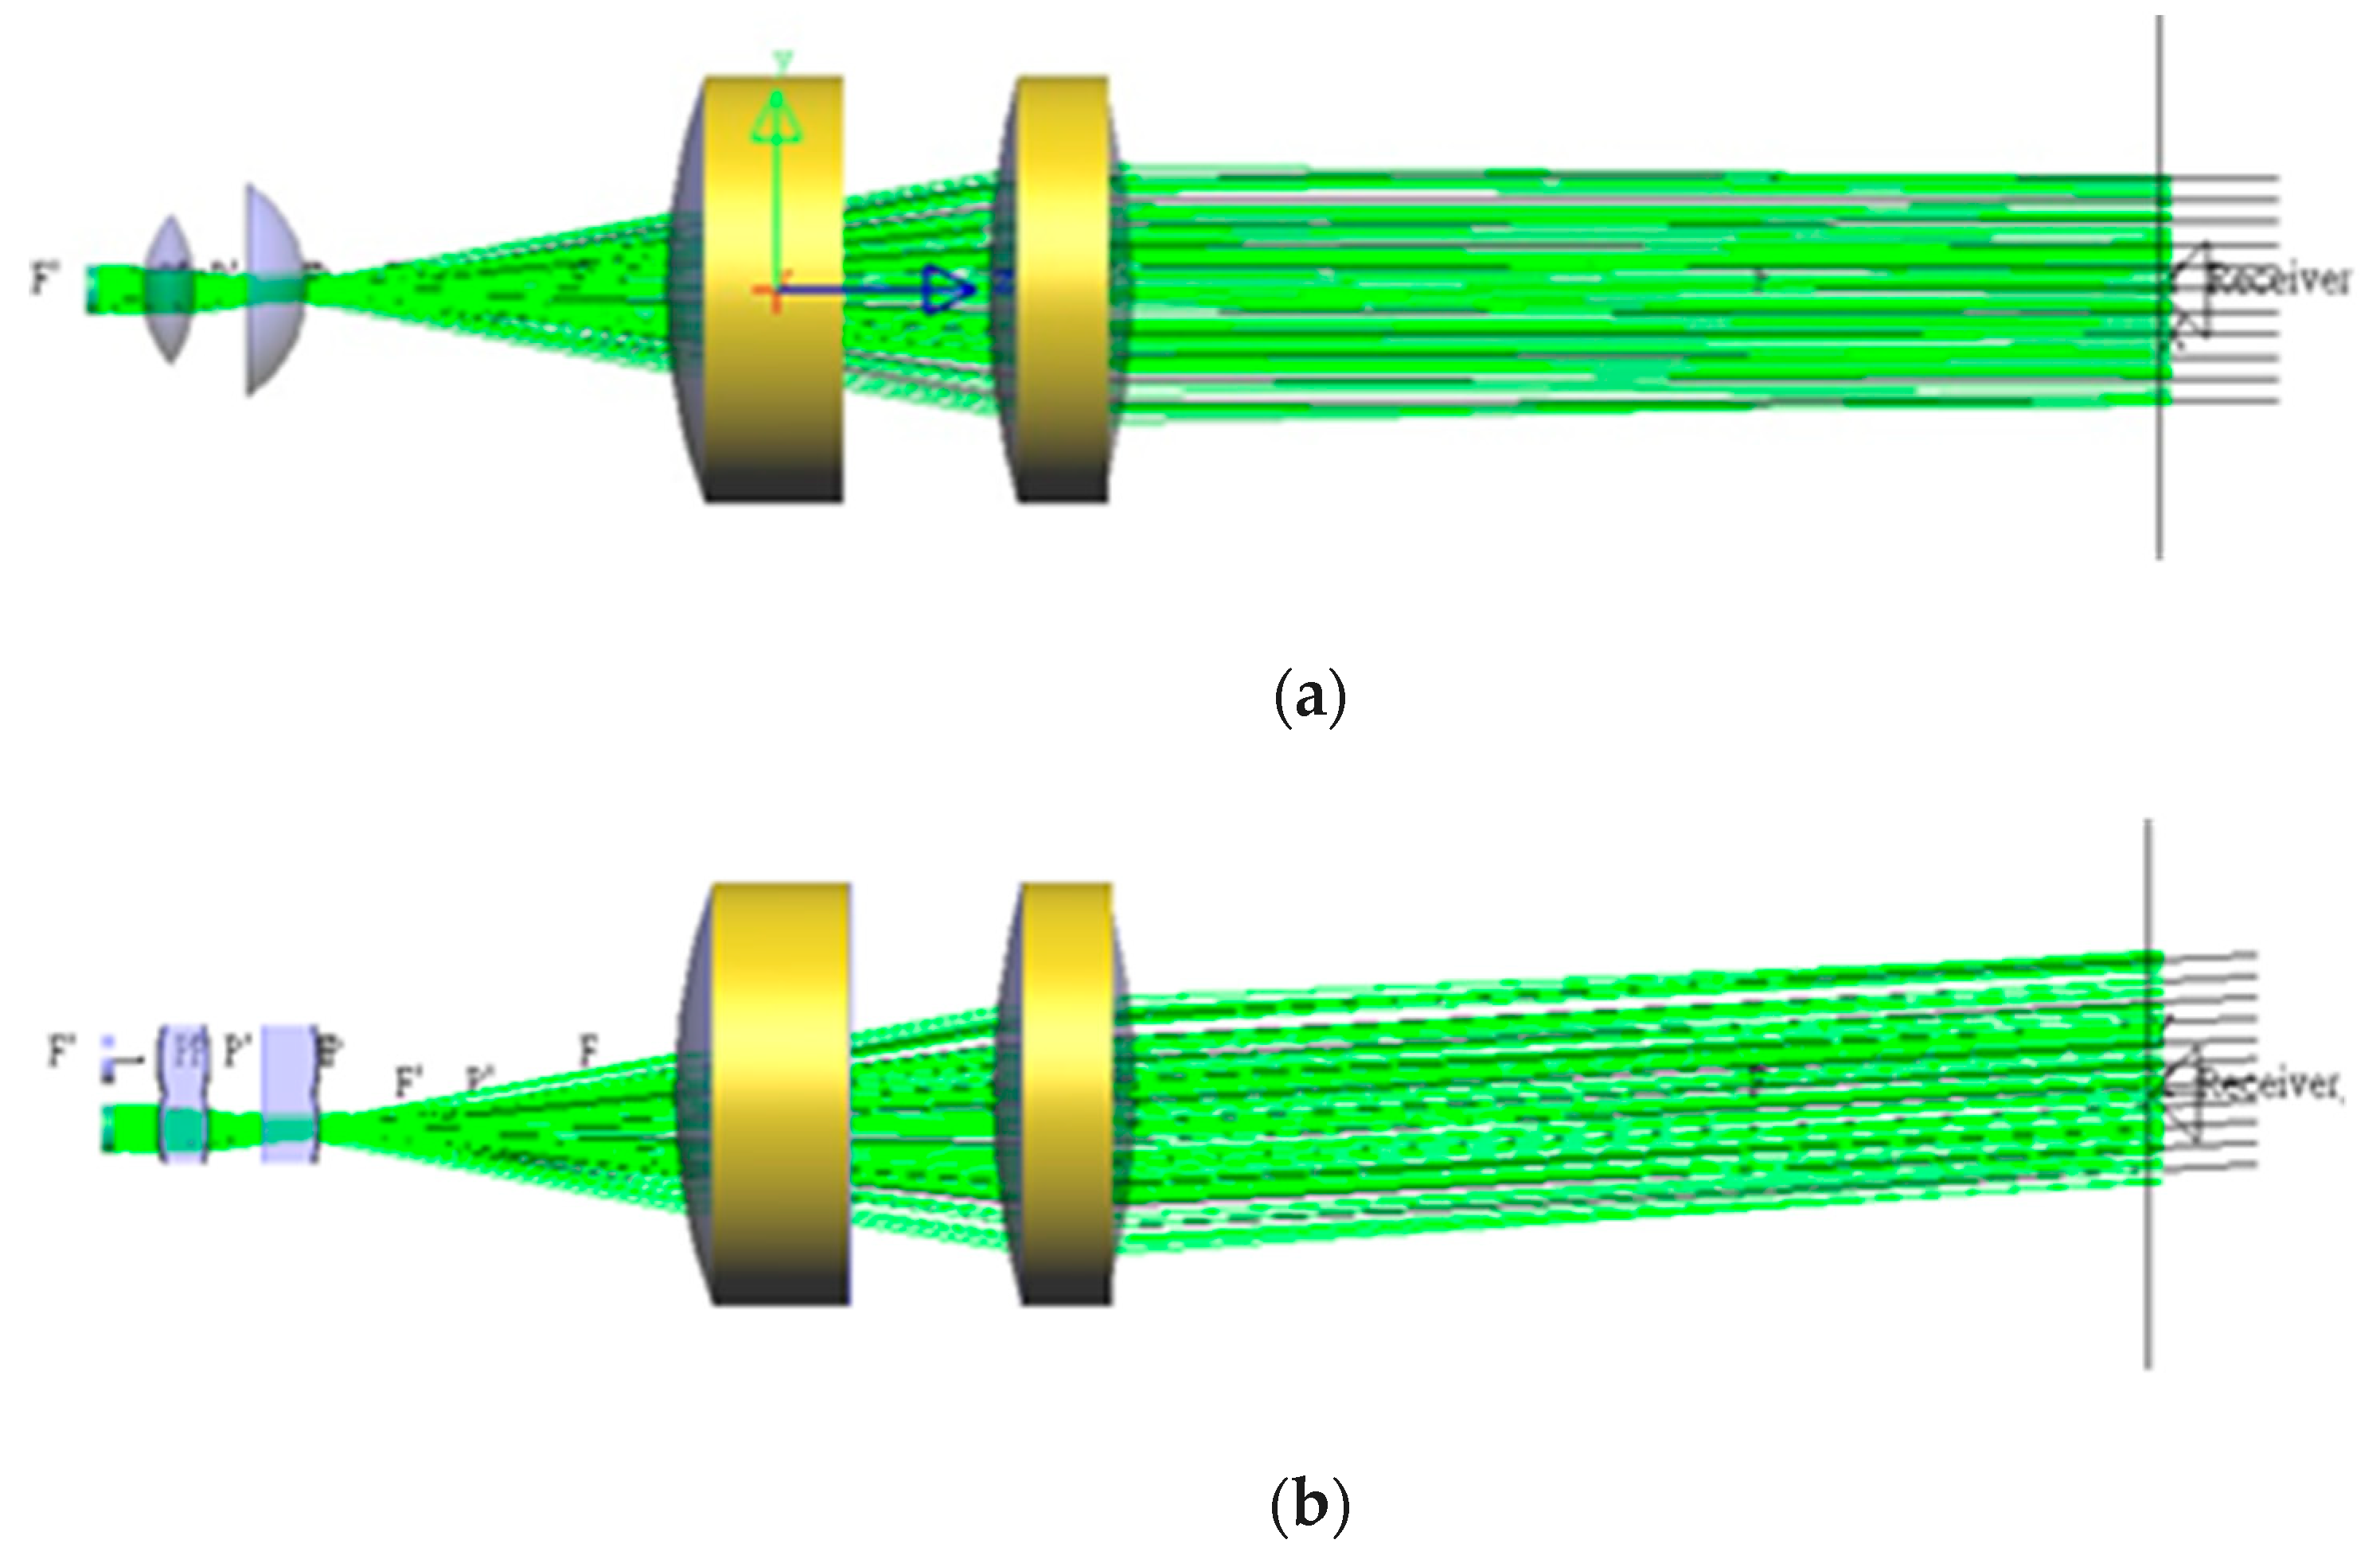
In the design of the projector, a telecentric system was used and therefore when constructing the optical path, a telecentric optical design approach was used. After configuring the aperture stop, the main light beams of the emitted light ray were parallel to the optical axis, and the exit pupil was pushed to infinity. The optical paths for R, G, and B were individually designed. For the lenses that were on the optical paths, curvature, thickness, and location were optimized in terms of uniformity and accuracy [12]. Since the off-axis for the light source could not be designed directly, a single light source was used in the design of the telecentric system, as shown in Figure 5.
The laser light source was then changed into rectangular arrays that were symmetrically arranged. The lenses that were close to the light source were designed as microlenses with a pore size of 5 mm. This design was intended to prevent the off-axis angle of the off-axis light from being too large.
2.3. The Design of the Dimming System with Liquid Crystal Lens Array
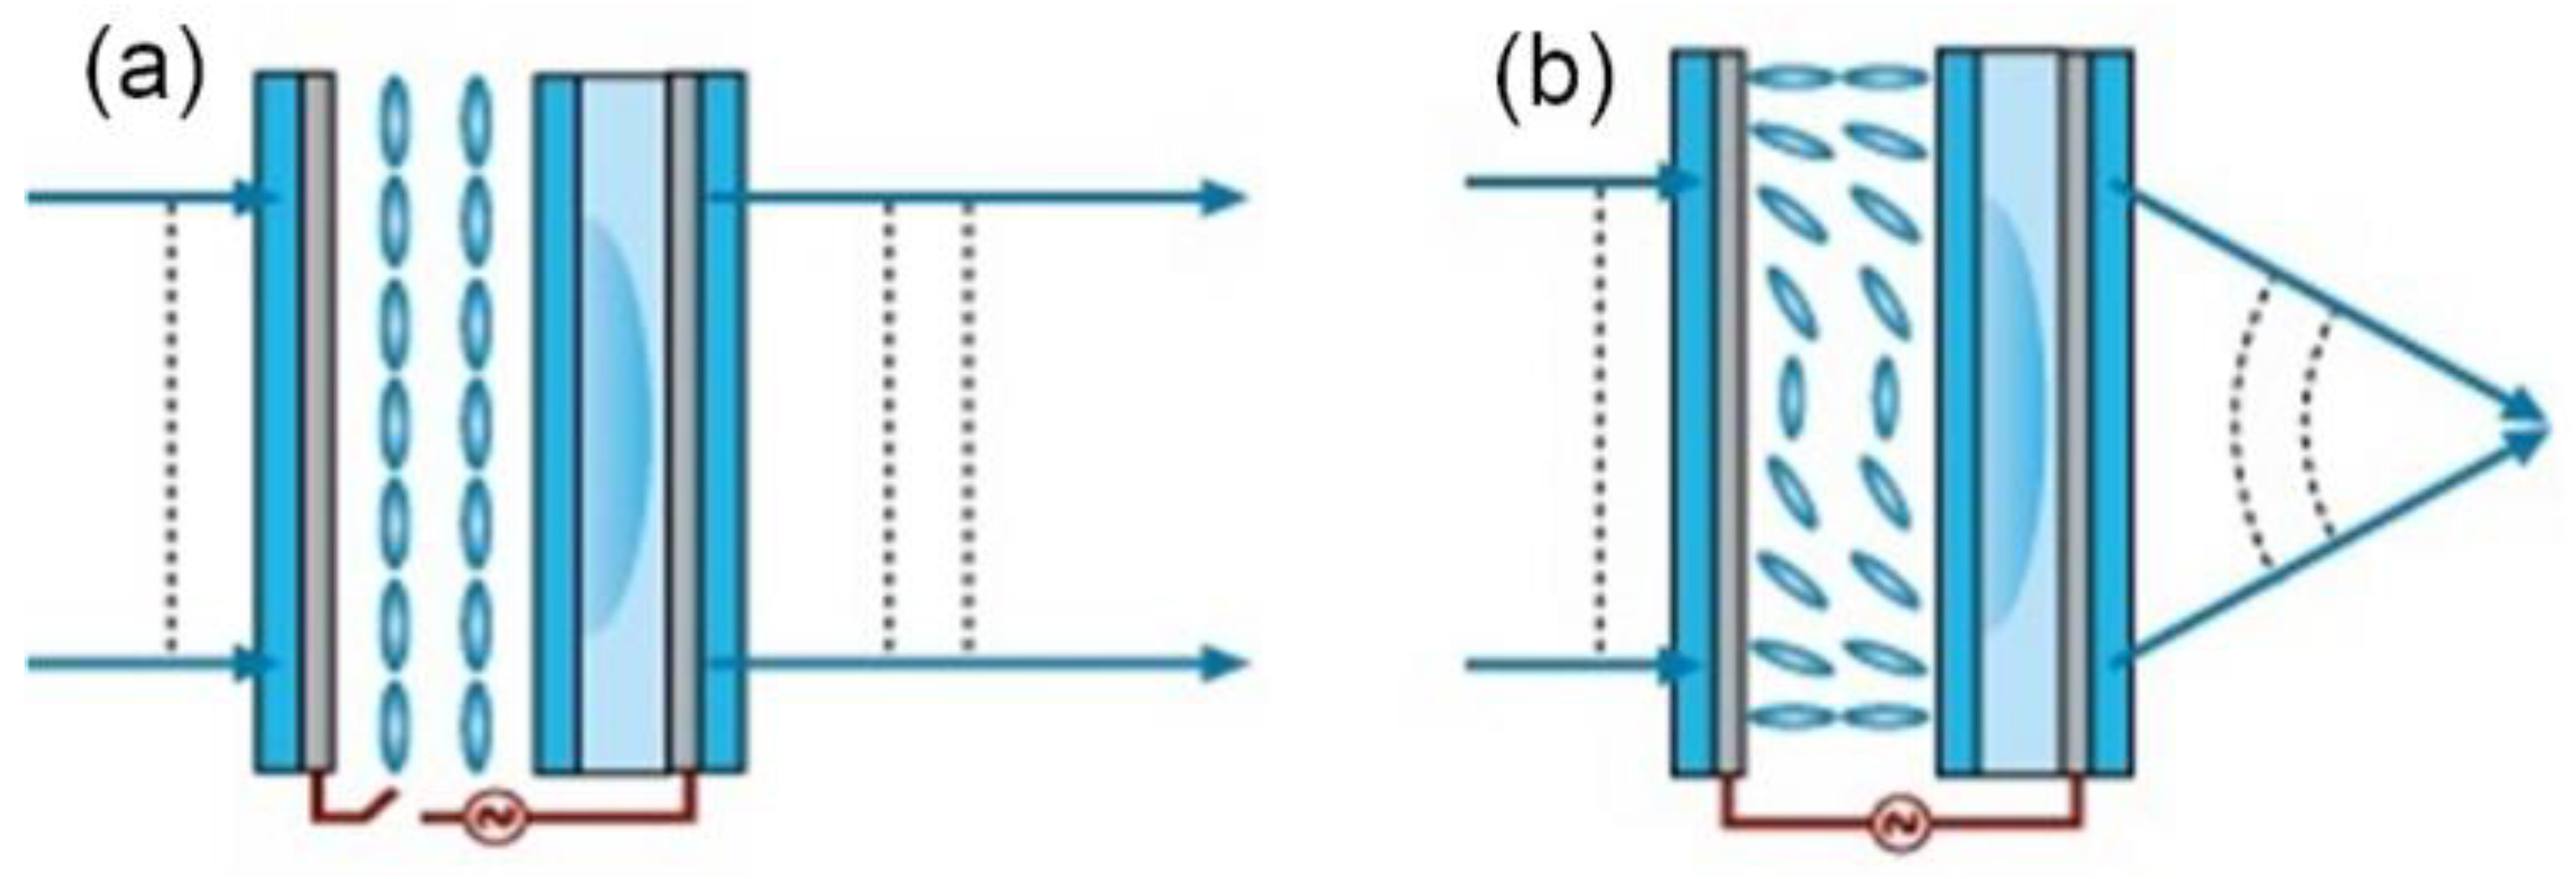
The basic principle for the liquid crystal lens was to create a non-uniform electric field in space and change the direction of the guiding axis of the liquid crystal molecules. The liquid crystal layer could then display a gradient distribution for the index of refraction as shown in the optical lens—the Grin lens. This causes the optical path to deflect and thus achieve the focusing effect. If the liquid crystal lenses do not experience interference from the electric field, or the electric field interference has caused every liquid crystal molecule to be completely disoriented, then the lenses have no effect at all, as shown in Figure 6.
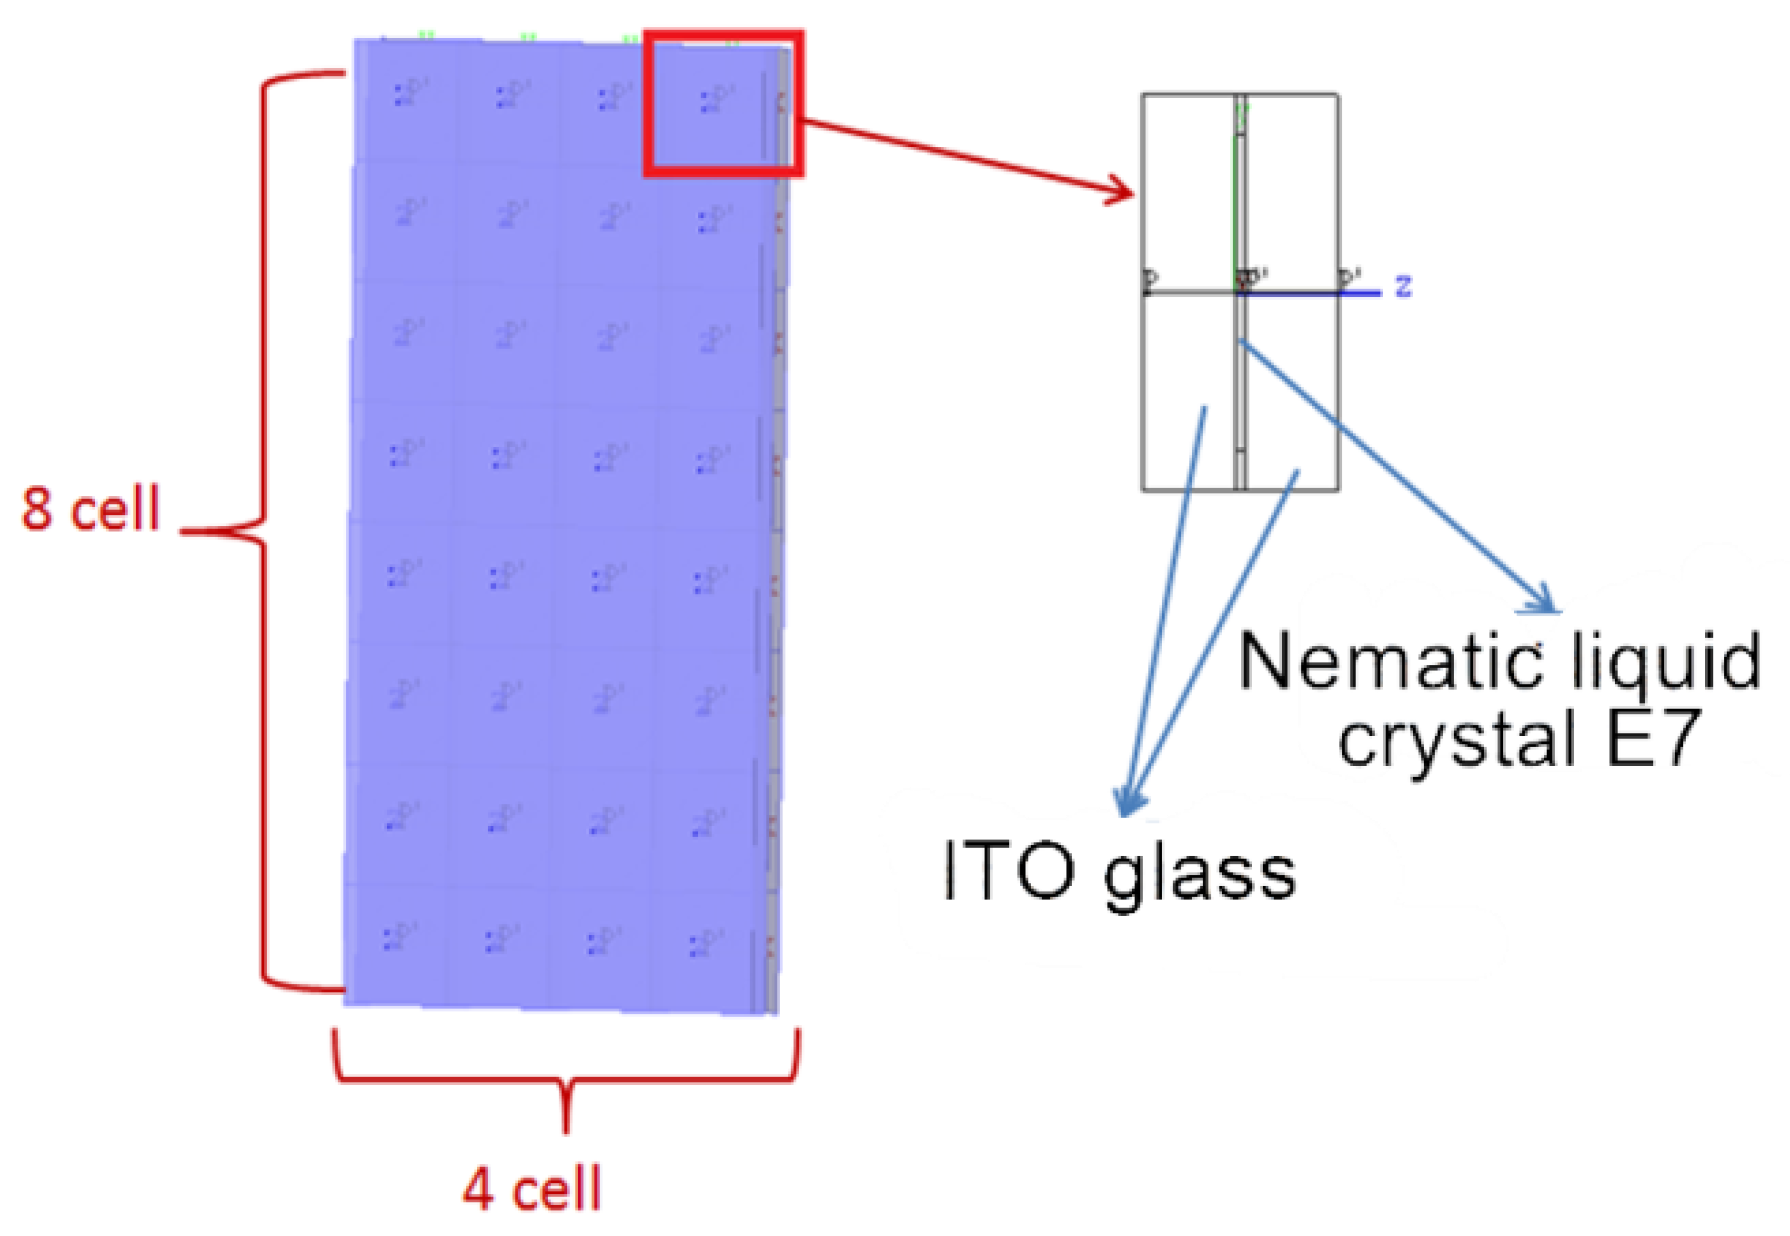
In terms of the liquid crystal lens structure for each unit, each liquid crystal lens was designed to have a volume of 2 mm × 2 mm × 1.05 mm in the simulation. Merck E7 Liquid Crystal was used as the liquid crystal material. The relationships between the focal length, voltage, and pore size are as shown in Table 2. The liquid crystal lens data referenced the research results obtained by Yingling Chenrom, Chungshan University on modulating liquid crystal lens using voltage [2].
The initial application of dimming backlight technology was used in liquid crystal displays. It was mainly based on gray scales required for the images, and then the backlight was used to regulate the brightness and darkness of the light source. The backlight dimming system can be divided into global dimming or local dimming depending on the lighting and extinguishing method of the backlight. Global dimming is mainly for performing a complete and uniform dimming to the entire picture in terms of brightness and darkness. Local dimming is mainly used for performing partial dimming on part of an image. In terms of image contrast as well as light efficiency and energy saving, two-dimensional local dimming has the best results.
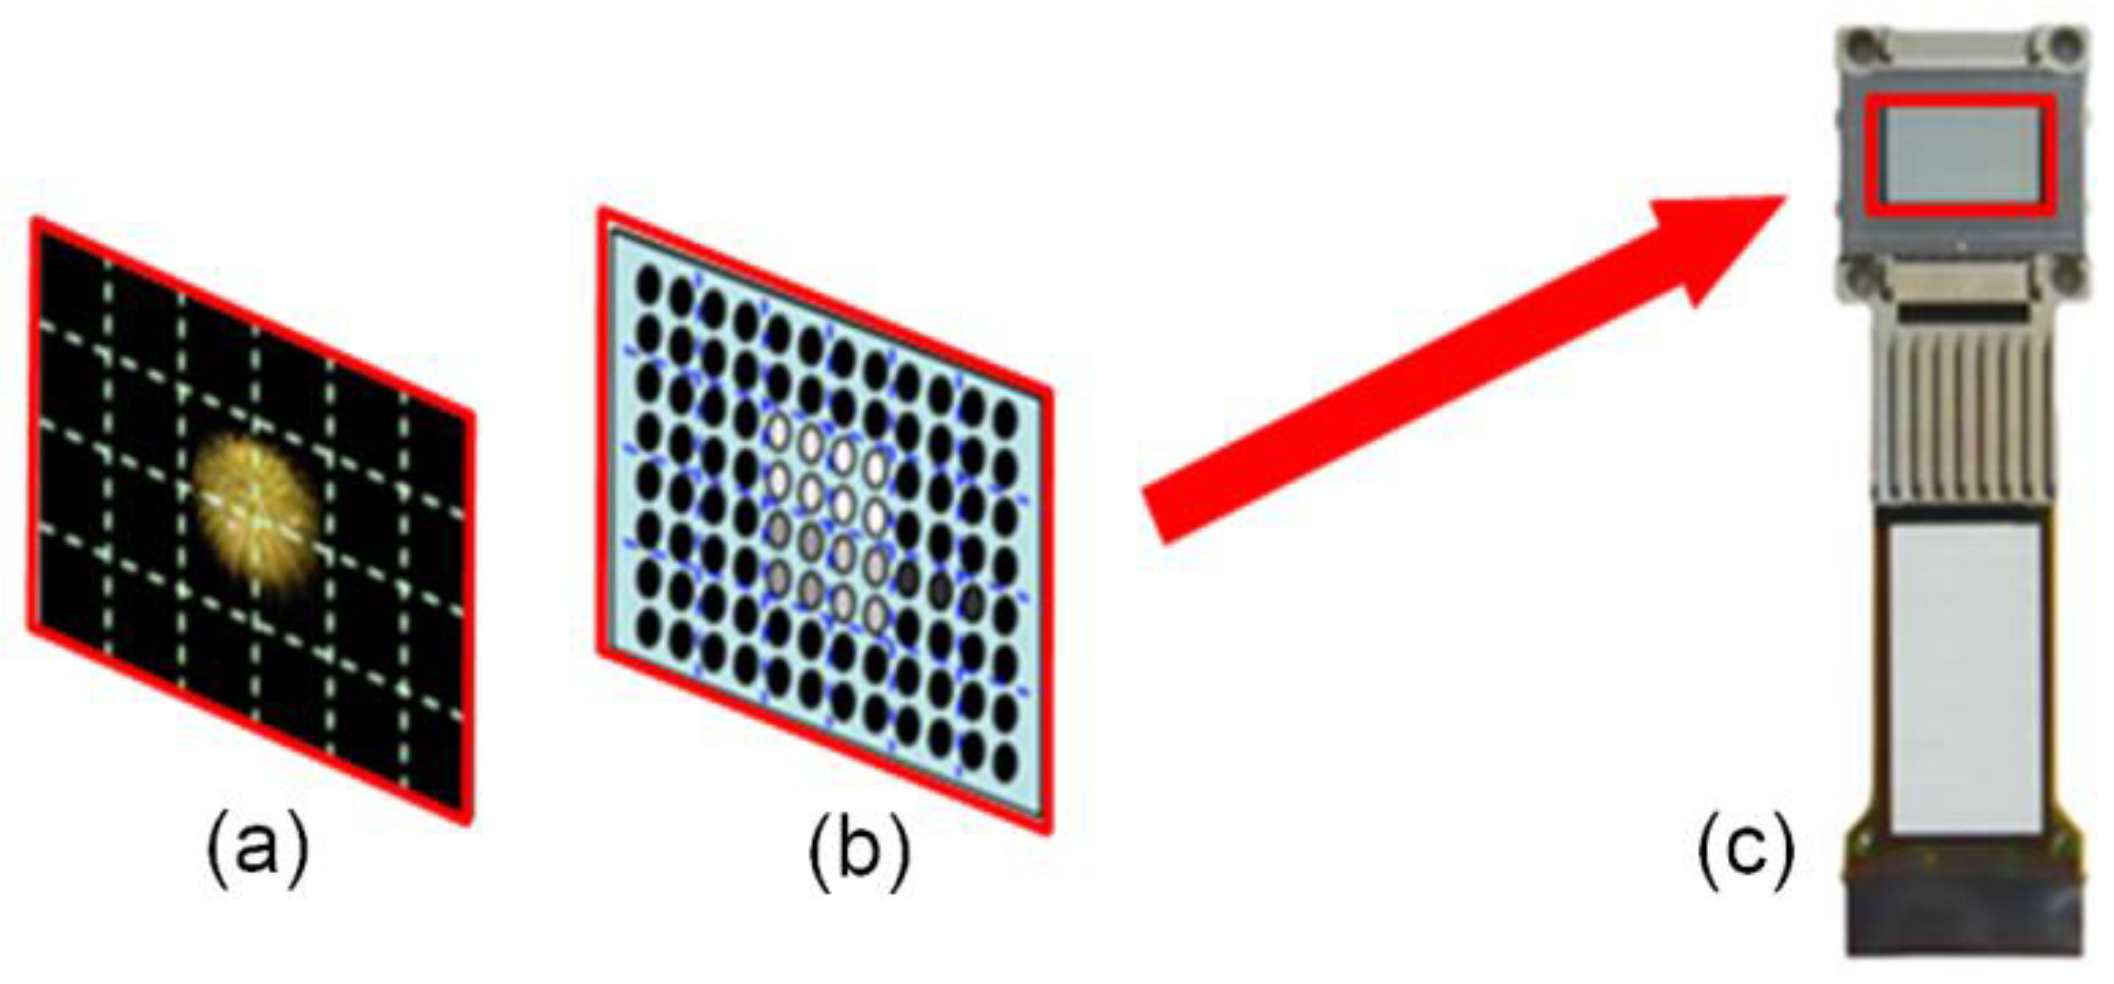
In this study, the dimming technology was used in the projection and illumination system for projectors. The purpose was that through the use of this dimming system the imaging chip components could provide considerable uniformity in terms of illumination, as well as lighting contrast, as shown in Figure 7.
In the dimming system designed in this paper, the liquid crystal lenses were arranged in an array pattern and placed in front of the imaging chip components. The voltage of each unit in the liquid crystal lens array was regulated by means of a microprocessor in the opto-mechanical system. In other words, the focal length of each unit was regulated, thereby changing the luminance and size of the circular optical spot in each unit. This mode of operation can provide the desired degree of illumination gray-scale required by images.
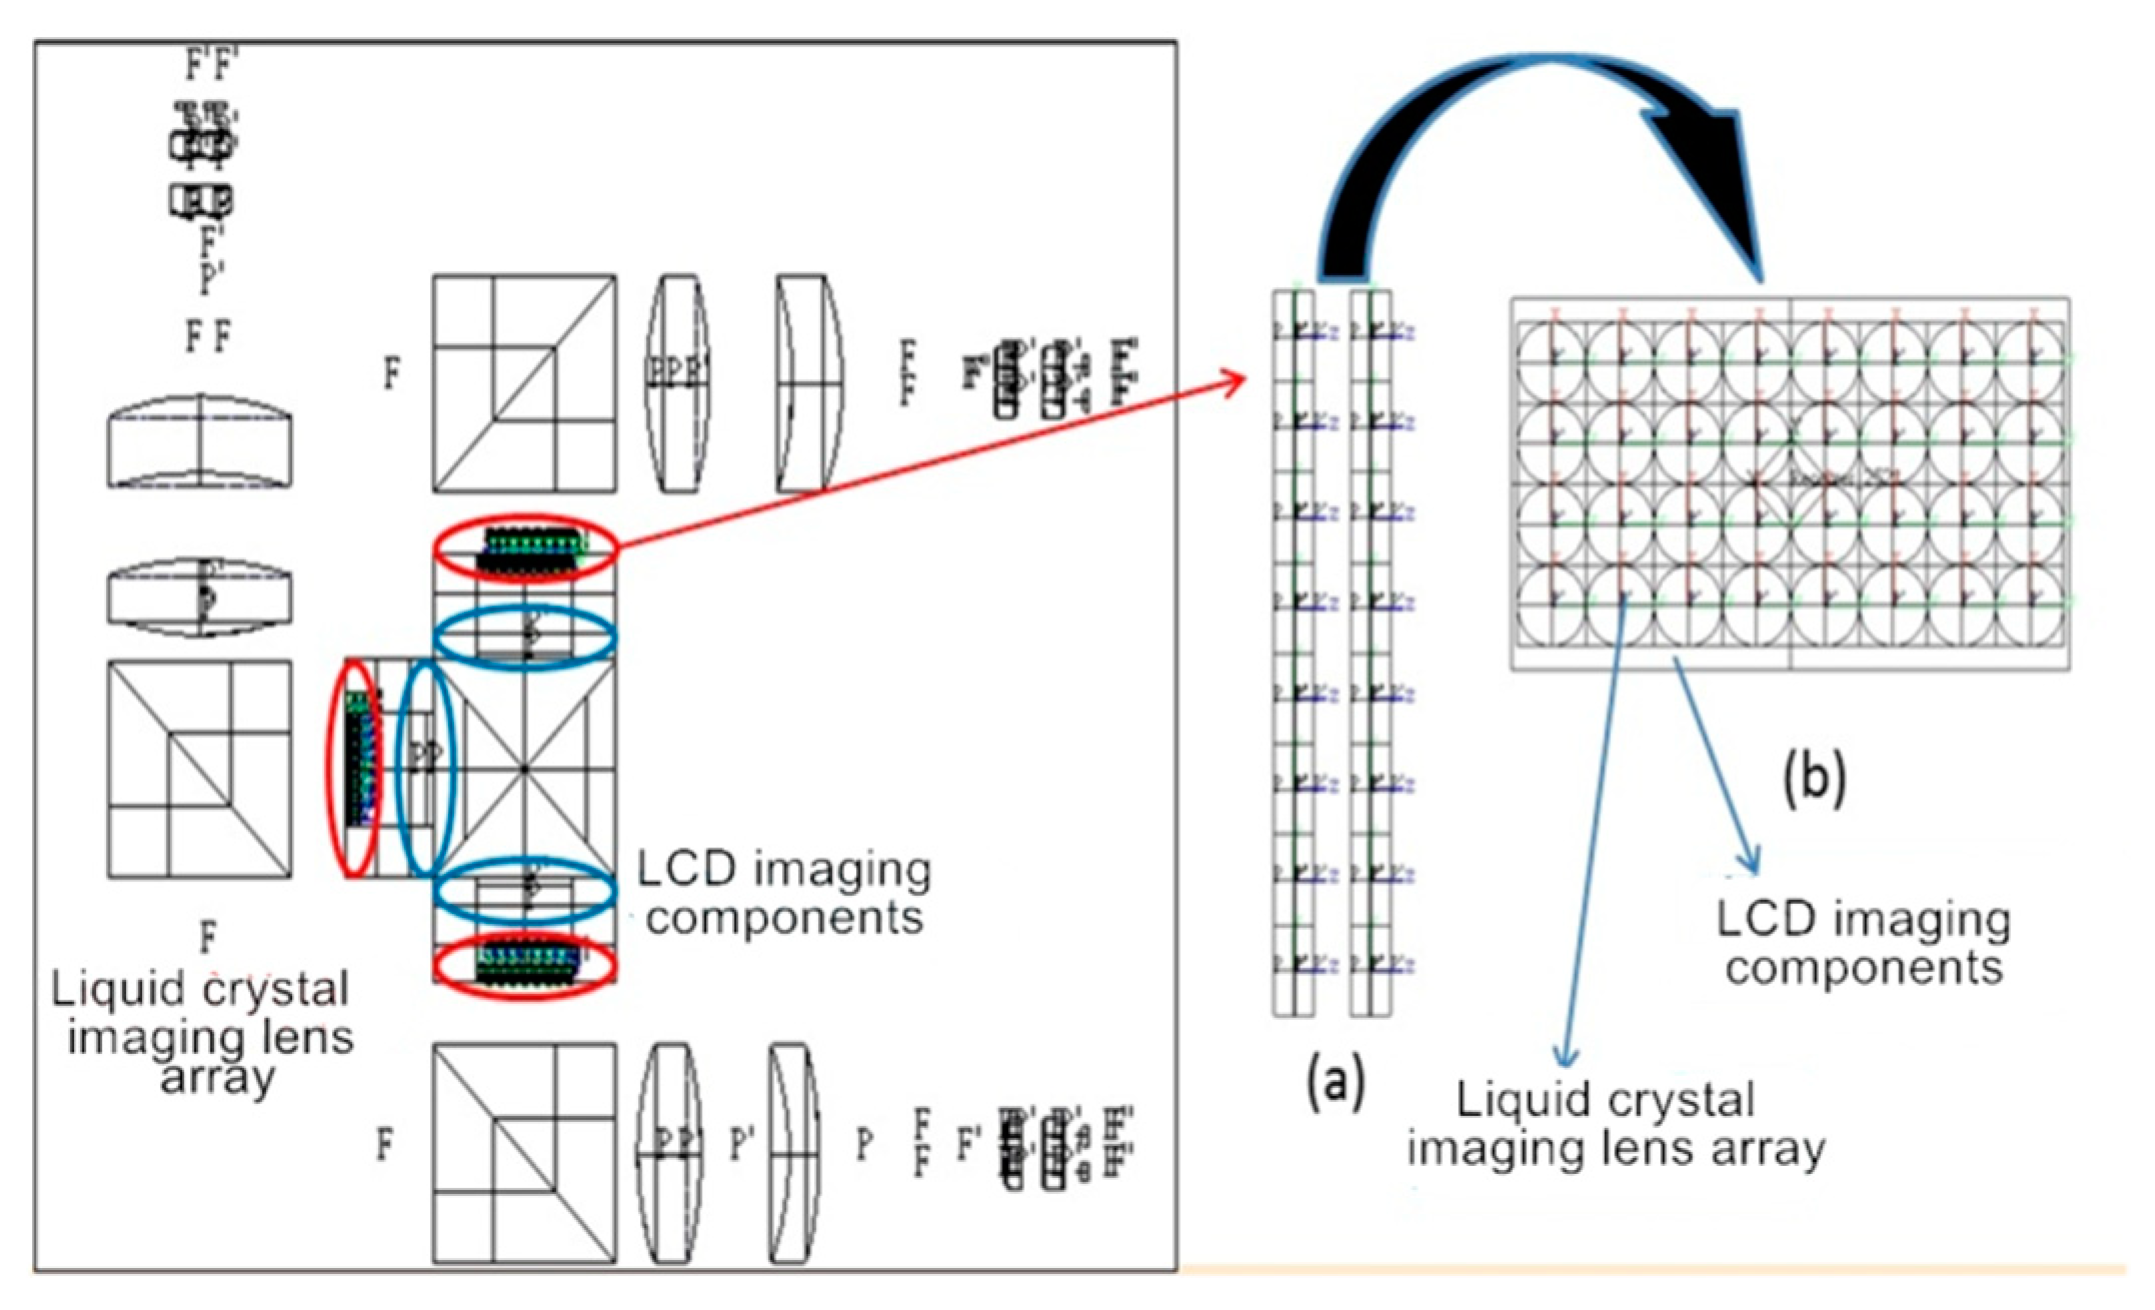
For the dimming system in this study, the liquid crystal lenses were designed in an array of 4 × 8 ranks, as shown in Figure 8. The array was placed in front of the imaging chip components. The distance between the liquid crystal lens array and the imaging chip components was 8.5 mm. The position correlogram is shown in Figure 9. The objective was to perform dimming, and it was performed in front of the chips. The design for such a lighting system was done to resemble the design when the liquid crystal screen was illuminated vertically. The designed array size was smaller than the imaging area of the LCD chip components. The size of the LCD chip component was 16.32 mm × 9.18 mm, and the size for the effective functional area for the dimming system was 8 mm × 16 mm.
2.4. Construction of the Optical Path
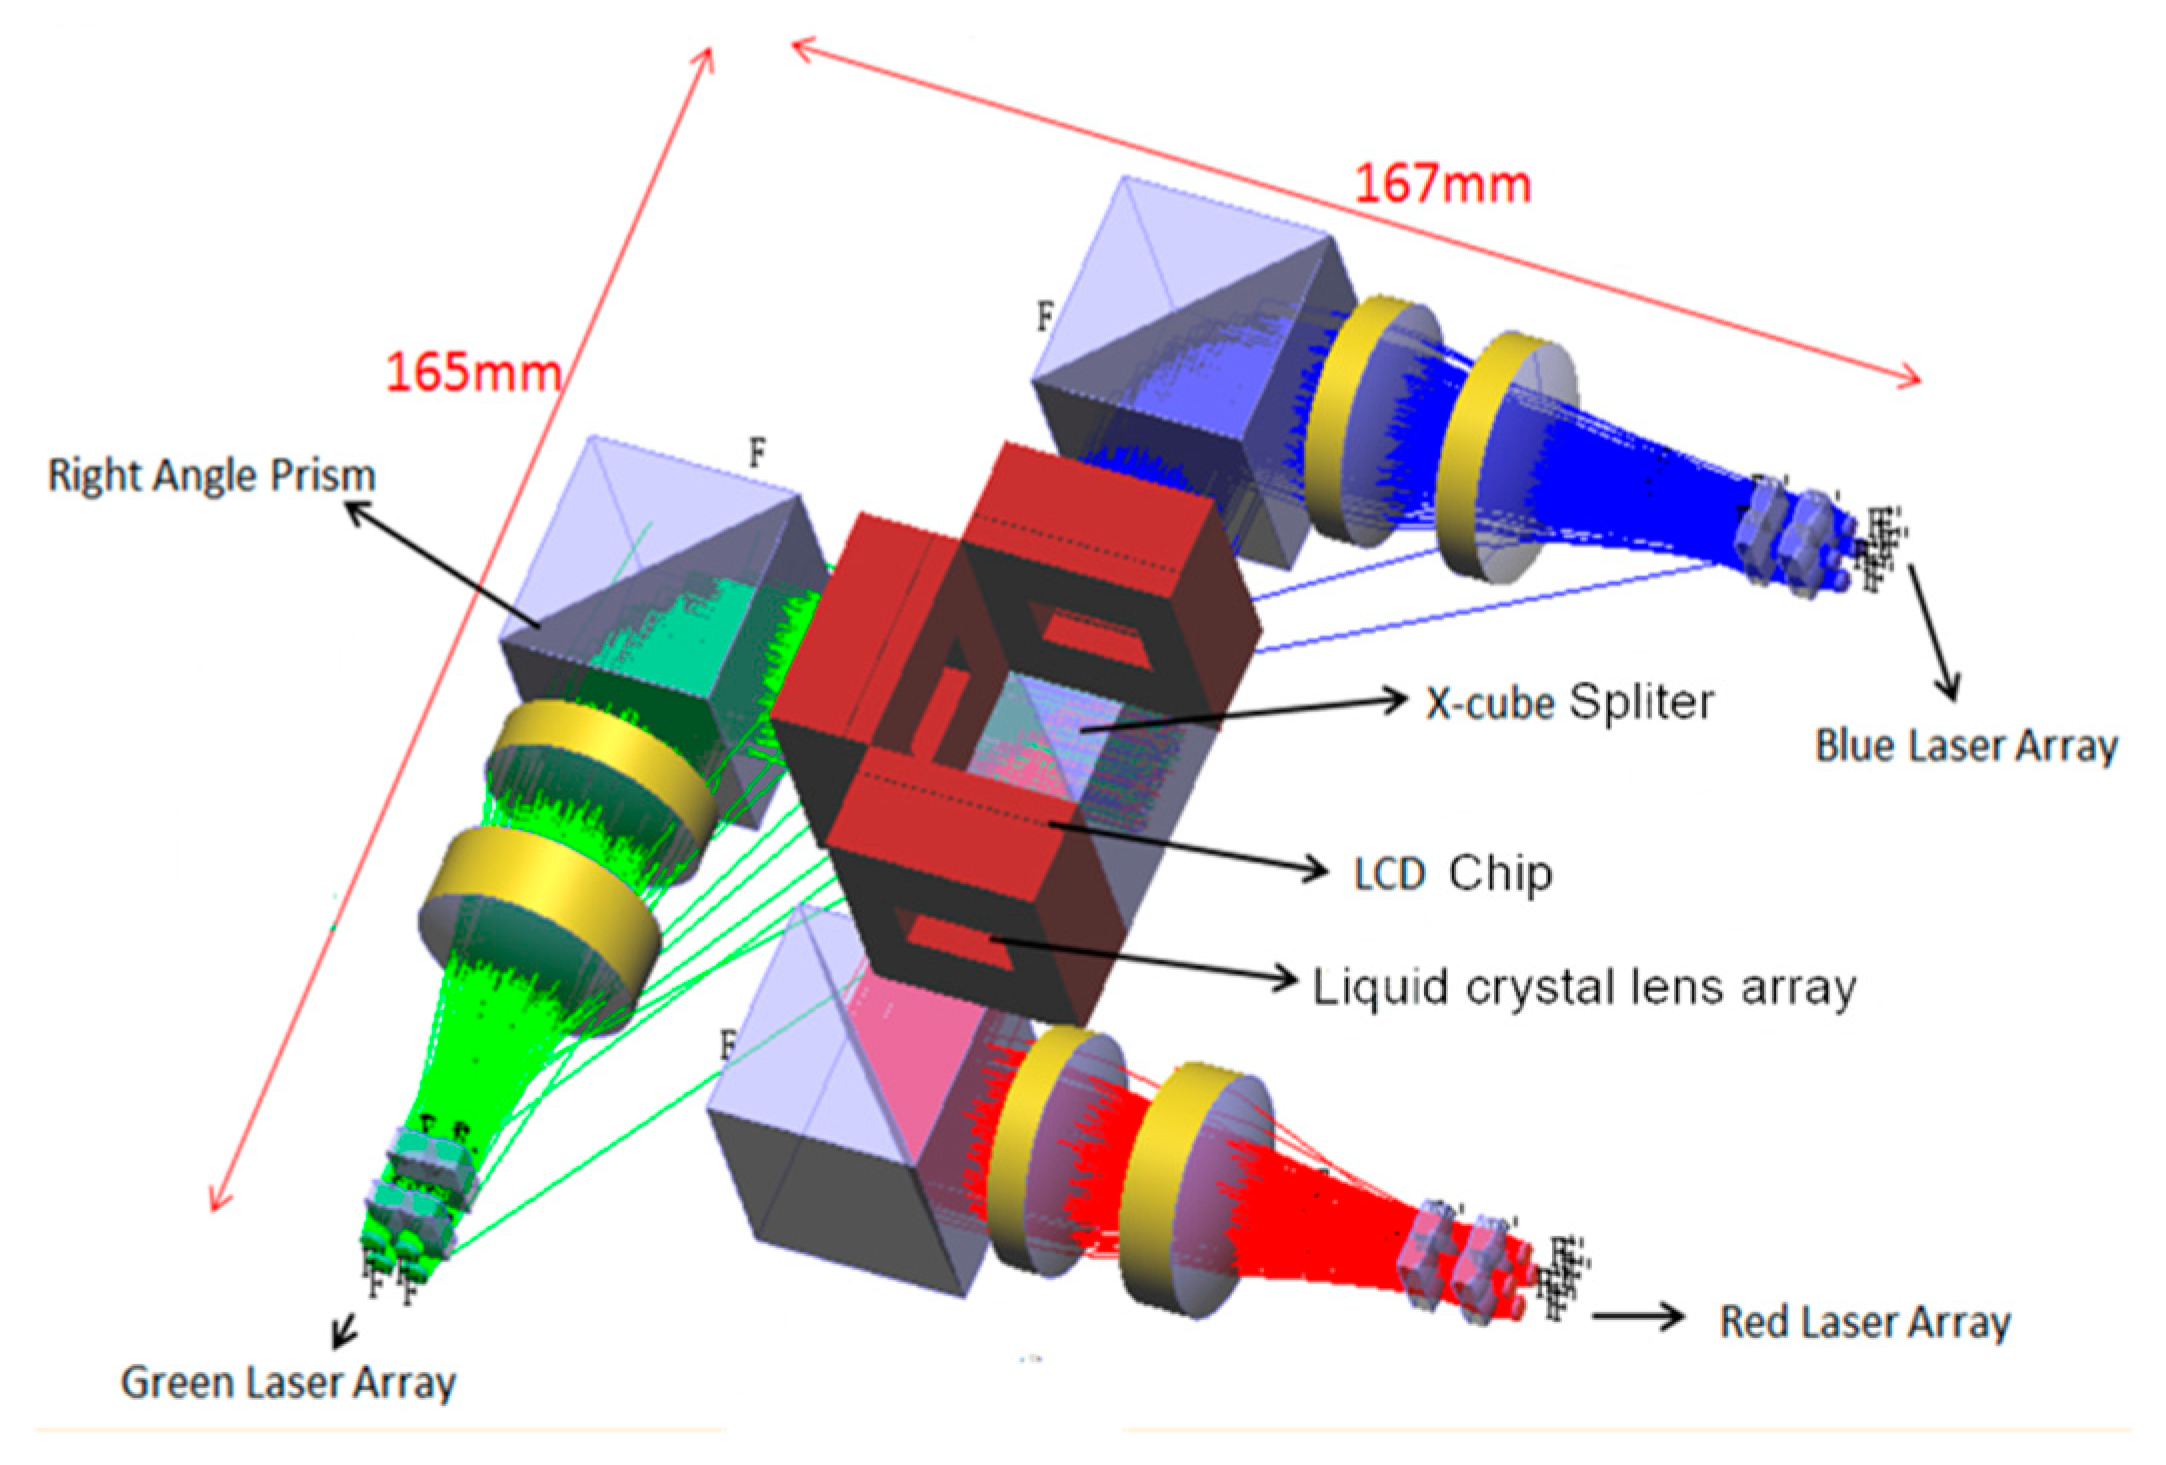
The projector designed in this study was an LCD projector, and the projector design diagram is shown in Figure 10. For the optical paths for R, G, and B, the laser arrays were arranged to be in a 2 × 2 rectangular array. The light source emitting method was controlled and regulated by the system in the form of a micro-scanning cycle of lighting and extinguishing. After passing through the optical paths with telecentric design, the light source was refracted by the right angle prism onto the liquid crystal lens array in order to perform local dimming on the imaging chip components. Lastly, the three colours were converged onto an X-Cube spectroscope to perform light mixing. The opto-mechanical volume was 165 mm × 167 mm × 31 mm, and the F-number was 1.64.
After passing through the lens, and the laser beams were expanded, collimated and uniformly distributed, and were about to enter the imaging chip components. Since we were focusing on size reduction, we used a right angle prism to refract the optical path to reduce the size of the opto-mechanical design. The right angle prism refracts the optical path at 90 degrees; its advantages include the fact that the total reflection surface has a large usable area. It functions similarly to that of a reflector; but its right angle prism has better stability and strength in terms of installing the opto-mechanical mechanism.
In terms of the optical path, a non-imaging optical software product, LightTools (Synopsys, Mountain View, CA, USA), was used in the construction and optimization of the lens group on the optical path. In terms of the uniformity and luminous flux of the projection illumination system for the projector, this study discusses only the optical efficiency from the light source to the imaging chip components. According to the HTPS (High Temperature Poly-Silicon) chips by Epson, Nagano, Japan, the size of the LCD chip is 16.32 mm × 9.18 mm. When the liquid crystal lens is not functional, and the light source is completely transmissive, maximum uniformity is achieved. Since the light source is an off-axis design, only the region with optical superposition can perform compensation after the dimming operation. Thus, in terms of illuminating the imaging chip components, the effective range selected in this study was 16 mm × 8 mm below. We discuss the light source and the receiving surface of the imaging chip components. The three optical paths were divided for discussion. The effectiveness of the projection illumination system for the projector is organized into a statistical table, as shown in Table 3.
3. Dimming and Compensation Simulation Results
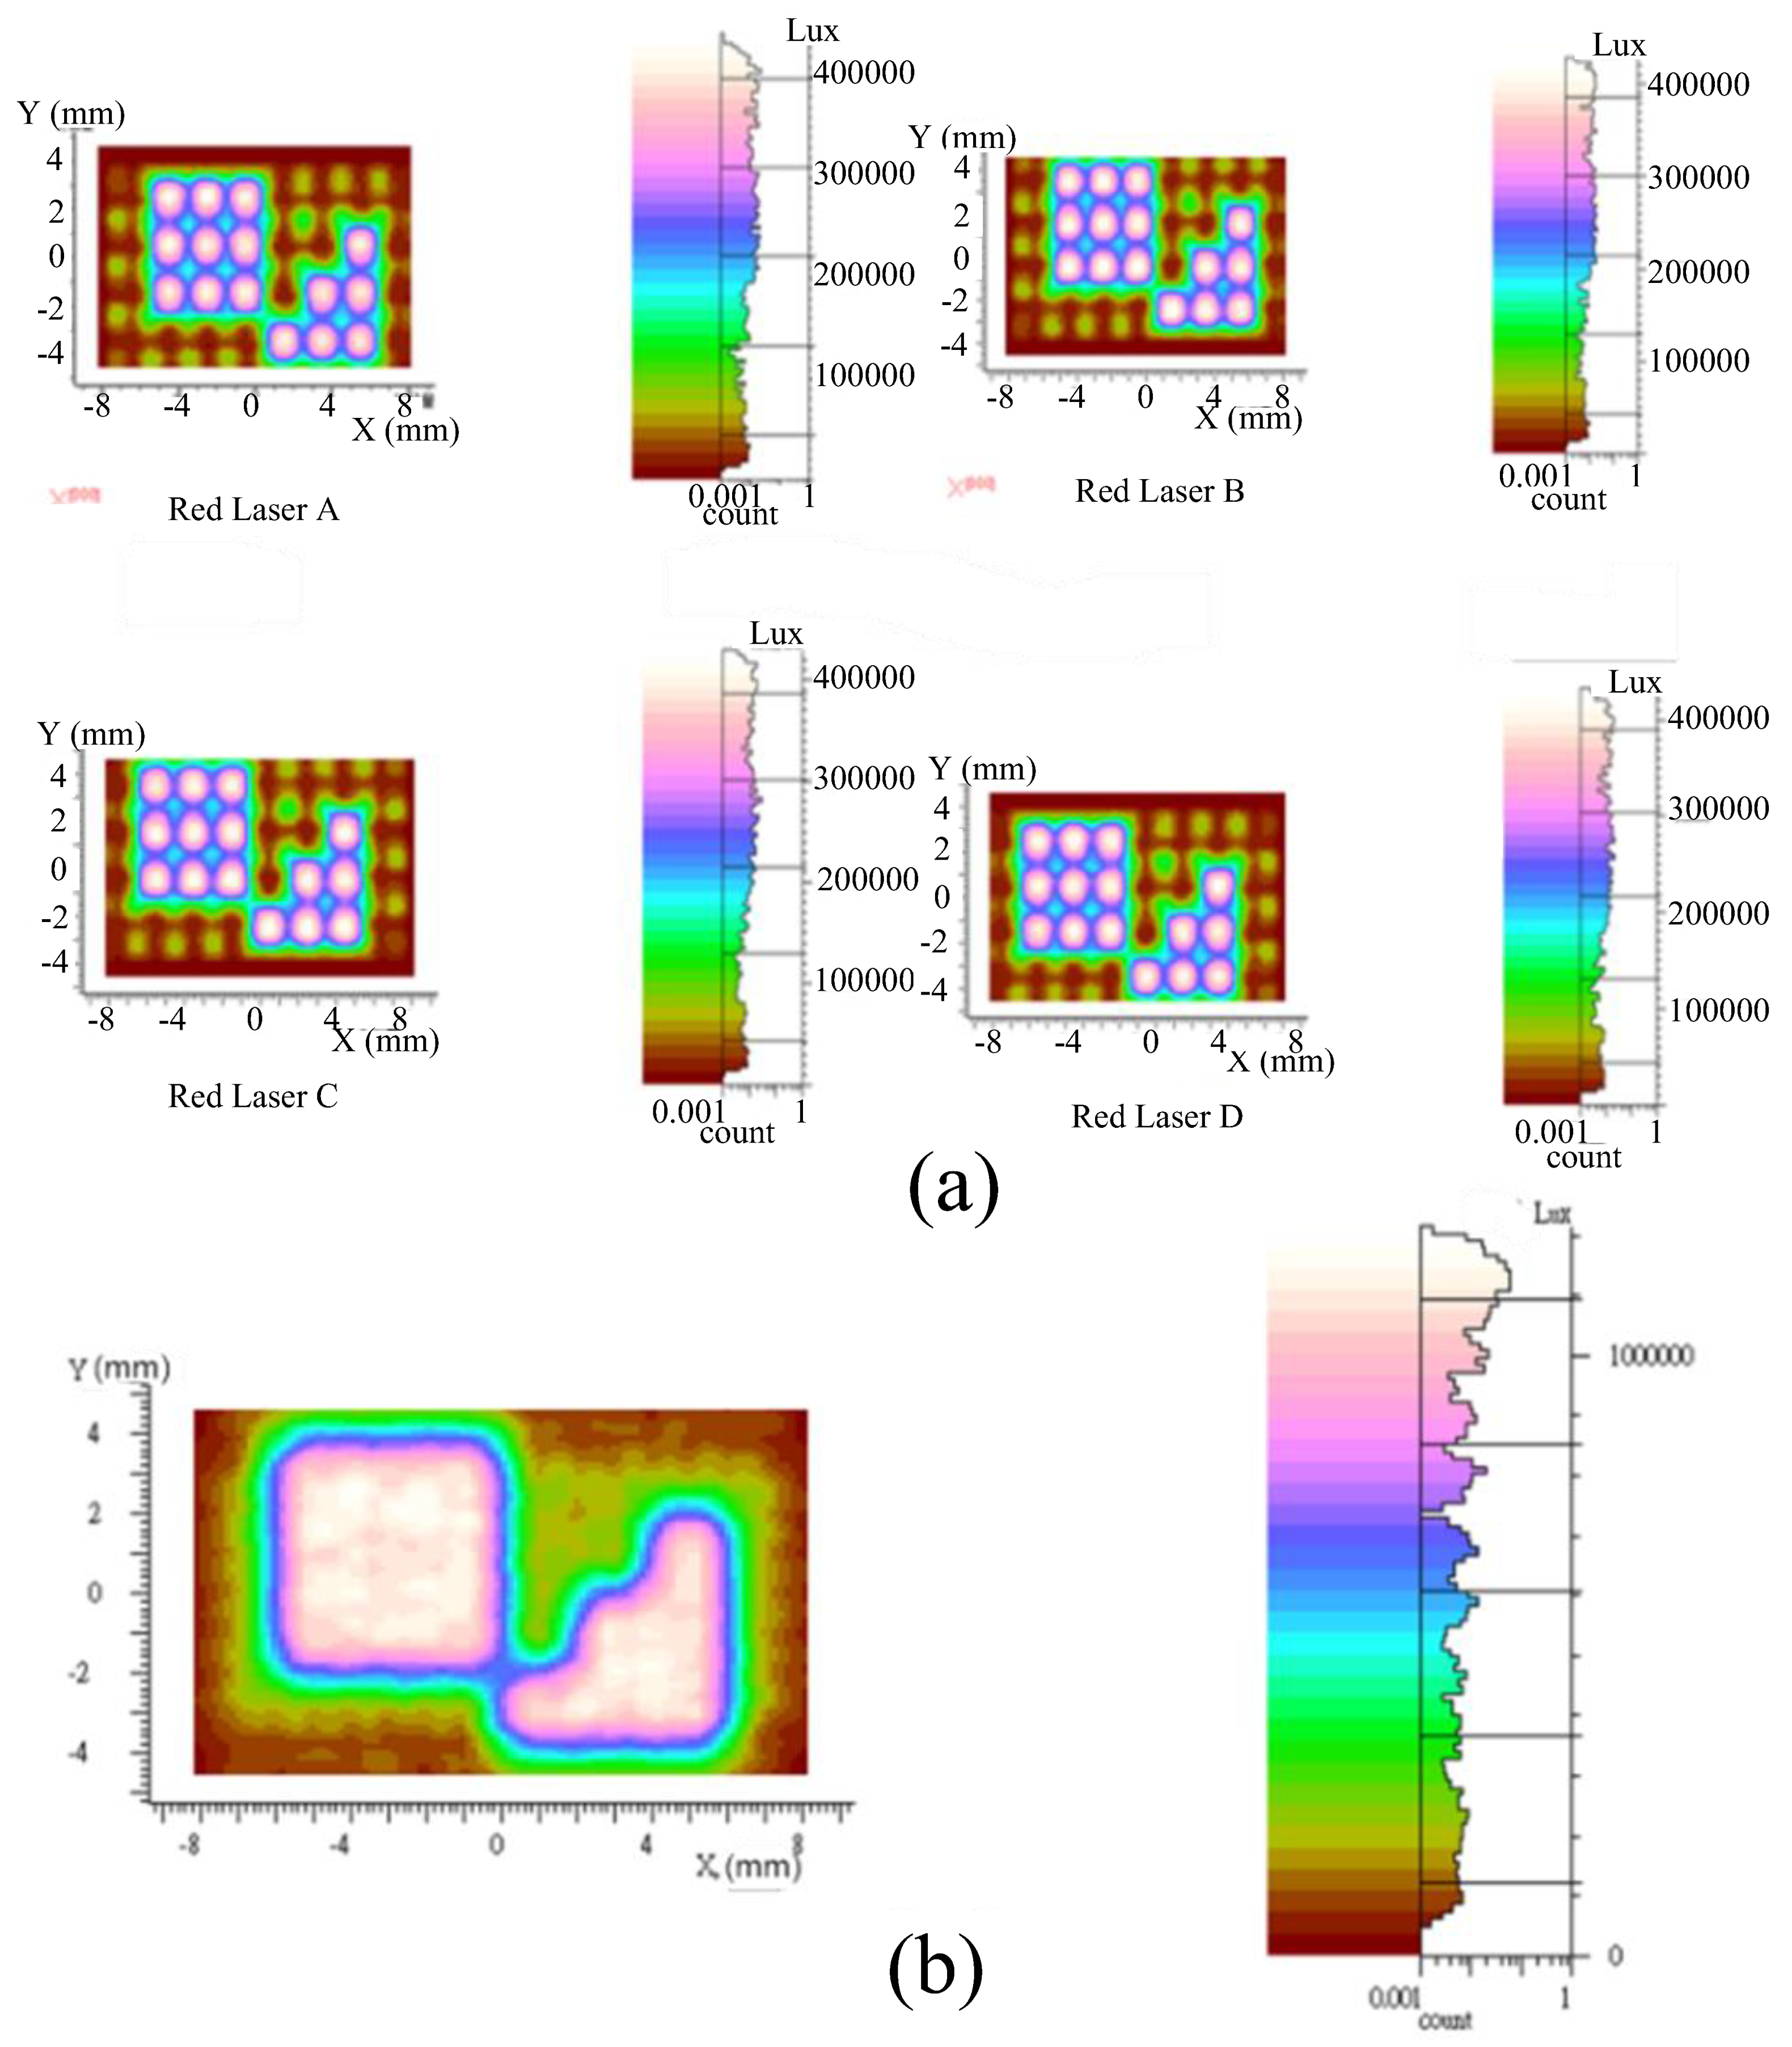
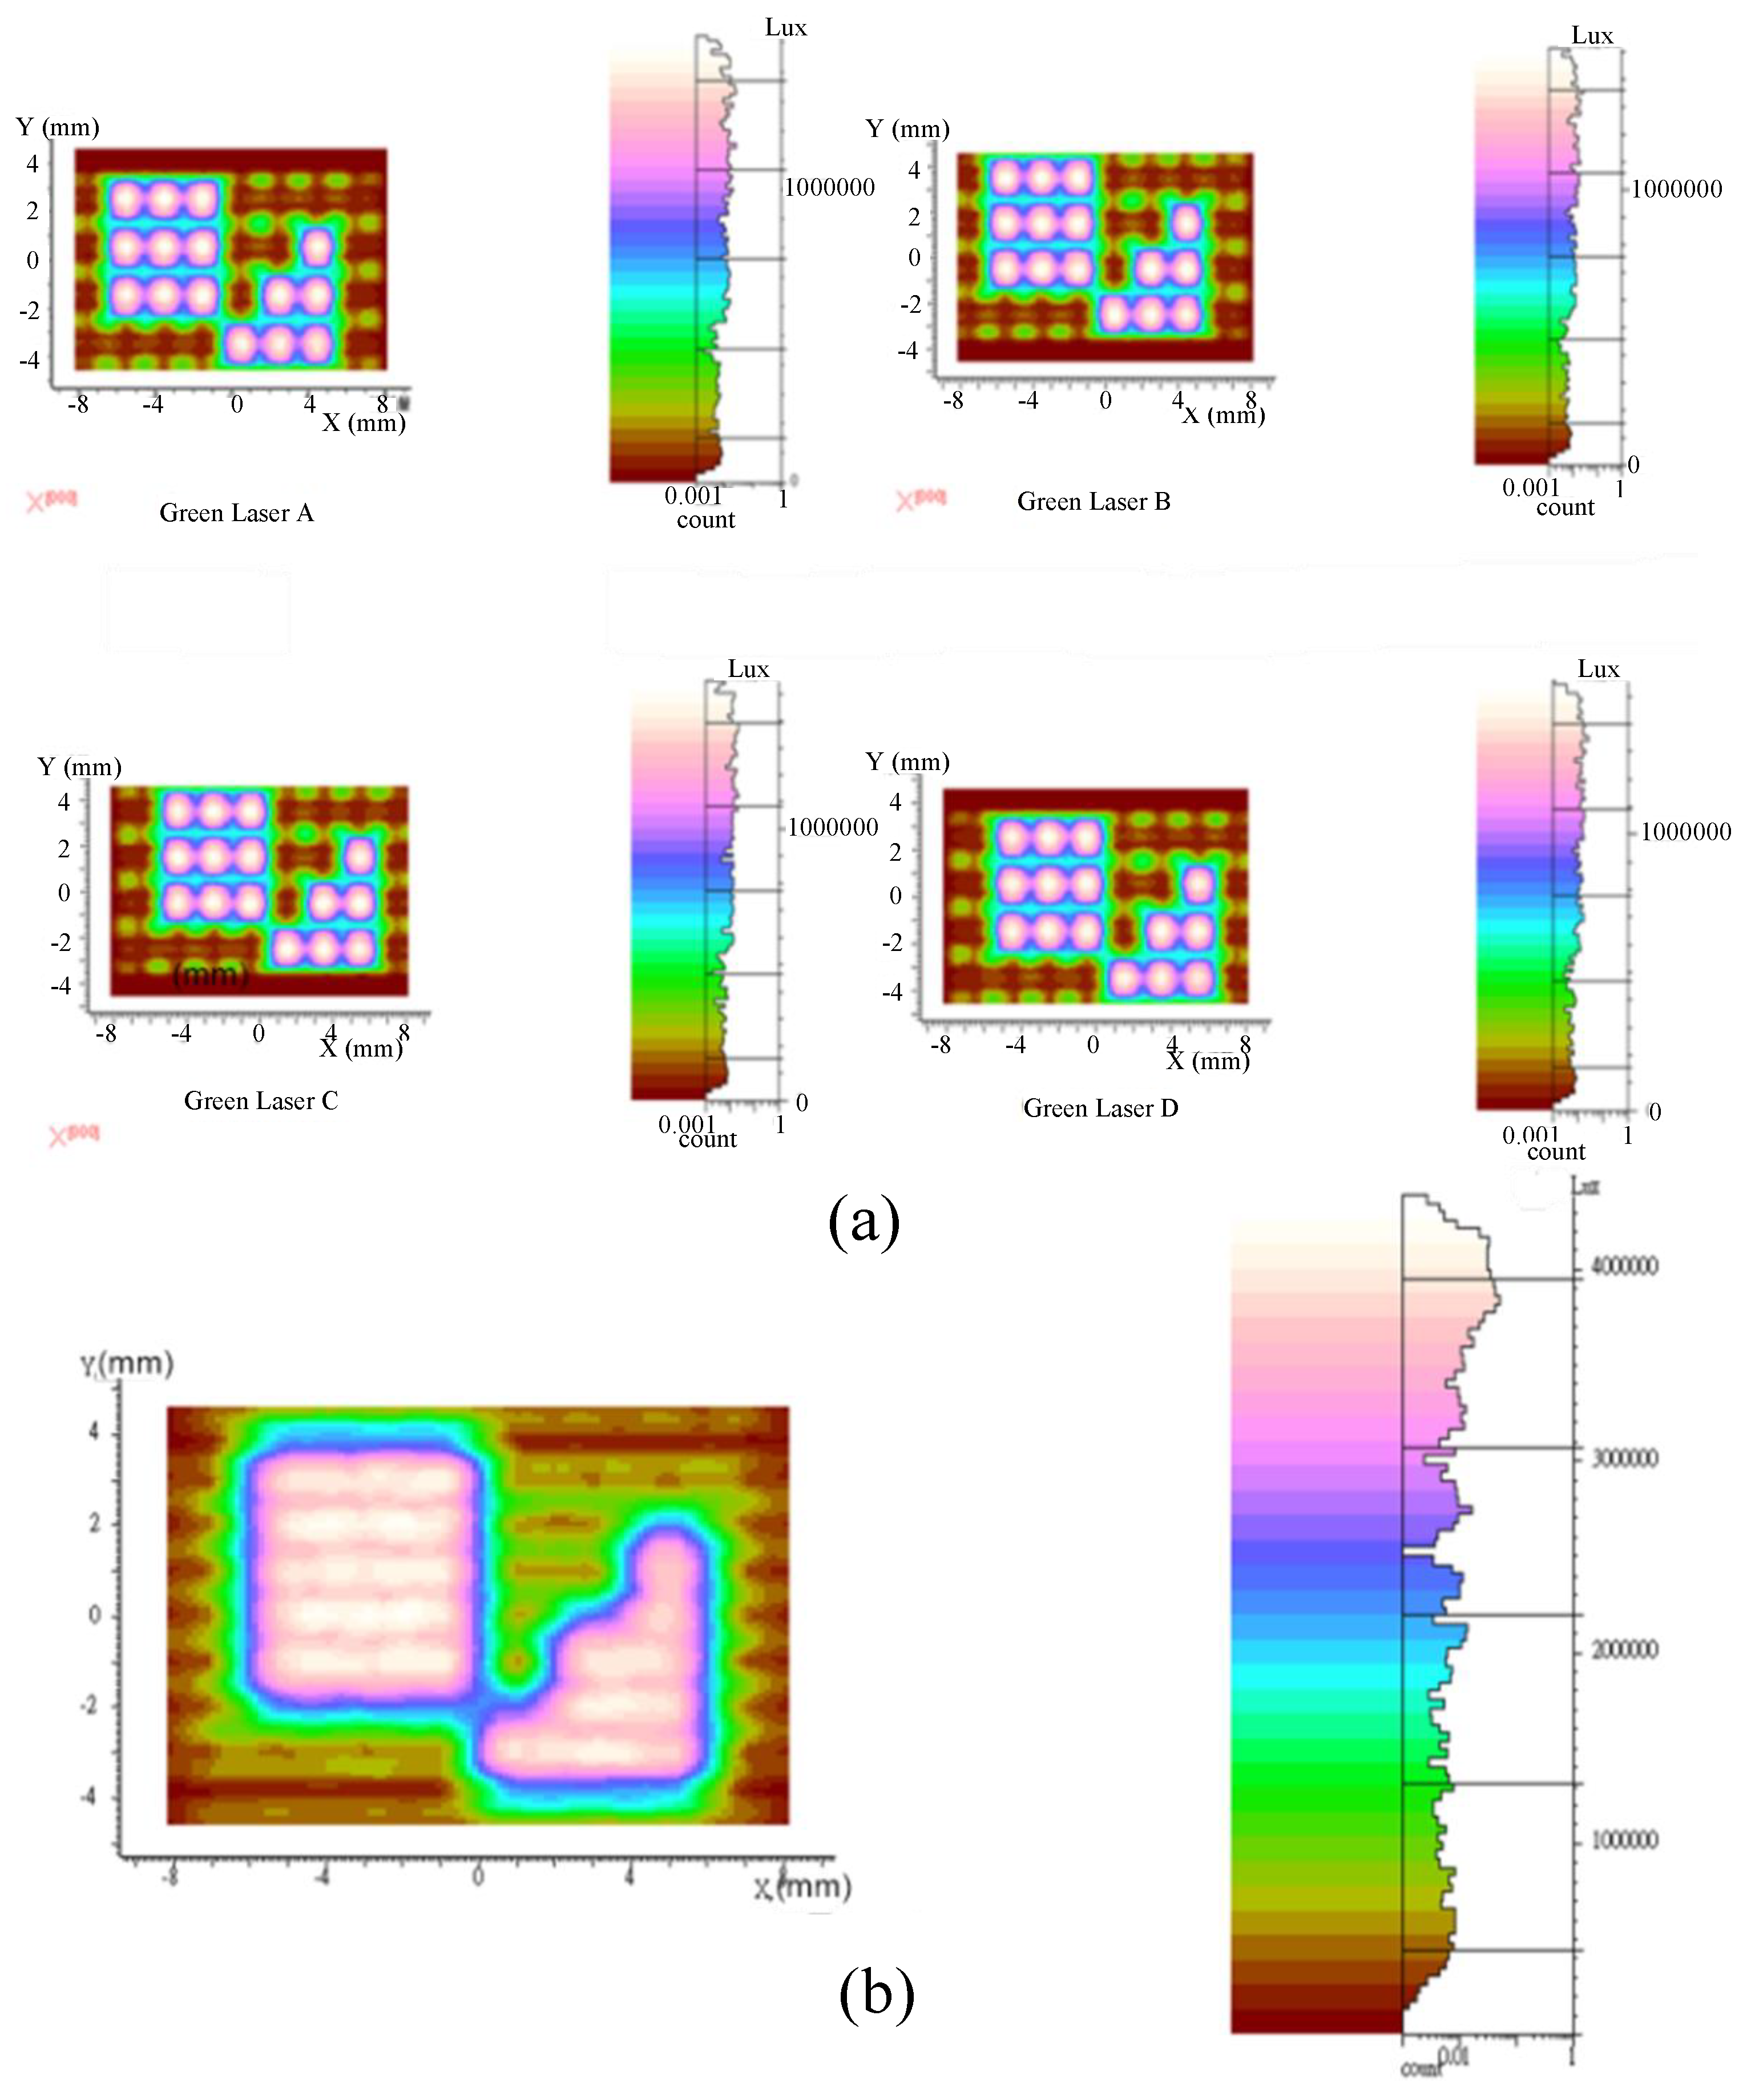
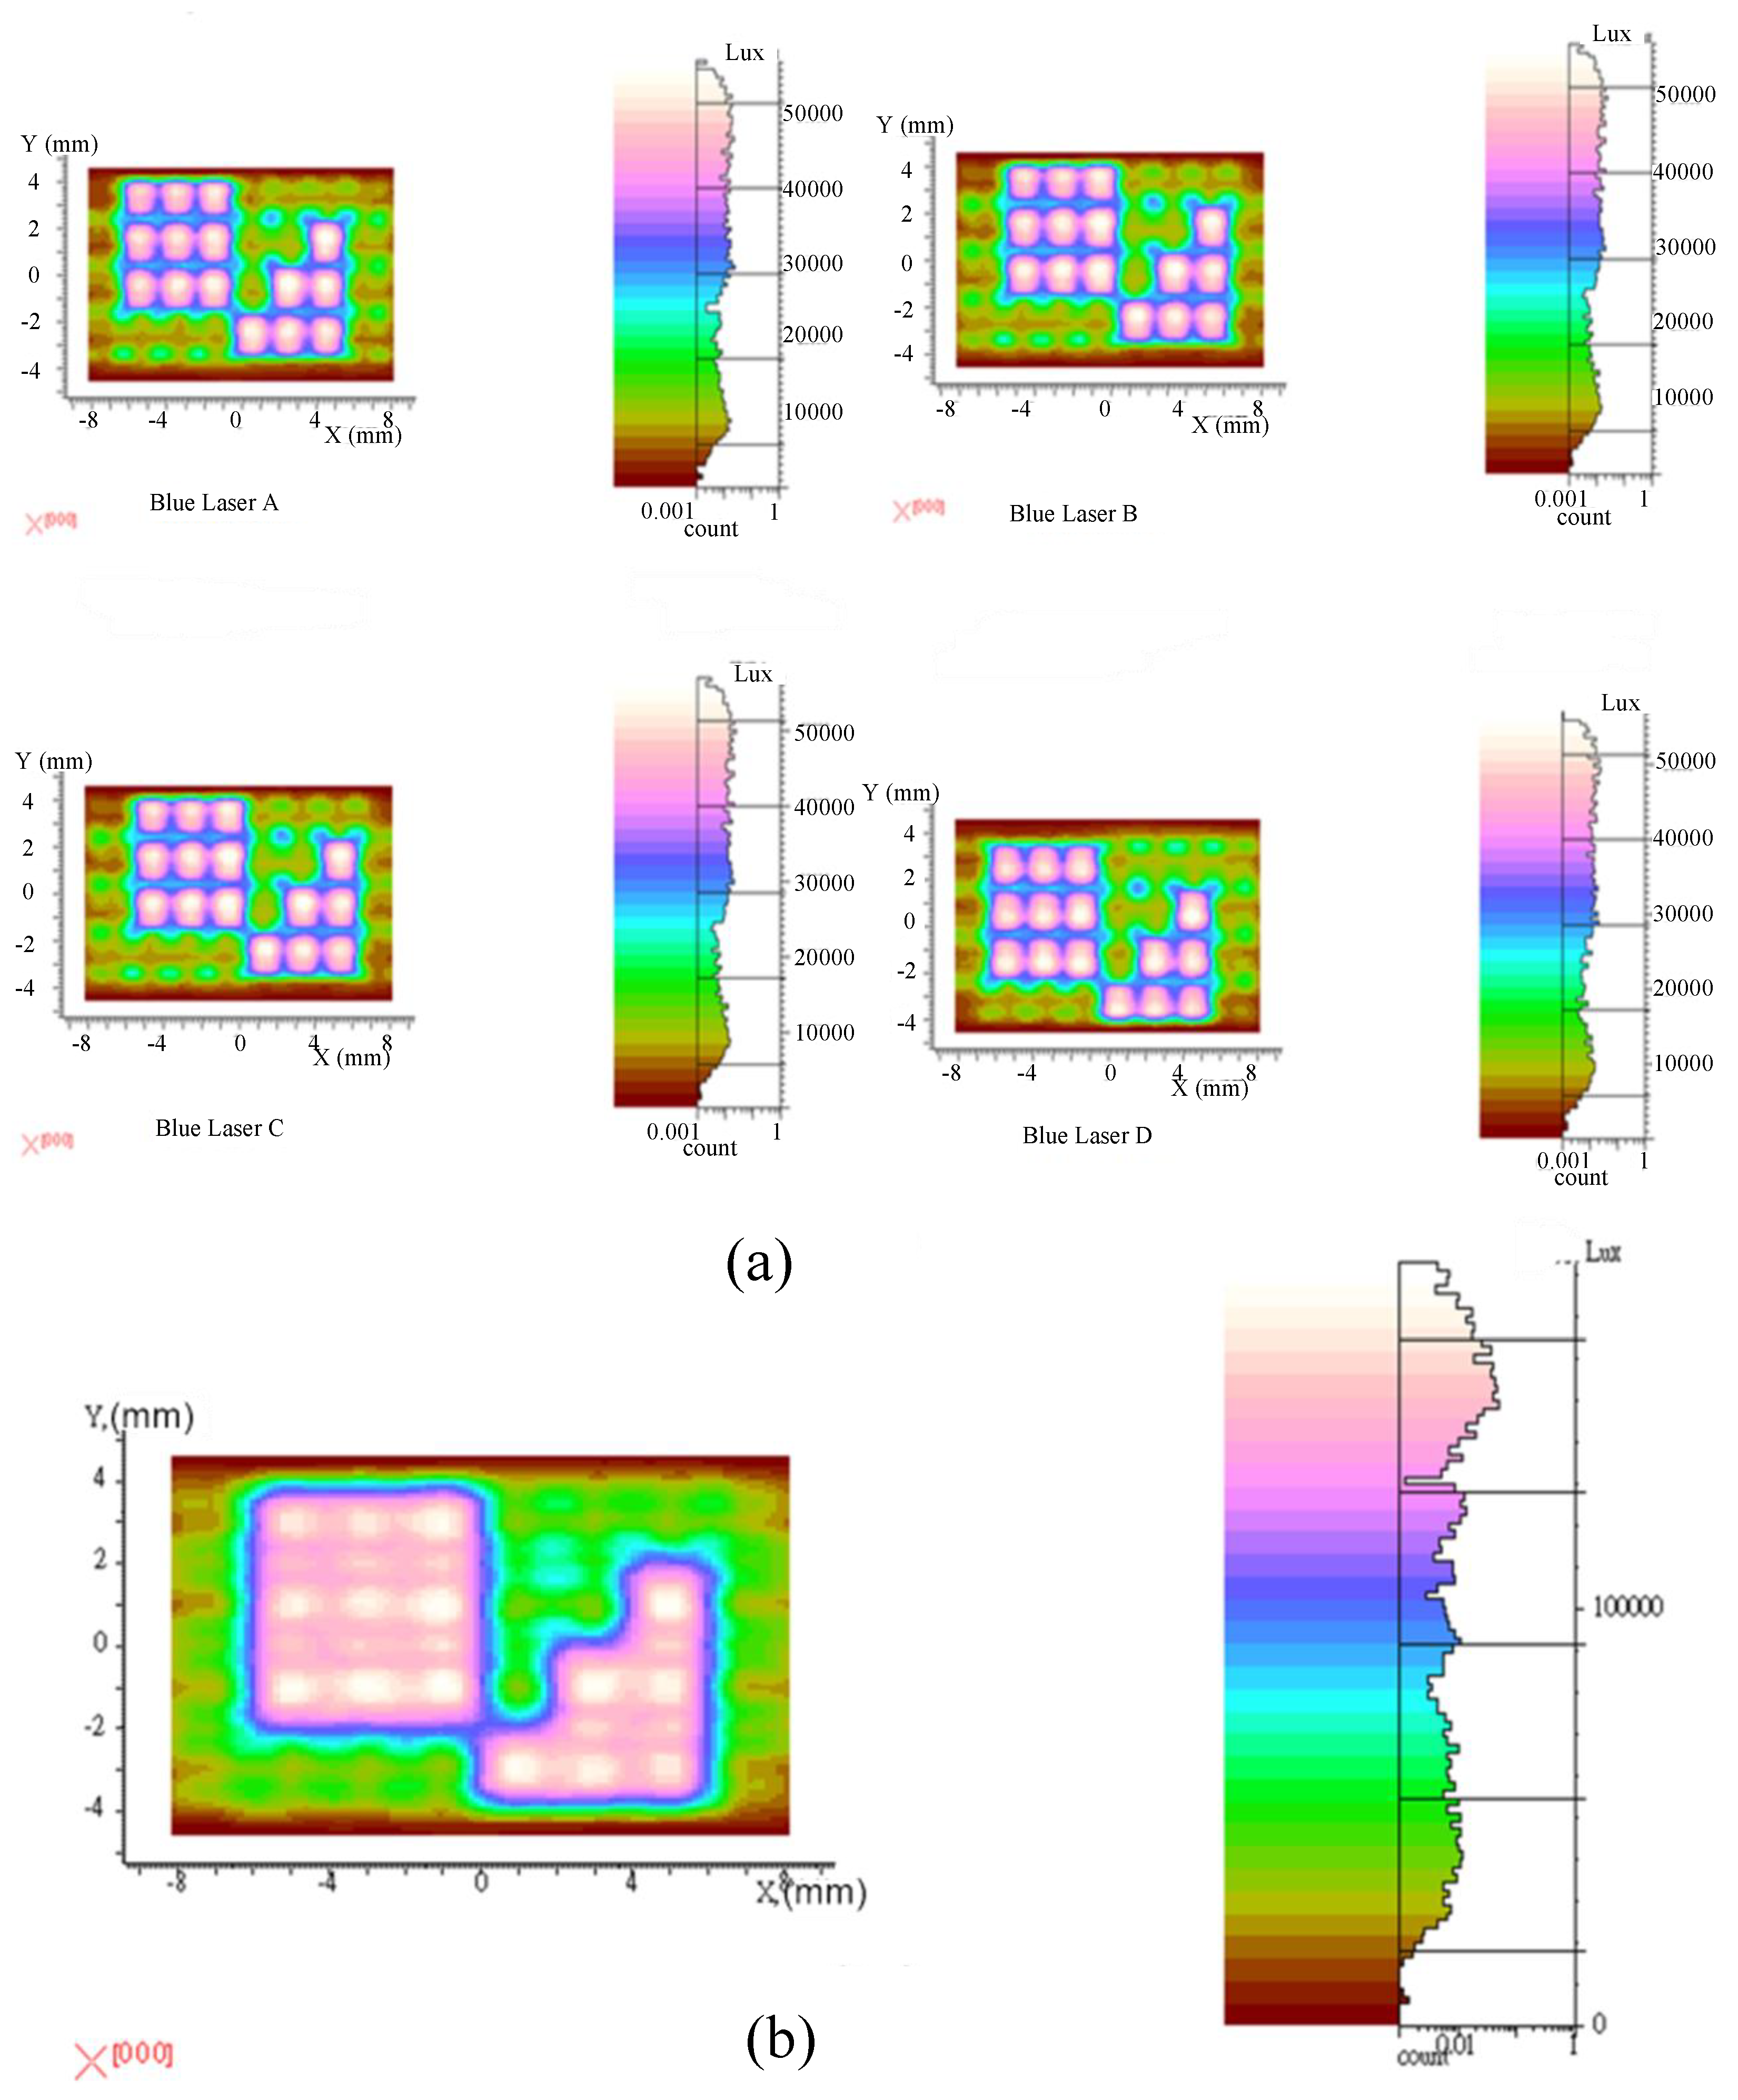
This research study examined only the projection illumination system for the projector, and therefore when exploring the light source, the exploration covered only the dimming condition when the light source was on the imaging chip components. Discussions related to contrast were limited. Since there were three colours for the light, namely R, G, and B, and were three imaging chip components, the following discussion is divided into R, G, and B lights, respectively. In the simulation, the liquid crystal lens array was used to simulate a pore size of 2.0 mm, with the focal length of the liquid crystal lens of 9 cm and 23 cm. After adjustment, two bright fields (relatively bright areas) were produced. A square bright field and a triangular bright field were used as the simulation samples. All other areas were considered to be dark fields (relatively dark areas).
The simulation results concern two modes. One set came from a single laser light source displaying local dimming as in Figure 11a, Figure 12a and Figure 13a, and the other came from using all four light sources to compensate for local dimming as in Figure 11b, Figure 12b and Figure 13b.
(1). Single light source local dimming simulation: In this, four lasers were emitting by themselves, showing a displacement map for local dimming. The four light sources were labelled Laser A, Laser B, Laser C, and Laser D to make it easier to discuss their contrast and light efficiency as described in Figure 11a, Figure 12a and Figure 13a. Those were identical designs with different wavelength of laser source.
(2). Simulation of four light sources compensating for cyclic micro scanning: Four light sources operating in a loop to show the mode of operation in which the light sources were performing micro scanning as described in Figure 11b, Figure 12b and Figure 13b. We discuss the contrast and light efficiency of these two.
Simulations of optical design are presented in Table 4, Table 5 and Table 6, which was described by contrast ratio and light efficiency. Another simulation is performed with different focal lengths of liquid optics in order to see how performance varied with focal length. From Figure 11, Figure 12 and Figure 13 and Table 4, Table 5 and Table 6, focal length of the Liquid crystal lens is 9 cm. In Figure 14, Figure 15 and Figure 16 and Table 7, Table 8 and Table 9, we have different focal length of 23 cm. All the simulations were the same, except focal length. All simulations were performed and optimized by LightTool.
In this study, we investigated the opto-mechanical static contrast ratio. A dynamic contrast ratio requires the integral operation of spatial light, and thus, in terms of the present discussion, software simulation cannot fully cover it. In terms of calculation, the complexity is very high, and therefore it is not discussed in depth in the present study. The purpose of this study was mainly, as discussed, to improve the static contrast ratio of a projector using a local dimming function. In addition, in terms of light source design, dim spots were compensated for, so that while the contrast ratio was improved, the non-uniformity in the dimming area could also be compensated for.
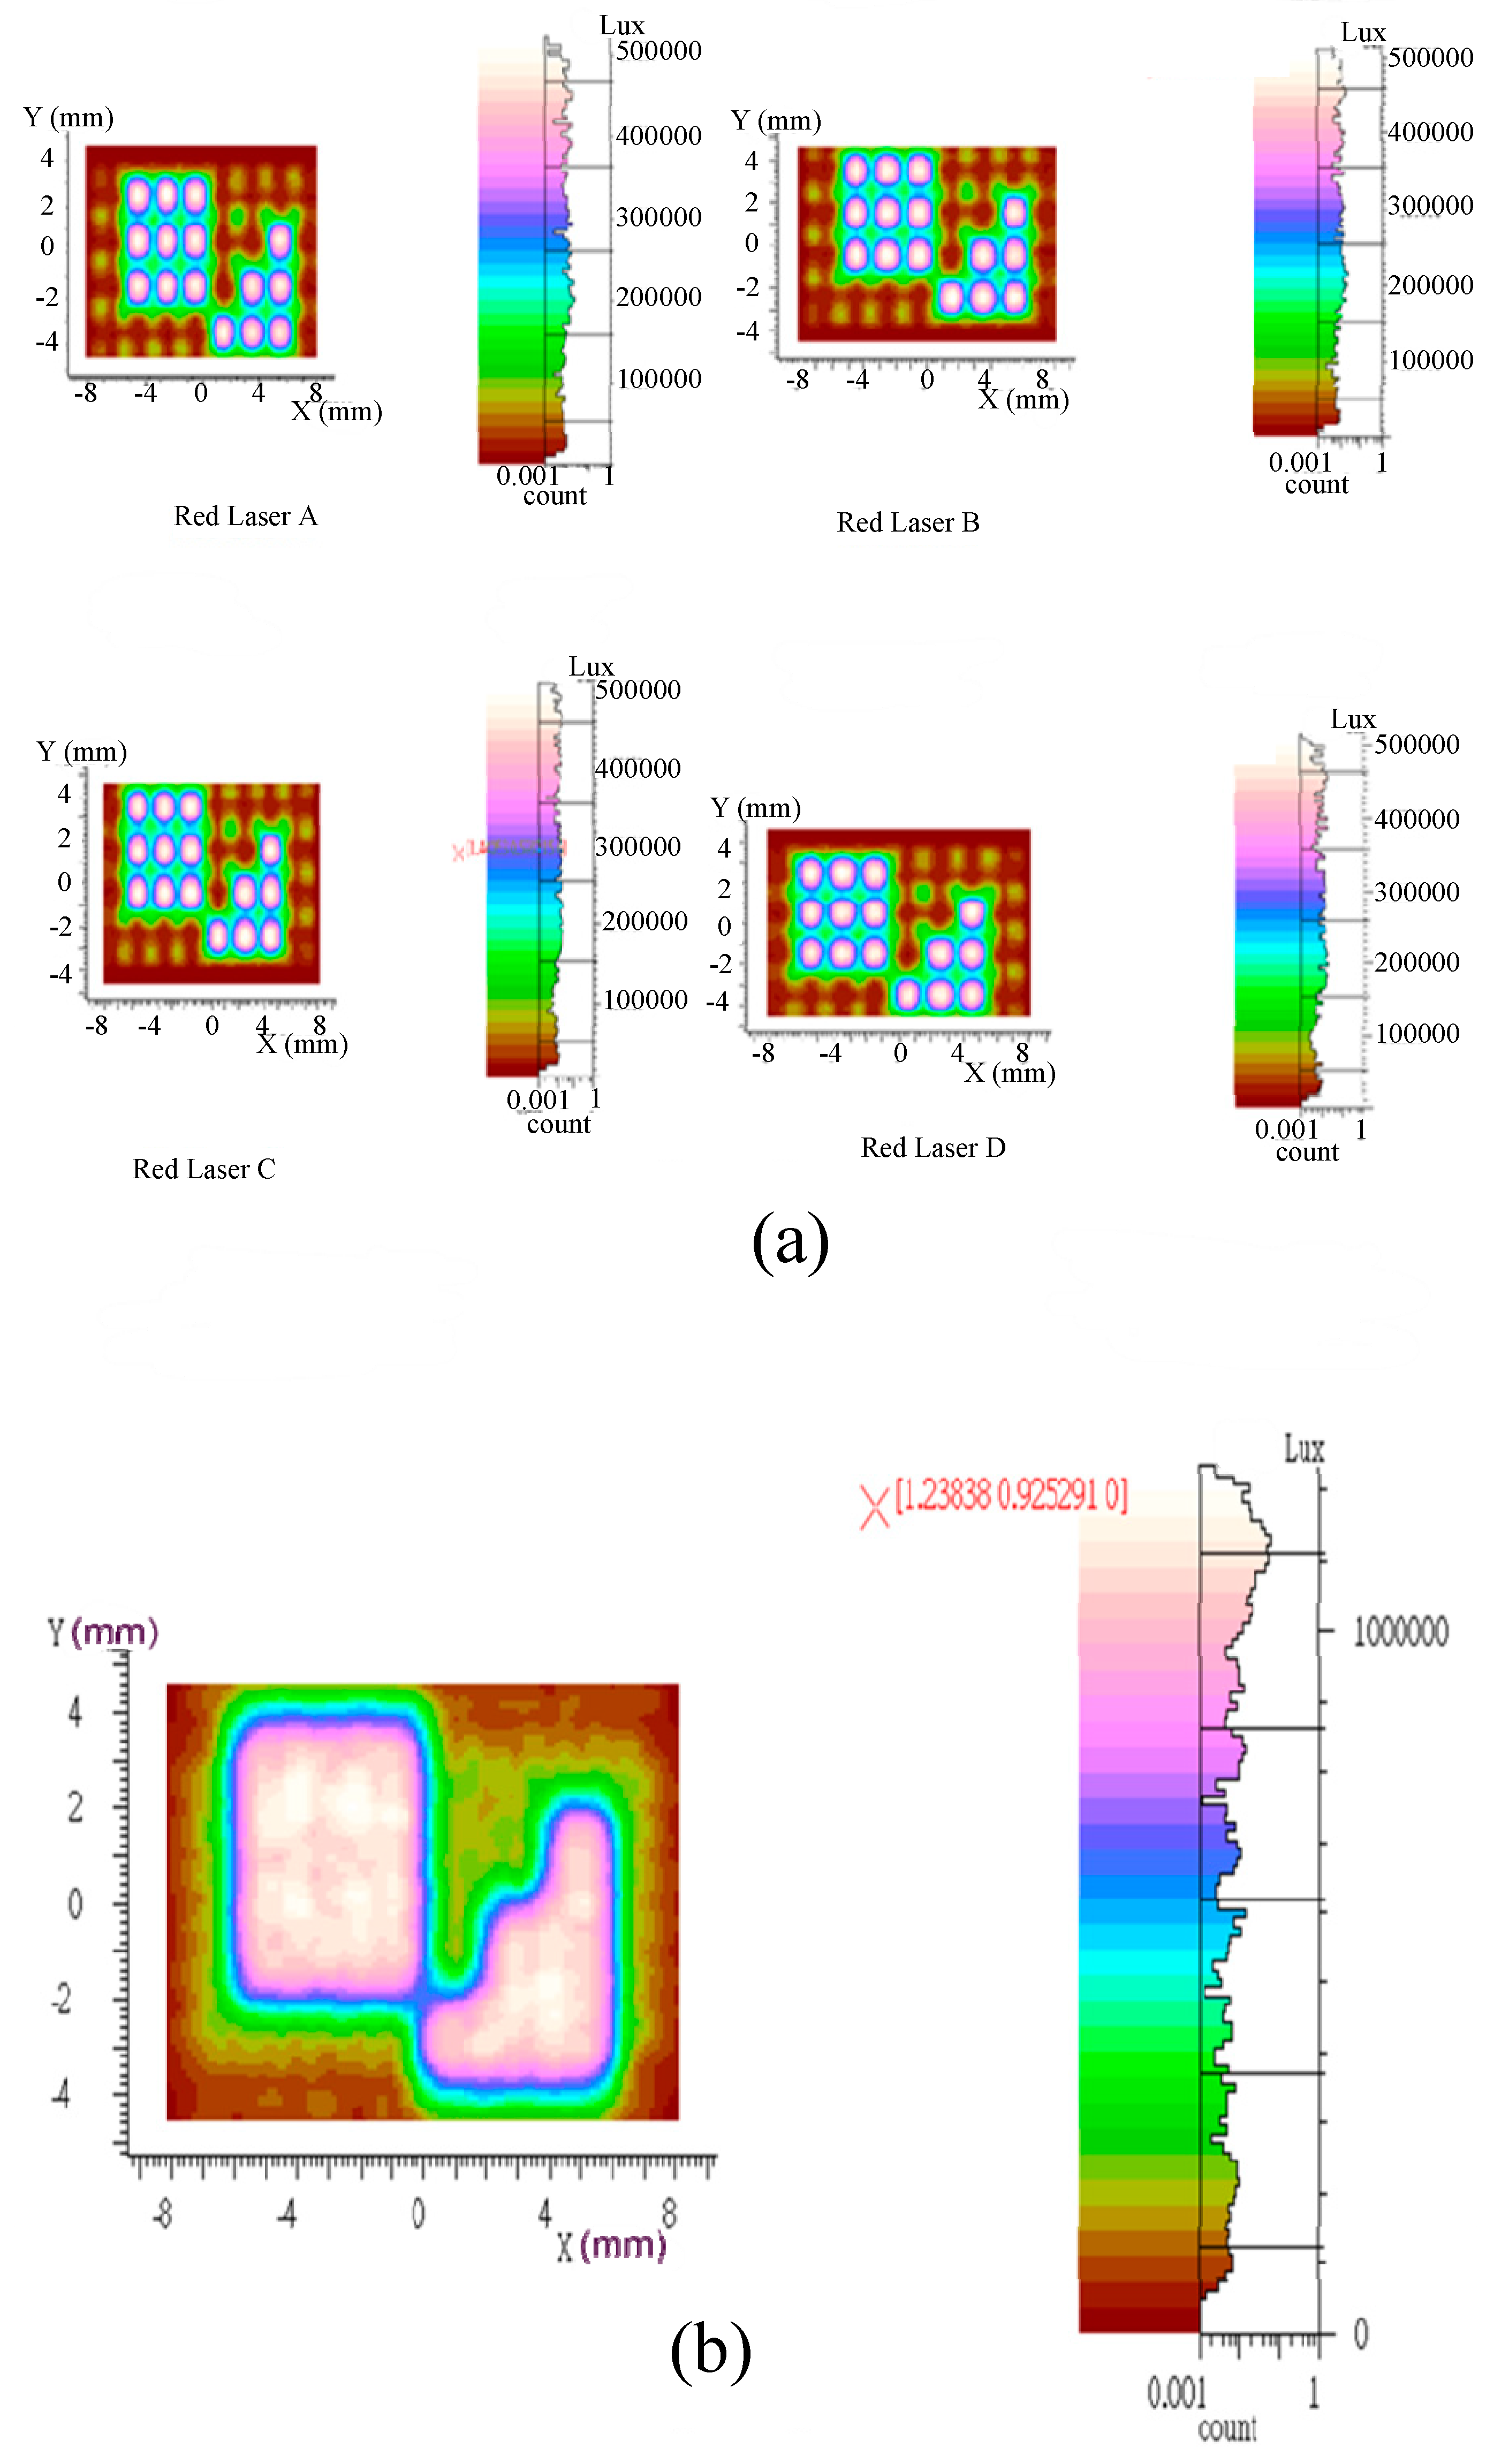
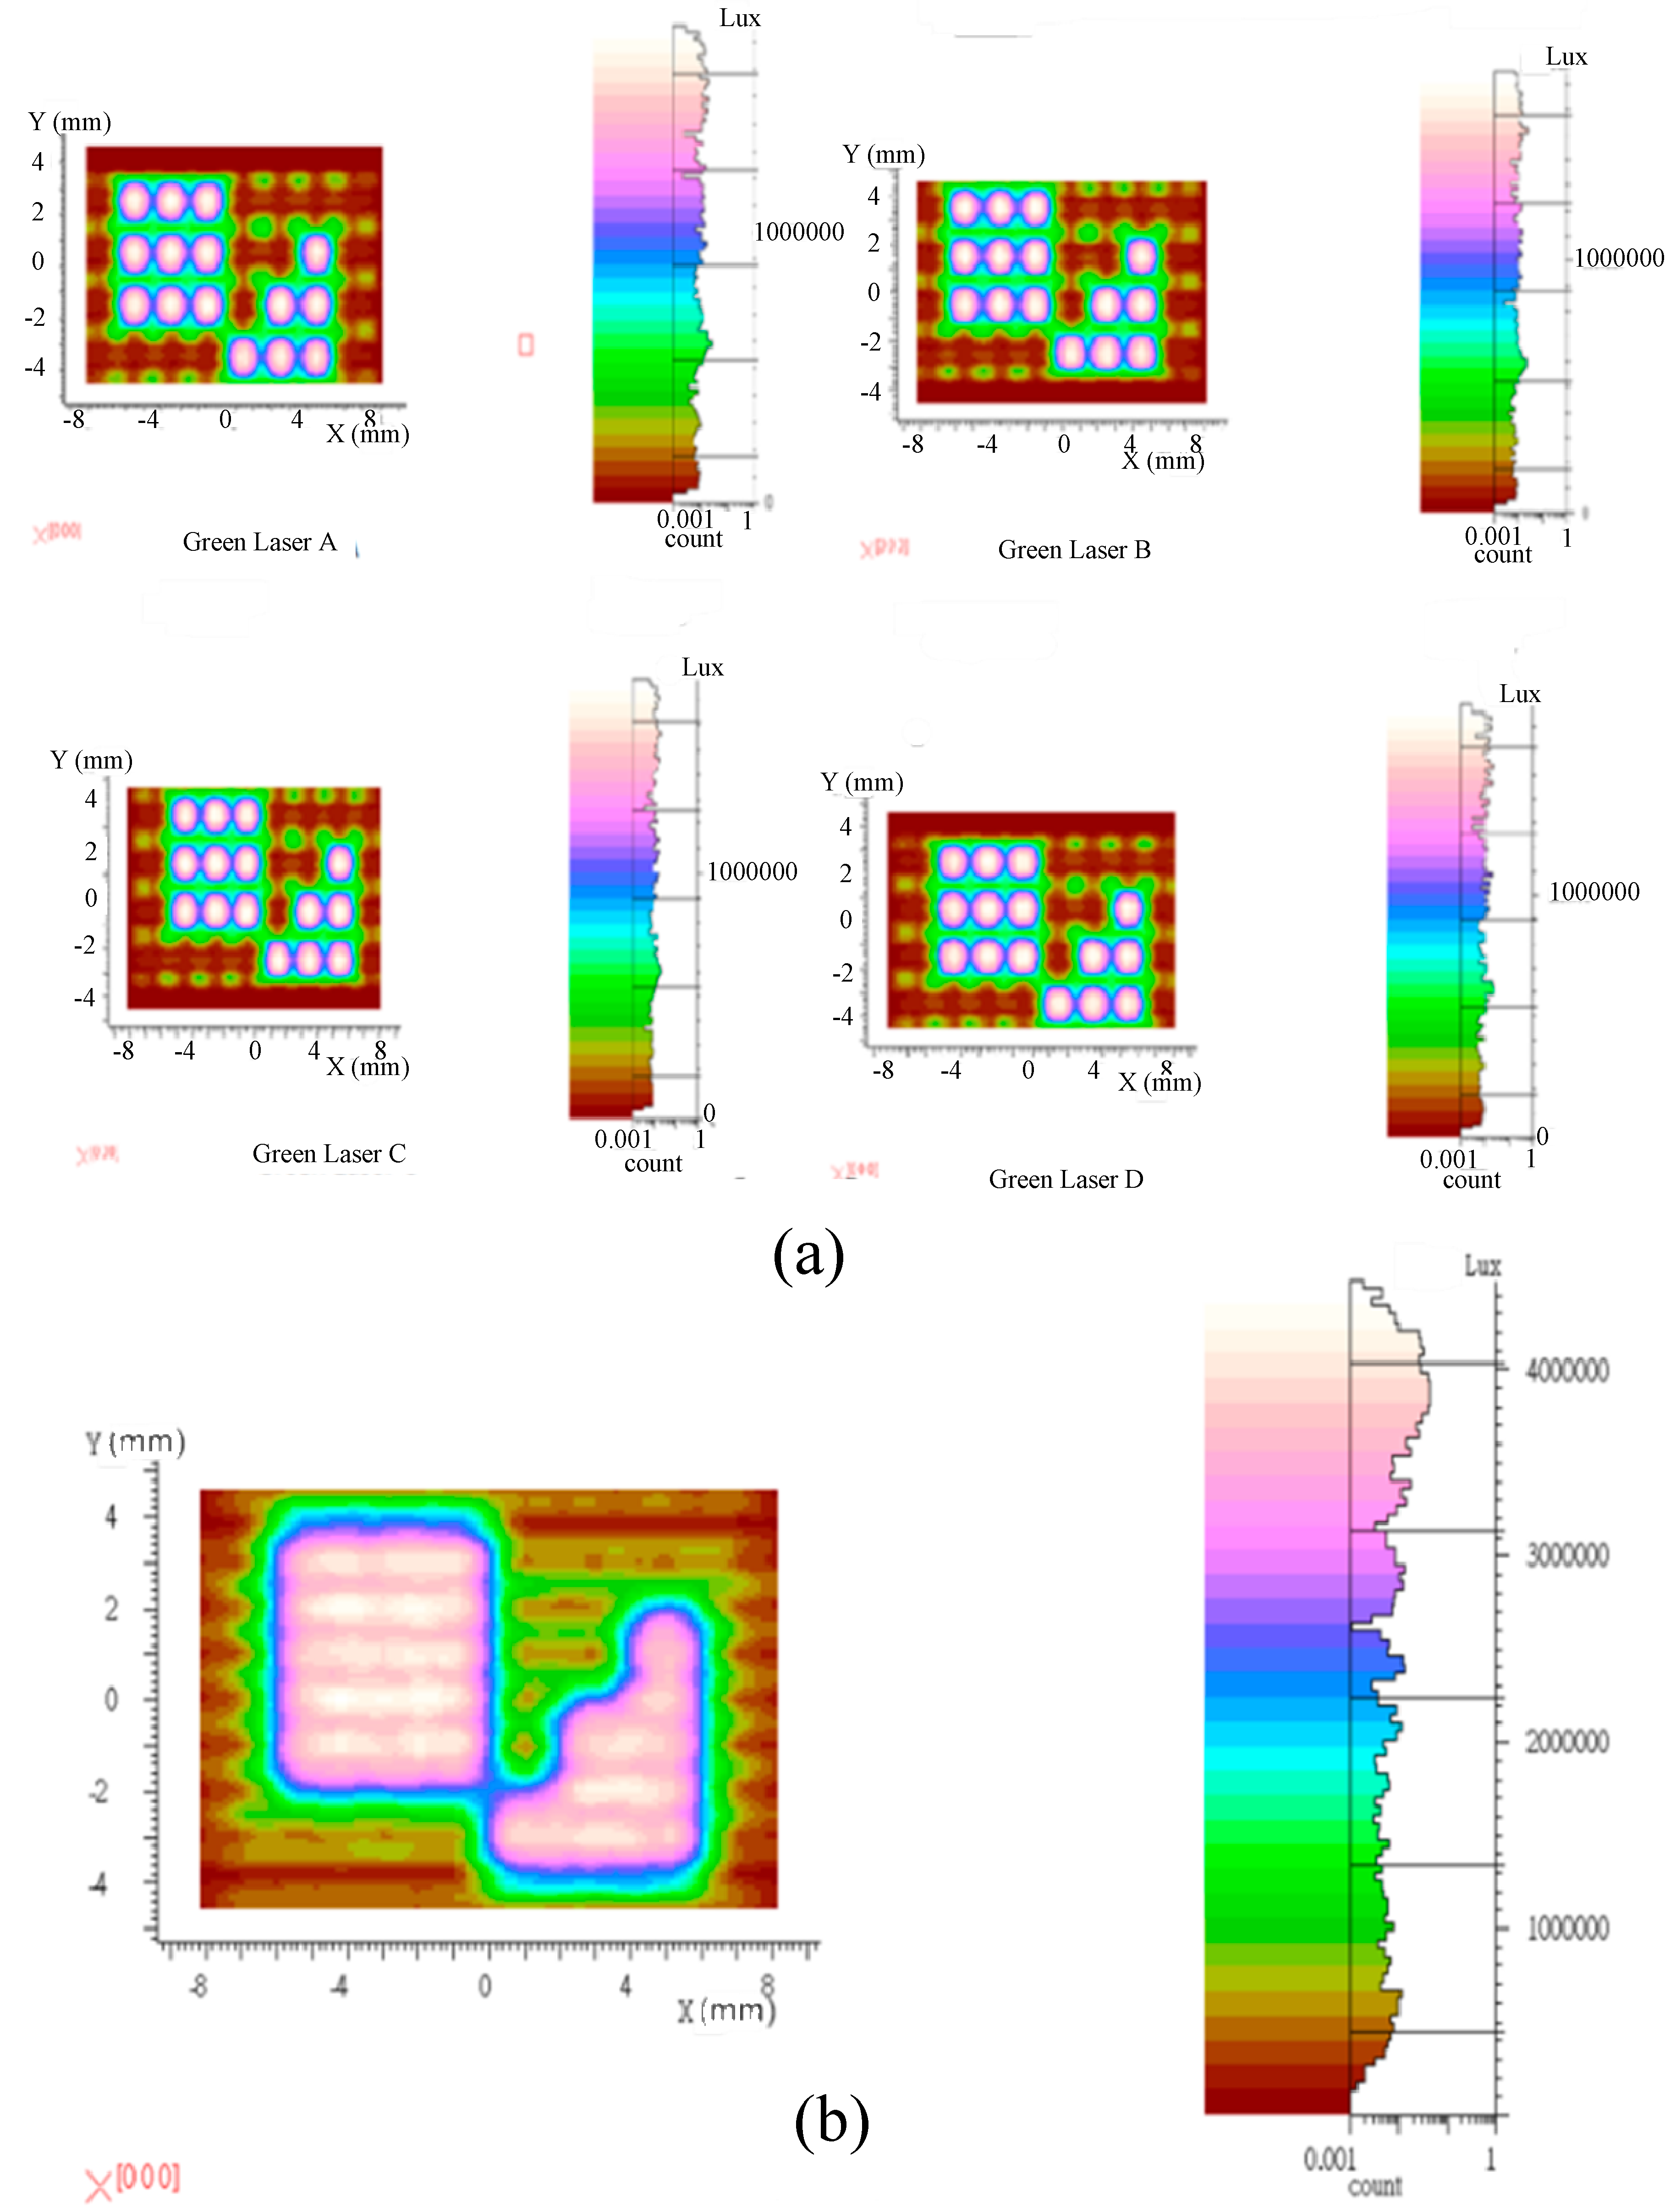
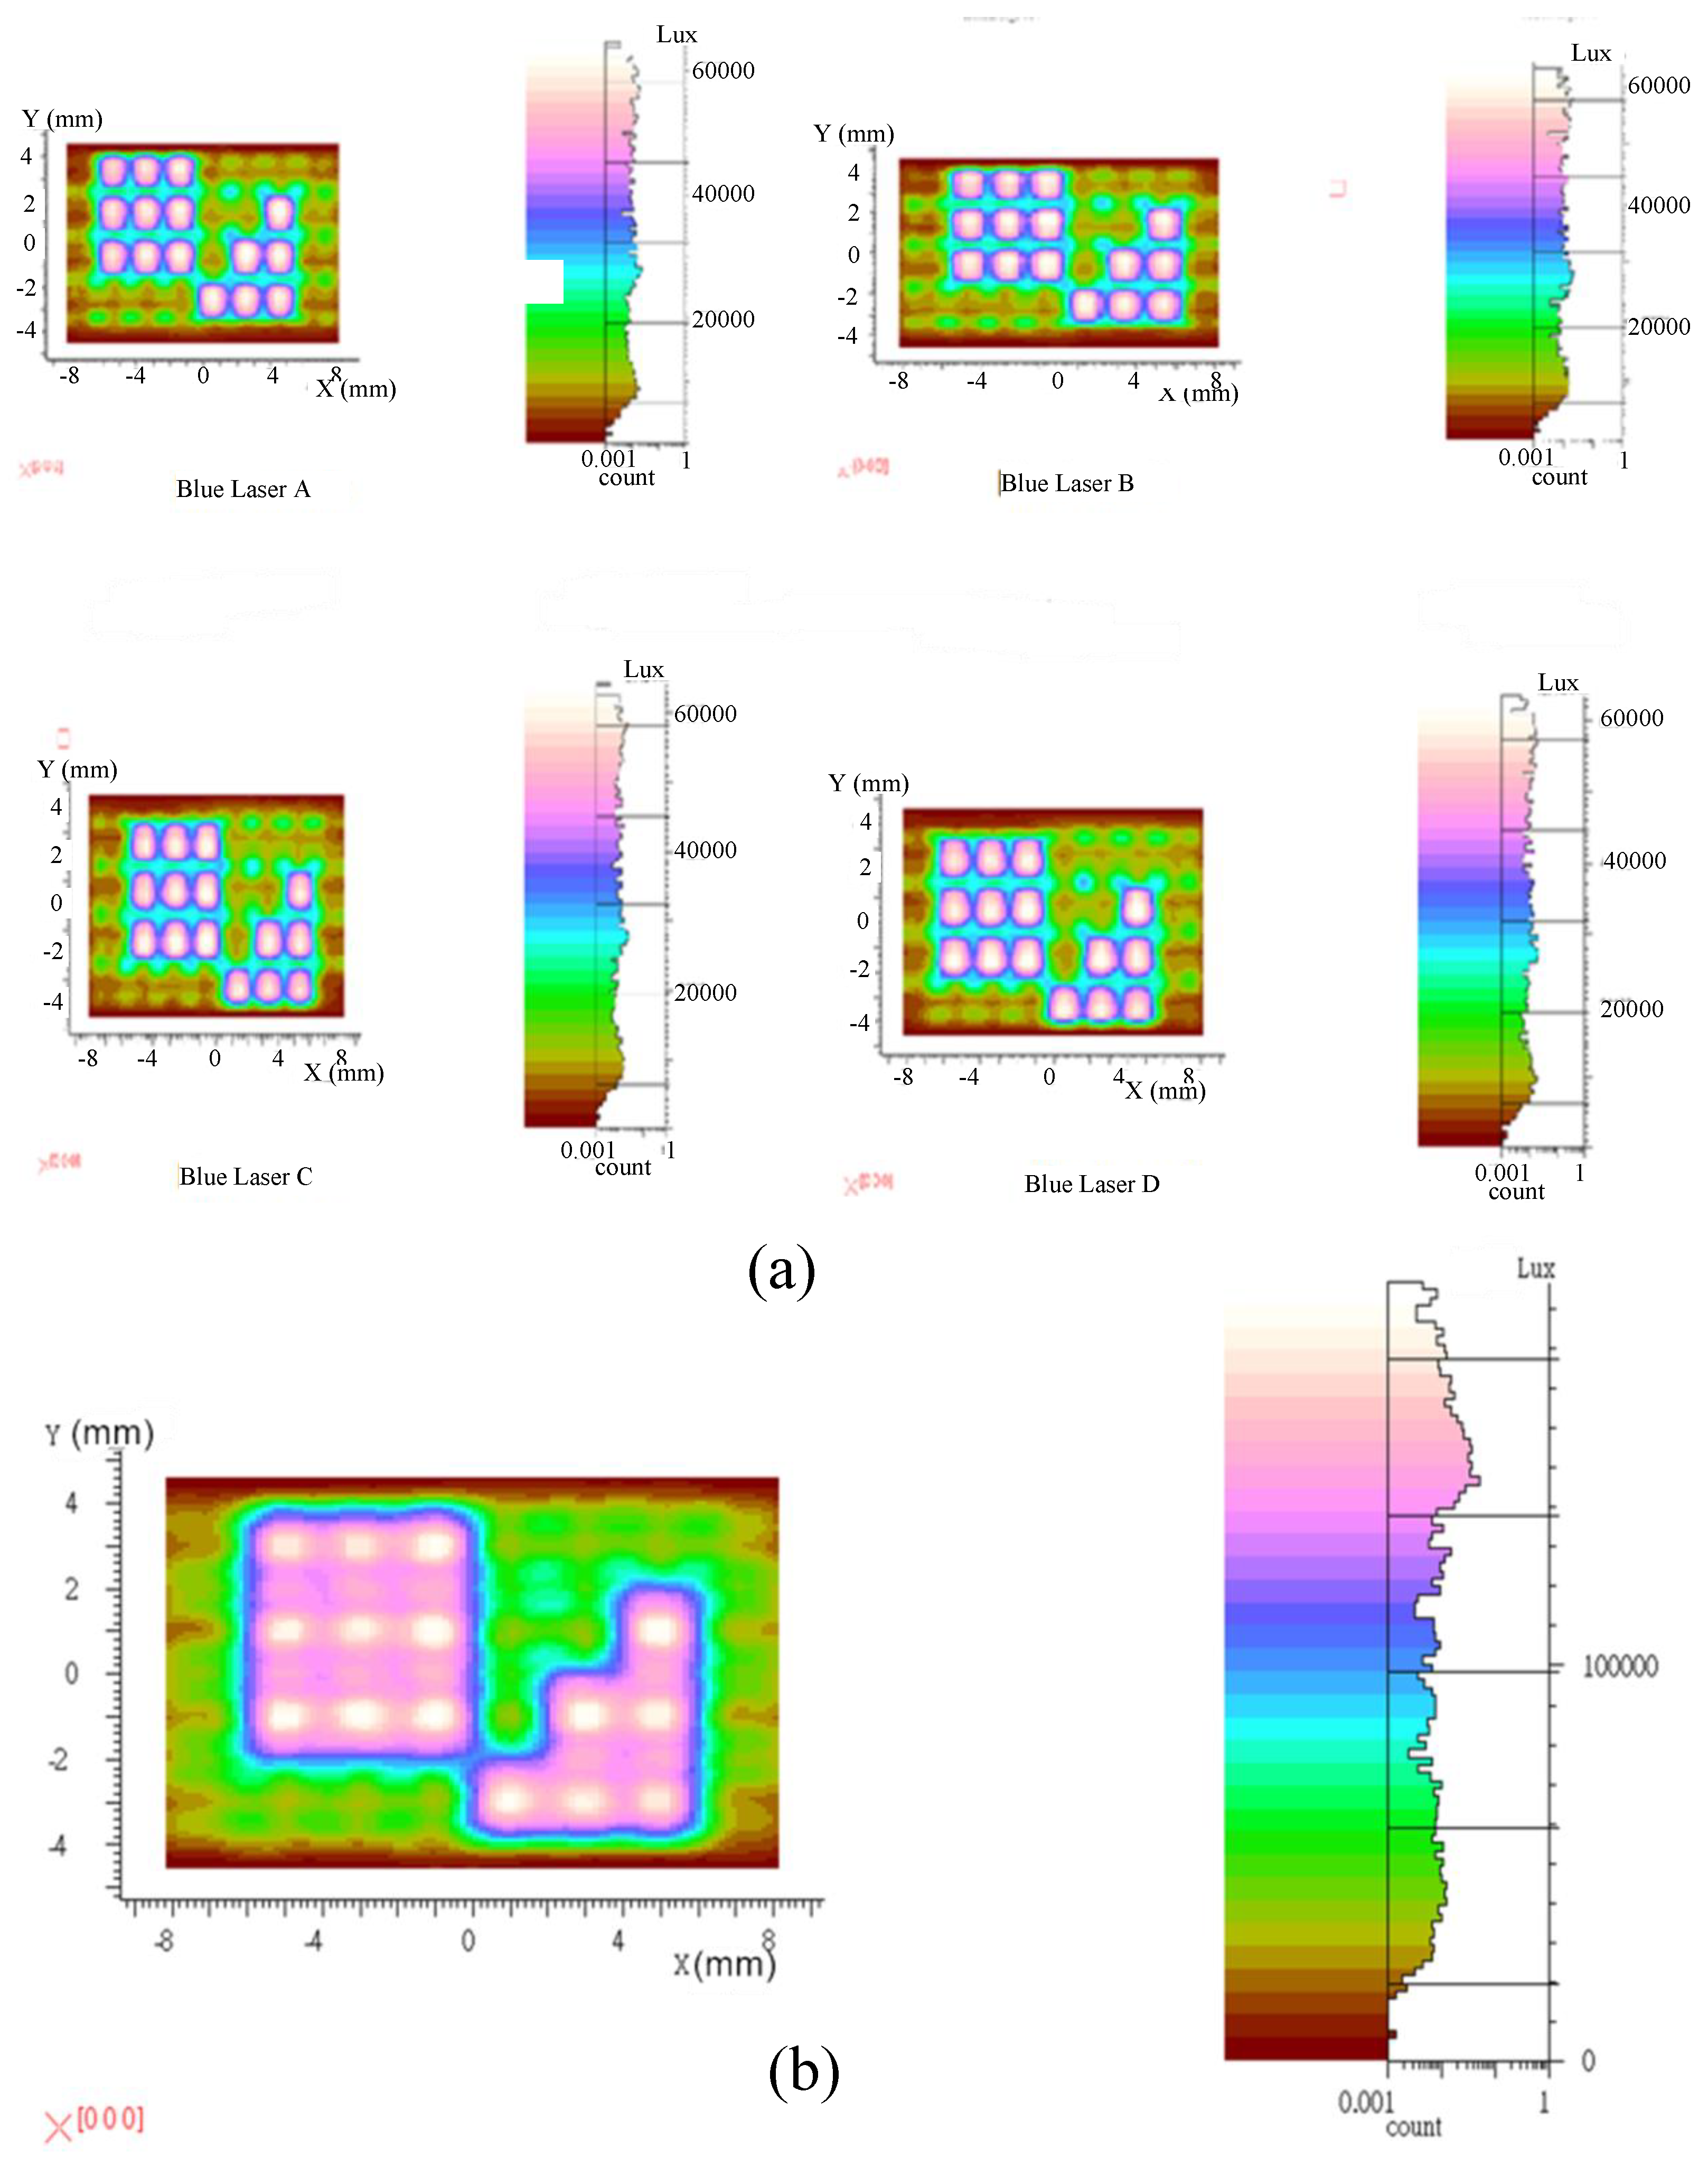
For the simulated dimming systems, a contrast dimming simulation was performed for a liquid crystal lens with a pore size of 2.0 mm. For the local dimming of a single laser light source, the highest contrast ratio for the red source reached 128:1, and the light efficiency was 20.91%. For the green source, the highest contrast ratio reached 438:1, and the light efficiency was 20.05%. For the blue source, the highest contrast ratio reached 244:1 and the light efficiency was 24.45%. After performing compensation on the liquid crystal lens dimming system using light source micro scanning, for the red source, the highest contrast ratio reached 52:1, and the light efficiency was 20.99%. For the green source, the highest contrast ratio reached 122:1, and the light efficiency was 21.81%. For the blue source, the highest contrast ratio reached 110:1 and the light efficiency was 24.46%. After light source compensation, the contrast ratio was reduced. It also distributed the dimming area more uniformly, which somewhat mitigated the defects associated with dim spots in pores.
Although Figure 11, Figure 12 and Figure 13 look similar, those experiments were done via different wavelengths as described in the papers. Generally speaking, a display is usually composited with red, green and blue light sources so that we have to check the performance of individual wavelengths. Since liquid optics as a miniature zoom optics were proposed in this experiment, two focal lengths of 9 cm and 23 cm were the optimized results to simulate the local dimming scheme, as shown in Figure 11, Figure 12 and Figure 13 for the focal length 9 cm, and Figure 14, Figure 15 and Figure 16 for the focal length 23 cm.
4. Conclusions and Recommendations
In this paper, a projection illumination system for mini projectors was designed. For the opto- mechanical system, the three optical paths, namely R, G and B were designed as per a telecentric optical design. The volume was 165 mm × 167 mm × 31 mm with an F-number of 1.64. The design purpose was to improve the contrast of the projector. In front of the imaging chip components, a liquid crystal lens array was inserted as the dimming system for the projection illumination system. In this way, the light source could help the imaging chip components to provide more contrast. In terms of the light sources, they were all designed to be micro-scanning light sources with cyclic lighting and extinguishing cycles, in order to compensate for the phenomenon of dim spots in the pores between each unit of the liquid crystal lens. For the projection illumination system for the entire opto-mechanical system, the maximum uniformity for red LCD chip components was 82.25%, the maximum light efficiency was 33.11, and the luminous flux was 119.64 lm. The maximum uniformity from green LCD chip components was 87.15%, the maximum light efficiency was 35.01, and the luminous flux was 423.32 lm. The maximum uniformity from blue LCD chip components was 88.43%, the maximum light efficiency was 39.03, and the luminous flux was 14.59 lm. The mixed light of R, G and B was able to reach a colour temperature of approximately 7000 K.
The liquid crystal lens has the advantages of being light, thin, and compact. Its focal zoom distance ranges from mm to cm and has wide applications. For the simulation in this paper, the local dimming performed by a liquid crystal lens showed good dimming results for the bright and dark areas. For a single laser light source, the maximum contrast values for local dimming were approximately 128:1, 438:1, and 244:1 for optical paths R, G, and B respectively. The light efficiency was approximately 20.91 %, 20.05 % and 24.45 % for the optical paths R, G, and B respectively.
After performing compensation using light source micro scanning, the defect of dim spots in pores was alleviated, and the dimming area was more uniformly distributed, while the contrast became smaller. The maximum contrast ratios were approximately 52:1, 122:1, and 110:1 for optical paths R, G and B respectively. For the projector when the liquid crystal lenses were not in effect, the maximum uniformity was 82.25%, 87.15% and 88.43% for the optical paths R, G and B respectively.
For the design of the light source micro-scanning, the light source was configured as off-axis. The incident light enters the imaging chip component on a slanted angle. The effective range for light source compensation was the optical superposition area formed by the four light sources on the imaging chip components. As a result, the uniformity on the edges of the imaging chip components was poor. In terms of the configuration for light source location, a more refined adjustment on individual liquid crystal lenses could possibly have slightly improved the issue. The selection of distances between light sources can determine the size of the optical superposition area and the precision of the compensating liquid crystal lenses. Such a selection can be achieved by using Taguchi optimization to find the optimal solution. In terms of the selection for a light source array, an improved integration with surface-emitting lasers may be more suitable as a light source array for a micro-scanning system.
Author Contributions
Conceptualization, Y.-C.F. and C.M.T.; methodology, Y.-C.F.; software, Y.-C.F., D.-L.C.; validation, Y.-C.F.; formal analysis, C.M.T., D.-L.C.; investigation, Y.-C.F.; resources, Y.-C.F., D.-L.C.; data curation, Y.-C.F.; writing—original draft preparation, Y.-C.F.; writing—review and editing, C.M.T.; visualization, C.M.T.; supervision, Y.-C.F.; project administration, Y.-C.F.; funding acquisition, Y.-C.F.
Funding
This work was supported by the Ministry of Science and Technology of China, Taiwan, for financially supporting this research under contract numbers MOST 103-2632-E-366-001 and MOST 107-2221-E-005-050.
Conflicts of Interest
The author declares no conflict of interest.
References
- Fang, Y.-C.; Sun, J.-H.; Lai, W.-C.; Wang, H.-F. Projector Using LED as Light Source. US Patent 8277049, 2 October 2012. [Google Scholar]
- Hung, C.C.; Sun, J.-H.; Tzeng, Y.F.; MacDonald, J.; Lai, W.C.; Li, S.-X.; Fang, Y.-C.; Sun, H.-C.; Chen, Y.-L. A Study of Extended Optimization of U type Rod for LED Projectors. Optik 2011, 122, 385–390. [Google Scholar] [CrossRef]
- Sun, J.-H.; Hsueh, B.-R. Optical Design and Multi-Objective Optimization for U-type 2X Zoom Projection Optics. Opt. Lasers Eng. 2010, 48, 411–420. [Google Scholar] [CrossRef]
- Chen, C.-C.; Tsai, C.-M.; Fang, Y.C. Optical Design of LCOS Optical Engine Optimization with Genetic Algorism. IEEE/OSA J. Disp. Technol. 2009, 5, 293–305. [Google Scholar] [CrossRef]
- Chen, Y.L. The Study of Liquid Crystal Lens with Varying Voltage. Master’s Thesis, National Sun Ye Sen University, Kaohsiung, Taiwan, 26 July 2006. [Google Scholar]
- Wang, J.Y. The Development of Liquid Crystal Component that Uses Electric Field to Adjust Positive and Negative Lens Properties. Master’s Thesis, National Chungshan University, Kaohsiung, Taiwan, 2 July 2005. [Google Scholar]
- Qi, Y.L.; Sun, X.H.; Wang, S.; Li, W.Y.; Wang, Z.Y. Design of an Electrically Tunable Micro-Lens Based on Graded Photonic Crystal. Crystals 2018, 303, 8. [Google Scholar] [CrossRef]
- Wang, L.; Urbas, A.M.; Li, Q. Nature-Inspired Emerging Chiral Liquid Crystal Nanostructures: From Molecular Self-Assembly to DNA Mesophase and Nanocolloids. Adv. Mater. 2018. [Google Scholar] [CrossRef] [PubMed]
- Yang, R.M.; Zhao, D.J.; Dong, G.X.; Liu, Y.H.; Wang, D.T. Synthesis and Characterization of Photo-Responsive Thermotropic Liquid Crystals Based on Azobenzene. Crystals 2018, 8, 147. [Google Scholar] [CrossRef]
- Wang, L.; Li, Q. Photochromism into nanosystems: Towards lighting up the future nanoworld. Chem. Soc. Rev. 2018, 47, 1044–1097. [Google Scholar] [CrossRef] [PubMed]
- Xiang, X.; Kim, J.; Escuti, M.J. Far-field and Fresnel Liquid Crystal Geometric Phase Holograms via Direct-Write Photo-Alignment. Crystals 2017, 7, 383. [Google Scholar] [CrossRef]
- Wang, H.F. Research on the Design and Optimization of Advanced Digital Imaging and Non-Imaging Optical System. Master’s Thesis, National Kaohsiung First University of Science and Technology, Kaohsiung, Taiwan, 3 June 2010. [Google Scholar]
Figure 1.
Micro-scan compensation technology enhances the pixels.

Figure 2.
Optical path for green light source in a rectangular 2 × 2 array.

Figure 3.
Steps in cycle light source micro-scanning compensation, using the repeating cycle of persistence of human vision.
Figure 3.
Steps in cycle light source micro-scanning compensation, using the repeating cycle of persistence of human vision.

Figure 4.
Illustration diagram for light source micro-scanning compensation.

Figure 5.
(a) Paraxial optical path design, similar to rectangular telecentric optical design. (b) Light source off-axis 2 × 2 array design (No laser diode on the main axis, and four light sources were symmetrically located in alignment with the main axis).
Figure 5.
(a) Paraxial optical path design, similar to rectangular telecentric optical design. (b) Light source off-axis 2 × 2 array design (No laser diode on the main axis, and four light sources were symmetrically located in alignment with the main axis).

Figure 6.
Liquid crystal lens principle. (a) Non-active lenses are not energized. The lens has no effect. (b) Activated liquid crystal lens and showing the focusing effect.
Figure 6.
Liquid crystal lens principle. (a) Non-active lenses are not energized. The lens has no effect. (b) Activated liquid crystal lens and showing the focusing effect.

Figure 7.
Design concept for generating the local dimming phenomenon on the imaging chip components. (a) Image, (b) local dimming, (c) LCD imaging chip.
Figure 7.
Design concept for generating the local dimming phenomenon on the imaging chip components. (a) Image, (b) local dimming, (c) LCD imaging chip.

Figure 8.
Design structure for a single liquid crystal lens and the liquid crystal lens array.

Figure 9.
(a) A top view of the liquid crystal lenses (b) Elevation diagram for liquid crystal imaging lens array and LCD imaging components.
Figure 9.
(a) A top view of the liquid crystal lenses (b) Elevation diagram for liquid crystal imaging lens array and LCD imaging components.

Figure 10.
Overall structural diagram for the design of the projection illumination system for the projector.
Figure 10.
Overall structural diagram for the design of the projection illumination system for the projector.

Figure 11.
(a) Single red laser, displaying displacement map for local dimming (liquid crystal lens with pore size of 2.0 mm and a focal length of 9 cm). (b) Four red lasers, displaying compensation for light source micro scanning (liquid crystal lens with pore size of 2.0 mm and a focal length of 9 cm).

Figure 12.
(a) Single green laser, displaying displacement map for local dimming (liquid crystal lens with pore size of 2.0 mm and a focal length of 9 cm). (b) Four green lasers, displaying compensation for light source micro scanning (liquid crystal lens with pore size of 2.0 mm and a focal length of 9 cm).

Figure 13.
(a) Single blue laser, displaying displacement map for local dimming (liquid crystal lens with pore size of 2.0 mm and a focal length of 9 cm). (b) Four blue lasers, displaying compensation for light source micro scanning (liquid crystal lens with pore size of 2.0 mm and a focal length of 9 cm).

Figure 14.
(a) Single red laser, displaying displacement map for local dimming (liquid crystal lens with pore size of 2.0 mm and a focal length of 23 cm). (b) Four red lasers, displaying compensation for light source micro scanning (liquid crystal lens with pore size of 2.0 mm and a focal length of 23 cm).

Figure 15.
(a) Single green laser, displaying displacement map for local dimming (liquid crystal lens with pore size of 2.0 mm and a focal length of 23 cm). (b) Four green lasers, displaying compensation for light source micro scanning (liquid crystal lens with pore size of 2.0 mm and a focal length of 23 cm).

Figure 16.
(a) Single blue laser, displaying displacement map for local dimming (liquid crystal lens with pore size of 2.0mm and a focal length of 23 cm). (b) Four blue lasers, displaying compensation for light source micro scanning (liquid crystal lens with pore size of 2.0 mm and a focal length of 23 cm).


Table 1.
Selection specification for a single laser source.
| Color | Red Laser | Green Laser | Blue Laser |
|---|---|---|---|
| Wavelength | 660 (nm) | 532 (nm) | 450 (nm) |
| Die size (mm) | Radius = 1.5 | Radius = 1.8 | Radius = 1.3 |
| Die thickness | 0.8 mm | 1 mm | 1.1 mm |
| Optical Output Power | <0.7 w (90.53 lm) | <0.5 w (302.21 lm) | <0.36 w (9.343 lm) |
| Light type | Elliptical Gaussian | Elliptical Gaussian | Elliptical Gaussian |
| Divergence angle (Gauss angle X Gauss angle Y) | X = 4.25 degrees Y = 14 degrees | X = 2.5 degrees Y = 9 degrees | X = 2 degrees Y = 9 degrees |
Table 2.
List of focal length for different pore sizes under different voltages (unit: cm).
| Pore Size (mm) Voltages (V) | 1.2 mm | 1.4 mm | 1.6 mm | 1.8 mm | 2.0 mm |
|---|---|---|---|---|---|
| 5 V | 29 | 62 | 98 | 78 | |
| 15 V | 12 | 21 | 40 | 60 | 120 |
| 25 V | 4 | 5 | 8 | 14 | 23 |
| 35 V | 3 | 5 | 5 | 11 | 15 |
| 45 V | 3 | 3 | 5 | 6 | 9 |
Table 3.
Statistical table for the effectiveness of the projection illumination system for the projector.
Table 3.
Statistical table for the effectiveness of the projection illumination system for the projector.
| Brightness | Red Road | Green Road | Blue Road |
|---|---|---|---|
| Maximum uniformity | 82.25% | 87.15% | 88.43% |
| Maximum light efficiency | 33.11% | 35.01% | 39.03% |
| Luminous Flux | 119.64 lm | 423.32 lm | 14.59 lm |
Table 4.
Contrast and light efficiency for a single red laser and cyclic micro-scanning laser (liquid crystal lens with pore size of 2.0 mm and a focal length of 9 cm).
Table 4.
Contrast and light efficiency for a single red laser and cyclic micro-scanning laser (liquid crystal lens with pore size of 2.0 mm and a focal length of 9 cm).
| Brightness | Laser A | Laser B | Laser C | Laser D | Cyclic Laser |
|---|---|---|---|---|---|
| Brightest spot of the optical spot (unit: Lux) | 508,182 | 508,257.375 | 507,068.656 | 514,448.7 | 1233,362.63 |
| Darkest spot of the optical spot (unit: Lux) | 4996.46 | 6769.01 | 6876.07 | 6892.51 | 14,114.373 |
| Contrast | 102:1 | 75:1 | 73:1 | 75:1 | 87:1 |
| Light efficiency | 22.265% | 22.256% | 22.265% | 22.233% | 22.249% |
Table 5.
Contrast and light efficiency for a single green laser and cyclic micro-scanning laser (liquid crystal lens with pore size of 2.0 mm and a focal length of 9 cm).
Table 5.
Contrast and light efficiency for a single green laser and cyclic micro-scanning laser (liquid crystal lens with pore size of 2.0 mm and a focal length of 9 cm).
| Brightness | Laser A | Laser B | Laser C | Laser D | Cyclic Laser |
|---|---|---|---|---|---|
| Brightest spot of the optical spot (unit: Lux) | 1762717.38 | 1753481.25 | 1790916.75 | 1794706 | 5426647 |
| Darkest spot of the optical spot (unit: Lux) | 4587.92 | 4011.78 | 4160.02 | 4985.19 | 63513.4 |
| Contrast | 384:1 | 437:1 | 430:1 | 360:1 | 85:1 |
| Light efficiency | 23.059% | 23.097% | 23.573% | 23.546% | 23.301% |
Table 6.
Contrast and light efficiency for a single blue laser and cyclic micro-scanning laser (liquid crystal lens with pore size of 2.0 mm and a focal length of 9 cm).
Table 6.
Contrast and light efficiency for a single blue laser and cyclic micro-scanning laser (liquid crystal lens with pore size of 2.0 mm and a focal length of 9 cm).
| Brightness | Laser A | Laser B | Laser C | Laser D | Cyclic Laser |
|---|---|---|---|---|---|
| Brightest spot of the optical spot (unit: Lux) | 64501.95 | 63823.17 | 64506.9648 | 63560.0547 | 196819.141 |
| Darkest spot of the optical spot (unit: Lux) | 356.28 | 438.401 | 552.724 | 405.903 | 1121.24 |
| Contrast | 181:1 | 145:1 | 117:1 | 157:1 | 176:1 |
| Light efficiency | 33.405% | 33.44% | 33.41% | 33.42% | 33.429% |
Table 7.
Contrast and light efficiency for a single red laser and cyclic micro-scanning laser (liquid crystal lens with pore size of 2.0 mm and a focal length of 23 cm).
Table 7.
Contrast and light efficiency for a single red laser and cyclic micro-scanning laser (liquid crystal lens with pore size of 2.0 mm and a focal length of 23 cm).
| Brightness | Laser A | Laser B | Laser C | Laser D | Cyclic Laser |
|---|---|---|---|---|---|
| Brightest spot of the optical spot (unit: Lux) | 443163.875 | 428650.5 | 429790.438 | 432997.3 | 1216329.25 |
| Darkest spot of the optical spot (unit: Lux) | 4996.46 | 4314.2 | 3685.74 | 4762.99 | 10835 |
| Contrast | 89:1 | 99:1 | 117:1 | 91:1 | 112:1 |
| Light efficiency | 22.259% | 22.253% | 22.261% | 22.229% | 22.245% |
Table 8.
Contrast and light efficiency for a single green laser and cyclic micro-scanning laser (liquid crystal lens with pore size of 2.0 mm and a focal length of 23 cm).
Table 8.
Contrast and light efficiency for a single green laser and cyclic micro-scanning laser (liquid crystal lens with pore size of 2.0 mm and a focal length of 23 cm).
| Brightness | Laser A | Laser B | Laser C | Laser D | Cyclic Laser |
|---|---|---|---|---|---|
| Brightest spot of the optical spot (unit: Lux) | 1522,387.88 | 1511,813.25 | 1547,229.63 | 1556,919 | 4390,922 |
| Darkest spot of the optical spot (unit: Lux) | 4587.92 | 4175.74 | 4912.65 | 4418.53 | 35,573.425 |
| Contrast | 332:1 | 362:1 | 315:1 | 352:1 | 123:1 |
| Light efficiency | 23.056% | 23.093% | 23.568% | 23.541% | 23.296% |
Table 9.
Contrast and light efficiency for a single blue laser and cyclic micro-scanning laser (liquid crystal lens with pore size of 2.0 mm and a focal length of 23 cm).
Table 9.
Contrast and light efficiency for a single blue laser and cyclic micro-scanning laser (liquid crystal lens with pore size of 2.0 mm and a focal length of 23 cm).
| Brightness | Laser A | Laser B | Laser C | Laser D | Cyclic Laser |
|---|---|---|---|---|---|
| Brightest spot of the optical spot (unit: Lux) | 57378.1953 | 57041.1523 | 57270.78 | 57134.48 | 183215.125 |
| Darkest spot of the optical spot (unit: Lux) | 166.266 | 460.07 | 316.564 | 249.395 | 724.247 |
| Contrast | 345:1 | 124:1 | 181:1 | 229:1 | 253:1 |
| Light efficiency | 33.326% | 33.352% | 33.306% | 33.336% | 33.341% |
© 2019 by the authors. Licensee MDPI, Basel, Switzerland. This article is an open access article distributed under the terms and conditions of the Creative Commons Attribution (CC BY) license (http://creativecommons.org/licenses/by/4.0/).
Share and Cite
MDPI and ACS Style
Fang, Y.-C.; Tsai, C.M.; Cheng, D.-L. Application of Dimming Compensation Technology Via Liquid Crystal Lens for Non-Imaging Projection Laser Systems. Crystals 2019, 9, 122. https://0-doi-org.brum.beds.ac.uk/10.3390/cryst9030122
AMA Style
Fang Y-C, Tsai CM, Cheng D-L. Application of Dimming Compensation Technology Via Liquid Crystal Lens for Non-Imaging Projection Laser Systems. Crystals. 2019; 9(3):122. https://0-doi-org.brum.beds.ac.uk/10.3390/cryst9030122
Chicago/Turabian StyleFang, Yi-Chin, Cheng Mu Tsai, and Da-Long Cheng. 2019. "Application of Dimming Compensation Technology Via Liquid Crystal Lens for Non-Imaging Projection Laser Systems" Crystals 9, no. 3: 122. https://0-doi-org.brum.beds.ac.uk/10.3390/cryst9030122
Note that from the first issue of 2016, this journal uses article numbers instead of page numbers. See further details here.