Article

Synthesis and Study of CdSe QDs by a Microfluidic Method and via a Bulk Reaction

1
Materials Genome Institute, Shanghai University, Chengzhong Road, Shanghai 201800, China
2
ETH Zurich, 8093 Zurich, Switzerland
3
The Hong Kong University of Science and Technology Clear Water Bay, Kowloon, Hong Kong
*
Author to whom correspondence should be addressed.
These authors contributed equally to this work.
Submission received: 11 June 2019 / Revised: 15 July 2019 / Accepted: 17 July 2019 / Published: 18 July 2019
(This article belongs to the Special Issue Nanowires and Quantum Dots for IoT Applications)

Abstract

:
In this work, we synthesized monodispersed CdSe quantum dots (QDs) by a microfluidic method and via a bulk reaction. The structures of the CdSe QDs were characterized by X-ray powder diffraction (XRD) and high-resolution transmission electron microscopy (HR-TEM). The optical properties of the prepared CdSe QDs were determined using ultraviolet-visible absorption spectroscopy and photoluminescence spectroscopy. The CdSe QDs obtained by the microfluidic method have a faster crystal growth rate and a higher absolute photoluminescence quantum yield than those obtained via the bulk reaction. Additionally, we investigated the growth process of the CdSe QDs with increasing residence times.

1. Introduction

Over the past few decades, semiconductor quantum dots (QDs), such as CdSe, have been attracting increased scientific and commercial interest due to their tunable band gap, their narrow emission spectrum, their high conductivity and mobility, and an outstanding chemical and light stability. They have been increasingly used in bioimaging [1,2], therapeutics [3], catalysis [4], solar cells [5,6], and quantum-dot light-emitting devices (QD-LED) [7,8].
Peng et al. [9] obtained rod-like CdSe QDs by adding hexyl-phosphonic acid (HPA) into the reaction system, thereby providing a way to control their shape. Alivisatos et al. [10] demonstrated that the addition of acidic surfactants, such as octadecylphosphonate, can accelerate the growth rate of the nucleus and reduce the number of particles of a stable size, thereby affecting the average radius of the nanocrystals. The effect of a small amount of acidic surfactant on the average diameter is very strong. Lin et al. [11] synthesized core-shell CdSe/CdS QDs in an aqueous solution by a photo-assisted method and a microwave heating method. They concluded that the CdSe QDs obtained with the photo-assisted method possess a higher photoluminescence (PL) quantum yield (QY) and a narrower full width at half maximum (FWHM) of the emission peak than those of the QDs prepared by microwave heating.
The most conventional synthesis method of CdSe QDs is to prepare a Cd precursor solution and a Se precursor solution and mix them at a high temperature for a certain period of time [12,13,14,15]. The traditional method of synthesizing CdSe QDs is fundamental, but also suffers from obvious deficiencies. Certain reaction parameters, such as the reaction temperature and the concentration, cannot be accurately controlled, which results in an irreproducible reaction. Therefore, we introduced a microfluidic method with rapid and efficient mass and heat transfer to prepare CdSe QDs to precisely control the reaction parameters with good repeatability. There have been many studies to synthesize QDs on microfluidic platforms. Maeda et al. [16] explored the effects of the reaction conditions including the residence time, the temperature, and the addition of stearic acid on CdSe nanocrystals prepared in a microreactor. They found that addition of organic ligands had a direct effect on the number of particles. Alivisatos et al. [17] used chip-based microfluidic reactors to synthesize CdSe nanocrystals and studied the influence of the reaction time, the temperature, and the precursor concentration. Bakr et al. [18] automatically synthesized PbS QDs with a microfluidic system, and the performance of the fabricated solar cell was equivalent to that prepared from batch-synthesized QDs. Xu et al. [19] investigated the effects of the nucleation temperature, the monomer concentration, and the overall ratio of Cd to Se on the shape of CdSe nanoparticles. They successfully obtained highly monodisperse-branched cadmium selenide QDs in the microreactor. Chen et al. [20] proposed a green strategy to produce solvent-free CdSe QD-hybrid fibers and arrays via a microfluidic spinning technology. They ground CdSe/PVP microfibers into powders to prepare phosphors for white light-emitting diodes (WLED).
In this work, we compared the properties of CdSe QDs obtained with the same reaction conditions (temperature, reactant ratio, and reaction time) in microtubes and in a bulk reaction by combining the typical trioctylphosphine-oleic acid (TOP-OA) reaction [21] with microfluidics devices.

2. Experiment

2.1. Materials

Cadmium oxide (CdO, 99.99%), diphenyl ether (98%), selenium (Se, 99.9%), chloroform, oleic acid (OA), and anhydrous methanol were the analytical reagents. All chemicals were used directly without any purification.

2.2. Synthesis of the Precursors
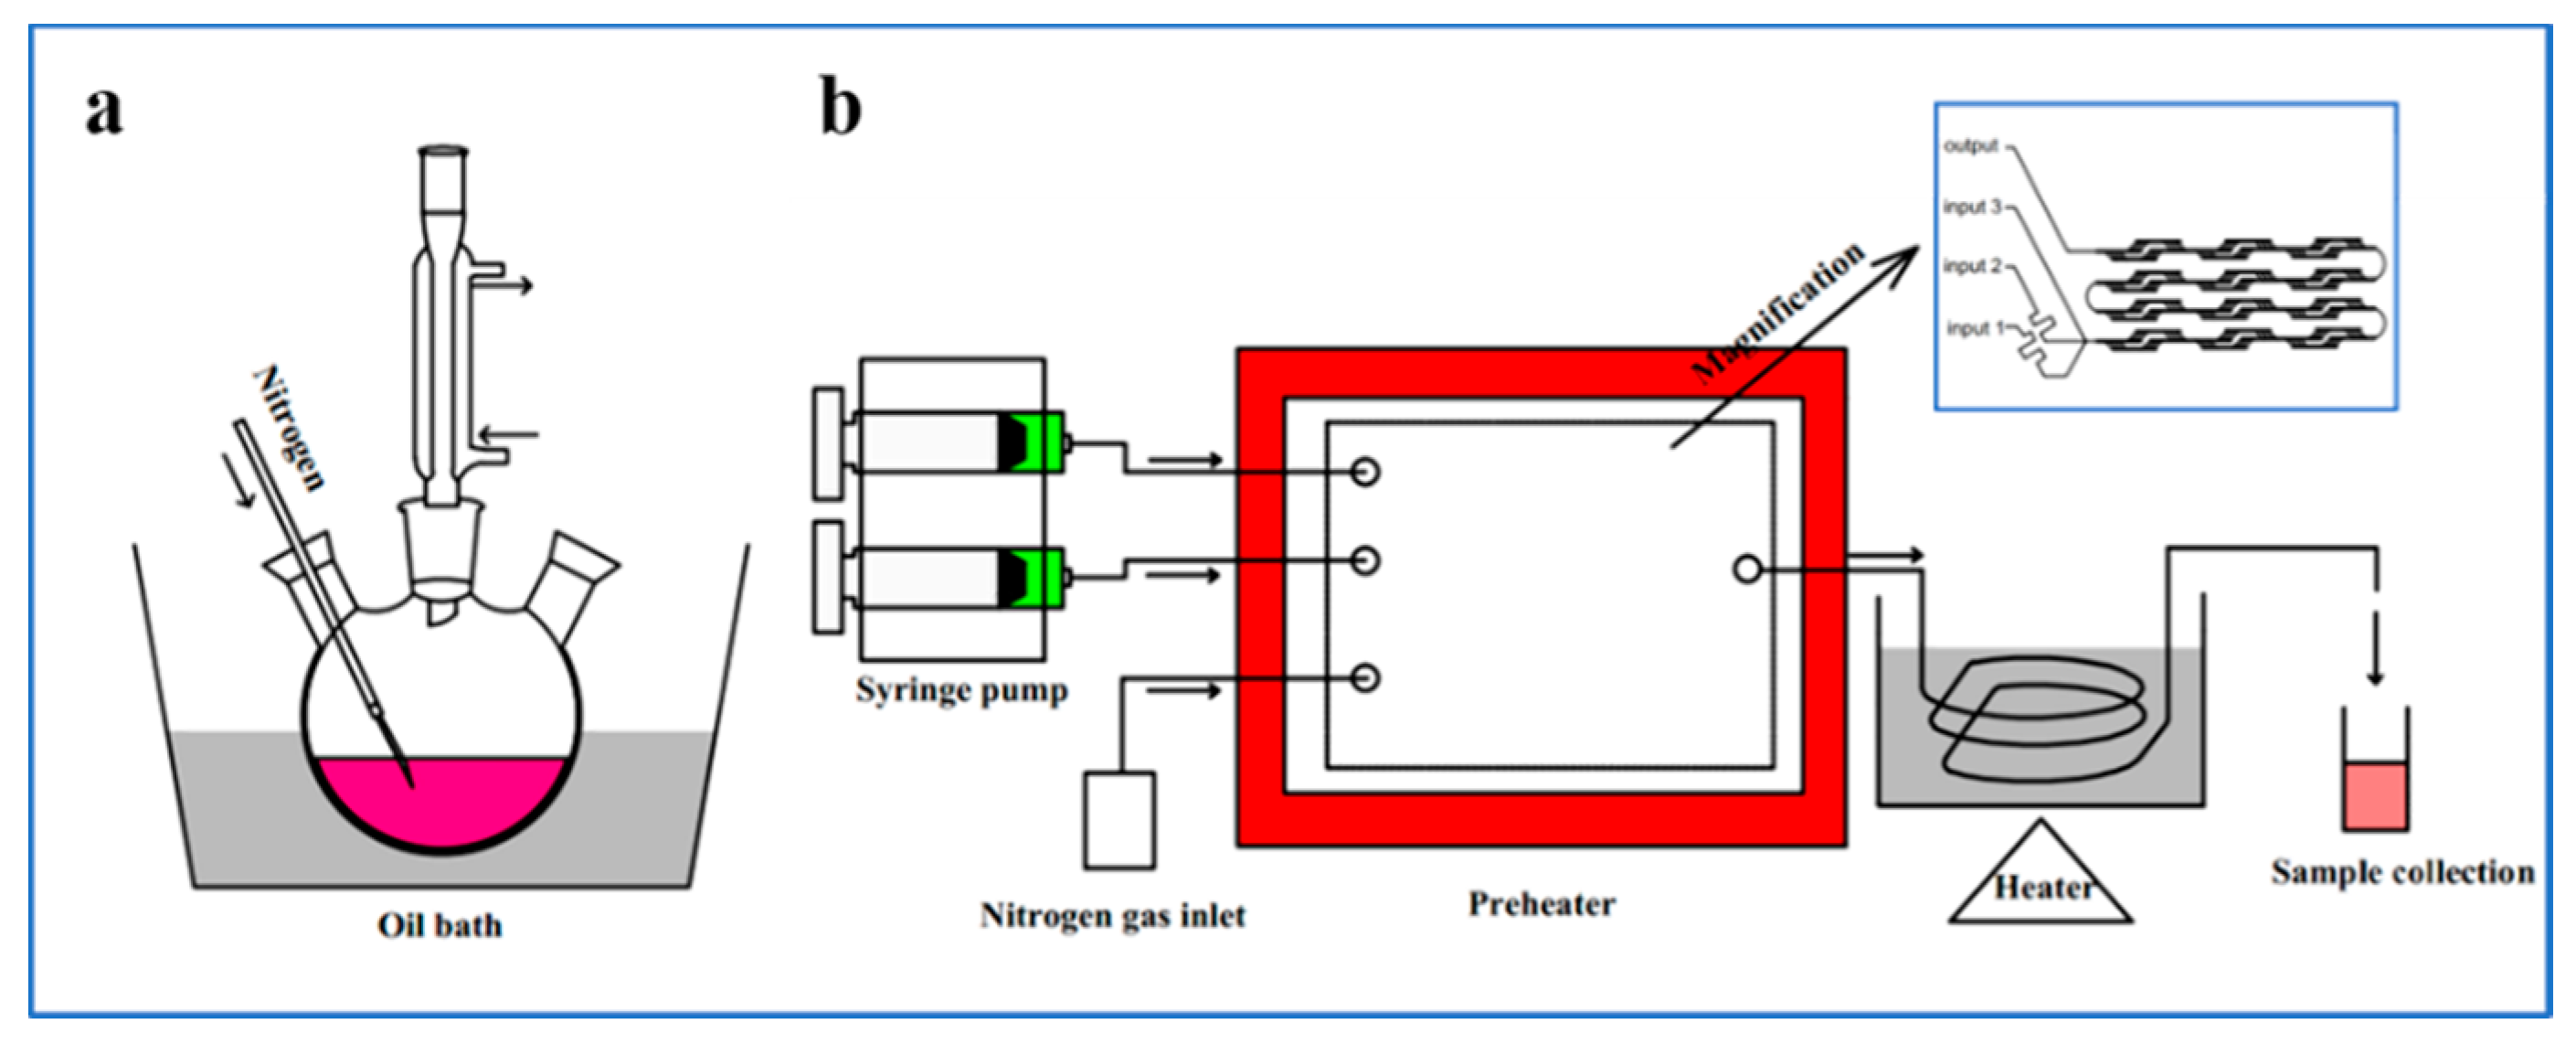
To begin, 0.23 g of cadmium oxide and 1.70 g of oleic acid were dispersed in 8 mL of diphenyl ether and the mixture was heated at 180 °C in a 25 mL three-necked flask while stirring for 120 min under nitrogen to form a clear yellow cadmium oleate stock solution. In order to prepare the Se-TOP solution, 0.32 g Se powder was dispersed in 2.88 g TOP and the mixture was ultrasonicated for 30 min.

2.3. Bulk Reaction

As described in Figure 1a, we injected 3.2 g Se precursor solution into the three-necked flask while stirring under nitrogen flow after the cadmium oleate stock solution was prepared. A 0.5 mL aliquot at given reaction times between 3 and 60 min was removed from the reaction flask with a syringe and quickly transferred into a vial with cold chloroform to sufficiently quench the growth of the nanocrystals. Finally, anhydrous methanol was added to the samples and the mixture was centrifuged at 6000 rpm for 5 min before washing it with anhydrous methanol. This procedure was repeated several times until the supernatant was clear. The precipitate was collected in 2 mL chloroform.

2.4. Microfluidic Devices

Figure 1b shows a schematic illustration of the microfluidics procedure. The 4 ml cadmium oleate solution was loaded into a syringe and named solution A whereas the 2 ml Se-TOP solution was loaded into another syringe and named solution B. They were pumped into a micromixer chip (Dolomite Microfluidics, Royston, UK) at different flow rates. The flow rate of solution A was 1 mL/min whereas the flow rate of solution B was 0.2 mL/min. Solutions A and B were mixed in the micromixer chip using polytetrafluoroethylene (PTFE) microtubes with an inner diameter of 0.8 mm and an outer diameter of 1.6 mm. They were incubated for a duration between 3 and 60 min using a Hoffman valve and finally collected into a vial. The purification process of the sample was the same as for the bulk preparation method mentioned above and the final sample was stored in 2 mL chloroform.

2.5. Characterization

Samples of 0.2 mL were diluted with chloroform to 2 mL and measured with 3 mL quartz cuvettes in ambient air at room temperature with an FS5 spectrofluorimeter and a JASCO V-750 spectrophotometer to characterize the optical properties. The absolute QY of the CdSe QDs was determined with an integrating sphere in combination with an FS5 spectrofluorimeterusing chloroform as a blank solution.
The X-ray diffraction (XRD) patterns were obtained on a MeasSrv D2-210629 X-ray diffractometer between 10° and 80° using the Cu Kα radiation (λ = 0.1542 nm) and operated at 50 kV and 100 mA. The specimens were prepared by spreading a thin layer of precipitated nanocrystals onto a non-diffracting silicon wafer in ambient air.
High-resolution transmission electron microscopy (HR-TEM) was performed with a Tecnai G2 F20 operating at 200 kV. The samples were prepared by depositing a drop of the dilute solutions of the nanocrystals onto ultrathin carbon-coated copper grids and drying them with an infrared lamp in ambient air. The transmission images were analyzed by a Nano Measurer, and the diameter distribution of the particles was summarized.

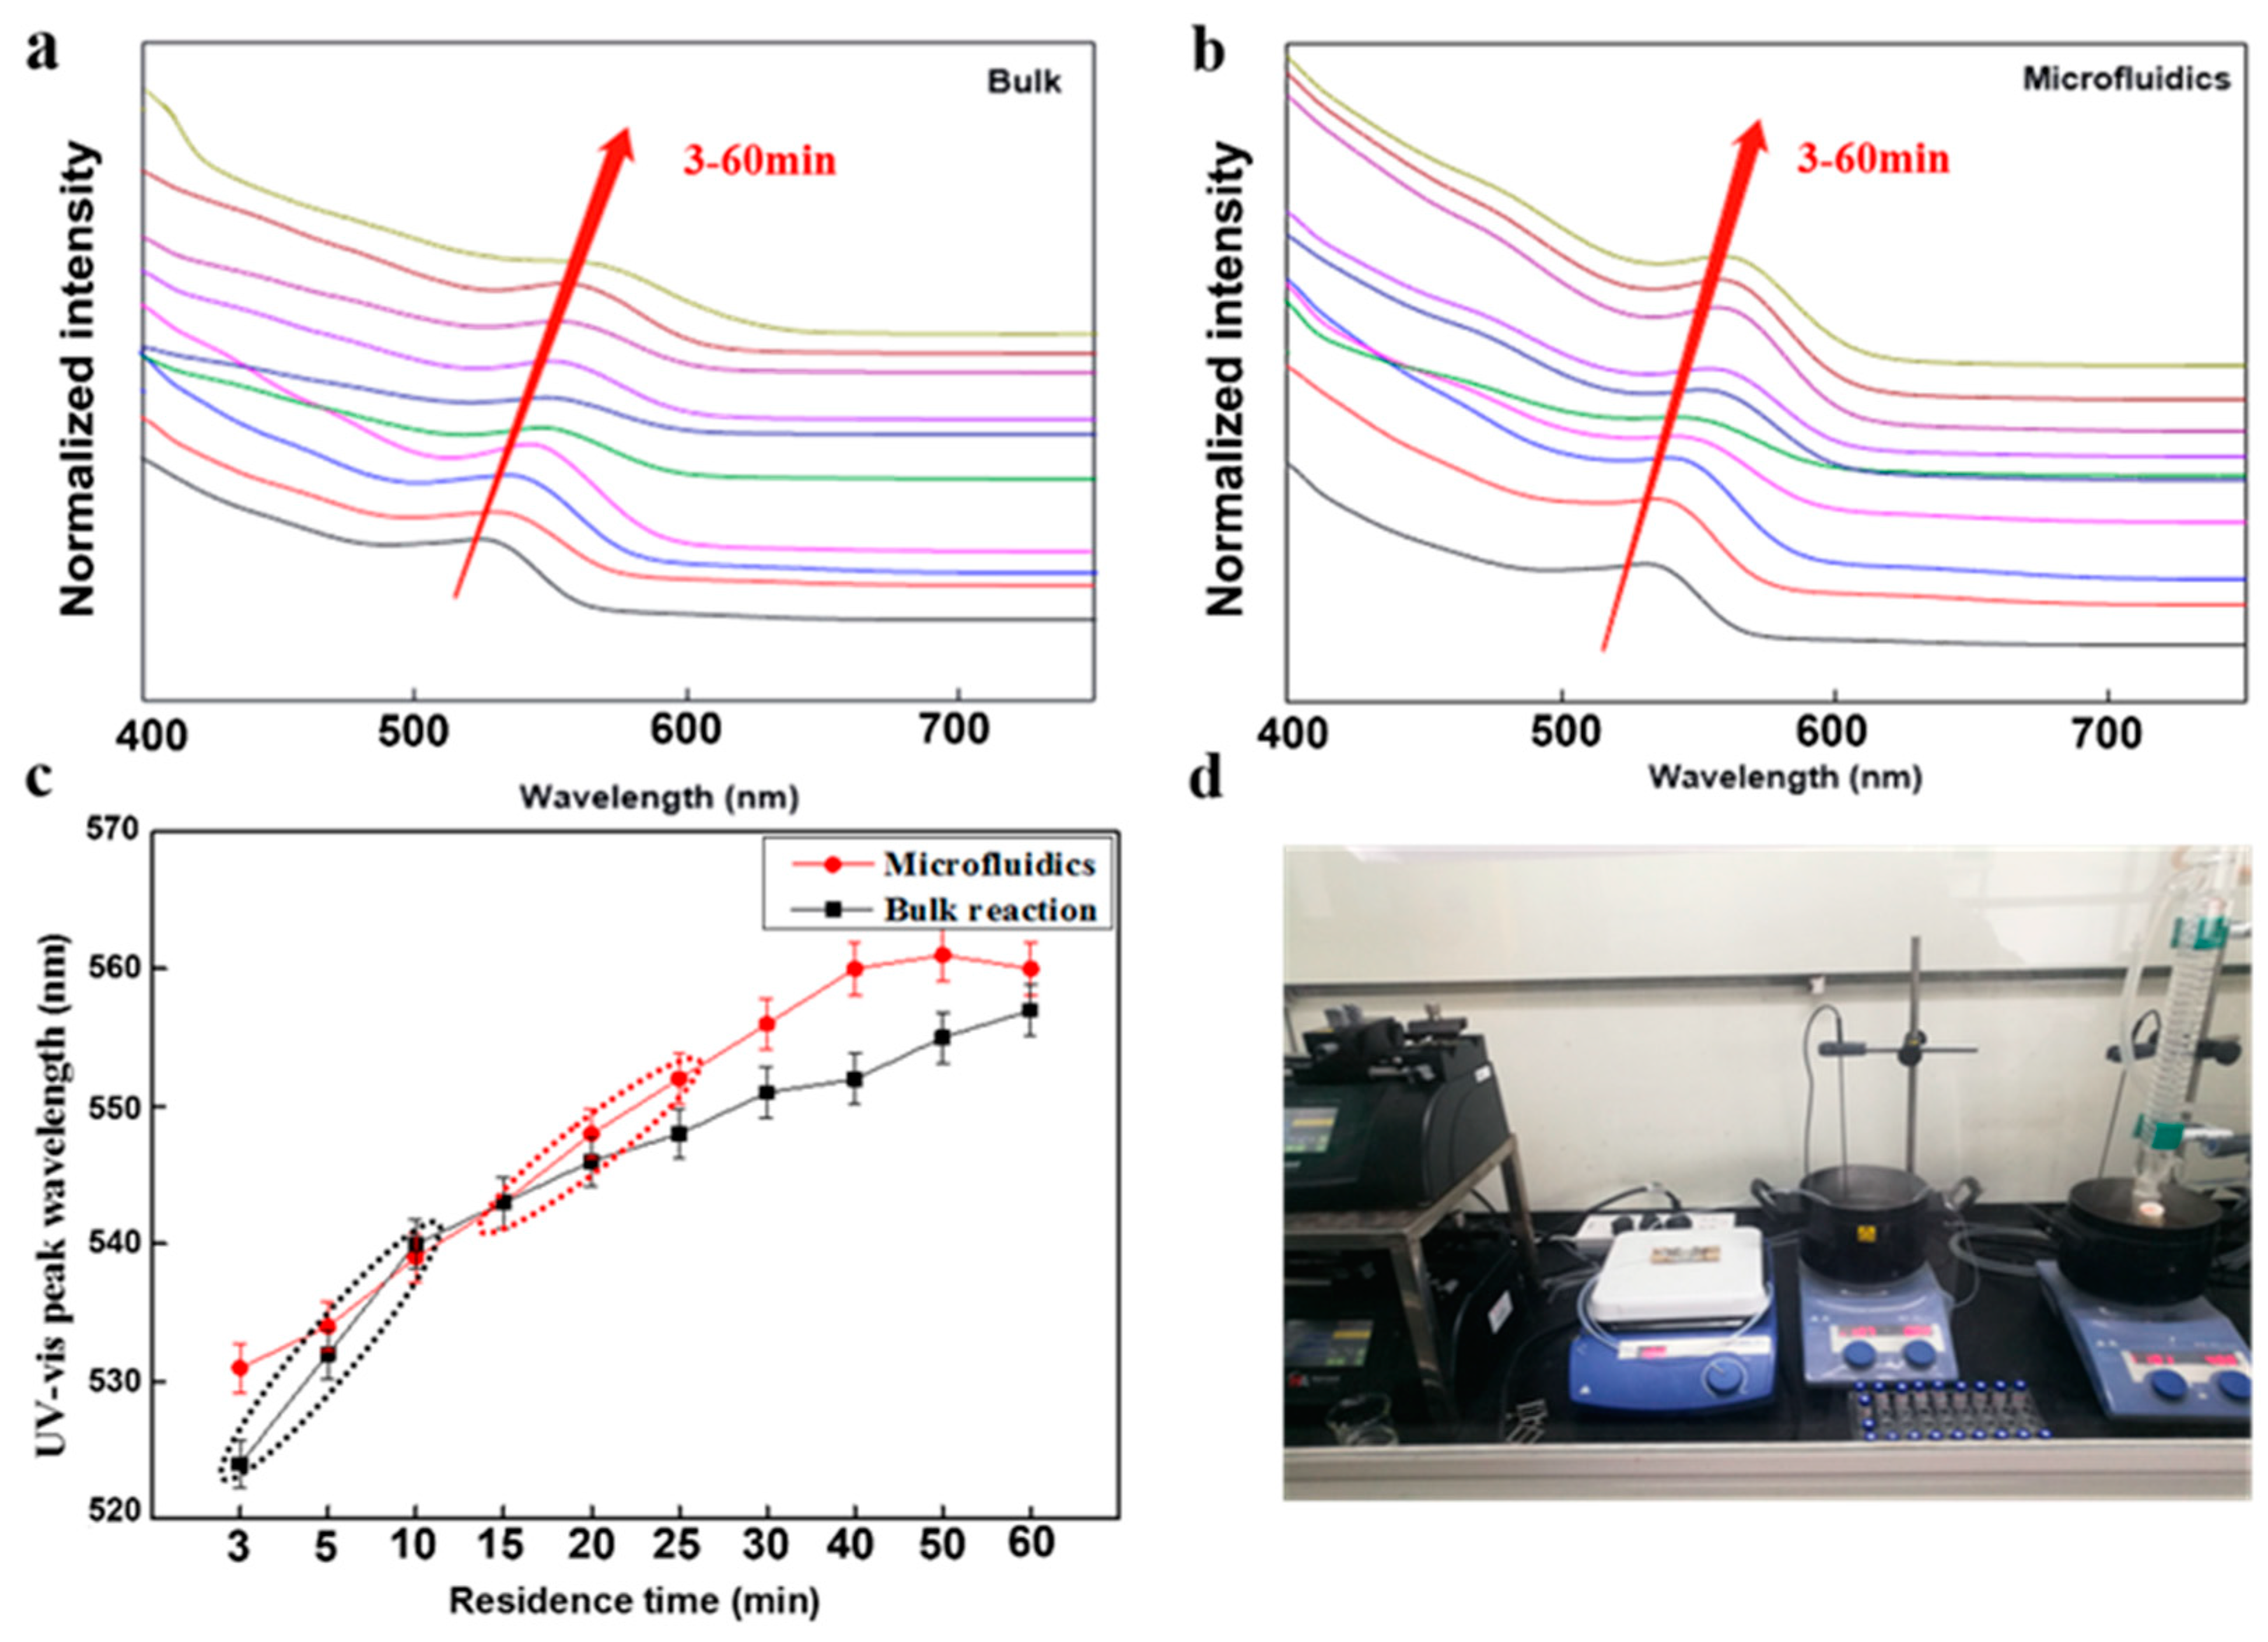
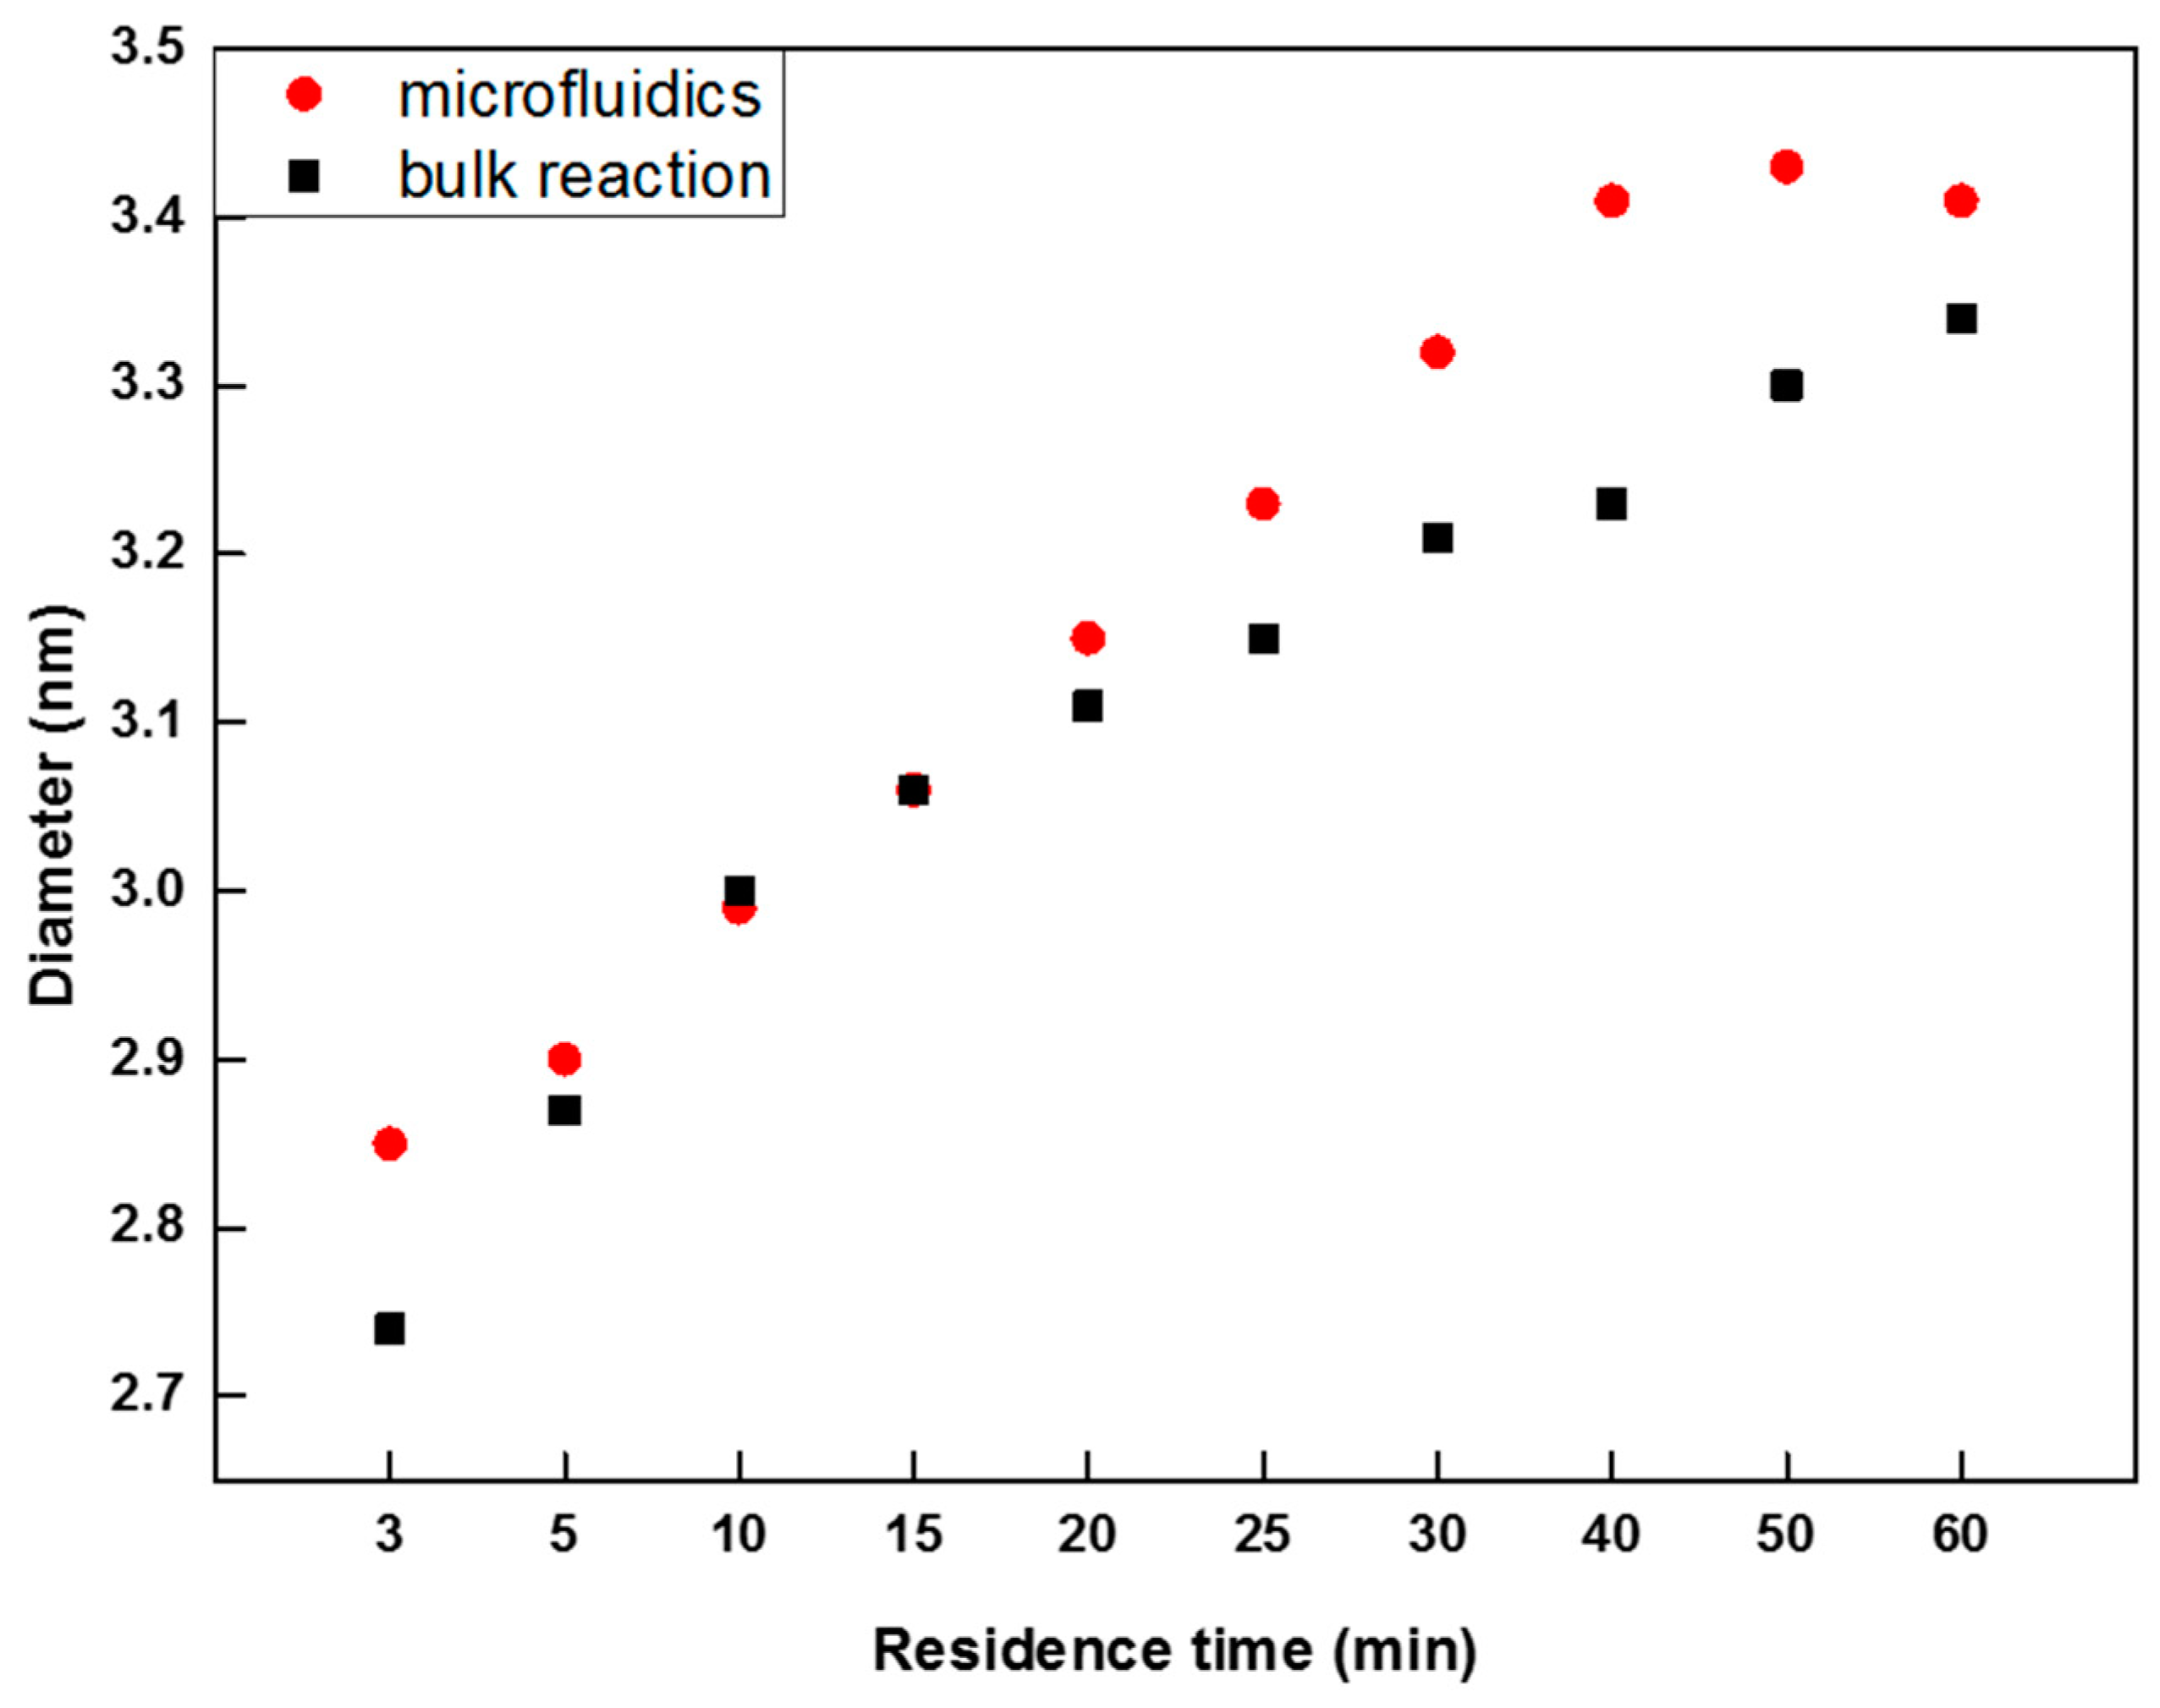
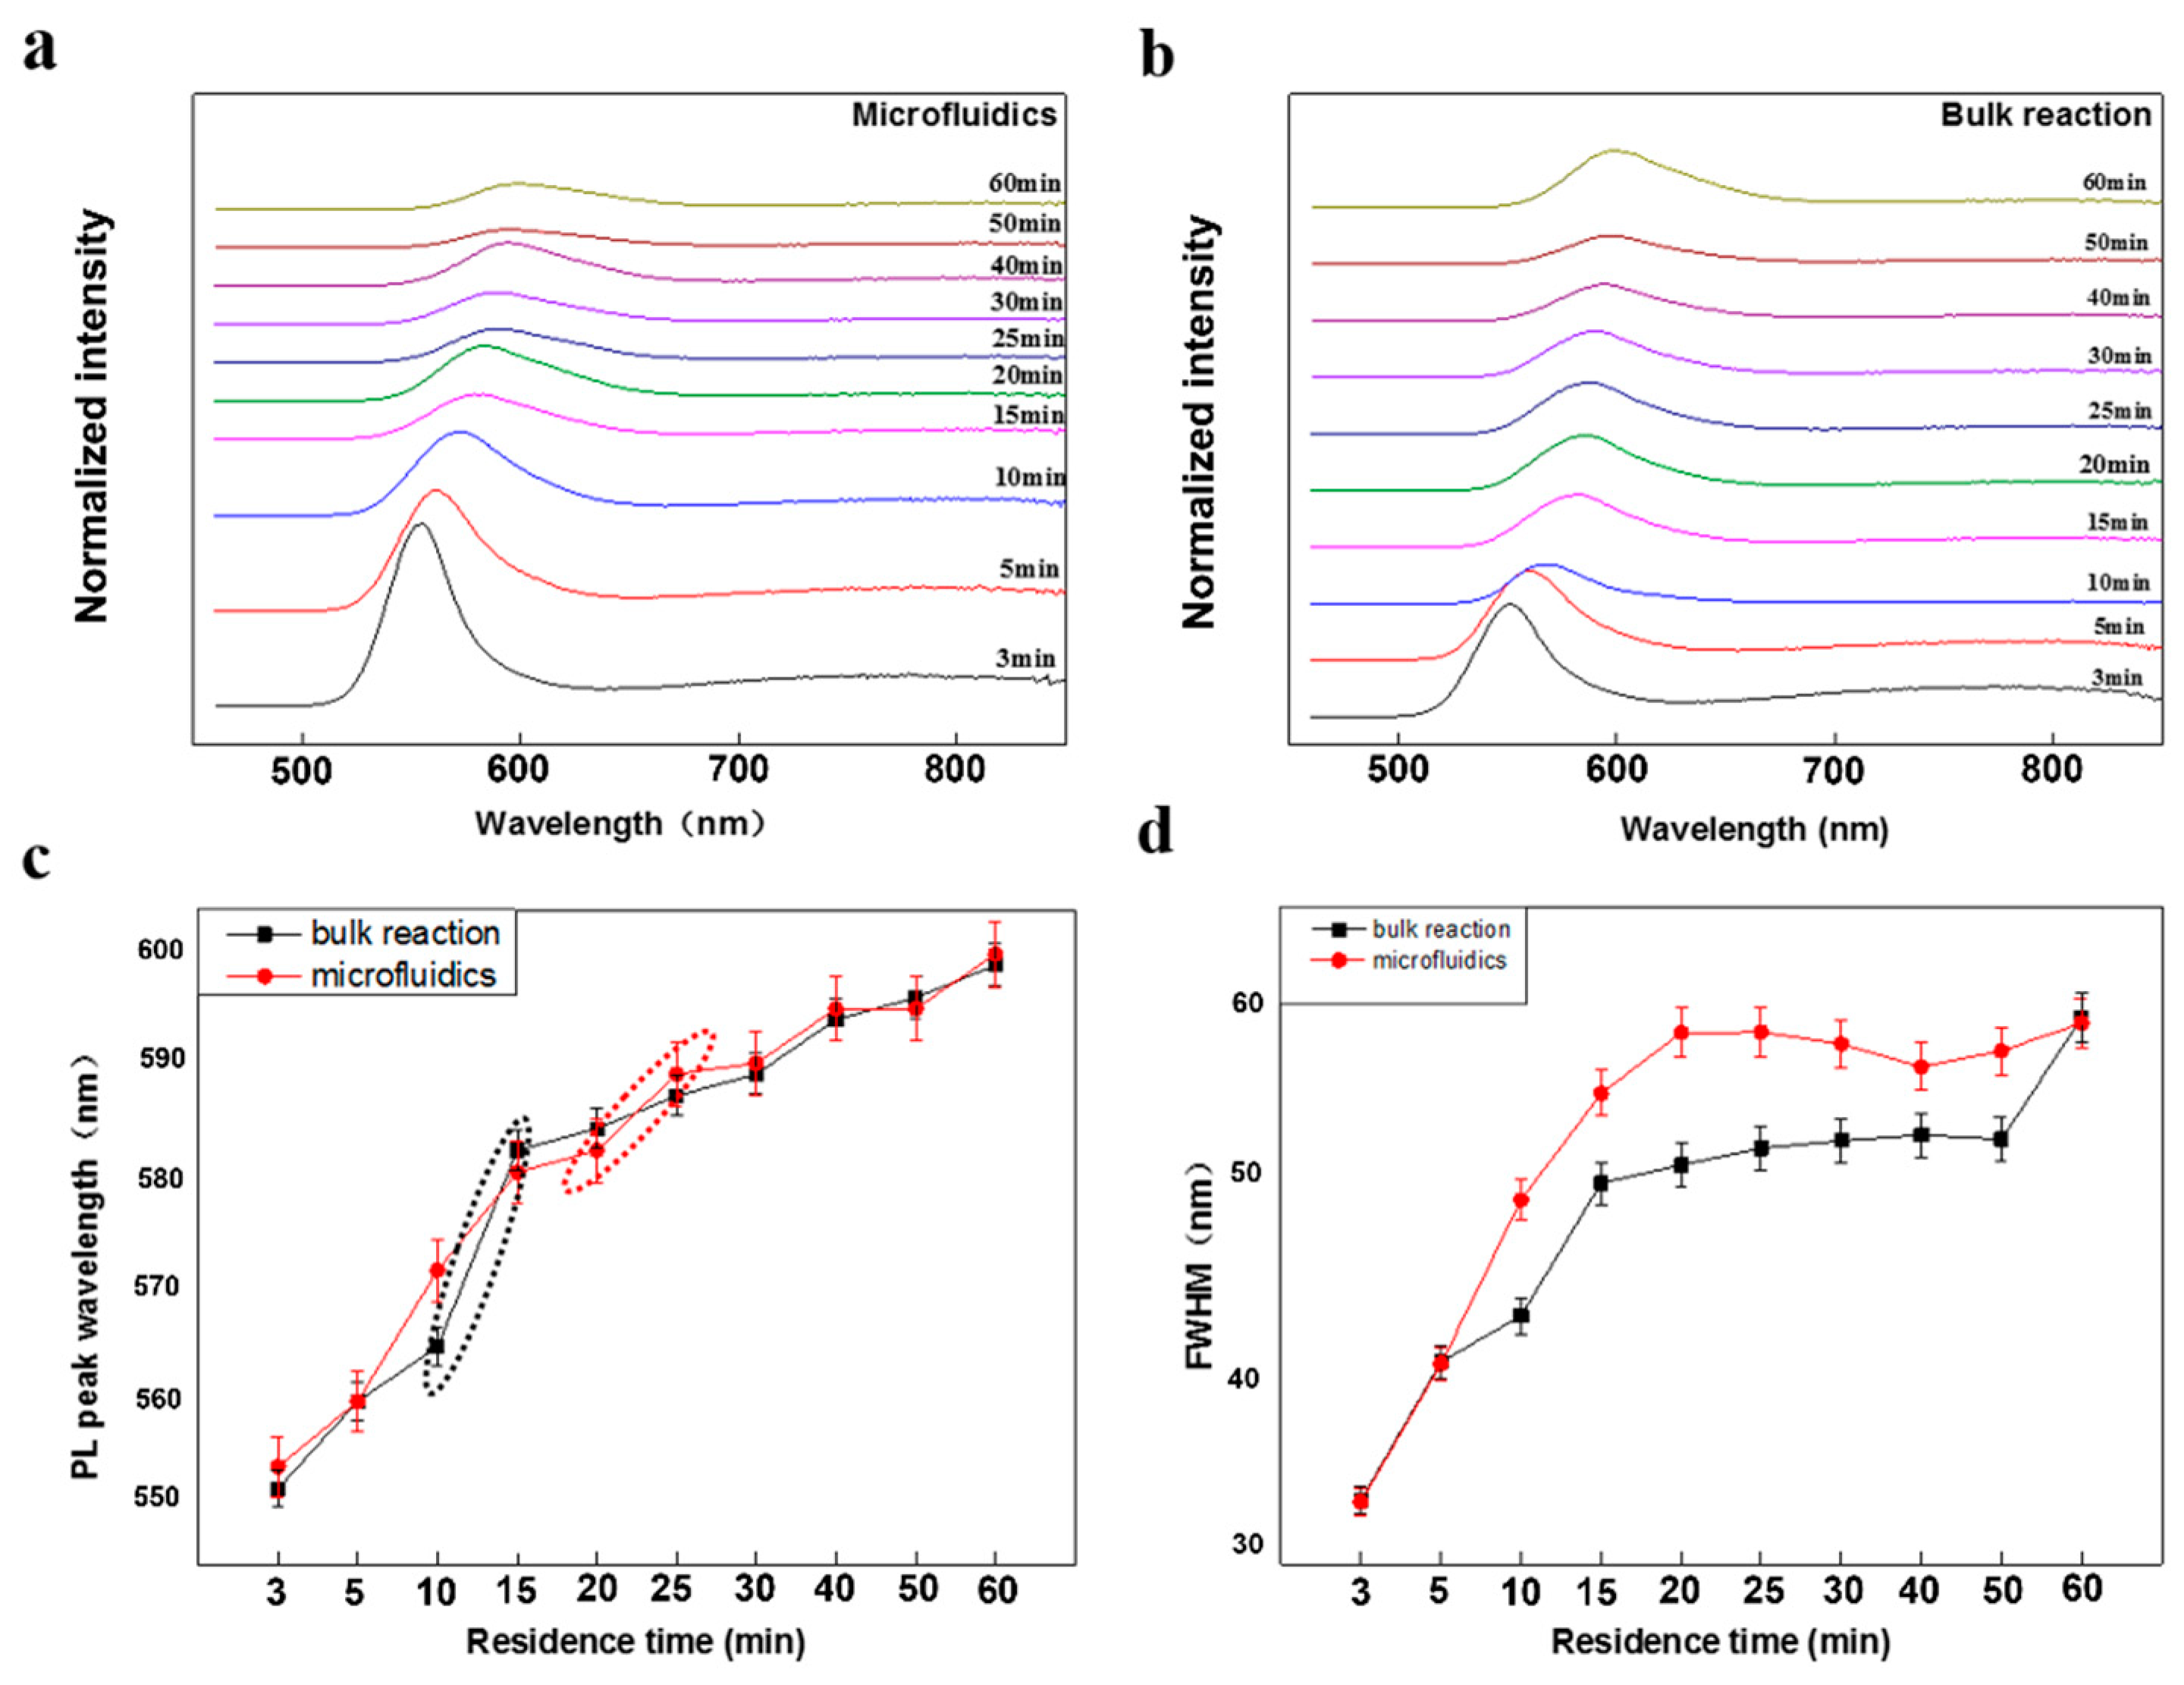
3. Results and Discussion

Figure 2a,b shows the UV-visible spectra of CdSe QDs synthesized via a bulk reaction and in a PTFE microtube for residence times between 3 and 60 min. Figure 2c shows the first absorption peak in the UV-visible spectra depending on the residence time in the microfluidics and in the bulk reaction. Figure 2d shows a photograph of the reaction devices. A red shift in the UV-vis spectra means an enlargement of the particles [22]. Indeed, the peak position in the UV-visible absorption spectrum is red-shifted as the reaction time increases. Comparing the microfluidics-based with the bulk synthesis, we found that the maximum value of the red shift in the microfluidics was 15–25 min (red dotted ellipses in Figure 2c) whereas the maximum value of the red shift for the bulk reaction was 3–10 min (black dotted ellipses in Figure 2c). The value of the red shift reflects the growth rate of the CdSe QDs. We propose that this observation originates from the fact that the precursor solution for the bulk synthesis was rapidly mixed in the three-necked flask whereas the microfluidic reaction was mainly carried out in the PTFE microtubes. At the initial stage, the monomer concentration in the three-necked flask was higher than that in the PTFE microtubes and the growth "burst" of the CdSe QDs in the bulk reaction occurred earlier. Since the total monomer concentration was the same, more monomer was consumed after the growth “burst” and, consequently, the monomer concentration in the bulk reaction was lower than in the microfluidic devices. The microfluidic devices have a higher heat and mass transfer efficiency [23,24,25], which results in larger CdSe QDs and explains why the peak wavelength in the UV-vis absorption spectra (Figure 2c) was ultimately above that for the bulk reaction.
Figure 3 shows the evolution of the predicted mean diameter of the CdSe QDs with the residence time calculated by an empirical fitting function [26]. The CdSe QDs grew as the residence time increased and larger CdSe QDs were obtained in the microtubes than in bulk.
Figure 4a, b shows the photoluminescence (PL) spectra of the CdSe QDs synthesized in PTFE microtubes and via a bulk reaction with residence times ranging from 3 to 60 min. When the residence time increased, both PL spectra showed a red shift indicating that the CdSe QDs were growing. Additionally, the photoluminescence intensity decreased mildly because of the decreasing electron-hole overlap with the increasing quantum dot size. As shown in Figure 4c, the wavelength of the PL peak increased with the residence time. The maximum of the red shift in the microfluidic reaction occurred between 20 and 25 min (red dotted ellipse in Figure 4c) whereas the maximum value of the red shift for the bulk reaction occurred between 10 and 15 min (black dotted ellipse in Figure 4c). This is consistent with the UV-visible absorption spectra. The reason for this observation was given earlier. Figure 4d shows the evolution of the full width at half maximum (FWHM) of the PL peak with the residence time. The FWHM of the peak for QDs obtained via microfluidics was consistently above that for QDs obtained via a bulk reaction. The FWHM of a PL peak is proportional to the size distribution of the particles [27]. Therefore, a higher size dispersion for the microfluidics devices results from a higher heat and mass transfer efficiency. We assume that a higher heat and mass transfer efficiency accelerate the growth of the CdSe crystals, which is equivalent to a higher reaction temperature and a faster stirring rate in the bulk reaction.
The PL colors of the samples obtained with the microtubes and via the bulk reaction are shown in Figure 5a,b. They coincide with the variation of the wavelength of the PL peak. We expected the prepared QDs to be used to fabricate LEDs and for bioimaging.
Figure 6 shows the XRD patterns of the CdSe QDs. Three distinct diffraction peaks were observed at 2θ values of 25.35°, 42.0°, and 49.7°. They corresponded to the (111), (220), and (311) crystalline planes of cubic CdSe, respectively (PDF#019–191). There was a significantly higher intensity when the residence time increased, which indicates a better crystallinity of the CdSe QDs during the growth of the particles in the microfluidic devices and in the bulk reaction.
The absolute quantum yields (noted as AQY) are given in Table 1. The advantage of absolute quantum yield is that the test results can be obtained without comparison with standard samples and the test values are stable and repeatable. There is no error caused by the standard test [28]. Figure 5c shows the luminescence of the CdSe QDs solution and the blank solution (chloroform) from fluorescein collected in the integrating sphere and measured by an integrating sphere in combination with an FS5 spectrofluorimeter. The AQYs in the bulk reaction with residence times of 15 and 60 min were lower than those in the microfluidic devices, which indicates that there were fewer traps on the surface of the CdSe QDs obtained in the microfluidic devices [29]. The CdSe QDs obtained in the microtubes were superior to those obtained in the bulk reaction.
Figure 7a,b shows the HR-TEM images of CdSe QDs obtained in microfluidics devices with residence times of 15 and 60 min. Figure 7c,d show the HR-TEM images of CdSe QDs obtained via the bulk reaction with residence times of 15 and 60 min. The insets in the top left corner are lower magnifications of the HR-TEM images with a scale bar of 20 nm. The mean particle diameters in Figure 6a–d are 3.2 nm, 3.8 nm, 3.0 nm, and 3.2 nm, respectively (the size distribution diagrams are shown in the top right corner of the Figure 7). We also calculated the mean particle diameter using the empirical fitting function given in Figure 3. The values were generally consistent with the measurements from the HR-TEM images. For a residence time of 15 min, the mean diameter of the particles was more dispersed in the microfluidics than in the bulk reaction, which is consistent with the analysis of the PL spectra. We obtain larger CdSe QDs in the microfluidic devices with residence times of 15 and 60 min. This agrees well with the red shifts in the UV-visible absorption spectra.

4. Conclusions

We prepared CdSe QDs in microfluidics devices and via the bulk reaction at 180 °C using TOP and OA as surfactants. Ten different residence times were used to study the growth process of CdSe QDs. The CdSe QDs became larger when the residence time increased. We compared the properties of CdSe QDs obtained with the same reaction conditions (temperature, reactant ratio, and reaction time) in microtubes and in a bulk reaction to investigate the differences between both methods. There is a “burst” of crystal growth in the initial stage of the reaction before the growth rate gradually slows down. The difference between the microfluidic and the bulk synthesis is that the “burst” growth in the bulk reaction occurs earlier. Consequently, the CdSe QDs obtained with the microfluidic devices have a faster crystal growth rate than those obtained via the bulk reaction. We calculated the mean particle diameters using an empirical fitting function. The values obtained are geneerally consistent with the observations in the TEM images. Higher quantum yields are obtained in the microfluidic devices, which indicates fewer surface traps than for the bulk reaction. All of these elements indicate that the microfluidic method is superior to the bulk method to synthesize CdSe QDs.

Author Contributions

Conceptualization, L.Z. and X.G.; Data curation, J.L. and Q.W.; Formal analysis, Y.G. and X.W.; Funding acquisition, X.G.; Investigation, J.L.; Methodology, J.L.; Project administration, X.G.; Resources, J.L., Y.G., and Q.W.; Software, Y.G.; Supervision, L.Z. and X.G.; Validation, J.L. and Y.G.; Visualization, J.L., Y.G., and R.T.; Writing—original draft, J.L.; Writing—review and editing, A.d., W.W., and X.G.

Funding

This research was funded by the Shanghai Pujiang Program (17PJ1402800) and the National Natural Science Foundation of China (21775101).

Acknowledgments

This work was sponsored by the Shanghai Pujiang Program (17PJ1402800) and the National Natural Science Foundation of China (21775101).

Conflicts of Interest

The authors declare no conflict of interest.

References

  1. Bally, M.; Vörös, J. Nanoscale labels: Nanoparticles and liposomes in the development of high-performance biosensors. Nanomedicine 2009, 4, 447–467. [Google Scholar] [CrossRef] [PubMed]
  2. Gao, X.; Cui, Y.; Levenson, R.M.; Chung, L.W.K.; Nie, S. In vivo cancer targeting and imaging with semiconductor quantum dots. Nat. Biotechnol. 2004, 22, 969. [Google Scholar] [CrossRef] [PubMed]
  3. Sun, C.; Lee, J.S.H.; Zhang, M. Magnetic nanoparticles in MR imaging and drug delivery. Adv. Drug Deliv. Rev. 2008, 60, 1252–1265. [Google Scholar] [CrossRef] [PubMed] [Green Version]
  4. Tada, H.; Kiyonaga, T.; Naya, S.I. Rational design and applications of highly efficient reaction systems photocatalyzed by noble metal nanoparticle-loaded titanium(iv) dioxide. Chem. Soc. Rev. 2009, 38, 1849–1858. [Google Scholar] [CrossRef] [PubMed]
  5. Kumar, S.; Scholes, G.D. Colloidal nanocrystal solar cells. Microchim. Acta 2008, 160, 315–325. [Google Scholar] [CrossRef]
  6. Gur, I.; Fromer, N.A.; Geier, M.L.; Alivisatos, A.P. Air-stable all-inorganic nanocrystal solar cells processed from solution. Science 2005, 310, 462. [Google Scholar] [CrossRef] [PubMed]
  7. Shirasaki, Y.; Supran, G.J.; Bawendi, M.G.; Bulović, V. Emergence of colloidal quantum-dot light-emitting technologies. Nat. Photonics 2012, 7, 13. [Google Scholar] [CrossRef]
  8. Smyder, J.A.; Krauss, T.D. Coming attractions for semiconductor quantum dots. Mater. Today 2011, 14, 382–387. [Google Scholar] [CrossRef]
  9. Peng, X.; Manna, L.; Yang, W.; Wickham, J.; Scher, E.; Kadavanich, A.; Alivisatos, A.P. Shape control of CdSe nanocrystals. Nature 2000, 404, 59. [Google Scholar] [CrossRef]
  10. Owen, J.S.; Chan, E.M.; Liu, H.; Alivisatos, A.P. Precursor conversion kinetics and the nucleation of cadmium selenide nanocrystals. J. Am. Chem. Soc. 2010, 132, 18206–18213. [Google Scholar] [CrossRef]
  11. Lin, Y.W.; Hsieh, M.M.; Liu, C.P.; Chang, H.T. Photoassisted Synthesis of CdSe and Core-Shell CdSe/CdS Quantum Dots. Langmuir 2005, 21, 728–734. [Google Scholar] [CrossRef] [PubMed]
  12. Manna, L.; Scher, E.C.; Alivisatos, A.P. Synthesis of Soluble and Processable Rod-, Arrow-, Teardrop-, and Tetrapod-Shaped CdSe Nanocrystals. J. Am. Chem. Soc. 2000, 122, 12700–12706. [Google Scholar] [CrossRef]
  13. Dai, Q.; Kan, S.; Li, D.; Jiang, S.; Chen, H.; Zhang, M.Z.; Gao, S.Y.; Nie, Y.G.; Lu, H.L.; Qu, Q.L.; et al. Effect of ligands and growth temperature on the growth kinetics and crystal size of colloidal CdSe nanocrystals. Mater. Lett. 2006, 60, 2925–2928. [Google Scholar] [CrossRef]
  14. He, R.; Gu, H.C. Synthesis and characterization of mondispersed CdSe nanocrystals at lower temperature. Colloids Surf. A Physicochem. Eng. Asp. 2006, 272, 111–116. [Google Scholar] [CrossRef]
  15. Wang, C.; Jiang, Y.; Chen, L.L.; Li, S.Y.; Li, G.H.; Zhang, Z.P. Temperature dependence of optical properties and size tunability CdSe quantum dots via non-TOP synthesis. Mater. Chem. Phys. 2009, 116, 388–391. [Google Scholar] [CrossRef]
  16. Nakamura, H.; Tashiro, A.; Yamaguchi, Y.; Miyazaki, M.; Watari, T.; Shimizua, H.; Maeda, H. Application of a microfluidic reaction system for CdSe nanocrystal preparation: Their growth kinetics and photoluminescence analysis. Lab Chip 2004, 4, 237–240. [Google Scholar] [CrossRef] [PubMed]
  17. Chan, E.M.; Mathies, R.A.; Alivisatos, A.P. Size-controlled growth of cdse nanocrystals in microfluidic reactors. Nano Lett. 2003, 3, 199–201. [Google Scholar] [CrossRef]
  18. Talapin, D.V.; Rogach, A.L.; Mekis, I.; Haubold, S.; Kornowski, A.; Haase, M.; Weller, H. Synthesis and surface modification of amino-stabilized CdSe, CdTe and InP nanocrystals. Colloids Surf. A Physicochem. Eng. Asp. 2002, 202, 145–154. [Google Scholar] [CrossRef]
  19. Tian, Z.; Shao, M.; Zhao, X.; Wang, Y.; Wang, K.; Xu, J. Morphologies control of cdse nanoparticles via two-step segmented microreactors. Cryst. Growth Des. 2018, 18, 3953–3958. [Google Scholar] [CrossRef]
  20. Liu, W.; Zhang, Y.; Wang, C.F.; Chen, S. Fabrication of highly fluorescent CdSe quantum dots via solvent-free microfluidic spinning microreactors. RSC Adv. 2015, 5, 107804. [Google Scholar] [CrossRef]
  21. Pang, Q.; Zhao, L.; Cai, Y.; Nguyen, D.; Regnault, N.; Wang, N.; Yang, S.; Ge, W.; Ferreira, R.; Bastard, G.; et al. CdSe Nano-tetrapods: Controllable Synthesis, Structure Analysis, and Electronic and Optical Properties. Chem. Mater. 2005, 17, 5263–5267. [Google Scholar] [CrossRef]
  22. Yu, W.; Qu, L.; Guo, W.; Peng, X. Experimental Determination of the Extinction Coefficient of CdTe, CdSe, and CdS Nanocrystals. Chem. Mater. 2003, 15, 2854–2860. [Google Scholar] [CrossRef]
  23. Zhao, Y.; Shum, H.C.; Chen, H.; Adams, L.L.A.; Gu, Z.; Weitz, D.A. Microfluidic generation of multifunctional quantum dot barcode particles. J. Am. Chem. Soc. 2011, 133, 8790–8793. [Google Scholar] [CrossRef]
  24. Wang, X.H.; Liu, J.F.; Wang, P.Z.; DeMello, A.; Feng, L.Y.; Zhu, X.L.; Wen, W.J.; Kodzius, R.; Gong, X.Q. Synthesis of Biomaterials Utilizing Microfluidic Technology. Genes 2018, 9, 283. [Google Scholar] [CrossRef]
  25. Liu, Y.; Jiang, X.Y. Why microfluidics? Merits and trends in chemical Synthesis. Lab Chip 2017, 17, 3960–3978. [Google Scholar] [CrossRef]
  26. Jasieniak, J.; Smith, L.; van Embden, J.; Mulvaney, P.; Califano, M. Re-examination of the Size-Dependent Absorption Properties of CdSe Quantum Dots. J. Phys. Chem. C 2009, 113, 19468–19474. [Google Scholar] [CrossRef]
  27. Luan, W.; Yang, H.; Tu, S.; Wang, Z. Open-to-air synthesis of monodisperse CdSe nanocrystals via microfluidic reaction and its kinetics. Nanotechnology 2007, 18, 175603. [Google Scholar] [CrossRef]
  28. Porres, L.; Holland, A.; Palsson, L.O.; Monkman, A.P.; Kemp, C.; Beeby, A. Absolute Measurements of Photoluminescence Quantum Yields of Solutions Using an Integrating Sphere. J. Fluoresc. 2006, 16, 2. [Google Scholar] [CrossRef]
  29. Pu, C.D.; Qin, H.Y.; Gao, Y.; Zhou, J.H.; Wang, P.; Peng, X.G. Synthetic Control of Exciton Behavior in Colloidal Quantum Dots. J. Am. Chem. Soc. 2017, 139, 3302–3311. [Google Scholar] [CrossRef]
Figure 1. (a) Schematic diagram of the bulk reaction and (b) of the microfluidics procedure.
Crystals 09 00368 g001
Figure 2. (a) UV-visible absorption spectra of CdSe quantum dots (QDs) synthesized via a bulk reaction and (b) in a polytetrafluoroethylene (PTFE) microtube for (c) residence times from 3 to 60 min showing the evolution of the wavelength of the first absorption peak with the residence time in the microfluidic reactor (red) and in the bulk reaction (black). The dotted regions indicate the fastest red shifts. (d) Photograph of the reaction devices.
Crystals 09 00368 g002
Figure 3. Evolution of the predicted mean particle diameter of the CdSe QDs with the residence time calculated by an empirical fitting function. The QDs were obtained in the microfluidics devices or via the bulk reaction.
Crystals 09 00368 g003
Figure 4. (a) Photoluminescence (PL) spectra of CdSe QDs synthesized in a PTFE microtube and (b) via a bulk reaction with residence times from 3 to 60 min. The excitation wavelength was 440 nm. (c) Evolution of the peak wavelength in the PL spectra with the residence time in the microfluidics devices and in the bulk reaction. (d) Evolution of the full width at half maximum (FWHM) of the PL peak with the residence time in the microfluidics devices and via the bulk reaction.
Crystals 09 00368 g004
Figure 5. Optical images of CdSe QDs solution obtained with (a) microfluidic devices and (b) via bulk reaction under a 365 nm UV lamp. (c) The luminescence of the CdSe QDs solution (the orange line) and blank solution (the black line) from fluorescein collected in the integrating sphere. The inset is an enlarged part from 450 to 700 nm (the blue dotted line).
Crystals 09 00368 g005
Figure 6. X-ray powder diffraction (XRD) patterns of CdSe QDs obtained via the bulk reaction and in microfluidics devices at different residence times. The vertical red lines indicate the three strong peaks corresponding to the power diffraction file (PDF # 019–191).
Crystals 09 00368 g006
Figure 7. High-resolution transmission electron microscopy (HR-TEM) images of CdSe QDs obtained in microfluidics devices with a residence time of (a) 15 and (b) 60 min. HR-TEM images of CdSe QDs obtained via a bulk reaction with a residence time of (c) 15 and (d) 60 min. The scale bar for the top left corner insets is 20 nm. Size distribution diagrams of CdSe QDs are shown in the top right corner of the images.
Crystals 09 00368 g007
Table 1. Quantum yields of the QDs with residence times of 15 and 60 min in the microfluidic devices and in the bulk reaction, as determined by spectrofluorimetry.
MethodResidence Time (min)Absolute Quantum Yields (%)
Microfluidics151.61 ± 0.15
601.50 ± 0.13
Bulk reaction150.98 ± 0.10
600.82 ± 0.09

