1. Introduction
With the growing need for portable, wireless, or wearable electronic devices, highly efficient alternative power generation has increasingly become a necessity. In the past decade, harvesting ambient energy from environmental sources, such as vibrations, fluid flow, or thermal gradients has gained much attention. Up to now, broadband energy harvesting using piezoelectric materials from ambient vibrations based on cantilever configurations have been the main focus because they can produce high dynamic strain and are compatible to microelectromechanical systems fabrication [
1,
2,
3,
4].
Energy harvesting using sonic crystals, phononic crystals (PCs), or acoustic/elastic metamaterials based on wave focusing or wave localization have attracted increasing attention [
5,
6,
7,
8,
9]. PCs are periodic composite structures with frequency band gaps capable of forbidding elastic wave propagations [
10,
11]. Elastic metamaterials are generally structures with periodic local resonators designed to achieve sub-wavelength band gaps and non-traditional manipulations of wave propagations [
12,
13,
14]. Energy harvesting using PCs or metamaterials has been achieved at the defect modes through a resonant cavity (or an inclusion) in the airborne sound configuration or under mechanical excitation [
15,
16,
17,
18]. Here, the defect mode stands for a bandgap resonance mode which comes from the presence of mismatched unit cells. Recently, energy harvesting using a finite phononic crystal beam with a point defect was investigated considering thermal effects, but without experimental validations [
9]. In fact, defect modes are one of the important characteristics of imperfect periodic structures that have the potential to be used for energy harvesting due to their capability of localizing sound or elastic waves around the defects [
19,
20,
21,
22]. However, contrary to the airborne sound configuration, placement of the point defect in finite PCs or metamaterials under mechanical excitation has not been addressed [
15]. Placement of the mismatched unit cell should play an important role in energy harvesting for minimizing the influence of wave attenuation inside the frequency band gaps. Since PC beams have received great attention due to their engineering importance, the proposed energy harvesting configuration will provide another practical application for PC beams, and the experimental validations will provide useful information for future related studies of energy harvesting using sonic or phononic crystals [
14,
23,
24,
25,
26,
27].
Although propagation of elastic waves is completely forbidden inside the band gaps in ideally infinite PC beams, it is only attenuated away from the excitation point in practical finite ones. Thus, most of the flexural wave energy is locally confined in the neighborhood of the excitation point. In this work, we simultaneously combine this fact (i.e., wave confinement near the excitation source) with the characteristics of the defect modes (i.e., wave localization around the point defect) in a PC beam to achieve highly efficient bandgap energy harvesting. One of the unit cells in the PC beam has a perfect segment that is connected to the excitation source and a geometrically mismatched flexible one that is connected to the rest of the PC beam. We mainly focus on the placement of the mismatched unit cell related to the mechanical excitation point and the associated energy harvesting at the defect modes. Thus, we note that the energy harvesting is not carried out at ordinary passband resonance frequencies or compared to those of general straight beam-type energy harvesters.
In this work, energy harvesting using a typical but representative binary PC beam inside the band gaps is investigated. A polyvinylidene fluoride (PVDF) film is bonded on the mismatched flexible segment as an energy harvester. A point-wise fiber Bragg grating (FBG) displacement sensing system is set up in advance to detect the displacement transmission and determine the defect-mode frequencies. We will demonstrate that the combination of wave confinement near the excitation point and the localization of the flexural waves at the defect modes enable highly localized, less attenuated, and efficient energy harvesting.
2. Piezoelectric Energy Harvesting
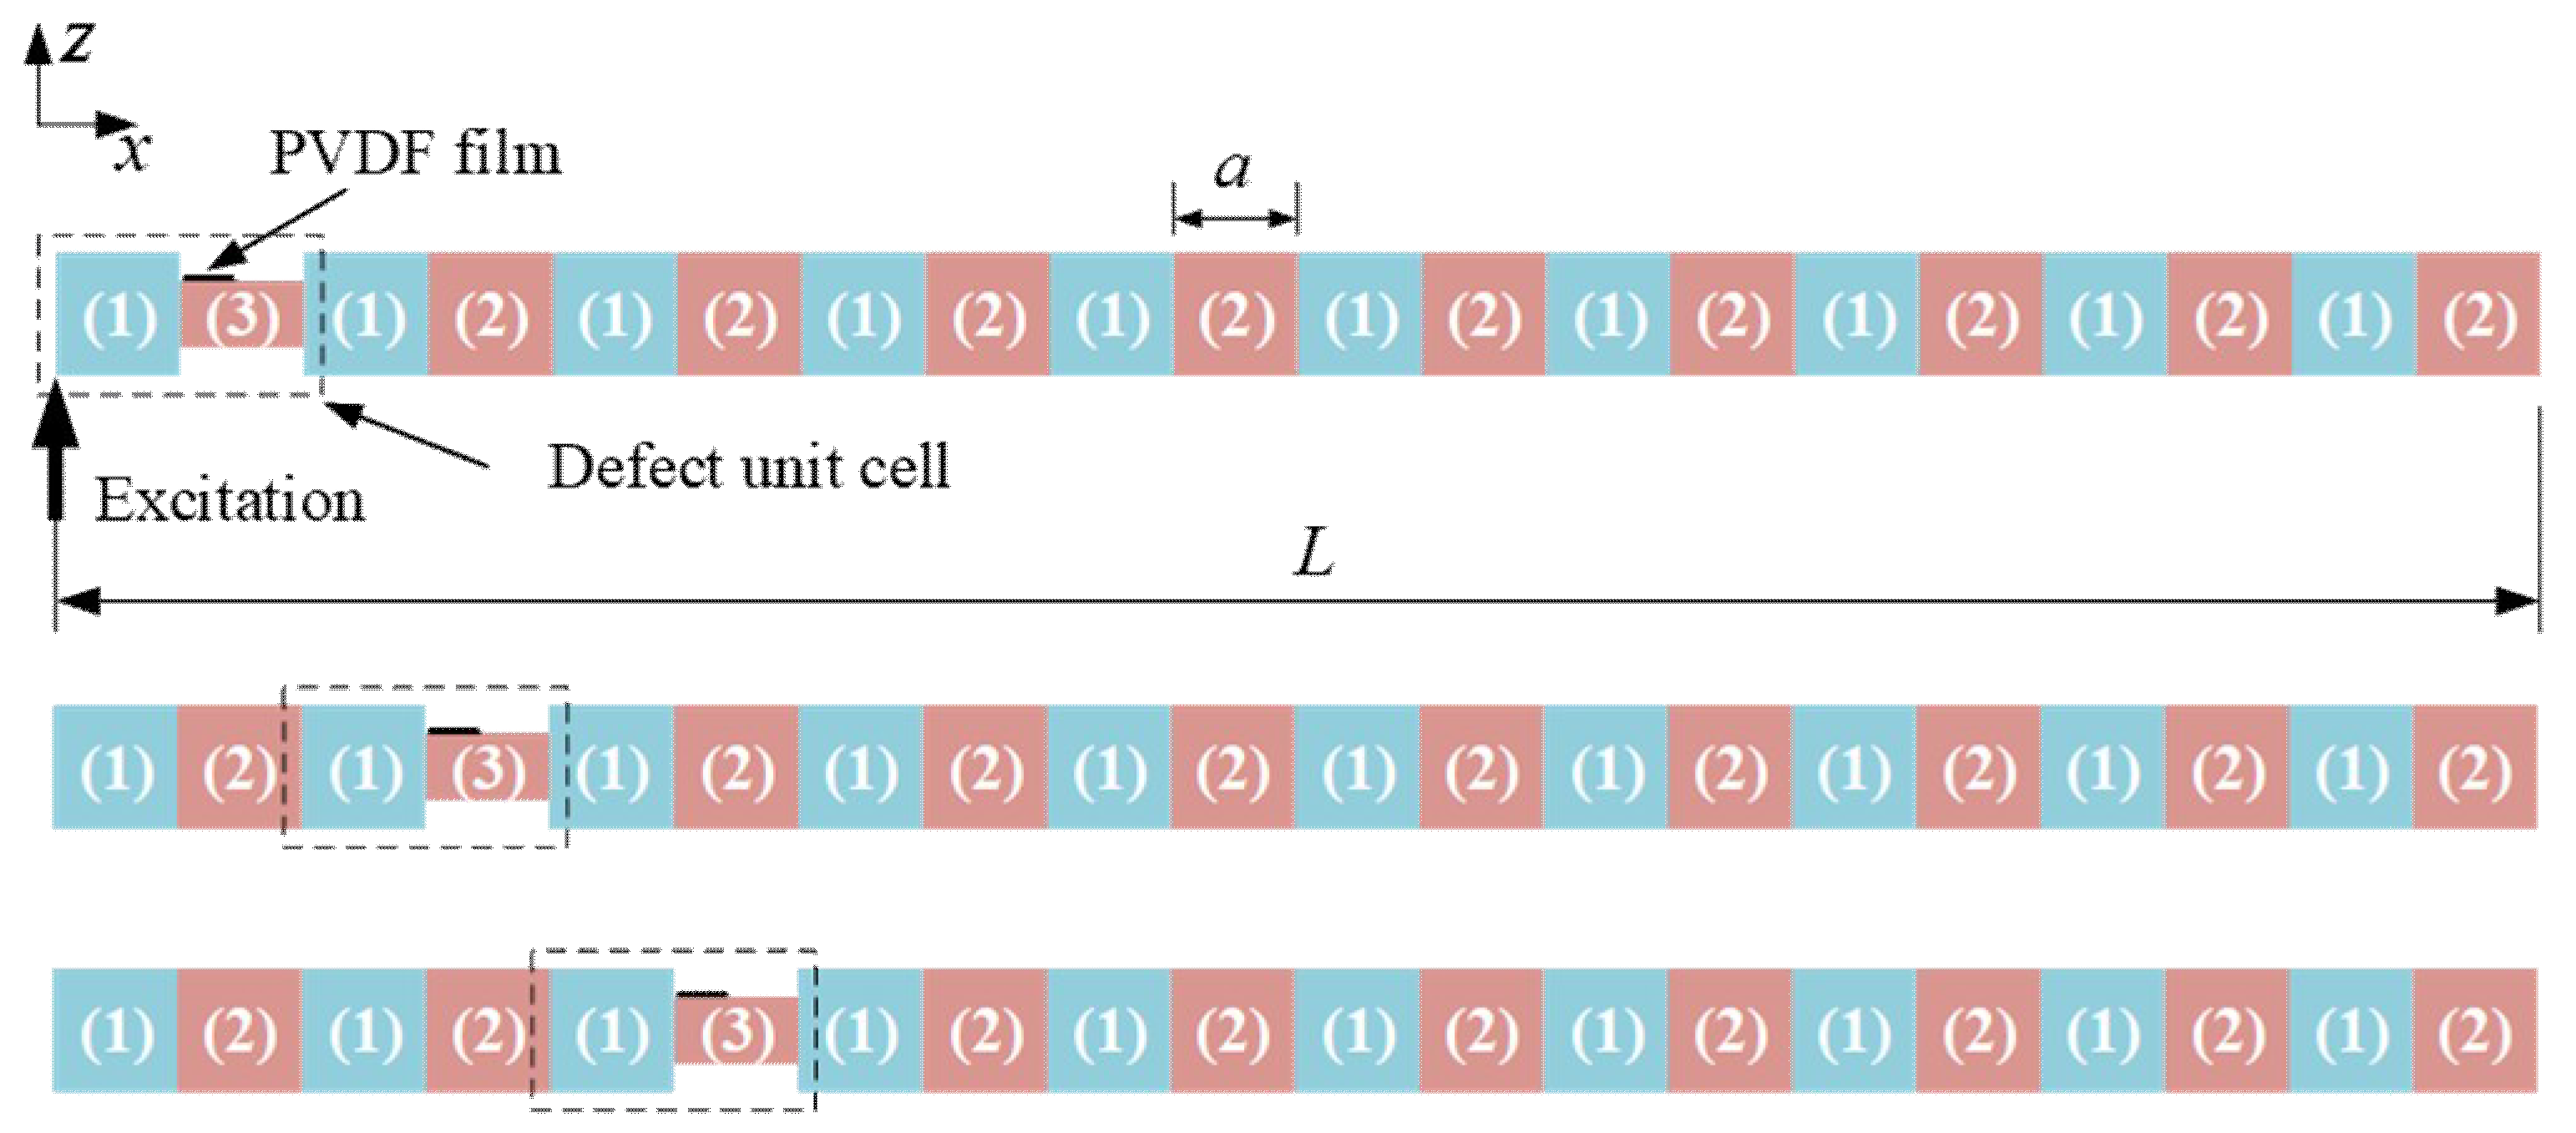
Figure 1 shows a finite binary PC beam containing 10 unit cells made of two different materials (1) and (2). The material of the segment marked as (3) is the same as that of the segment (2), but segment (3) has a lower height to represent a geometrically mismatched segment. We considered three placement conditions of the mismatched unit cell with respect to the excitation point.
We attached the easily-deformed PVDF film on the mismatched segment close to the excitation point as an energy harvester, as shown in
Figure 1. The electrical displacement (i.e., charge density) is expressed by the piezoelectric constitutive relations as follow:
where
εx is the strain on the mismatched segment along the beam,
d31 is the piezoelectric constant in the 31 coupling direction,
Y is Young’s modulus of the PVDF film,
ε33 is the dielectric constant, and
E3 is the transverse electric field in the PVDF. The collected electric charge on the electrode surface can be expressed as the integral of the electrical displacement over the area of the surface as follows:
where
bt is the width of the PVDF. Assuming a uniform electrical field, the charge collected on the electrode surface can be expressed as [
28]
where
U is the potential difference,
lt is the length of the PVDF film,
is the average strain over the surface of the piezoelectric layer, and
Cp is the capacitance expressed by
where Δ is the thickness of the piezoelectric layer. The root mean square amplitude of the output harmonic steady-state voltage can be determined as
where
RL is the external load resistance. The time-average of the output power of the PVDF film dissipated in the resistive load can be expressed by multiplication of the voltage and current flow (i.e.,
I = ωQ) as
Clearly, the output power is a function of the external load resistance
RL, the excitation frequency
ω, the average dynamic strain
of the mismatched segment, the piezoelectric constants, and dimensions of the energy harvester. The maximum value of the output power can be obtained by selecting the external load resistance as [
16].
which is related to the excitation frequency and the capacitance of the PVDF film.
In our modeling for energy harvesting, PVDF is assumed to have weak electromechanical coupling, in which converse coupling is neglected. The generated power is a quadratic function of the dynamic strain. Thus, the optimum placement of the PVDF film is related to the distribution of the dynamic strain field. It should be noted that the optimal size of the PVDF is not the focus in this work since for the considered defect mode, it only vibrates in the first bending mode and the harvested power will not be averaged out.
As shown in
Figure 1, a PC beam having a mismatched unit cell (i.e., containing a perfect and a geometrically mismatched segment) placed in three different locations is considered. Each unit cell has two segments made of 6061 aluminum (i.e., material (1)) and acrylic (PMMA, material (2)). Each of the two materials has a size of 0.08 m (length)
0.015 m (width)
0.015 m (height). The height of the point defect (i.e., marked as (3) with the same material as (2), PMMA) is 0.008 m, and the other dimensions of the point defect are the same as the other segments. The local mismatched segment with a lower flexural rigidity serves as a perturbation to a perfect PC beam. For convenience, we, respectively, name the three PC beams as EHPC1, EHPC2, and EHPC3, in which “E” denotes energy and “H” denotes harvesting. A PVDF film energy harvester is attached on the top surface of the mismatched segment near the boundary between it and another segment in the first, second, and third unit cells of EHPC1, 2, and 3. The attachment of the PVDF film on EHPC1 is illustrated in
Figure 1.
To validate the defect mode-based wave localization in the three PC beams, we calculate the flexural displacement transmission (denoted as frequency response function (FRF) in the following figures) using the finite element method (FEM). The displacement transmission is obtained by calculating , where and are, respectively, the line-average (along the width of the beam) displacement amplitudes at the two ends of the PC beam. In FEM simulations, the elastic constants of the materials are ρ1 = 2735 kg/m3, E1 = 74.7 GPa, ρ2 = 1142 kg/m3, and E1 = 4.5 GPa. The Poisson’s ratios of the two materials are both 0.33. The damping is modeled in terms of a structural loss factor of 0.001 for aluminum and 0.01 for PMMA. A 1.74 μm vertical excitation (along the width of the beam) is given in the simulation.
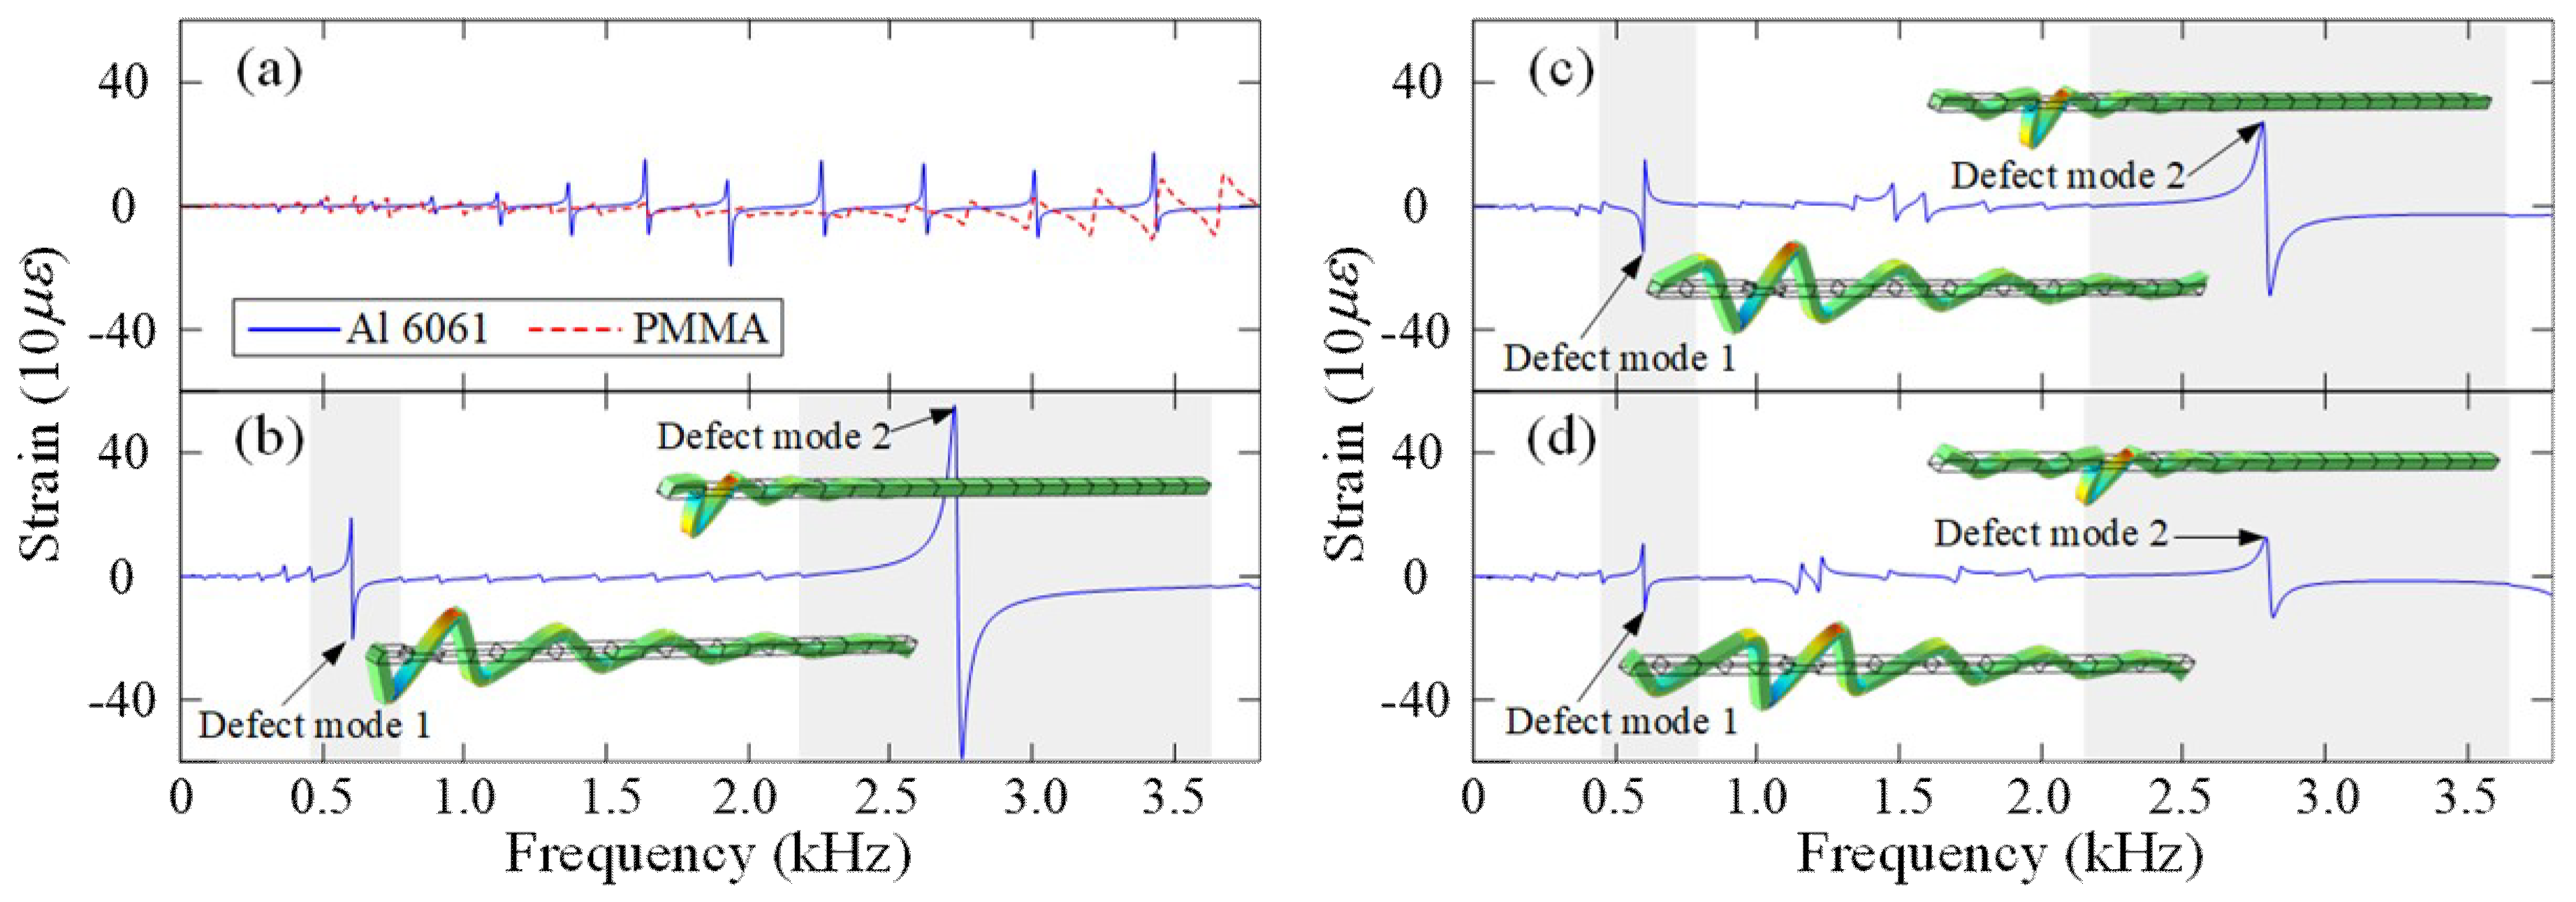
From
Figure 2a we can see that, after arranging a mismatched segment, the defect mode occurs in the band gaps. The passband resonance modes are in general larger than 0 dB in the displacement transmission. Although the considered PC beam is also truncated from an ideally infinite PC beam, we note that the defect modes are different from the truncation modes or surface modes in that wave will be localized around the mismatched unit cell at the frequency of the defect mode [
29,
30,
31]. The insets in
Figure 2a show the predicted output voltage around the two band gaps when an external load resistance of 500 kΩ is applied in the FEM simulation using the module “Piezoelectric Devices” in COMSOL MULTIPHYSICS. The PVDF film has a size of 0.0147 m (length)
0.01 m (width)
28 μm (thickness). To understand the behavior of the PVDF, the material constants of the PVDF are taken from the COMSOL database. We can see that, even compared with the resonance frequencies at the edges of the band gaps, the harvested voltage reaches the maximum when the PC beam is excited at the defect mode. The most efficient energy harvesting is obtained using the EHPC1 beam, where, in addition to the defect-mode wave localization, the elastic wave is less attenuated. To further gain insights into the less-attenuated defect-mode based energy harvesting, full-field strain distribution at the two defect modes of the defect and perfect PC beam are shown in
Figure 2b,c, respectively. A non-smooth strain field distribution is observed due to the material discontinuities (i.e., impedance mismatch). The strains in the softer PMMA segments are larger than those in the harder aluminum segments. We can see that the mismatched segment possesses the largest dynamic strain compared to the other segments when the PC beam is excited at the defect modes.
One might think that the introduced mismatch segment acts as a local damage, and the variation of strain distribution must be sensitive according to the concept of damage detection. It is true that the strain mode shapes are sensitive to local damages. However, in PC beams, the mismatched flexible segment possesses higher strain mainly due to the confinement of flexural waves at the defect modes and the conditions of Bragg scattering. As an illustration, the displacement vibration shape and the strain distribution of the three PC beams (i.e., EHPC1, 2, 3) and two homogeneous beams with a thinner segment as that of the mismatched segment in the PC beam are simulated using the FEM, and the results are shown in
Figure 3. All the strain responses are obtained at the same point on the mismatched segment, which is one third the length of the PVDF film and close to the discontinuity boundary. Although the strain responses are all obtained at the same point, the strain responses obtained from the PC beam are much larger than those obtained from the homogeneous beams, as shown in
Figure 3. In addition, as the mismatched segment moves away from the excitation point (i.e., EHPC2 and EHPC3), the strain magnitude and their difference between the first and the second defect modes become significantly smaller compared to that of EHPC1. The difference of the strain magnitude between the defect mode and the passband resonance modes also becomes less obvious when the mismatched segment moves away from the excitation point. The strain magnitude shown in
Figure 3 agrees with the predictions of the output voltage shown in
Figure 2a.
In
Figure 3 we observe that the defect modes behave similarly (e.g., similar larger local displacement shapes and strain distribution) and the vibrations in the other end of the PC beam are strongly attenuated because the defect modes still lie in the band gaps. In addition, from
Figure 3, we can see that the magnitude of the dynamic strain distribution in the second defect mode around the mismatched segment is much larger than that in the first defect mode. This is because the second defect mode lies in a band gap deeper and wider than the first band gap where the first defect mode exists, as shown in
Figure 2a. Thus, under the same vibration excitation condition, the input energy is more highly localized in the second defect mode.
Figure 3 also suggests higher harvested power from the second defect mode, which will be confirmed later by our experiment results on energy harvesting. Note that for higher-order defect modes with even shorter wavelengths, the harvested voltage or power on the PVDF film might not be high since the short-wavelength strain might be averaged out in the PVDF film.
We further study the dependence of the harvested voltage.
Figure 4a shows the simulated output voltage when the mismatched segment has different thicknesses. We see that the harvested voltage first increases then decreases when the thickness is varied from 12 mm to 6 mm. Thus, a moderate perturbation in the segment, instead of large impedance mismatching, is beneficial to the energy harvesting. The proposed PC beam has a thickness of 8 mm. In fact, a defect mode caused by a low-rigidity mismatched segment in a binary PC beam is in essential a shift of a resonance frequency from the upper (or lower for a high-rigidity mismatched segment) bandgap edge [
32]. If the impedance difference of the constituent segments in the mismatched unit cell increases, the defect mode might largely shift to be close to the lower edge of the band gap and the wave localization at the defect mode might thus be minimized. Since the damping of the bonding material might affect the harvested output voltage, we further introduce damping at the bottom of the PVDF, and the damping is modeled as a loss factor
ξ, as shown in
Figure 4b. We see that the damping of the bonding layer will decrease the output voltage when the PC beam is excited at the defect mode. In
Figure 4c, for EHPC1 beam, we change the external load resistance and observe the variation of the output power and voltage. The results indicate that the harvested voltage increases as the external load resistance increases. The harvested power first increases and then decreases after passing the optimized external load resistance 750 kΩ, where the trend and the optimized resistance agree with the theoretical predictions in Equations (6) and (7).
The possible combination of the wave confinement in the neighborhood of the excitation point and the wave localization around the point defect might cause the misunderstanding that the best placement of the geometrically mismatched segment is exactly at the excited point of the PC beam, where the excited flexural wave always reaches the largest magnitude without being strongly attenuated by Bragg scattering. However, if the mismatched segment is the first segment being excited by the excitation source, it only serves as a dissipative material that weakens the excitation magnitude instead of a part of the PC beam and does not contribute to the formation of the defect modes. To show the wrong idea of placing segment (3) adjacent to the excitation source, we compare the location of segment (3) in displacement transmission and energy harvesting as shown in
Figure 4d. When segment (3) is located adjacent to the excitation, despite being less attenuated by Bragg scattering, segment (3) only serves as a part of the weakened excitation, and the PC beam behaves as defect-free because segment (3) is softer than the adjacent segment (1). Thus, when considering the placement of the point defect and the localization of flexural waves at the defect modes, the lower rigidity segment is suggested to be arranged as the second segment in the first unit cell that is connected to the excitation source.
3. Experimental Validations
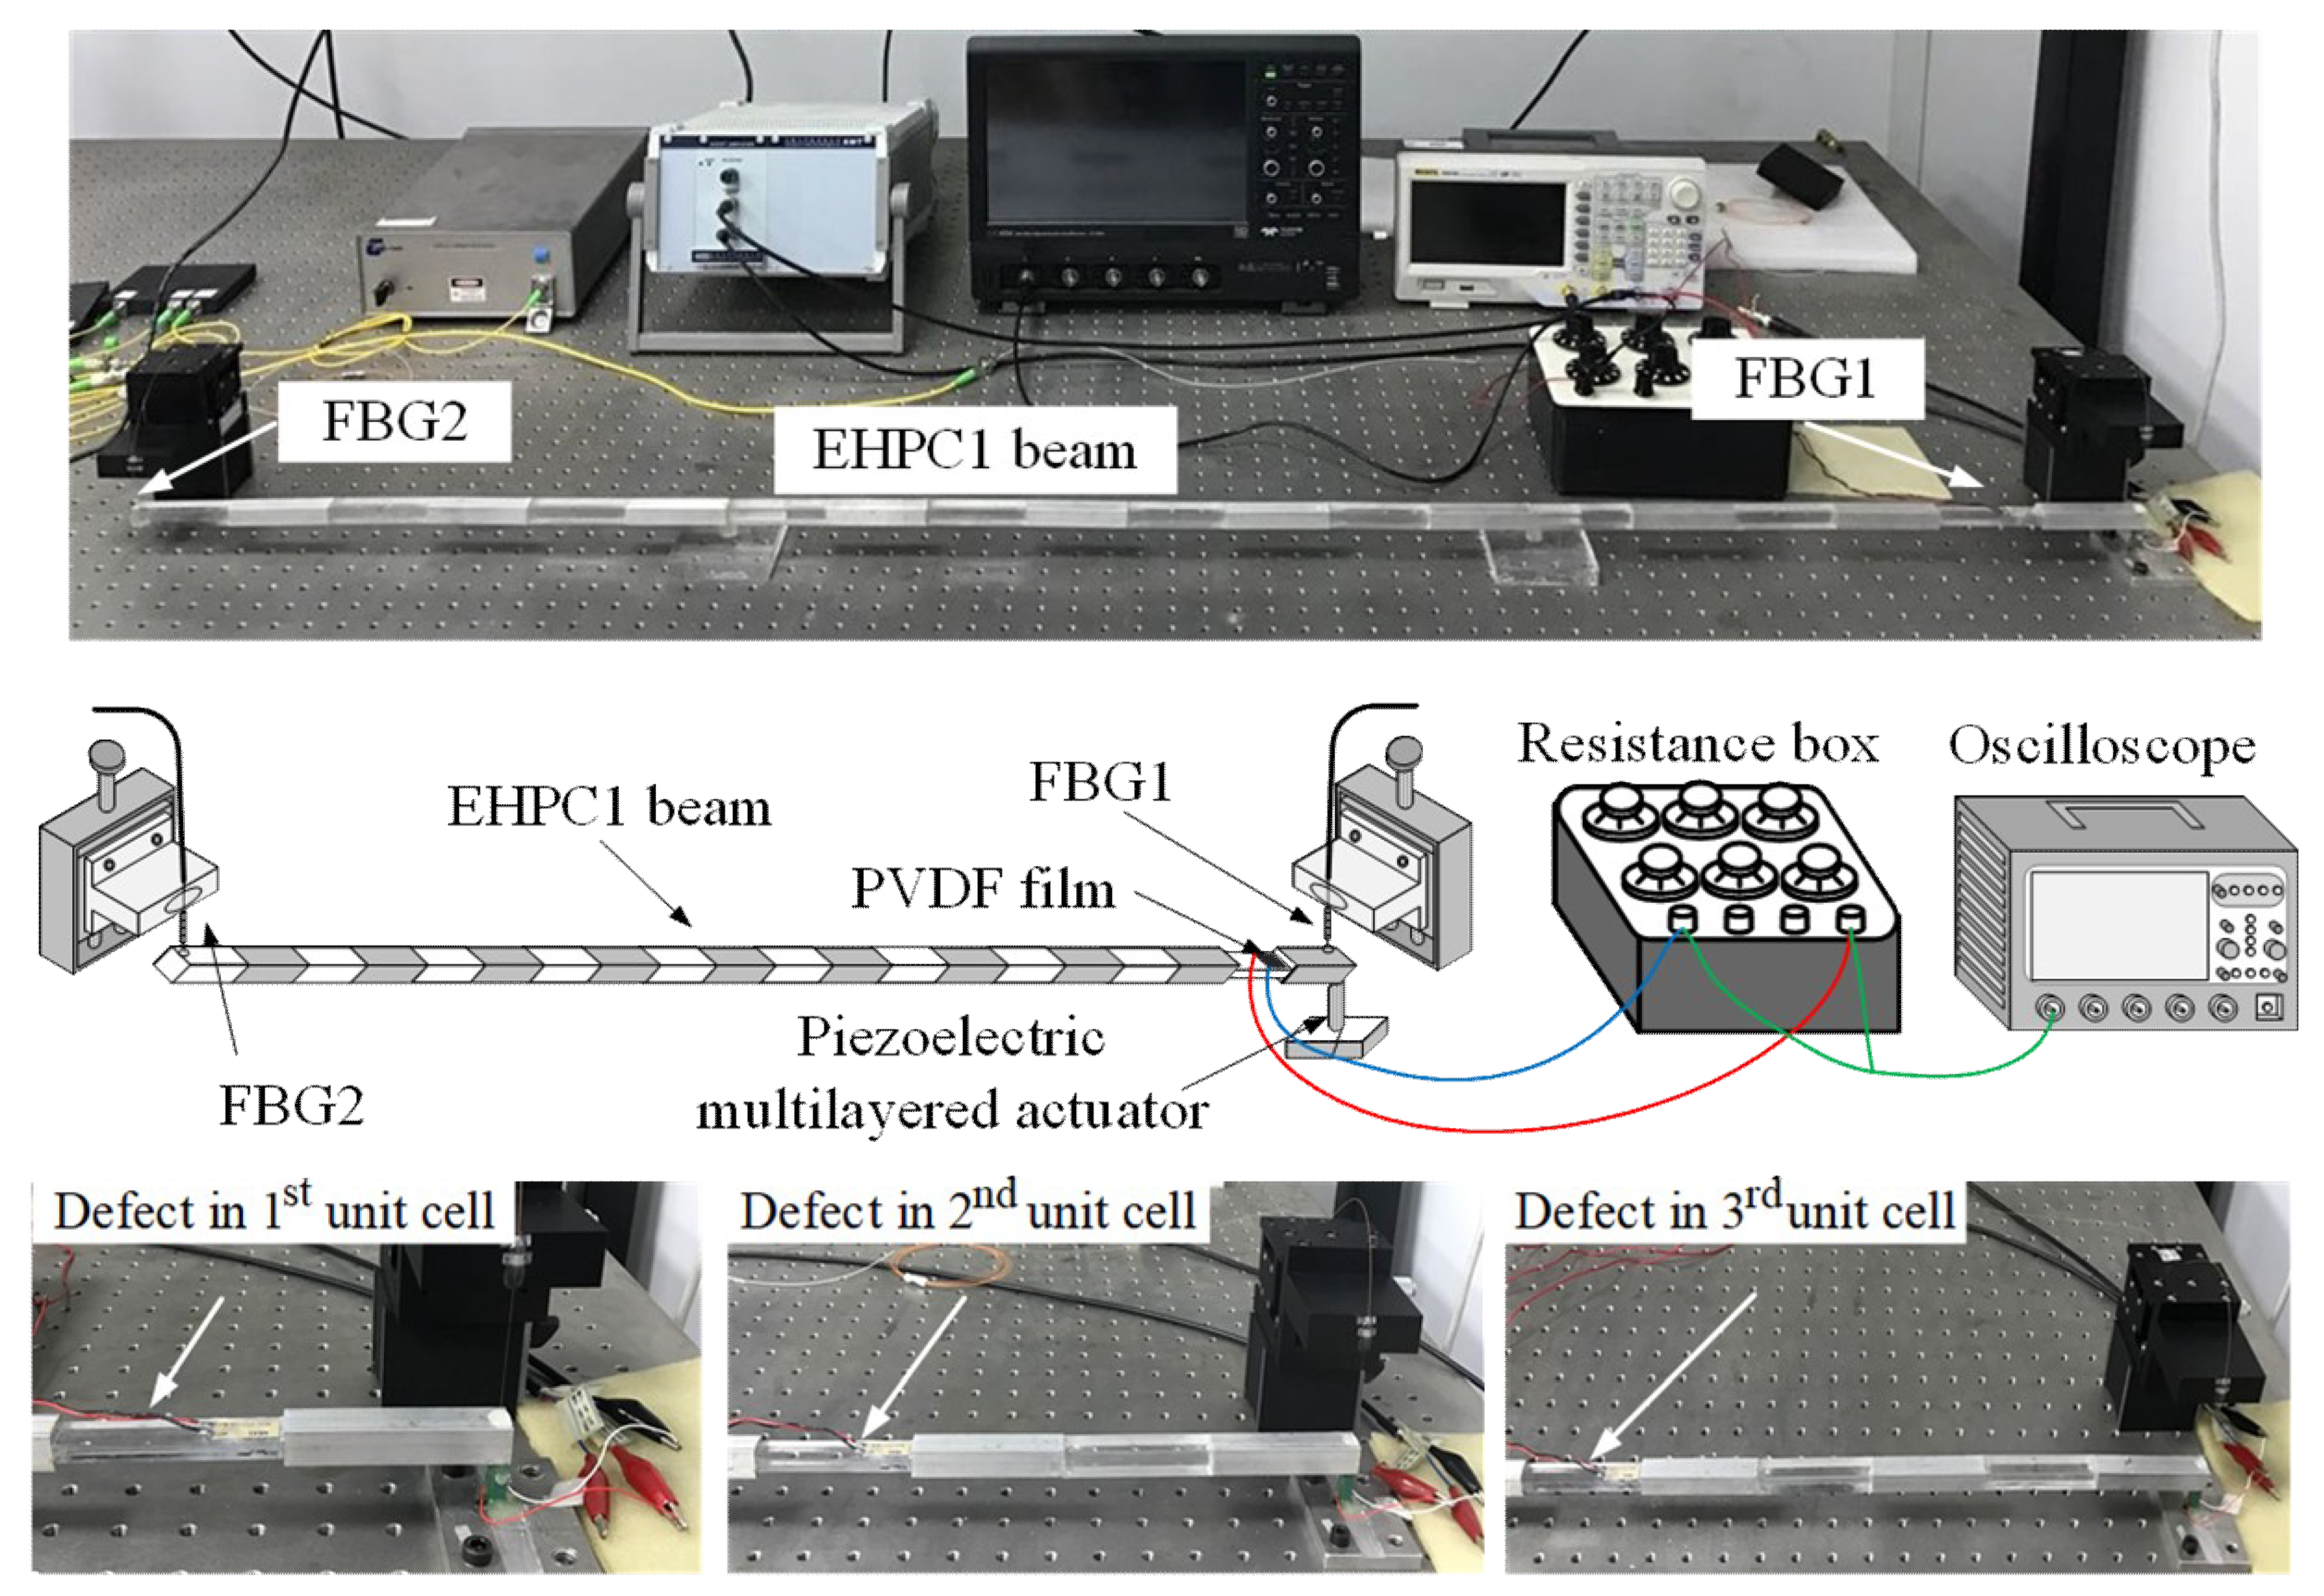
Before validating the defect mode-based energy harvesting experimentally, we employed a high-sensitive fiber Bragg grating (FBG) displacement sensing system (as shown in
Figure 5) to directly detect the defect modes in the displacement transmission [
32]. The FBG displacement sensing system contains two FBG displacement sensors, located at the two extreme ends of the PC beam. White noise random signals, generated by the Simulink (The MathWorks, Natick, MA) and the dSPACE DS1104 system, are sent to a piezoelectric multilayered actuator through a power amplifier with a sampling frequency 50 kHz to excite flexural wave propagation. The displacement transmission is then obtained using a stochastic spectral estimation. The experimental transmissions of the three PC beams (i.e., EHPC1, 2, and 3), extracted from the responses of FBG2 (output sensor) and FBG1 (input sensor), are, respectively, shown in
Figure 6a–c. The experimental results are compared with those obtained by the FEM simulations, where for clear observation the experimental transmission is shifted by −10 dB.
From
Figure 6, we can see that the regions of the band gaps and the pass bands are almost the same for the three PC beams with different placements of the mismatched segment. The simulated and measured band gaps and the defect modes in the three PC beams are listed in
Table 1. The experimentally identified defect modes in the first two band gaps are indicated in the corresponding displacement transmission in
Figure 6. From
Figure 6 and
Table 1, we can see that the displacement transmissions obtained from the FBG experiments and FEM simulations agree well with each other. Note that the good agreements between the trends of the resonance peaks in the pass bands, band gaps, and defect modes also indicate an excellent dynamic measurement capability of the FBG displacement sensing system.
From
Table 1 we see that, despite different locations of the mismatched segment, the frequency ranges of the band gaps and the frequencies of the defect modes are close to each other in the three PC beams. For example, in the experimental results, the first defect modes in the three PC beams are, respectively, 615 Hz, 588 Hz, and 590 Hz. As for the second defect modes, they are, respectively, 2688 Hz, 2707 Hz, and 2732 Hz. The discrepancies between the experimental drifts of the band gaps (or the defect modes) and the numerical results are within 3%.
Then, the defect mode-based wave localization was applied for energy harvesting using PVDFs (LDT0-028K, Measurement Specialties, Inc., Wayne, PA), having the same dimensions as those in the previous simulations. As illustrated in
Figure 5, the PVDF film is attached to the mismatched segment near the edge. We will compare the harvested voltage and power using the three PC beams.
The harvested output power is related to the external load resistance. According to Equation (7), the optimal external load resistances for obtaining maximum output power using EHPC1 for the first defect mode (i.e., 615 Hz) is 517.6
. We experimentally compared the harvested output voltage and output power using the three designed PC beams by adjusting the optimized external load resistance through a resistance box (as shown in
Figure 5) at different frequencies around the first defect mode. The results are shown in
Figure 7a for output voltage and
Figure 7b for output power, respectively. Since the highest output power can be obtained in EHPC1 compared to that in EHPC2 and EHPC3, the less-attenuated defect mode-based wave localization is validated.
According to Equation (6), under the same strain distribution, the harvested output power increases as the operational frequency increases. However, maximum output power (i.e., 55.4 nW) can be obtained in
Figure 7 at the first defect mode at 615 Hz. It is interesting to point out that the defect mode-based wave localization might enable efficient energy harvesting even being compared to that operated at passband resonance frequencies (i.e., see resonance peaks outside the gray region in
Figure 7). At the first defect mode, the maximum harvested power using EHPC2 and EHPC3 are, respectively, 20.1 nW and 14.1 nW. The decreasing of the harvested power at the defect modes, when the harvesting cell moves away from the excitation point, is expectable because the defect modes are inside the band gaps and waves are still attenuated as they propagate along each unit cell. They are, respectively, only 36.3% and 25.5% of the maximum harvested power using EHPC1. On the other hand, the harvested voltage or power at the resonance frequencies is less related to the location of the mismatched unit cell. From the experimental results in
Figure 7, we can see that the defect modes behave quite differently from the passband resonance modes in that elastic waves are highly localized but globally and spatially decay along the unit cells. Thus, the defect-mode wave localization with the consideration of the placement of the mismatched segment in finite PC beams for energy harvesting is required. In this work, we only compare the optimal placement of the harvesting cell that contains the geometrically mismatched segment. The optimal placement and size of the energy harvester on the harvesting segment are not considered. Although not being considered, we note that at the considered two defect modes, the PVDF film only vibrates in its first bending mode, and thus the strain averaging effect needs not to be considered.
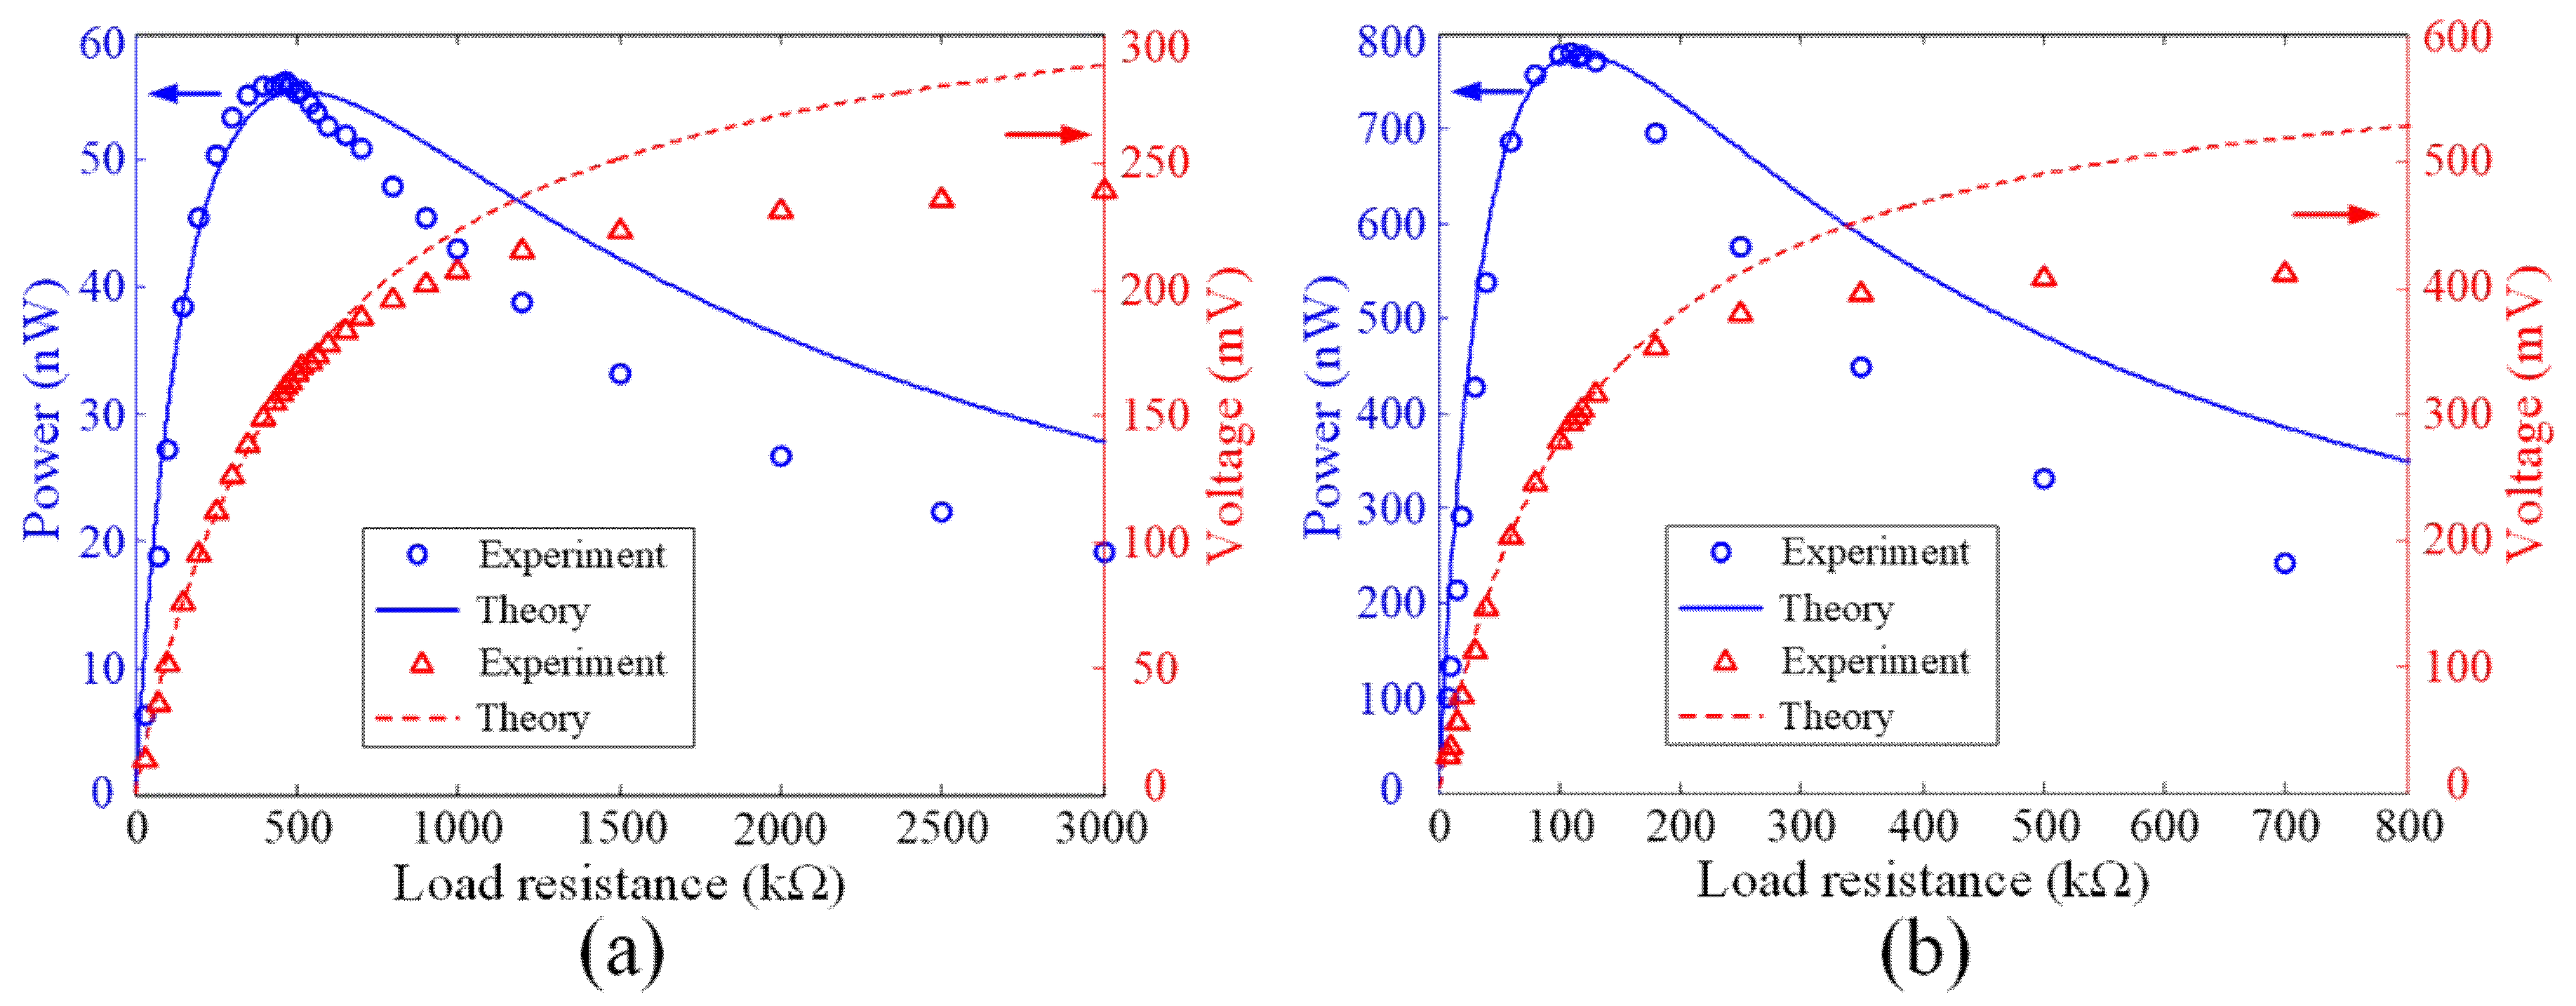
Finally, we validate the optimal load resistance for energy harvesting application. The harvested output power and voltage as a function of the external load resistance are shown in
Figure 8.
Figure 8a are the results obtained at the first defect mode (i.e., 615 Hz) and
Figure 8b are those obtained at the second defect mode (i.e., 2688 Hz) using EHPC1. From
Figure 8, we can see that the trends of the experimental results agree well with the theoretical predictions. It should be noted that the theoretical results derived through Equations (5) and (6), based on the experimental voltage with the corresponding calculated optimal load resistance, agreed with the theoretical predictions for the first defect mode at 615 Hz. The maximum output voltage and output power are, respectively, 169.4 mV and 55.4 nW. The corresponding experimental and theoretical (according to Equation (7)) optimal load resistance are, respectively, 465 kΩ and 517.6 kΩ. For the second defect mode at 2688 Hz, the maximum output voltage and output power are, respectively, 303.4mV and 777.5 nW. The corresponding experimental and theoretical optimal load resistance are, respectively, 110 kΩ and 118.4 kΩ.
Modeled as a single-degree-of-freedom (SDOF) harvester, the conversion efficiency of energy can be described as [
28]
where
kme is the modal piezoelectric coupling stiffness, and
c is the modal mechanical damping. According to Equation (8), when the external load resistance is the optimal resistance
, the highest energy conversion efficiency can be obtained for weakly electromechanical coupling with the PVDF. The conversion efficiency at low resistance is smaller than the highest efficiency, which agrees well between the theoretical and experimental results. The cross-sensitivity between the drawn and transverse directions of the PVDF film due to the anisotropy of the piezoelectric effect might attribute to the discrepancies at high frequencies.
Our experimental investigation has validated that, for a normal PC beam, one can possibly perform energy harvesting by arranging a geometrically mismatched harvesting unit cell with a lower flexural rigidity between the PC beam and the excitation point. Although the PVDF is used in this work for demonstrating energy harvesting, higher power can be achieved in practice by using the piezoceramics (PZTs) with a higher value of d31 and with larger ambient vibration source.


