Utilization of a CO2 Storage Material: Shape-Controlled Preparation of CaCO3 Microspheres
by
Xianlong Meng
1,2, 
Long Zhao
2,
Haitao Guo
3,
Feng Sha
2,
Huihu Shi
2,
Zhaojun Wu
2 and
Jianbin Zhang
1,2,* 1
Key Laboratory of Coal-based CO2 Capture and Geological Storage, China University of Mining and Technology, Xuzhou 221008, China
2
Inner Mongolia Engineering Research Center for CO2 Capture and Utilization, Hohhot 010051, China
3
Inner Mongolia Internet Information Office, Hohhot 010070, China
*
Author to whom correspondence should be addressed.
Crystals 2019, 9(8), 433; https://0-doi-org.brum.beds.ac.uk/10.3390/cryst9080433
Submission received: 30 July 2019
/
Revised: 13 August 2019
/
Accepted: 16 August 2019
/
Published: 20 August 2019
(This article belongs to the Section Crystalline Materials)
Abstract
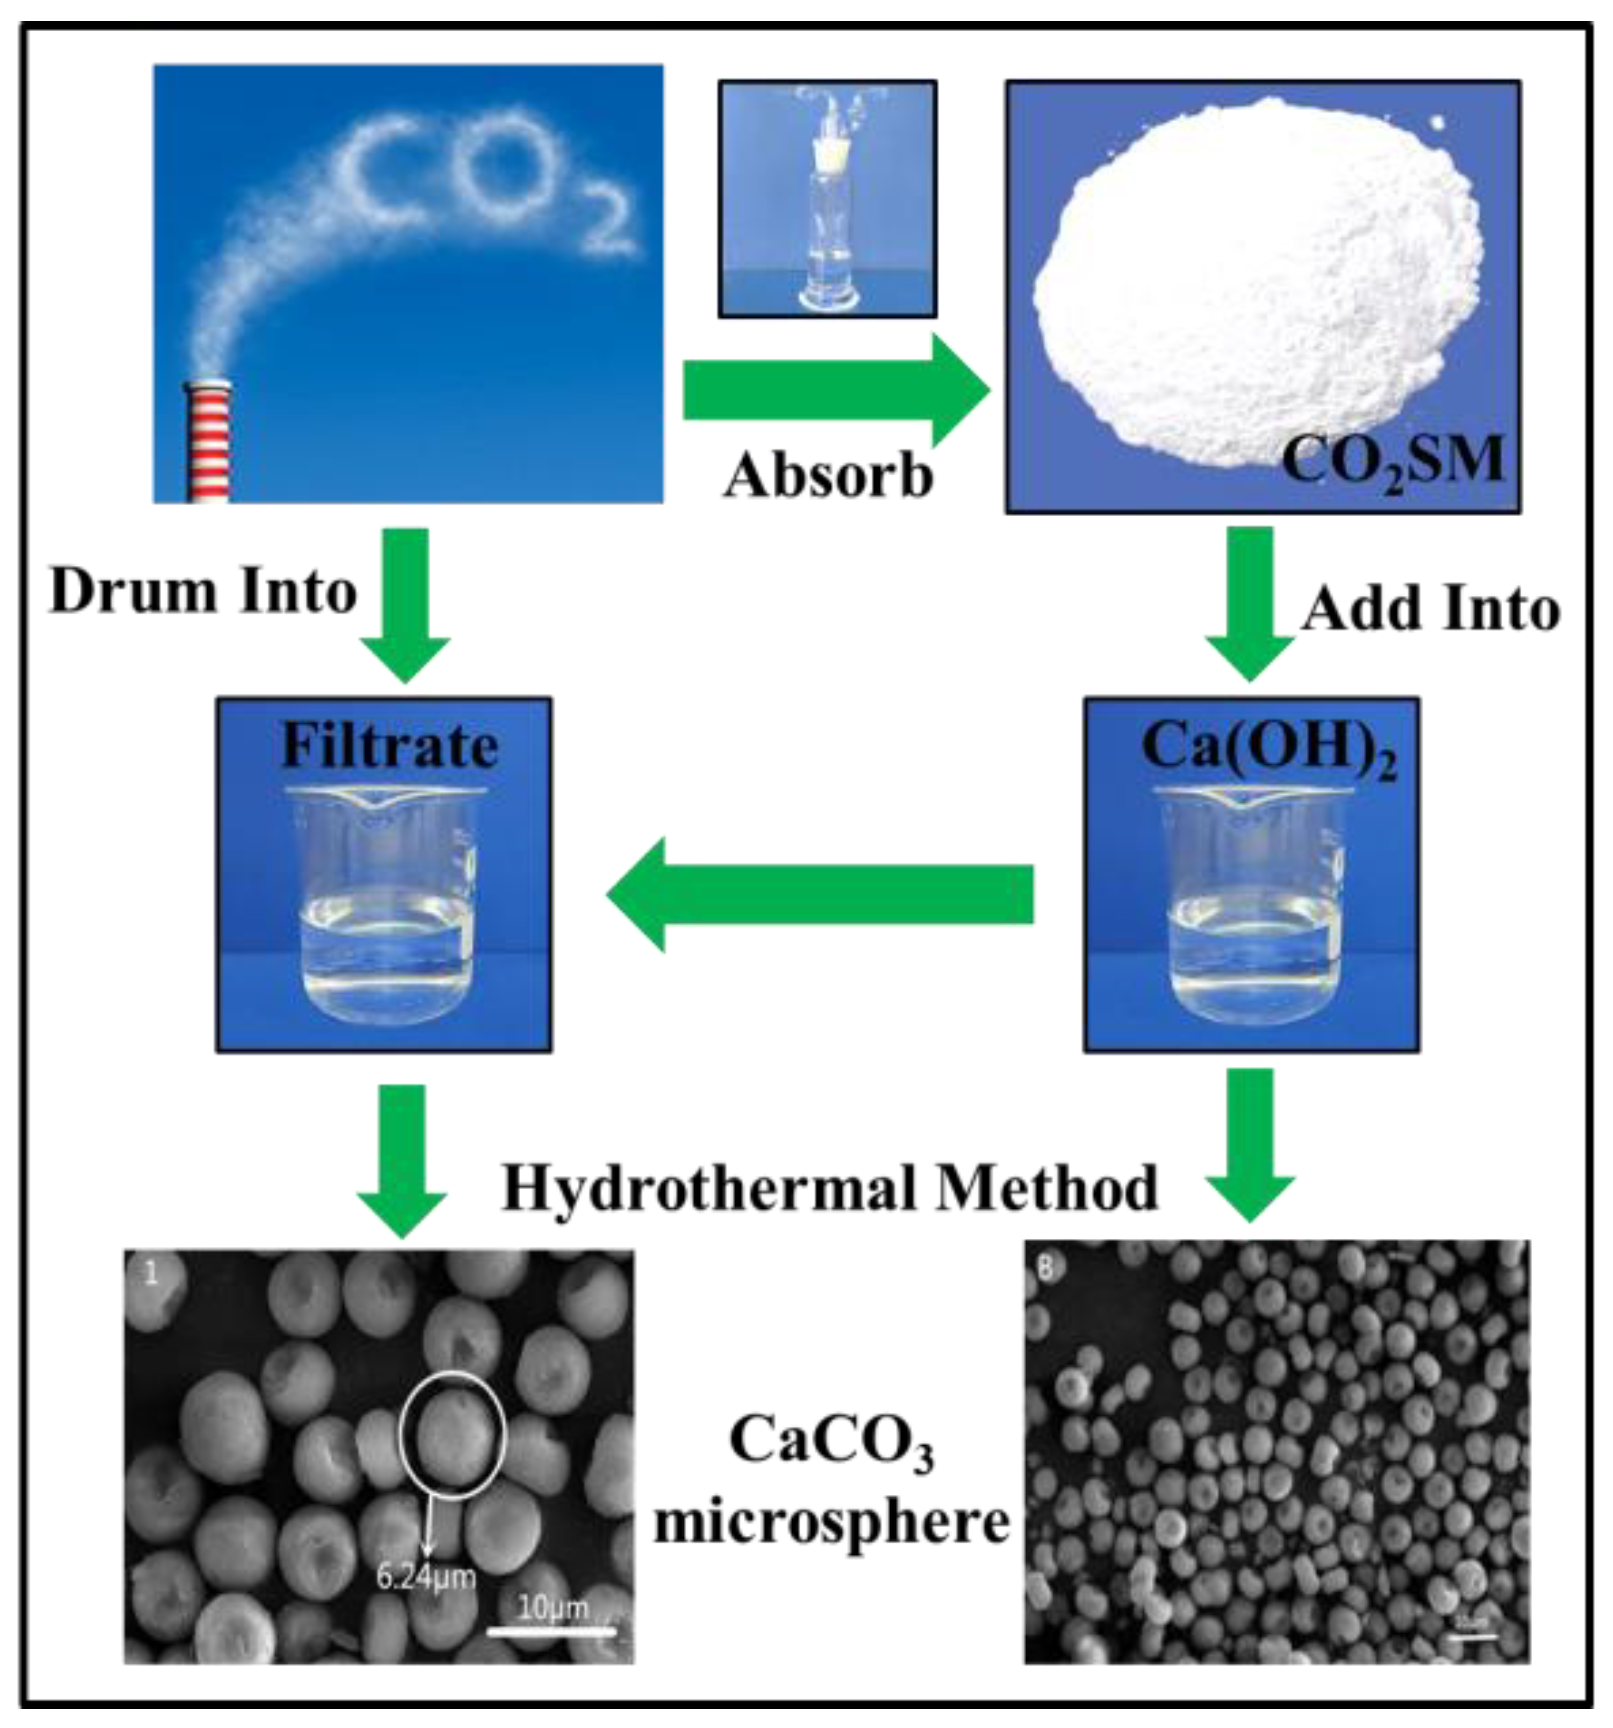
:Homogeneous CaCO3 microspheres were controllably synthesized via a simple hydrothermal method without using extraneous additives by Ca(OH)2 saturated solution reacted with CO2 storage material (CO2SM), which was obtained by absorbing CO2 gas in a system containing equimolar ethylenediamine (EDA) and polyethylene glycol 400 (PEG). Specifically, homogeneous pure vaterite spheres were obtained by using 160 g/L CO2SM solution at 100 °C and a reaction time of two hours. It is noteworthy that the EDA and PEG, which are released from CO2SM, have dual functions as a CO2 absorber and crystal regulator in the process of controlling the crystallization of CaCO3 crystals.
1. Introduction
Climate change, one of the most disturbing global environmental issues, primarily relates to continuously increasing CO2 emission from burning fossil fuels [1,2,3]. Thus, it is necessary to develop CO2 capture and utilization (CCU) technology to reduce CO2 emission. Currently, there are four CO2 separation technologies, consisting of pre-combustion decarburization, chemical chain combustion decarburization, oxygen-rich combustion decarburization, and post-combustion decarburization [4,5]. As an important CO2 abatement technology, the post-combustion decarbonization captures CO2 from the flue gas after combustion and reduces CO2 in flue gases by about 80% [6,7]. Therefore, it has broad application prospects. In recent years, carbon capture and storage (CCS) and CCU processes have been developed to control CO2 emission and resource recovery [8,9,10,11,12]. In particular, the preparation of CaCO3 via the chelation of CO2 has been studied extensively because CaCO3, as one of the cheaper biological materials, has important applications in various fields [13,14,15,16,17,18,19,20]. There are four polymorphic phases that have been prepared as follows: calcite, aragonite, vaterite, and amorphous CaCO3 (ACC) [21,22]. Calcite and aragonite CaCO3 crystals are the most stable structures of thermodynamics, and vaterite would rapidly transform to aragonite and (or) calcite because it is the least thermodynamically stable [23]. Among them, the pure vaterite phase CaCO3 crystals is studied most widely because it has a larger specific surface and porous nature that could improve mechanical properties when they are used as filler [24,25,26]. More importantly, it is challenging for the synthesis of stable vaterite when CO2 is used as a direct raw chemical because the process is more dependent on the calcium source.
CaCO3 powders are prepared by carbonization in industry. The morphology of CaCO3 powders prepared by carbonization is disordered and the particle size is not uniform [27,28]. Recently, Mari et al. [13,19] captured CO2 in aqueous solutions of methyldiethanolamine (MDEA) and 2-amino-2-methyl-1-propanol (AMP). At the same time, soluble calcium salts were added to the system, and the CO2 captured by amine in the system was further converted by the reaction with Ca2+ in the system to form CaCO3 precipitation. However, CaCO3 is easy to agglomerate, its morphology is disordered, and the size of particle is larger. Therefore, the preparation of CaCO3 with fixed morphology, monodisperse, small particle size, and single crystal phase has become a hot spot in the research of CaCO3 mineralization.
In the work, the polyethylene glycol 400 (PEG400) was added into ethylenediamine (EDA) to enhance the ability of the system absorbing CO2, which formed CO2 storage material (CO2SM) (Figure 1). After that, the as-prepared CO2SM was used to investigate the crystallization of CaCO3 crystals via a simple hydrothermal reaction. Whereas EDA provided a high pH environment, polyethylene glycol (PEG) induced the formation of vaterite CaCO3 crystals. Furthermore, the optimal synthesis conditions were identified by exploring the concentration of CO2SM solution, reaction temperature, and reaction time. Specially, the stable pure vaterite phase CaCO3 crystals in nature also could be prepared under experiment condition. It is anticipated that the result of this is significant for the indirect utilization of CO2. The process integrates CO2 capture and resource utilization, effectively utilizes CO2, and generates value-added CaCO3.
2. Experimental Section
2.1. Materials
The purity of EDA was 98%, which was provided by Yongsheng Fine Chemical Co., Ltd., Tianjin, China. The solid of Ca(OH)2 was provided by Sinopharm Chemical Reagent Co., Ltd., Shanghai, China. PEG 400 with a molecular weight range of 380–420 g/mol, was analytical grade and was provided by the Beijing Reagent Company Co., Ltd., Beijing, China. The purity of compressed CO2 was 99.999%, which was provided by the China Standard Things Center, Beijing, China. CO2SM was obtained by capturing via the equimolar EDA + PEG400 system according to the previous study.
2.2. Synthetic Procedures
In line with a typical CaCO3 preparing process, 1 g CO2SM was added into a stainless steel reactor (the specifications of Teflon-lined is 100 mL), which was filled with 50 mL saturated Ca(OH)2 solution. The reaction was controlled at 100 °C for 2 h, and then was cooled down until it reached room temperature. The mixture of precipitate and solution was separated by vacuum filtration, and it was washed at least three times by aqua distillate. The collected filter cake was dried at 120 °C for more than 4 h under vacuum.
2.3. Characterization
The morphology of CaCO3 precipitates were observed by scanning electron microscope (SEM) and energy dispersive X-ray spectroscopy (Quanta FEG 650, Beijing, China), with an accelerating voltage of 20 kV. The crystal lattice spacing was observed by high resolution transmission electron microscope (HR-TEM; JEM-2100, Beijing, China), and the accelerating voltage was 200 kV. The X-ray diffractometer (XRD) was made in Germany from Siemens D/max-RB at 2θ = 5–80°, and the scanning rate was 0.05°/s (the mass of a sample was about 0.5 g), which used a powder with Cu Kα (λ = 1.5418 Å) radiation. The Fourier transform infrared spectroscopy (FTIR) technology was made in the USA by Nexus 670, and the CO2SMs dispersed in KBr powder, with a resolution of 1 cm−1 from (4000 to 400) cm−1. The thermogravimetric analysis (TGA) technology was made in Germany by Entzsch-Sta 449 and the samples were met with the heating rate of 5 °C min−1 (the mass of a sample was about 0.3–0.5 mg). The automatic surface area (BET method) and porosity analyzer (BJH model) was made in the USA by TristarII 3020 to obtain nitrogen adsorption-desorption data (the mass of a sample was about 2.0 g). The BET method and BJH model are depended on the Equations (1) and (2):
where P is nitrogen partial pressure, P0 is adsorption temperature, nitrogen saturated vapor pressure, V is the actual adsorption amount of nitrogen on the sample surface, Vm is nitrogen monolayer saturated adsorption amount, C is constants related to the adsorption capacity of the sample
where P is the actual vapor pressure, P0 is the saturated vapor pressure, γ is the surface tension, Vm is the molar volume of the liquid, R is the general gas constant, r is the radius of the droplet, T is the temperature.
P/[V(P0 − P)] = 1/(Vm × C) + [(C − 1)/(Vm × C)] × (P/Po)
The X-ray photoelectron spectroscopy (XPS) technology was made in the USA by ESCLAB-250Xi with a monochromatized Al Kα X-ray (hν = 1486.6 eV) operating at 150 W from (200 to 600) eV.
The percent molar content of calcite, vaterite, and aragonite in the precipitate was calculated by Equations (3) to (5) [29]:
The percent of molar content of only containing vaterite and calcite in the precipitate is calculated by Equations (6) and (7):
where XA, XC, and XV are the percent molar content of aragonite, calcite, and vaterite, respectively. The lattice planes of 221 (I221A), 110 (I110V), and 104 (I104C) are due to aragonite, vaterite, and calcite.
3. Results and Discussion
Conventional protocols for regulating CaCO3 polymorph mainly include variation of solvents [30], temperatures [31], and organic or inorganic additives [32]. Thus, the effect of three major factors were examined in the CaCO3 crystallization process, such as CO2SM concentration, temperature, and time.
3.1. Influences of CO2SM Concentration
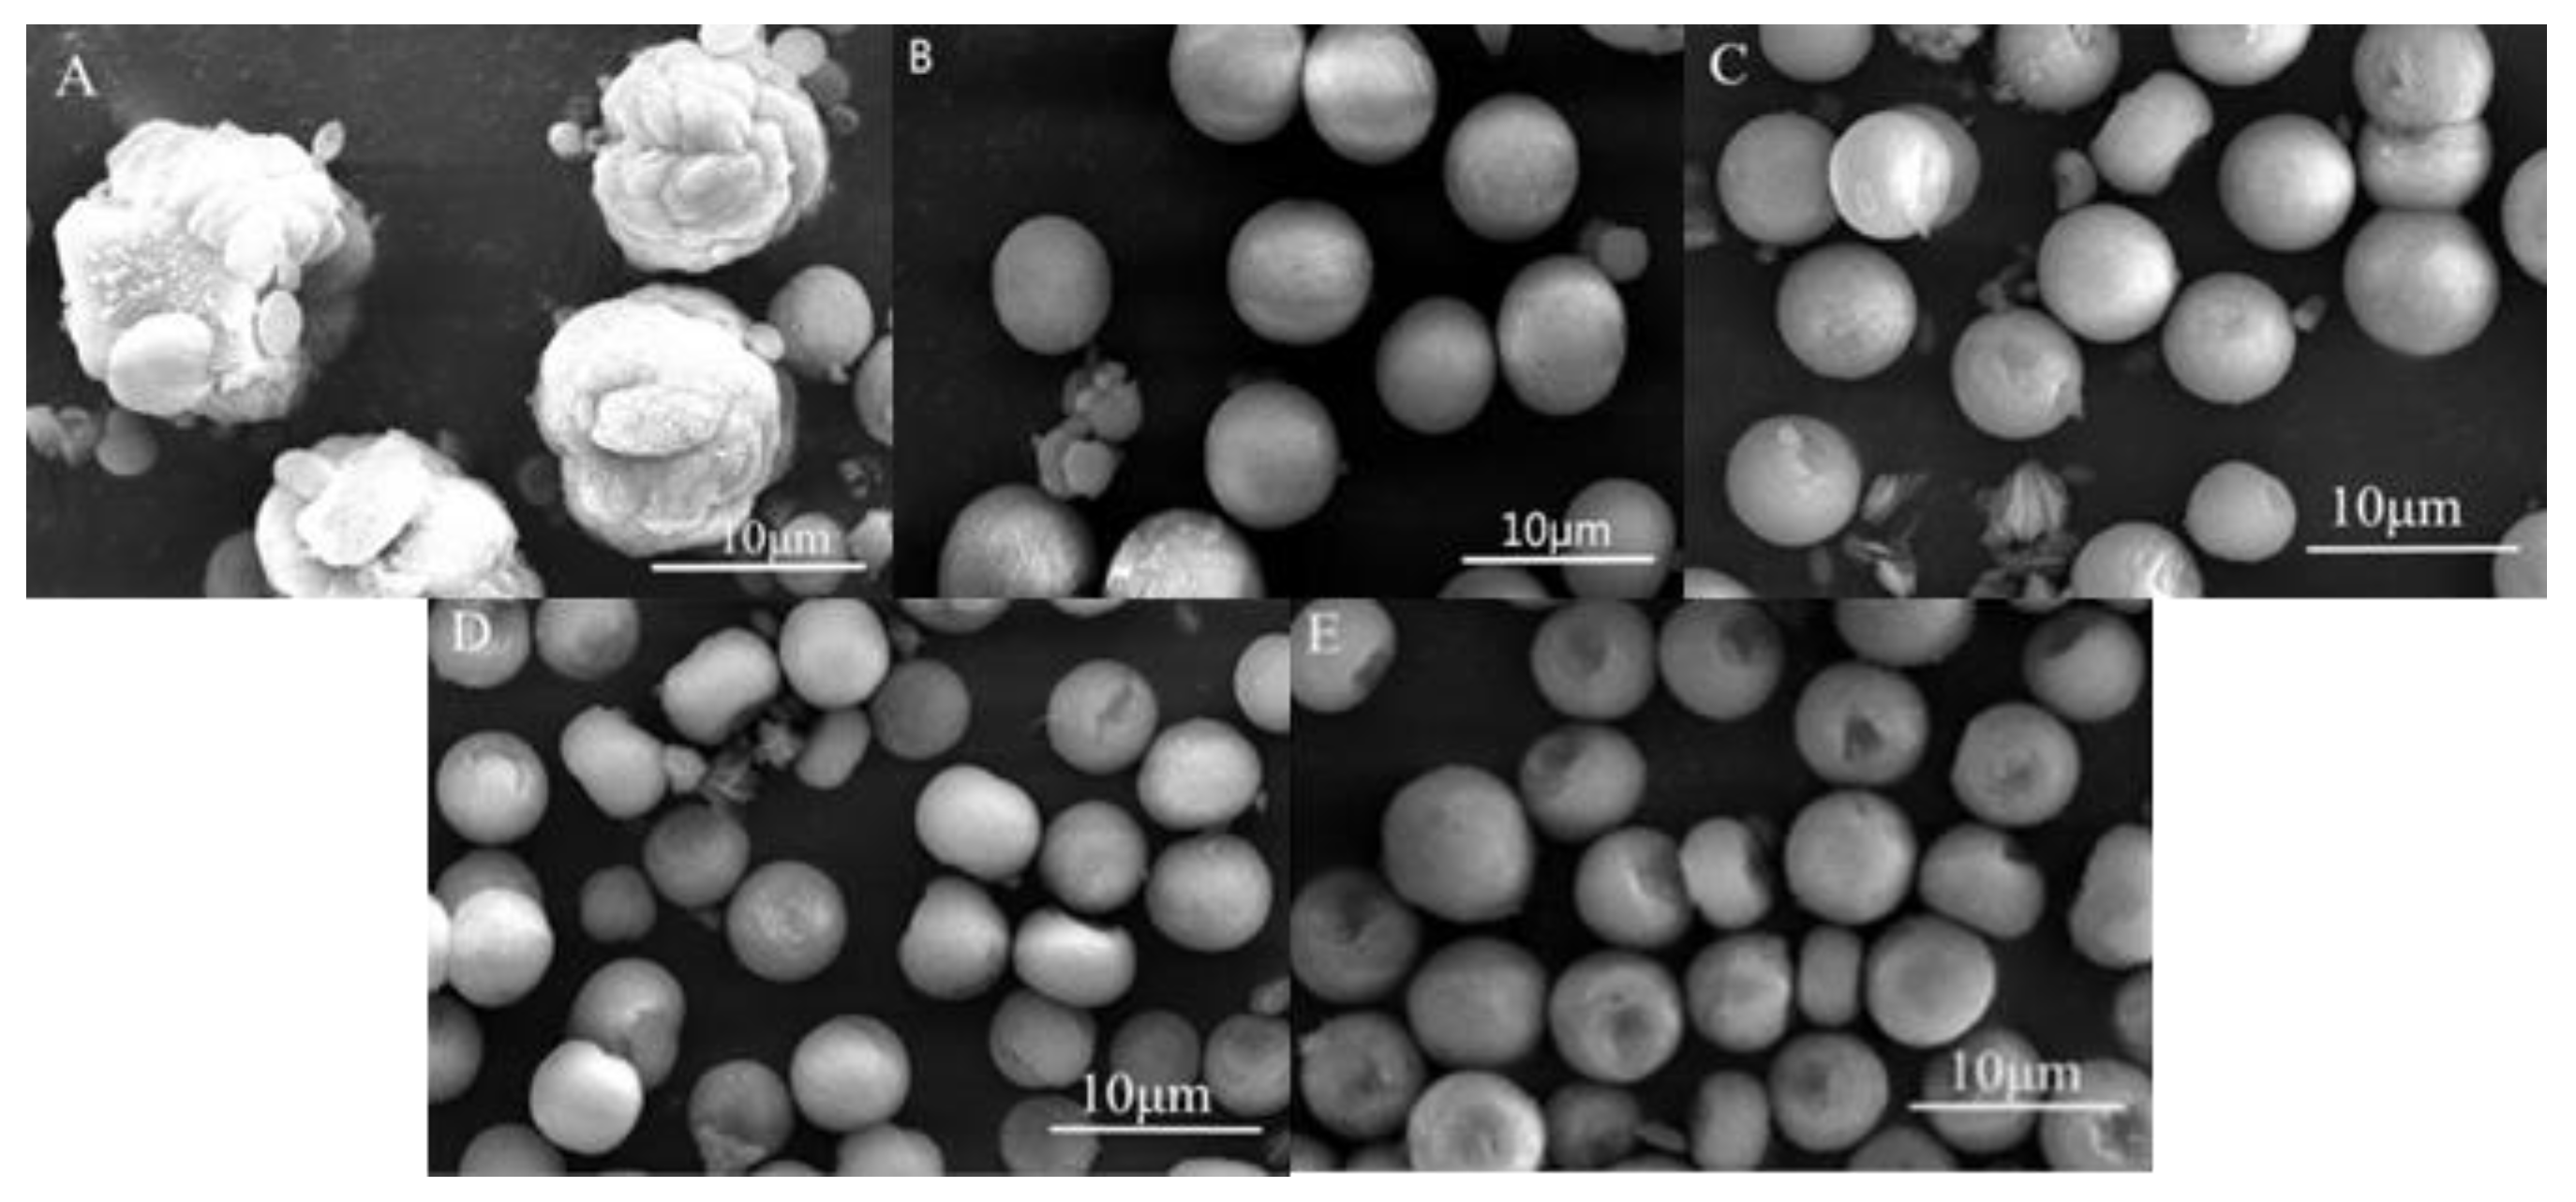
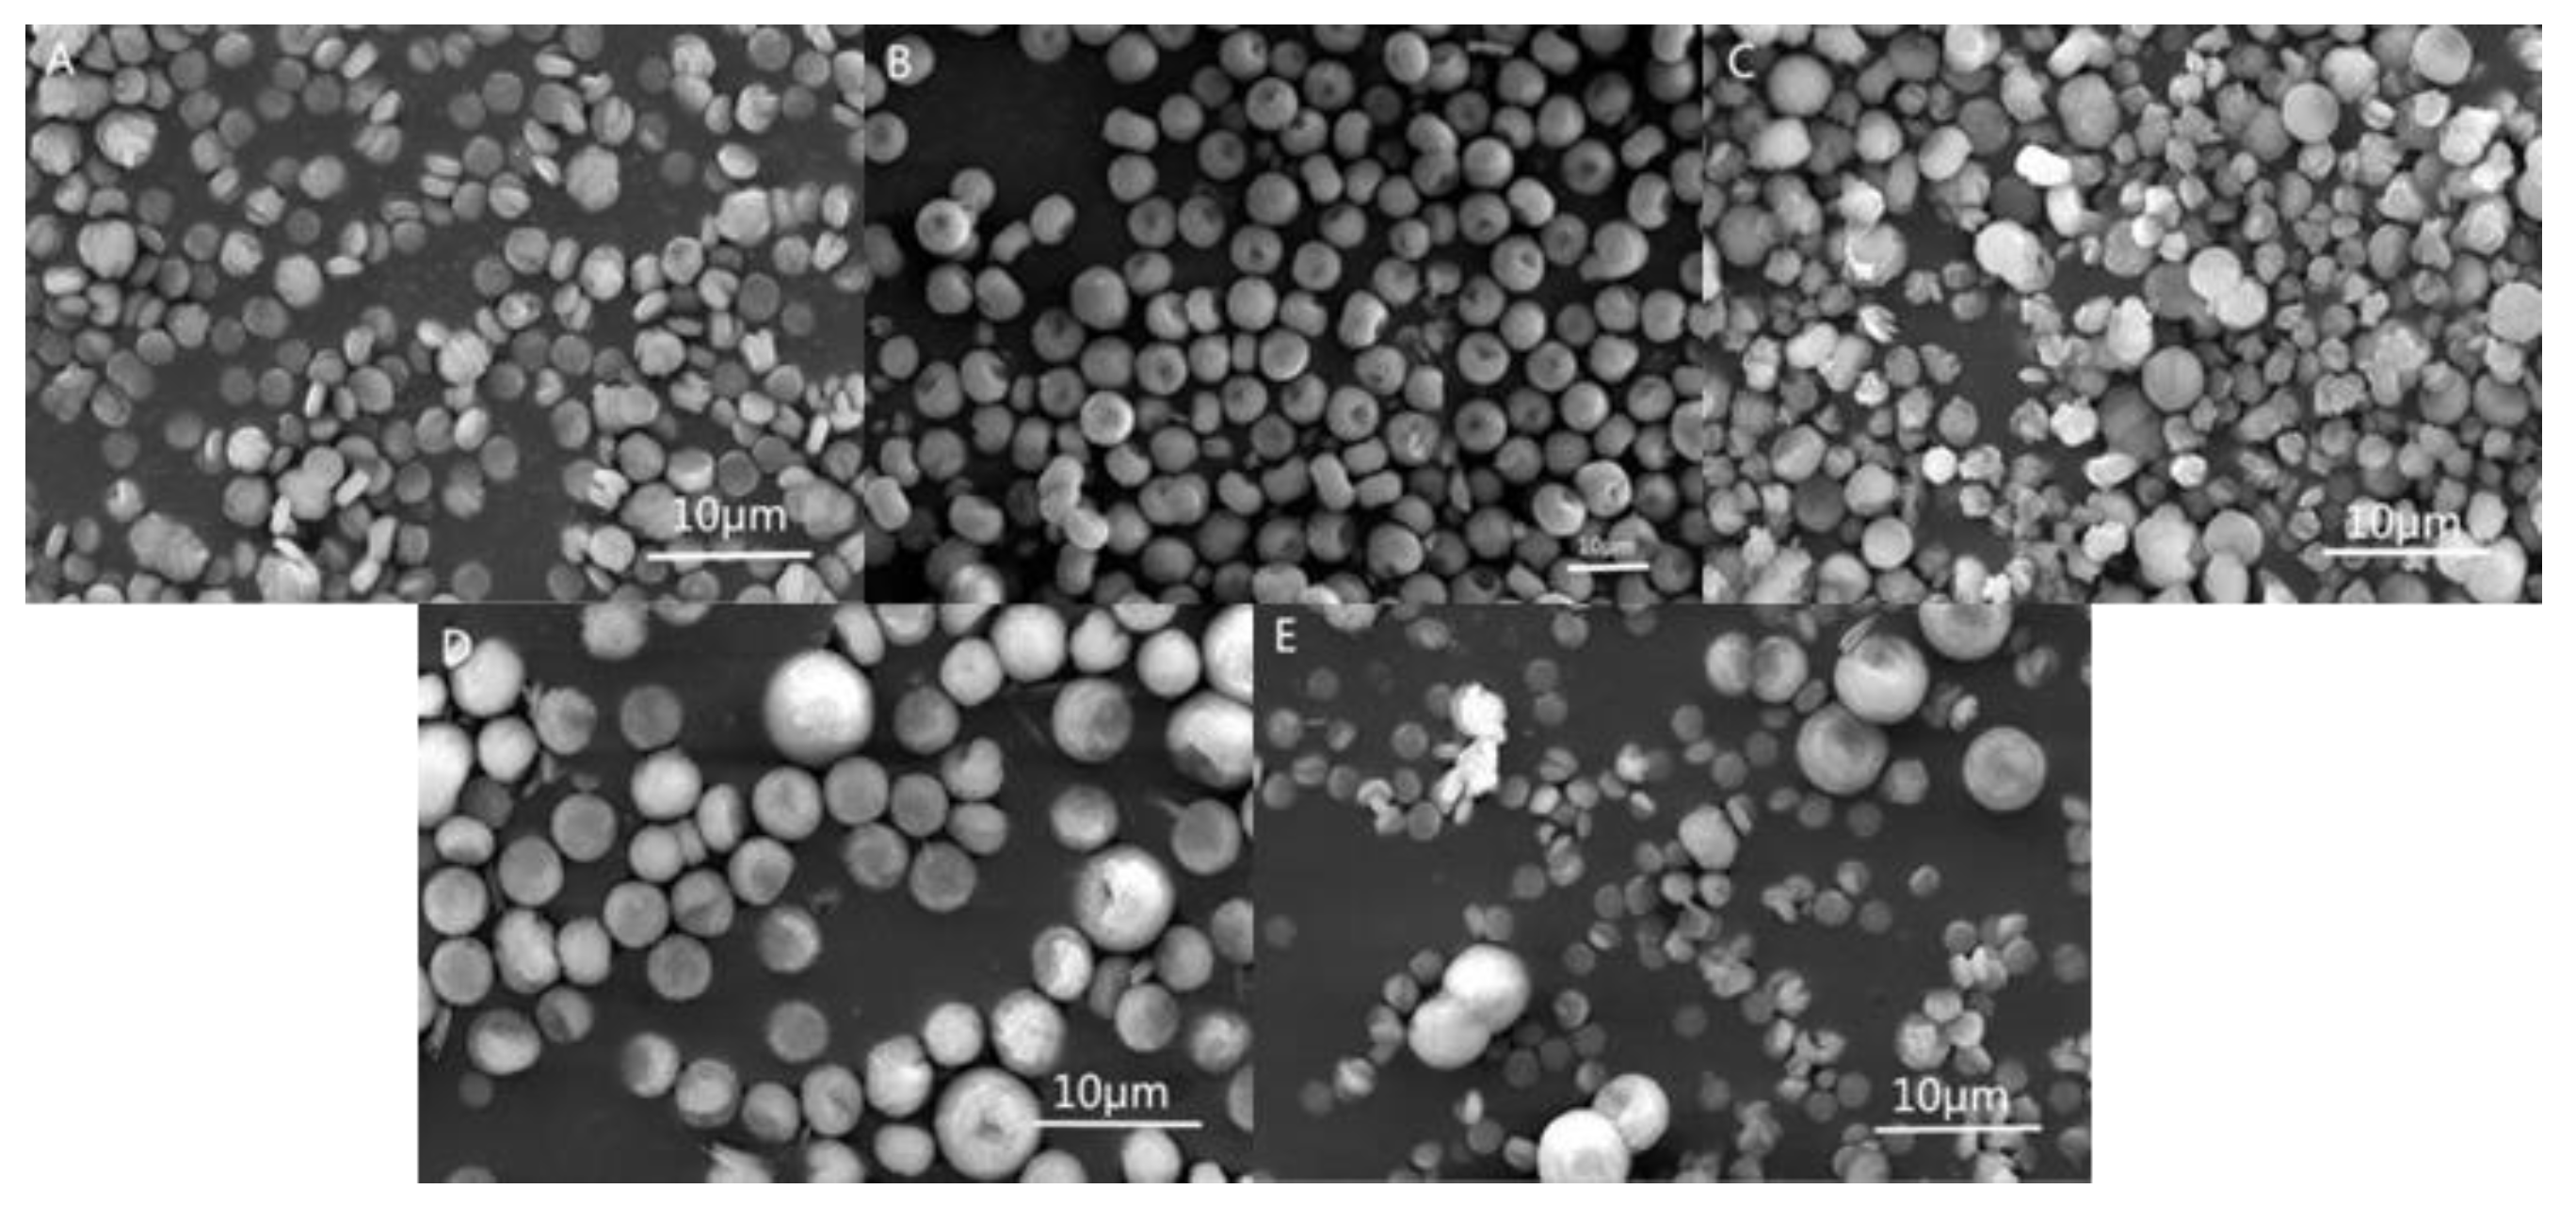
Various CO2SM concentrations were examined to identify the influences of CO2SM concentration on the preparation of CaCO3 crystals, and the SEM photos of CaCO3 crystals obtained at the CO2SM concentration range of 20 to 160 g/L at 100 °C for 2 h are shown in Figure 2. Table 1 illustrates the preparation conditions and crystal composition of CaCO3 crystals prepared with different CO2SM concentrations, which indicated that the CaCO3 crystals exhibited spherical-like shapes with an approximate particle diameter of 5–7 μm, at the same time, there was no obvious change in CaCO3 crystal size with the increase of CO2SM concentration. As listed in Table 1, the solution pH decreased gradually from 9.33 to 8.49 with increasing CO2SM concentration. These results unambiguously revealed that the morphology of CaCO3 crystals varied significantly with the increasing CO2SM concentrations.
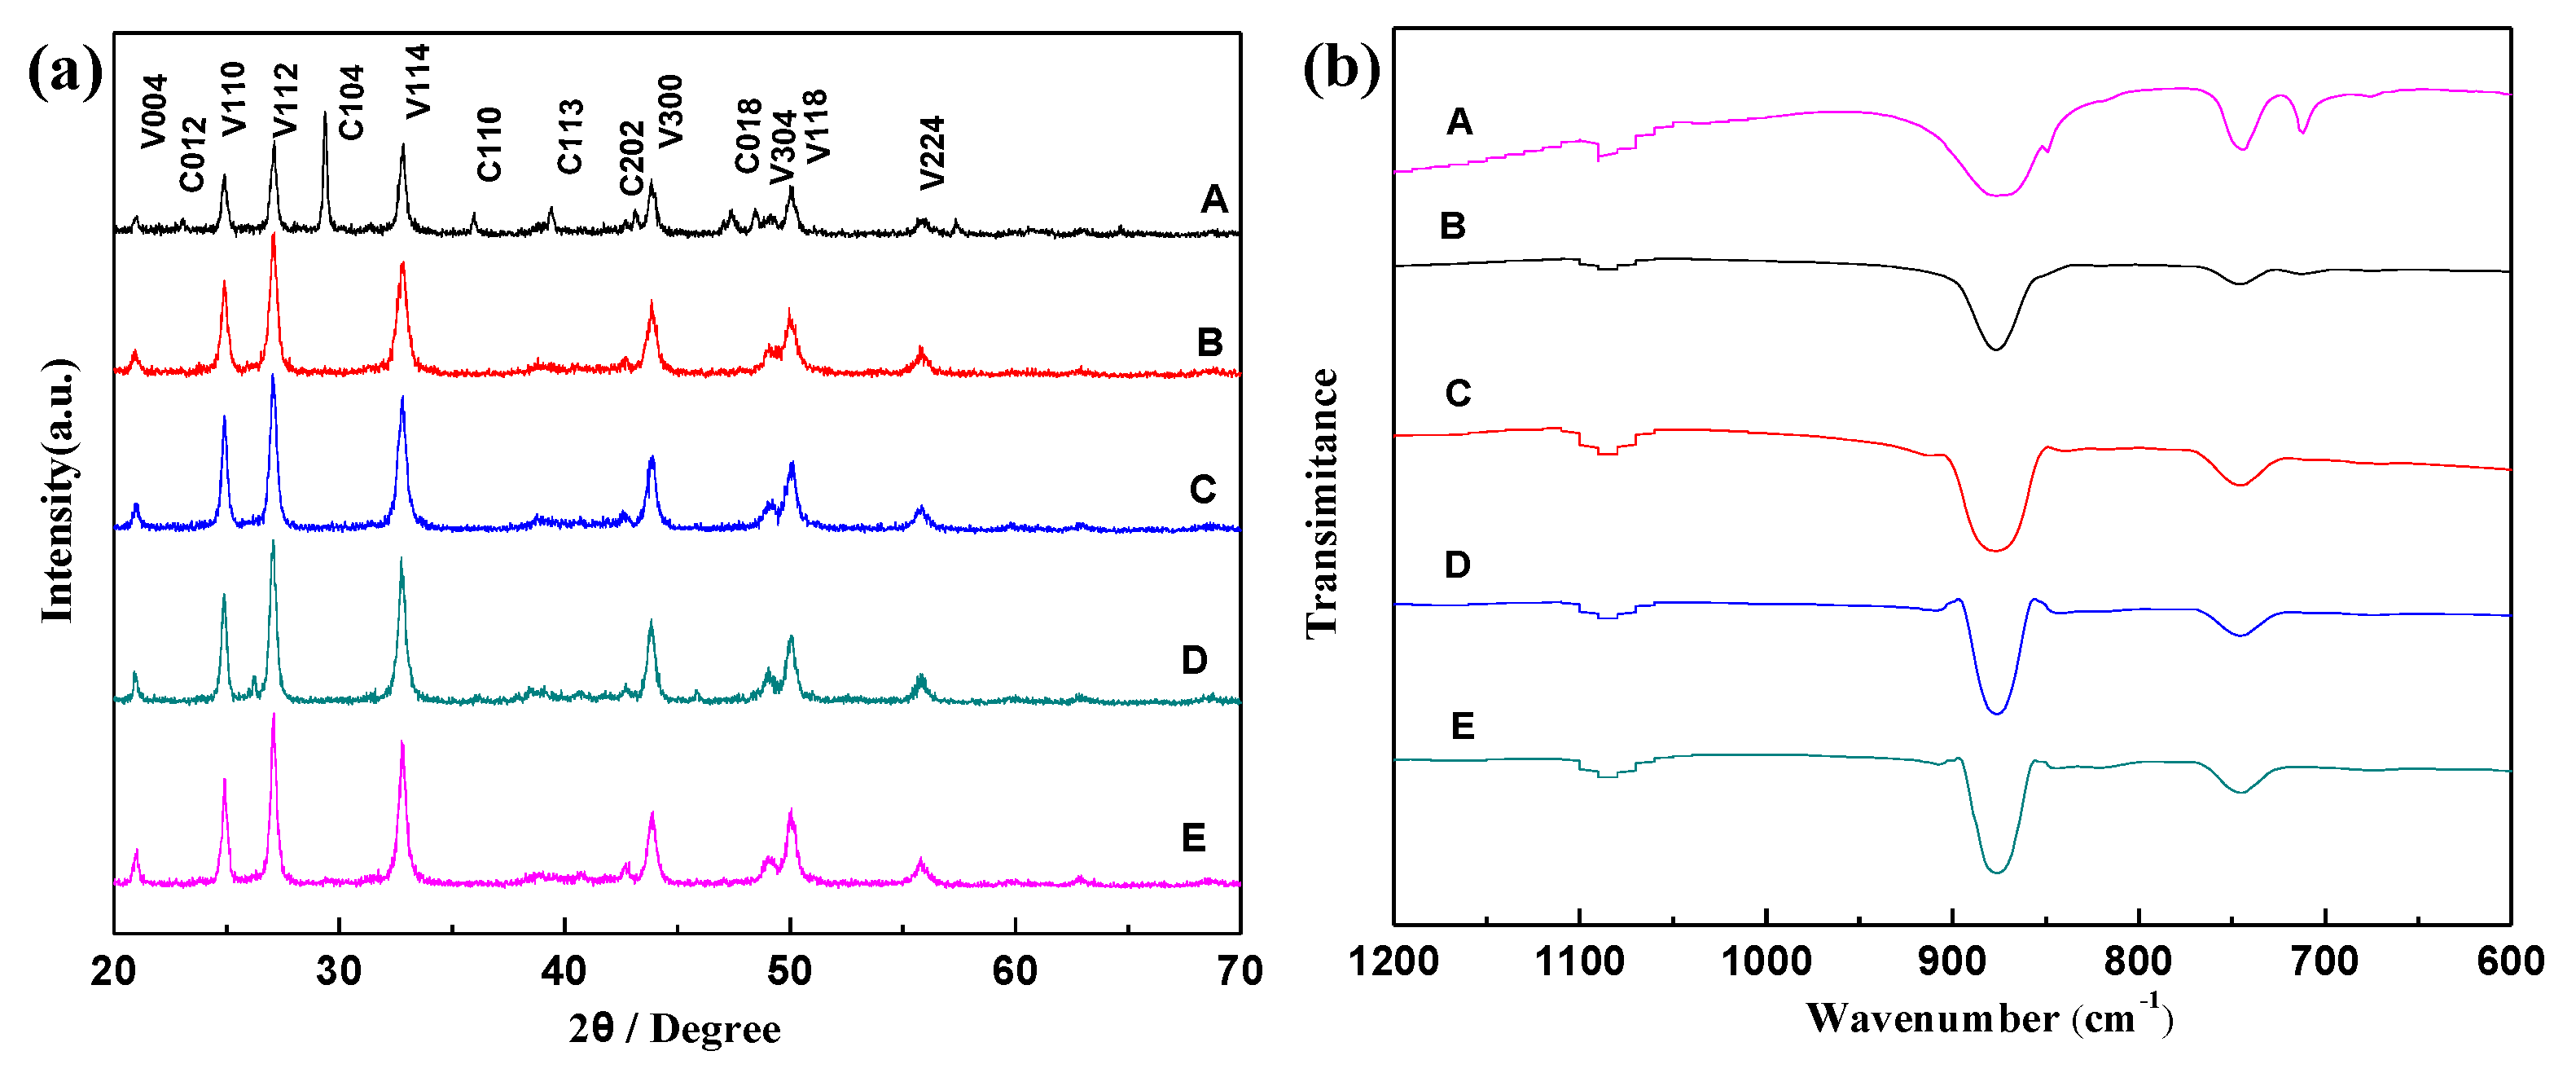
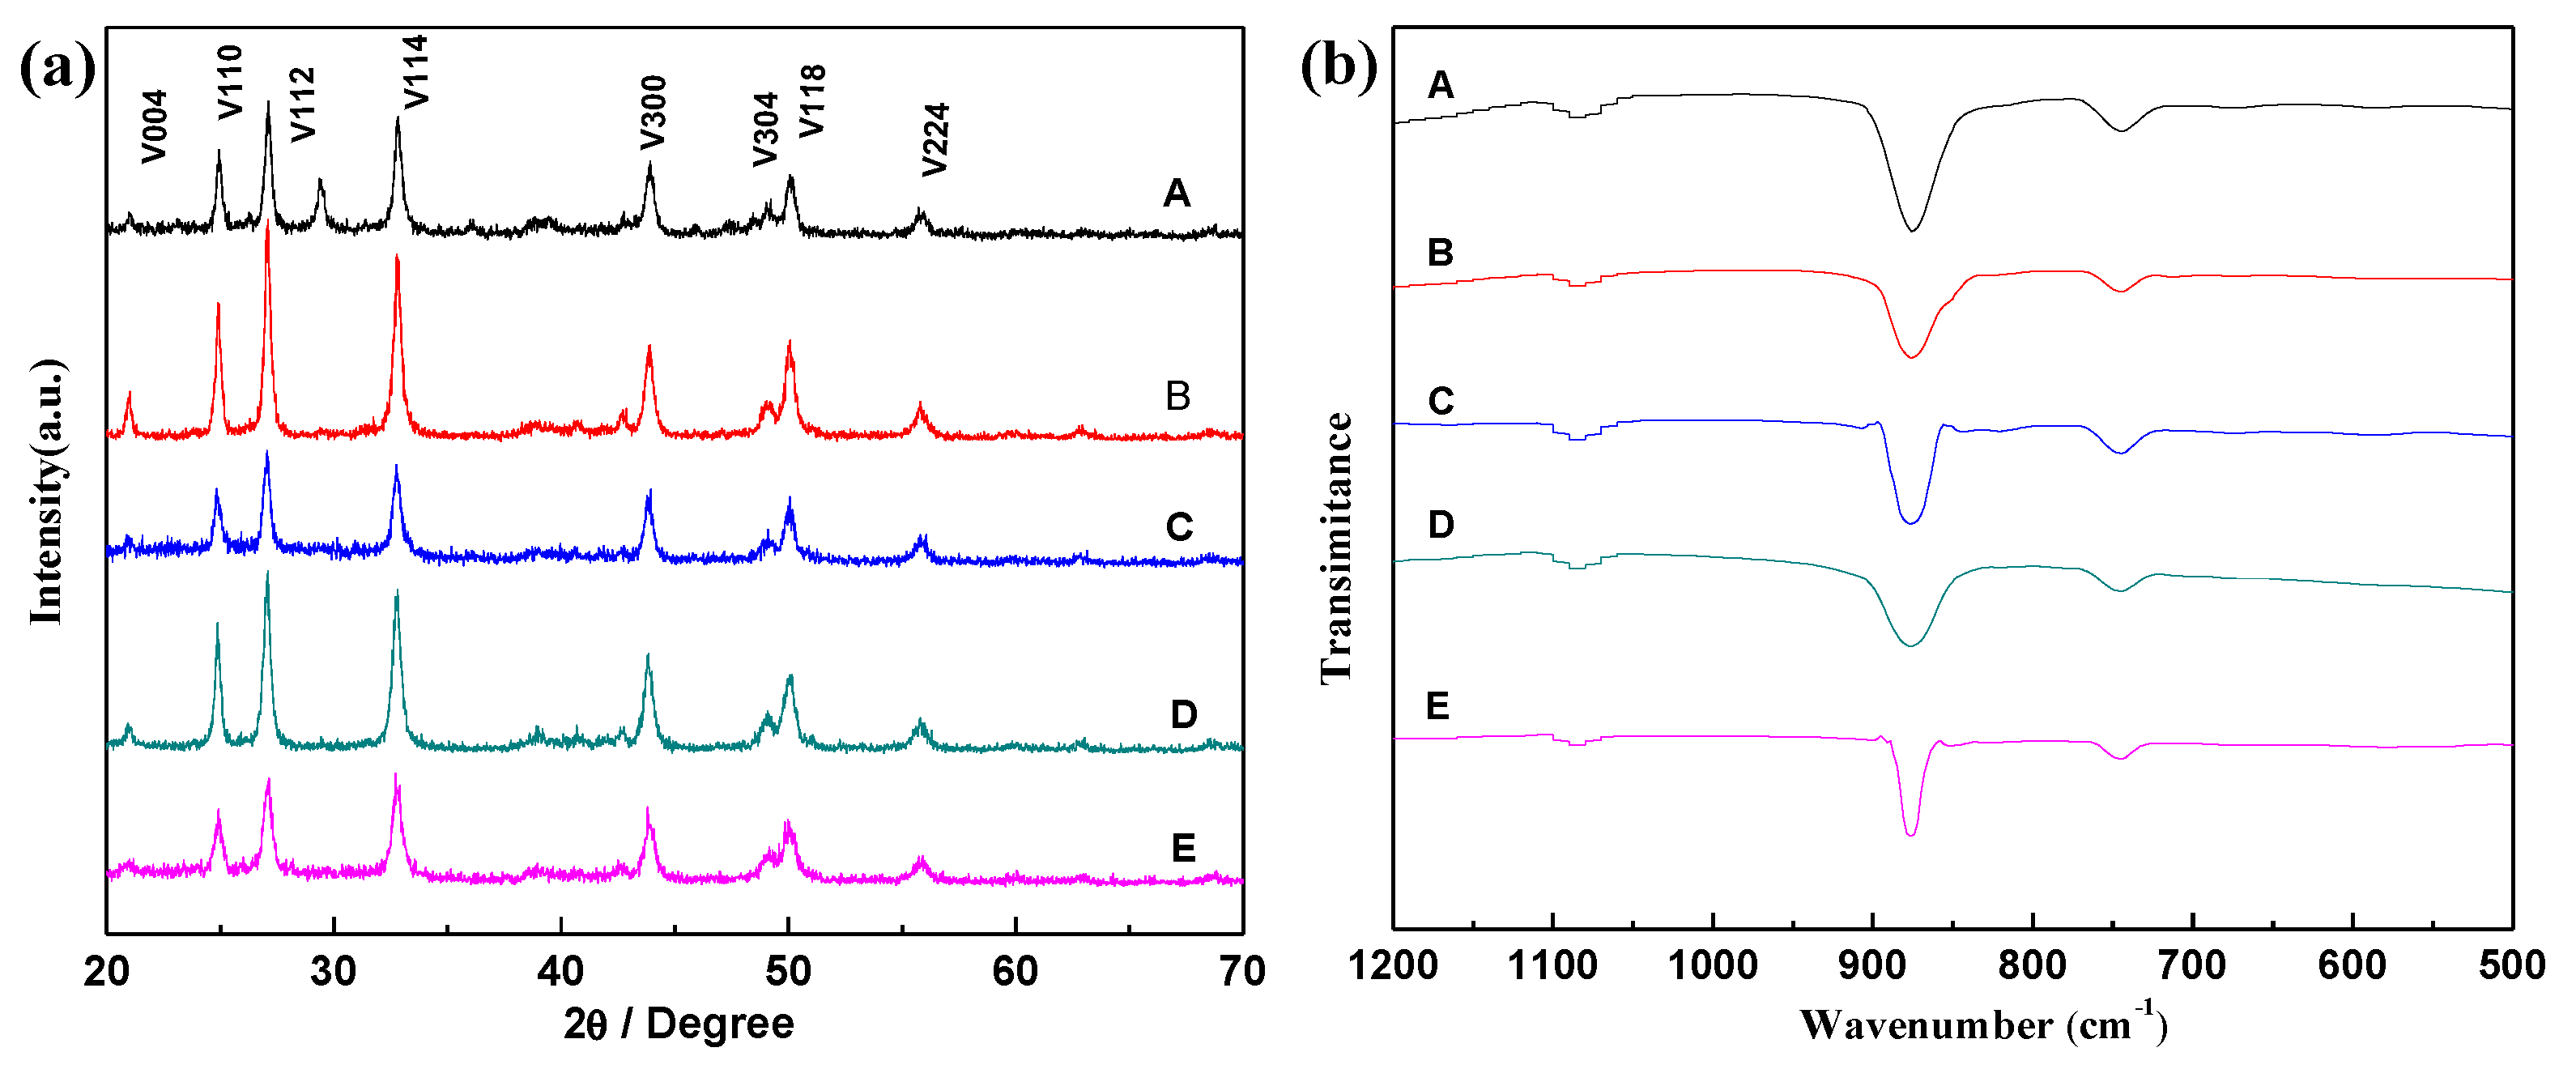
The XRD patterns of CaCO3 crystals are shown in Figure 3. The main peaks of sample A (20 g/L) at 29.2° and 24.7° in the XRD patterns were assigned to the (104) face of calcite and the (110) face of vaterite, respectively [33], indicating the phase structure of the sample A was a mixture of calcite and vaterite, of which the CO2SM concentration was 20 g/L. With the increasing CO2SM concentration from 60 g/L to 160 g/L (samples B–E), the phase structures were pure vaterite because their characteristic peaks at 24.7° corresponded to the (110) face of vaterite, which is consistent with our previous work. The change trend above suggests that a high concentration of CO2SM favors the formation of vaterite because of the low pH value of the medium [34,35,36,37], which probably favors the formation of the most thermodynamically stable polymorph—vaterite. In addition, the polymorph composition of CaCO3 crystals are listed in Table 1.
In general, there are four modes for the characteristic vibrations of the C–O bond of CaCO3 crystals in FTIR spectra, which are the symmetric stretching mode, the out-of-plane bending mode, the doubly asymmetric stretching mode, and the doubly in-plane bending mode [38,39,40]. As shown in Figure 3b, two characteristic peaks at 875 and 711 cm−1 were observed, which was due to the υ4 mode of calcite in the sample A. Meanwhile, the characteristic peak at 745 cm−1 was also observed, which corresponds to the υ4 mode of vaterite. These results indicated that the crystal phase of sample A was a mixing crystal phase of calcite and vaterite. When the CO2SM concentration was higher than 20 g/L, the characteristic peak at 711 cm−1 disappeared, indicating that the samples of B to E were pure vaterite phase. The analysis results of FTIR spectra and XRD spectra are unanimous.
3.2. Influent of Reaction Temperature
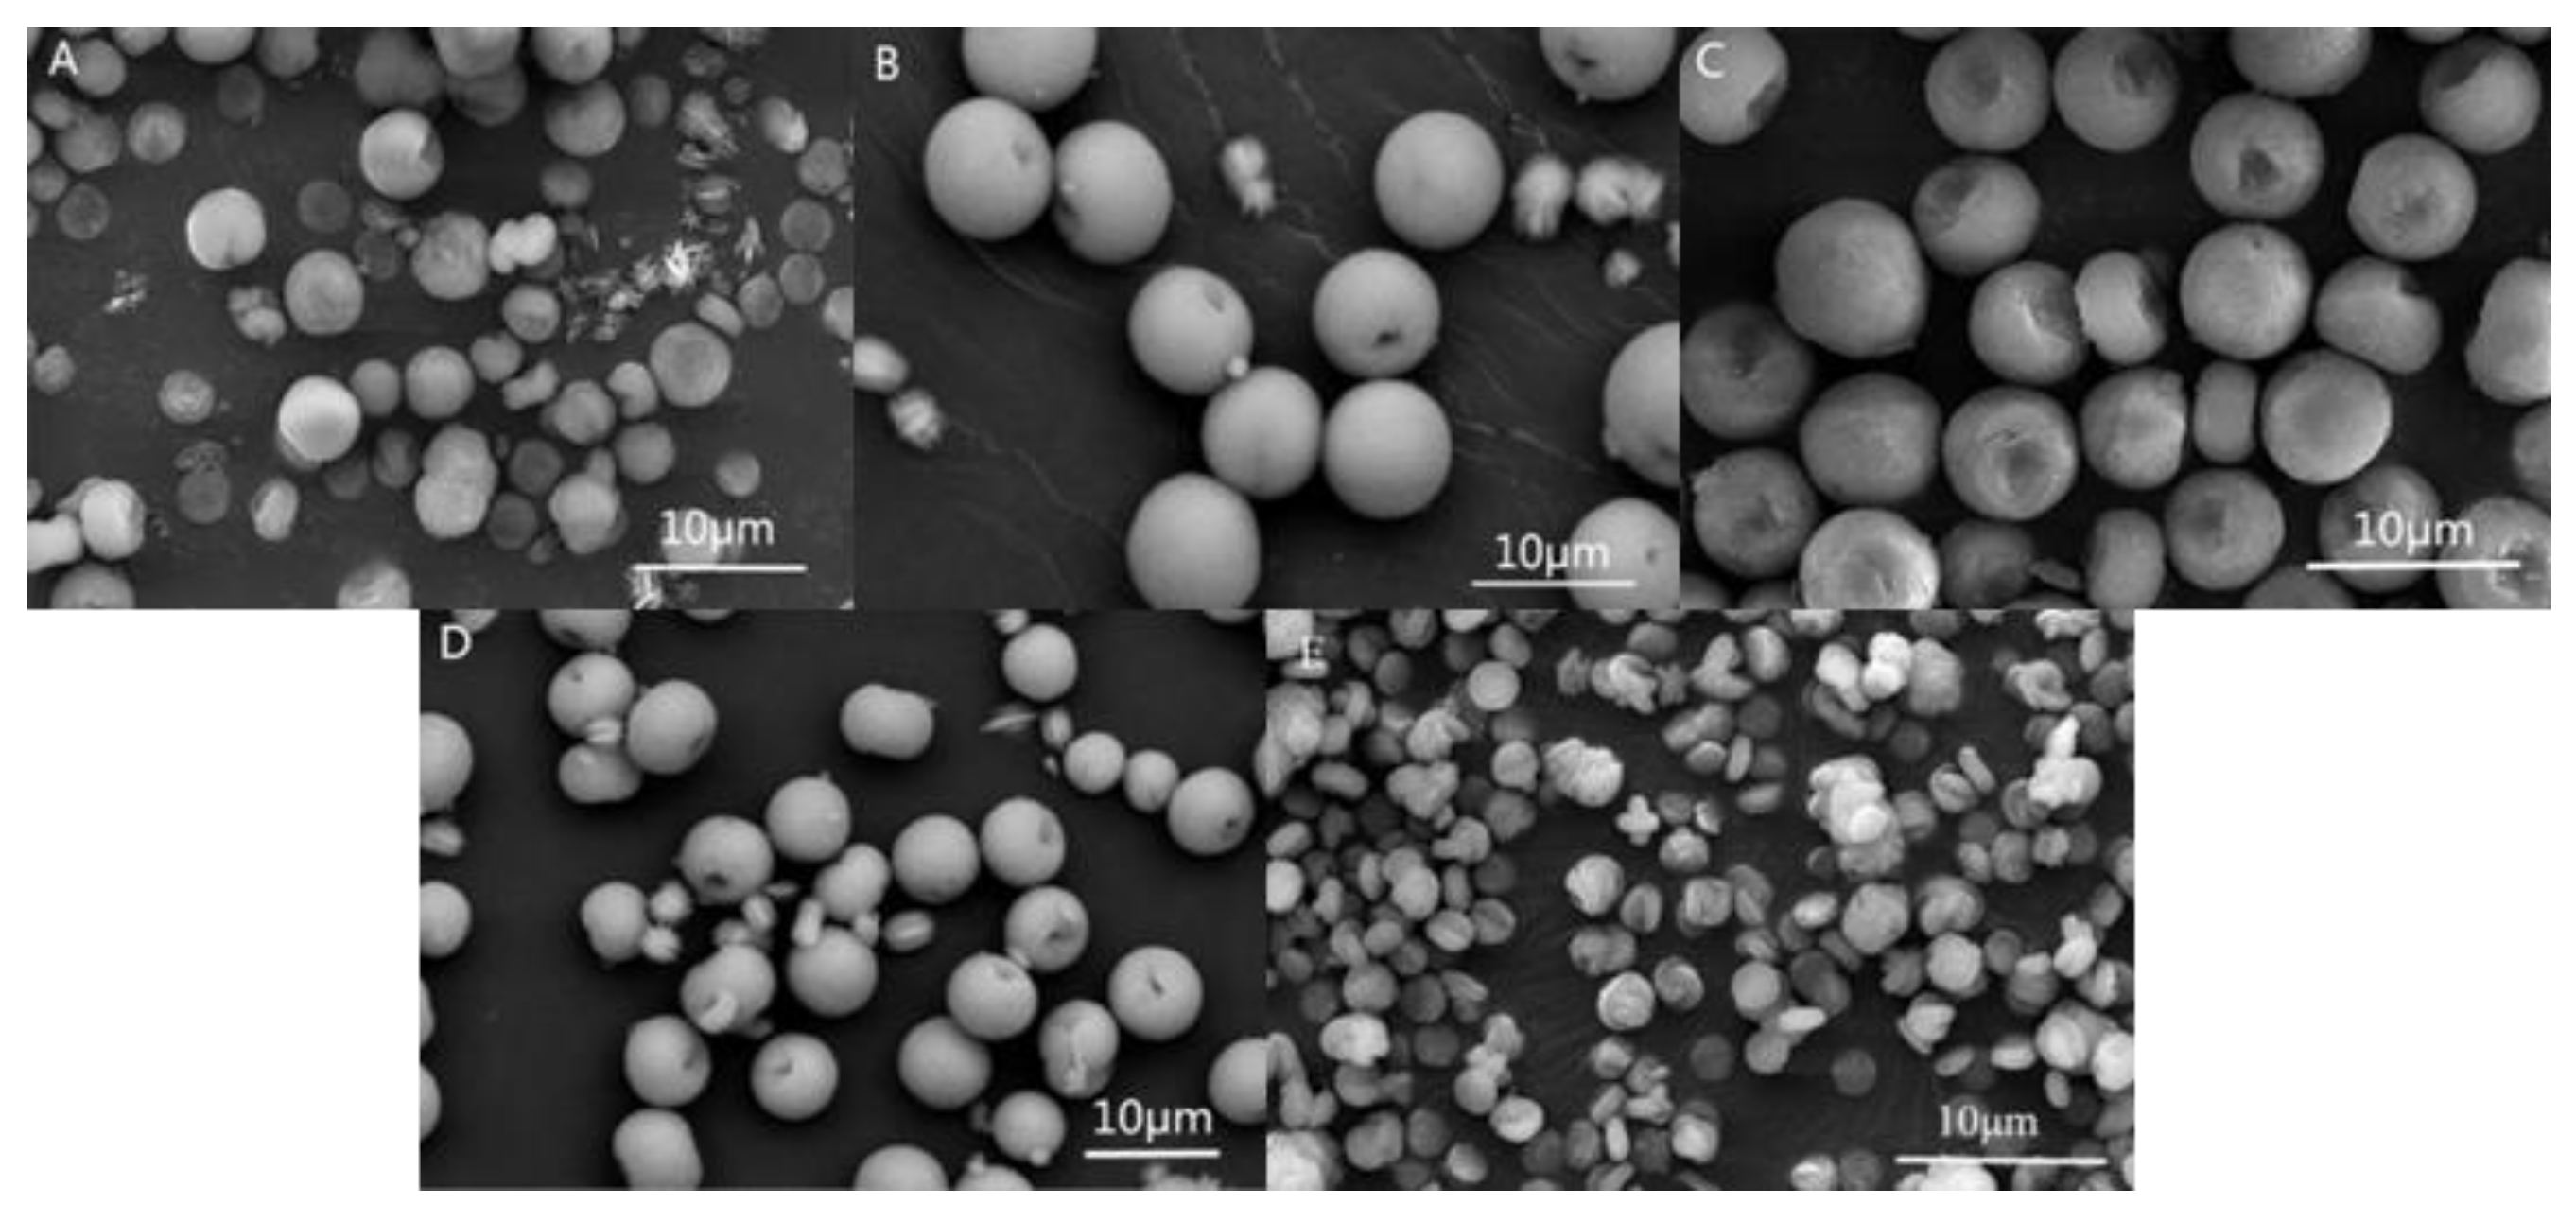
Preparation conditions and crystal composition of CaCO3 crystals at different reaction temperatures are listed in Table 2. It is known that the reaction temperature hardly influenced the morphology of CaCO3 in Figure 4. In contrast, with increasing reaction temperature, the size of as-obtained CaCO3 crystals increased firstly, and subsequently decreased. In the crystallization process, supersaturation was the driving force, as the supersaturation decreased with the rise of temperature and the nucleation rate slowed down, which made the growth rate slower and helped to increase the size of the crystals. The solubility of CO2 in solution further decreased, and the content of CO32− decreased with the further increase of temperature, which led to the formation of smaller particles and the smaller size of CaCO3 crystals [15].
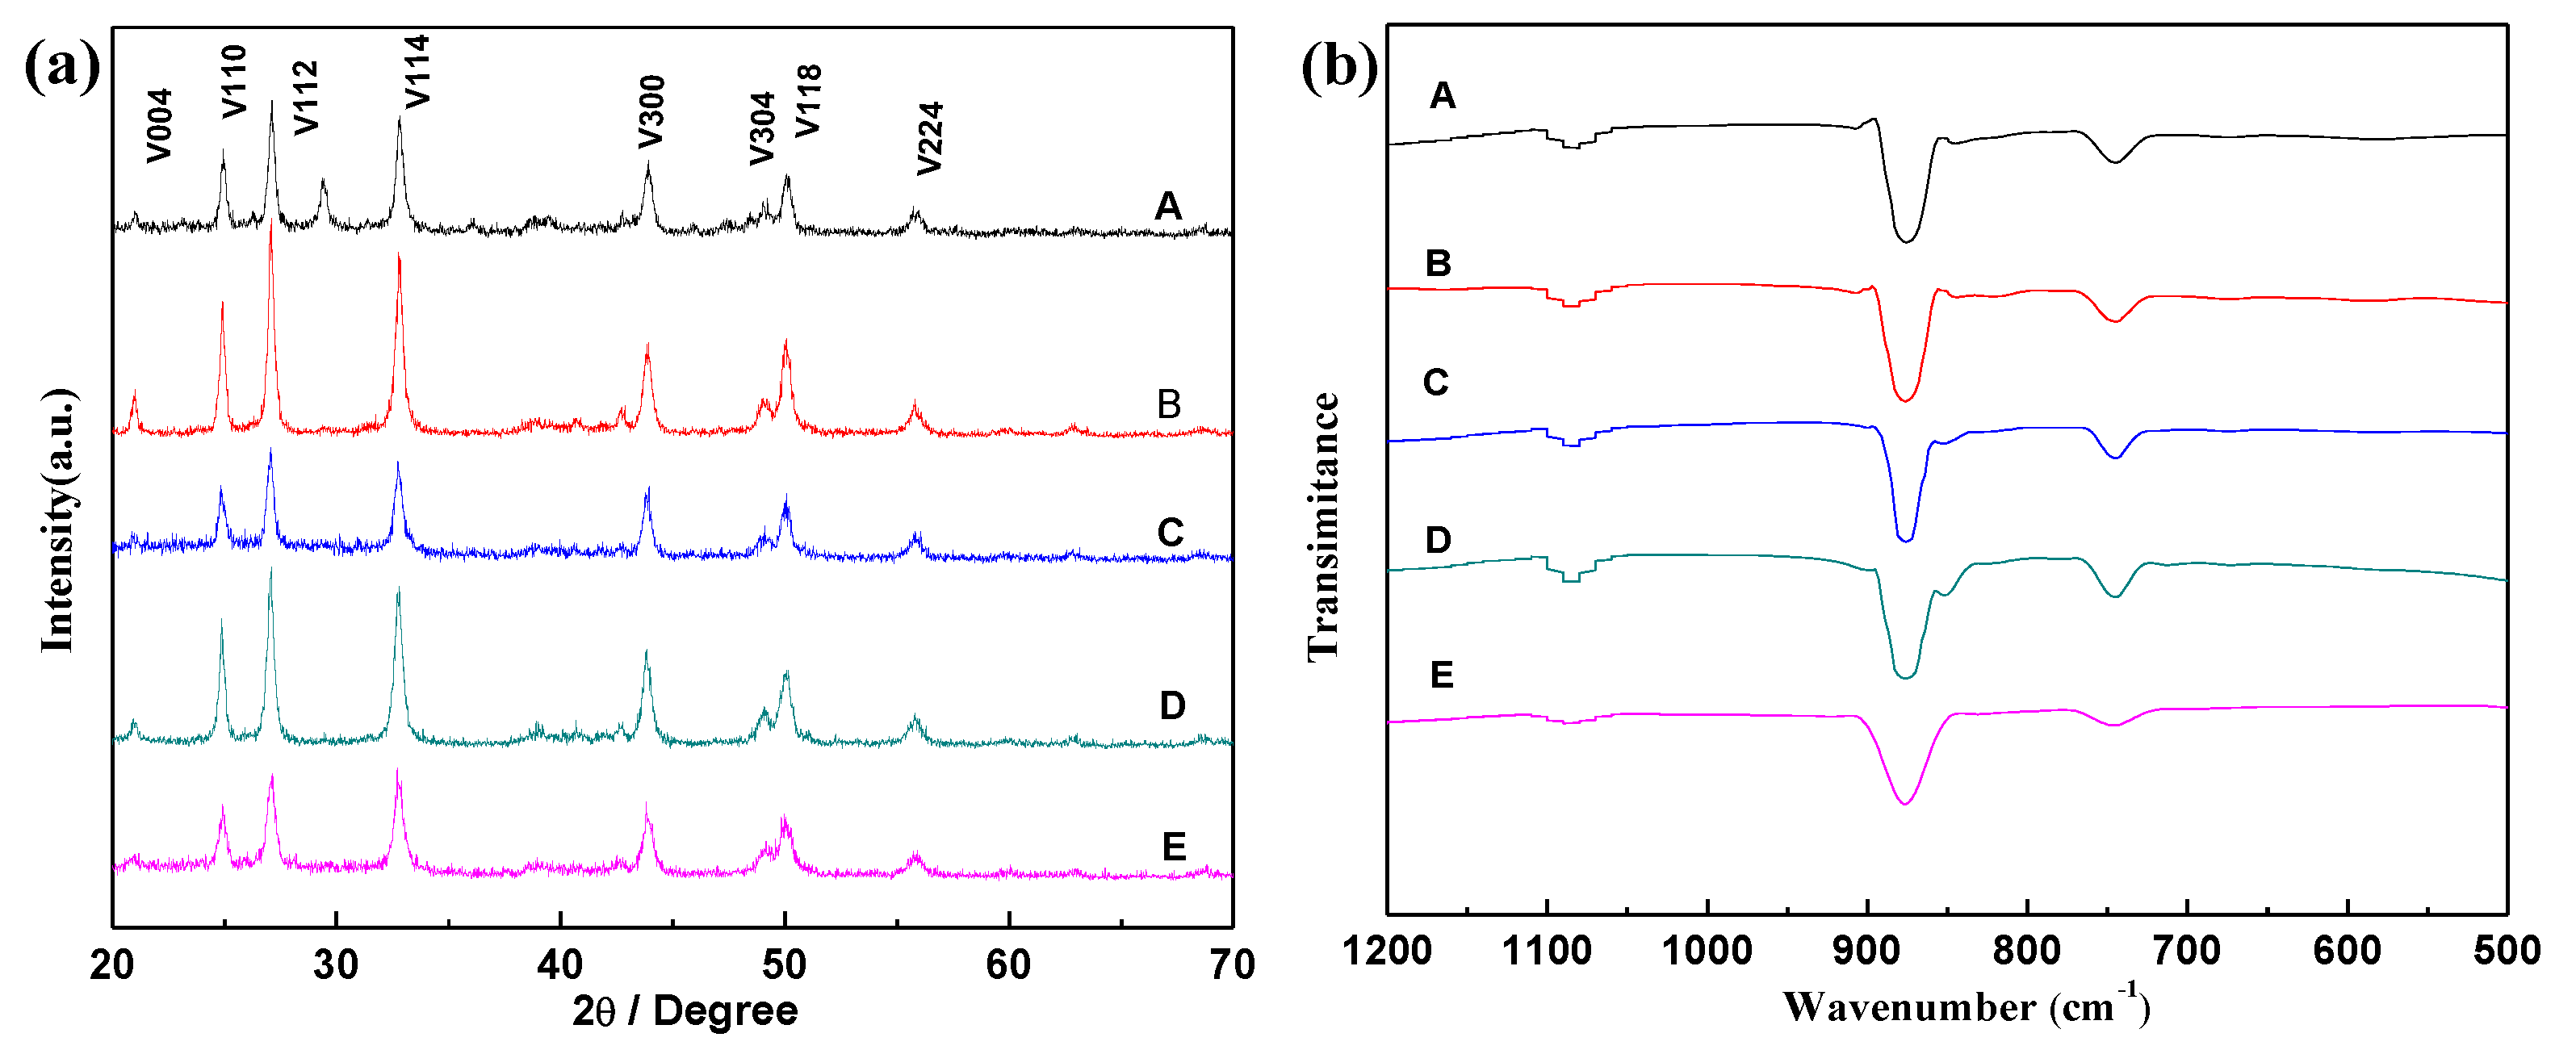
The XRD patterns of CaCO3 crystals were shown in Figure 5, which were obtained with the increasing temperature from 80 °C to 120 °C with 160 g/L CO2SM for 2 h. As shown in Figure 5a, all samples were pure vaterite crystals because the main peak at 24.7° could be assigned to the 110 phase of vaterite. Furthermore, the polymorph composition of CaCO3 crystals is listed in Table 2. The FTIR spectra in Figure 5 show that all the samples displayed three vibration bands at 1083, 875, and 745 cm−1, which confirmed the presence of vaterite. These results suggest that there was no influence of reaction temperature on the phase.
3.3. Influents of Reaction Time
Preparation conditions and crystal composition of CaCO3 crystals prepared with different reaction time are listed in Table 3. All the samples were spherical-like shapes, regardless of the reaction time in Figure 6. When the reaction time was extended, the microsphere of CaCO3 gradually grew into defective spheres. As a result, the size of microspheres gradually decreased and became densely agglomerated. The reason may be that the nucleation rate of crystals is faster and the system is controlled by thermodynamics. In other words, the nucleation process of CaCO3 particles was completed within 120 min, and then small particles began to agglomerate over time [15].
The XRD patterns of CaCO3 are shown in Figure 7, which were obtained at the reaction time ranging from 1 to 8 h and the reaction temperature of 100 °C with 160 g/L CO2SM. As shown in Figure 7a, all the samples were pure vaterite crystals because their main peaks at 24.7° correspond to the 110 phase of vaterite. The polymorph composition of CaCO3 crystals are listed in Table 3. The FTIR spectra in Figure 7b showed that all the samples displayed three vibration bands at 1083, 875, and 745 cm−1, which confirmed the presence of vaterite.
It was suggested that the reaction time could affect the size of CaCO3, which may have been because of the fast nucleation rate of CaCO3, but it hardly impacted the morphology and crystal phase of CaCO3 crystals.
3.4. Continuous Preparation of CaCO3 Microspheres
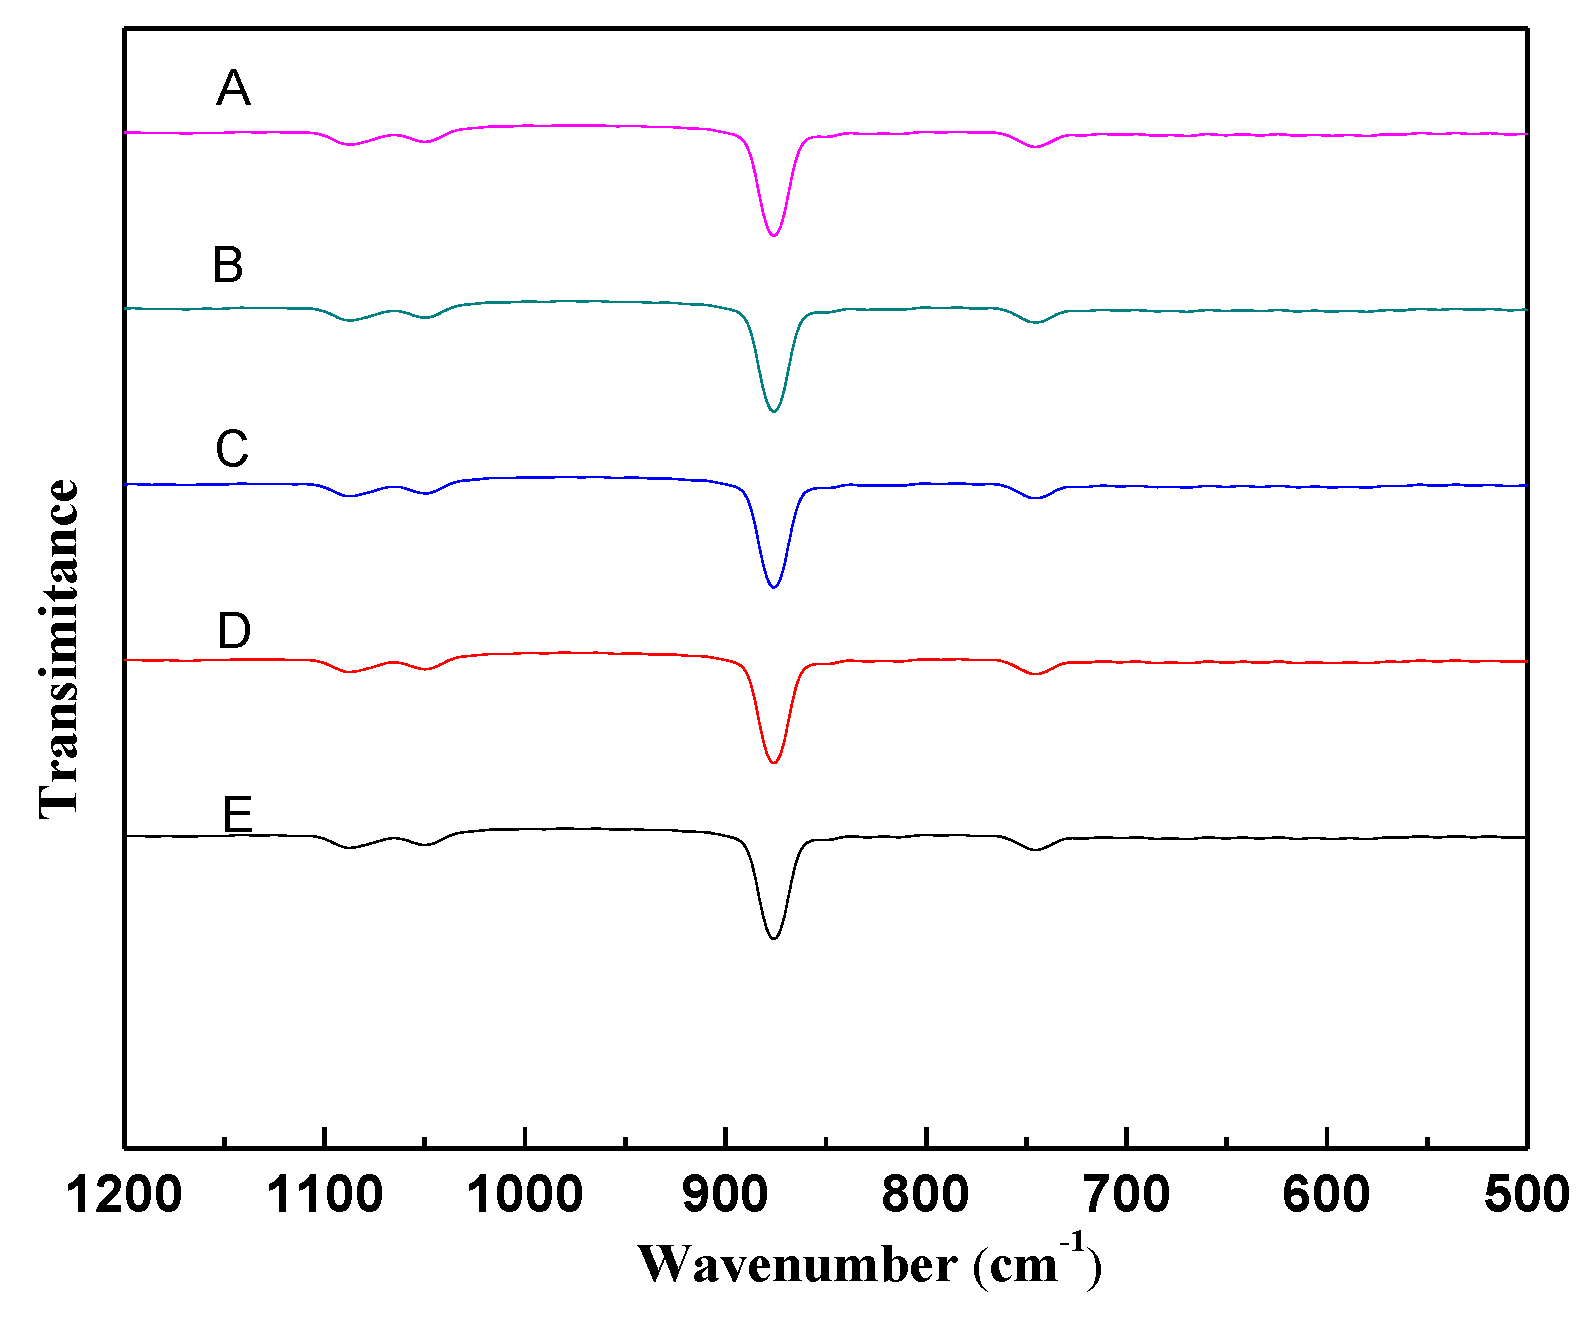
The system consisting of equimolar EDA + PEG reacted with CO2 to yield CO2SM, which was added into Ca(OH)2 solution to prepare CaCO3 precipitate via the hydrothermal process. Then, the mixture of precipitate and solution was separated via vacuum filtration to obtain CaCO3 powder and filtrate. Subsequently, CO2 was bubbled into filtrate before the Ca(OH)2 solution was added. The mixing solution was reacted at 100 °C and 160 g L−1 CO2SM for 2 h. The process was recirculated five times. The characteristic peaks of products in FTIR were found at 877 and 745 cm−1, as shown in Figure 8, which were ascribed to the CO32− group of the vaterite phase, indicating that the uniform crystalline phase of CaCO3 crystals could still be obtained after filtration.
3.5. Possible Preapared Mechanism of as-Obtained CaCO3 Microspheres
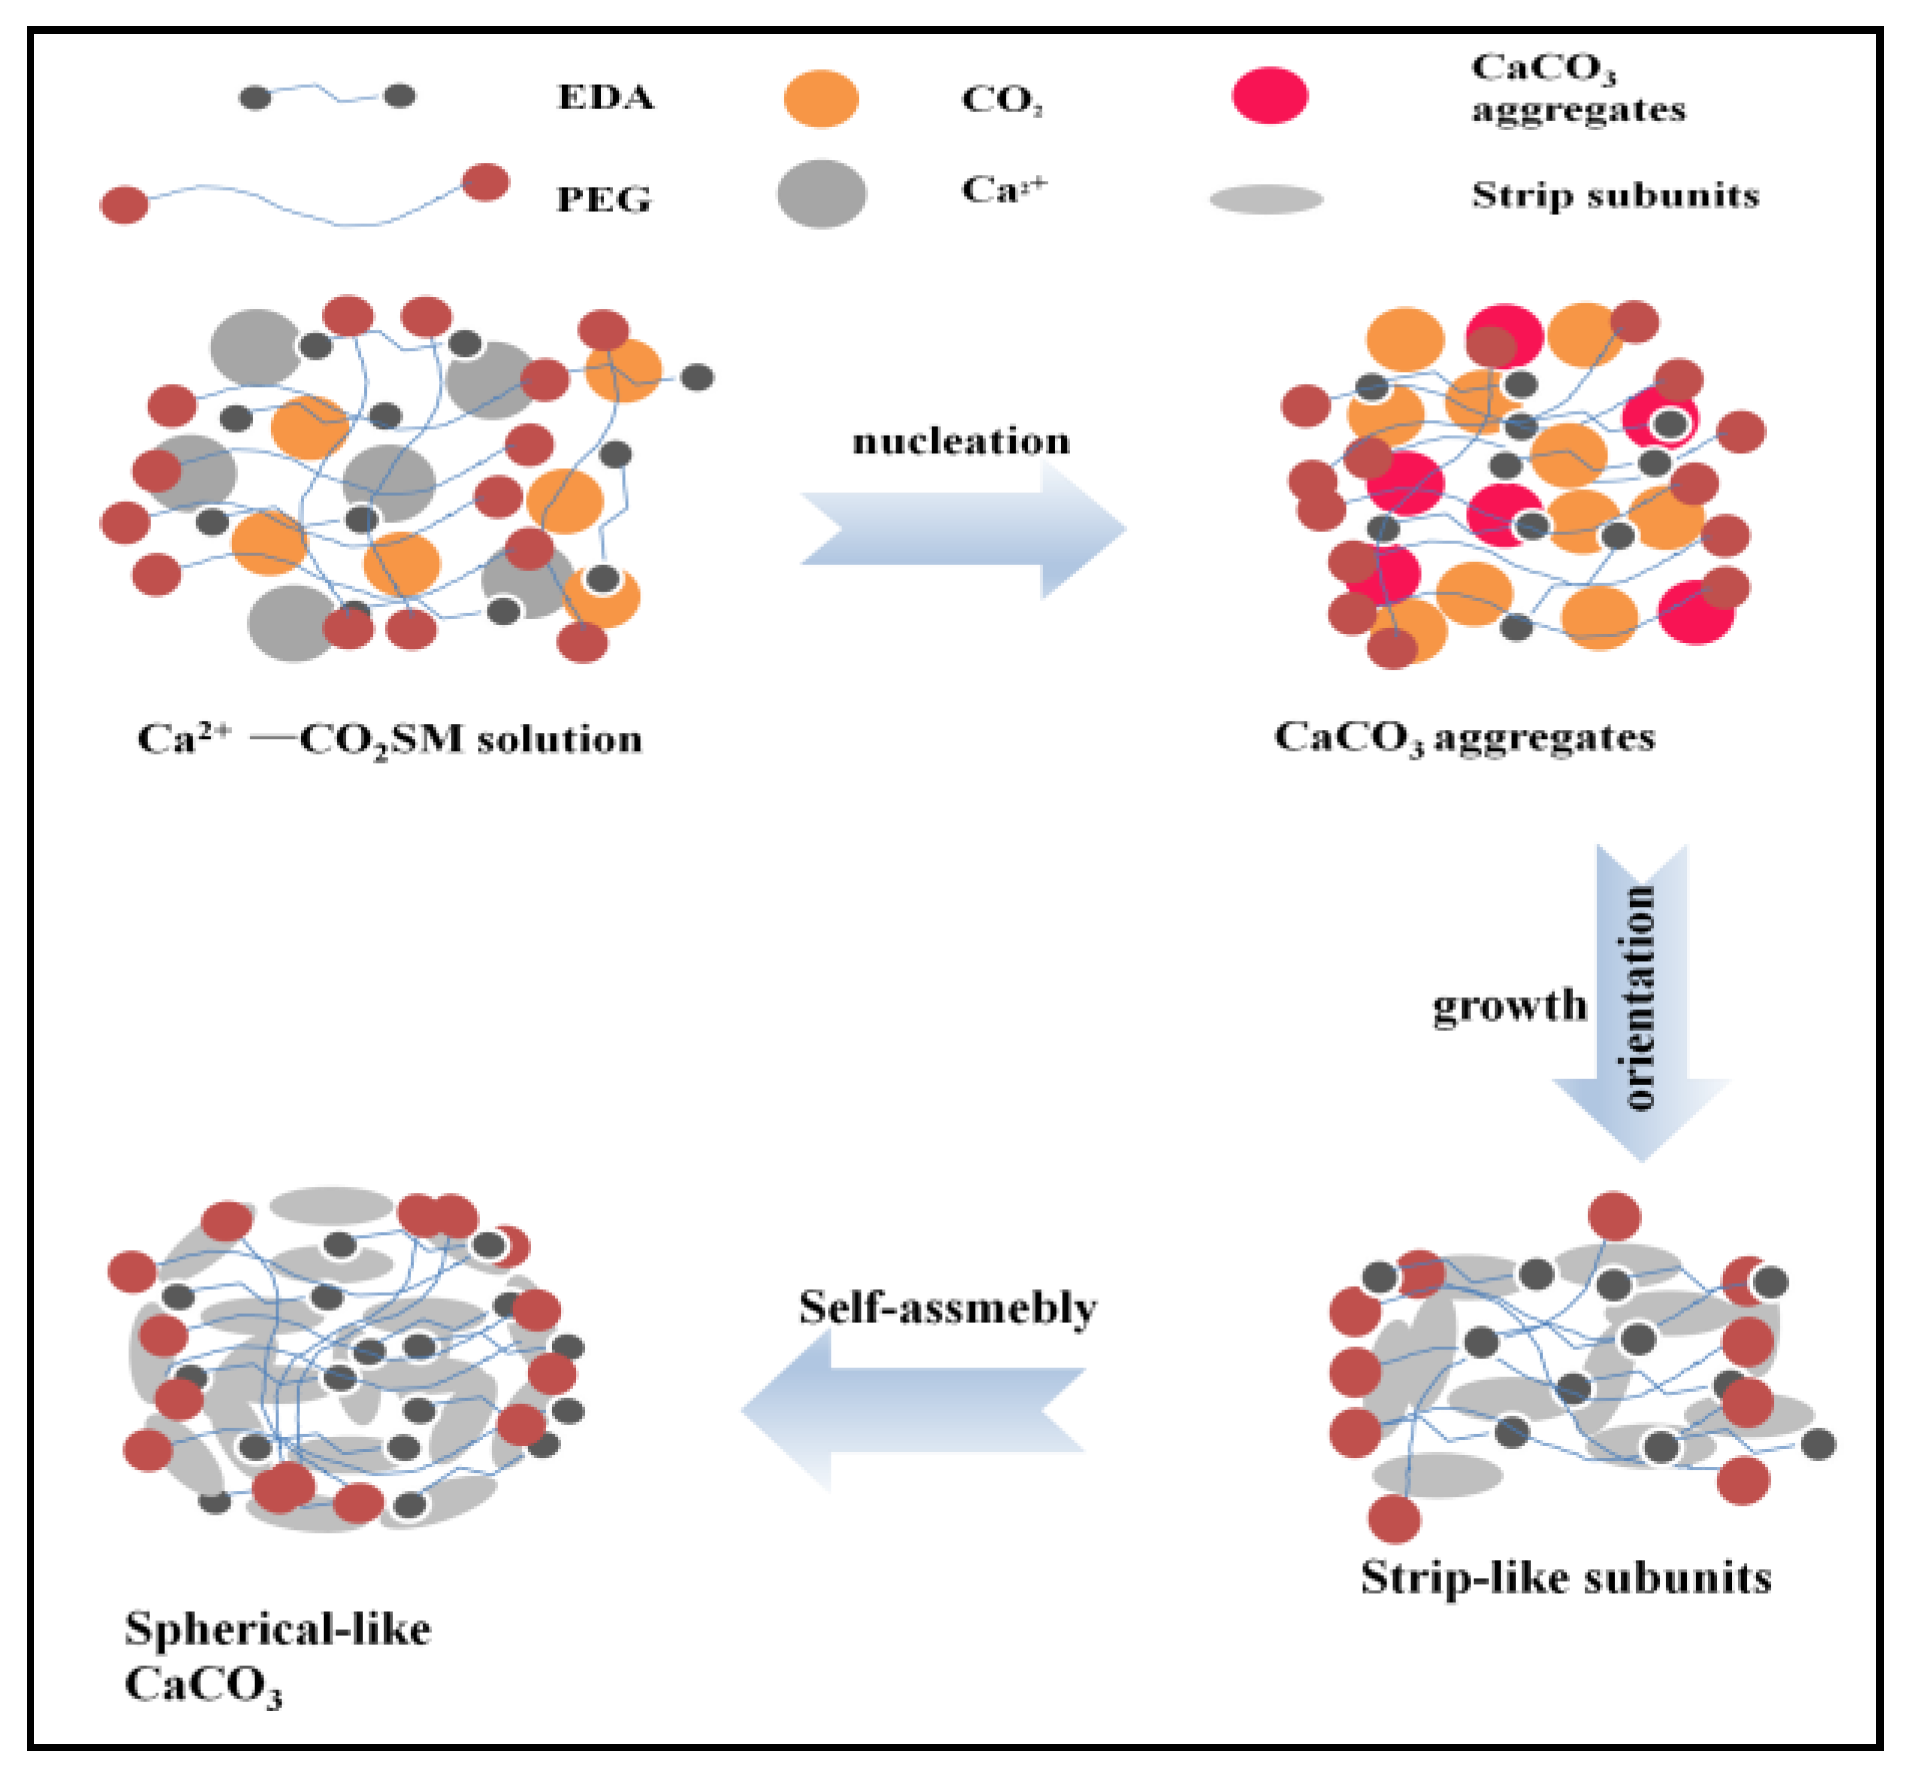
In this process (Figure 9), EDA would play pH-adjusting agent roles and PEG would play co-solvent roles in the growing process of CaCO3 crystals [35,36,37,41]. The CO2, which was released from the CO2SM, transformed to CO32− via the zwitterion mechanism, and at the same time, the CO2SM produced RNH3+ and HCO3− at a higher pH (pH > 8) and subsequently abstracted H+ by OH− to produce CO32−. On the other hand, the lone-pair electrons of O in -OH and N in NH3 showed the strong electrostatic interactions between PEG and Ca ions in the mixing solution [35,42,43,44,45]. Therefore, the formation mechanism of CaCO3 crystals was as follows:
RNH2 + CO2 + H2O → RNH3+ + HCO3−
RNH2 + H2O → RNH3+ + OH−
2RNH3+ + CaX2 → 2RNH2 + Ca2+ + 2HX(X= Cl−, NO3−, Br−, CH3COO−)
PEG + Ca2+ → PEG-Ca2+
2PEG-Ca2+ + 2HCO3− + 2OH− → 2CaCO3 + 2H2O + 2PEG
The normal polymorph phase transformation of CaCO3 is vaterite to calcite. The reverse phase transformation was observed in the systems as a result of the electrostatic interactions between surface layers containing two orientations of the CO32− groups, and the calcium-rich surface promotes the crystallization of calcite.
As known by crystal growth kinetics, the growth rate of CaCO3 crystals on one special direction might slow down due to the fact that the crystal adsorbs PEG and/or EDA on the same surface, which might lead to an isotropic growth of the crystal [46,47]. Thus, it is known that the concentration of PEG and EDA, which is directly related from CO2SM, was of great significance in the CaCO3 crystallization processes. The higher the CO2SM concentration, the higher the EDA and PEG concentrations, which leads to more chances for collisions between different ions and the further formation of spherical particles.
3.6. Properties of CaCO3 Microspheres
To further know the properties of the CaCO3 microspheres, including the crystalline phase transformation and compositions, we further systematically investigated the spherical-like CaCO3 micro-particles.
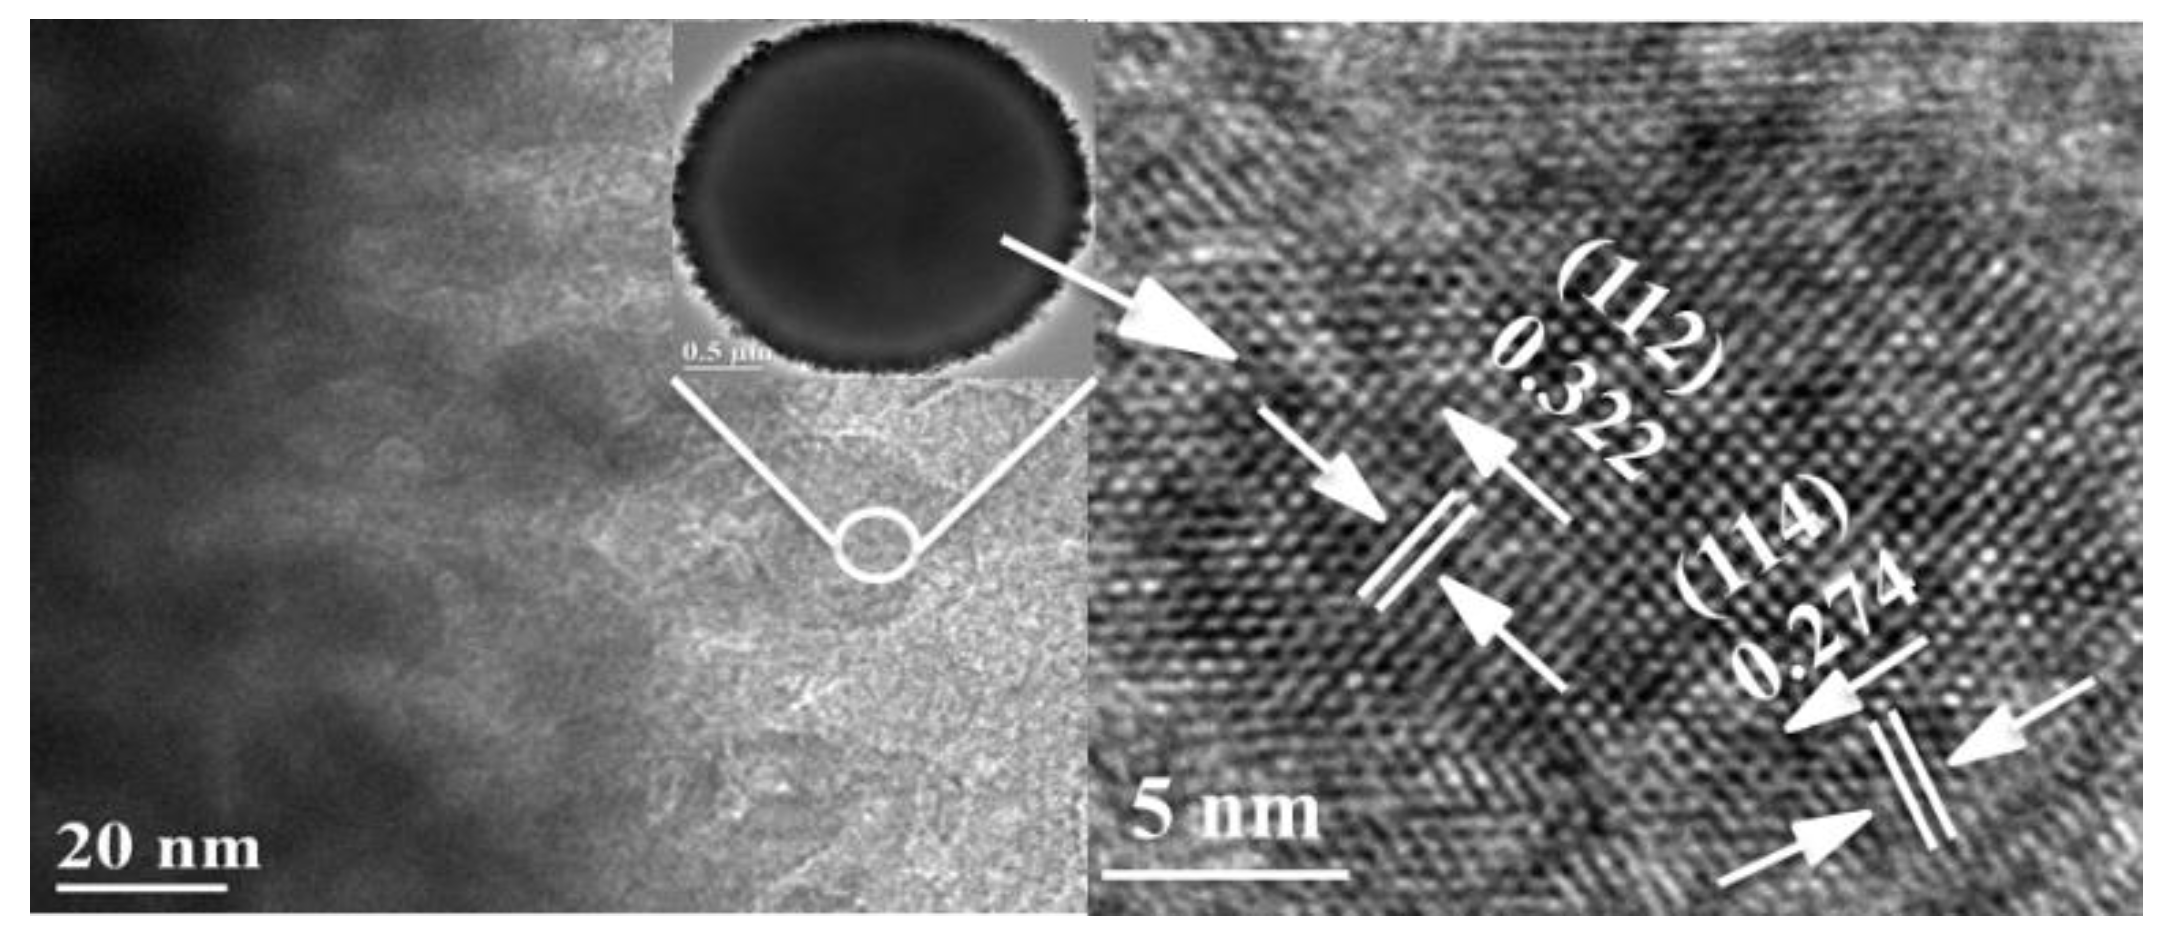
3.6.1. HR-TEM
3.6.2. TGA-DSC
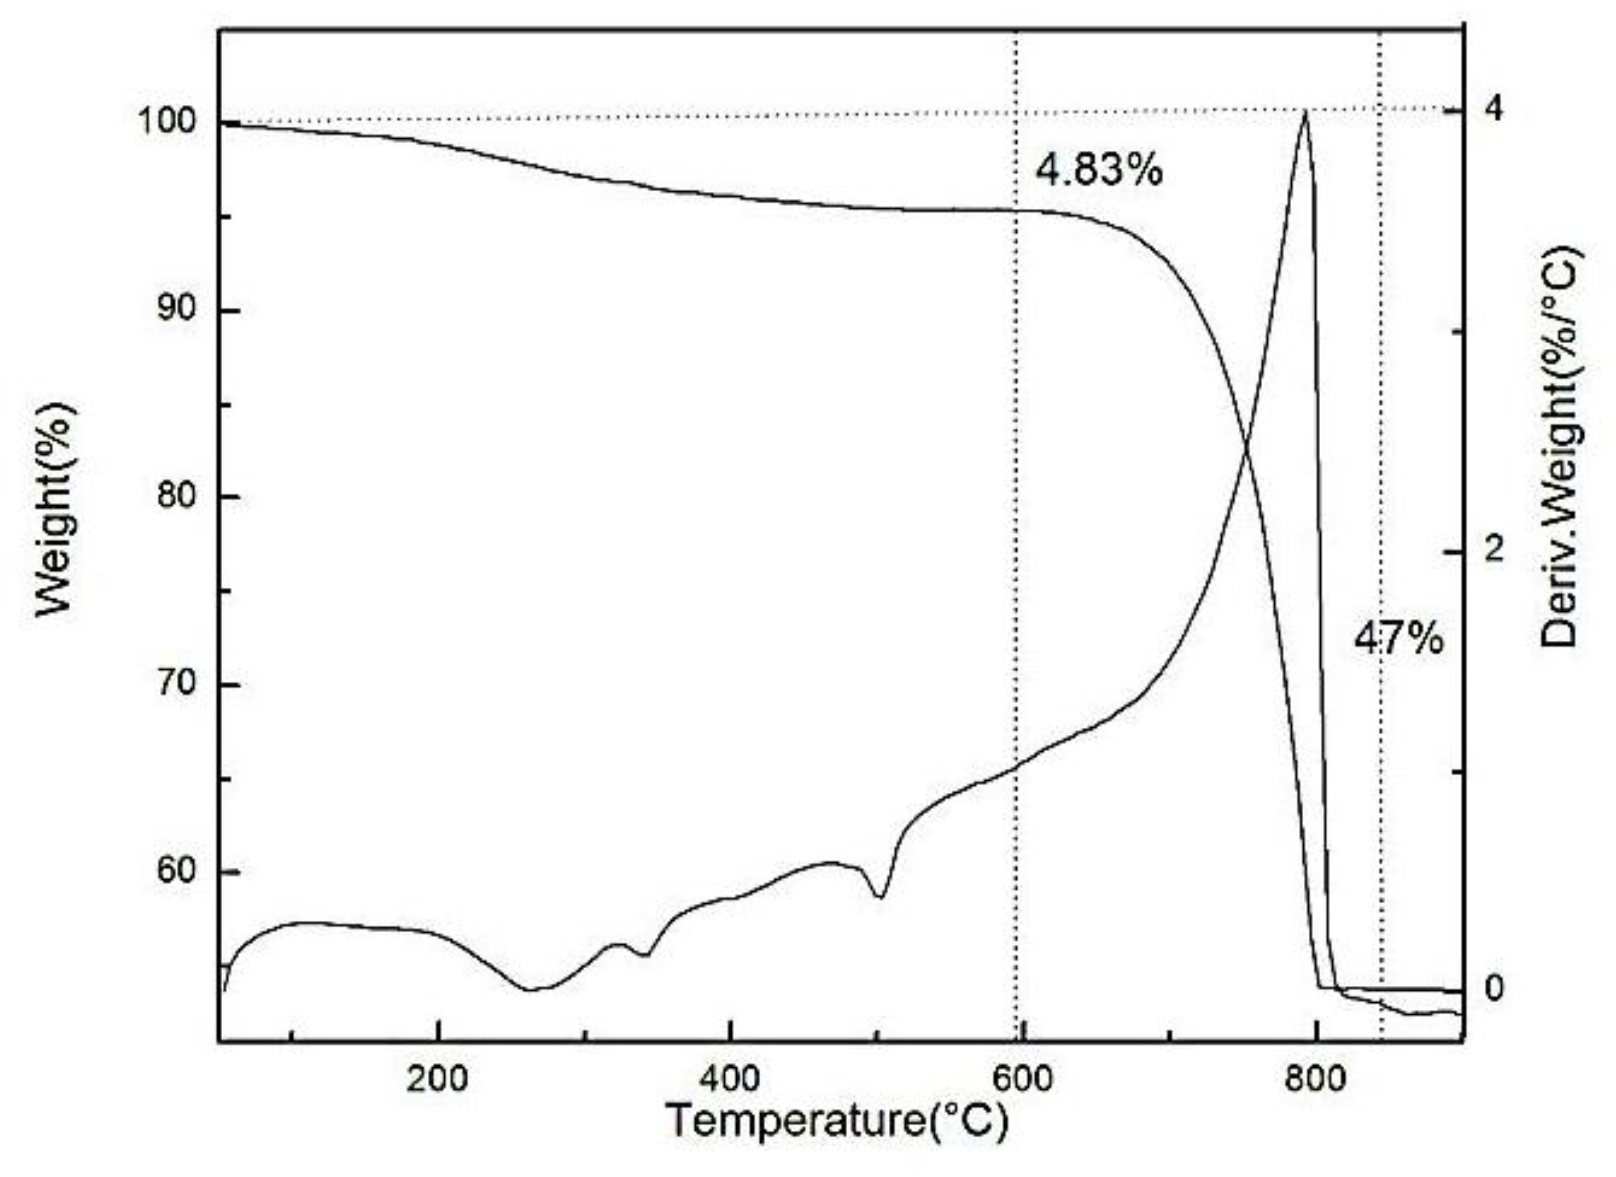
TGA refers to the relationship between the mass of the sample to be measured and the temperature change under programmed temperature control. DSC refers to the relationship between the power difference (e.g. in the form of heat) input to the sample and the reference material and the temperature under programmed temperature control.
The spherical CaCO3 microspheres were also analyzed by using TGA-DSC, and the result is shown in Figure 11. At the first stage of weight loss from the origin temperature at 592 °C, the weight loss rate of CaCO3 microspheres was 4.83%, which is attributed to the volatilization of organic matters contained on the surface of CaCO3 microspheres. At 790 °C, a very strong exothermic peak was observed in the DSC curve, which was caused by the thermal decomposition of CaCO3 via the following reaction: CaCO3 → CaO + CO2↑ [49].
3.6.3. Surface Area and Pore Diameter
The N2 adsorption–desorption curve and pore size distribution curve were also studied to evaluate the property of CaCO3 microspheres. A specific surface area of CaCO3 microspheres arrived at 152.04 m2/g. Their average pore diameter and pore volume were determined to be 3.862 nm and 0.245 cc/g, respectively.
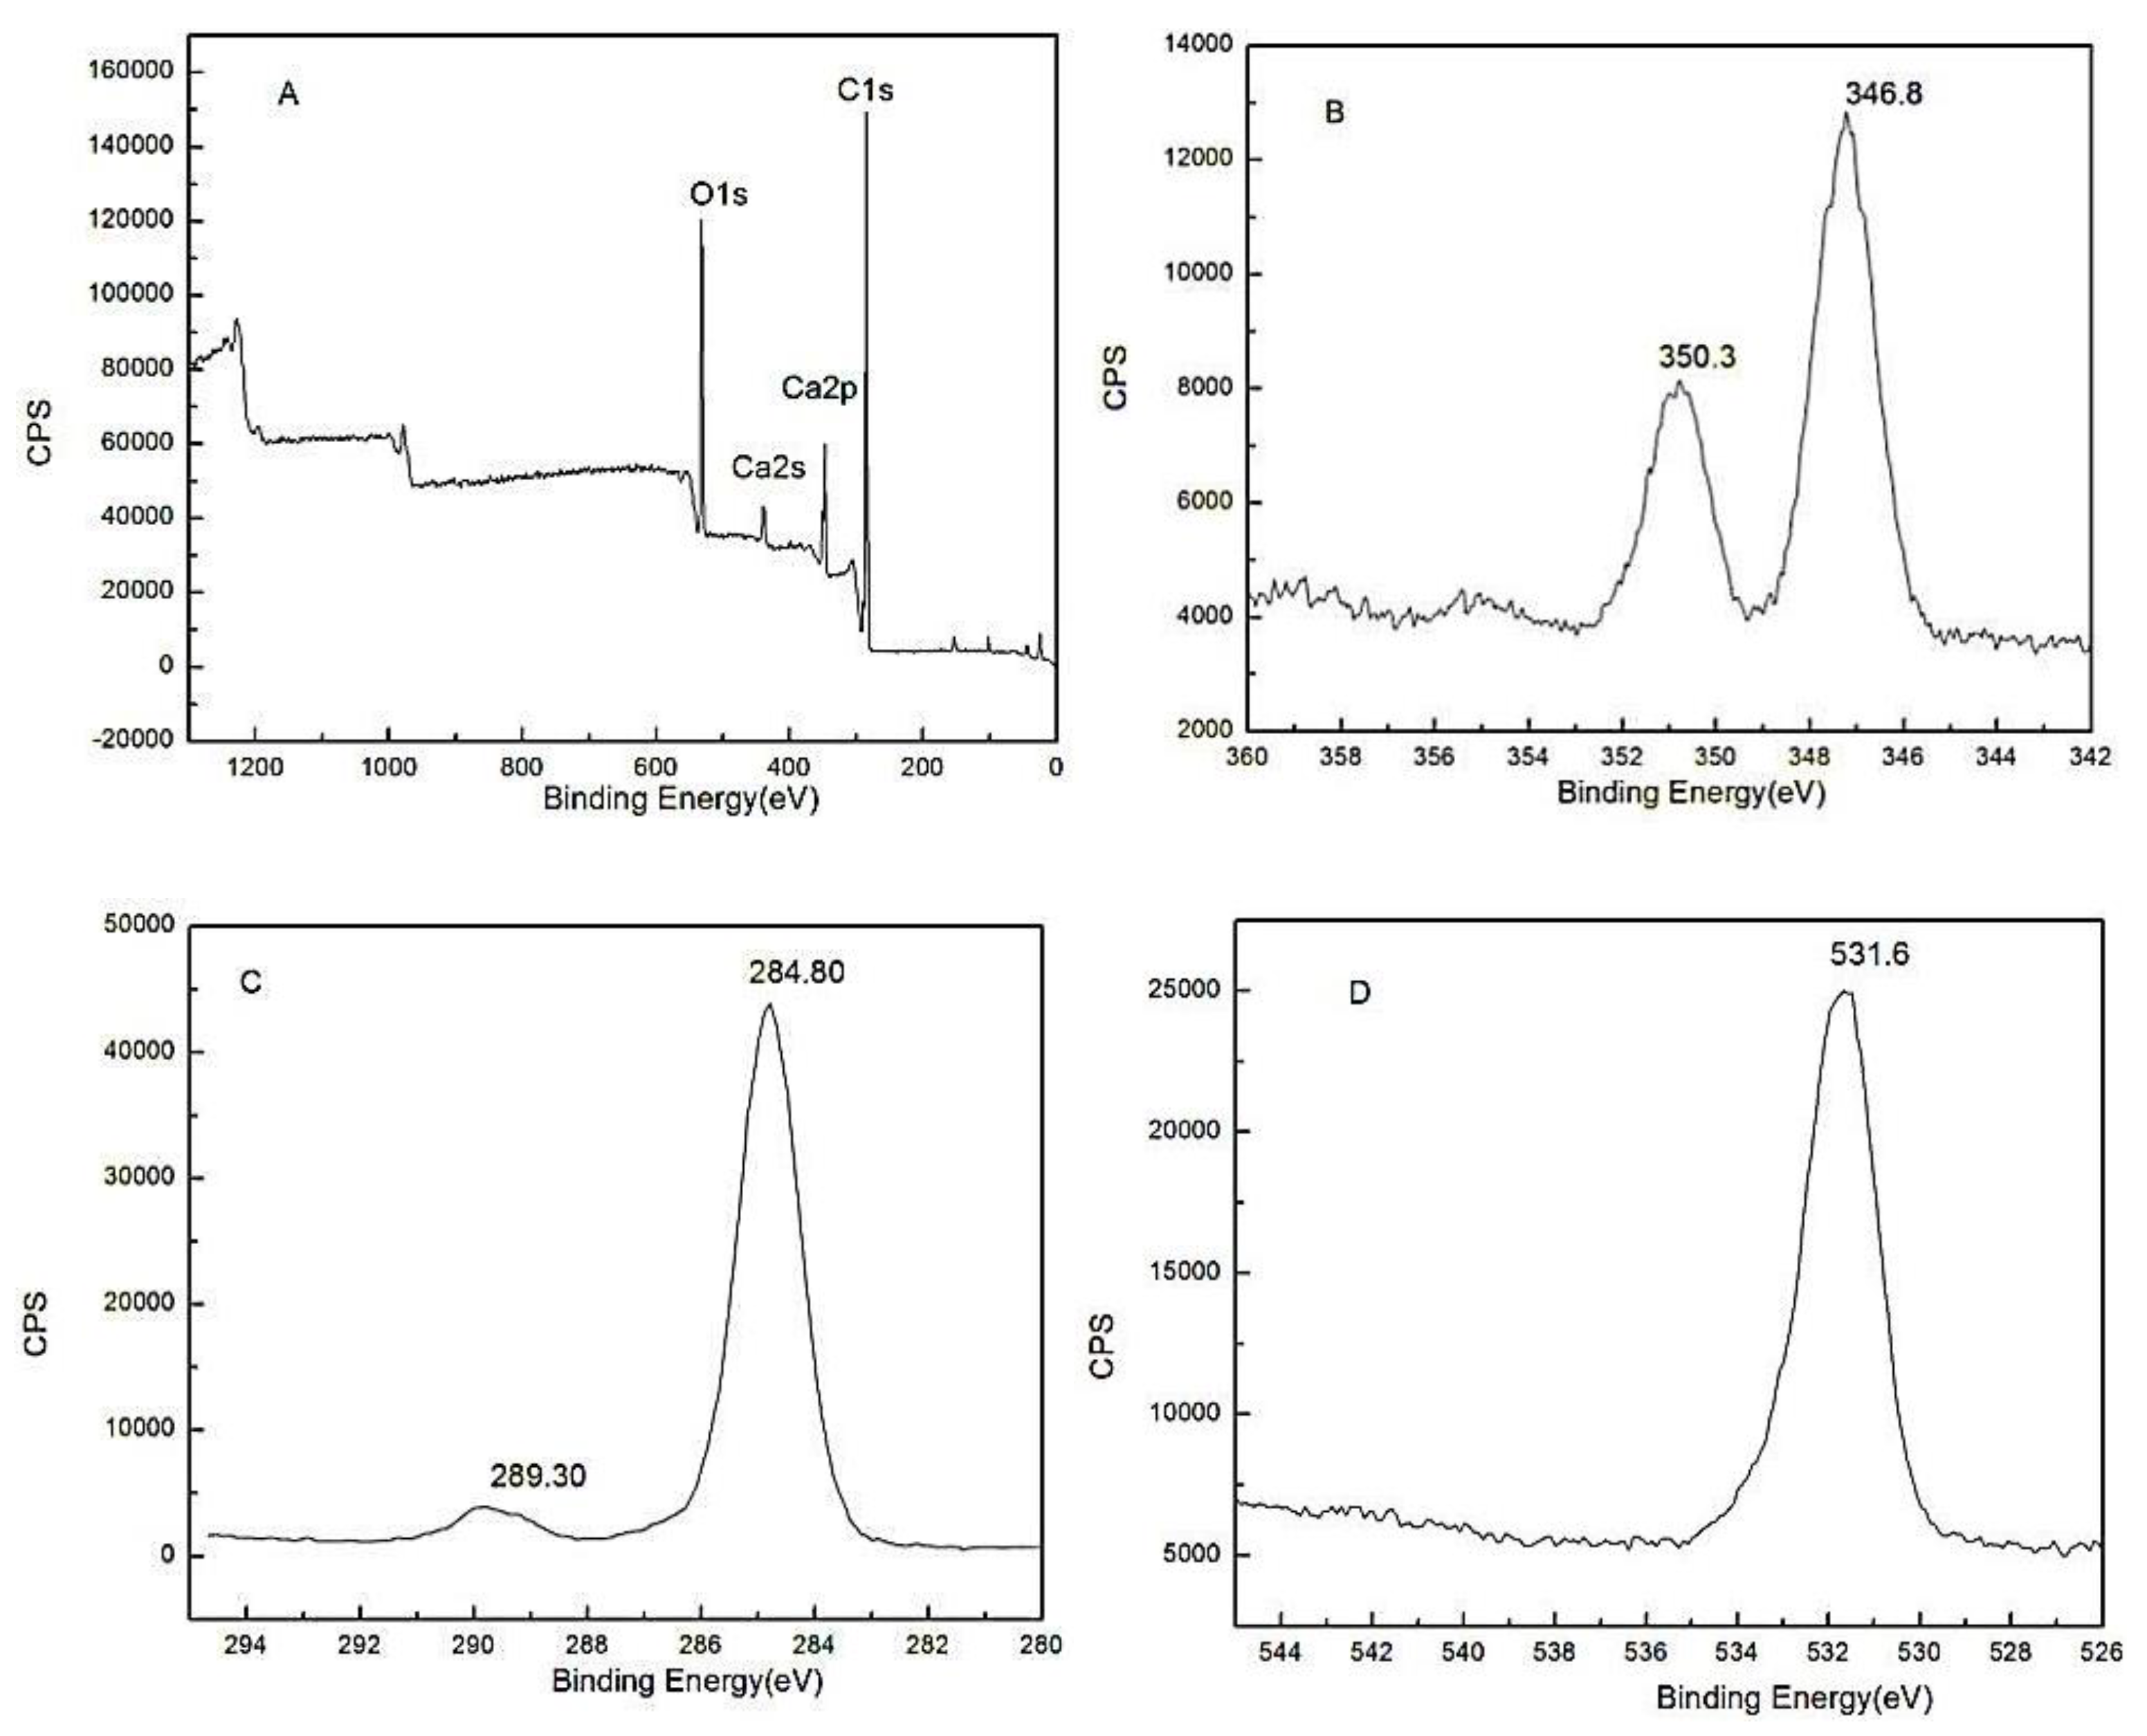
3.6.4. XPS and EDX
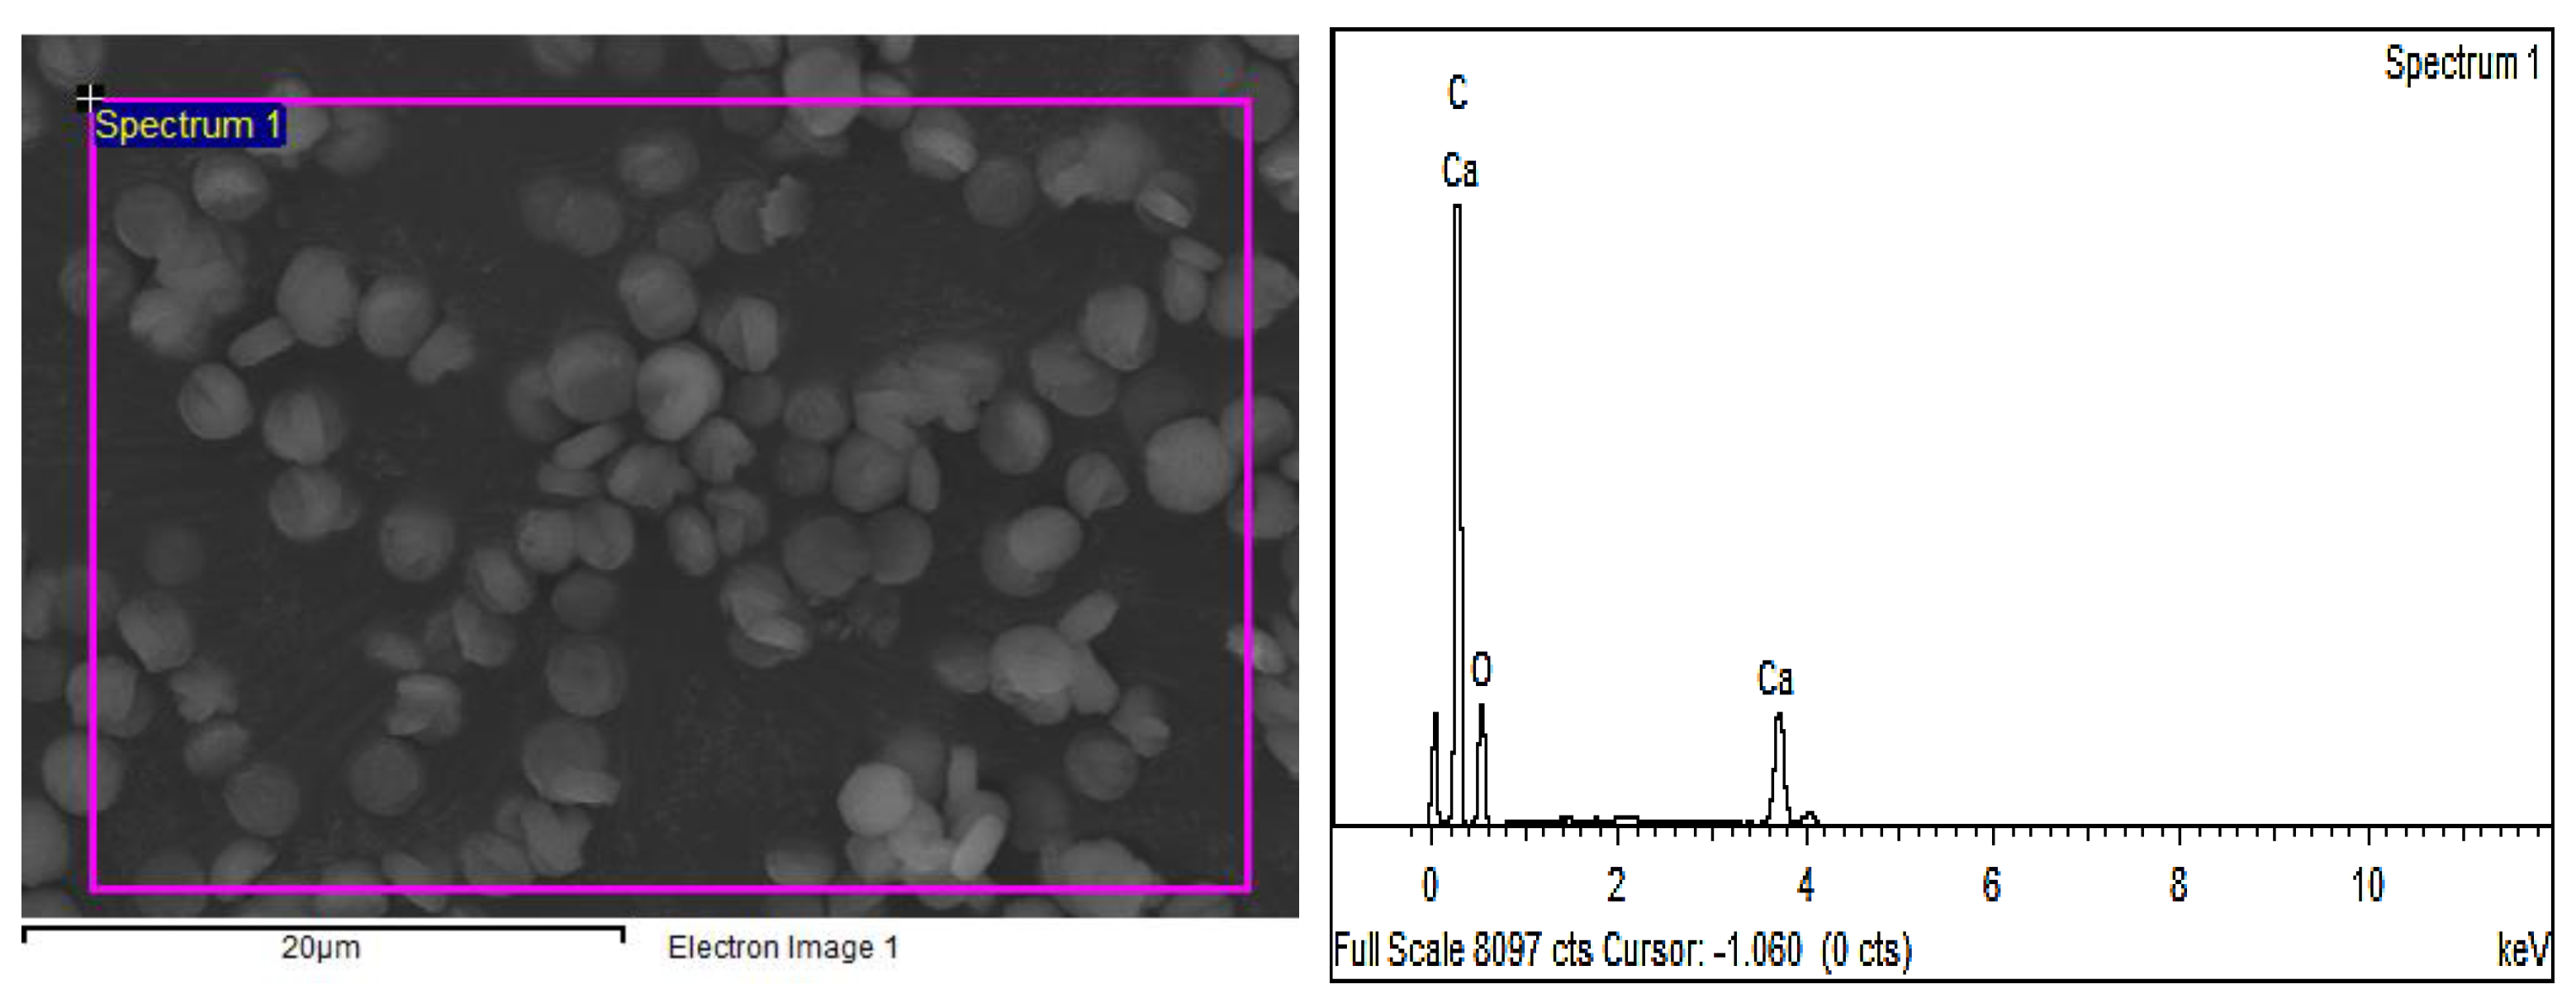
EDX refers to the determination of elements in samples according to the different characteristic X-ray wavelengths of different elements.
The microspheres of CaCO3 were also analyzed by XPS and EDX, which are shown in Figure 12 and Figure 13. From the EDX and XPS spectra, as-prepared CaCO3 microspheres contained C, O, and Ca elements, but other elements were not observed, partially because of the low content of EDA and PEG in CaCO3 microspheres.
4. Conclusions
CO2SM, which was obtained by absorbing CO2 via the EDA + PEG binary system solution, was mixed with Ca(OH)2 to prepare CaCO3 microspheres via hydrothermal reactions. The suitable preparation conditions were confirmed as follows: a CO2SM concentration of 160 g/L, a reaction temperature of 100 °C, and a reaction time of 2 h. The as-prepared CaCO3 crystals were homogeneous pure vaterite phase and the properties of CaCO3 microspheres was confirmed. In addition, the uniform crystalline phase of CaCO3 crystals could still be obtained after five times of cyclic preparation by filtrate. The as-obtained CaCO3 by this method has high purity and uniform particle size, which may have a good application prospect in the paper industry.
Author Contributions
Conceptualization, H.G., Z.W. and J.Z.; methodology, X.M., Z.W. and J.Z.; software, X.M. and L.Z.; validation, H.G., Z.W. and J.Z.;; formal analysis, X.M., L.Z., F.S. and H.S.; investigation, X.M.; resources, H.G., Z.W. and J.Z.; data curation, H.G., Z.W. and J.Z.; writing—original draft preparation, X.M. and L.Z.; writing—review and editing, X.M., L.Z., F.S. and H.S.; visualization, X.M. and L.Z.; supervision, H.G., Z.W. and J.Z.; project administration, H.G., Z.W. and J.Z.; funding acquisition, H.G., Z.W. and J.Z.
Funding
We are grateful for the financial support provided by the National Natural Science Foundation of China (NSFC, 21666027), Key Laboratory of Coal-based CO2 Capture and Geological Storage (Jiangsu Province, China University of Mining and Technology, 2016A06), the Natural Science Foundation of Inner Mongolia Autonomous Region (2016JQ02), the Program for Grassland Excellent Talents of Inner Mongolia Autonomous Region, the Inner Mongolia Science and Technology Key Projects, and Undergraduate Innovation Fund of Inner Mongolia University of Technology (2016).
Conflicts of Interest
There are no conflicts to declare.
Nomenclature
The checklist of nomenclature abbreviation:
| Origin Vocabulary | Abbreviations |
| Calcium carbonate | CaCO3 |
| CO2-storage material | CO2SM |
| Carbon dioxide | CO2 |
| ethylenediamine | EDA |
| polyethylene glycol 400 | PEG400 |
| calcium hydroxide | Ca(OH)2 |
| CO2 capture and utilization | CCU |
| carbon capture and storage | CCS |
| scanning electron microscope | SEM |
| high resolution transmission electron microscope | HR-TEM |
| X-ray diffractometer | XRD |
| Fourier Transform infrared spectroscopy | FTIR |
| Thermogravimetric analysis | TGA |
| X-ray photoelectron spectroscopy | XPS |
References
- Barelli, L.; Bidini, G.; Gallorini, F. CO2 capture with solid sorbent: CFD model of an innovative reactor concept. Appl. Energ. 2016, 162, 58–67. [Google Scholar] [CrossRef]
- Li, B.; Duan, Y.; Luebke, D.; Morreale, B. Advances in CO2 capture technology: A patent review. Appl. Energ. 2013, 102, 1439–1447. [Google Scholar] [CrossRef]
- Luo, X.L.; Hu, J.H.; Zhao, J.; Zhang, B.; Chen, Y.; Mo, S. Multi-objective optimization for the design and synthesis of utility systems with emission abatement technology concerns. Appl. Energ. 2014, 136, 1110–1131. [Google Scholar] [CrossRef]
- Li, B.H.; Zhang, N.; Smith, R. Simulation and analysis of CO2 capture process with aqueous monoethanolamine solution. Appl. Energ. 2016, 161, 707–717. [Google Scholar] [CrossRef]
- Cheung, O.; Bacsik, Z.; Liu, Q.; Mace, A.; Hedin, N. Adsorption kinetics for CO2 on highly selective zeolites NaKA and nano-NaKA. Appl. Energ. 2013, 112, 1326–1336. [Google Scholar] [CrossRef]
- Zheng, Q.H.; Farrauto, R.; Nguyen, A.C. Adsorption and methanation of flue gas CO2 with dual functional catalytic materials: A parametric study. Ind. Eng. Chem. Res. 2016, 55, 6768–6776. [Google Scholar] [CrossRef]
- Aliakbar, H.; Yang, J.H.; Tohidi, B.; Chuvilin, E.; Istomin, V. CO2 capture by injection of flue gas or CO2–N2 mixtures into hydrate reservoirs: Dependence of CO2 capture efficiency on gas hydrate reservoir conditions. Environ. Sci. Technol. 2018, 52, 4324–4330. [Google Scholar]
- Gimeno, B.; Manuela, A.; Velasco, I.; Fernandez, J.; Blanco, S.T. Influence of SO2 on CO2 transport by pipeline for carbon capture and storage technology: Evaluation of CO2/SO2 capture. Energ. Fuel. 2018, 32, 8641–8657. [Google Scholar] [CrossRef]
- Yin, W.; Alexis, G.; Iban, A.; Yang, C.Z.; Tarascon, J.M. Electrochemical reduction of CO2 mediated by quinone derivatives: Implication for Li–CO2 battery. J. Phys. Chem. C 2018, 122, 6546–6554. [Google Scholar] [CrossRef]
- Niklas, A.; Leonard, J.M.; Annette, S.; Philip, V.; Andre, B. Selecting CO2 sources for CO2 utilization by environmental-merit-order curves. Environ. Sci. Technol. 2016, 50, 1093–1101. [Google Scholar]
- Yuan, M.; Gao, G.; Hu, X.Y.; Luo, X.; Huang, Y.Q.; Jin, B.; Liang, Z.W. Premodified sepiolite functionalized with triethylenetetramine as an effective and inexpensive adsorbent for CO2 capture. Ind. Eng. Chem. Res. 2018, 57, 6189–6200. [Google Scholar] [CrossRef]
- Lee, M.G.; Kang, D.W.; Yoo, Y.; Jo, H.; Song, H.J.; Prk, J. Continuous and simultaneous CO2 absorption, calcium extraction, and production of calcium carbonate using ammonium nitrate. Ind. Eng. Chem. Res. 2016, 55, 11795–11800. [Google Scholar] [CrossRef]
- Vinoba, M.; Margandan, B.; Choi, S.Y.; Park, K.T.; Kim, H.J.; Jeong, S.K. Harvesting CaCO3 polymorphs from in situ CO2 capture process. J. Phys. Chem. C 2014, 118, 17556–17566. [Google Scholar] [CrossRef]
- Du, H.C.; Steinacher, M.; Borca, C.; Huthwelker, T.; Murello, A.; Stellacci, F.; Amstad, E. Amorphous CaCO3: Influence of the formation time on its degree of hydration and stability. J. Am. Chem. Soc. 2018, 140, 14289–14299. [Google Scholar] [CrossRef] [PubMed]
- Boyjoo, Y.; Pareek, V.K. Synthesis of micro and nano-sized calcium carbonate particles and their applications. J. Mater.Chem. A 2014, 2, 14270–14288. [Google Scholar] [CrossRef]
- Yan, F.; Jiang, J.G.; Li, K.M.; Tian, S.C.; Zhao, M.; Chen, X.J. Performance of coal fly ash stabilized, CaO-based sorbents under different carbonation–calcination conditions. ACS Sustain. Chem. Eng. 2015, 3, 2092–2099. [Google Scholar] [CrossRef]
- Sacia, E.R.; Ramkumar, S.; Phalak, N.; Fan, L.S. Synthesis and regeneration of sustainable CaO sorbents from chicken eggshells for enhanced carbon dioxide capture. ACS Sustain. Chem. Eng. 2013, 1, 903–909. [Google Scholar] [CrossRef]
- Sennoune, M.; Salvador, S.; Debenest, G. Impact of a CO2-enriched gas on the decarbonation of CaCO3 and the oxidation of carbon in the smoldering process of oil shale semicoke. Energ. Fuel. 2012, 26, 391–399. [Google Scholar] [CrossRef]
- Vinoba, M.; Margandan, B.; Grace, A.N.; Chu, D.H.; Nam, S.C.; Yoon, Y.; Yoon, S.H.; Jeong, S.K. CO2 absorption and sequestration as various polymorphs of CaCO3 using sterically hindered amine. Langmuir 2013, 29, 15655–15663. [Google Scholar] [CrossRef]
- Lee, S.; Sin, D.H.; Cho, K. CaCO3 precipitation and polymorph forms during CO2 sequestration from the atmosphere: Effects of the basic buffer components. Cryst. Growth Des. 2015, 15, 610–616. [Google Scholar]
- Yao, Y.; Dong, W.; Zhu, S.; Yu, X.; Yan, D. Novel morphology of calcium carbonate controlled by poly(l-lysine). Langmuir 2009, 25, 13238–13243. [Google Scholar] [CrossRef] [PubMed]
- Ihli, J.; Kulak, A.N.; Meldrum, F.C. Freeze-drying yields stable and pure amorphous calcium carbonate (ACC). Chem. Commun. 2013, 49, 3134–3136. [Google Scholar] [CrossRef] [PubMed] [Green Version]
- Grasby, S.E. Naturally precipitating vaterite (μ-CaCO3) spheres: Unusual carbonates formed in an extreme environment. Geochim. Cosmochim. Acta 2003, 67, 1659–1666. [Google Scholar] [CrossRef]
- Hu, Z.; Deng, Y. Superhydrophobic surface fabricated from fatty acid-modified precipitated calcium carbonate. Ind. Eng. Chem. Res. 2010, 49, 5625–5630. [Google Scholar] [CrossRef]
- Zhang, H.; Zeng, X.F.; Gao, Y.F. A facile method to prepare superhydrophobic coatings by calcium carbonate. Ind. Eng. Chem. Res. 2011, 50, 3089–3094. [Google Scholar] [CrossRef]
- Wang, G.; Zhu, L.; Liu, H. Self-Assembled biomimetic superhydrophobic CaCO3 coating inspired from fouling mineralization in geothermal water. Langmuir 2011, 27, 12275–12279. [Google Scholar] [CrossRef] [PubMed]
- Huber, M.; Stark, W.J.; Loher, S. Flame synthesis of calcium carbonate nanoparticles. Chem. Commun. 2005, 648–650. [Google Scholar] [CrossRef]
- Hu, L.N.; Dong, P.F.; Zhen, G.W. Preparation of active CaCO3 nanoparticles and mechanical properties of the composite materials. Mater. Lett. 2009, 63, 373–375. [Google Scholar] [CrossRef]
- Chu, D.H.; Vinoba, M.; Bhagiyalakshmi, M.; Baekb, I.H.; Namb, S.C.; Yoonb, Y.; Kim, S.H.; Jeong, S.K. CO2 mineralization into different polymorphs of CaCO3 using an aqueous-CO2 system. RSC Adv. 2013, 3, 21722–21729. [Google Scholar] [CrossRef]
- Liu, L.; Jiang, J.; Yu, S.H. Polymorph selection and structure evolution of CaCO3 mesocrystals under control of Poly(sodium 4-styrenesulfonate): Synergetic effect of temperature and mixed solvent. Cryst. Growth Des. 2014, 14, 6048–6056. [Google Scholar] [CrossRef]
- Lu, S.Q.; Lan, P.Q.; Wu, S.F. Preparation of nano-CaCO3 from phosphogypsum by Gas–Liquid–Solid reaction for CO2 sorption. Ind. Eng. Chem. Res. 2016, 55, 10172–10177. [Google Scholar] [CrossRef]
- Leukel, S.; Tremel, W. Water-Controlled crystallization of CaCO3, SrCO3, and MnCO3 from amorphous precursors. Cryst. Growth Des. 2018, 18, 4662–4670. [Google Scholar] [CrossRef]
- Sarkar, A.; Dutta, K.; Mahapatra, S. Polymorph control of calcium carbonate using insoluble layered double hydroxide. Cryst. Growth Des. 2013, 13, 204–211. [Google Scholar] [CrossRef]
- Marcela, M.; Steinbach, C.; Aflori, M.; Simona, S. Design of high sorbent pectin/CaCO3 composites tuned by pectin characteristics and carbonate source. Mater. Des. 2015, 86, 388–396. [Google Scholar]
- Xu, X.Y.; Zhao, Y.; Lai, Q.Y.; Hao, Y.J. Effect of polyethylene glycol on phase and morphology of calcium carbonate. J. Appl. Polym. Sci. 2011, 119, 319–324. [Google Scholar] [CrossRef]
- Jiang, J.X.; Ye, J.Z.; Zhang, G.W.; Gong, X.H.; Nie, L.H.; Liu, J.N. Polymorph and morphology control of CaCO3 via temperature and peg during the decomposition of Ca(HCO3)2. J. Am. Ceram. Soc. 2012, 95, 3735–3738. [Google Scholar] [CrossRef]
- Chuajiw, W.; Takatori, K.; Igarashi, T.; Hara, H.; Fukushima, Y. The influence of aliphatic amines, diamines, and amino acids on the polymorph of calcium carbonate precipitated by the introduction of carbon dioxide gas into calcium hydroxide aqueous suspensions. J. Cryst. Growth 2014, 386, 119–127. [Google Scholar] [CrossRef]
- Lakkakula, J.R.; Kurapati, R.; Tynga, I.; Abrahamse, H.D.; Raichur, A.M.; Krause, R.W.M. Cyclodextrin grafted calcium carbonate vaterite particles: Efficient system for tailored release of hydrophobic anticancer or hormone drugs. RSC Adv. 2016, 6, 104537–104548. [Google Scholar] [CrossRef]
- Ray, J.R.; Wong, W.; Jun, Y.S. Antiscaling efficacy of CaCO3 and CaSO4 on polyethylene glycol (PEG)-modified reverse osmosis membranes in the presence of humic acid: Interplay of membrane surface properties and water chemistry. Phys. Chem. Chem. Phys. 2017, 19, 5647–5657. [Google Scholar] [CrossRef]
- Cheng, G.H.; Chai, Y.M.; Chen, J.; Chen, J.; Zhang, Q.; Ji, S.L.; Ou, L.L.; Yu, Y.T. Polystyrene–divinylbenzene based nano-CaCO3 composites for the efficient removal of human tumor necrosis factor-α. Chem. Commun. 2017, 53, 7744–7747. [Google Scholar] [CrossRef]
- Zhao, Y.Y.; Li, S.X.; Yu, L.; Liu, Y.H.; Wang, X.Q.; Jiao, J.J. The preparation of calcium carbonate crystals regulated by mixed cationic/cationic surfactants. J. Cryst. Growth 2011, 324, 278–283. [Google Scholar] [CrossRef]
- Mihai, M.; Schwarz, S.; Doroftei, F.; Simionescu, B.C. Calcium carbonate/polymers microparticles tuned by complementary polyelectrolytes as complex macromolecular templates. Cryst. Growth Des. 2014, 14, 6073–6083. [Google Scholar] [CrossRef]
- Qi, R.J.; Zhu, Y.J. Microwave-Assisted synthesis of calcium carbonate (vaterite) of various morphologies in water−ethylene glycol mixed solvents. J. Phys. Chem. B 2006, 110, 8302–8306. [Google Scholar] [CrossRef] [PubMed]
- Li, Z.Q.; Xiong, Y.J.; Xie, Y. Selected-Control synthesis of ZnO nanowires and nanorods via a PEG-Assisted route. Inorg. Chem. 2003, 42, 8105–8109. [Google Scholar] [CrossRef] [PubMed]
- El-Sheikh, S.M.; El-Sherbiny, S.; Barhoum, A.; Deng, Y. Effects of cationic surfactant during the precipitation of calcium carbonate nano-particles on their size, morphology, and other characteristics. Colloids Surf. A 2013, 422, 44–49. [Google Scholar] [CrossRef]
- Guo, X.H.; Liu, L.; Wang, W.; Zhang, J.; Wang, Y.; Yu, S.H. Controlled crystallization of hierarchical and porous calcium carbonate crystals using polypeptide type block copolymer as crystal growth modifier in a mixed solution. CrystEngComm 2011, 13, 2054–2061. [Google Scholar] [CrossRef]
- Geng, X.; Liu, L.; Jiang, J.; Yu, S.H. Crystallization of CaCO3 mesocrystals and complex aggregates in a mixed solvent media using polystyrene sulfonate as a crystal growth modifier. Cryst. Growth Des. 2010, 10, 3448–3453. [Google Scholar] [CrossRef]
- Ma, L.; Zhao, B.S.; Shi, H.H.; Sha, F.; Liu, C.; Du, H.; Zhang, J.B. Controllable synthesis of two CaO crystal generations: Precursors’ synthesis and formation mechanisms. CrystEngComm 2017, 19, 7132–7145. [Google Scholar] [CrossRef]
- Ligia, M.M.C.; Sakihama, J.; Salomao, R. Characterization of porous calcium hexaluminate ceramics produced from calcined alumina and microspheres of Vaterite (μ-CaCO3). J. Eur. Ceram. Soc. 2018, 38, 5208–5218. [Google Scholar]
Figure 1.
The preparing process of morphology controlled CaCO3 micro-particles. The equimolar system ethylenediamine (EDA) + polyethylene glycol (PEG) reacted with CO2 to obtain CO2 storage material (CO2SM), which was added into the Ca(OH)2 solution to obtain CaCO3 precipitate via the hydrothermal method. Subsequently, CO2 was bubbled into filtrate before the addition of Ca(OH)2 solution, and CaCO3 particles with the same crystal phase were also recycled to obtain the same reaction conditions.

Figure 2.
Scanning electron microscope (SEM) images of CaCO3 crystals at different CO2SM concentrations (g L−1): A, 20; B, 60; C, 95; D, 120; and E, 160.
Figure 2.
Scanning electron microscope (SEM) images of CaCO3 crystals at different CO2SM concentrations (g L−1): A, 20; B, 60; C, 95; D, 120; and E, 160.

Figure 3.
XRD patterns (a) and Fourier transform infrared spectroscopy (FTIR) spectra (b) of CaCO3 crystals when the CO2SM concentrations were as follows (g L−1): A, 20; B, 60; C, 95; D, 120; and E, 160.
Figure 3.
XRD patterns (a) and Fourier transform infrared spectroscopy (FTIR) spectra (b) of CaCO3 crystals when the CO2SM concentrations were as follows (g L−1): A, 20; B, 60; C, 95; D, 120; and E, 160.

Figure 4.
SEM images of CaCO3 crystals under temperatures at 160 g L−1 CO2SM solution for 2 h (°C): A, 80; B, 90; C, 100; D, 110; and E, 120.
Figure 4.
SEM images of CaCO3 crystals under temperatures at 160 g L−1 CO2SM solution for 2 h (°C): A, 80; B, 90; C, 100; D, 110; and E, 120.

Figure 5.
XRD patterns (a) and FTIR spectra (b) of CaCO3 crystals with different reaction temperatures at 160 g L−1 CO2SM solution for 2 h (°C): A, 80; B, 90; C, 100; D, 110; and E, 120.
Figure 5.
XRD patterns (a) and FTIR spectra (b) of CaCO3 crystals with different reaction temperatures at 160 g L−1 CO2SM solution for 2 h (°C): A, 80; B, 90; C, 100; D, 110; and E, 120.

Figure 6.
SEM images of CaCO3 crystals with different times at 100 °C and 160 g L−1 (h): A, 1; B, 2; C, 4; D, 6; and E, 8.
Figure 6.
SEM images of CaCO3 crystals with different times at 100 °C and 160 g L−1 (h): A, 1; B, 2; C, 4; D, 6; and E, 8.

Figure 7.
XRD patterns (a) and FTIR spectra (b) of CaCO3 crystals with different times at 100 °C and 160 g L−1 (h): A, 1; B, 2; C, 4; D, 6; and E, 8.
Figure 7.
XRD patterns (a) and FTIR spectra (b) of CaCO3 crystals with different times at 100 °C and 160 g L−1 (h): A, 1; B, 2; C, 4; D, 6; and E, 8.

Figure 8.
FTIR spectra of CaCO3 crystals prepared with five cycles: A: firstly, B: secondly, C: thirdly, D: fourthly, and E: fifthly.
Figure 8.
FTIR spectra of CaCO3 crystals prepared with five cycles: A: firstly, B: secondly, C: thirdly, D: fourthly, and E: fifthly.

Figure 9.
Possible prepared mechanism of as-obtained CaCO3 microspheres.

Figure 10.
High resolution transmission electron microscope (HR-TEM) of as-obtained CaCO3 microspheres.
Figure 10.
High resolution transmission electron microscope (HR-TEM) of as-obtained CaCO3 microspheres.

Figure 11.
Thermogravimetric analysis curves of as-obtained CaCO3 microspheres.

Figure 12.
XPS spectra of as-obtained CaCO3 microspheres. A: the total element; B: calcium element; C: carbon element; D: oxygen element.
Figure 12.
XPS spectra of as-obtained CaCO3 microspheres. A: the total element; B: calcium element; C: carbon element; D: oxygen element.

Figure 13.
EDX results of as-obtained CaCO3 microspheres.


Table 1.
The reaction conditions and polymorph composites of as-obtained CaCO3 crystals under different CO2SM concentrations at 100 °C for 2 h.
Table 1.
The reaction conditions and polymorph composites of as-obtained CaCO3 crystals under different CO2SM concentrations at 100 °C for 2 h.
| Sample a | Reaction Conditions b(CO2SM g/L; pH) | Polymorph Composition c (%) | ||
|---|---|---|---|---|
| Calcite | Aragonite | Vaterite | ||
| A | 20; 9.33 | 20.60 | 0 | 79.40 |
| B | 60; 8.75 | 0 | 0 | 100 |
| C | 95; 8.57 | 0 | 0 | 100 |
| D | 120; 8.53 | 0 | 0 | 100 |
| E | 160; 8.49 | 0 | 0 | 100 |
a The Ca(OH)2 saturated liquid was 50 mL. b The unit of g/L was calculated by CO2SM dispersed in Ca(OH)2 saturated liquid. c Results were calculated by the X-ray diffractometer (XRD) patterns.
Table 2.
The reaction conditions and polymorph composites of as-obtained CaCO3 crystals under different temperatures in 160 g L−1 CO2SM solution for 2 h.
Table 2.
The reaction conditions and polymorph composites of as-obtained CaCO3 crystals under different temperatures in 160 g L−1 CO2SM solution for 2 h.
| Samples a | Preparation Conditions b (°C) | Polymorph Compost c (%) | ||
|---|---|---|---|---|
| Calcite | Aragonite | Vaterite | ||
| A | 80 | 0 | 0 | 100 |
| B | 90 | 0 | 0 | 100 |
| C | 100 | 0 | 0 | 100 |
| D | 110 | 0 | 0 | 100 |
| E | 120 | 0 | 0 | 100 |
a The Ca(OH)2 saturated liquid was 50 mL. b The unit of g/L was calculated by CO2SM dispersed in Ca(OH)2 saturated liquid. c Results were calculated by the XRD patterns.
Table 3.
The reaction conditions and polymorph composites of as-obtained CaCO3 crystals with different reaction times at 100 °C and in 160 g L−1 CO2SM solution.
Table 3.
The reaction conditions and polymorph composites of as-obtained CaCO3 crystals with different reaction times at 100 °C and in 160 g L−1 CO2SM solution.
| Samples a | Preparation Conditions b (min) | Polymorph Compost c (%) | ||
|---|---|---|---|---|
| Calcite | Aragonite | Vaterite | ||
| A | 60 | 0 | 0 | 100 |
| B | 120 | 0 | 0 | 100 |
| C | 240 | 0 | 0 | 100 |
| D | 360 | 0 | 0 | 100 |
| E | 480 | 0 | 0 | 100 |
a The Ca(OH)2 saturated liquid was 50 mL. b The unit of g/L was calculated by CO2SM dispersed in Ca(OH)2 saturated liquid. c Results were calculated by the XRD patterns.
© 2019 by the authors. Licensee MDPI, Basel, Switzerland. This article is an open access article distributed under the terms and conditions of the Creative Commons Attribution (CC BY) license (http://creativecommons.org/licenses/by/4.0/).
Share and Cite
MDPI and ACS Style
Meng, X.; Zhao, L.; Guo, H.; Sha, F.; Shi, H.; Wu, Z.; Zhang, J. Utilization of a CO2 Storage Material: Shape-Controlled Preparation of CaCO3 Microspheres. Crystals 2019, 9, 433. https://0-doi-org.brum.beds.ac.uk/10.3390/cryst9080433
AMA Style
Meng X, Zhao L, Guo H, Sha F, Shi H, Wu Z, Zhang J. Utilization of a CO2 Storage Material: Shape-Controlled Preparation of CaCO3 Microspheres. Crystals. 2019; 9(8):433. https://0-doi-org.brum.beds.ac.uk/10.3390/cryst9080433
Chicago/Turabian StyleMeng, Xianlong, Long Zhao, Haitao Guo, Feng Sha, Huihu Shi, Zhaojun Wu, and Jianbin Zhang. 2019. "Utilization of a CO2 Storage Material: Shape-Controlled Preparation of CaCO3 Microspheres" Crystals 9, no. 8: 433. https://0-doi-org.brum.beds.ac.uk/10.3390/cryst9080433
Note that from the first issue of 2016, this journal uses article numbers instead of page numbers. See further details here.