Article

Dielectric Properties of Chiral Ferroelectric Liquid Crystalline Compounds with Three Aromatic Rings Connected by Ester Groups

1
Department of Physics, University of North Bengal, Siliguri 734013, West Bengal, India
2
Department of Physics, Siliguri Institute of Technology, Siliguri 734013, India
3
Institute of Physics of the Czech Academy of Sciences, 18221 Prague, Czech Republic
*
Author to whom correspondence should be addressed.
Submission received: 12 August 2019 / Revised: 1 September 2019 / Accepted: 7 September 2019 / Published: 10 September 2019
(This article belongs to the Special Issue Ferroelectric and Ferromagnetic Liquid Crystals)

Abstract

:
The tilted ferroelectric SmC* phase of three structurally different series having three aromatic rings in the core structure connected by ester groups with different end alkyl chain lengths, all of which are derived from lactic acid, have been observed by broadband dielectric spectroscopy. Introduction of structural variations within the liquid crystalline compounds has led to the formation of chiral nematic N*, or the paraelectric orthogonal SmA* phase at higher temperatures. The dielectric spectra strongly depend both on the temperature as well as the specific molecular structure of the self-assembling compounds possessing the ferroelectric polar order. The results reveal a strong Goldstone mode in the ferroelectric SmC* phase with ~kHz relaxation frequency. In the SmC* phase, the real and imaginary parts of the complex permittivity increase up to certain temperature near the SmC*-N*/SmA* transition and then decrease with increasing temperature, perhaps due to the disruption of the molecular domains at the onset of the SmA*/N* phase transition. The dielectric strength attains a maximum value in the SmC* phase and then decreases near the SmA*/N* phase transition. The dielectric strength is also influenced by the lengths of the alkyl chain and the nature of the connecting unit of the constituent molecules. The relaxation time and the relaxation frequency are found to vary with the molecular structure of the studied ferroelectric compounds.

Graphical Abstract

1. Introduction

During the last four decades, organic materials possessing self-assembling behaviour and polar ordering, known as ferroelectric mesogens, are being looked at as a smart, functional alternative in the field of high-end applications ranging from tunable lasers [1] and spatial modulators [2] to fast electro optical switching devices [3,4], wherein the subtle balance between the different molecular fragments of these anisotropic molecules crucially affect their mesomorphic behaviour [5,6,7,8,9]. The design of such molecules has a profound impact both in terms of performance as well as their applicability in modern technological gadgets [10,11,12]. Thus, the molecular structure–property relationships dominates their ultimate choice as functional materials [13]. Moreover, chiral molecules exhibiting the ferroelectric phase show advanced properties in relation to their fast switching speed and bistability [14]. Therefore, it becomes imperative to deeply probe the static and dynamic aspects of such chiral molecules in relation to their molecular structure–property behaviour. In this context, broadband dielectric spectroscopy has been found to be an important technique to observe and investigate various molecular relaxation phenomena that may occur in the ferroelectric liquid crystalline materials [15].
In continuation of our previous investigations on the molecular structure–property correlations of a few chiral ferroelectric compounds from mesomorphic, electro-optic and static dielectric measurements [16], in this work we report the dielectric spectroscopy measurements on these compounds. As reported by us earlier [16], variations within the structural organization of the molecules has resulted in a rich polymorphism with multiple chiral variants including the chiral nematic N* phase, paraelectric orthogonal smectic A* phase and ferroelectric tilted smectic C* phase which are thermodynamically stable over a comparatively large range of temperature. Dielectric spectroscopy of ferroelectric systems provides a powerful insight into the dynamic aspects of these molecules which predetermine their applicability for different practical purposes [17,18,19,20,21,22]. In general, the observed spectra in the paraelectric (SmA*), ferroelectric (SmC*) and antiferroelectric (SmC*A) phases of liquid crystals yield important information about collective processes as well as molecular modes [23,24,25,26,27,28,29]. The frequency dependent dielectric response in the orthogonal SmA* phase arises from the fluctuations of the director tilt (θ), commonly known as the soft mode (SM) [26,27]. The tilted ferroelectric SmC* phase shows two types of collective modes represented by: (i) the director fluctuation along the tilt angle direction (the soft mode (SM)) and (ii) the fluctuation of the molecules in the direction of azimuthal angle (φ), known as the Goldstone mode (GM) [28]. Since the amplitude of GM is much stronger than that of SM, usually SM is suppressed by GM in the SmC* phase and is only visible near the SmA*–SmC* phase transition [27]. This work focuses on the study of the frequency dependent relaxation mechanisms to obtain a deeper understanding of the short and long range molecular correlations [30,31,32] of structurally similar molecules so as to elucidate the missing link between the structure and properties of this class of chiral ferroelectric materials, aimed for their better tunability in optoelectronic and photonic devices. The materials investigated here show an interesting variation in the molecular fragments: Compounds with ester linkage groups in the molecular core and variable alkyl chain lengths intercepted with an occasional lateral substitution. The complex permittivity has been utilized to determine the dielectric strength (Δε), relaxation time (τr) and relaxation frequency (fr), and the temperature dependence of the relaxation time and relaxation frequency for all the investigated chiral ferroelectric liquid crystalline (FLC) compounds has been measured and the corresponding results have been interpreted.

2. Experimental

2.1. Materials

Three FLC series, namely QM n/m, E n/m and QVE n/m, have been used for spectroscopic observation. All the studied samples are characterized by different end hydrocarbon chain lengths both in the chiral and non-chiral part as well as different linking groups in the core structure. As indicated in Table 1, the hydrocarbon chain length in non-chiral and chiral parts is indicated by n and m, respectively, X denotes the linkage group of the non-chiral hydrocarbon chain with the first aromatic ring. Y denotes the linking group between first and second aromatic rings counting from the non-chiral part and the lateral substitution is indicated by Z. The details of the studied materials including the mesomorphic behaviour have already been presented in our previous publications [16,33,34,35].

2.2. Dielectric Spectroscopy Measurements

The molecular structure and the mechanism of molecular processes have been understood broadly by studying the dielectric properties. Real and imaginary parts of the complex permittivity on planarly aligned samples (i.e., in bookshelf geometry) were determined using a precision LCR meter(Agilent 4294A, Agilent Technologies, Singapore) by measuring the capacitance of the homogeneously aligned liquid crystal filled cells build-up from Indium Tin Oxide (ITO) coated glass plates with cell gap of 4.9 μm thickness (supplied by AWAT Company, Warsaw, Poland) within 40 Hz–20 MHz frequency range at different temperatures during the cooling cycle. An electric field of 0.5 V (root mean square), directed parallel to the smectic planes was applied to the sample placed inside a thermally insulated cell, the temperature of which was regulated by INSTEC mK 1000 thermo system with an accuracy of ± 0.001 K. The complex permittivity (ε*) can be expressed in terms of the real (ε′) and the imaginary (ε″) part as described in refs. [36,37,38,39,40]. In order to understand the temperature dependence of the measured dielectric relaxation processes, the complex permittivity ε*(f) can be described by the Havriliak–Negami equation [41,42] with the addition of a term responsible for the conductivity contribution:
ε * ( f ) = ε + k = 1 N Δ ε k [ 1 + ( i ω τ k ) a k ] b k i σ 0 ε 0 ( 2 π f ) S
where k = 1, 2, -, -, -, N is an integer corresponding to different relaxation processes in a particular phase. Δ ε k = [ε0ε] is the dielectric strength; ε0 and ε are the limiting values of the relative dielectric permittivity in the low and high frequency region, respectively. The frequency is depicted by f, the relaxation time is denoted by τ k = (1/2π f k ) where f k is the relaxation frequency, a k   and   b k are the distribution parameter of different relaxation processes accounting for the line width and symmetrisation parameter of the dielectric dispersion curve whose values ranges between 1 to 0. σ 0   and   ε 0   are the conductivity and the free space permittivity (8.854 pFm−1), respectively. S = 1 for pure ohmic conductors [43,44]. Δ ε k , τ k , f k of the observed relaxation mode in the SmC* phase have been determined from the Havriliak–Negami equation [41,42] from a polynomial fit to the experimental data using mathematical software.

3. Results and Discussions

3.1. Phase Behaviour

The melting points (m.p.), clearing points (c.p.) and N* /SmA* to SmC* transition temperatures, of all the studied compounds as determined from polarising optical microscopy (POM) and checked by Differential Scanning Calorimetry (DSC) measurements [16] has been shown in Table 2.

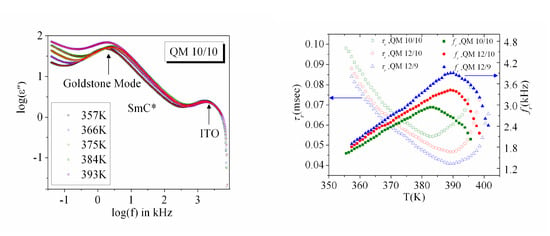
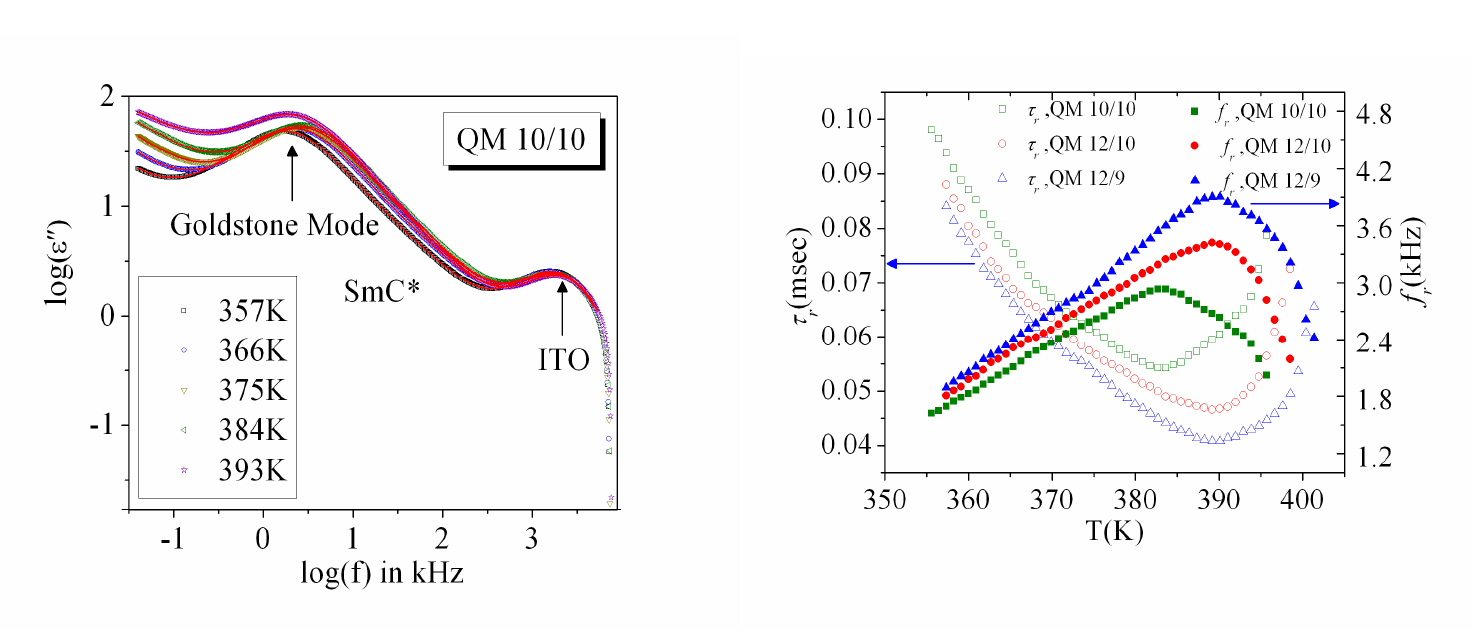
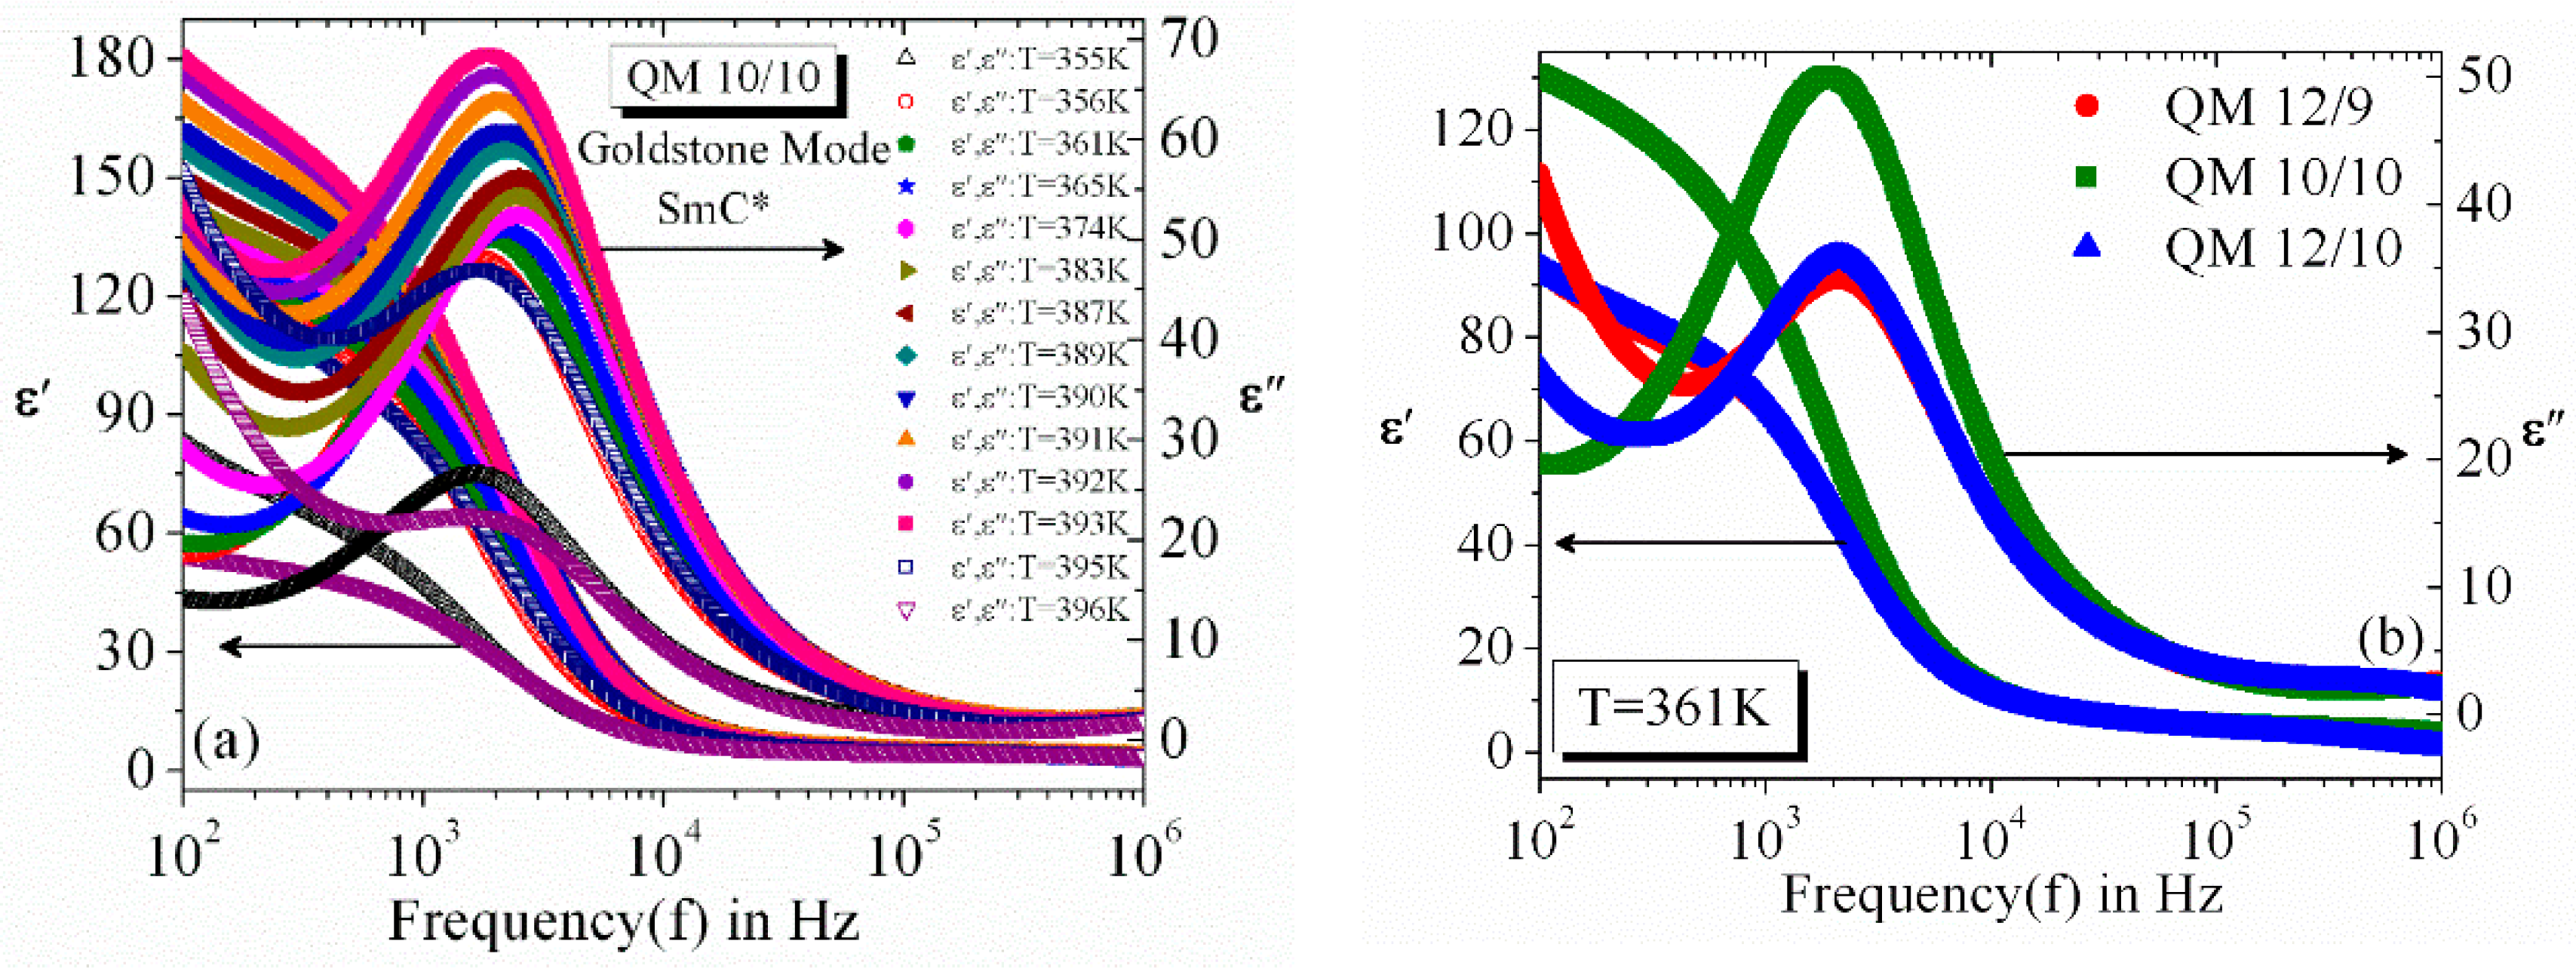
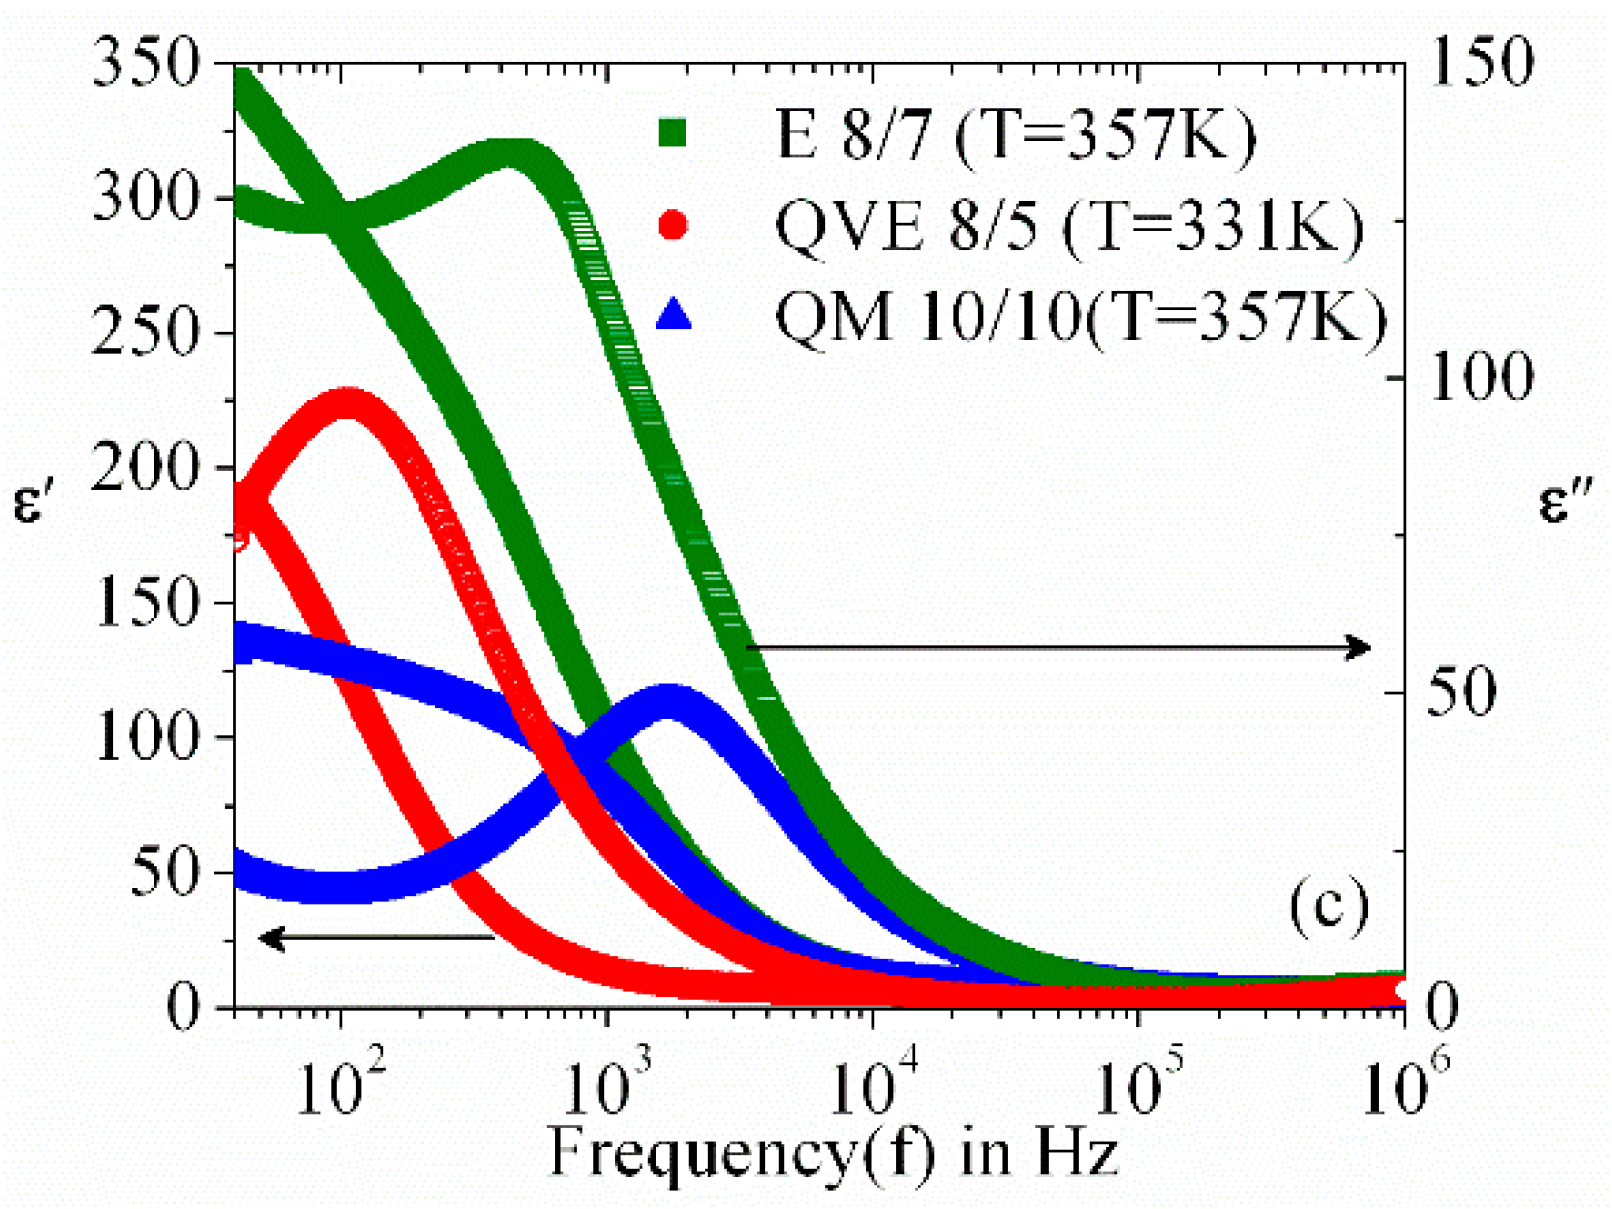
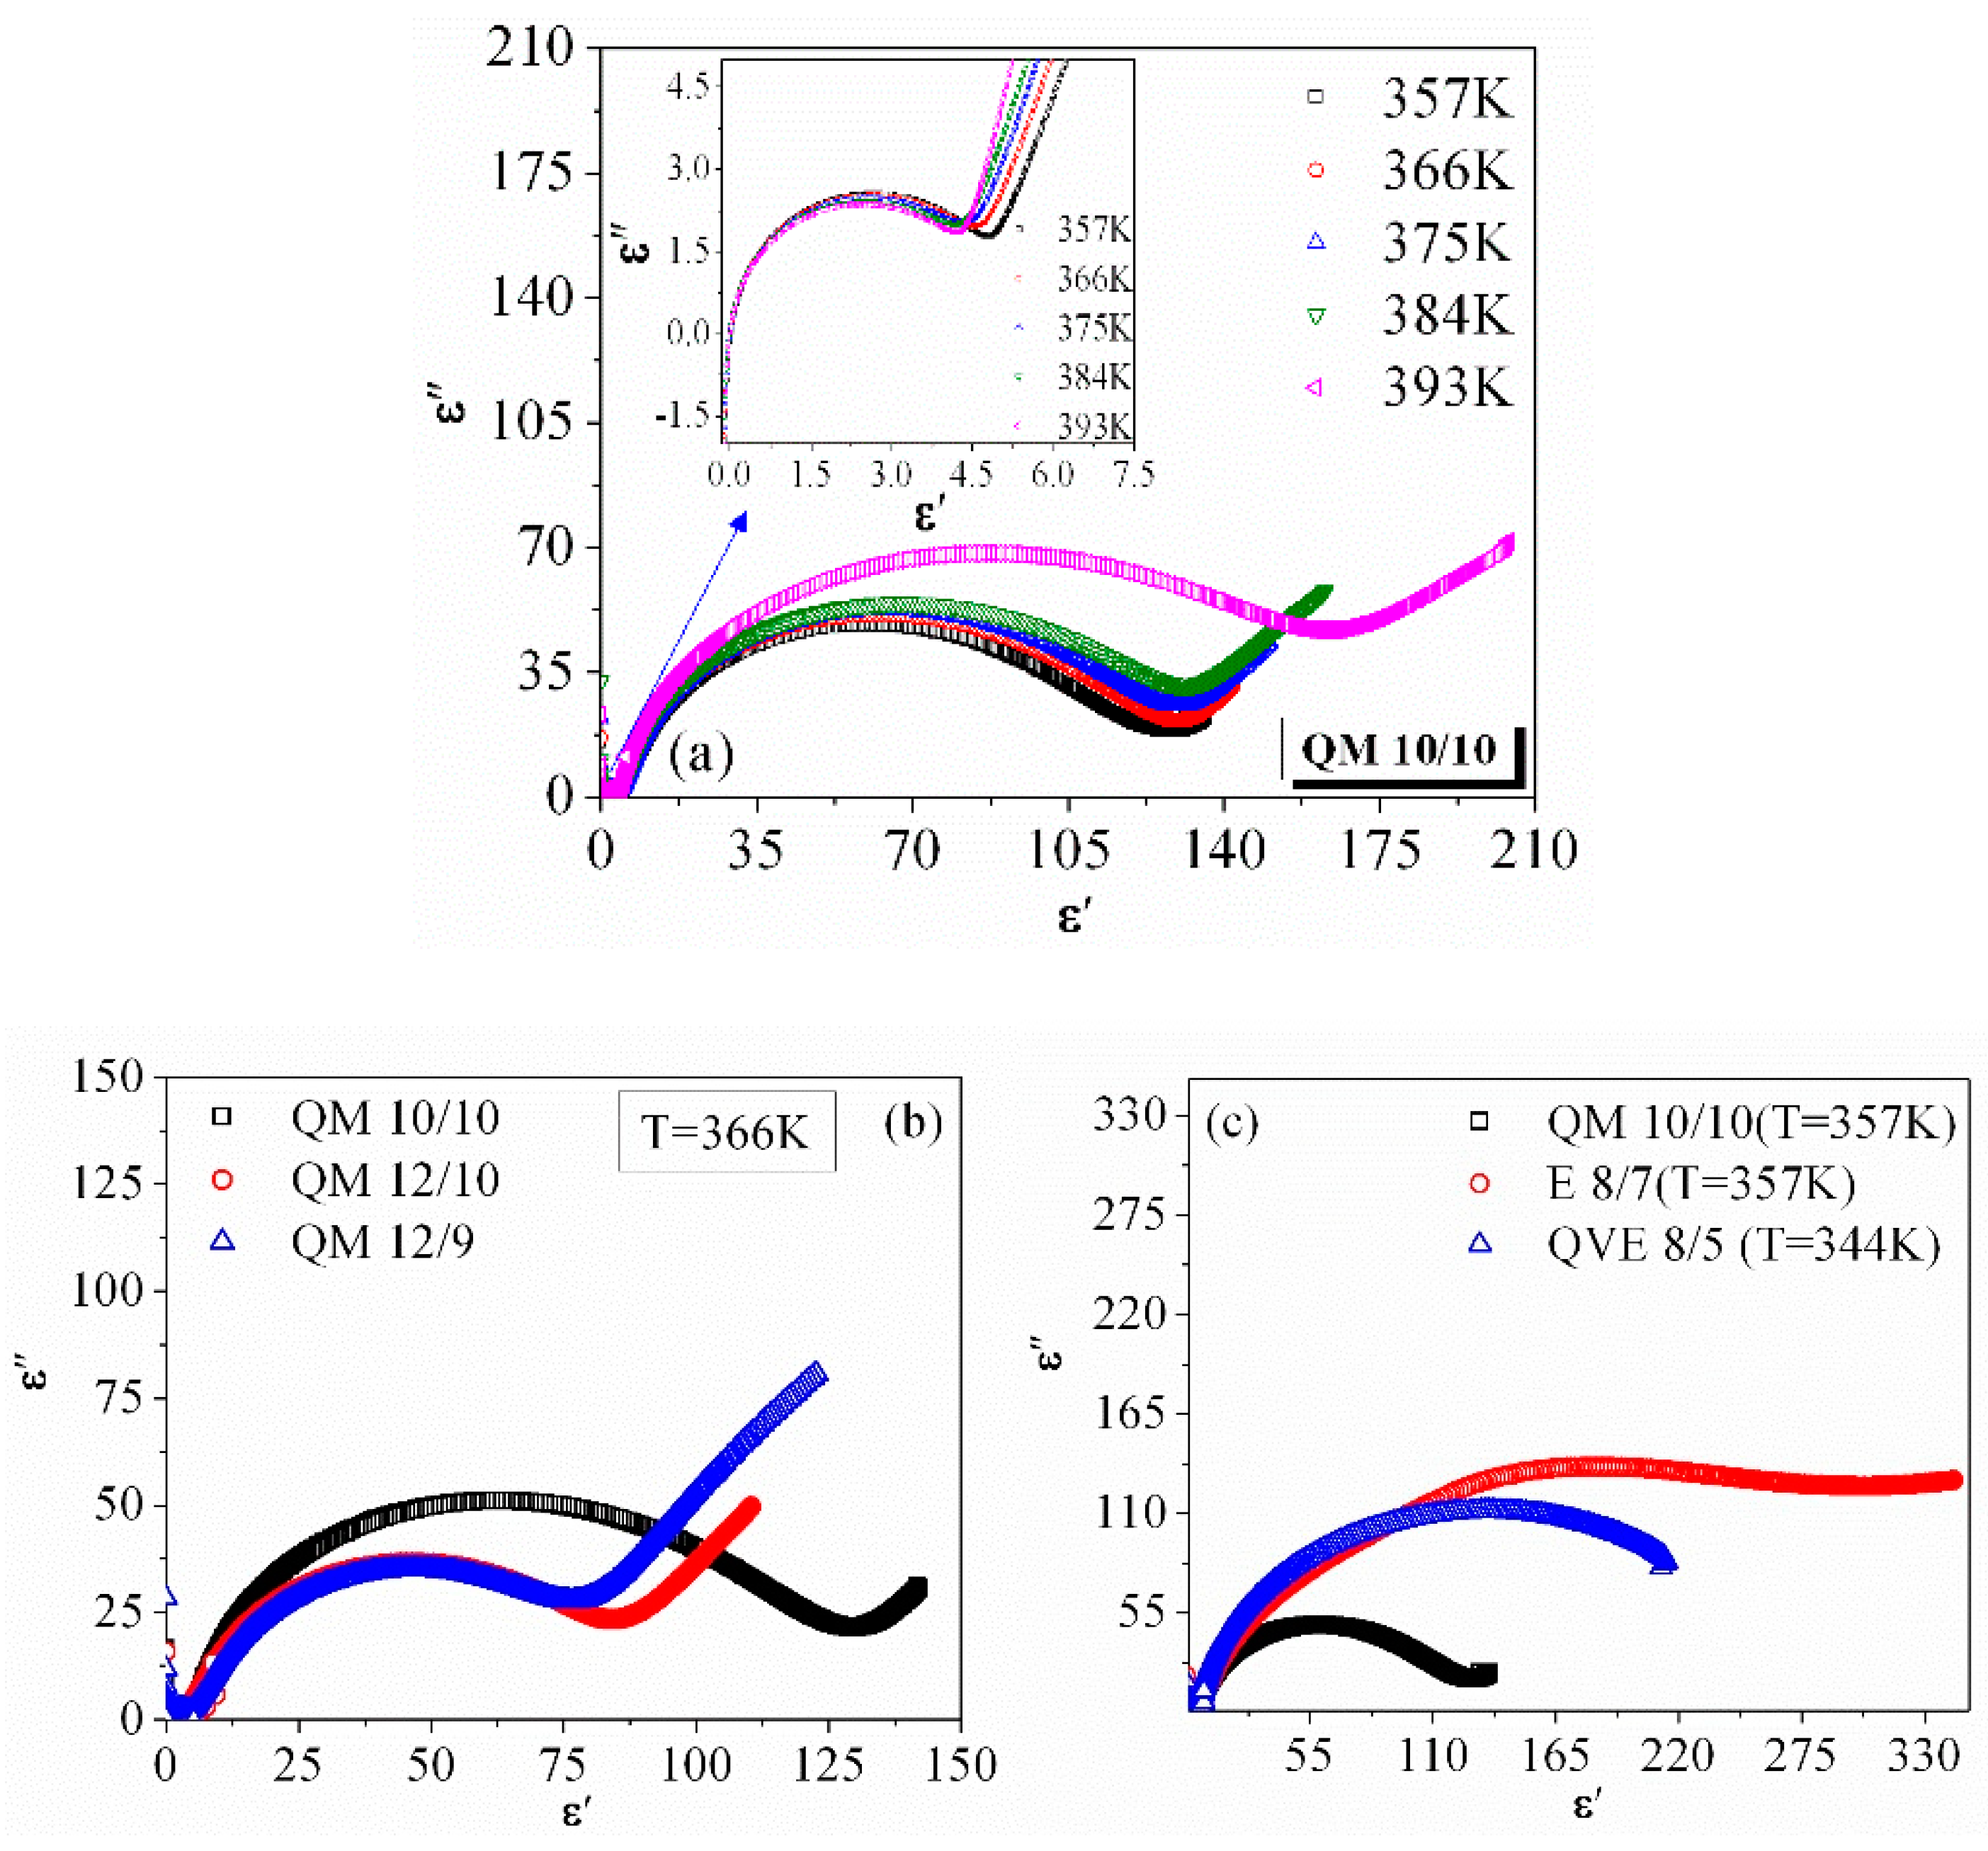
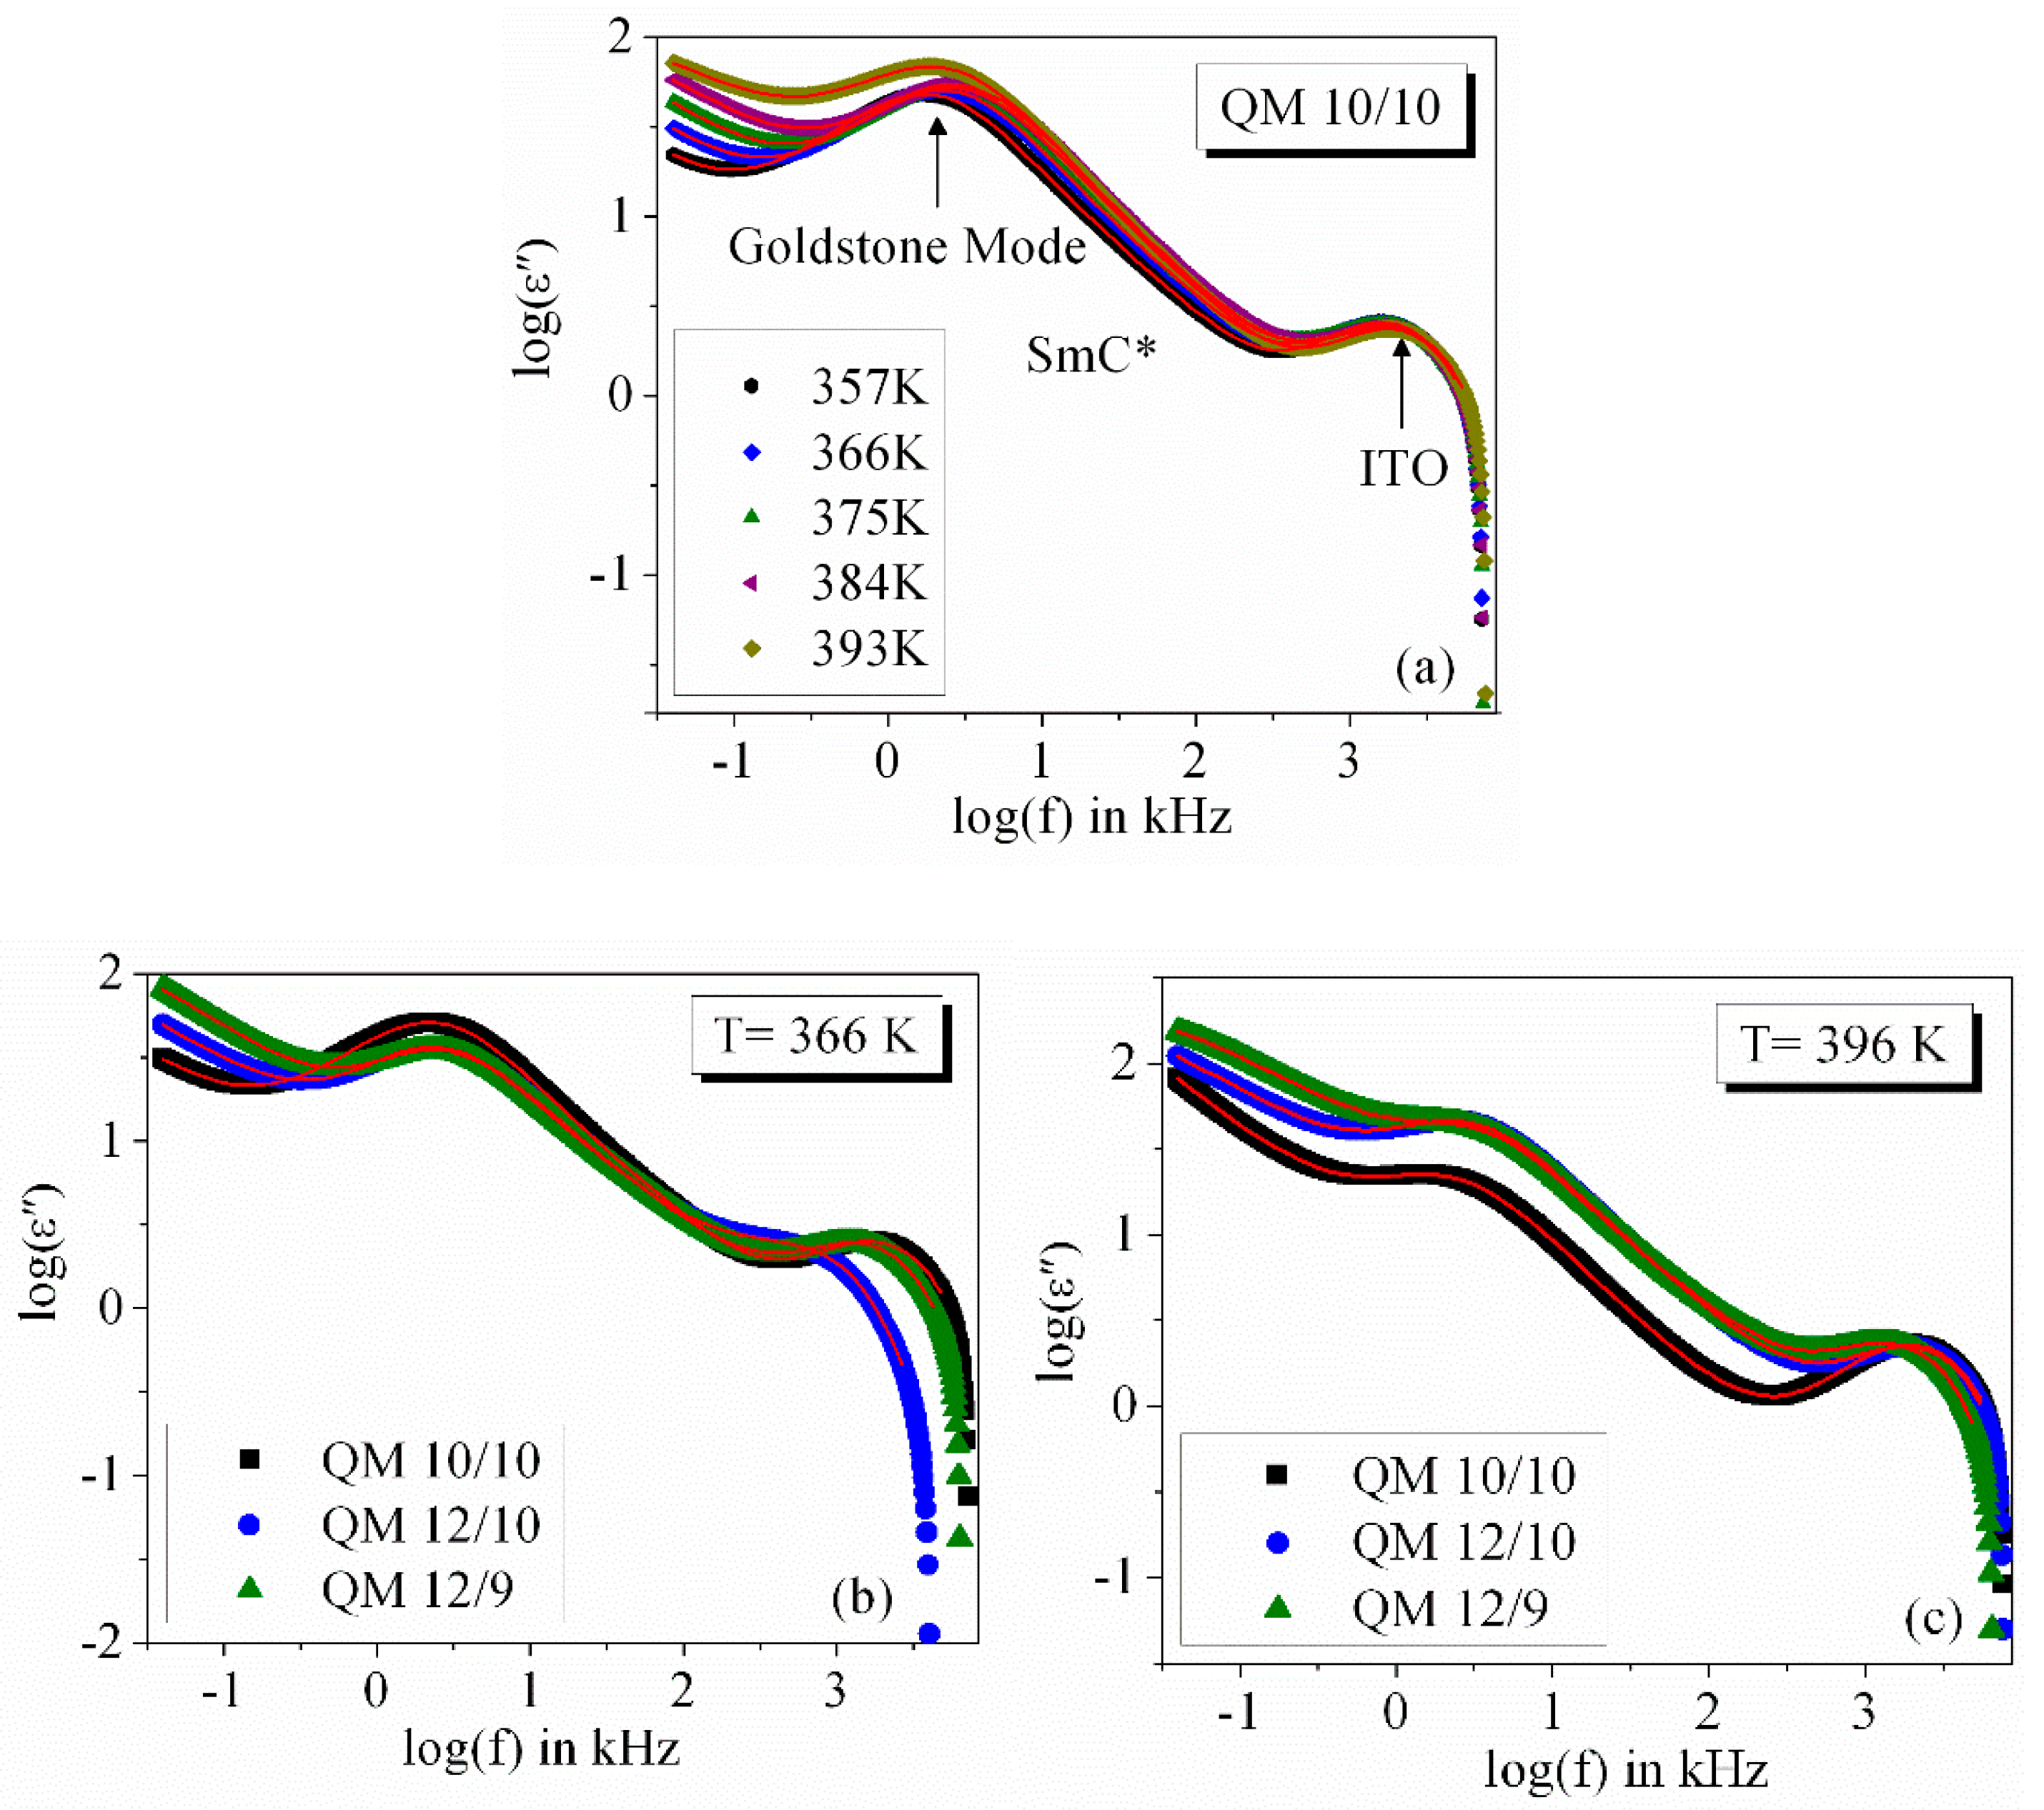
3.2. Frequency Dispersion of Complex Permittivity

The dielectric response is a useful experimental method to observe and investigate various molecular relaxation phenomena that may occur in FLC systems. The dielectric spectra, that is, the frequency dependent behaviour of the real (ε′) and imaginary (ε″) part of complex permittivity at different temperatures in the SmC* phase for one representative QM10/10 compound, has been shown in Figure 1a; analogous behaviour was observed in different FLC materials [45,46,47,48,49,50,51]. It has been obtained from the experimental data that the real as well as the imaginary part of complex permittivity increases with temperature upto about 393 K [see Figure 1a]; then, with further increase of temperature, these values started to decrease. This may be due to the disruption in the orderly arrangement of the dipoles within the molecular domains as the SmC*–N* phase transition is approached. The real part of the permittivity (ε′) decreases smoothly with frequency increase and becomes nearly constant in the higher frequency region. On the other hand, the imaginary part of the complex permittivity (ε″) shows a strong collective relaxation phenomenon related to the Goldstone mode (fluctuations of the long molecular axis in the azimuthal direction) in the SmC* phase, with the frequency range of about (1–10) kHz [45,50,51]. At higher frequency regime ε″ does not show much variation with frequency and becomes nearly constant as in ε′. In order to investigate the effect of the end alkyl chain length in both the chiral as well as non-chiral part on the dielectric spectra, we have plotted three QMn/m compounds differing in the lengths of the chiral and non-chiral alkyl chains [Figure 1b] in the SmC* phase. It has been observed that among all the three compounds of the QMn/m series, the QM10/10 compound attained the highest values of both ε′ and ε″. This can be explained by the presence of same number of hydrocarbon groups in the chiral and non-chiral fragments of QM10/10 compound, which gives rise not only to a symmetric configuration of the molecules but also decreases the rotational hindrance of the chiral part in comparison to the other two compounds. As a result, large number of molecules are aligned along a preferred direction, consequently increasing the permittivity.
To observe how the core structure of the constituent molecules affects the values of ε′ and ε″, we have chosen three structurally different compounds, namely E8/7, QVE8/5 and QM10/10. It can be observed from Figure 1c that the E8/7 compound has the largest ε′ and ε″ values among the three: the additional dipoles originating from the carboxy group in this compound contributes towards this effect. Another noticeable fact is that the polar lateral methoxy group in QVEn/m series gives rise to larger values of ε′ and ε″ than that for QMn/m series.
Figure 2a shows the Cole–Cole plot for QM10/10 compound at five different temperatures within the SmC* phase. Beyond the Goldstone mode detected at relatively low frequencies, a higher frequency process was found and is attributed to the finite resistivity of ITO layers in measuring cells (see inset of Figure 2a) [45,48,52]; within the SmC* phase the dielectric losses rise with temperature. It is necessary to mention that dielectric losses depend not only on the molecular core structure but also on the alkyl chain lengths. It has been observed that depending on the end alkyl chain length the dielectric loss (ε″) is different for different compounds (see Figure 2b). Figure 2c represents the Cole–Cole plot for three compounds taken from three structurally different series. It is clear from the Figure 2 that the dielectric loss is largest for the E8/7 compound [47,48,50,53].
In order to determine the relaxation mode parameters such as dielectric strength (Δε), relaxation time (τr), relaxation frequency (fr) related to the maximum of loss peak, a logarithmic plot of the imaginary part of complex permittivity (ε″) versus frequency is shown in Figure 3a–c; the data were fitted by the Havriliak–Negami equation [41,42]. The logarithmic plot of imaginary part of complex permittivity at five different temperatures has been shown for one of the representative QM10/10 compound [see Figure 3a]. The same figures has been plotted in the vicinity of the Cr–SmC* (at about T = 366 K) and SmC*–N* (at about T = 396 K) phase transitions for all the three compounds of the same homologous series QMn/m [see Figure 3b,c]. From these two figures it can be seen easily that the dielectric strength of relaxation mode considerably decreases in the temperature region very close to the N*–SmC* phase transition and it is more distinct for QM10/10 compound; this effect can be explained by the possible helix unwinding phenomenon near the N*–SmC* phase transition.

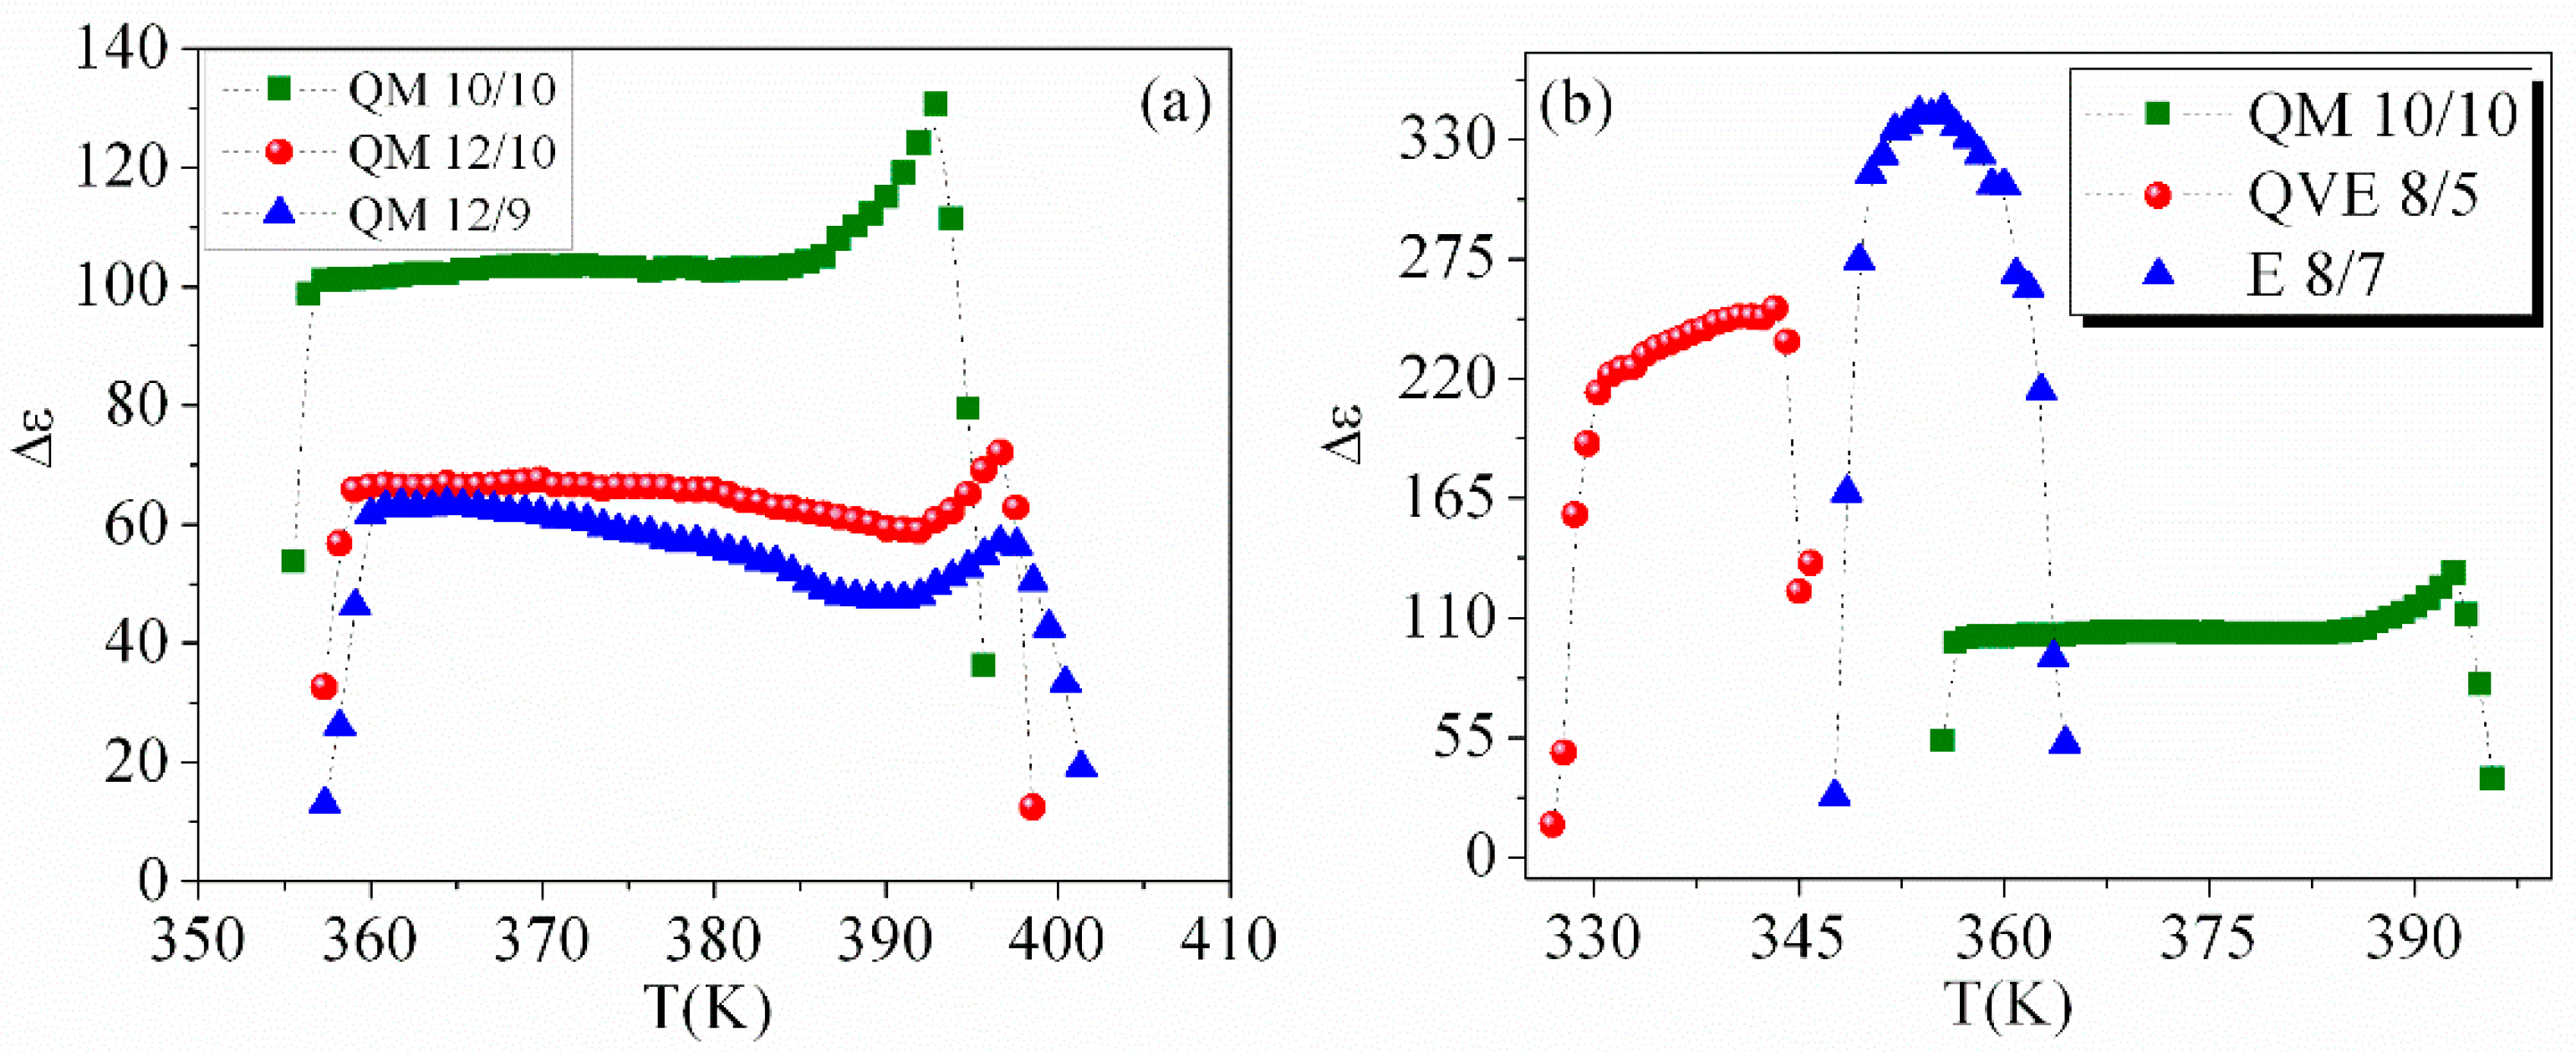
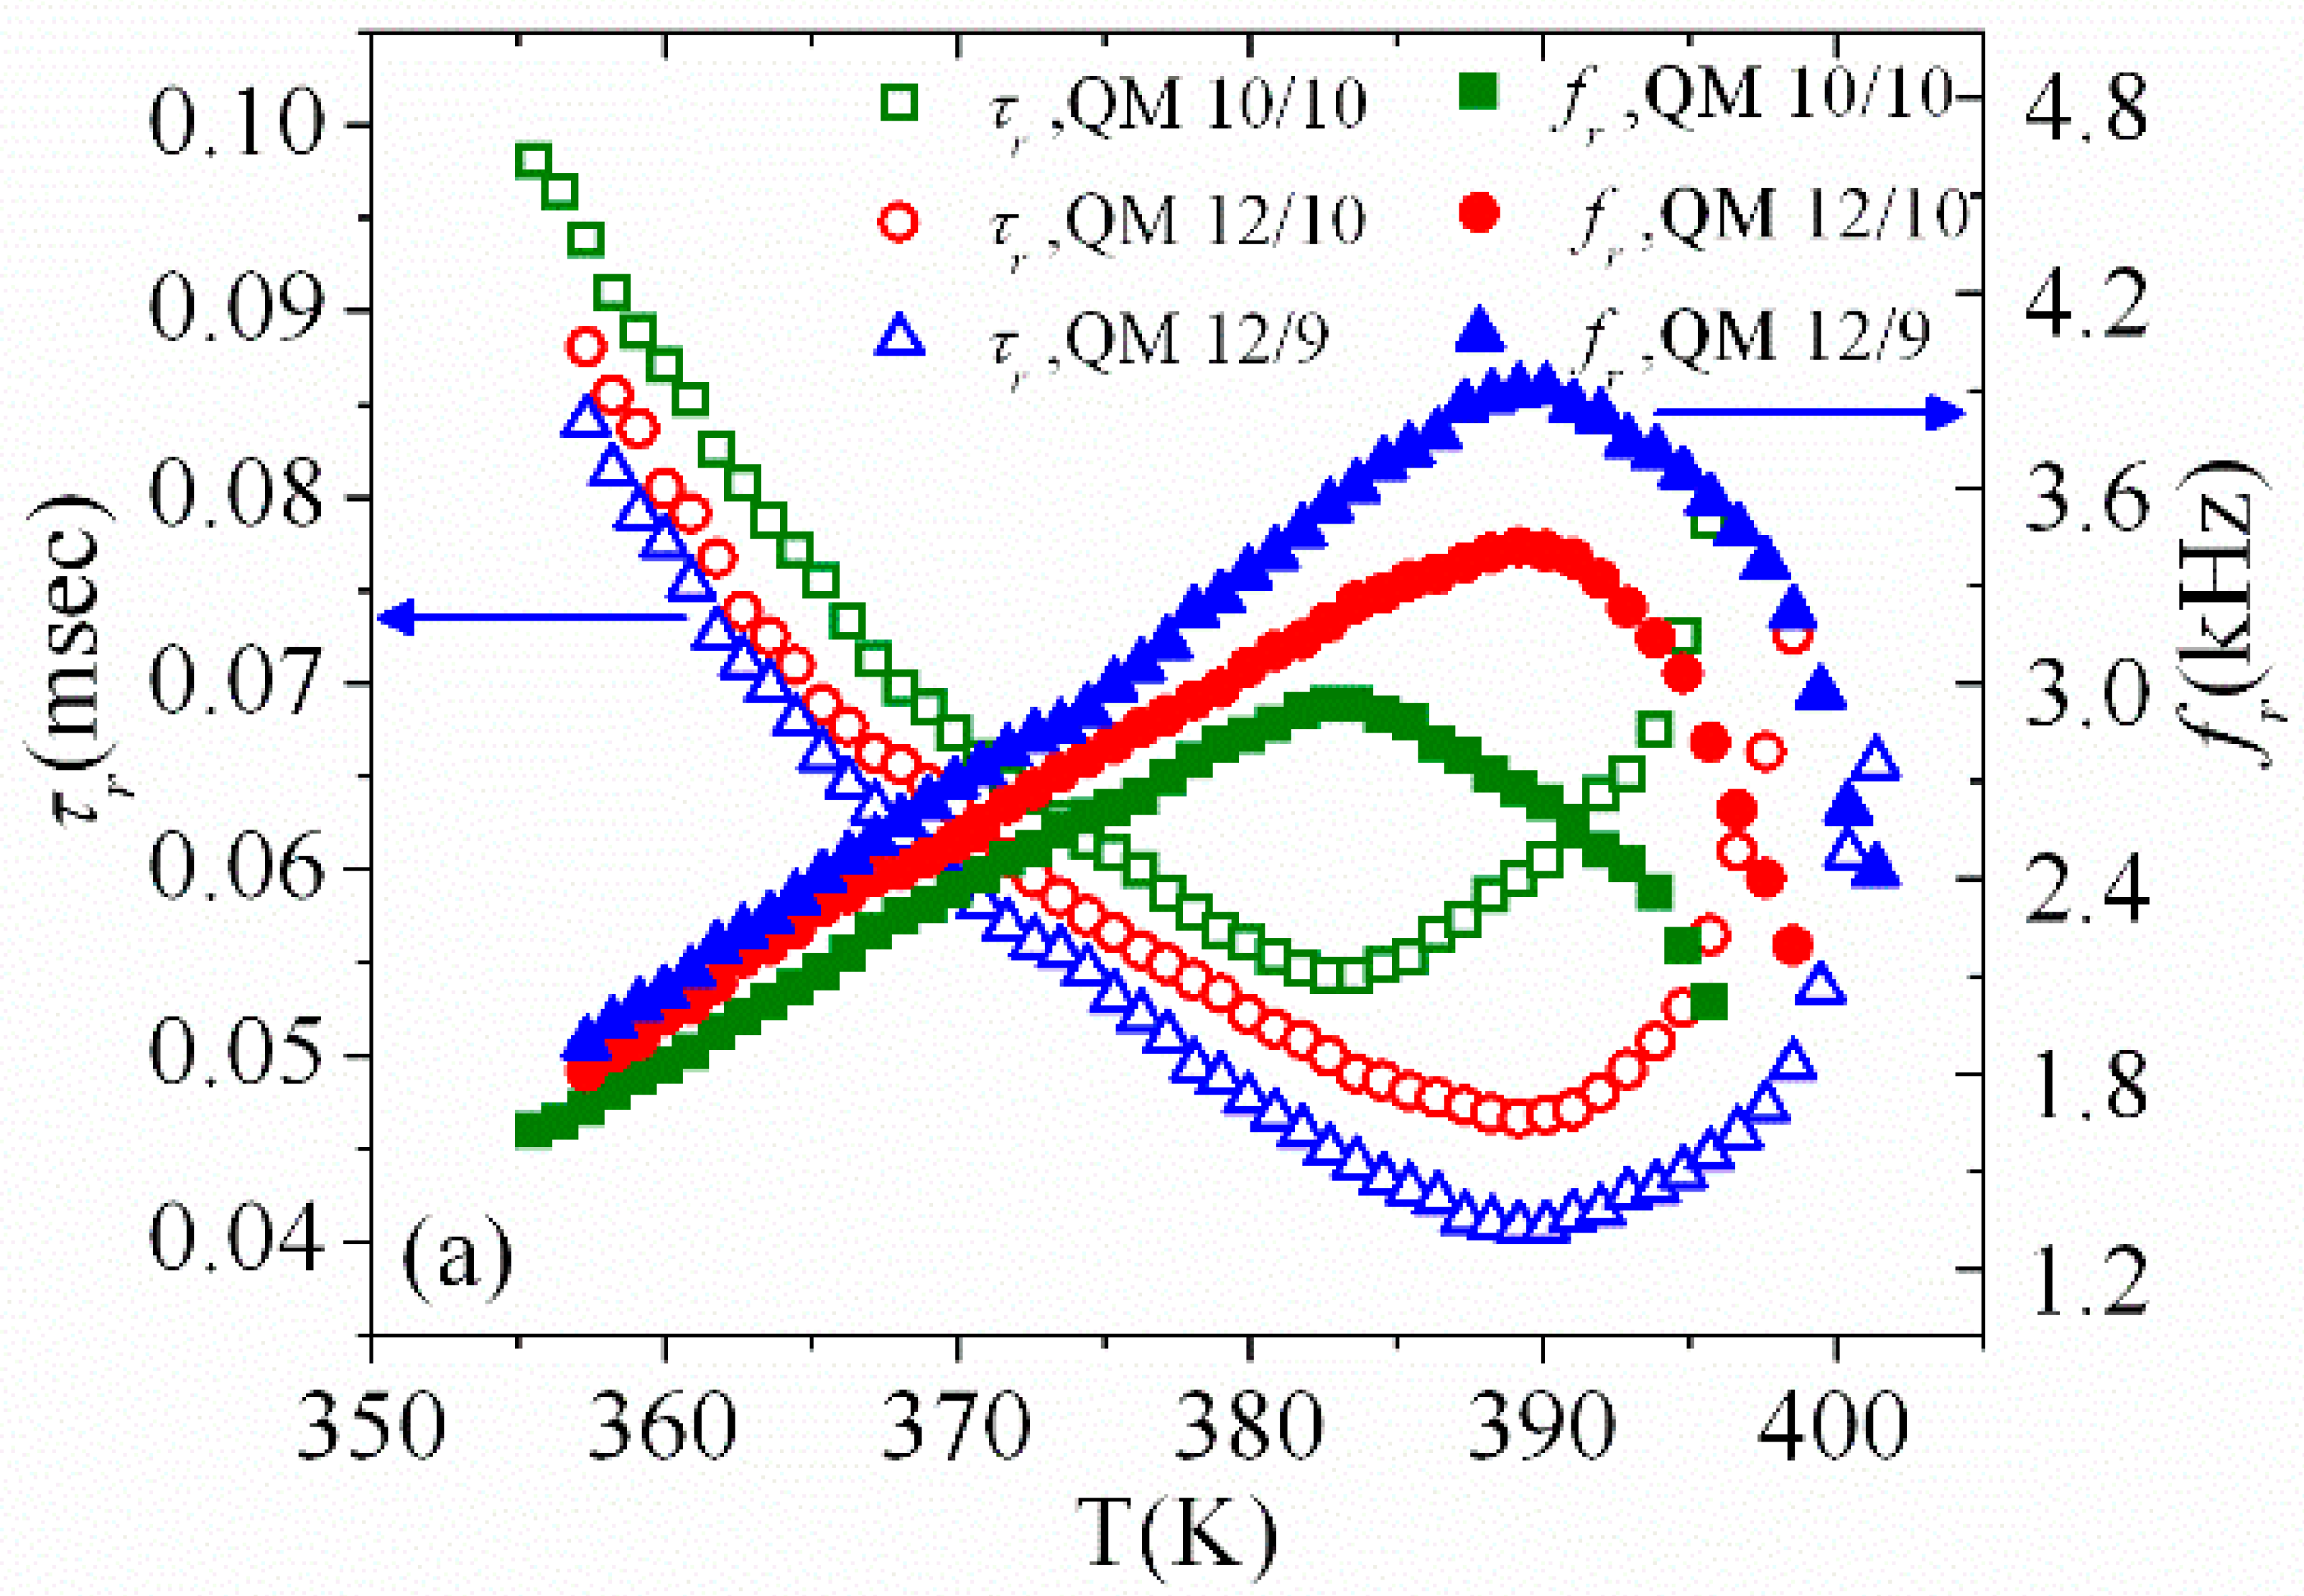
3.3. Temperature Dependence of Dielectric Strength and Relaxation Frequency

Figure 4a,b represents the temperature dependence of the dielectric strength (Δε) (as a result of fitting procedure) for the studied compounds within the temperature range of the ferroelectric SmC* phase. Generally, the dielectric strength increases with increasing temperature in the SmC* phase (see Figure 4a,b), revealing a maximum close to the N*/SmA*–SmC* phase transition and then decreases abruptly with further increase in temperature. A similar effect has been observed by others [47,48,50,53]. One important observation is that QM10/10 compound, possessing the same lengths of both chiral (m) and non-chiral (n) alkyl chains, exhibits the largest dielectric strength (about Δε = 130) among all the compounds from the QMn/m series. Values of Δε are slightly smaller for QM12/9 compound with respect to that of QM12/10 compound. However, E8/7 compound exhibits the largest dielectric strength among the three structurally different compounds as shown in Figure 4b, probably due to the presence of a second polar carboxylate group which can generate additional mobile charges, and hence can increase the total dipole moment.
The temperature dependence of relaxation time and relaxation frequency for QMn/m series is shown in Figure 5a.
The Goldstone mode contributions attributes towards an enhanced relaxation frequency with temperature within the SmC* phase: these values rise, attain a maximum and then starts to decrease about 10 K below the N*–SmC* phase transition [54,55], perhaps due to the consequent decrease of ferroelectricity near the SmA*/N*–SmC* phase transitions. Among all three QMn/m compounds, the QM10/10 one exhibits the lowest relaxation frequency that attains its maximum value at the low temperature region in comparison with another two possessing different lengths of chiral and non-chiral terminal alkyl chains. Moreover, the temperature dependence of the relaxation time has an inverse nature in relation to the relaxation frequency [54,55,56]. Temperature dependence of the relaxation time and relaxation frequency for E8/7 and QVE8/5 compounds are shown in Figure 5b,c, respectively. It may be noted that the temperature dependence of the relaxation frequency in the SmC* phase for QVE8/5 and QMn/m compounds shows a similar trend; however, for E8/7 the behaviour is quite different; first it decreases slightly, then increases with increasing temperature. This anomaly is probably due to an additional polar ester linking group (placed in between the non-chiral alkyl chain and the molecular core), which causes larger dipole moment and their repulsive interaction accounts for increase of relaxation time with increasing temperature. However, the ferroelectric dipolar coupling rapidly diminishes as the N*/SmA*–SmC* phase transition is approached, leading to a consequent decrease of the mutual repulsive interaction which now facilitates quick relaxation process with further increase of temperature. If we compare the values of relaxation frequency ( f r ) and relaxation time ( τ r ) it can be observed that compound belonging to QVEn/m series exhibits larger relaxation time and smaller relaxation frequency due to its relatively high viscosity caused by the presence of the lateral methoxy substitution on the central aromatic ring of the molecular core. Materials from QMn/m series possess smaller relaxation time and larger relaxation frequency due to its more flexible “zigzag shaped” molecular structure. On the other hand, f r and τ r values for materials from En/m series are intermediate with respect to the materials mentioned above. Thus, for the studied ferroelectric liquid crystalline materials, it can be concluded that the parameters of the relaxation mode strongly depend on both the molecular core structure and alkyl chain lengths.

4. Summary of the Results and Conclusion

The ferroelectric SmC* phase for the compounds belonging to three structurally different series of chiral self-assembling compounds possessing the ferroelectric polar order has been investigated via broadband dielectric spectroscopy measurements. The behaviour of dielectric spectra not only depends on the temperature but also on the specific molecular structure of the FLC compounds. The results of the investigations lead to the following summary.
Within the SmC* phase, both real and imaginary parts of complex permittivity increase upto certain temperature then drop with increasing temperature. The length of the alkyl chains length as well as linkage unit has a great influence on the values of the dielectric permittivities.
The real (ε′) and imaginary (ε″) parts of the complex dielectric permittivity as well as the dielectric losses (ε″/ε′) are maximum for En/m series and minimum for QMn/m series; this is attributed due to polar nature of the ester connecting group (situated in between the non-chiral alkyl chain and the molecular core) which is present in the En/m series; this additional ester linkage group is present only for the En/m series.
By fitting of the experimental data for the imaginary part of the complex permittivity by the Havriliak–Negami equation, the dielectric strength (Δε) and relaxation frequency (fr) of the Goldstone mode has been determined.
The temperature dependence of dielectric strength shows that Δε increases with increasing temperature in the SmC* phase and attains a maximum value then decreases near the phase transition to the SmA*/N* phase.
The dielectric strength is also influenced by the difference of the alkyl chain length and type of linkage group of the constituent chiral molecules. It has been observed experimentally that the dielectric strength is maximum for En/m series and minimum for QMn/m series.
With increasing temperature, the relaxation frequency of the Goldstone mode shifts towards higher frequency region and attains a maximum at a certain temperature, then starts to decrease close to the phase transition to the SmA*/N* phase which appears at high temperatures.
It has been observed that the relaxation time ( τ r ) and the relaxation frequency ( f r ) varies with the molecular structure of the studied ferroelectric compounds. The value of τ r is maximum for QVEn/m series and minimum for QMn/m series, due to the bulky methoxy (–OCH3) group used as substituent in the lateral position on the middle aromatic ring of the QVEn/m molecules.
Finally, it can be concluded that the dielectric parameters of the studied materials are considerably influenced by the specific variations of the molecular structure as it has been described. The conducted studies should contribute towards a better understanding of the structure–property correlations for these specific classes of soft organic self-assembling materials derived from the lactic acid which may be utilized for further design of new liquid crystalline mixtures [57,58,59,60,61] aimed for advanced optoelectronic [62,63] and photonic applications.

Author Contributions

The experiment was designed by B.B. and B.D. The result analysis was performed by B.D., M.K.D. and A.B. Additionally, M.K.D., V.H., and A.B. were responsible for interpretation of results and writing the paper.

Funding

Financial support for this work was provided by the Department of Science and Technology (DST), New Delhi (EMR/2016/005001 and EEQ/2017/000829) to the authors B.D. and M.K.D respectively. Financial assistance to Barnali Barman in the form of DST/INSPIRE Fellowship (2015/IF150049) for the award of a Junior Research Fellowship is gratefully acknowledged. The Czech Science Foundation (CSF 19-03564S project) is acknowledged for providing financial assistance to the authors (A.B. and V.H.).

Acknowledgments

The authors would like to thank the Liquid Crystal Research Laboratory, Department of Physics, University of North Bengal for extending all the facilities to carry out the experimental work reported here.

Conflicts of Interest

All the authors declare that there is no potential conflict of interest.

References

  1. Palffy-Muhoray, P.; Cao, W.; Moreira, M.; Taheri, B.; Munoz, A. Photonics and lasing in liquid crystal materials. Philos. Trans. R. Soc. A 2006, 364, 2747–2761. [Google Scholar] [CrossRef] [PubMed]
  2. Fratalocchi, A.; Asquini, R.; Assanto, G. Integrated electro-optic switch in liquid crystals. Opt. Exp. 2005, 13, 32–37. [Google Scholar] [CrossRef] [PubMed]
  3. Jiang, M.; Yang, B.; Zhang, T.; Ji, L.; Wang, Y. Study on a Lateral-Electrical-Field Pixel Architecture for FLC Spatial Light Modulator with Continuously Tunable Grayscales. IEEE Trans. Electron Dev. 2003, 50, 1694–1697. [Google Scholar] [CrossRef]
  4. Scheffer, T.J.; Nehring, J. A new highly multiplexable liquid crystal display. Appl. Phys. Lett. 1984, 45, 1021–1023. [Google Scholar] [CrossRef]
  5. Kato, T.; Mizoshita, N.; Kishimoto, K. Functional liquid-crystalline assemblies: Self-organized soft materials. Angew. Chem. Int. Ed. 2006, 45, 38–68. [Google Scholar] [CrossRef] [PubMed]
  6. Hird, M.; Goodby, J.W.; Hindmarsh, P.; Lewis, R.A.; Toyne, K.J. The design, synthesis and structure property relationships of ferroelectric and antiferroelectric liquid crystal materials. Ferroelectrics 2002, 276, 219–237. [Google Scholar] [CrossRef]
  7. Kaspar, M.; Hamplova, V.; Pakhomov, S.A.; Bubnov, A.; Guittard, F.; Sverenyak, H.; Stibor, I.; Vanek, P.; Glogarova, M. New series of ferroelectric liquid crystals with four ester groups. Liq. Cryst. 1998, 24, 599–605. [Google Scholar] [CrossRef]
  8. Bubnov, A.; Novotna, V.; Hamplova, V.; Kaspar, M.; Glogarova, M. Effect of multilactate chiral part of the liquid crystalline molecule on mesomorphic behavior. J. Mol. Struct. 2008, 892, 151–157. [Google Scholar] [CrossRef]
  9. Brombach, F.; Neudorfl, M.J.; Blunk, D. The chiral pool as valuable natural source: New chiral mesogens made from lactic acid. Mol. Cryst. Liq. Cryst. 2011, 542, 62–74. [Google Scholar] [CrossRef]
  10. Lagerwall, T.S. Ferroelectric and Antiferroelectric Liquid Crystals; Wiley-VCH: New York, NY, USA, 1999. [Google Scholar]
  11. Takahashi, T.; Furue, H.; Shikada, M.; Matsuda, N.; Miyama, T.; Kobayashi, S. Preliminary study of field sequential full color liquid crystal display using polymer stabilized ferroelectric liquid crystal display. Jpn. J. Appl. Phys. 1999, 38, L534–L536. [Google Scholar] [CrossRef]
  12. Bahadur, B. Liquid Crystals: Applications and Uses; World Scientific: Singapore, 1990; Volume 1. [Google Scholar]
  13. Lagerwall, J.P.F.; Giesselmann, F. Current topics in smectic liquid crystal research. ChemPhysChem 2006, 7, 20–45. [Google Scholar] [CrossRef] [PubMed]
  14. Clark, N.A.; Lagerwall, S.T. Submicrosecondbistable electro-optic switching in liquid crystals. Appl. Phys. Lett. 1980, 36, 899–901. [Google Scholar] [CrossRef]
  15. Malik, P.; Raina, K.K.; Bubnov, A.; Prakash, C. Dielectric spectroscopy of a high-polarization ferroelectric liquid crystal. Phase Transit. 2006, 79, 889–898. [Google Scholar] [CrossRef]
  16. Barman, B.; Das, B.; Das, M.K.; Hamplová, V.; Bubnov, A. Effect of molecular structure on dielectric and electro-optic properties of chiral liquid crystals based on lactic acid derivatives. J. Mol. Liq. 2019, 283, 472–781. [Google Scholar] [CrossRef]
  17. Bubnov, A.; Domenici, V.; Hamplova, V.; Kaspar, M.; Veracini, C.A.; Glogarova, M. Orientational and structural properties of ferroelectric liquid crystal with a broad temperature range in the SmC* phase by 13C NMR, X-ray scattering and dielectric spectroscopy. J. Phys. 2009, 21, 035102. [Google Scholar]
  18. Ray, T.D.; Kundu, S.; Nayek, P.; Majumder, T.P.; Roy, S.K.; Haase, W. Dielectric and electro-optic behavior of pure ferroelectric liquid crystal material and the isomeric mixtures. Curr. Appl. Phys. 2009, 9, 605–609. [Google Scholar]
  19. Hemine, J.; Legrand, N.; Isaert, A.; Kaaouachi, E.; Nguyen, H.T. Structural, electro-optical and dielectric characterizations of ferroelectric liquid crystals showing the SmC*–SmA*–N* phase sequence. Physica B 2007, 390, 34–39. [Google Scholar] [CrossRef]
  20. Stojanović, M.; Bubnov, A.; Obadović, D.Z.; Hamplová, V.; Kašpar, M.; Cvetinov, M. Effect of the chiral chain length on structuraland phase properties of ferroelectric liquid crystals. Phase Transit. 2011, 84, 380–390. [Google Scholar] [CrossRef]
  21. Bubnov, A.; Pakhomov, S.; Kašpar, M.; Hamplová, V.; Glogarová, M. Synthesis and dielectric properties of new liquid crystalline substances with a lactate chiral group. Mol. Cryst. Liq. Cryst. Sci. Technol. 1999, 328, 317–324. [Google Scholar] [CrossRef]
  22. George, A.K.; Al-Hinai, M.; Carboni, C.; Al-Harthi, S.H.; Potukuchi, D.M.; Naciri, J. Dielectric response in the smectic A and smectic C* phases of a ferroelectric liquid crystal, 12CN5(R*). Mol. Cryst. Liq. Cryst. 2004, 409, 343–353. [Google Scholar] [CrossRef]
  23. Blinc, R.; Zeks, B. Dynamics of helicoidal ferroelectric smectic-C liquid crystals. Phys. Rev. A 1978, 18, 740. [Google Scholar] [CrossRef]
  24. Srivastava, A.K.; Dhar, R.; Agrawal, V.K.; Lee, H.S.; Dabrowski, R. Switching and electrical properties of ferro-and antiferroelectric phases of MOPB(H)PBC. Liq. Cryst. 2008, 35, 1101–1108. [Google Scholar] [CrossRef]
  25. Filipic, C.; Carlsson, T.; Levstik, A.; Zeks, B.; Blink, R.; Gouda, F.; Lagerwall, S.T.; Skarp, K. Dielectric properties near the smectic-C*-smectic-A phase transition of some ferroelectric liquid-crystalline systems with a very large spontaneous polarization. Phys. Rev. A 1988, 38, 5833. [Google Scholar] [CrossRef] [PubMed]
  26. Levstik, A.; Carlsson, T.; Filipic, C.; Levstik, I.; Zeks, B. Goldstone mode and soft mode at the smectic-A—smectic-C* phase transition studied by dielectric relaxation. Phys. Rev. A 1987, 35, 3527. [Google Scholar] [CrossRef] [PubMed]
  27. Carlsson, T.; Zeks, B. Generalized Landau model of ferroelectric liquid crystals. Phys. Rev. A 1984, 36, 1484. [Google Scholar] [CrossRef]
  28. Hiller, S.; Biradar, A.M.; Wrobel, S.; Haase, W. Dielectric behavior at the smectic-C*-chiral-nematic phase transition of a ferroelectric liquid crystal. Phys. Rev. E 1996, 53, 641. [Google Scholar] [CrossRef] [PubMed]
  29. Wrobel, S.; Hasse, W.; Pfeiffer, M.; Geelhar, T. Dielectric relaxation processes in a model ferroelectric liquid crystal. Mol. Cryst. Liq. Cryst. 1992, 212, 335–343. [Google Scholar] [CrossRef]
  30. Rozanski, S.A.; Thoen, J. Collective and antiferroelectric dielectric modes in a highly tilted three-ring ester. Liq. Cryst. 2007, 34, 519–526. [Google Scholar] [CrossRef]
  31. Glogarová, M.; Novotná, V.; Bubnov, A. Dielectric response of ferroelectric liquid crystals in samples of finite thickness. Ferroelectrics 2018, 532, 20–27. [Google Scholar] [CrossRef]
  32. Jasiurkowska-Delaporte, M.; Rozwadowski, T.; Juszyńska-Gałązka, E. Kinetics of Non-Isothermal and Isothermal Crystallization in a Liquid Crystal with Highly Ordered Smectic Phase as Reflected by Differential Scanning Calorimetry, Polarized Optical Microscopy and Broadband Dielectric Spectroscopy. Crystals 2019, 9, 205. [Google Scholar] [CrossRef]
  33. Pakhomov, S.; Kaspar, M.; Hamplova, V.; Bubnov, A.; Sverenyak, H.; Glogarova, M.; Stibor, I. Synthesis and mesomorphic properties of (S)-lactic acid derivatives containing several ester linkages in the core. Ferroelectrics 1998, 212, 341–348. [Google Scholar] [CrossRef]
  34. Bubnov, A.; Kaspar, M.; Novotna, V.; Hamplova, V.; Glogarova, M.; Kapernaum, N.; Giesselmann, F. Effect of lateral methoxy substitution on mesomorphic and structural properties of ferroelectric liquid crystals. Liq. Cryst. 2008, 35, 1329–1337. [Google Scholar] [CrossRef]
  35. Vajda, A.; Kaspar, M.; Hamplova, V.; Pakhomov, S.A.; Vanek, P.; Bubnov, A.; Csorba, K.F.; Éber, N. Synthesis and liquid crystalline properties of (S)-[4-n-Alkyloxy-benzoyloxyphenyl]-4′-[(2-nalkyloxy)propionyloxy]benzoate. Mol. Cryst. Liq. Cryst. 2001, 365, 569–580. [Google Scholar] [CrossRef]
  36. Gouda, F.; Skarp, K.; Lagerwall, S.T. Dielectric studies of the soft mode and Goldstone mode in ferroelectric liquid crystals. Ferroelectrics 1991, 113, 165–206. [Google Scholar] [CrossRef]
  37. Hill, N.; Vaughan, W.E.; Price, A.H.; Davies, M. Dielectric Properties and Molecular Behaviour; Van Nostrand Reinhold: New York, NY, USA, 1969. [Google Scholar]
  38. Bottcher, C.J.F.; Bordewijk, P. Theory of Electric Polarization, 2nd ed.; Elsevier: Amsterdam, The Netherlands, 1978; Volume 2. [Google Scholar]
  39. Cole, K.S.; Cole, R.H. Dispersion and absorption in dielectrics I. Alternating Current Characteristics. J. Chem. Phys. 1941, 9, 341–351. [Google Scholar] [CrossRef]
  40. Pandey, A.S.; Dhar, R.; Pandey, M.B.; Achalkumar, A.S.; Yelamaggad, C.V. Dielectric spectroscopy of unsymmetrical liquid crystal dimers showing wide temperature range TGBA and TGBC* phases. Liq. Cryst. 2009, 36, 13–19. [Google Scholar] [CrossRef]
  41. Havriliak, S., Jr.; Negami, S. A Complex plane analysis of α-dispersions in some polymer systems. J. Polym. Sci. C 1966, 14, 99. [Google Scholar] [CrossRef]
  42. Kundu, K.S.; Yagihara, S.; Yoshizawa, A. Dielectric spectroscopy of a smectic liquid crystal. Liq. Cryst. 2007, 34, 981–986. [Google Scholar] [CrossRef]
  43. Ghosh, S.; Nayek, P.; Roy, K.S.; Majumder, T.P.; Dabrowski, R. Dielectric relaxation spectroscopy and electro-optical studies of a new, partially fluorinated orthoconic antiferroelectric liquid crystal material exhibiting V-shaped switching. Liq. Cryst. 2010, 37, 369–375. [Google Scholar] [CrossRef]
  44. Shenoy, D.; Lavarello, A.; Naciri, J.; Shashidhar, R. Influence of annealing on the dielectric properties of a ferroelectric liquid crystal. Ferroelectrics 2002, 278, 161–166. [Google Scholar] [CrossRef]
  45. Shukla, R.K.; Raina, K.K.; Hamplová, V.; Kašpar, M.; Bubnov, A. Dielectric behaviour of the composite system: Multiwall carbon nanotubes dispersed in ferroelectric liquid crystal. Phase Transit. 2011, 84, 850–857. [Google Scholar] [CrossRef]
  46. Mishra, A.; Weglowska, D.; Dabrowski, R.; Dhar, R. Relaxation phenomena of a highly tilted ferroelectric liquid crystalline material (S)-(+)-4′-(3-pentanoyloxy prop-1-oxy)biphenyl-4-yl-4-(1-methylheptyloxy)benzoates. Liq. Cryst. 2015, 42, 1543–1549. [Google Scholar]
  47. Pandey, M.B.; Dhar, R.; Dabrowski, R. Dielectric spectroscopy of a newly synthesized chlorinated analogue of MHPOBC antiferroelectric liquid crystals. Ferroelectrics 2006, 343, 83–100. [Google Scholar] [CrossRef]
  48. Kaur, S.; Dierking, I.; Gleeson, H.F. Dielectric spectroscopy of Polymer Stabilized Ferroelectric Liquid Crystals. Eur. Phys. J. E 2009, 30, 265–274. [Google Scholar] [CrossRef] [PubMed]
  49. Dwivedi, A.; Dhar, R.; Dabrowski, R. Dielectric Spectroscopy of Para-, Ferro-, and Anti-Ferro-Electric Phases of (S)-(+)-(1-Methylheptyloxycarbonyl) Phenyl 4′-(6-Perfluoropentanoyloxyhex-1-Oxy) Biphenyl-4-Carboxylate. Soft Mater. 2009, 7, 54–65. [Google Scholar] [CrossRef]
  50. Dhar, R.; Singh, S.; Das, I.M.L.; Dabrowski, R. Thermodynamic and dielectric studies of liquid crystalline compound (S)-(+)-4-(1-methylheptyloxycarbonyl) phenyl 4′-(6-octanoyloxyhex-1-oxy) biphenyl-4-carboxylate. Phase Trans. 2009, 82, 251–265. [Google Scholar] [CrossRef]
  51. Gupta, S.K.; Singh, D.P.; Manohar, R. Enhancement of Dielectric and Electro-Optical Properties in SWCNT Dispersed Ferroelectric Liquid Crystals. Ferroelectrics 2014, 468, 84–91. [Google Scholar] [CrossRef]
  52. Perkowski, P. Dielectric spectroscopy of liquid crystals, theoritical model of ITO electrodes influence on dielectric measurements. Opto-Electron. Rev. 2009, 17, 180–186. [Google Scholar] [CrossRef]
  53. Wojciechowski, M.; Gromiec, L.A.; Bak, G.W. Dielectric characteristics of chiral smectic C subphases in liquid crystal MHPOPB. J. Mol. Liq. 2006, 124, 7–12. [Google Scholar] [CrossRef]
  54. Manohar, R.; Yadav, S.P.; Pandey, K.K.; Srivastava, A.K.; Misra, A.K. Comparative study of dielectric and electro-optical properties of pure and polymer ferroelectric liquid crystal composites. J. Polym. Res. 2011, 18, 435–441. [Google Scholar] [CrossRef]
  55. Srivastava, A.K.; Manohar, R.; Shukla, J.P.; Biradar, A.M. Dielectric relaxation of dye-doped ferroelectric liquid crystal mixture: A comparative study of Smectic C* and Smectic A phase. Jpn. J. Appl. Phys. 2007, 46, 1100–1105. [Google Scholar] [CrossRef]
  56. Pandey, M.B.; Dhar, R.; Dabrowski, R. Electrical characteristics of wide temperature range phase. Mol. Cryst. Liq. Cryst. 2009, 509, 363–377. [Google Scholar] [CrossRef]
  57. Kurp, K.; Tykarska, M.; Salamon, P.; Czerwinski, M.; Bubnov, A. Design of functional multicomponent liquid crystalline mixtures with nano-scale pitch fulfilling deformed helix ferroelectric mode demands. J. Mol. Liq. 2019, 290, 111329. [Google Scholar] [CrossRef]
  58. Fitas, J.; Marzec, M.; Szymkowiak, M.; Jaworska-Gołąb, T.; Deptuch, A.; Tykarska, M.; Kurp, K.; Żurowska, M.; Bubnov, A. Mesomorphic, electro-optic and structural properties of binary liquid crystalline mixtures with ferroelectric and antiferroelectric liquid crystalline behavior. Phase Trans. 2018, 91, 1017–1026. [Google Scholar] [CrossRef]
  59. Fitas, J.; Marzec, M.; Kurp, K.; Żurowska, M.; Tykarska, M.; Bubnov, A. Electro-optic and dielectric properties of new binary ferroelectric and antiferroelectric liquid crystalline mixtures. Liq. Cryst. 2017, 44, 1468–1476. [Google Scholar] [CrossRef]
  60. Bubnov, A.; Podoliak, N.; Hamplová, V.; Tomašková, P.; Havlíček, J.; Kašpar, M. Eutectic behaviour of binary mixtures composed by two isomeric lactic acid derivatives. Ferroelectrics 2016, 495, 105–115. [Google Scholar] [CrossRef]
  61. Kurp, K.; Czerwiński, M.; Tykarska, M.; Bubnov, A. Design of advanced multicomponent ferroelectric liquid crystalline mixtures with sub-micrometer helical pitch. Liq. Cryst. 2017, 44, 748–756. [Google Scholar] [CrossRef]
  62. Sreenilayam, S.P.; Brabazon, D.; Panarin, Y.P. Fast ferroelectric liquid crystal based optical switch: Simulation and experiments. Crystals 2019, 9, 388. [Google Scholar] [CrossRef]
  63. Dabrowski, R.; Kula, P.; Herman, J. High Birefringence Liquid Crystals. Crystals 2013, 3, 443–482. [Google Scholar] [CrossRef]
Figure 1. Frequency dependence of real (ε′) and imaginary (ε″) part of complex permittivity in the ferroelectric SmC* phase for: (a) QM10/10 at different temperatures; (b) three of QMn/m compounds at T = 361 K and (c) three structurally different QVE8/5 (T = 331 K), E8/7 (T = 357 K), QM10/10 (T = 357 K) compounds.
Crystals 09 00473 g001aCrystals 09 00473 g001b
Figure 2. Cole–Cole plots for: (a) QM10/10 compound at five temperatures (as indicated) where the inset shows the high frequency contribution related to ITO electrodes; (b) three QMn/m compounds at T = 366 K; (c) three structurally different QVE8/5 (T = 344 K), E8/7 (T = 357 K), QM10/10 (T = 357 K) compounds.
Crystals 09 00473 g002
Figure 3. The imaginary part of complex permittivity (ε″) for: (a) QM10/10 compound at five temperatures as indicated; (b) compounds from QMn/m series close to the Cr–SmC* phase transition at T = 366 K; (c) compounds from QMn/m series close to the SmC*–N* phase transition at T = 396 K; The red solid curves represent the results of fitting by Havriliak–Negami equation to the experimental data.
Crystals 09 00473 g003
Figure 4. Temperature dependence of the dielectric strength (∆ε) within the temperature range of the SmC* phase for: (a) structurally similar QMn/m compounds differing only in the length of the terminal alkyl chains; (b) structurally different QVE8/5, E8/7 and QM10/10 compounds.
Crystals 09 00473 g004
Figure 5. Temperature dependence of the relaxation time and relaxation frequency of the Goldstone mode for: (a) three QMn/m compounds as indicated; (b) E8/7 compound; (c) QVE8/5 compound.
Crystals 09 00473 g005aCrystals 09 00473 g005b
Table 1. General structure of the investigated compounds.
Crystals 09 00473 i001
CompoundnmXYZRef.
QM10/101010-O--COO-H[35]
QM12/9129-O--COO-H[35]
QM12/101210-O--COO-H[35]
E8/787-OCO--OCO-H[33]
E6/10610-OCO--OCO-H[33]
E10/101010-OCO--OCO-H[33]
E8/12812-OCO--OCO-H[33]
QVE8/585-O--OCO-OCH3[34]
Table 2. Phase (Ph) and their transition temperatures including melting points (m.p.) and clearing points(c.p.) in Kelvin and the corresponding enthalpy values in Jg−1 measured on cooling during 2nd DSC cycle (5 Kmin−1) for all of the investigated samples.
COMPm.p.c.p.Ph Ph Ph Ph
QM10/10373.1404.6Cr355.6SmC*397.8N*403.9Iso
[+42.4][+2.1][−37.7][−8.1][−1.9]
QM12/9374404.5Cr357.8SmC*401.3N*403.6Iso
[+39.5][+1.5][−32.4][−8.6][−1.9]
QM12/10373.5402.2Cr356.7SmC*399.9N*401.2Iso
[+42.0][+7.5][−37.5][−8.7][−1.4]
E8/7367.1382.3Cr336.5SmC*369.5SmA*380.6Iso
[+42.2][+5.3][−34.6][−0.5][−5.2]
E6/10367.6381.6Cr336.8SmC*365.7SmA*379.8Iso
[+43.8][+5.3][−36.9][−0.2][−5.6]
E10/10365.0381.6Cr343.5SmC*375.1SmA*380.6Iso
[+78.6][+6.3][−67.0][−0.4][−6.2]
E8/12360.1378.3Cr336.7SmC*368.7SmA*377.8Iso
[+76.5][+6.2][−35.4][−0.3][−6.0]
QVE8/5355.3365.4Cr318.1SmC*346.8N*363.9Iso
[+38.9][+1.2][−27.8][−1.5][−1.0]

