A Novel Hybrid Foaming Method for Low-Pressure Microcellular Foam Production of Unfilled and Talc-Filled Copolymer Polypropylenes


Abstract
:
1. Introduction
2. Materials and Methods
2.1. Materials
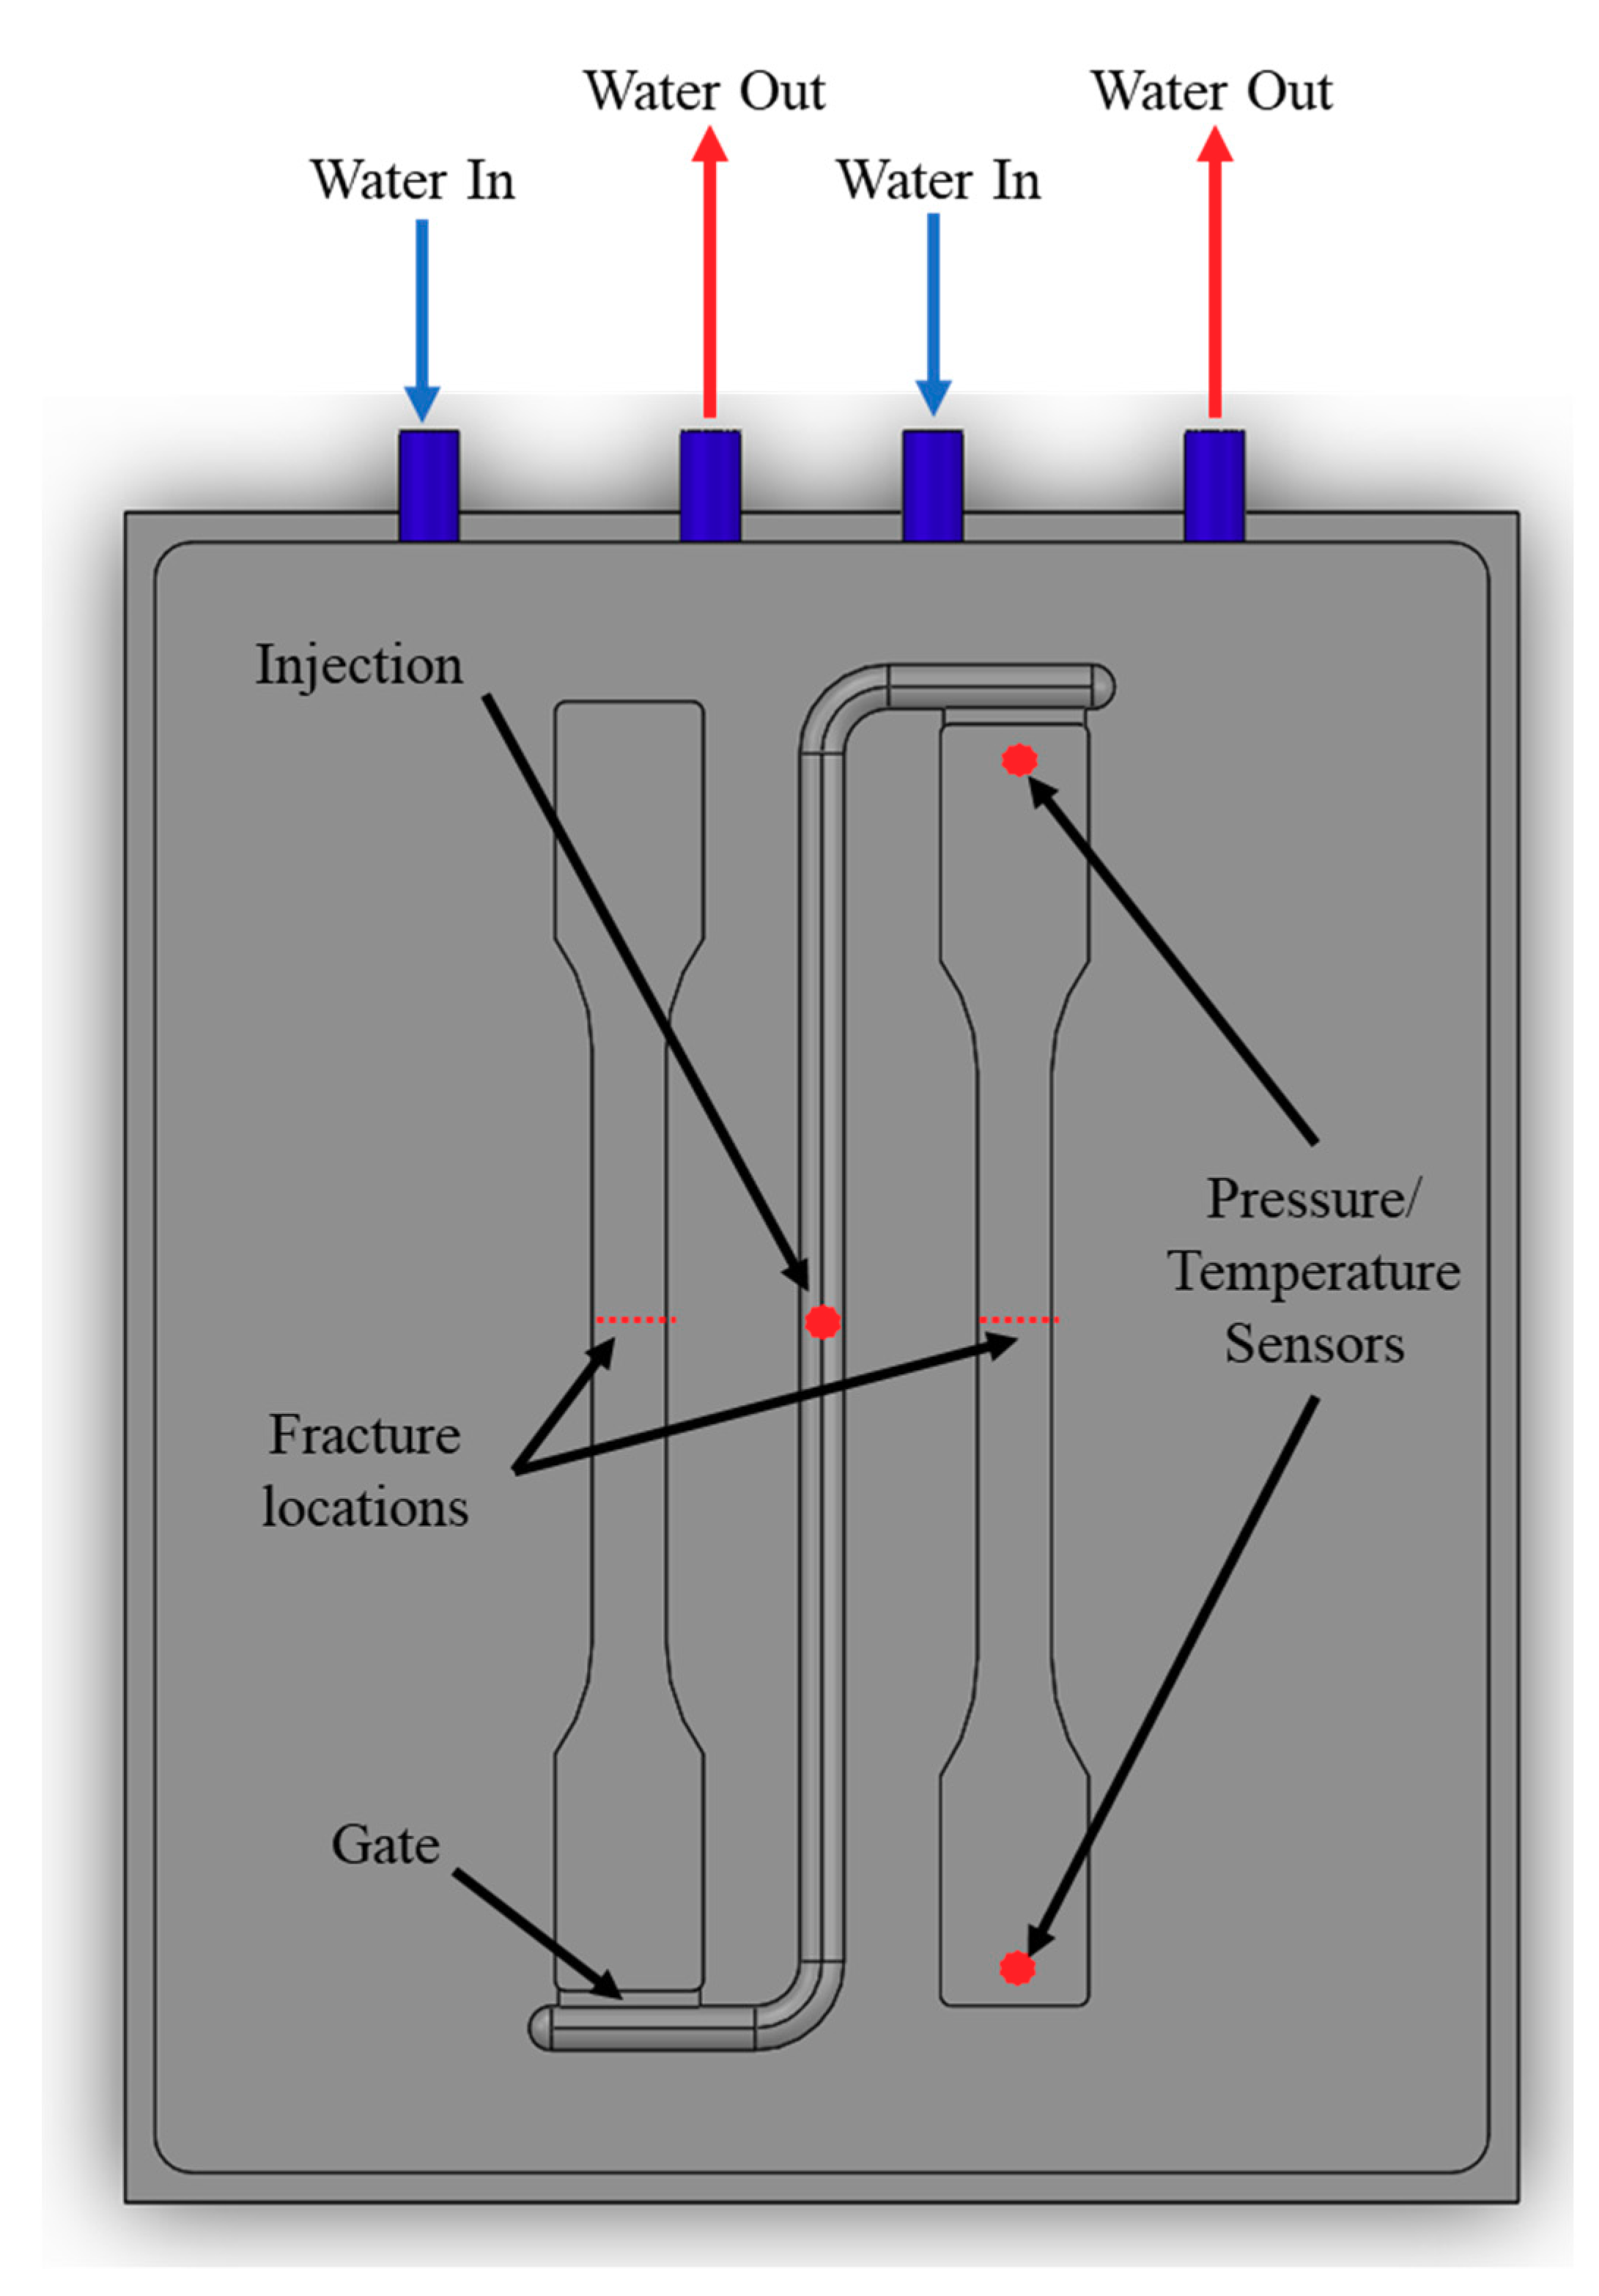
2.2. Processing
2.3. Characterization
2.3.1. Simple Modeling
2.3.2. Internal Cell Structure
2.3.3. Tensile Properties
2.3.4. Flexural Modulus Properties
3. Results and Discussion
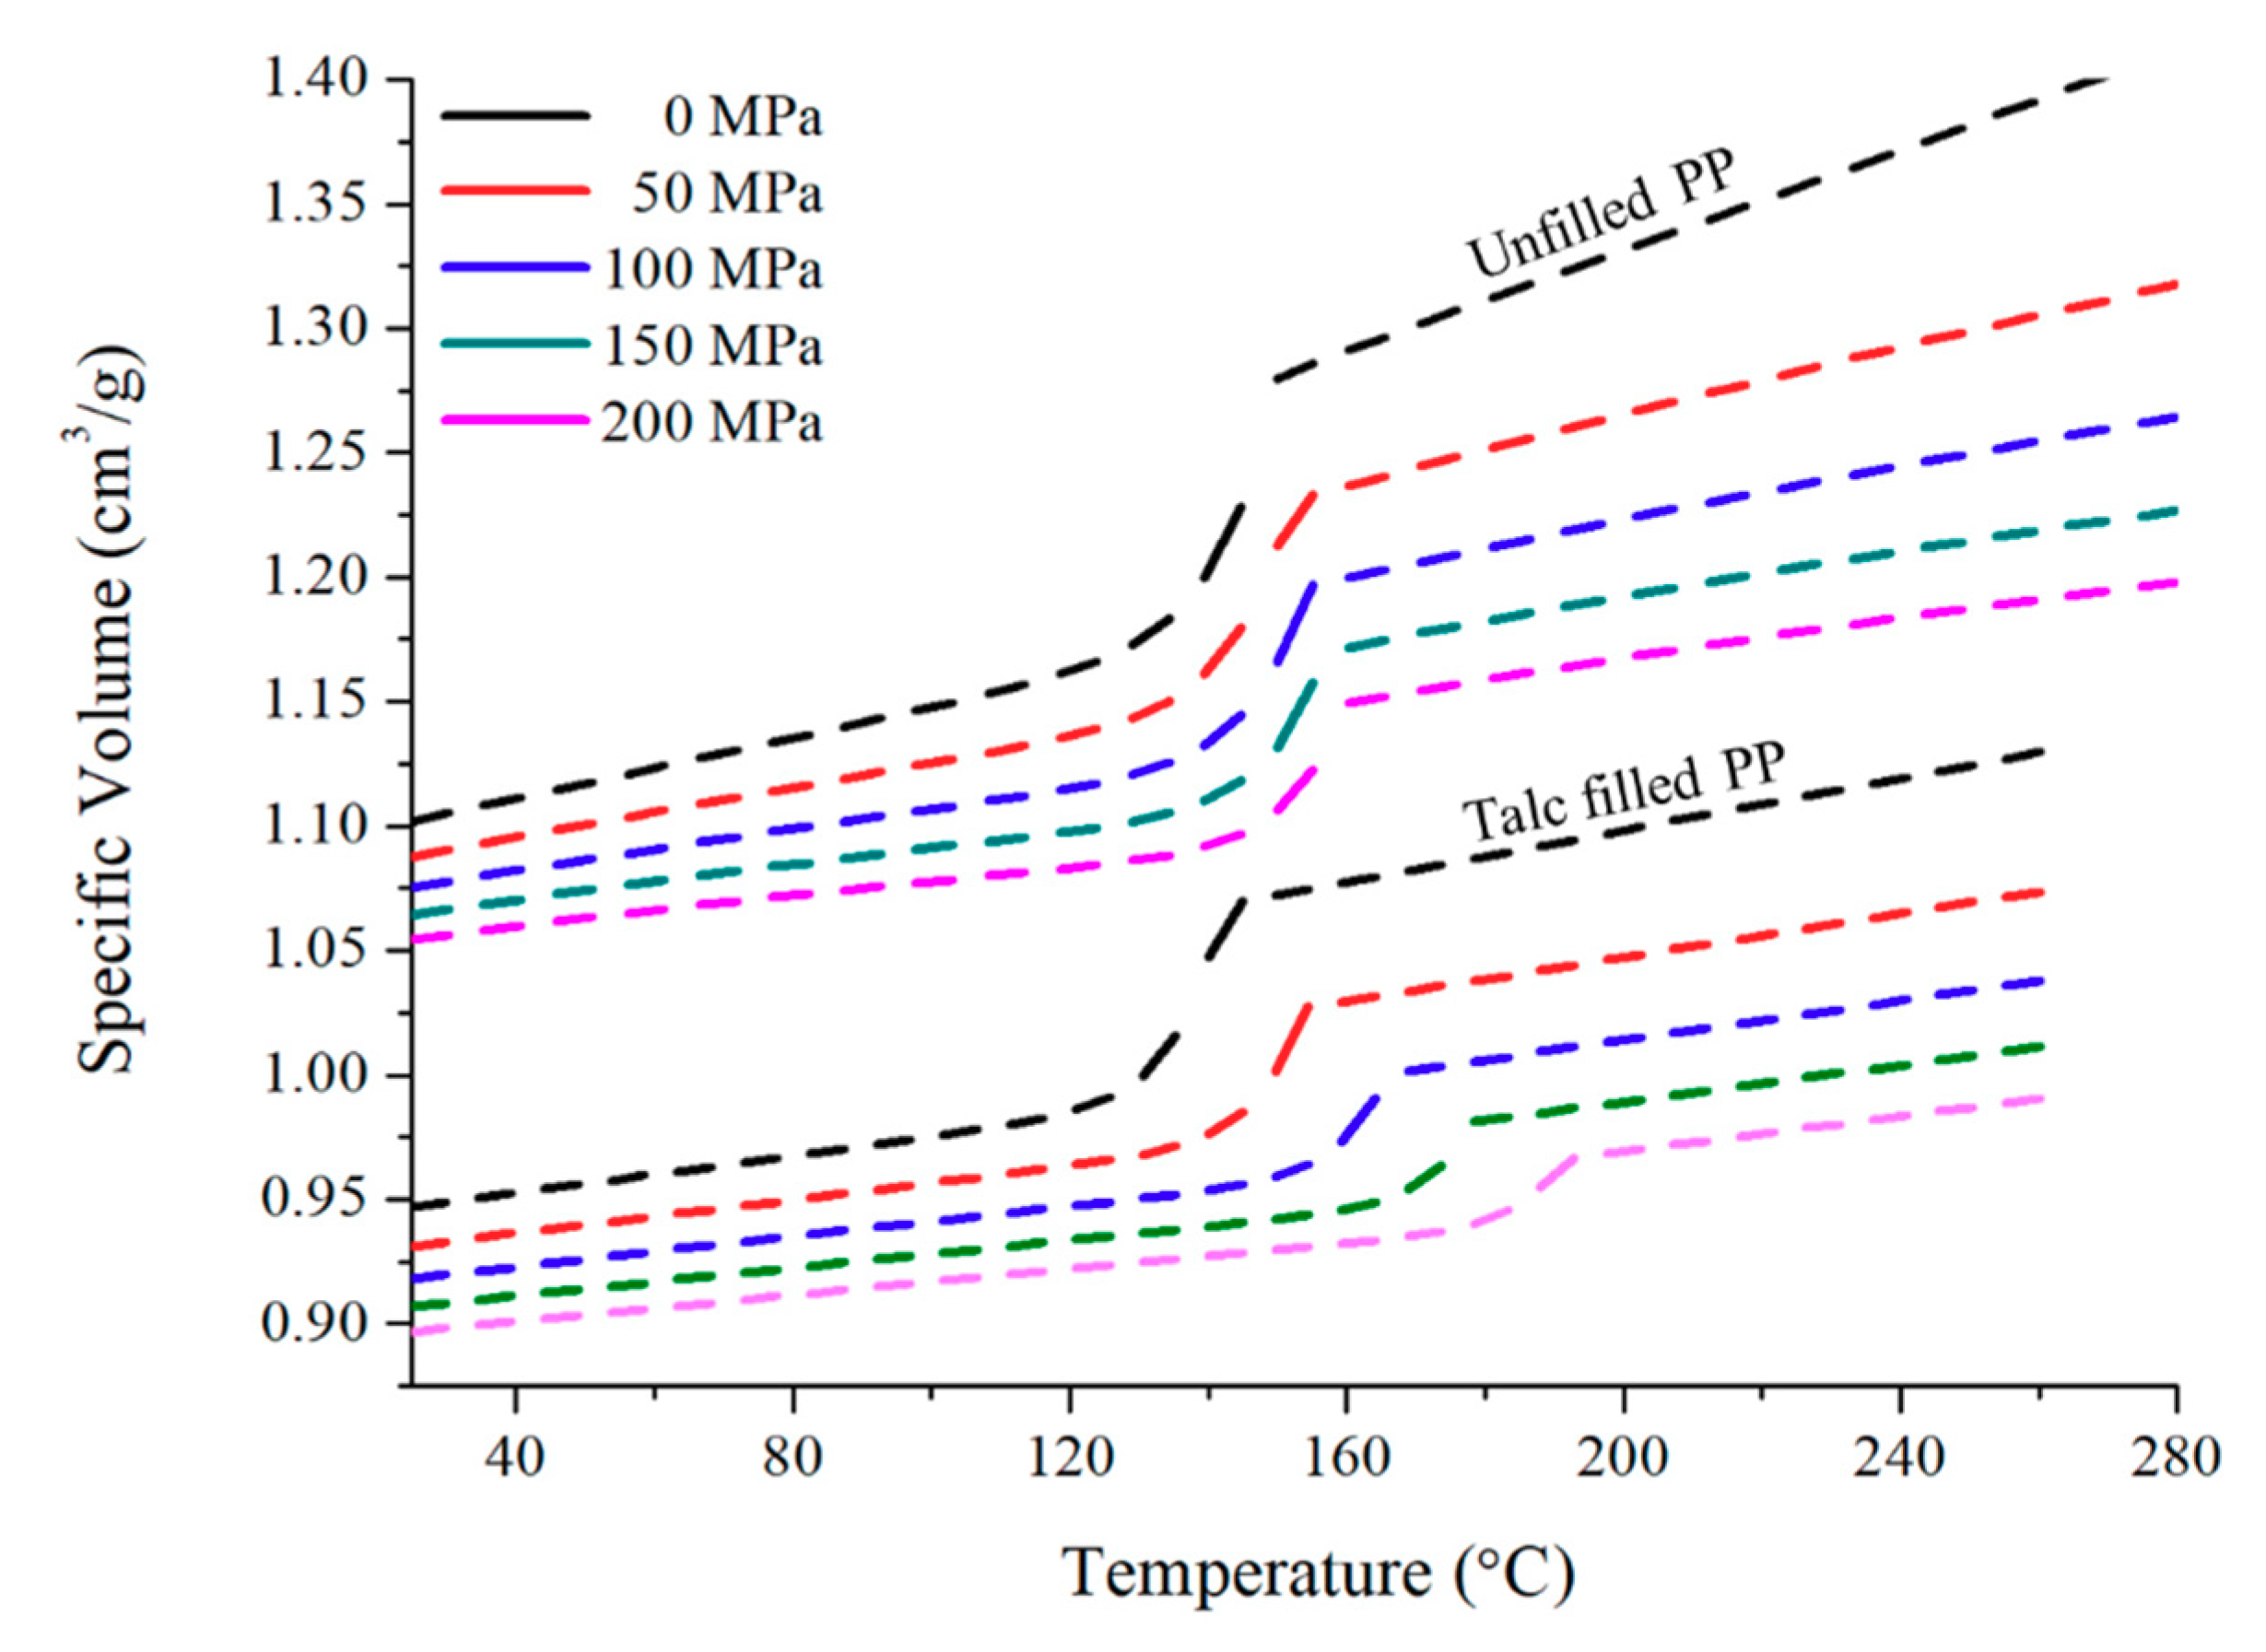
3.1. Simple Modeling Prediction
3.1.1. Tensile Strength Comparisons
3.1.2. Flexural Strength Comparisons
3.2. Microscopy Characterization
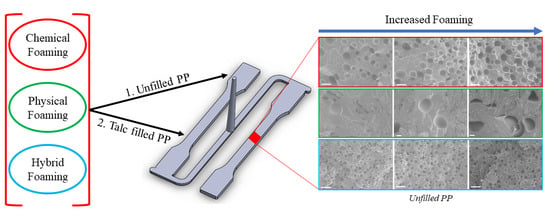
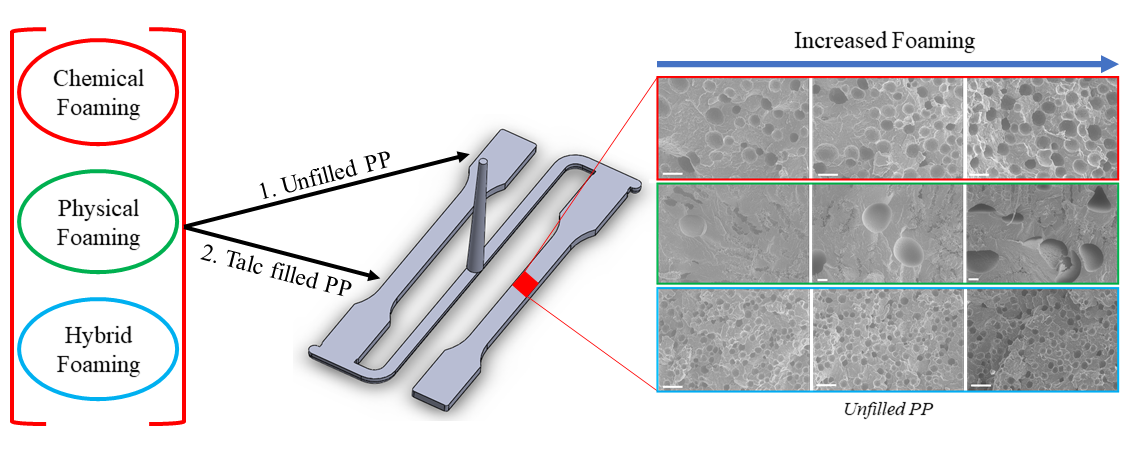
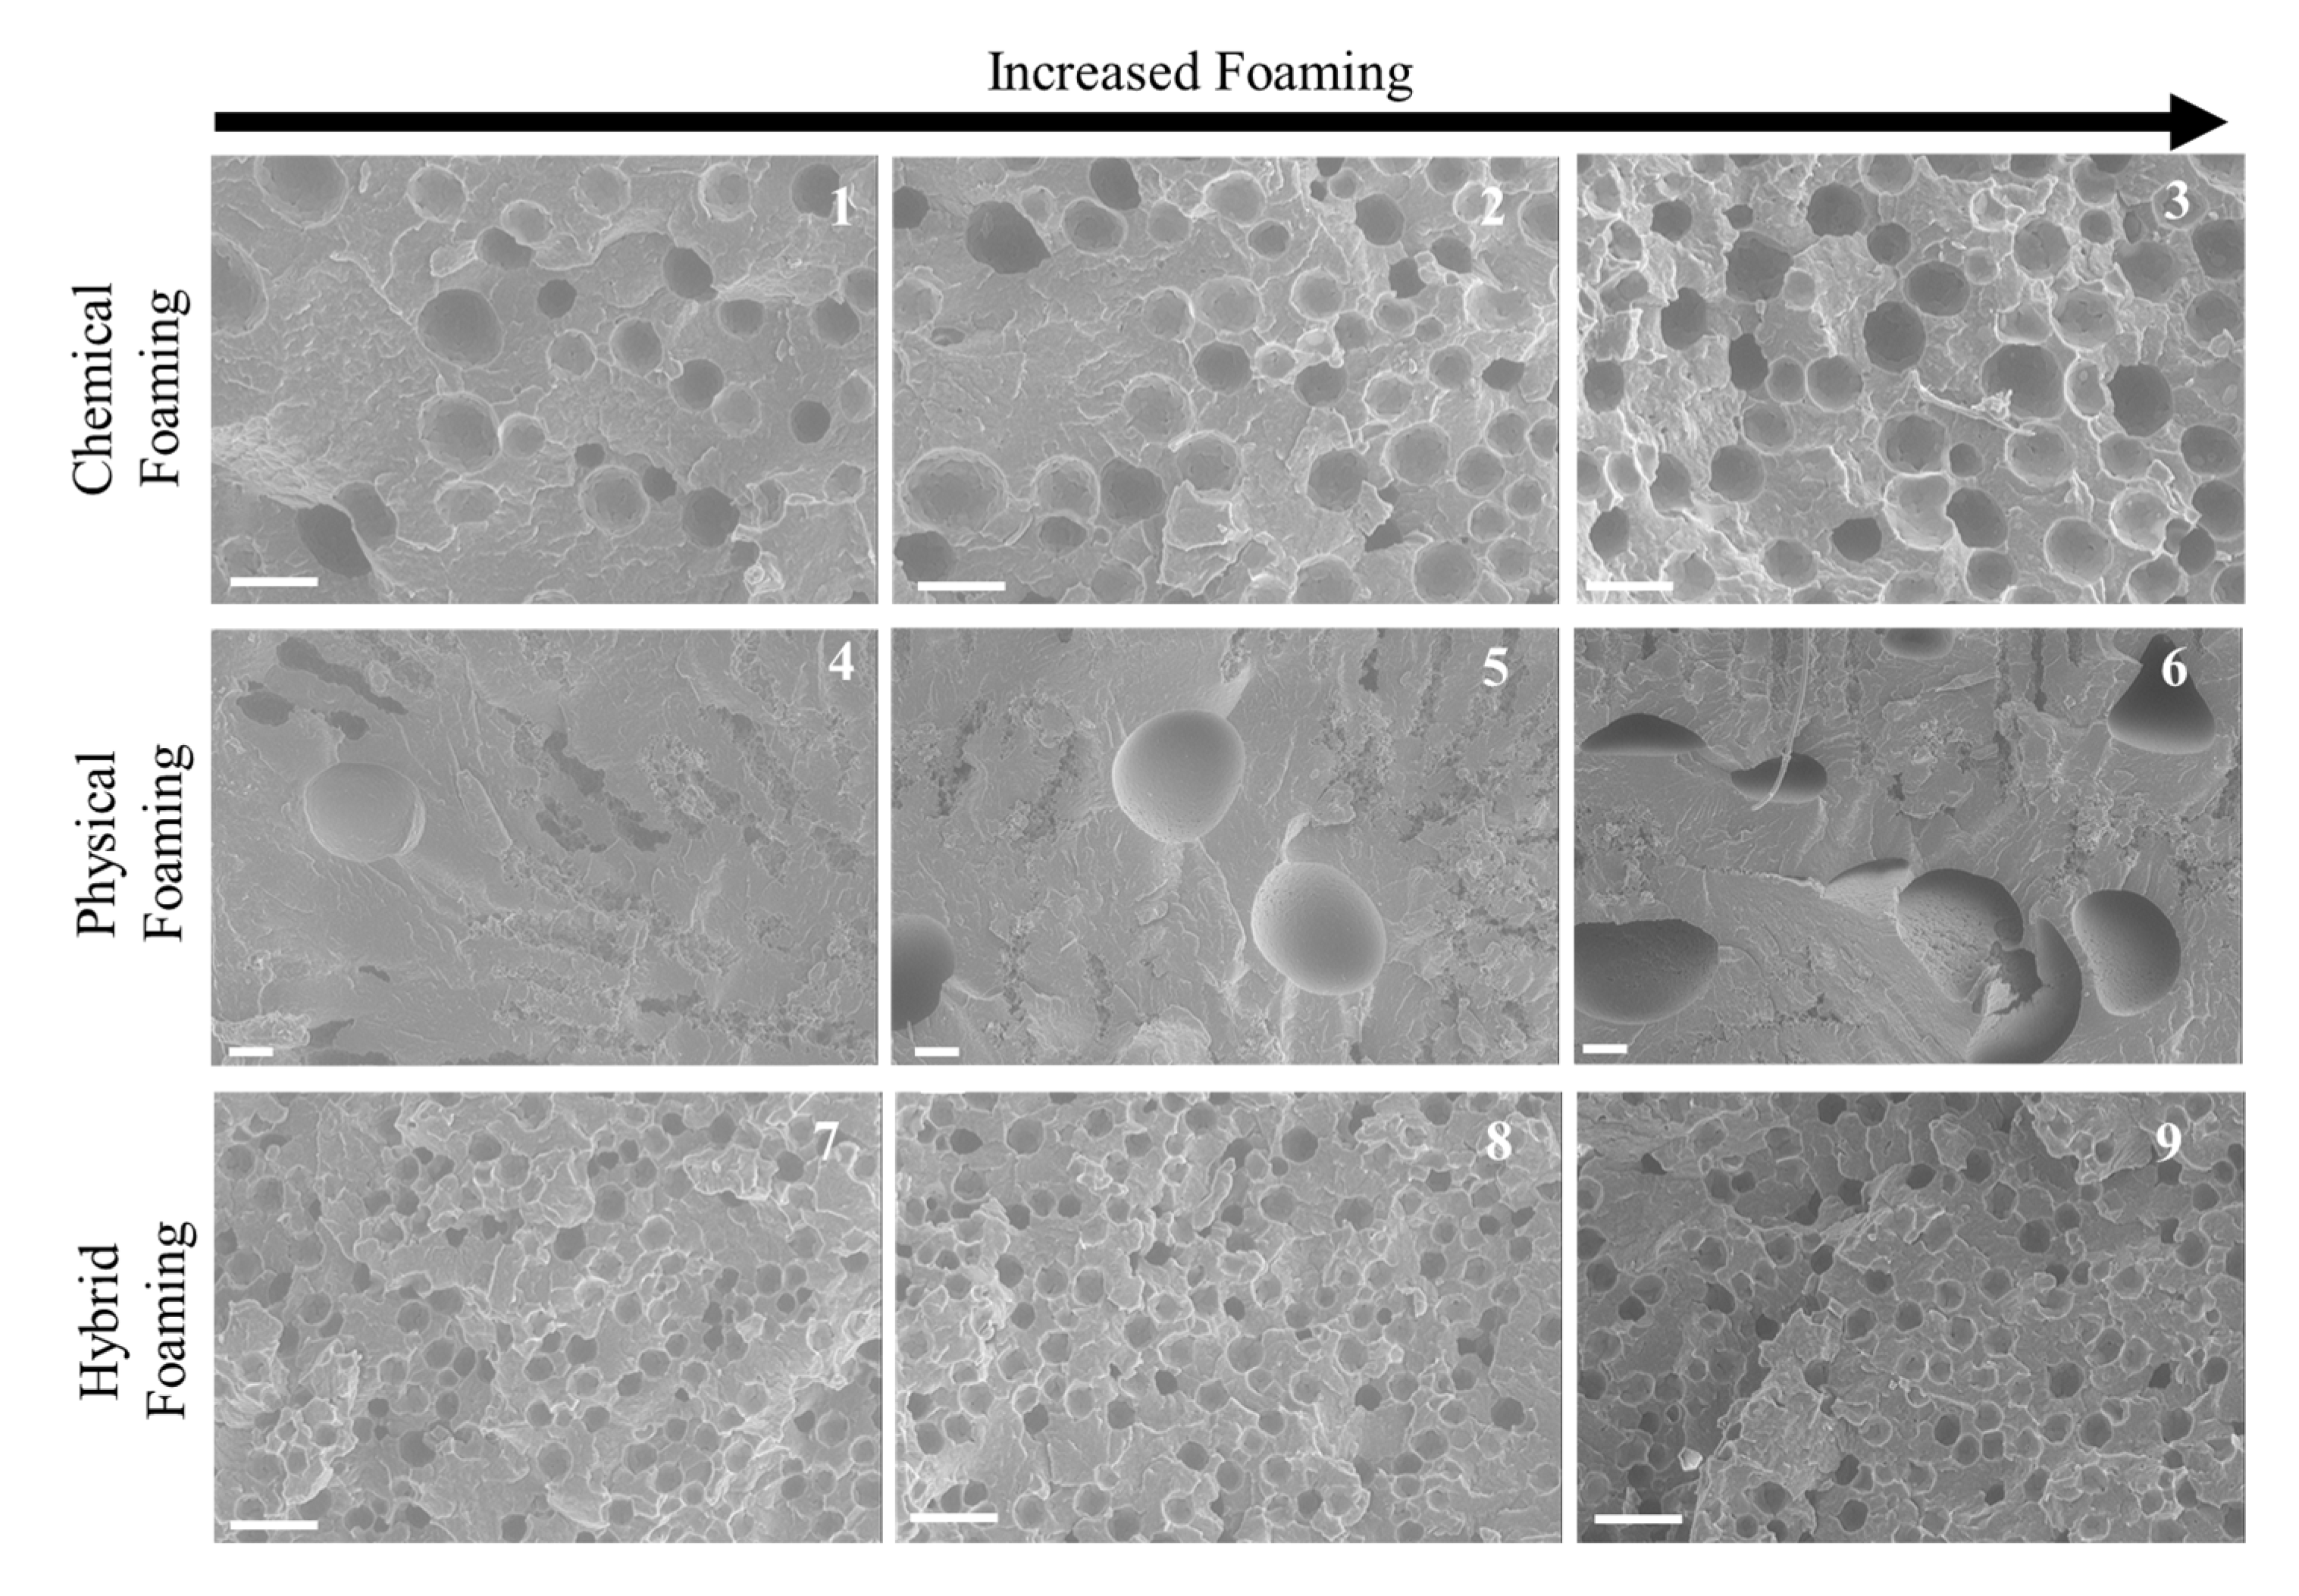
3.2.1. Unfilled PP Analysis
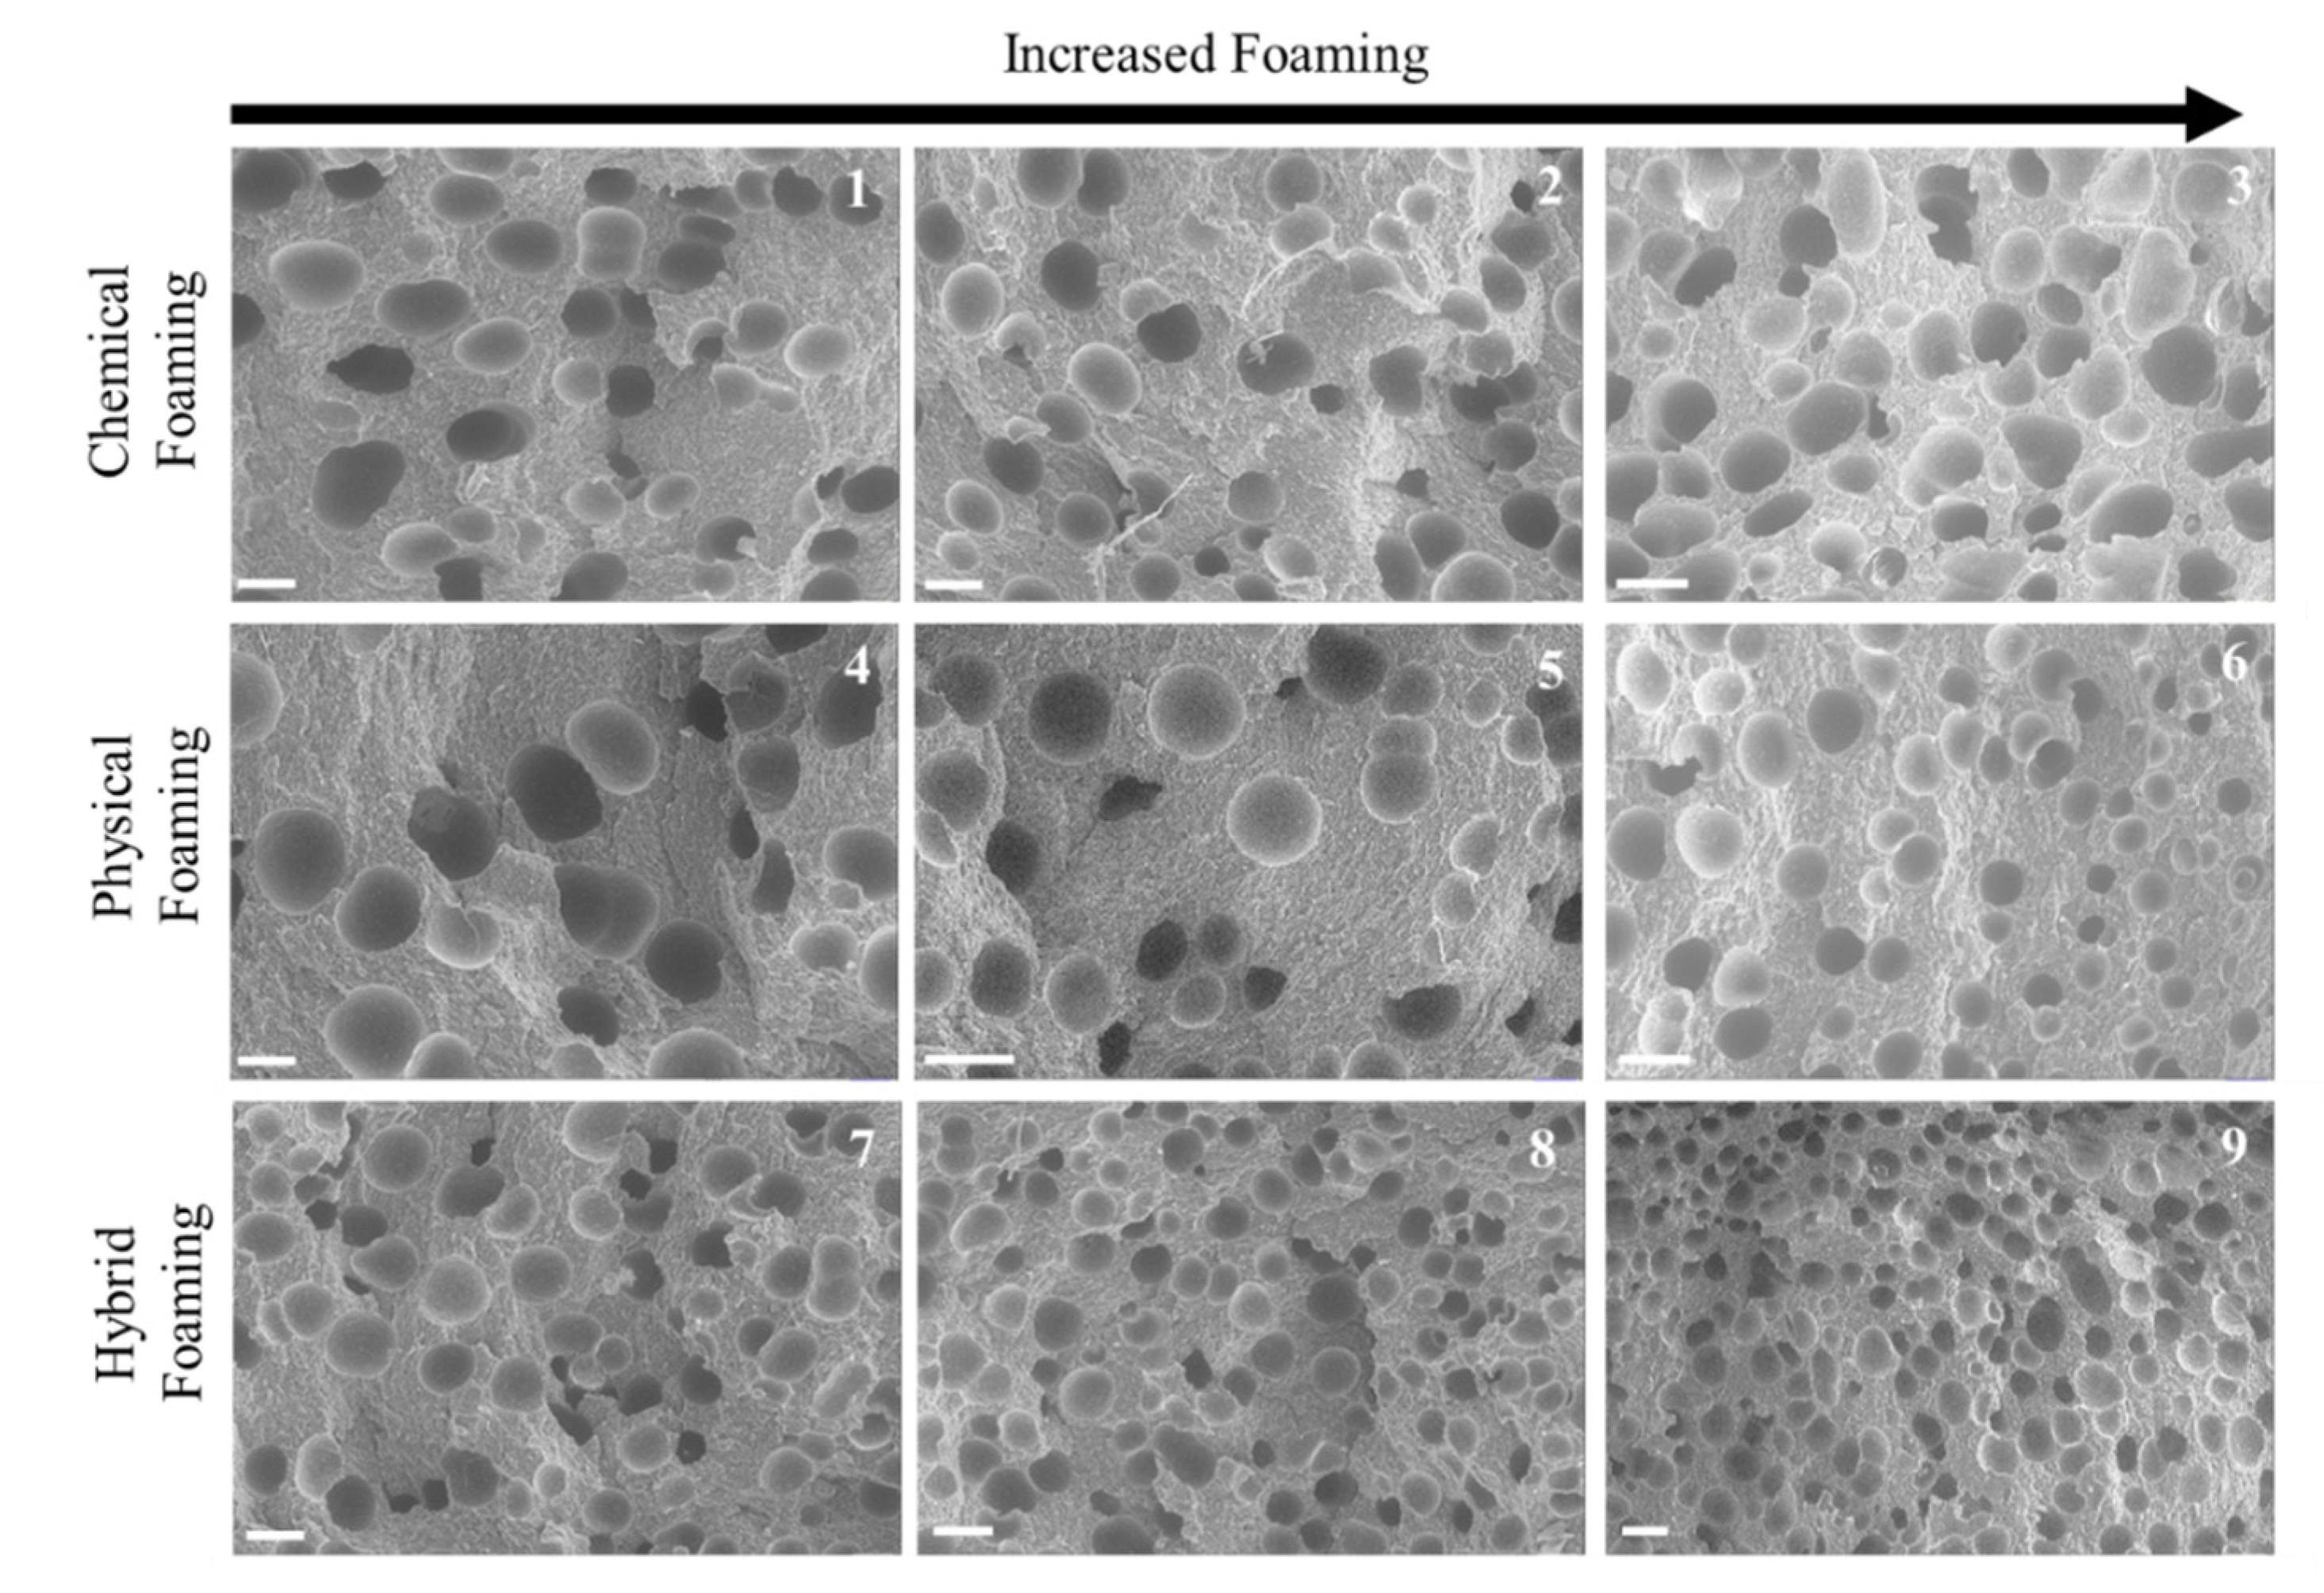
3.2.2. Talc-Filled PP Analysis
3.3. Tensile Strength Data
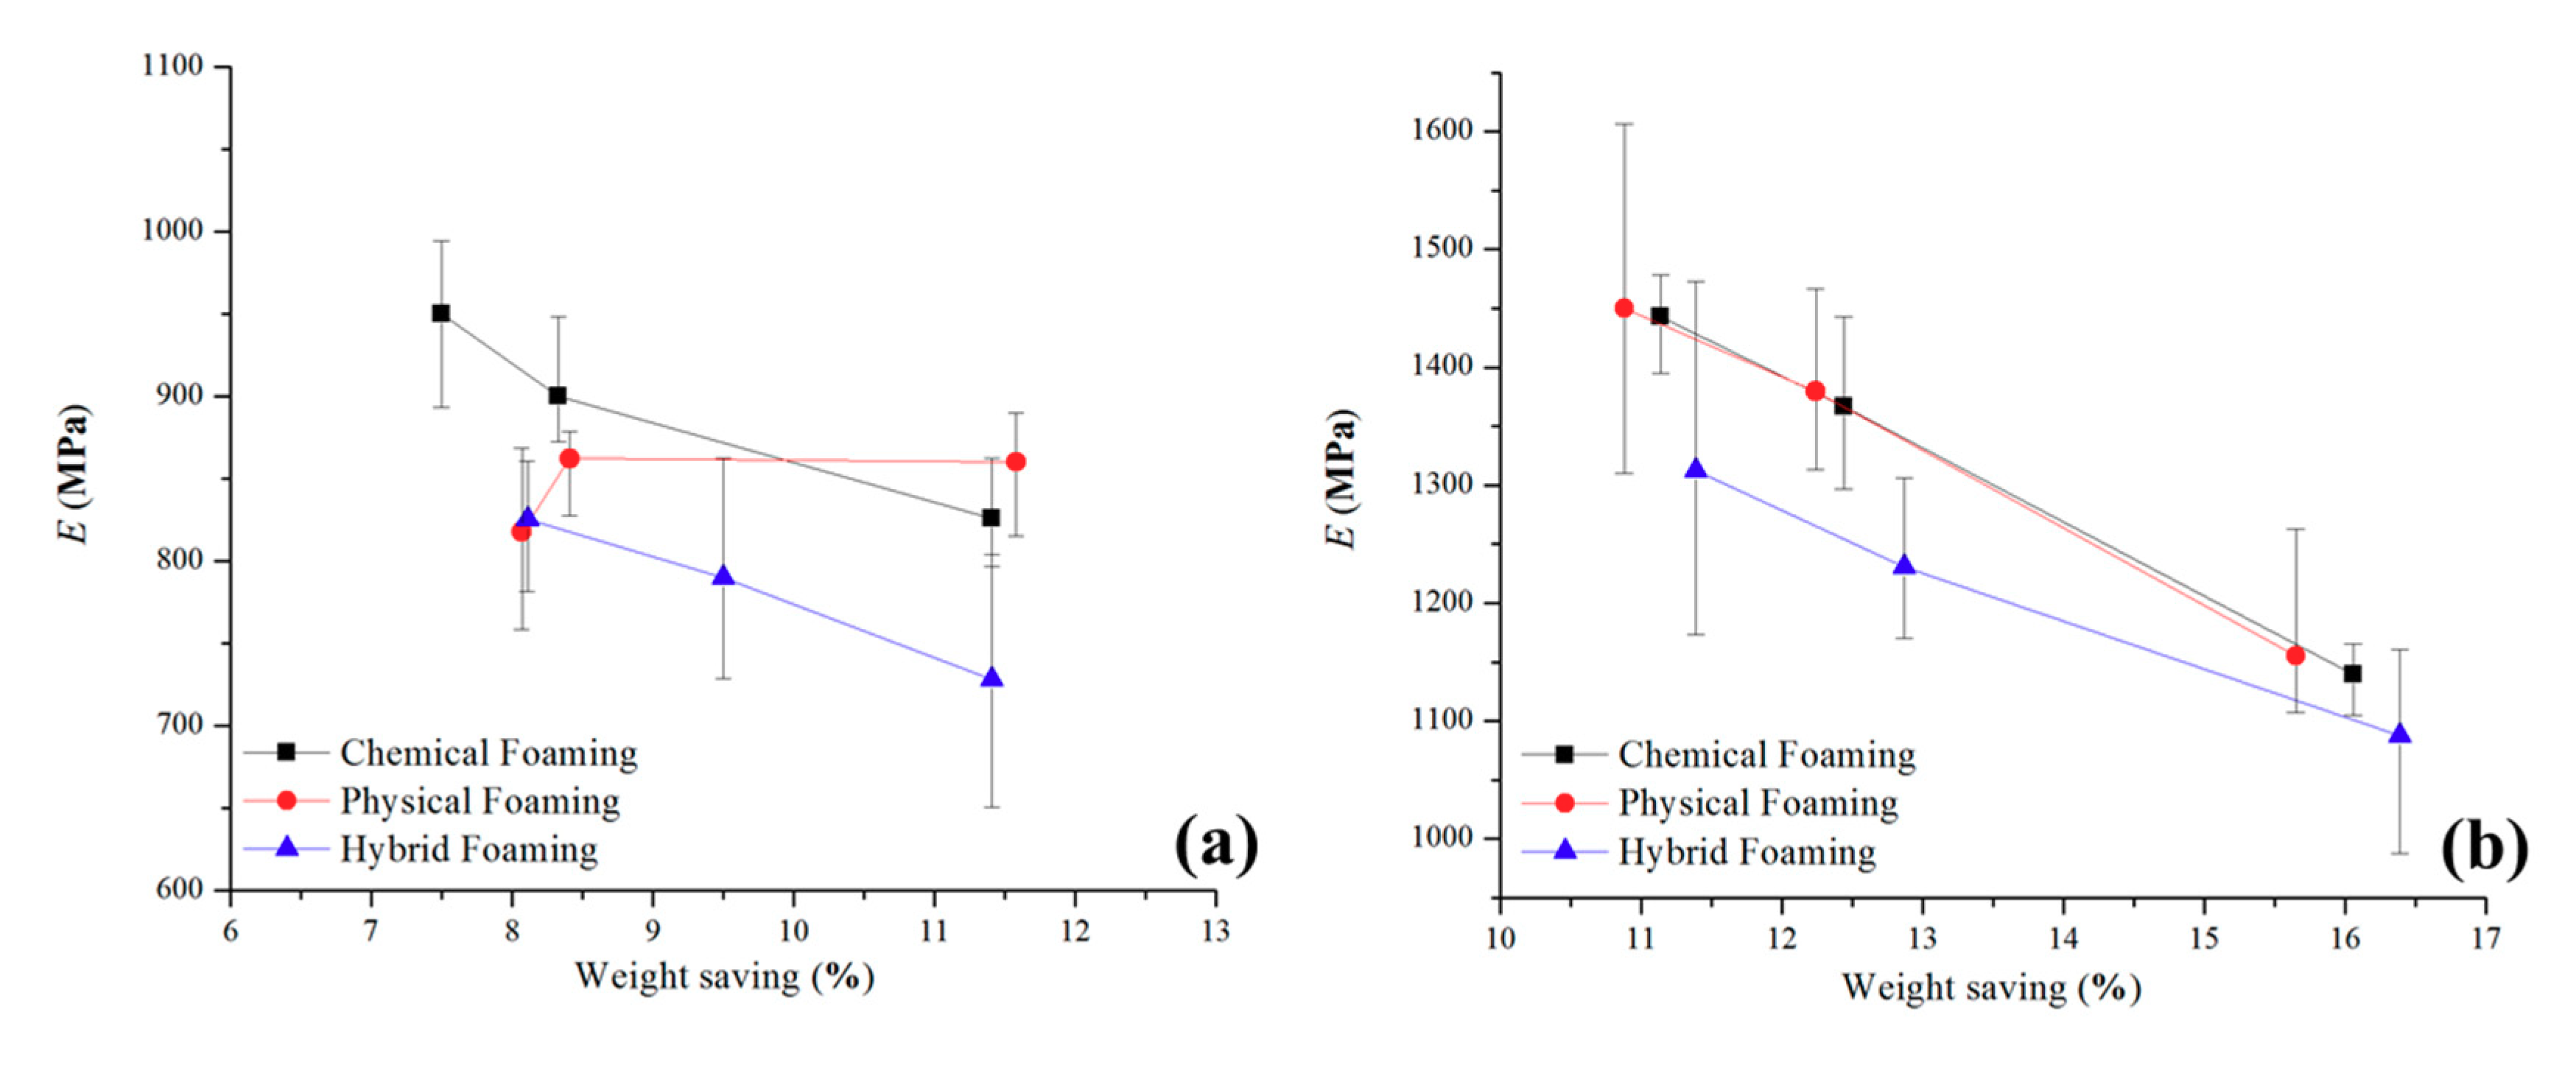
3.3.1. Modulus of Elasticity (E)
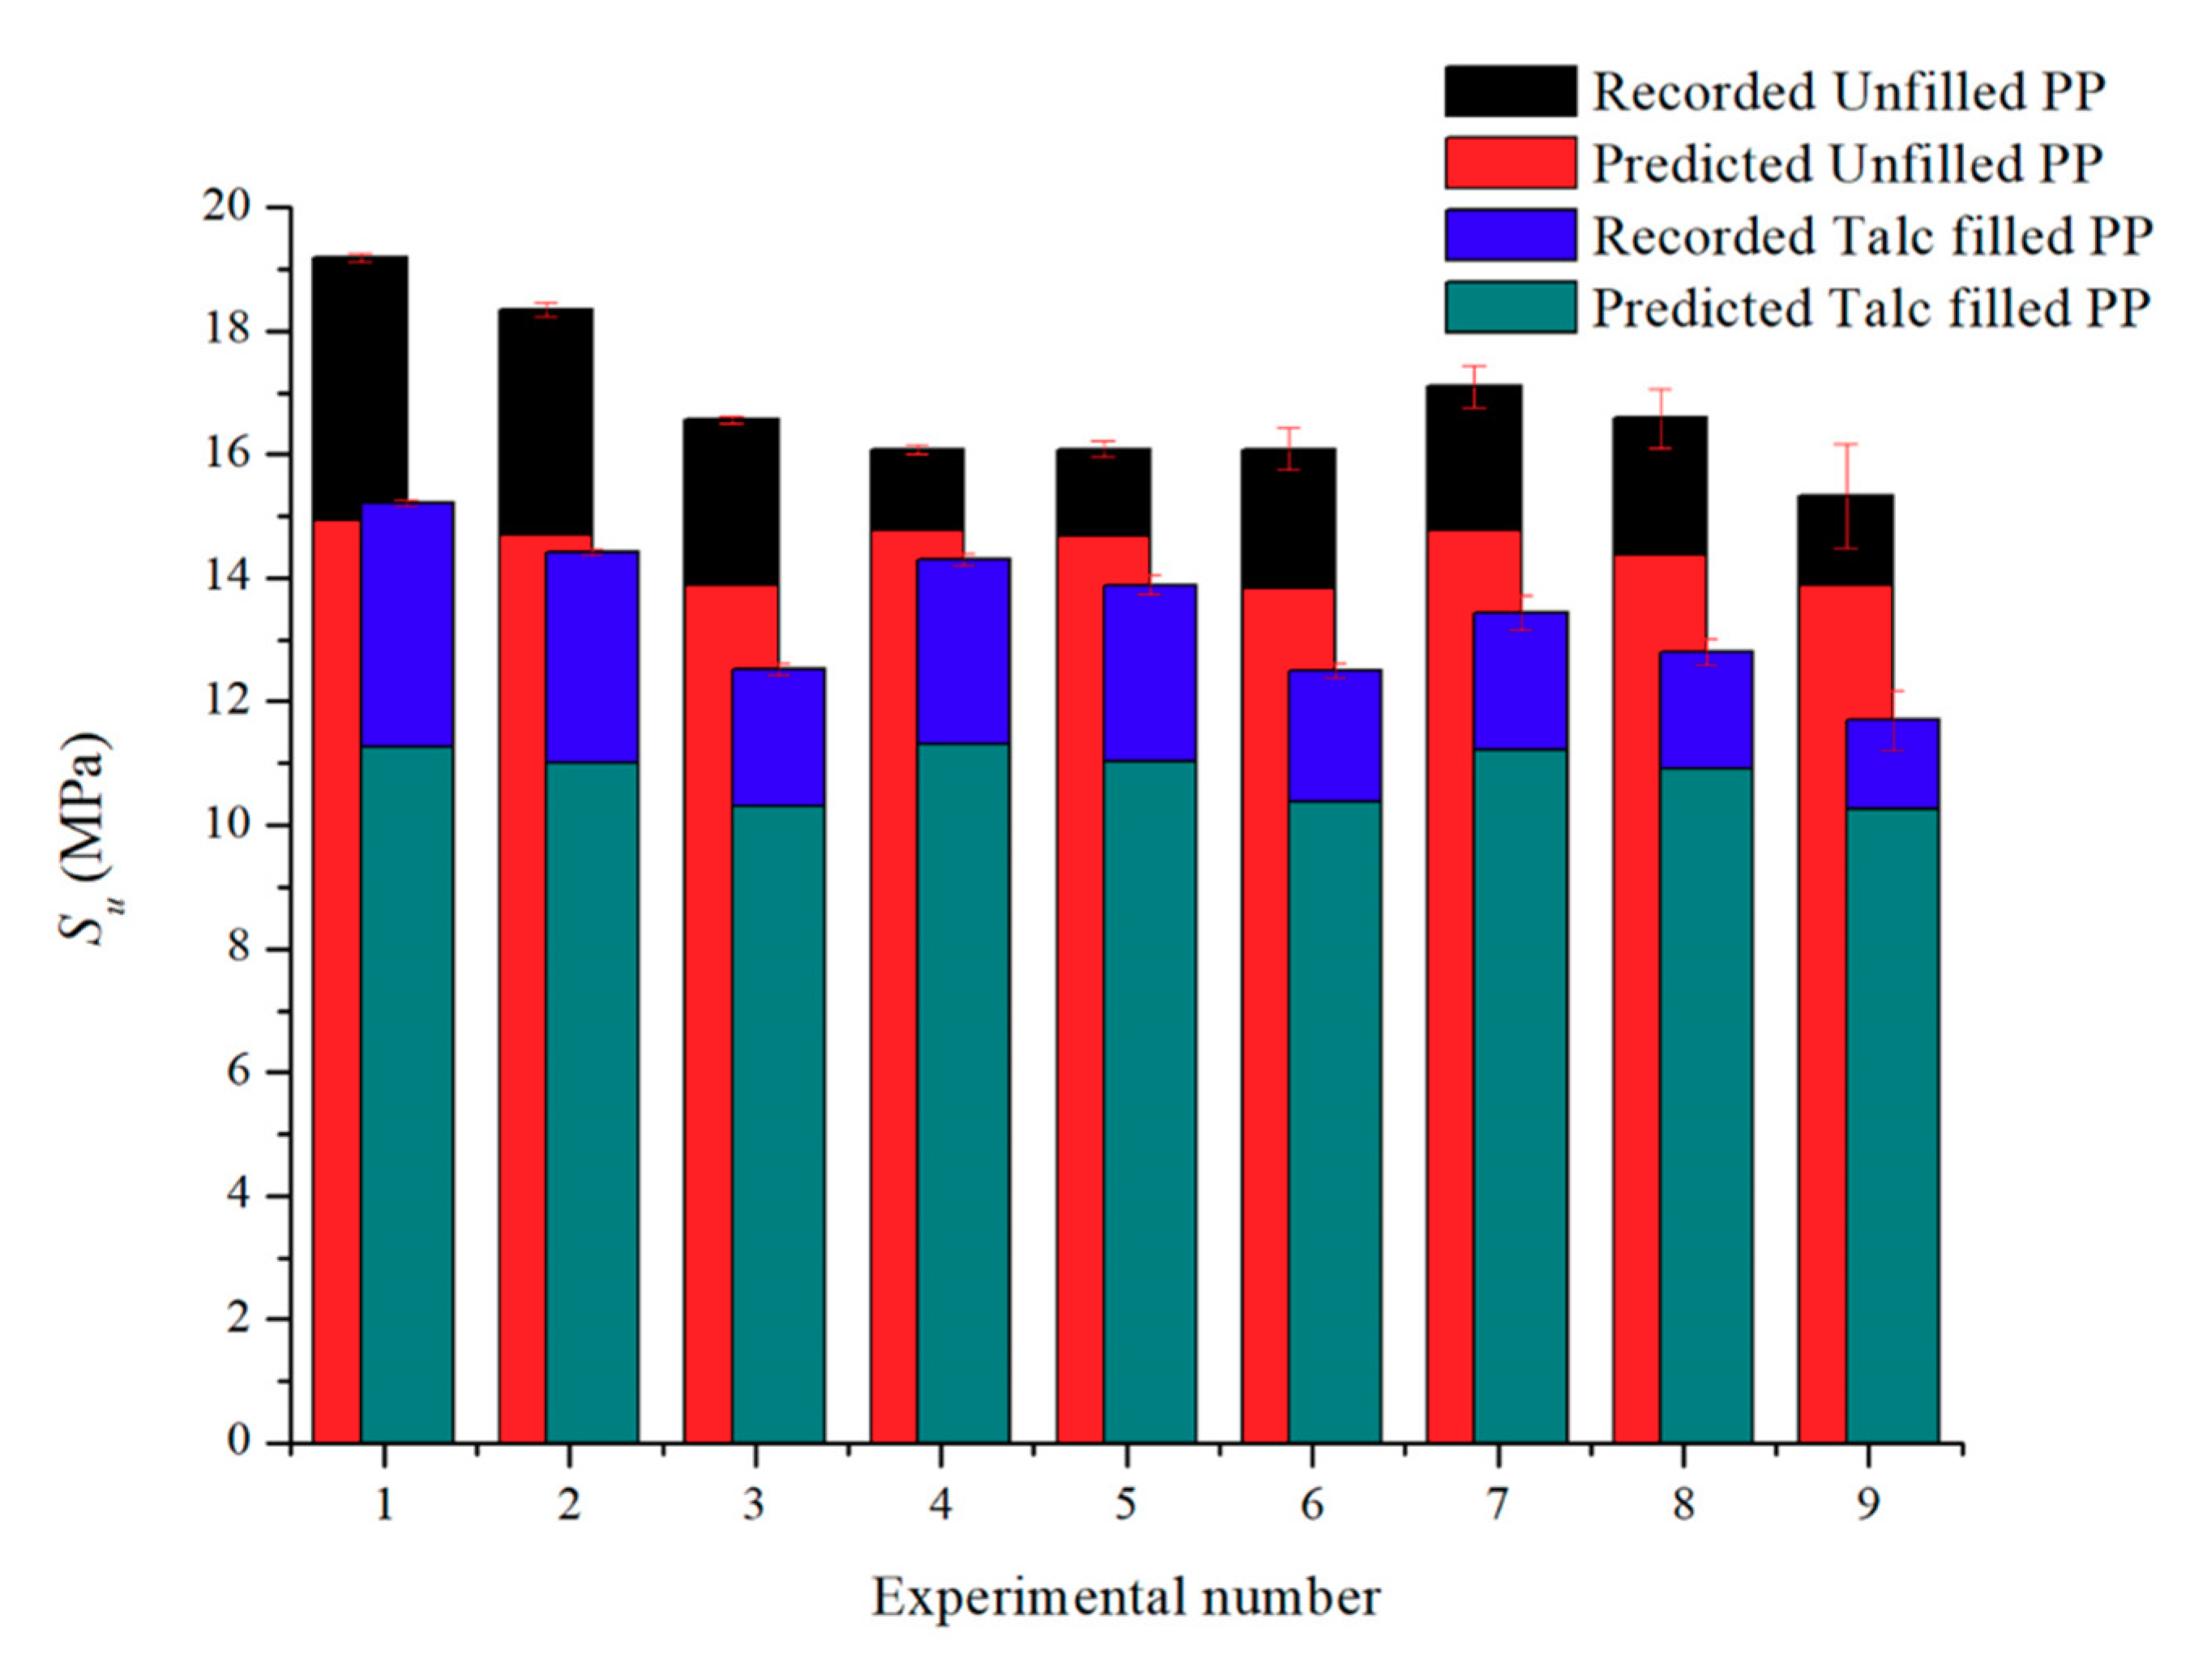
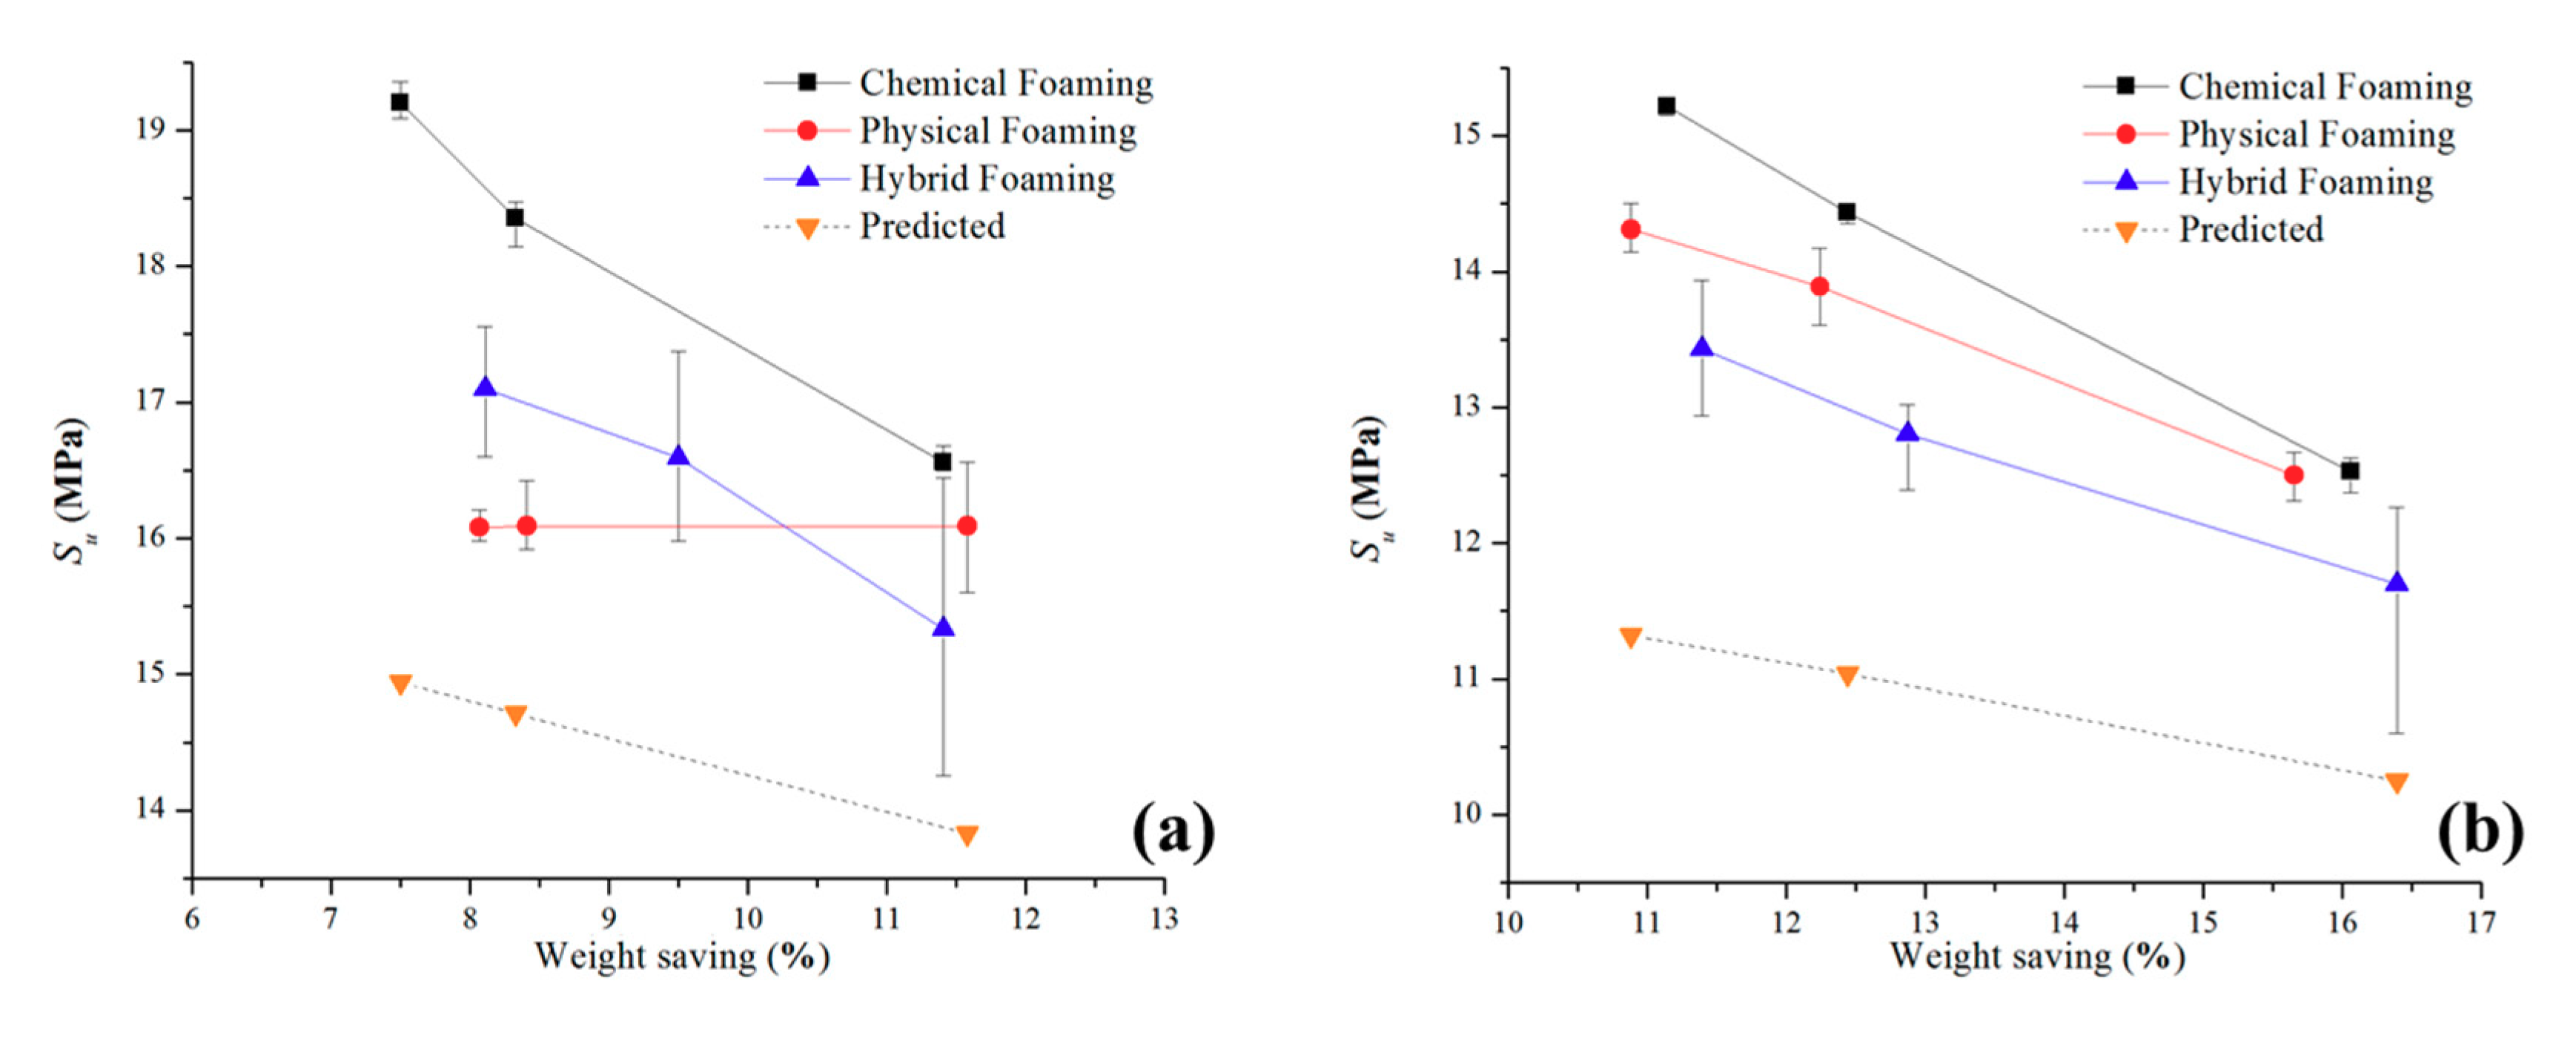
3.3.2. Ultimate Tensile Strength (Su)
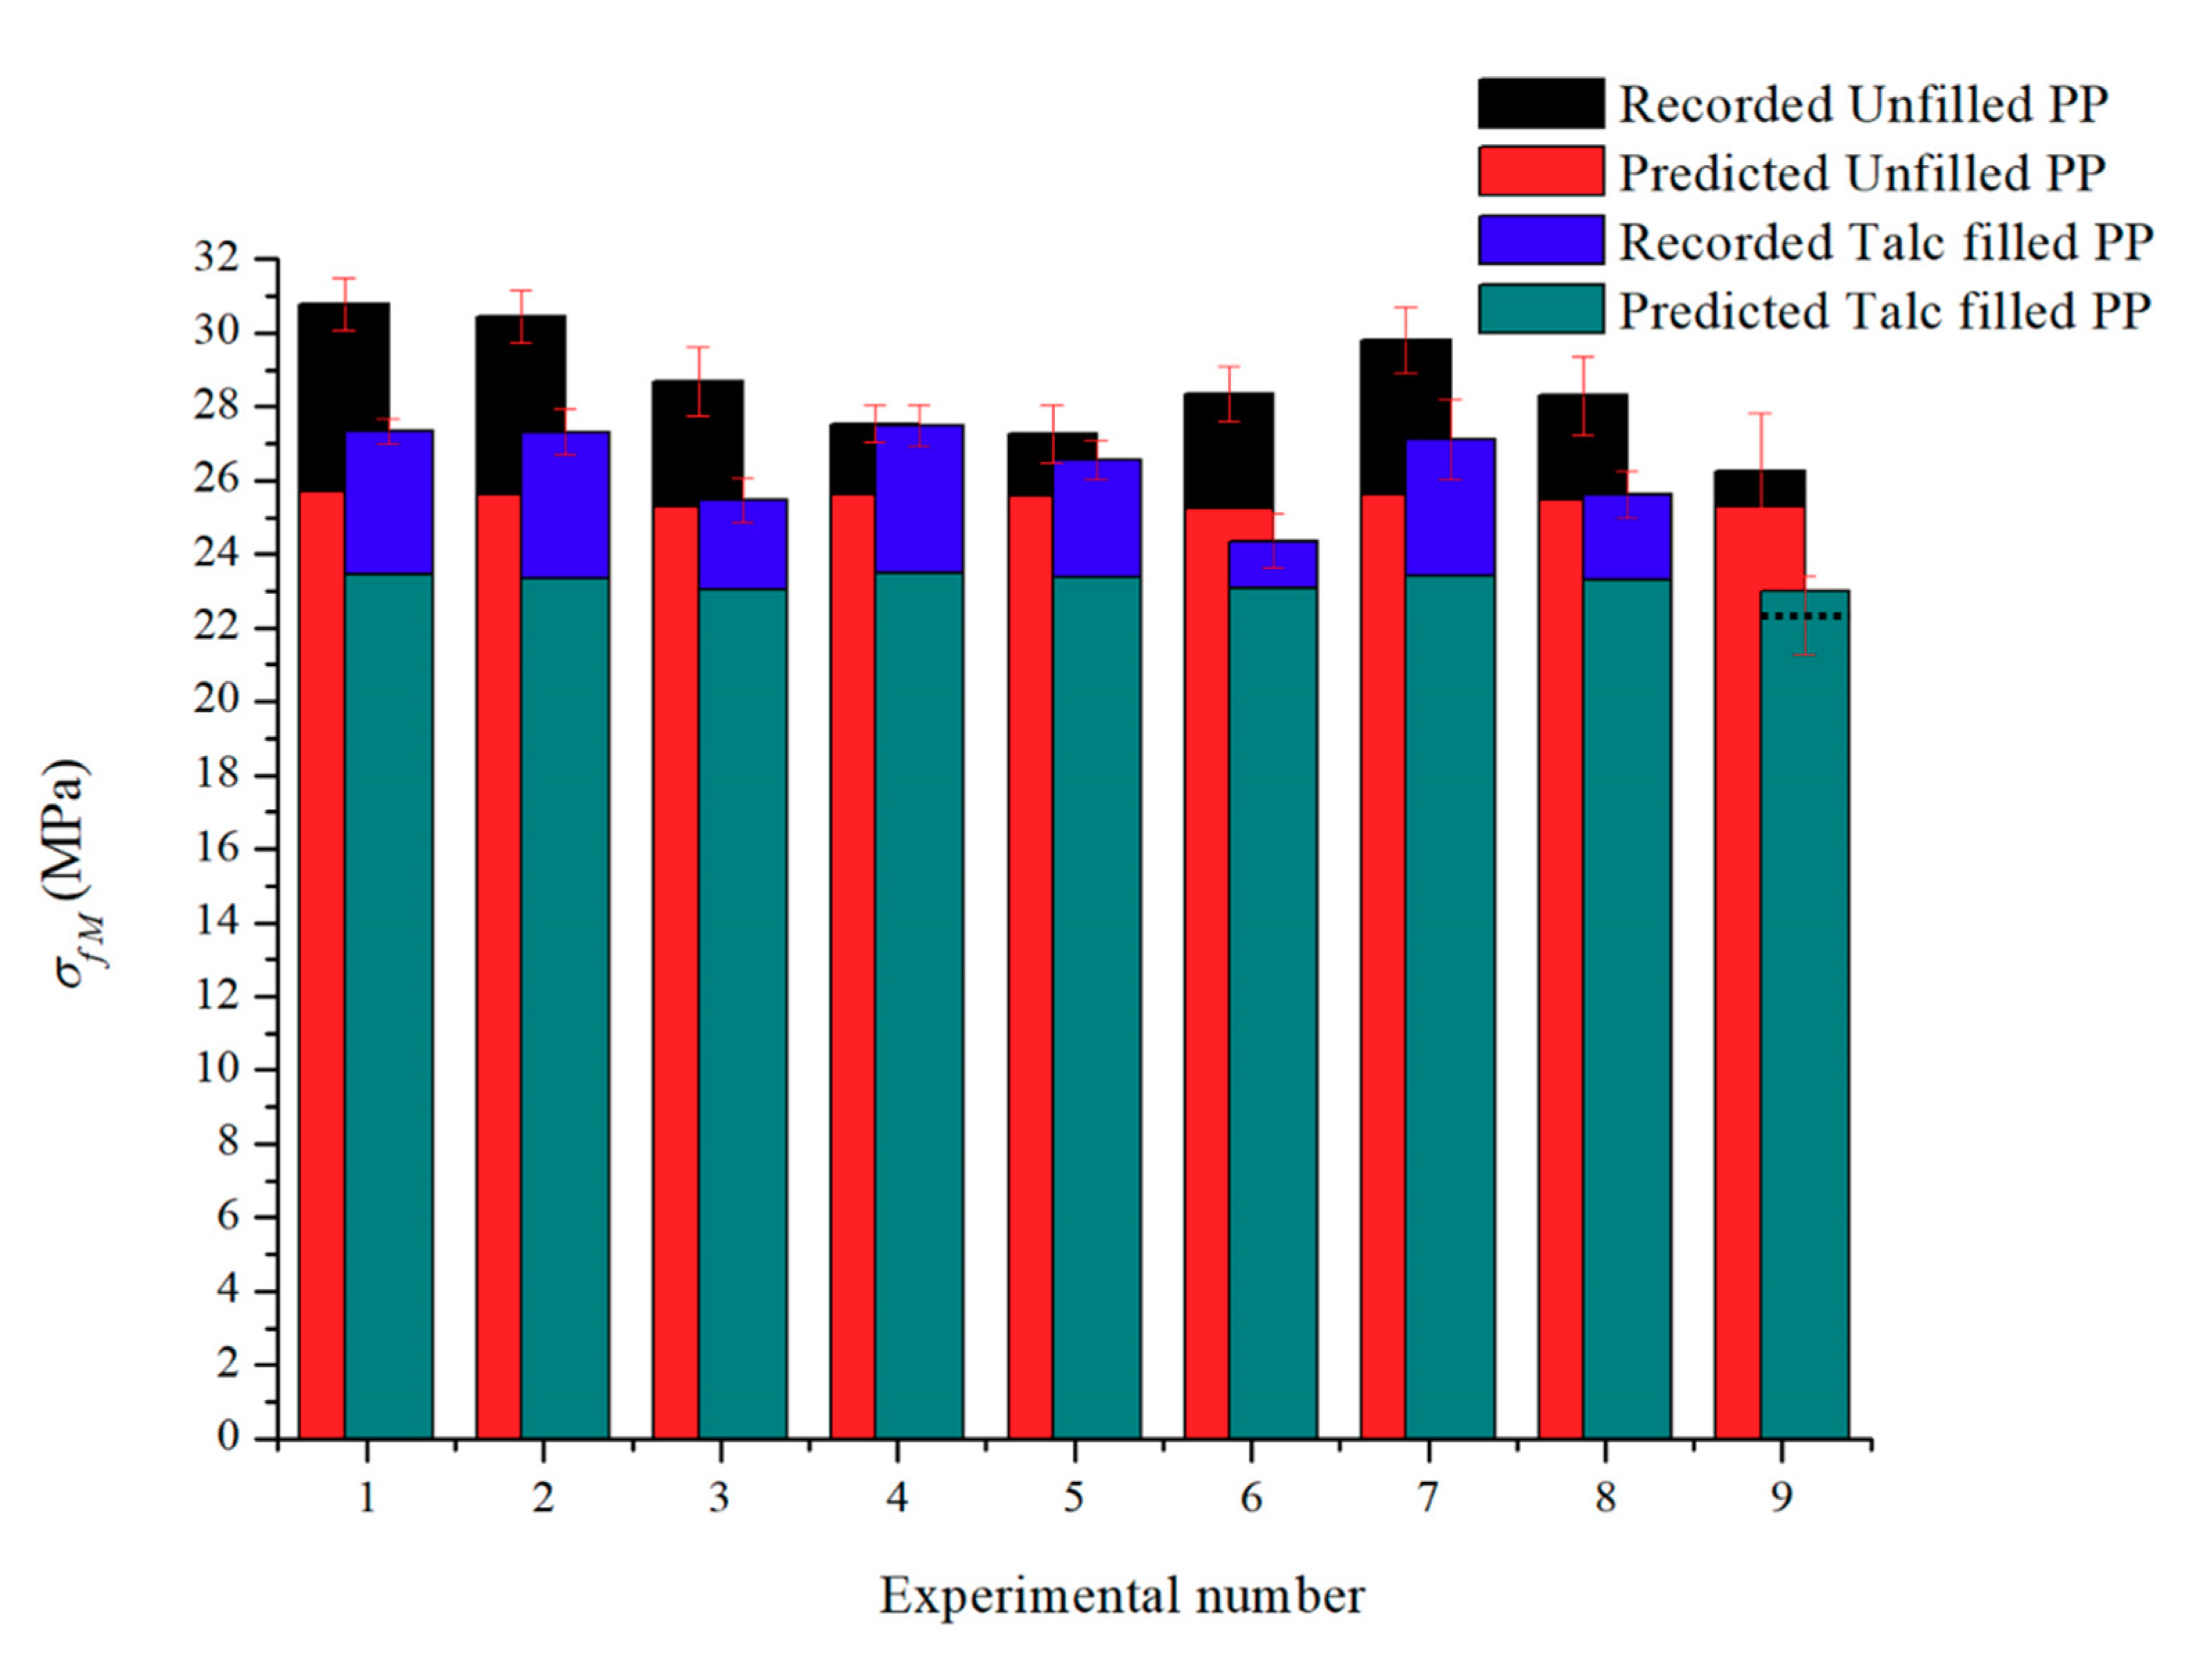
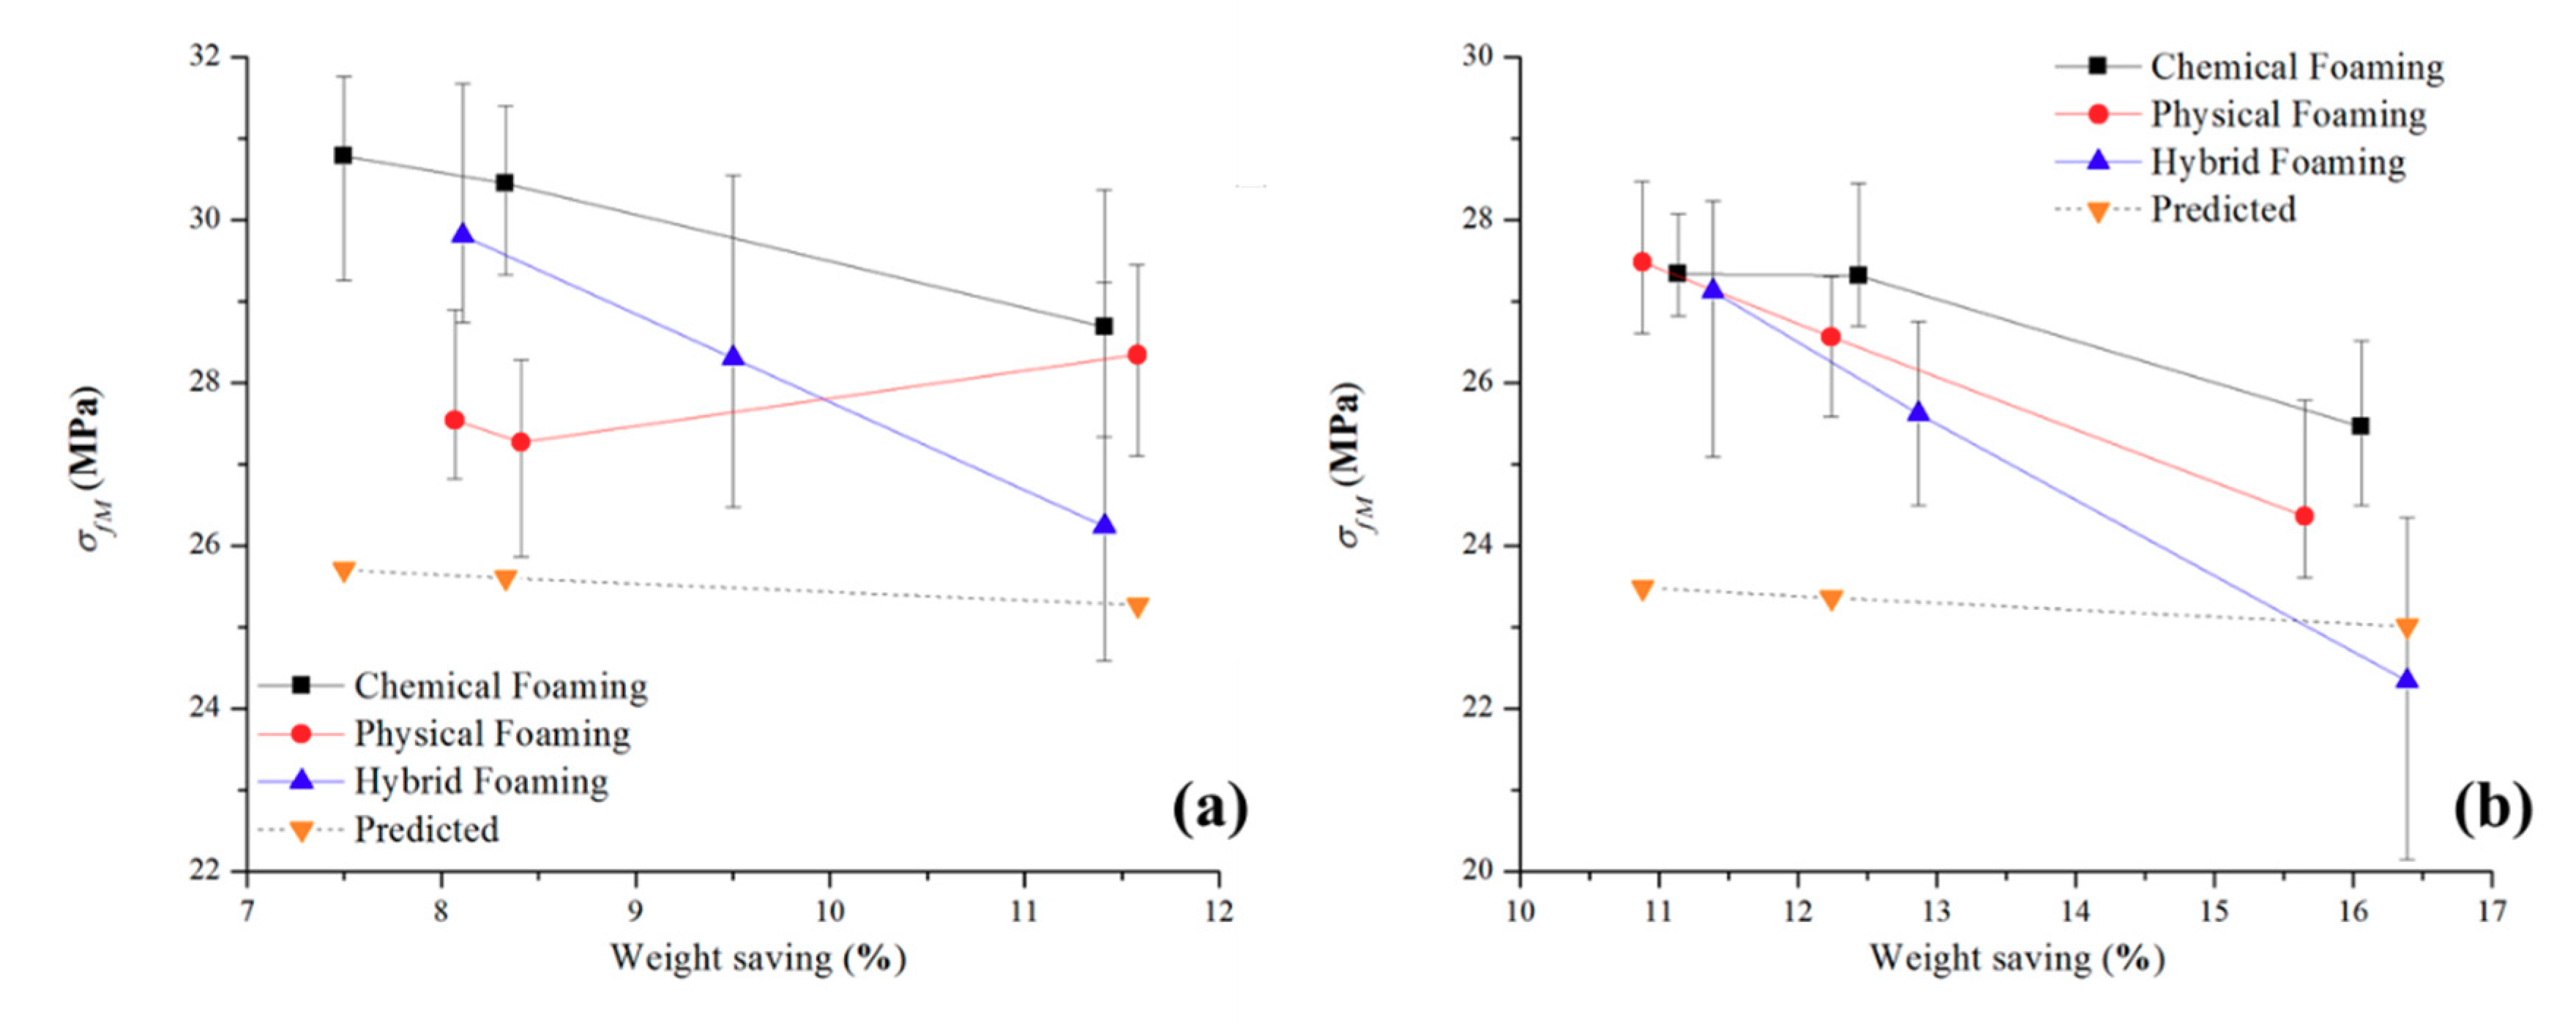
3.4. Flexural Modulus Data
4. Conclusions
Author Contributions
Funding
Acknowledgments
Conflicts of Interest
References
- Gong, S.; Yuan, M.; Chandra, A.; Kharbas, H.; Osorio, A.; Turng, L.S. Microcellular injection molding. Int. Polym. Process. 2005, 20, 202–214. [Google Scholar] [CrossRef]
- Baldwin, D.F.; Park, C.B.; Suh, N.P. An extrusion system for the processing of microcellular polymer sheets: Shaping and cell growth control. Polym. Eng. Sci. 1996, 36, 1425–1435. [Google Scholar] [CrossRef]
- Zhang, H.; Rizvi, G.M.; Park, C.B. Development of an extrusion system for producing fine-celled HDPE/wood-fiber composite foams using CO2 as a blowing agent. Adv. Polym. Technol. 2004, 23, 263–276. [Google Scholar] [CrossRef]
- Lee, S.-T.; Park, C.B. Foam Extrusion: Principles and Practice, 2nd ed.; CRC Press: Boca Raton, FL, USA, 2014. [Google Scholar]
- Suh, N.P. Impact of microcellular plastics on industrial practice and academic research. Macromol. Symp. 2003, 201, 187–202. [Google Scholar] [CrossRef]
- Volpe, V.; Lanzillo, S.; Affinita, G.; Villacci, B.; Macchiarolo, I.; Pantani, R. Lightweight high-performance polymer composite for automotive applications. Polymers 2019, 11, 326. [Google Scholar] [CrossRef] [PubMed]
- Doroudiani, S.; Park, C.B.; Kortschot, M.T. Effect of the crystallinity and morphology on the microcellular foam structure of semicrystalline polymers. Polym. Eng. Sci. 1996, 36, 2645–2662. [Google Scholar] [CrossRef]
- Wang, L.; Okada, K.; Hikima, Y.; Ohshima, M.; Sekiguchi, T.; Yano, H. Effect of cellulose nanofiber (CNF) surface treatment on cellular structures and mechanical properties of polypropylene/CNF nanocomposite foams via core-back foam injection molding. Polymers 2019, 11, 249. [Google Scholar] [CrossRef]
- Zhao, J.; Zhao, Q.; Wang, C.; Guo, B.; Park, C.B.; Wang, G. High thermal insulation and compressive strength polypropylene foams fabricated by high-pressure foam injection molding and mold opening of nano-fibrillar composites. Mater. Des. 2017, 131, 1–11. [Google Scholar] [CrossRef]
- Tromm, M.; Shaayegan, V.; Wang, C.; Heim, H.-P.; Park, C.B. Investigation of the mold-filling phenomenon in high-pressure foam injection molding and its effects on the cellular structure in expanded foams. Polymer 2019, 160, 43–52. [Google Scholar] [CrossRef]
- Xu, J. (Ed.) Microcellular Injection Molding, 1st ed.; John Wiley & Sons, Inc.: Hoboken, NJ, USA, 2010; Volume 1. [Google Scholar]
- Shaayegan, V.; Wang, C.; Park, C.B.; Costa, F.; Han, S. Mechanism of cell nucleation in high-pressure foam injection molding followed by precise mold-opening. In Proceedings of the SPE-ANTEC, Indianapolis, IN, USA, 23–25 May 2016; 2016; pp. 1151–1155. [Google Scholar]
- Bernardo, V.; Martin-de Leon, J.; Pinto, J.; Catelani, T.; Athanassiou, A.; Rodriguez-Perez, M.A. Low-density PMMA/MAM nanocellular polymers using low MAM contents: Production and characterization. Polymer 2019, 163, 115–124. [Google Scholar] [CrossRef]
- Bernardo, V.; Martin-de Leon, J.; Pinto, J.; Verdejo, R.; Rodriguez-Perez, M.A. Modeling the heat transfer by conduction of nanocellular polymers with bimodal cellular structures. Polymer 2019, 160, 126–137. [Google Scholar] [CrossRef]
- Huang, A.; Peng, X.; Turng, L.-S. In-situ fibrillated polytetrafluoroethylene (PTFE) in thermoplastic polyurethane (TPU) via melt blending: Effect on rheological behavior, mechanical properties, and microcellular foamability. Polymer 2018, 134, 263–274. [Google Scholar] [CrossRef]
- Su, B.; Zhou, Y.-G.; Dong, B.-B.; Yan, C. Effect of compatibility on the foaming behavior of injection molded polypropylene and Polycarbonate Blend Parts. Polymers 2019, 11, 300. [Google Scholar] [CrossRef] [PubMed]
- Wong, A.; Guo, H.; Kumar, V.; Park, C.B.; Suh, N.P. Microcellular plastics. Encycl. Polym. Sci. Technol. 2016. [Google Scholar] [CrossRef]
- Premalal, H.G.B.; Ismail, H.; Baharin, A. Comparison of the mechanical properties of rice husk powder filled polypropylene composites with talc filled polypropylene composites. Polym. Test. 2002, 21, 833–839. [Google Scholar] [CrossRef]
- Yu, G.; Zhang, M.Q.; Zeng, H.M. Carbon-black-filled polyolefine as a positive temperature coefficient material: Effect of composition, processing, and filler treatment. J. Appl. Polym. Sci. 1998, 70, 559–566. [Google Scholar] [CrossRef]
- Velasco, J.I.; De Saja, J.A.; Martínez, A.B. Crystallization behavior of polypropylene filled with surface-modified talc. J. Appl. Polym. Sci. 1996, 61, 125–132. [Google Scholar] [CrossRef]
- Xin, Z.X.; Zhang, Z.X.; Pal, K.; Byeon, J.U.; Lee, S.H.; Kim, J.K. Study of microcellular injection-molded polypropylene/waste ground rubber tire powder blend. Mater. Des. 2010, 31, 589–593. [Google Scholar] [CrossRef]
- Wilson, P.; Vijayan, S.; Prabhakaran, K. Low-density microcellular carbon foams from sucrose by NaCl particle templating using glycerol as a plasticizing additive. Mater. Des. 2018, 139, 25–35. [Google Scholar] [CrossRef]
- Bai, J.; Liao, X.; Huang, E.; Luo, Y.; Yang, Q.; Li, G. Control of the cell structure of microcellular silicone rubber/nanographite foam for enhanced mechanical performance. Mater. Des. 2017, 133, 288–298. [Google Scholar] [CrossRef]
- Müller, N.; Ehrenstein, G.W. Constancy of properties resulting from foam injection-molding techniques. In Proceedings of the SPE ANTEC, Boston, MA, USA, 10 November 2005; p. 593. [Google Scholar]
- Doroudiani, S.; Park, C.B.; Kortschot, M.T. Processing and characterization of microcellular foamed high-density polythylene/isotactic polypropylene blends. Polym. Eng. Sci. 1998, 38, 1205–1215. [Google Scholar] [CrossRef]
- Rachtanapun, P.; Selke, S.E.M.; Matuana, L.M. Effect of the high-density polyethylene melt index on the microcellular foaming of high-density polyethylene/polypropylene blends. J. Appl. Polym. Sci. 2004, 93, 364–371. [Google Scholar] [CrossRef]
- Wang, X.; Pan, Y.; Qin, Y.; Voigt, M.; Liu, X.; Zheng, G.; Chen, Q.; Schubert, D.W.; Liu, C.; Shen, C. Creep and recovery behavior of injection-molded isotactic polypropylene with controllable skin-core structure. Polym. Test. 2018, 69, 478–484. [Google Scholar] [CrossRef]
- Yuan, H.; Pan, Y.; Liu, X. Large-scale formation of shish-kebab in water-assisted injection-moulded high-density polyethylene with a high-molecular weight. Bull. Mater. Sci. 2019, 42, 40. [Google Scholar] [CrossRef]
- Hou, J.; Zhao, G.; Wang, G.; Dong, G.; Xu, J. A novel gas-assisted microcellular injection molding method for preparing lightweight foams with superior surface appearance and enhanced mechanical performance. Mater. Des. 2017, 127, 115–125. [Google Scholar] [CrossRef]
- Zhao, J.; Wang, G.; Zhang, L.; Li, B.; Wang, C.; Zhao, G.; Park, C.B. Lightweight and strong fibrillary PTFE reinforced polypropylene composite foams fabricated by foam injection molding. Eur. Polym. J. 2019, 119, 22–31. [Google Scholar] [CrossRef]
- Liu, X.; Lian, M.; Pan, Y.; Wang, X.; Zheng, G.; Liu, C.; Schubert, D.W.; Shen, C. An Alternating Skin–Core Structure in Melt Multi-Injection-Molded Polyethylene. Macromol. Mater. Eng. 2018, 303, 1700465. [Google Scholar] [CrossRef]
- Wang, G.; Zhao, G.; Zhang, L.; Mu, Y.; Park, C.B. Lightweight and tough nanocellular PP/PTFE nanocomposite foams with defect-free surfaces obtained using in situ nanofibrillation and nanocellular injection molding. Chem. Eng. J. 2018, 350, 1–11. [Google Scholar] [CrossRef]
- Wang, G.; Zhao, G.; Dong, G.; Mu, Y.; Park, C.B. Lightweight and strong microcellular injection molded PP/talc nanocomposite. Compos. Sci. Technol. 2018, 168, 38–46. [Google Scholar] [CrossRef]
- Bryce, D.M. Plastic Injection Molding: Material Selection and Product Design Fundamentals; Society of Manufacturing Engineers: Dearborn, MI, USA, 1997; Volume 2, p. 354. [Google Scholar]
- Naguib, H.E.; Park, C.B.; Panzer, U.; Reichelt, N. Strategies for achieving ultra low-density polypropylene foams. Polym. Eng. Sci. 2002, 42, 1481–1492. [Google Scholar] [CrossRef]
- Wu, H.; Krampe, E.; Schlicht, H.; Wintermantel, E. Application of a microcellular injection molding process (MuCell®) to produce an implant with porous structure. In Proceedings of the World Congress on Medical Physics and Biomedical Engineering, Munich, Gemany, 7–12 September 2009; pp. 61–64. [Google Scholar]
- Harper, C.A.; Petrie, E.M. Plastics Materials and Processes: A Concise Encyclopedia; John Wiley & Sons: Hoboken, NJ, USA, 2003; p. 59. [Google Scholar] [CrossRef]
- Trexel. TecoCell®-CFA. Available online: http://www.trexel.com/en/tecocell-cfa (accessed on 9 June 2019).
- Xu, J.; Kishbaugh, L. Simple modeling of the mechanical properties with part weight reduction for microcellular foam plastic. J. Cell. Plast. 2003, 39, 29–47. [Google Scholar] [CrossRef]
- Nečas, D.; Klapetek, P. Gwyddion: An open-source software for SPM data analysis. Open Phys. 2012, 10, 181–188. [Google Scholar] [CrossRef]
- Jahani, D.; Ameli, A.; Jung, P.U.; Barzegari, M.R.; Park, C.B.; Naguib, H. Open-cell cavity-integrated injection-molded acoustic polypropylene foams. Mater. Des. 2014, 53, 20–28. [Google Scholar] [CrossRef]
- Ding, J.; Ma, W.; Song, F.; Zhong, Q. Effect of nano-Calcium Carbonate on microcellular foaming of polypropylene. J. Mater. Sci. 2013, 48, 2504–2511. [Google Scholar] [CrossRef]
- Ding, J.; Shangguan, J.; Ma, W.; Zhong, Q. Foaming behavior of microcellular foam polypropylene/modified nano calcium carbonate composites. J. Appl. Polym. Sci. 2013, 128, 3639–3651. [Google Scholar] [CrossRef]
- Huang, H.-X.; Wang, J.-K. Improving polypropylene microcellular foaming through blending and the addition of nano-calcium carbonate. J. Appl. Polym. Sci. 2007, 106, 505–513. [Google Scholar] [CrossRef]


| Experimental Number | CBA (%) | SCF (grams) | Shot Volume (cm³) | Weight (grams) | Weight Reduction cf. Experiment No. 0 (%) |
|---|---|---|---|---|---|
| 0 | 0 | 0.000 | 40.1 | 23.1 ± 0.03 | 0.00 |
| 1 | 1 | 0.000 | 28.3 | 21.3 ± 0.07 | 7.5 ± 0.42 |
| 2 | 2 | 0.000 | 27.4 | 21.1 ± 0.16 | 8.3 ± 0.81 |
| 3 | 5 | 0.000 | 26.4 | 20.4 ± 0.12 | 11.4 ± 0.64 |
| 4 | 0 | 0.134 | 26.7 | 21.2 ± 0.16 | 8.1 ± 0.81 |
| 5 | 0 | 0.144 | 26.2 | 21.1 ± 0.28 | 8.4 ± 1.34 |
| 6 | 0 | 0.173 | 23.9 | 20.4 ± 1.46 | 11.6 ± 6.45 |
| 7 | 1 | 0.075 | 25.7 | 21.2 ± 0.69 | 8.1 ± 3.12 |
| 8 | 2 | 0.075 | 25.2 | 20.9 ± 1.19 | 9.5 ± 5.29 |
| 9 | 5 | 0.075 | 24.6 | 20.4 ± 1.70 | 11.4 ± 7.50 |
| Experimental Number | CBA (%) | SCF (grams) | Shot Volume (cm³) | Weight (grams) | Weight Reduction cf. Experiment No. 0 (%) |
|---|---|---|---|---|---|
| 0 | 0 | 0.000 | 40.1 | 28.1 ± 0.03 | 0.00 |
| 1 | 1 | 0.000 | 26.4 | 25.0 ± 0.04 | 11.1 ± 0.24 |
| 2 | 2 | 0.000 | 26.3 | 24.6 ± 0.19 | 12.5 ± 0.77 |
| 3 | 5 | 0.000 | 25.0 | 23.6 ± 0.16 | 16.1 ± 0.66 |
| 4 | 0 | 0.085 | 25.2 | 25.0 ± 0.19 | 10.9 ± 0.77 |
| 5 | 0 | 0.096 | 24.3 | 24.7 ± 0.33 | 12.2 ± 1.27 |
| 6 | 0 | 0.118 | 23.4 | 23.7 ± 0.87 | 15.7 ± 3.19 |
| 7 | 1 | 0.076 | 26.0 | 24.9 ± 1.41 | 11.4 ± 5.12 |
| 8 | 2 | 0.076 | 25.3 | 24.5 ± 0.97 | 12.9 ± 3.55 |
| 9 | 5 | 0.076 | 24.1 | 23.5 ± 1.52 | 16.4 ± 5.50 |
| Input Data | Unfilled PP | Talc-Filled PP |
|---|---|---|
| Barrel Temps. Profile (°C) | 200-190-190-180 | 220–210–210–190 |
| Back Pressure (MPa) | 18.5 | 14.5 |
| Mold Clamp Force (kN) | 1000 | 1000 |
| Injection Speed (mm/s) | 150 | 150 |
| Mold Temp. (°C) | 23 | 23 |
| Unfilled PP | Talc-Filled PP | |||||
|---|---|---|---|---|---|---|
| Experimental Number | Avg. Cell Diameter (µm) | Cell Density (cells/cm³) | Wall Thickness (µm) | Avg. Cell Diameter (µm) | Cell Density (cells/cm³) | Wall Thickness (µm) |
| 1 | 72.5 | 1.2 × 10⁶ | 765.4 | 166.3 | 1.6 × 10⁵ | 926.3 |
| 2 | 60.8 | 2.4 × 10⁶ | 601.8 | 135.1 | 3.1 × 10⁵ | 772.3 |
| 3 | 65.5 | 2.7 × 10⁶ | 612.8 | 78.7 | 1.5 × 10⁶ | 677.8 |
| 4 | 349.9 | 3.6 × 10³ | 393.3 | 158.9 | 1.8 × 10⁵ | 469.9 |
| 5 | 324.1 | 7.0 × 10³ | 352.5 | 138.5 | 2.5 × 10⁵ | 428.8 |
| 6 | 357.6 | 7.9 × 10³ | 302.5 | 123.8 | 4.3 × 10⁵ | 44.2 |
| 7 | 41.8 | 1.0 × 10⁷ | 431.0 | 91.5 | 7.6 × 10⁵ | 414.5 |
| 8 | 32.6 | 1.1× 10⁷ | 323.0 | 73.6 | 1.7 × 10⁶ | 91.1 |
| 9 | 33.2 | 1.1× 10⁷ | 298.8 | 54.1 | 3.6 × 10⁶ | 41.2 |
© 2019 by the authors. Licensee MDPI, Basel, Switzerland. This article is an open access article distributed under the terms and conditions of the Creative Commons Attribution (CC BY) license (http://creativecommons.org/licenses/by/4.0/).
Share and Cite
Llewelyn, G.; Rees, A.; Griffiths, C.A.; Jacobi, M. A Novel Hybrid Foaming Method for Low-Pressure Microcellular Foam Production of Unfilled and Talc-Filled Copolymer Polypropylenes. Polymers 2019, 11, 1896. https://0-doi-org.brum.beds.ac.uk/10.3390/polym11111896
Llewelyn G, Rees A, Griffiths CA, Jacobi M. A Novel Hybrid Foaming Method for Low-Pressure Microcellular Foam Production of Unfilled and Talc-Filled Copolymer Polypropylenes. Polymers. 2019; 11(11):1896. https://0-doi-org.brum.beds.ac.uk/10.3390/polym11111896
Chicago/Turabian StyleLlewelyn, Gethin, Andrew Rees, Christian A. Griffiths, and Martin Jacobi. 2019. "A Novel Hybrid Foaming Method for Low-Pressure Microcellular Foam Production of Unfilled and Talc-Filled Copolymer Polypropylenes" Polymers 11, no. 11: 1896. https://0-doi-org.brum.beds.ac.uk/10.3390/polym11111896