Investigation on the Fiber Orientation Distributions and Their Influence on the Mechanical Property of the Co-Injection Molding Products


Abstract
:
1. Introduction
2. Theoretical Background and Numerical Method
2.1. Model for Co-Injection Molding
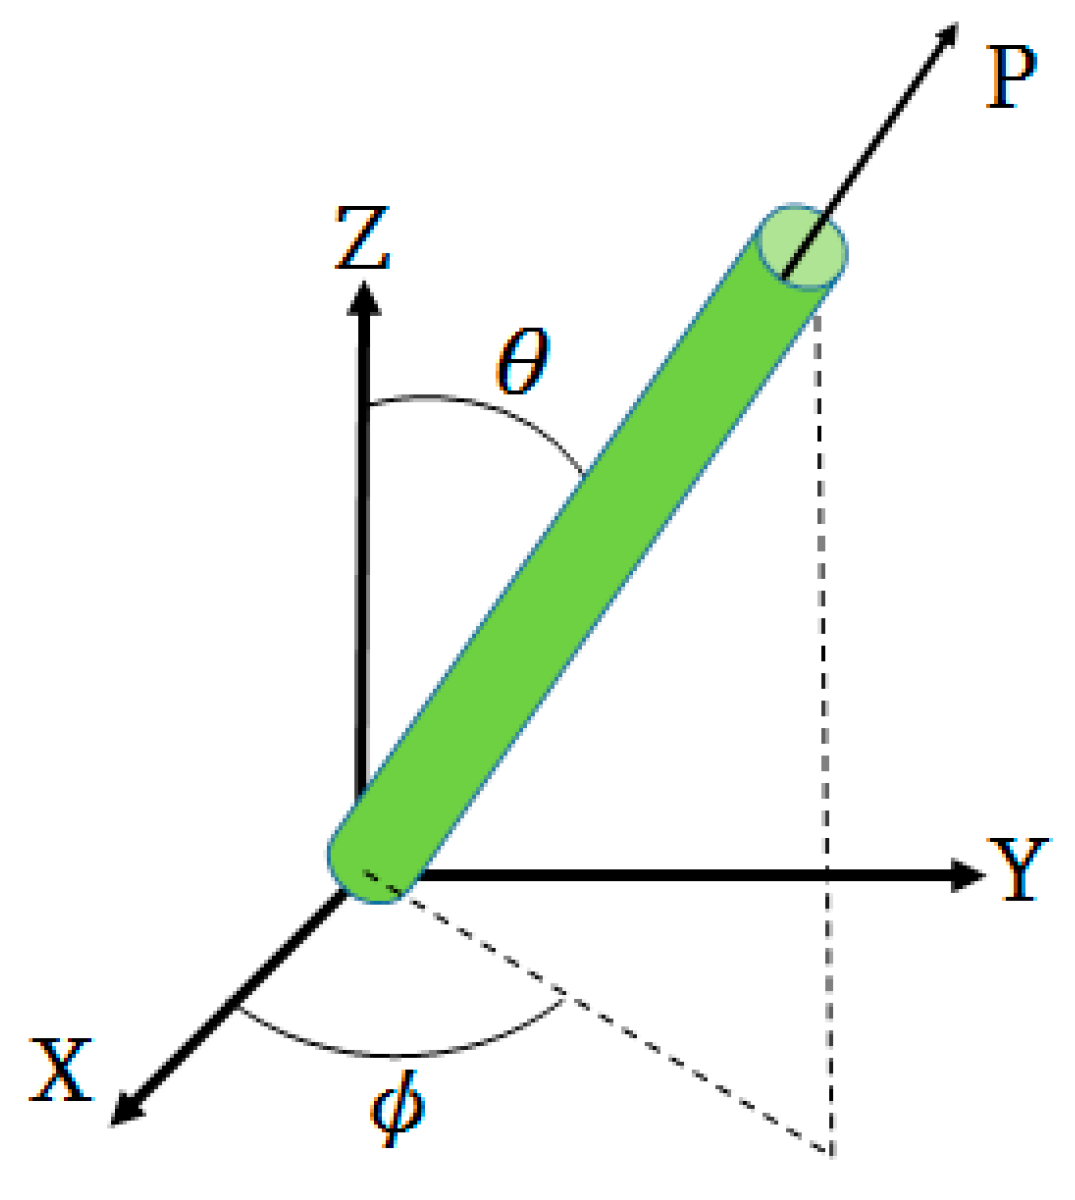
2.2. Model for Fiber Orientation Distribution
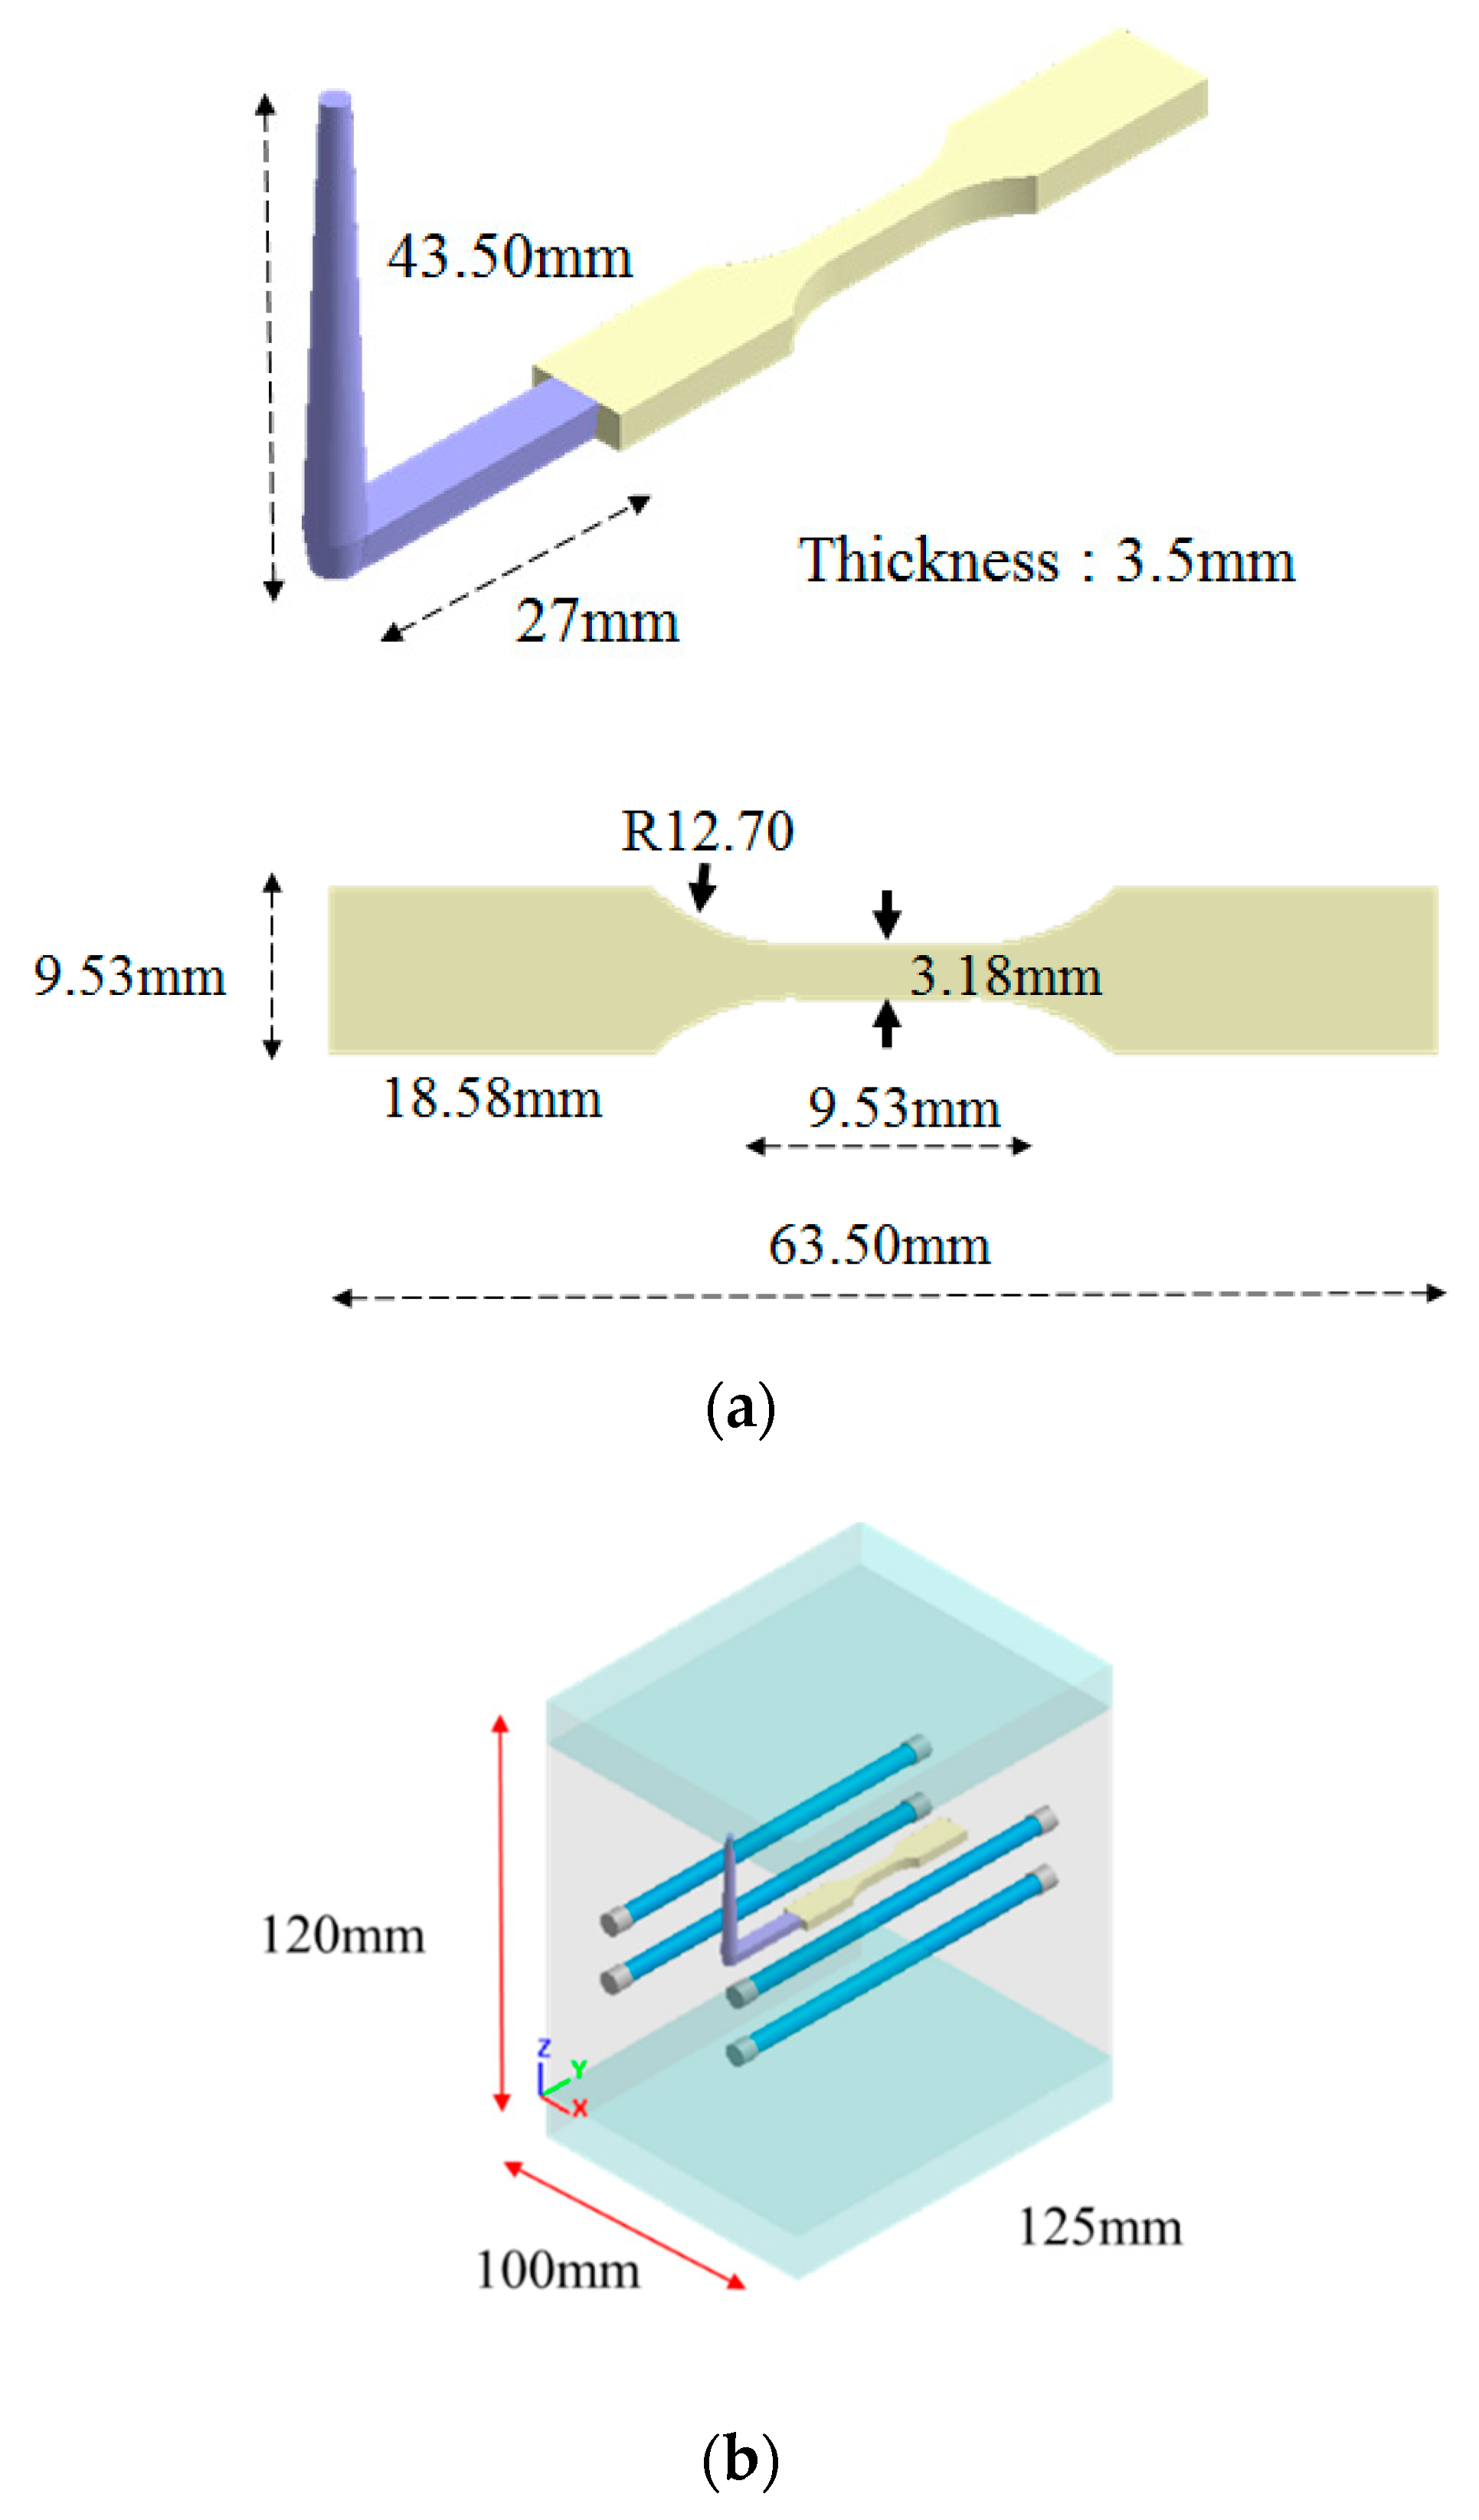
3. Geometrical Model and Related Information
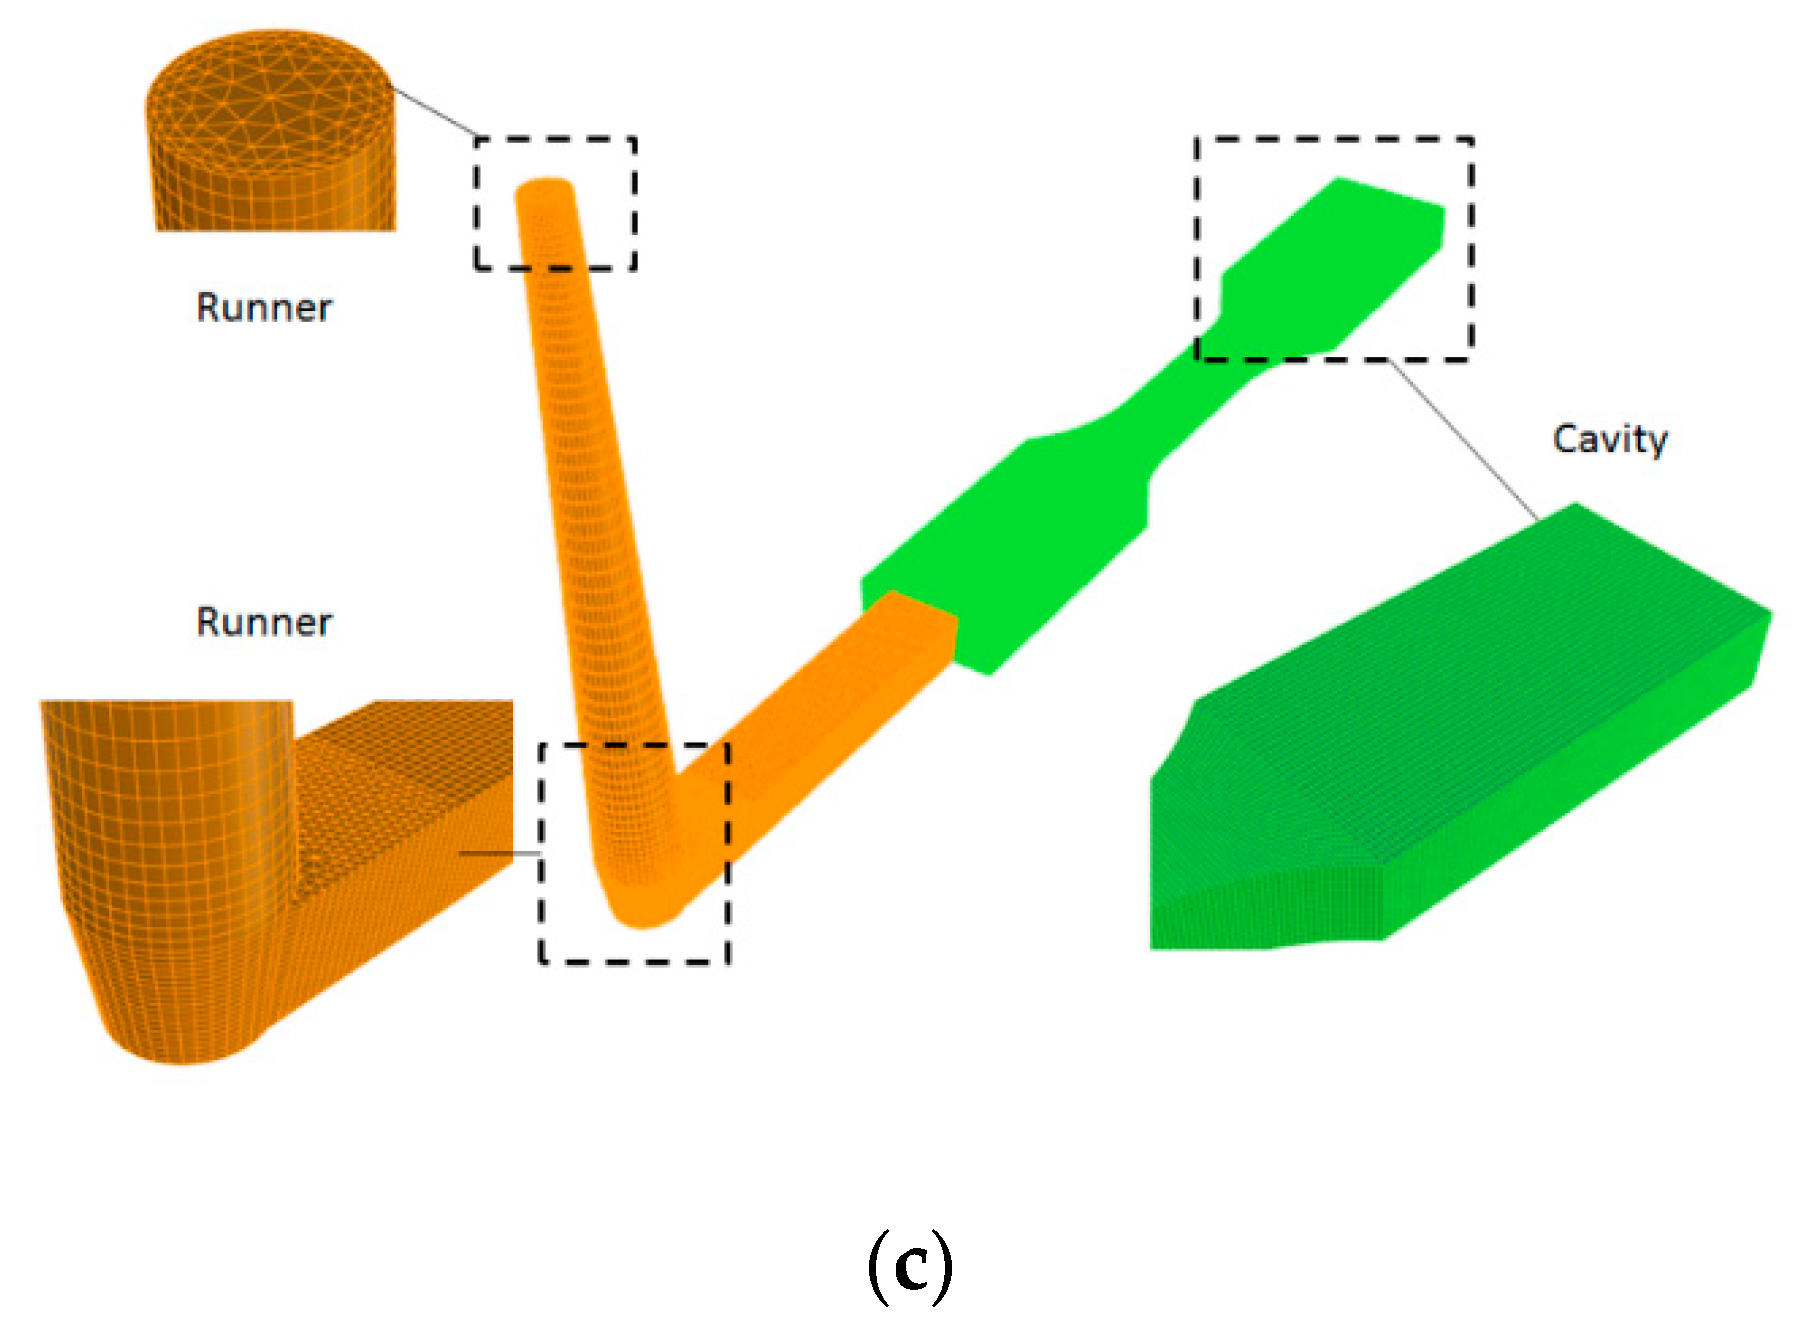
3.1. Simulation Model and Related Information
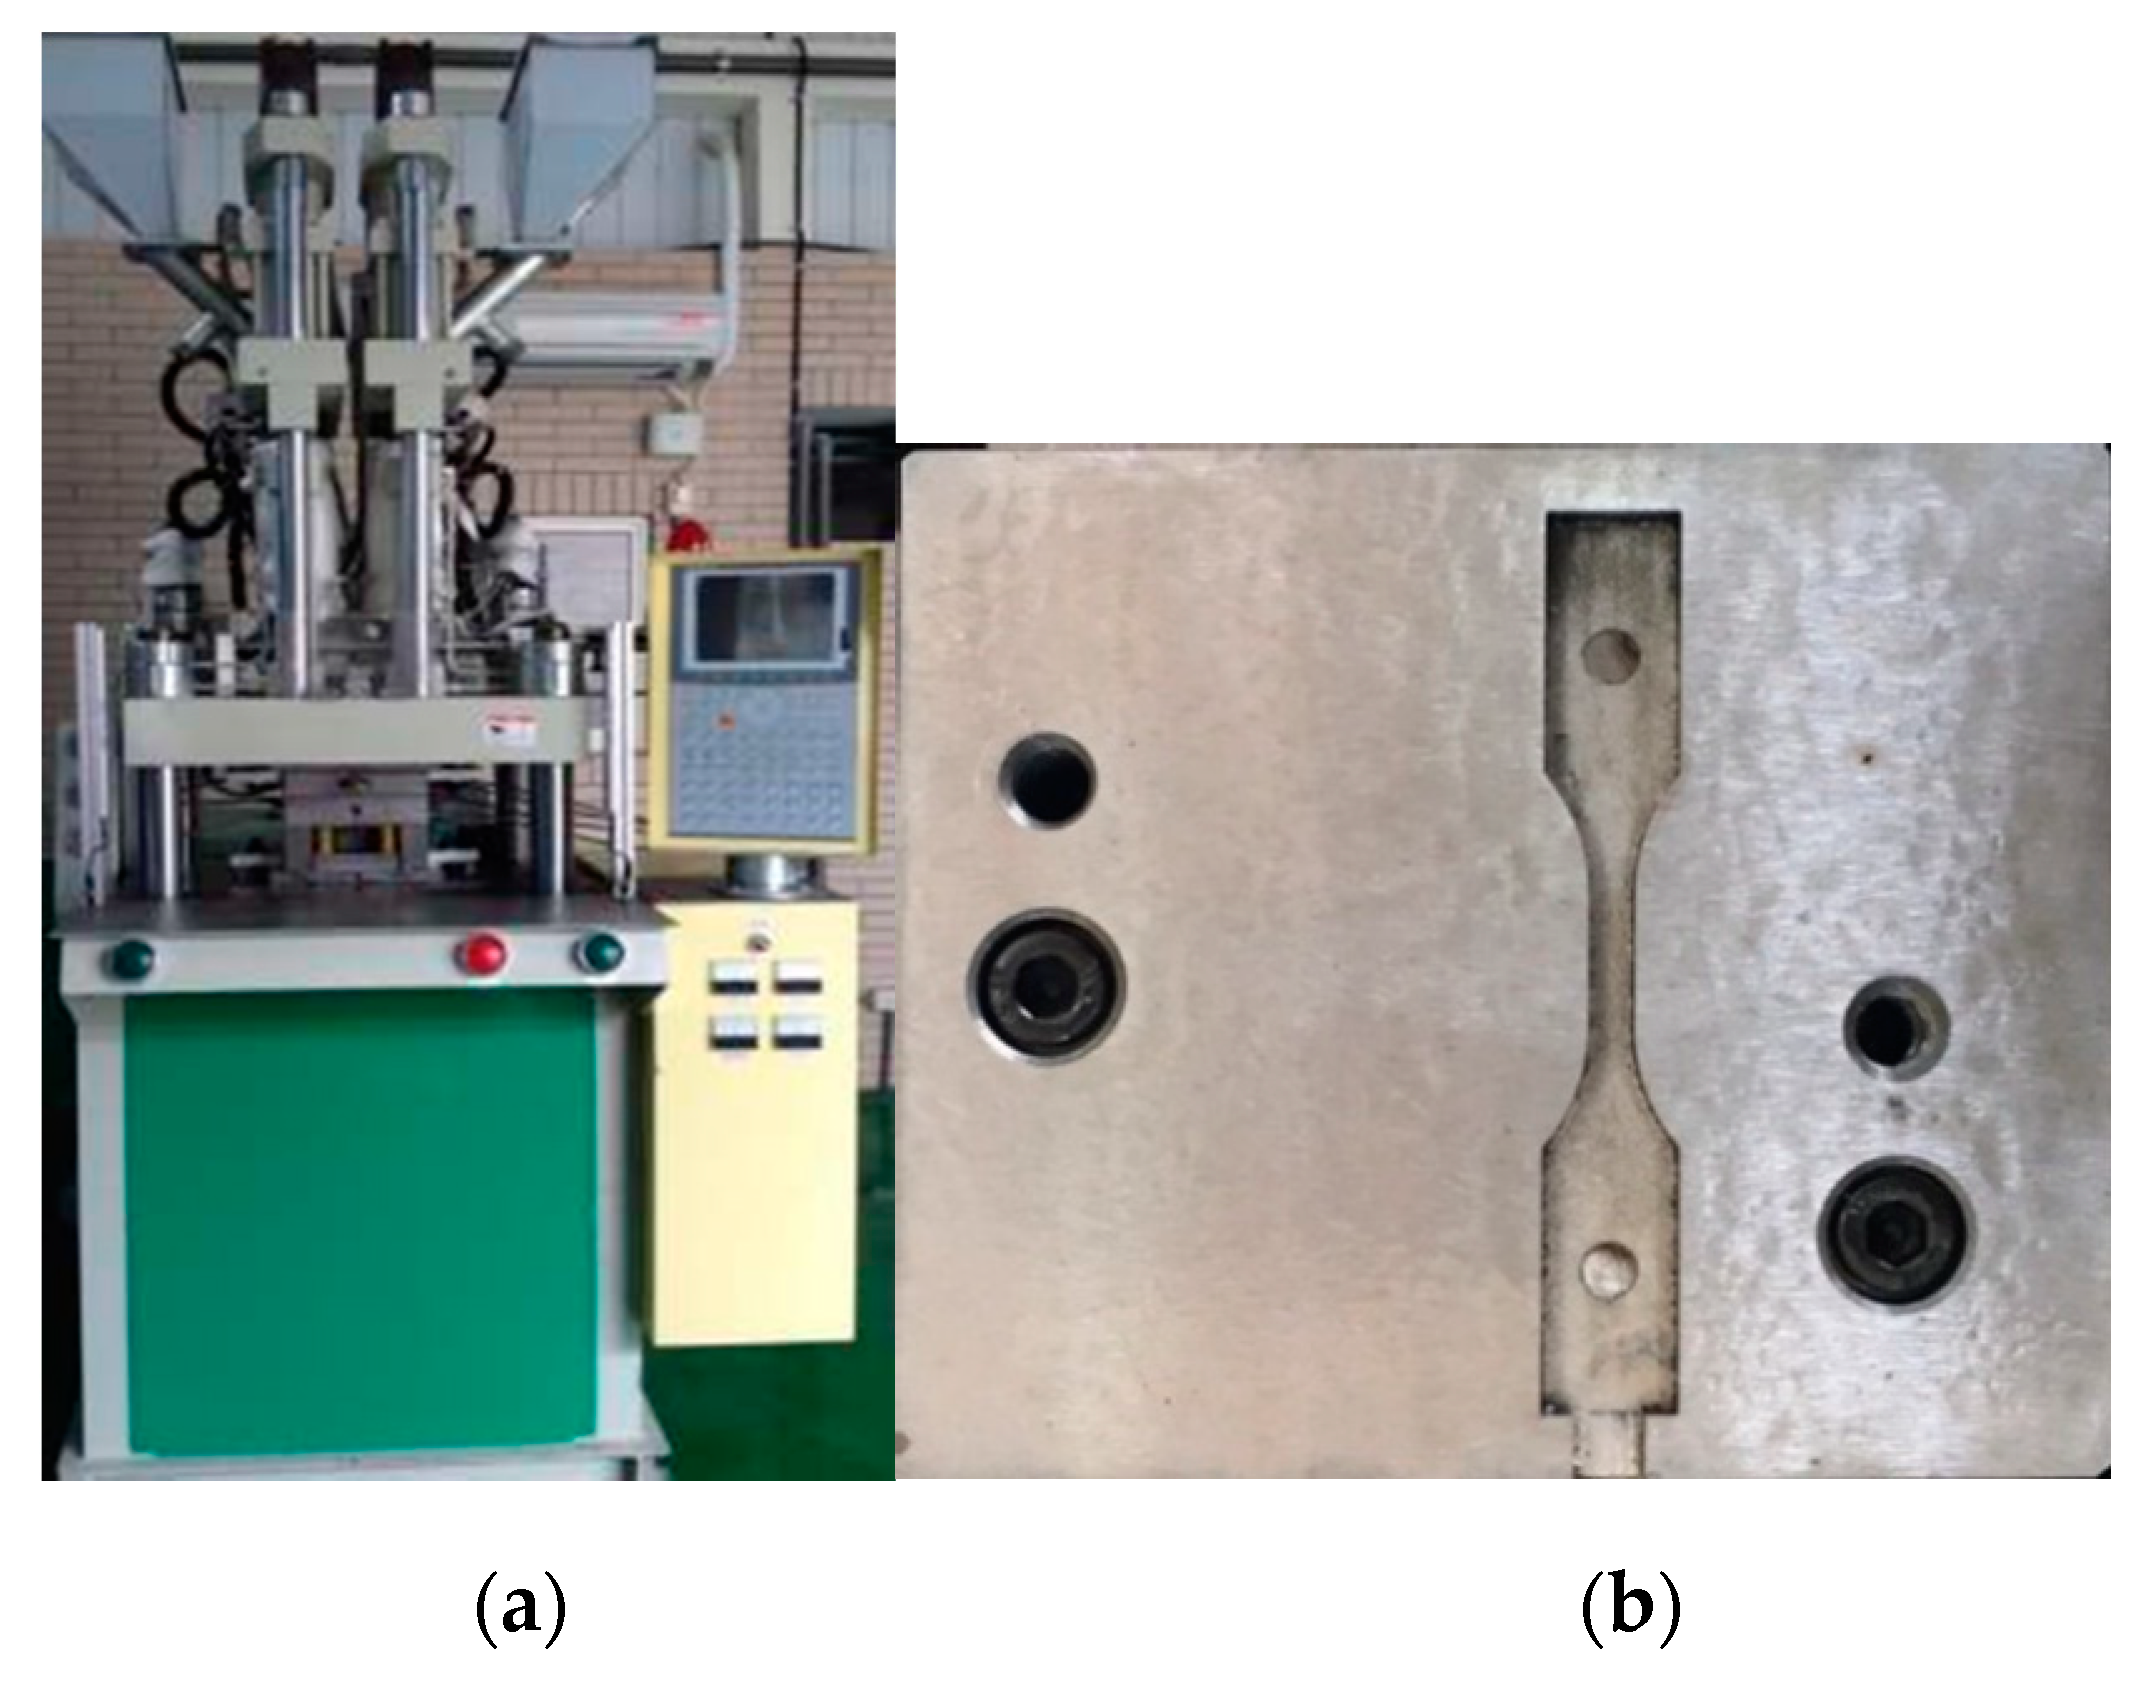
3.2. Experimental Model and Related Information
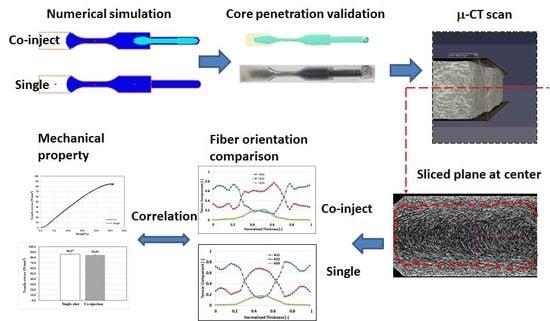
4. Results and Discussion
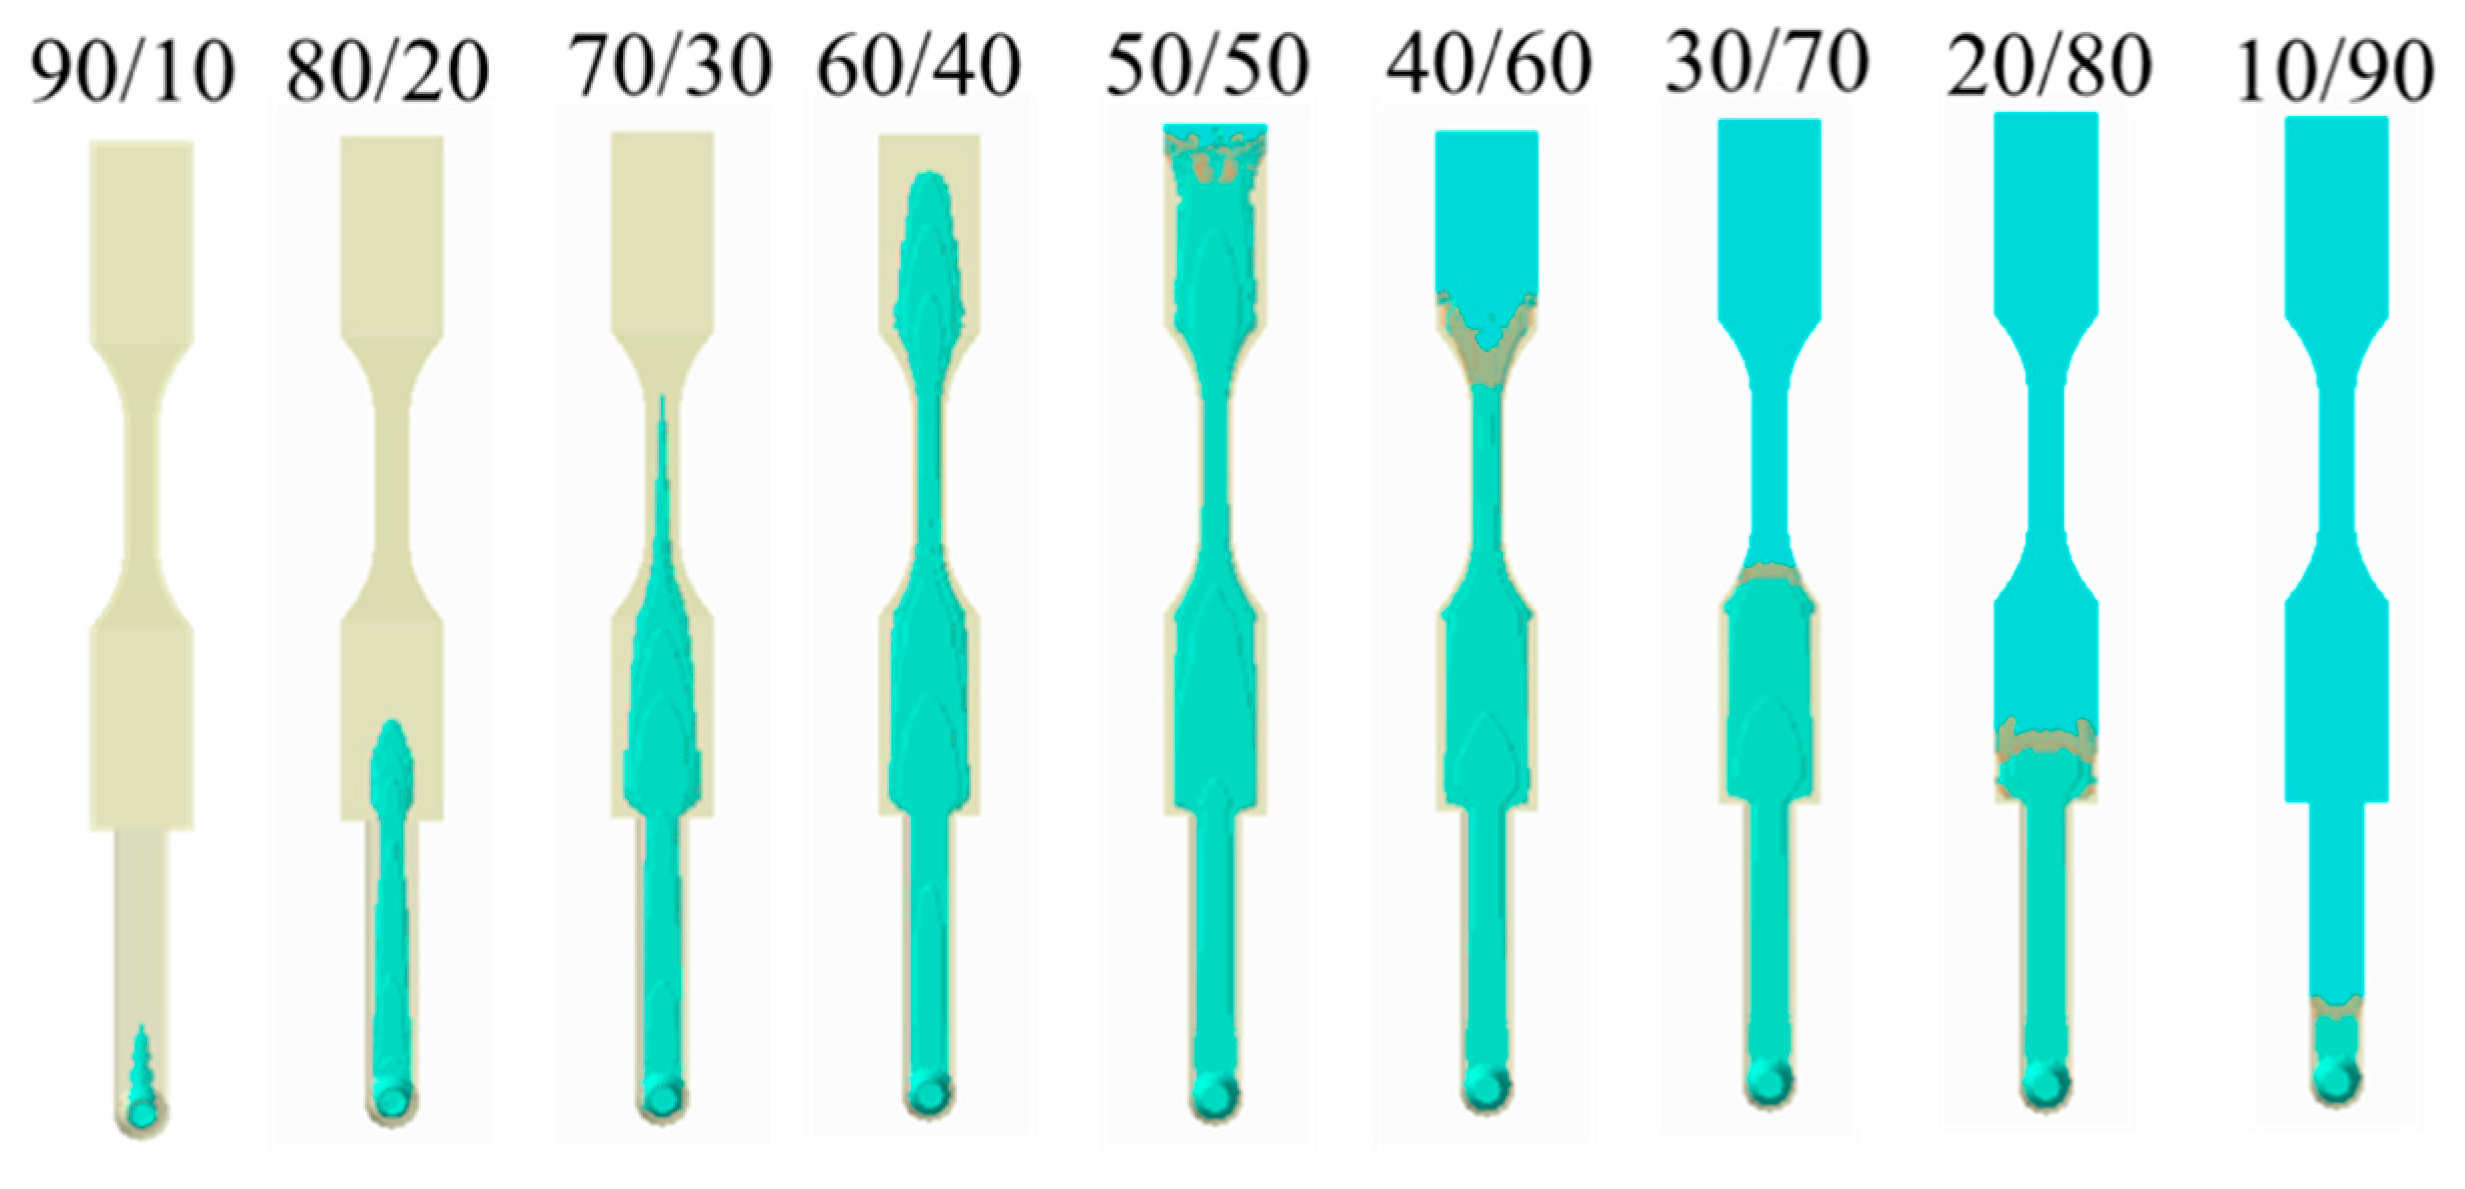
4.1. Skin/Core Ratio Effect
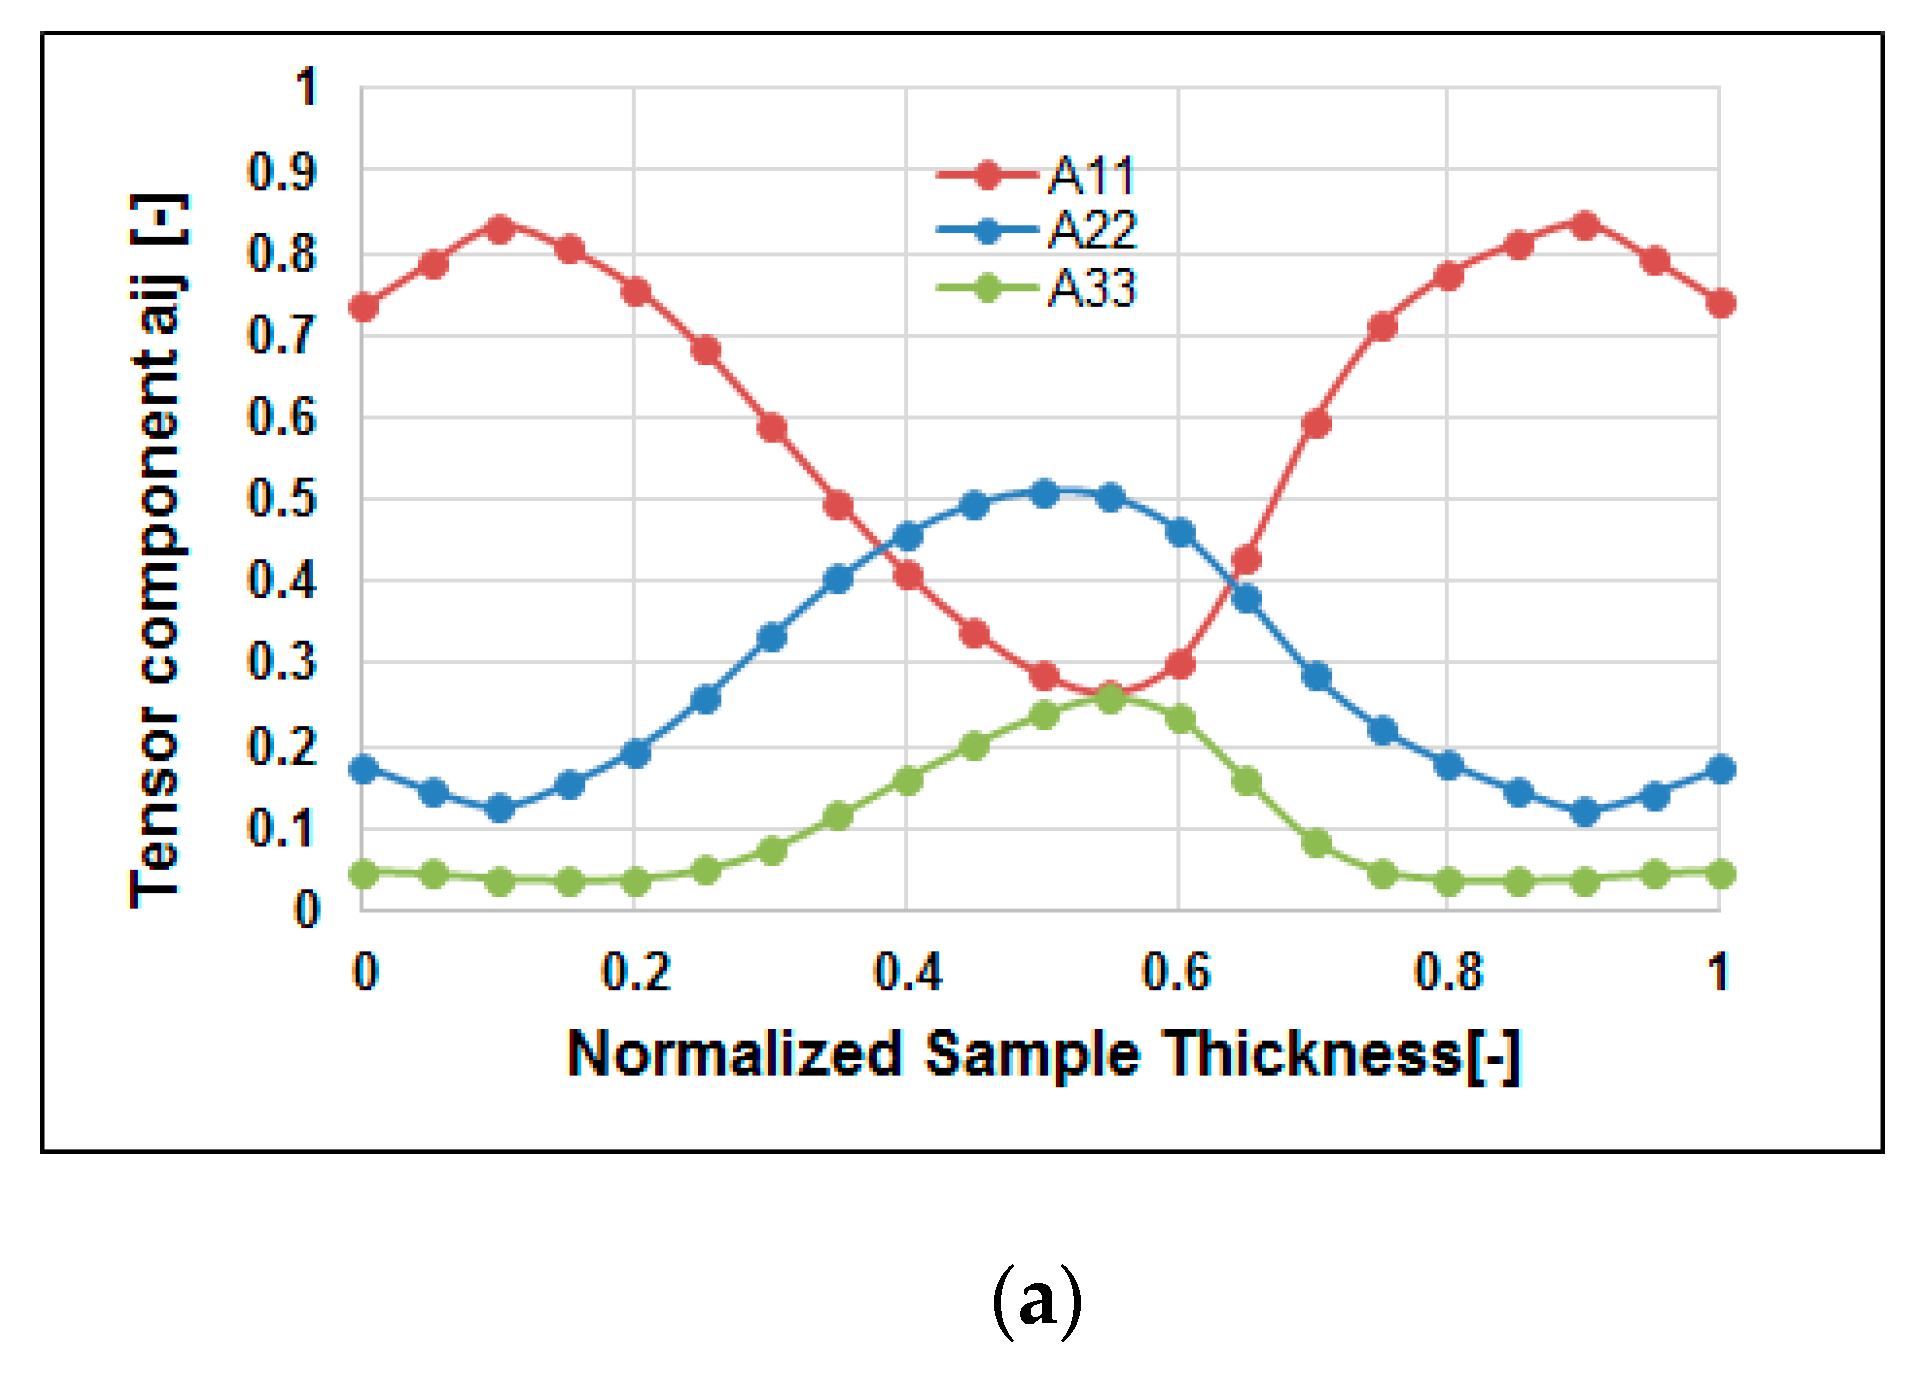
4.2. Fiber Orientation Distribution (FOD) Prediction
4.3. Experimental Investigation and Validation
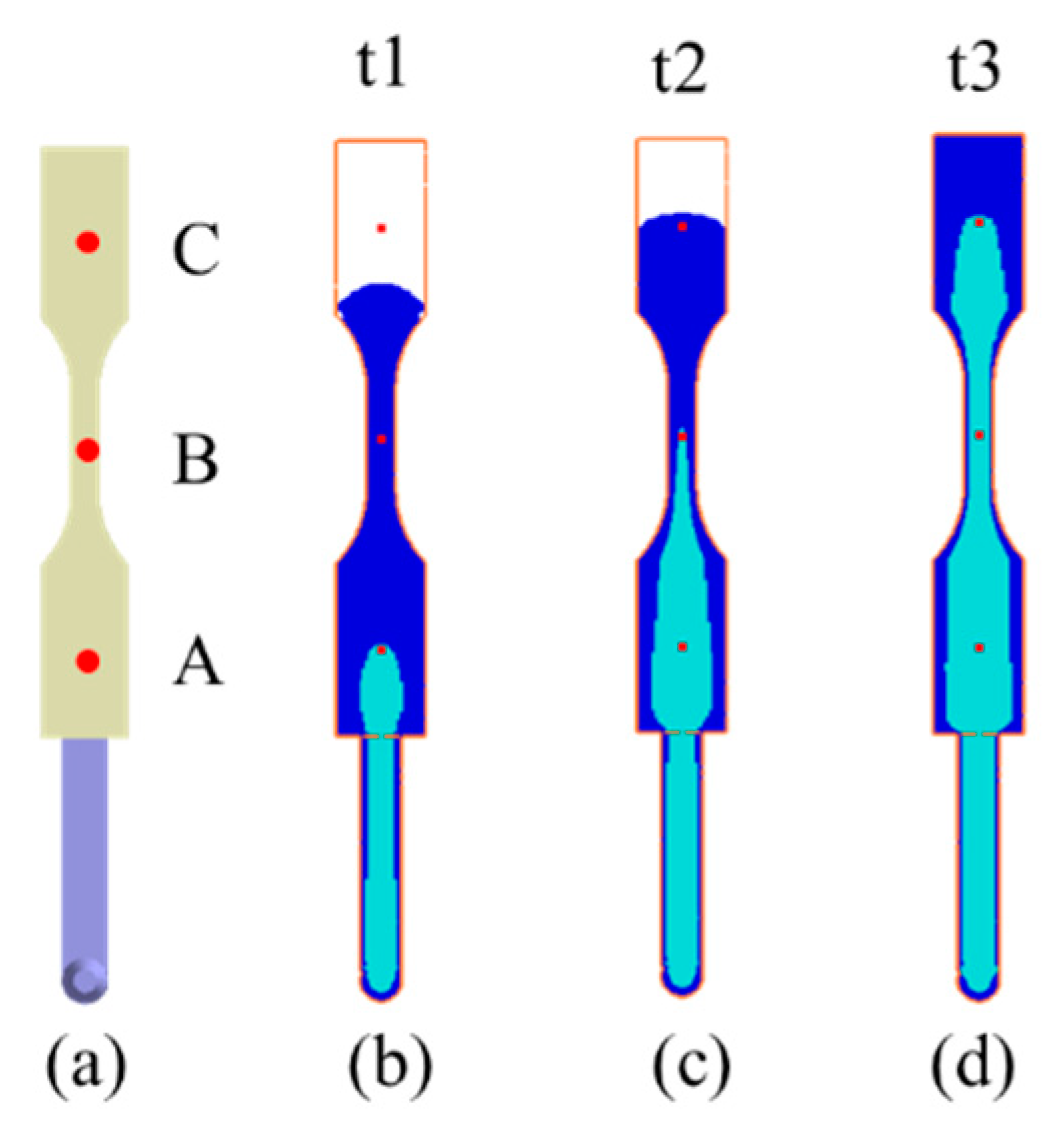
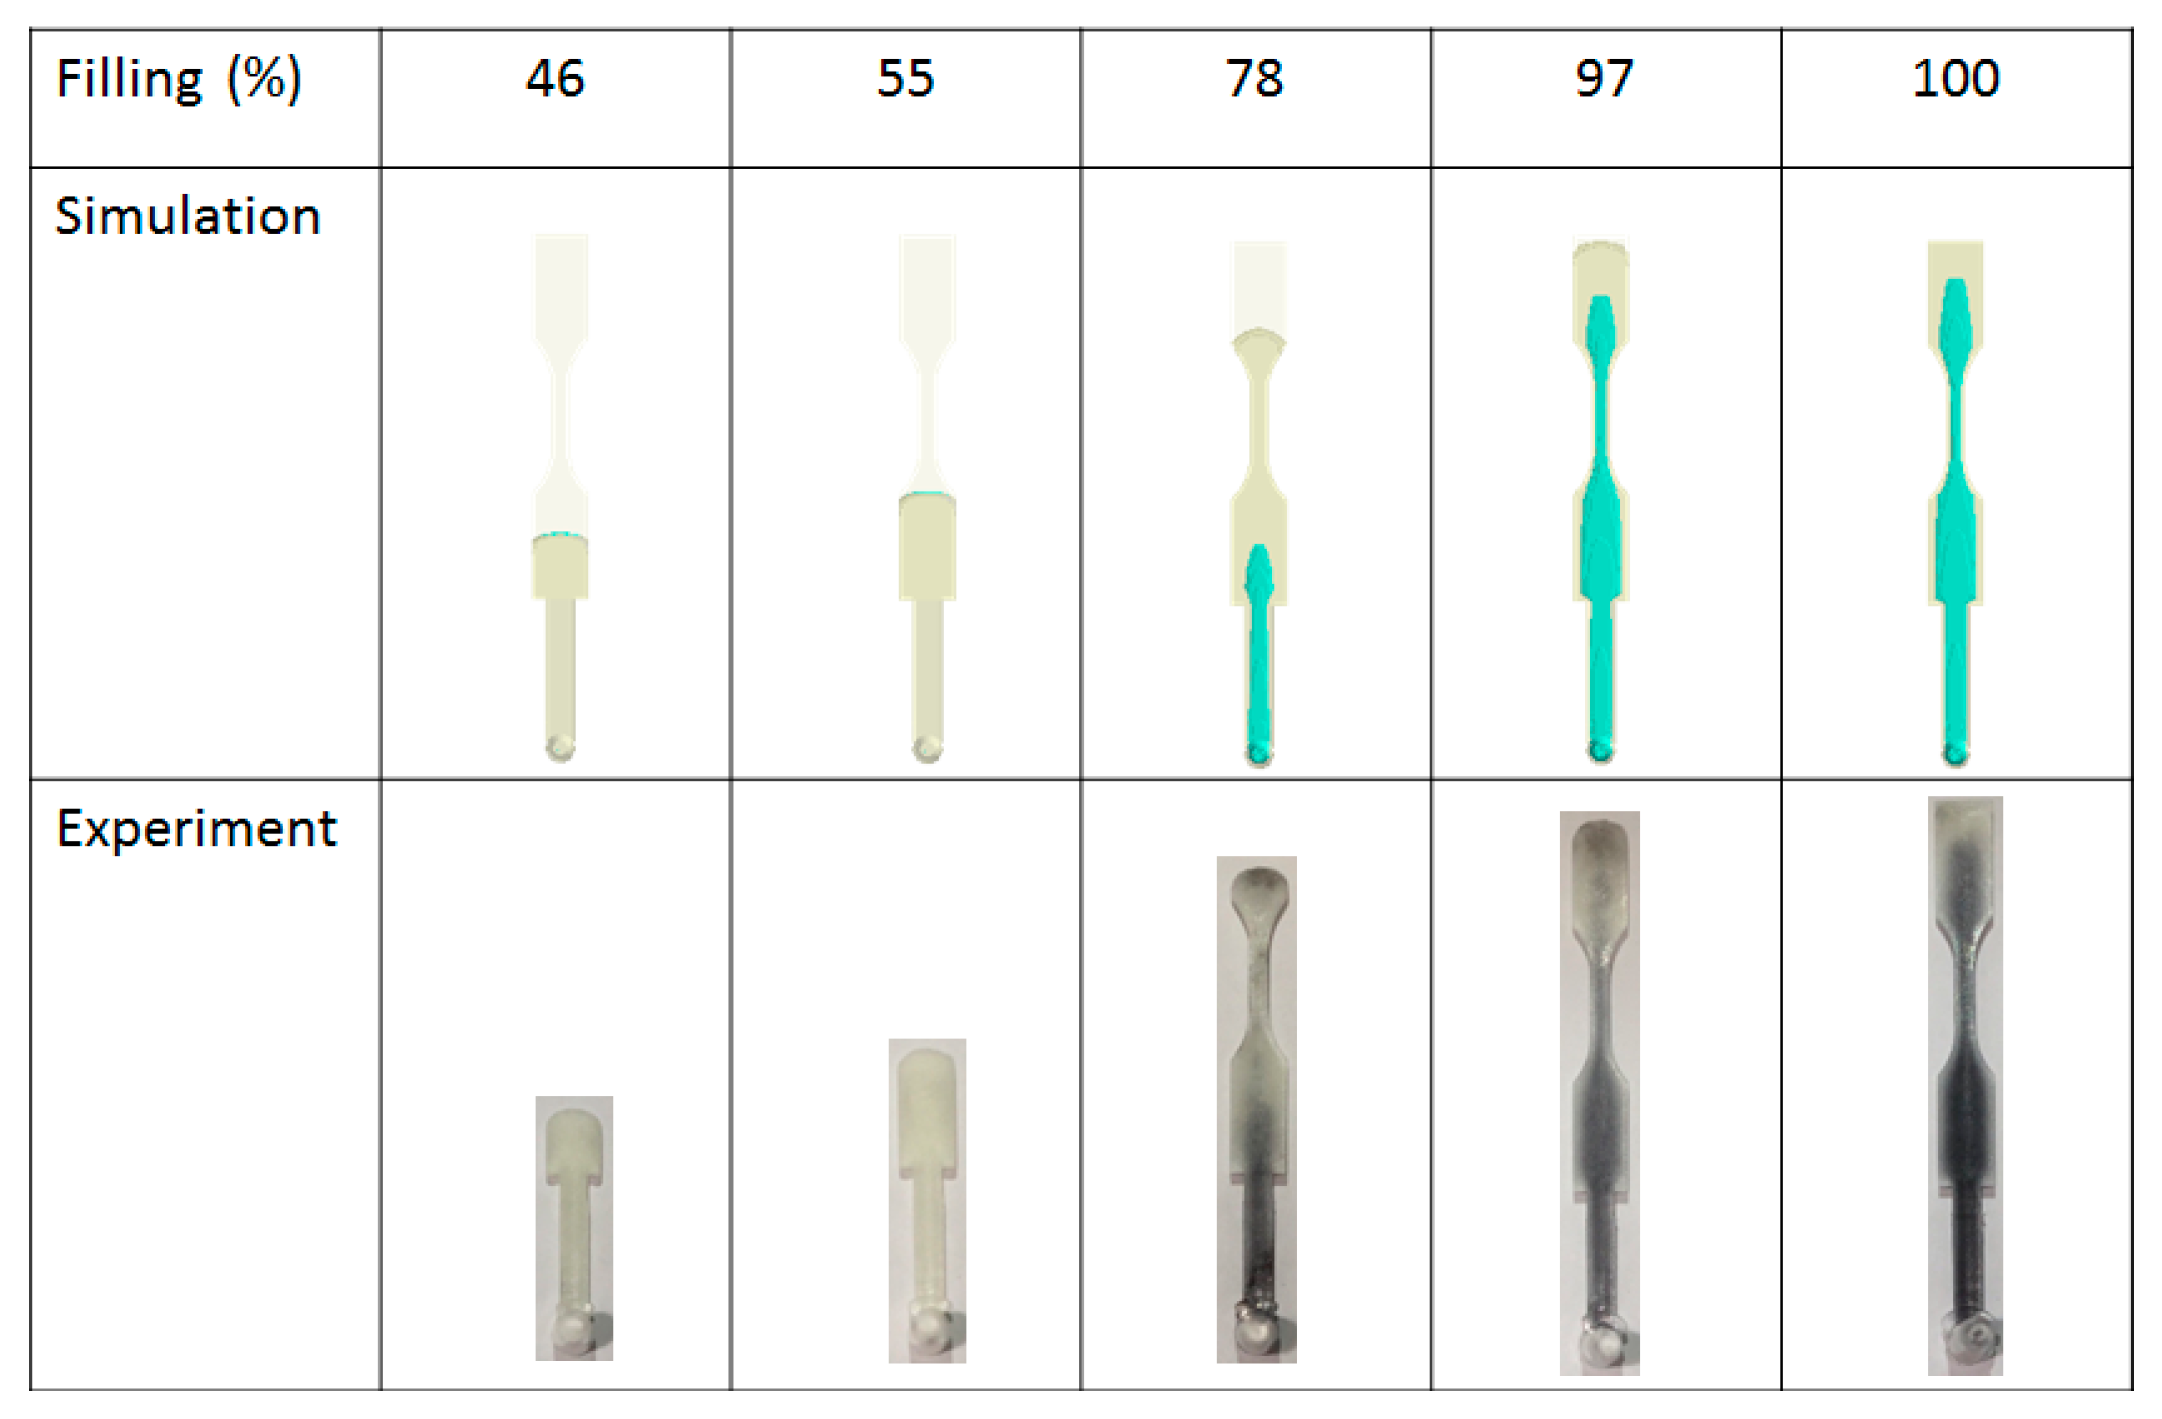
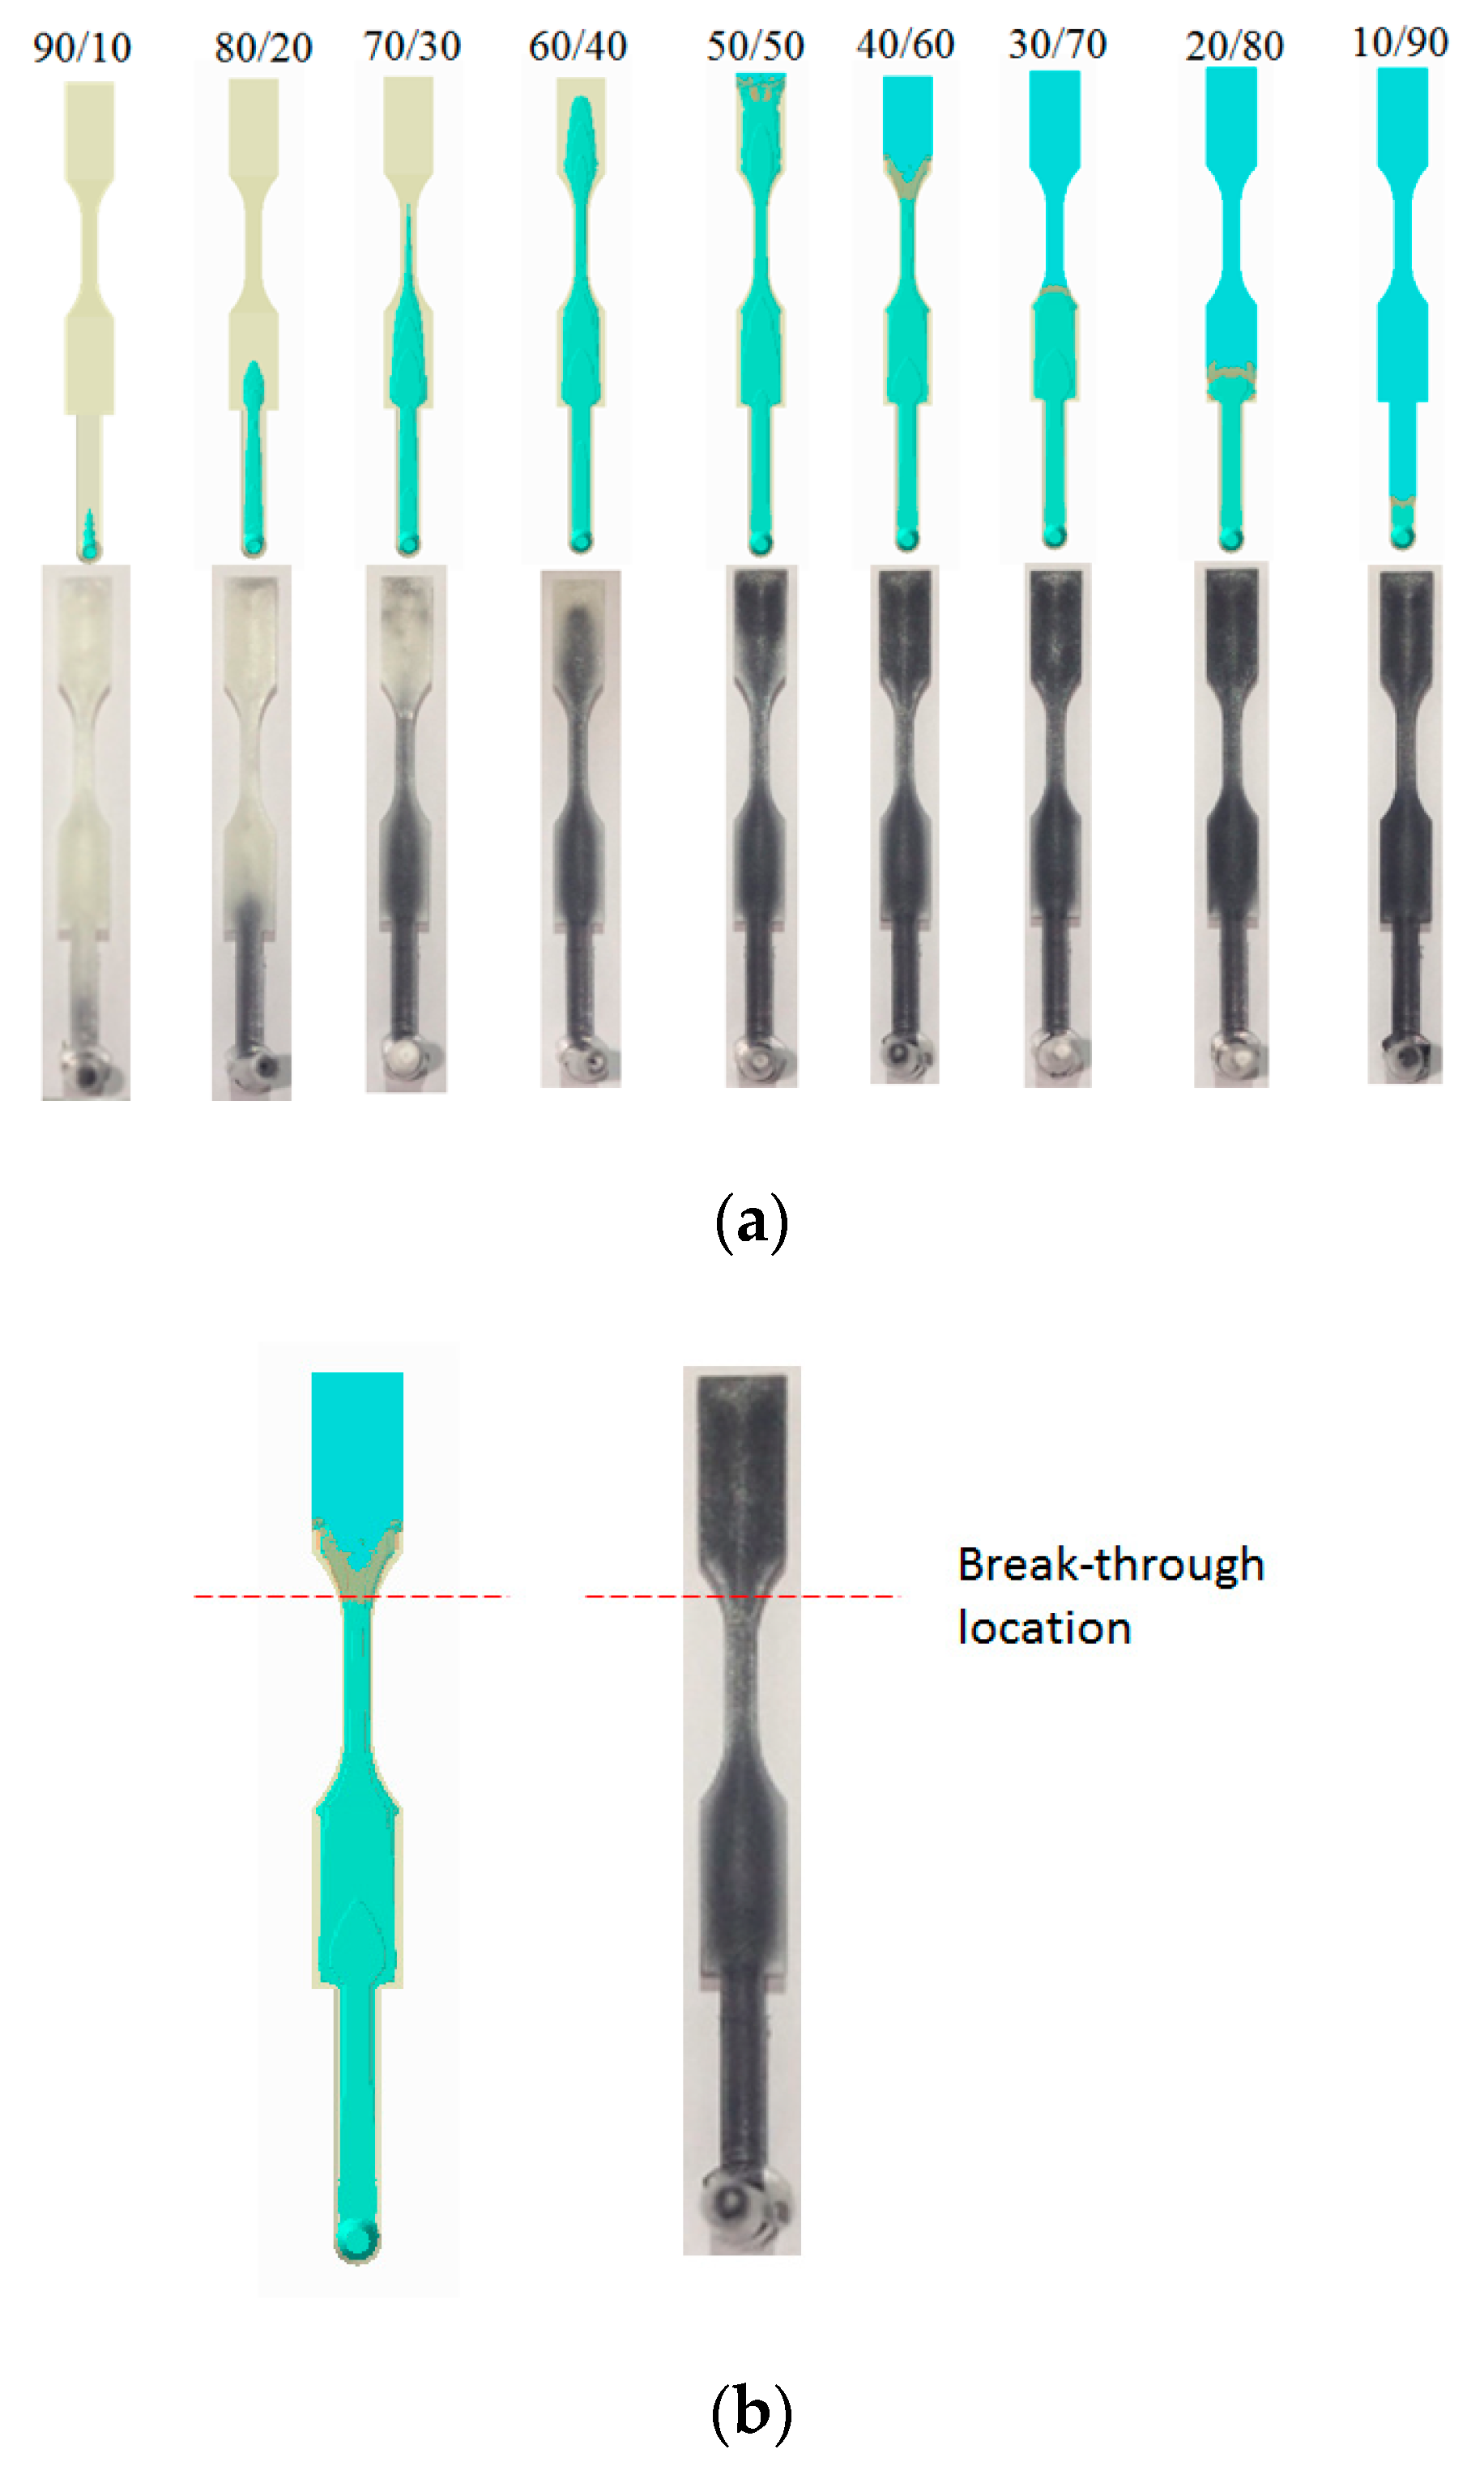
4.3.1. Short Shot Validation
4.3.2. Break-Through Study and Validation
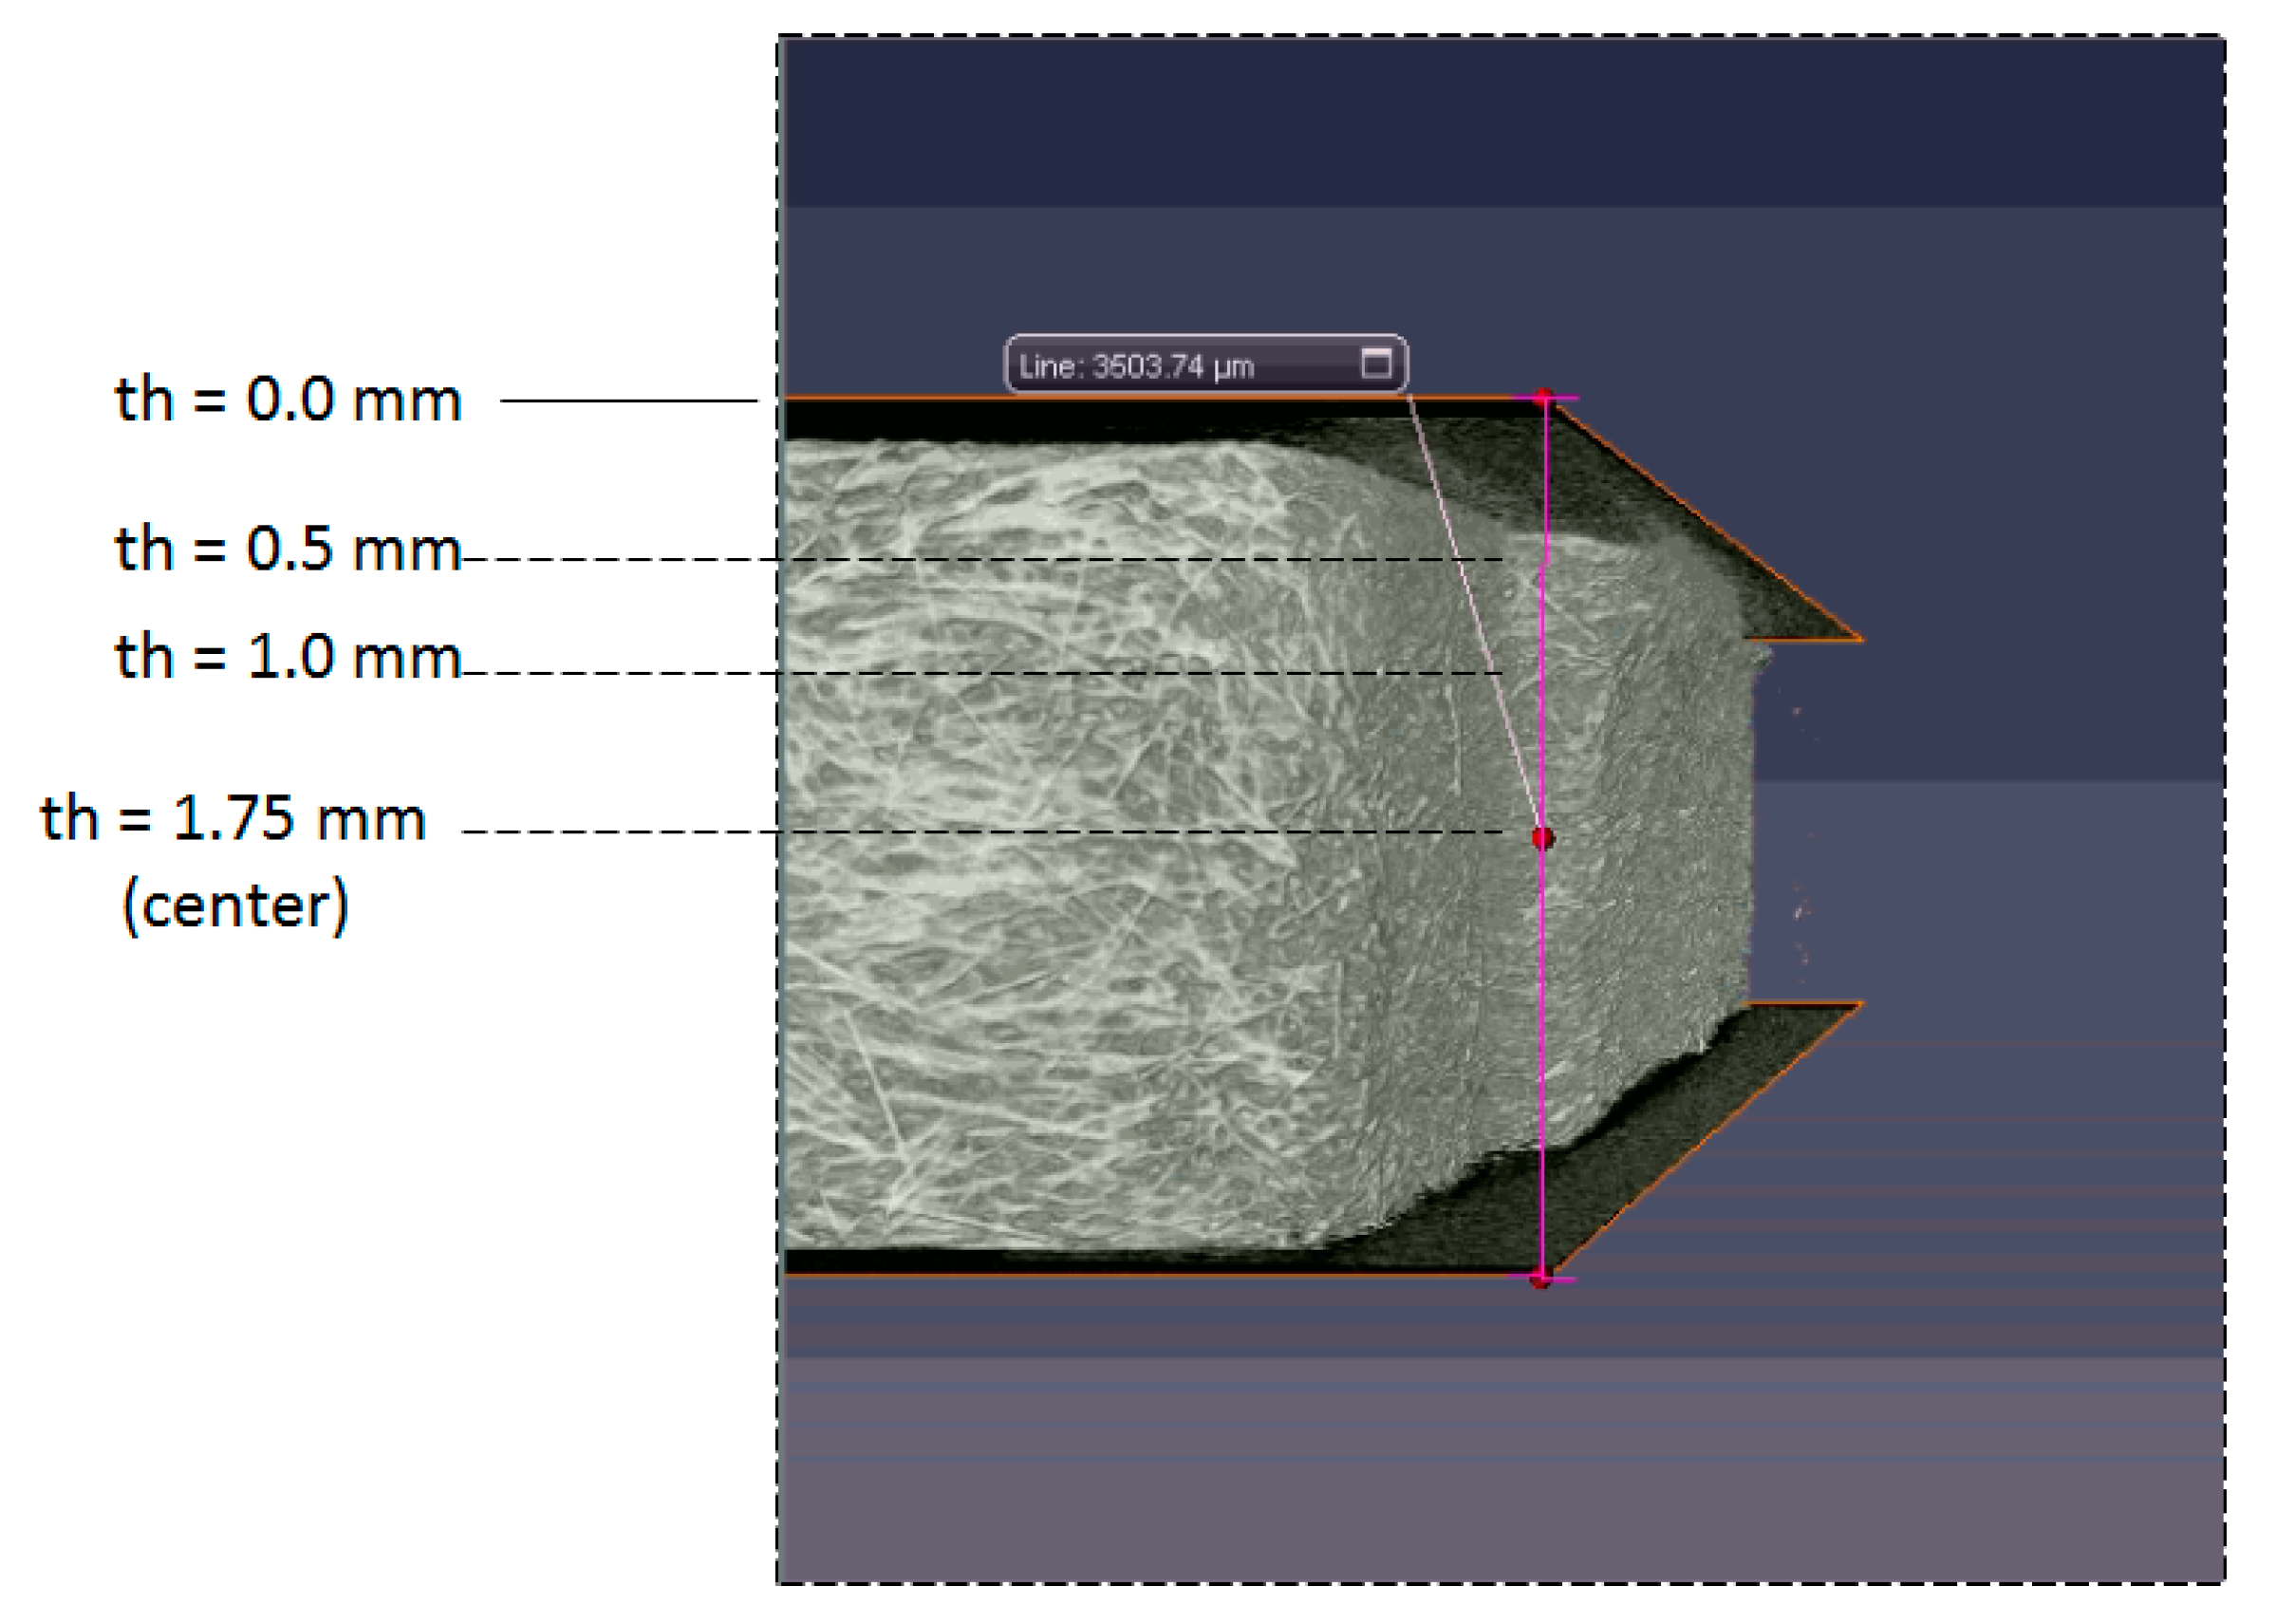
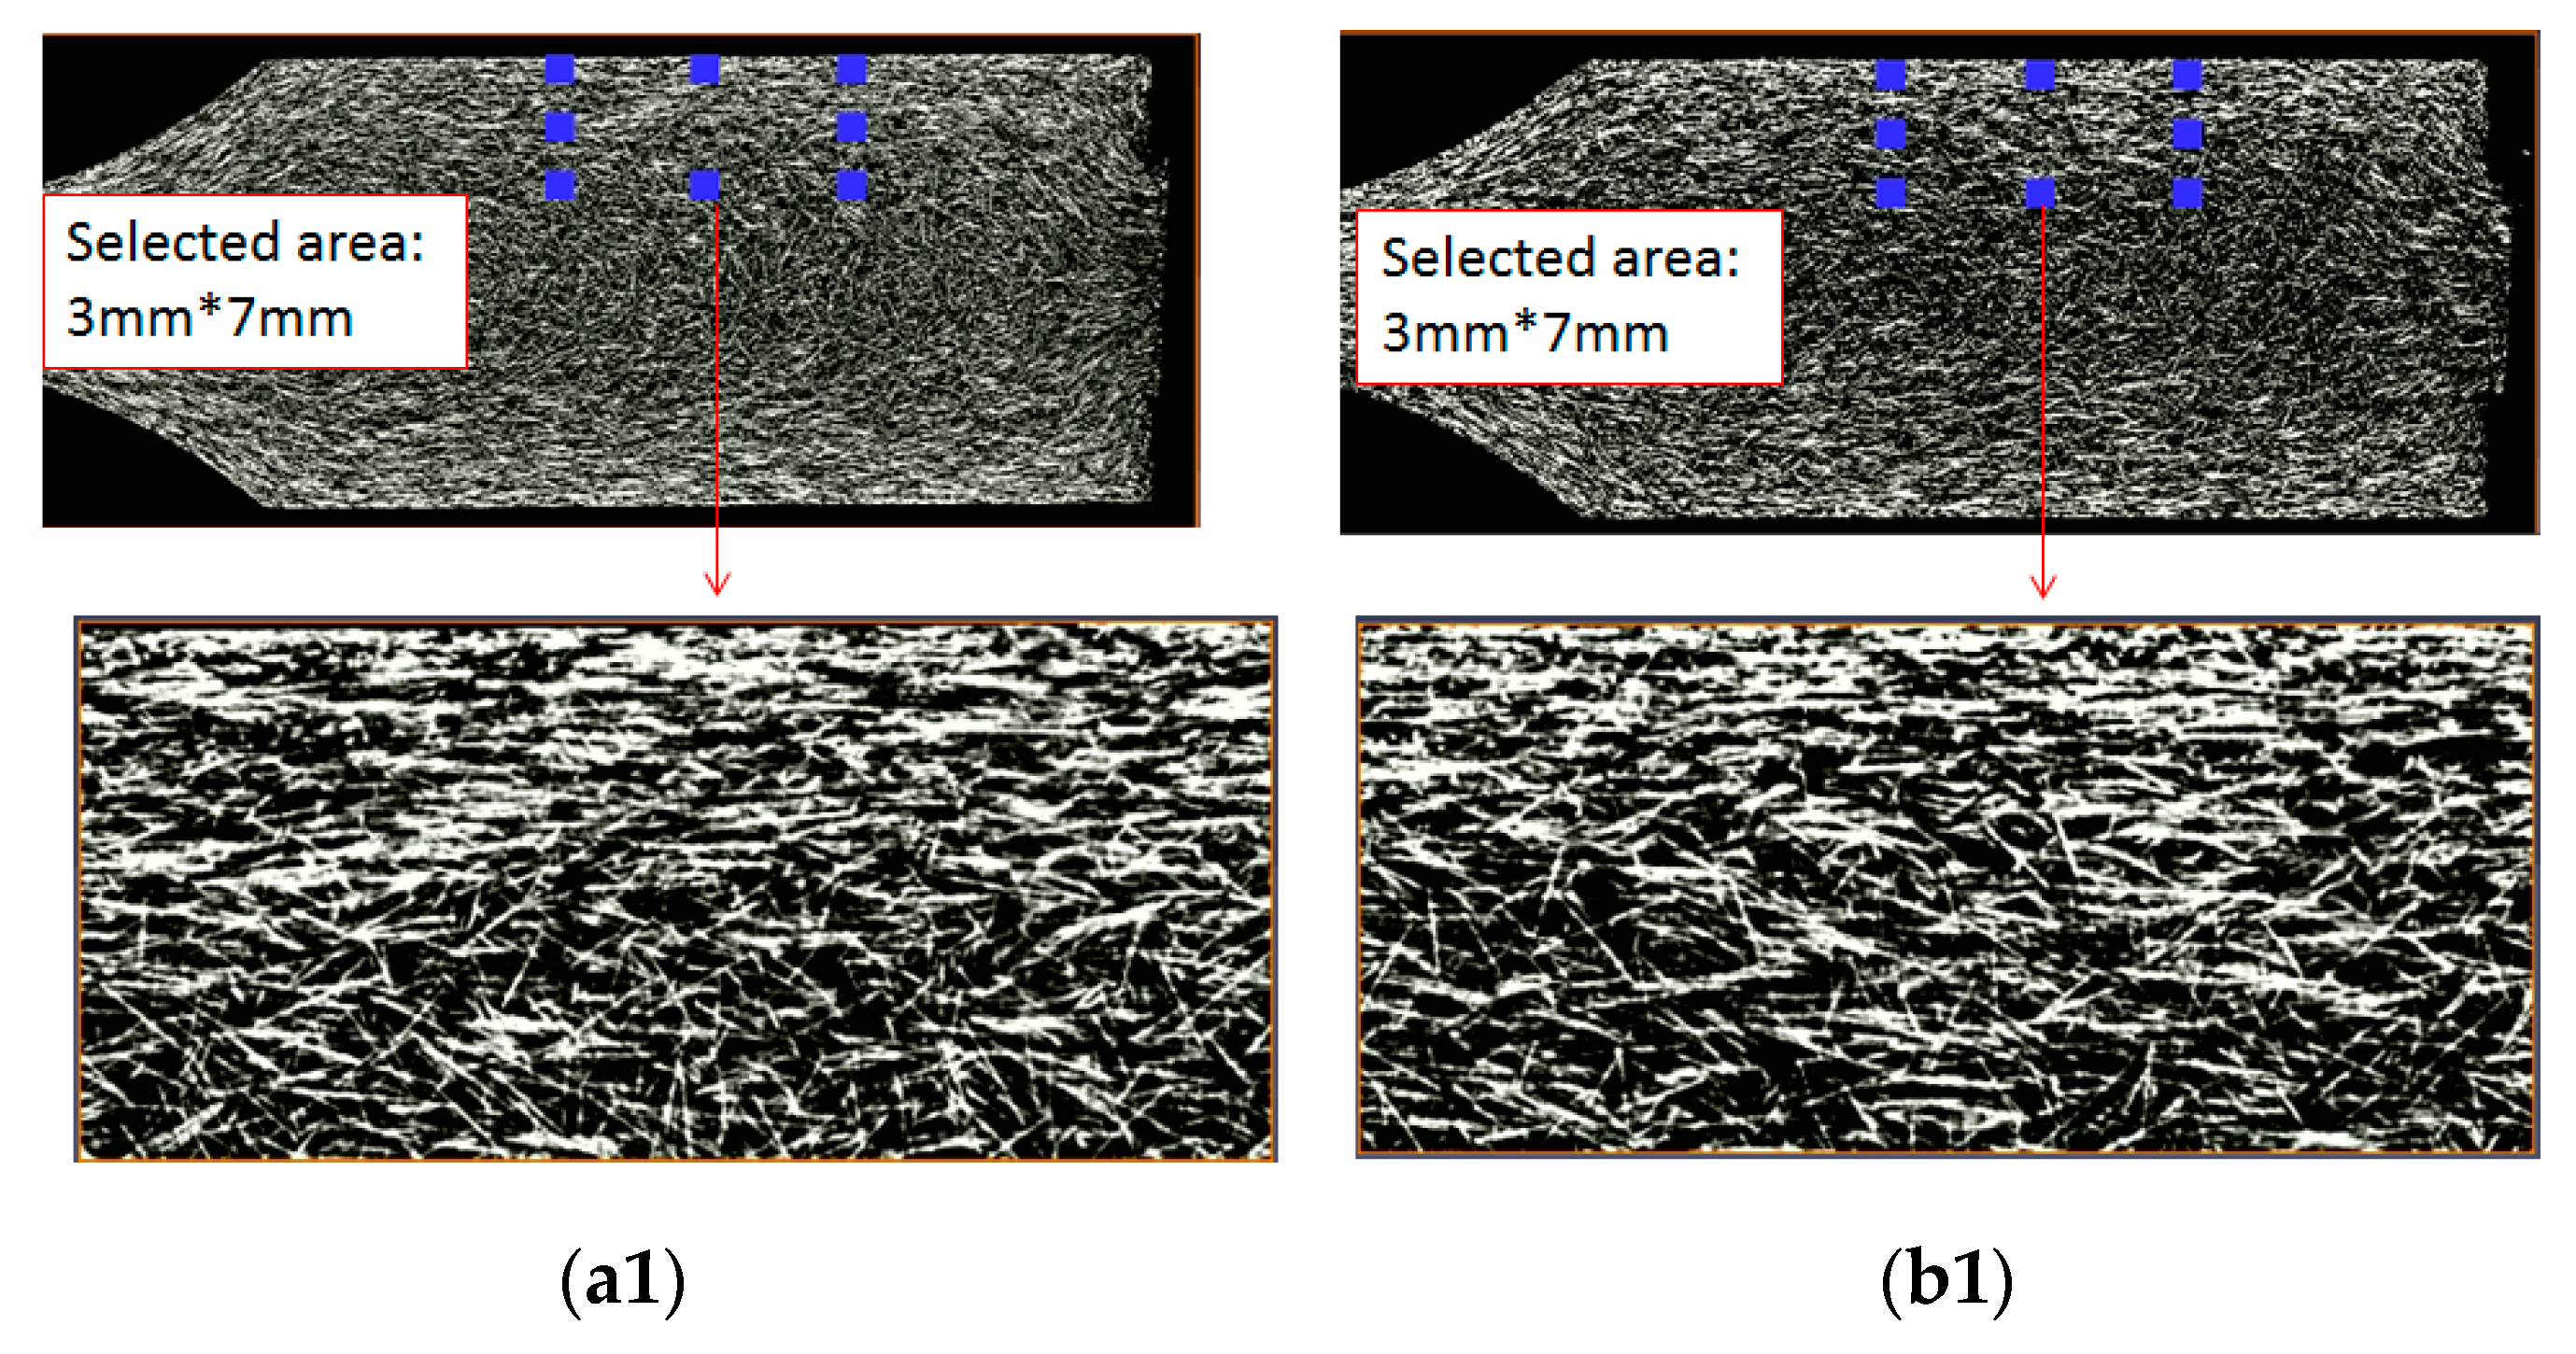
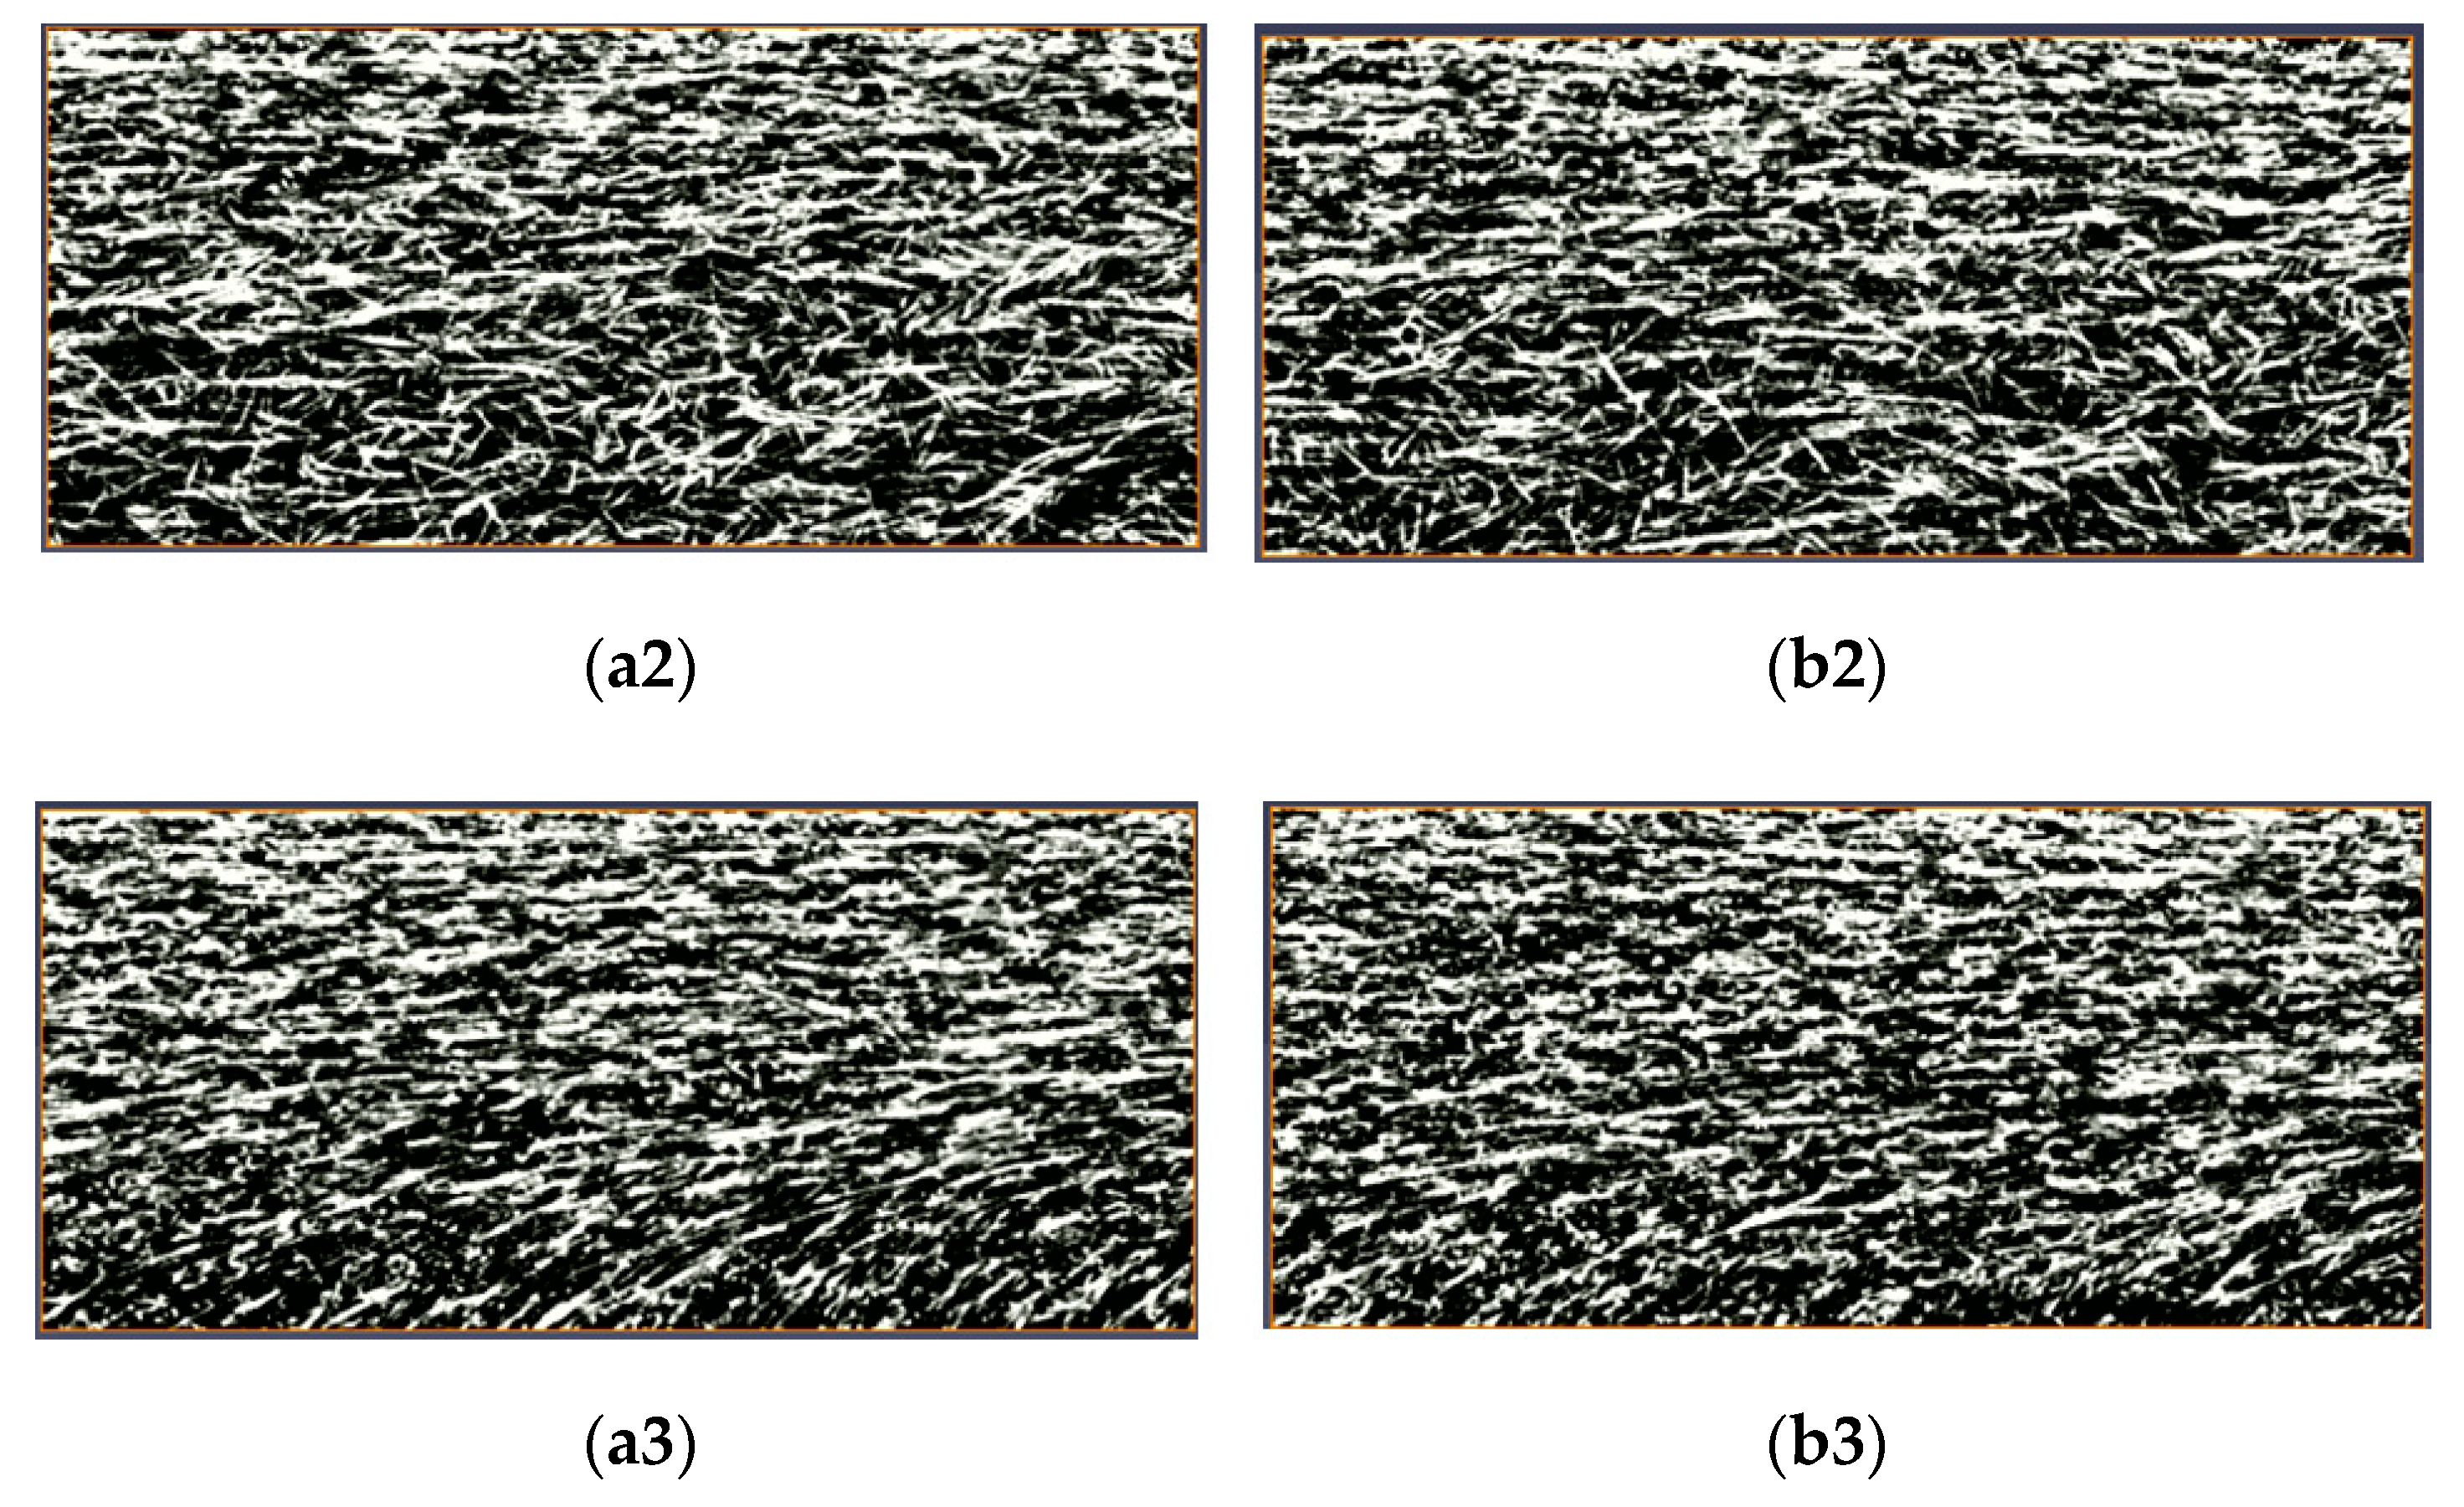
4.3.3. Fiber Morphology Observation
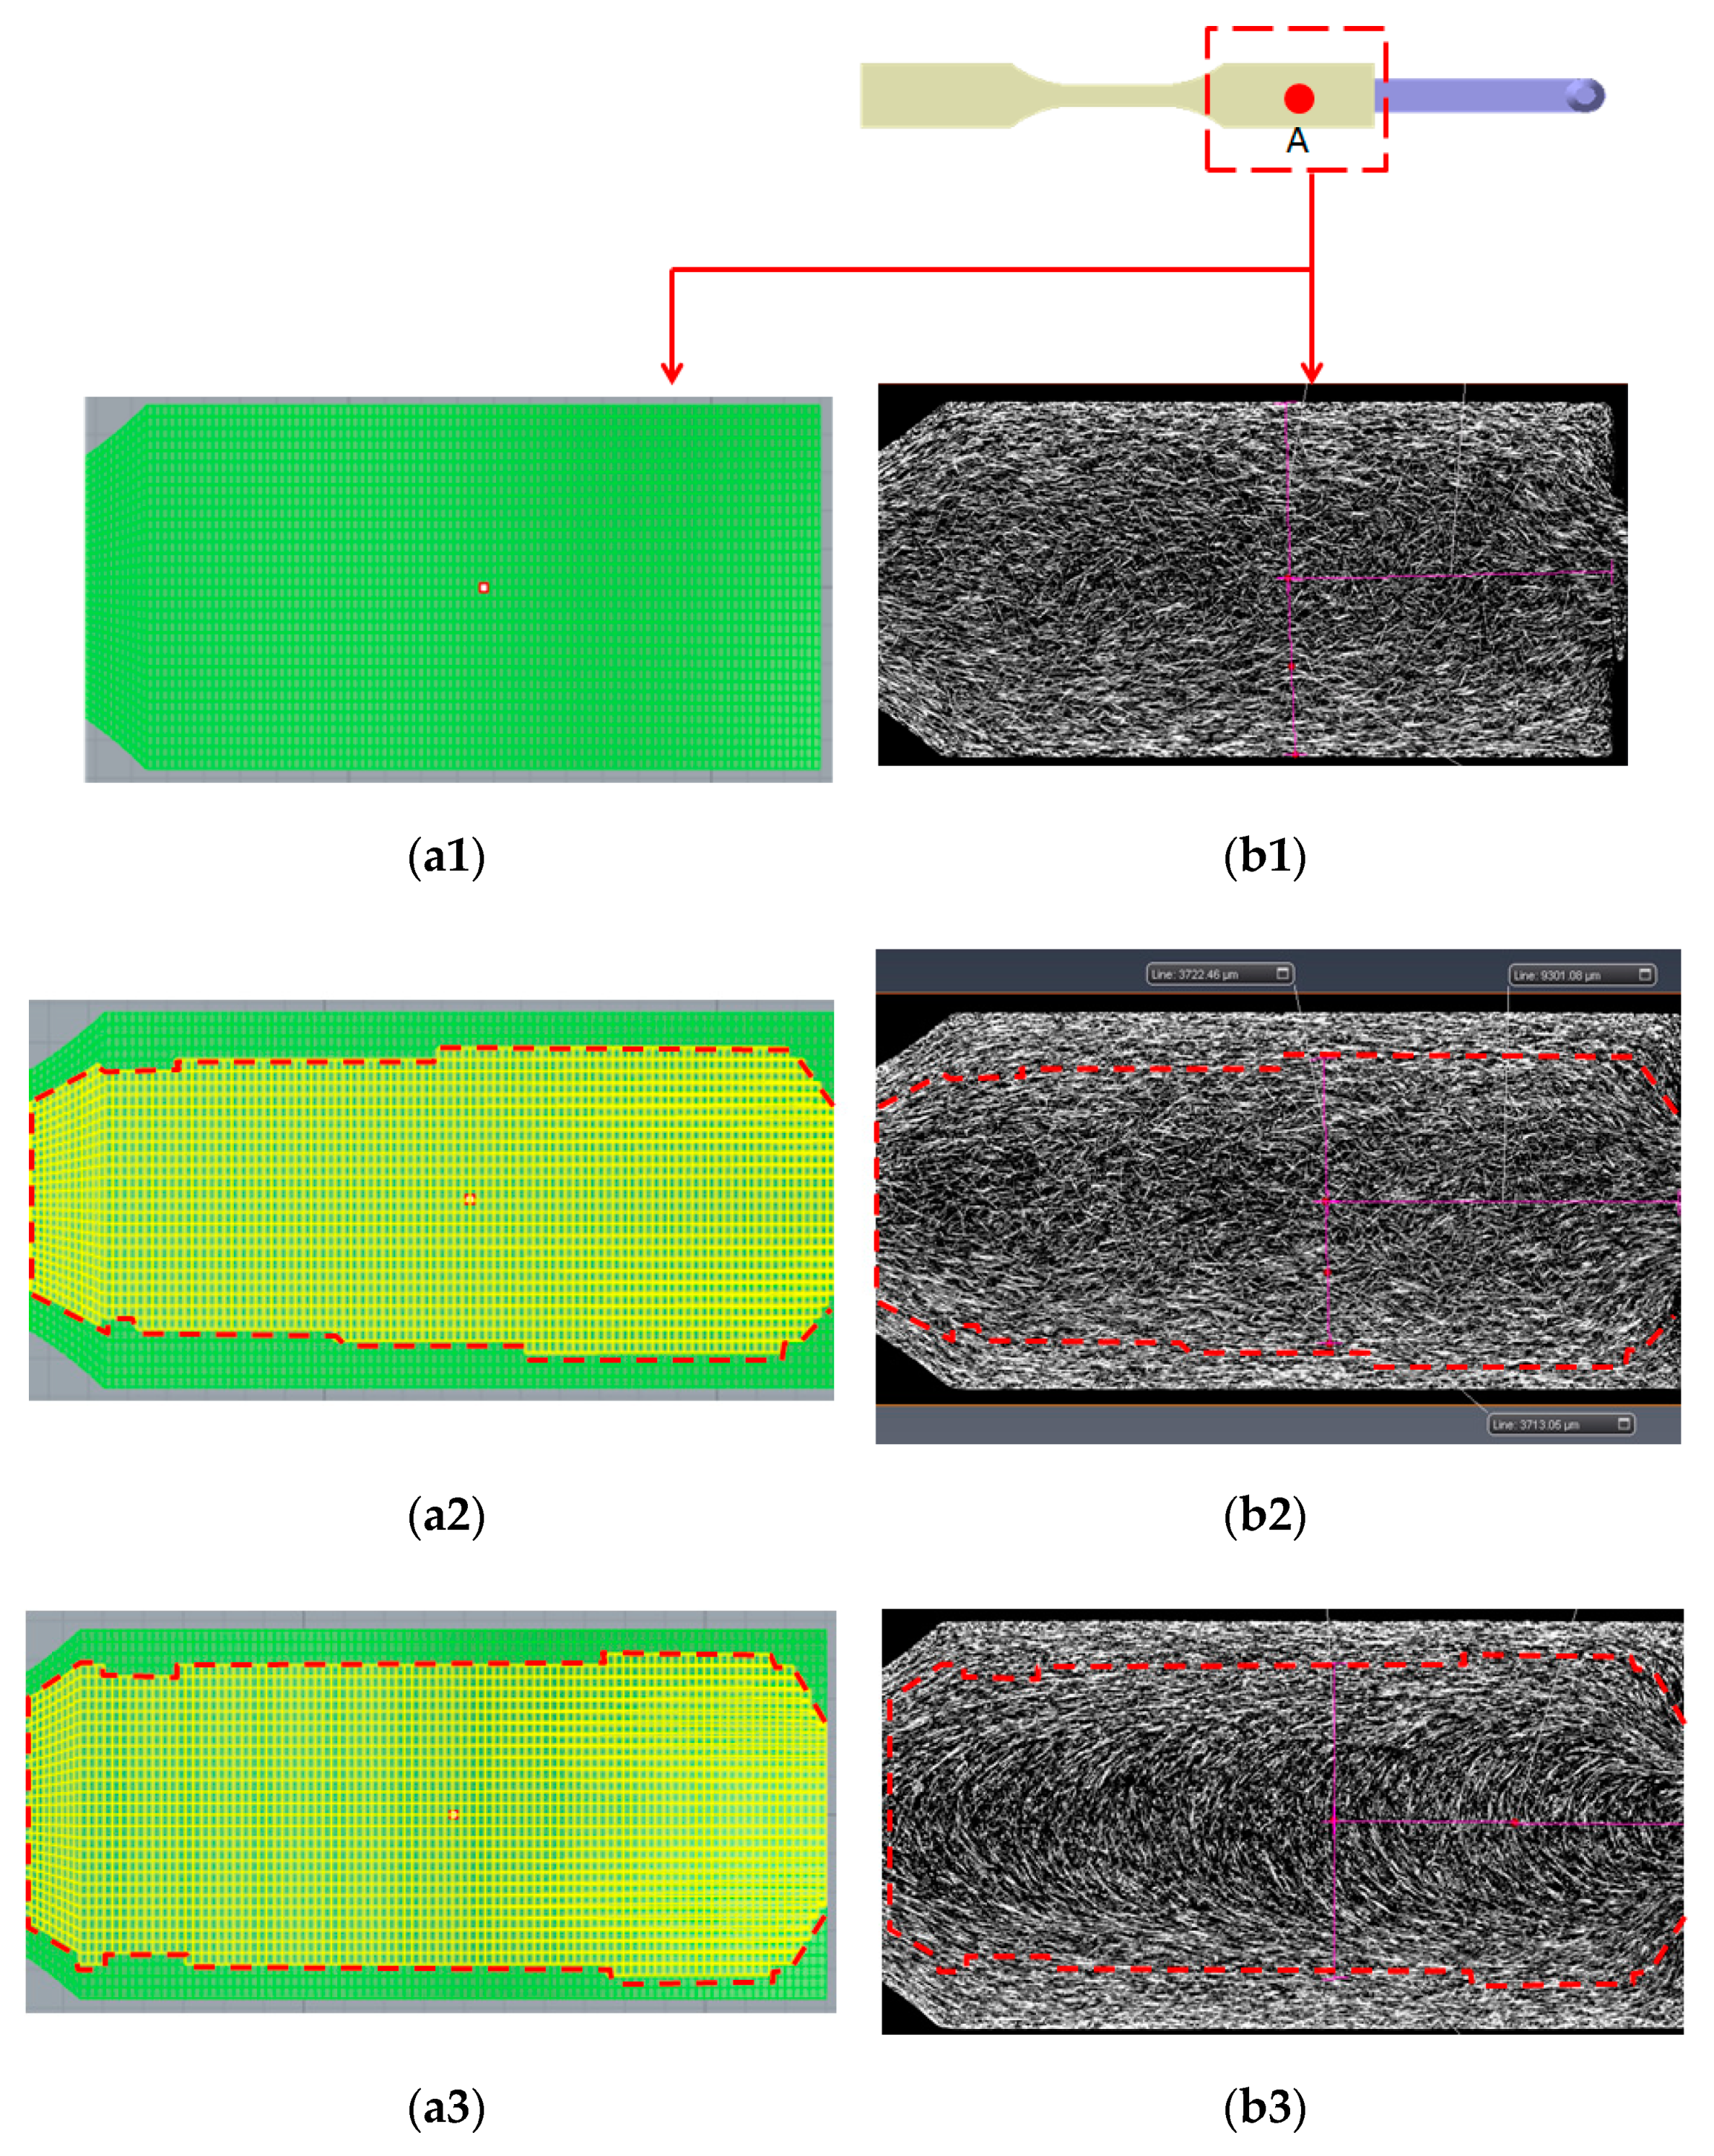
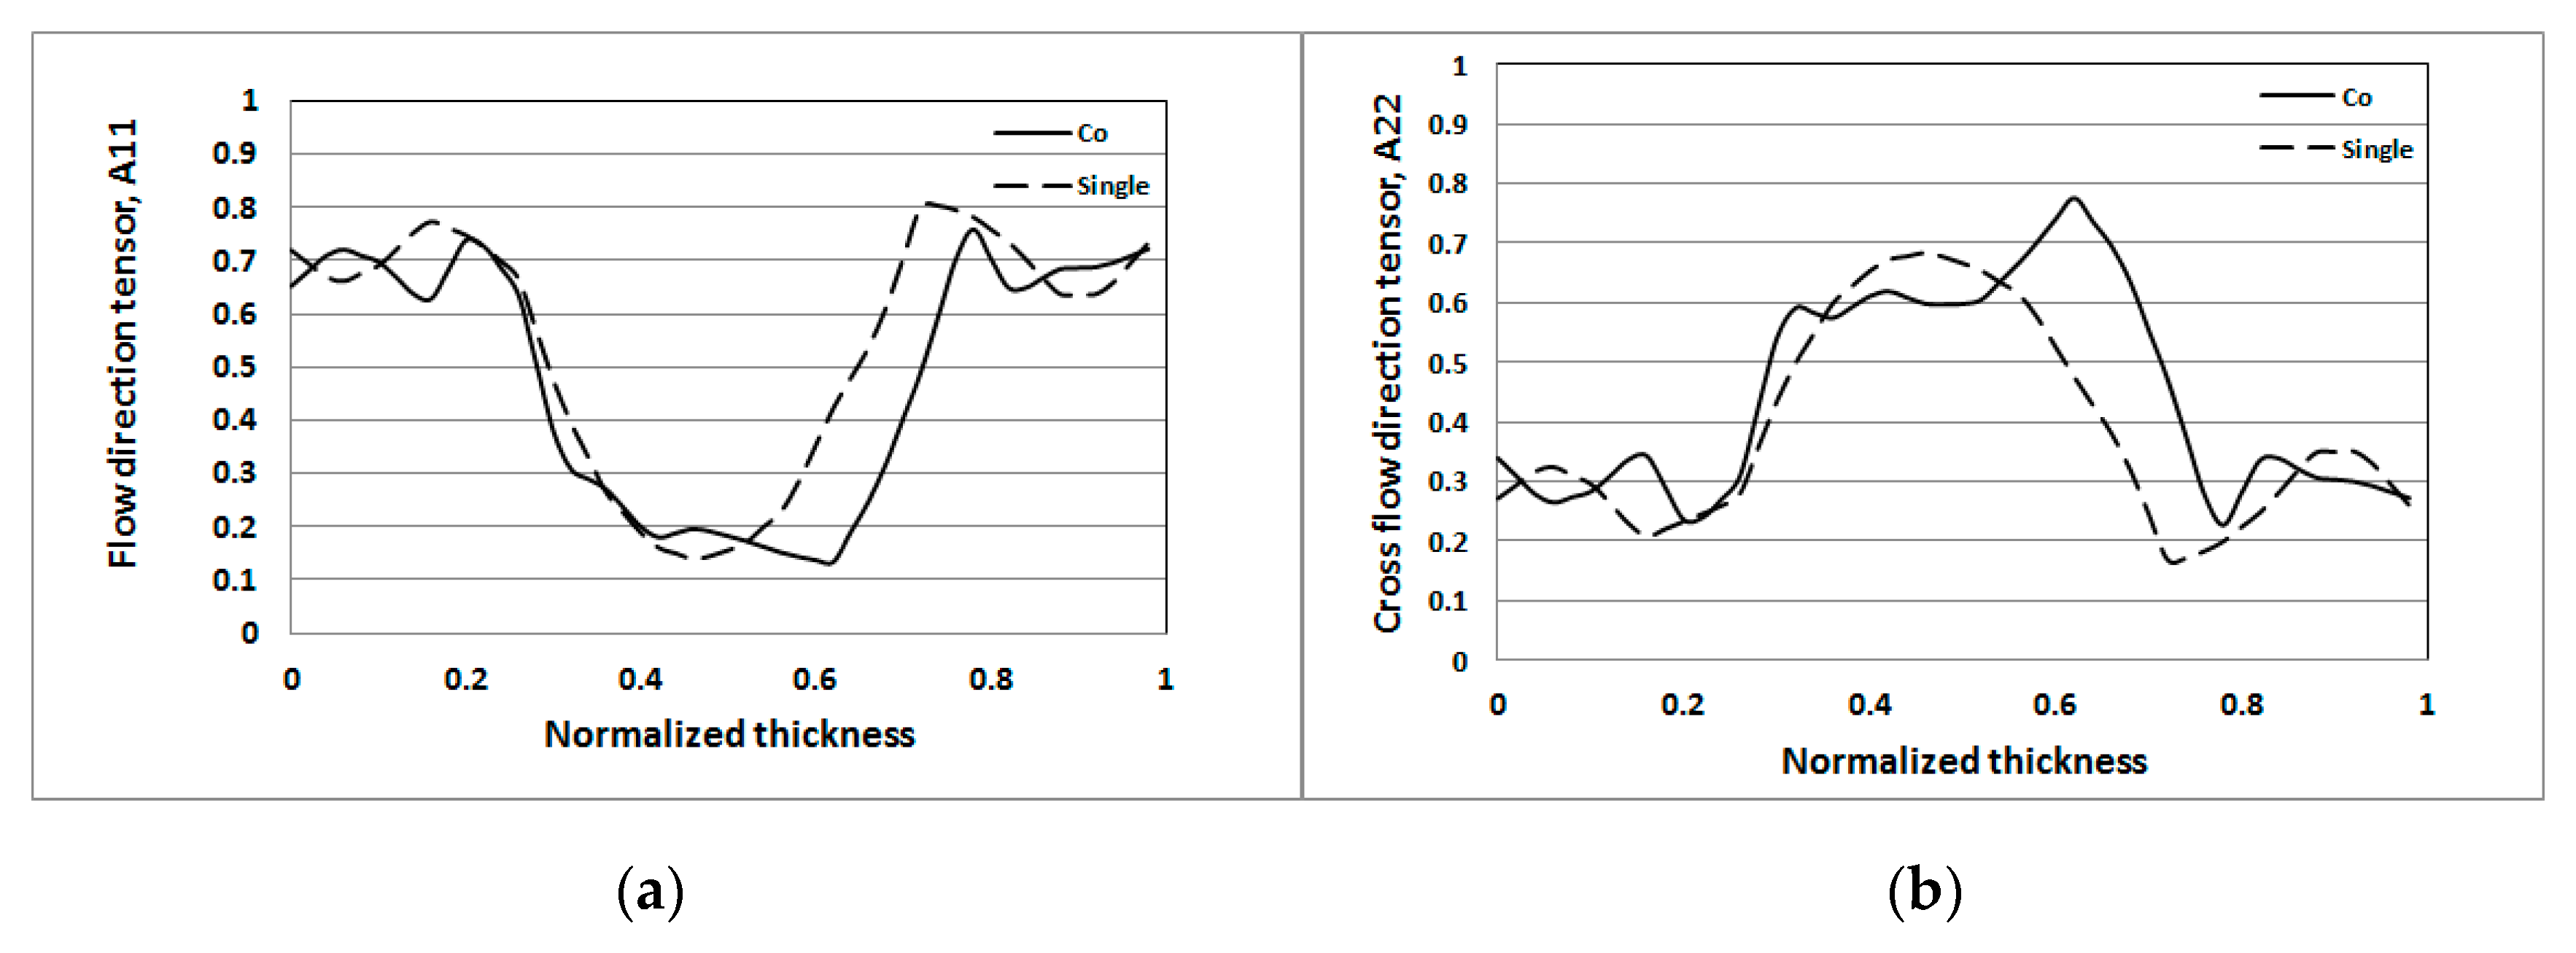
4.3.4. Fiber Orientation Distribution (FOD) Estimation and Validation
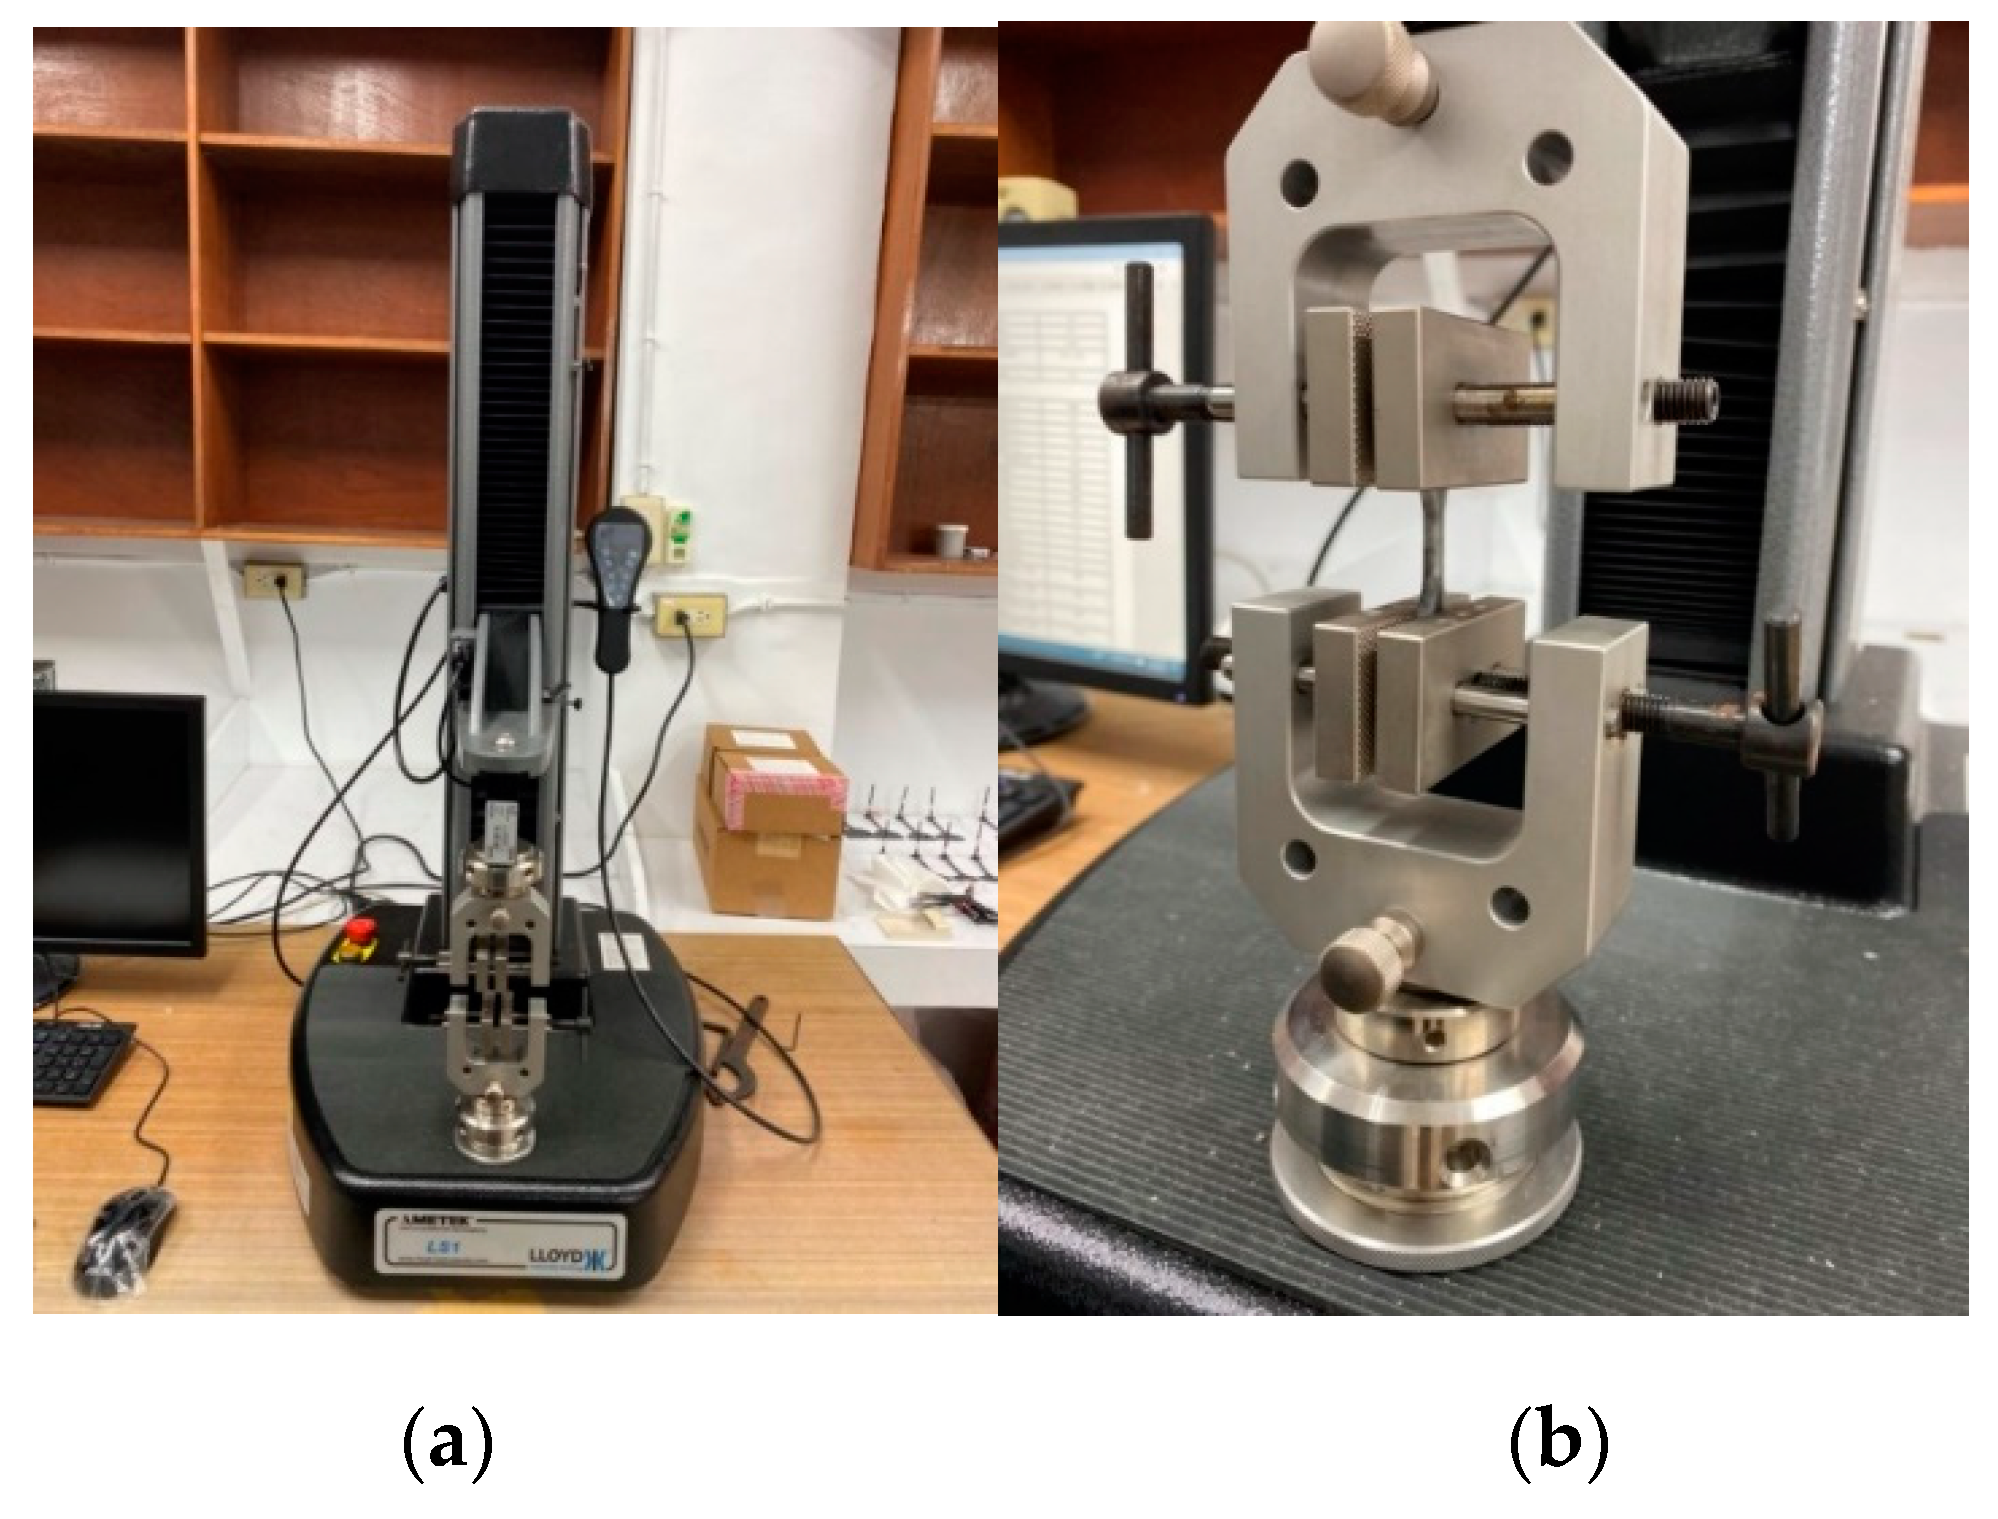
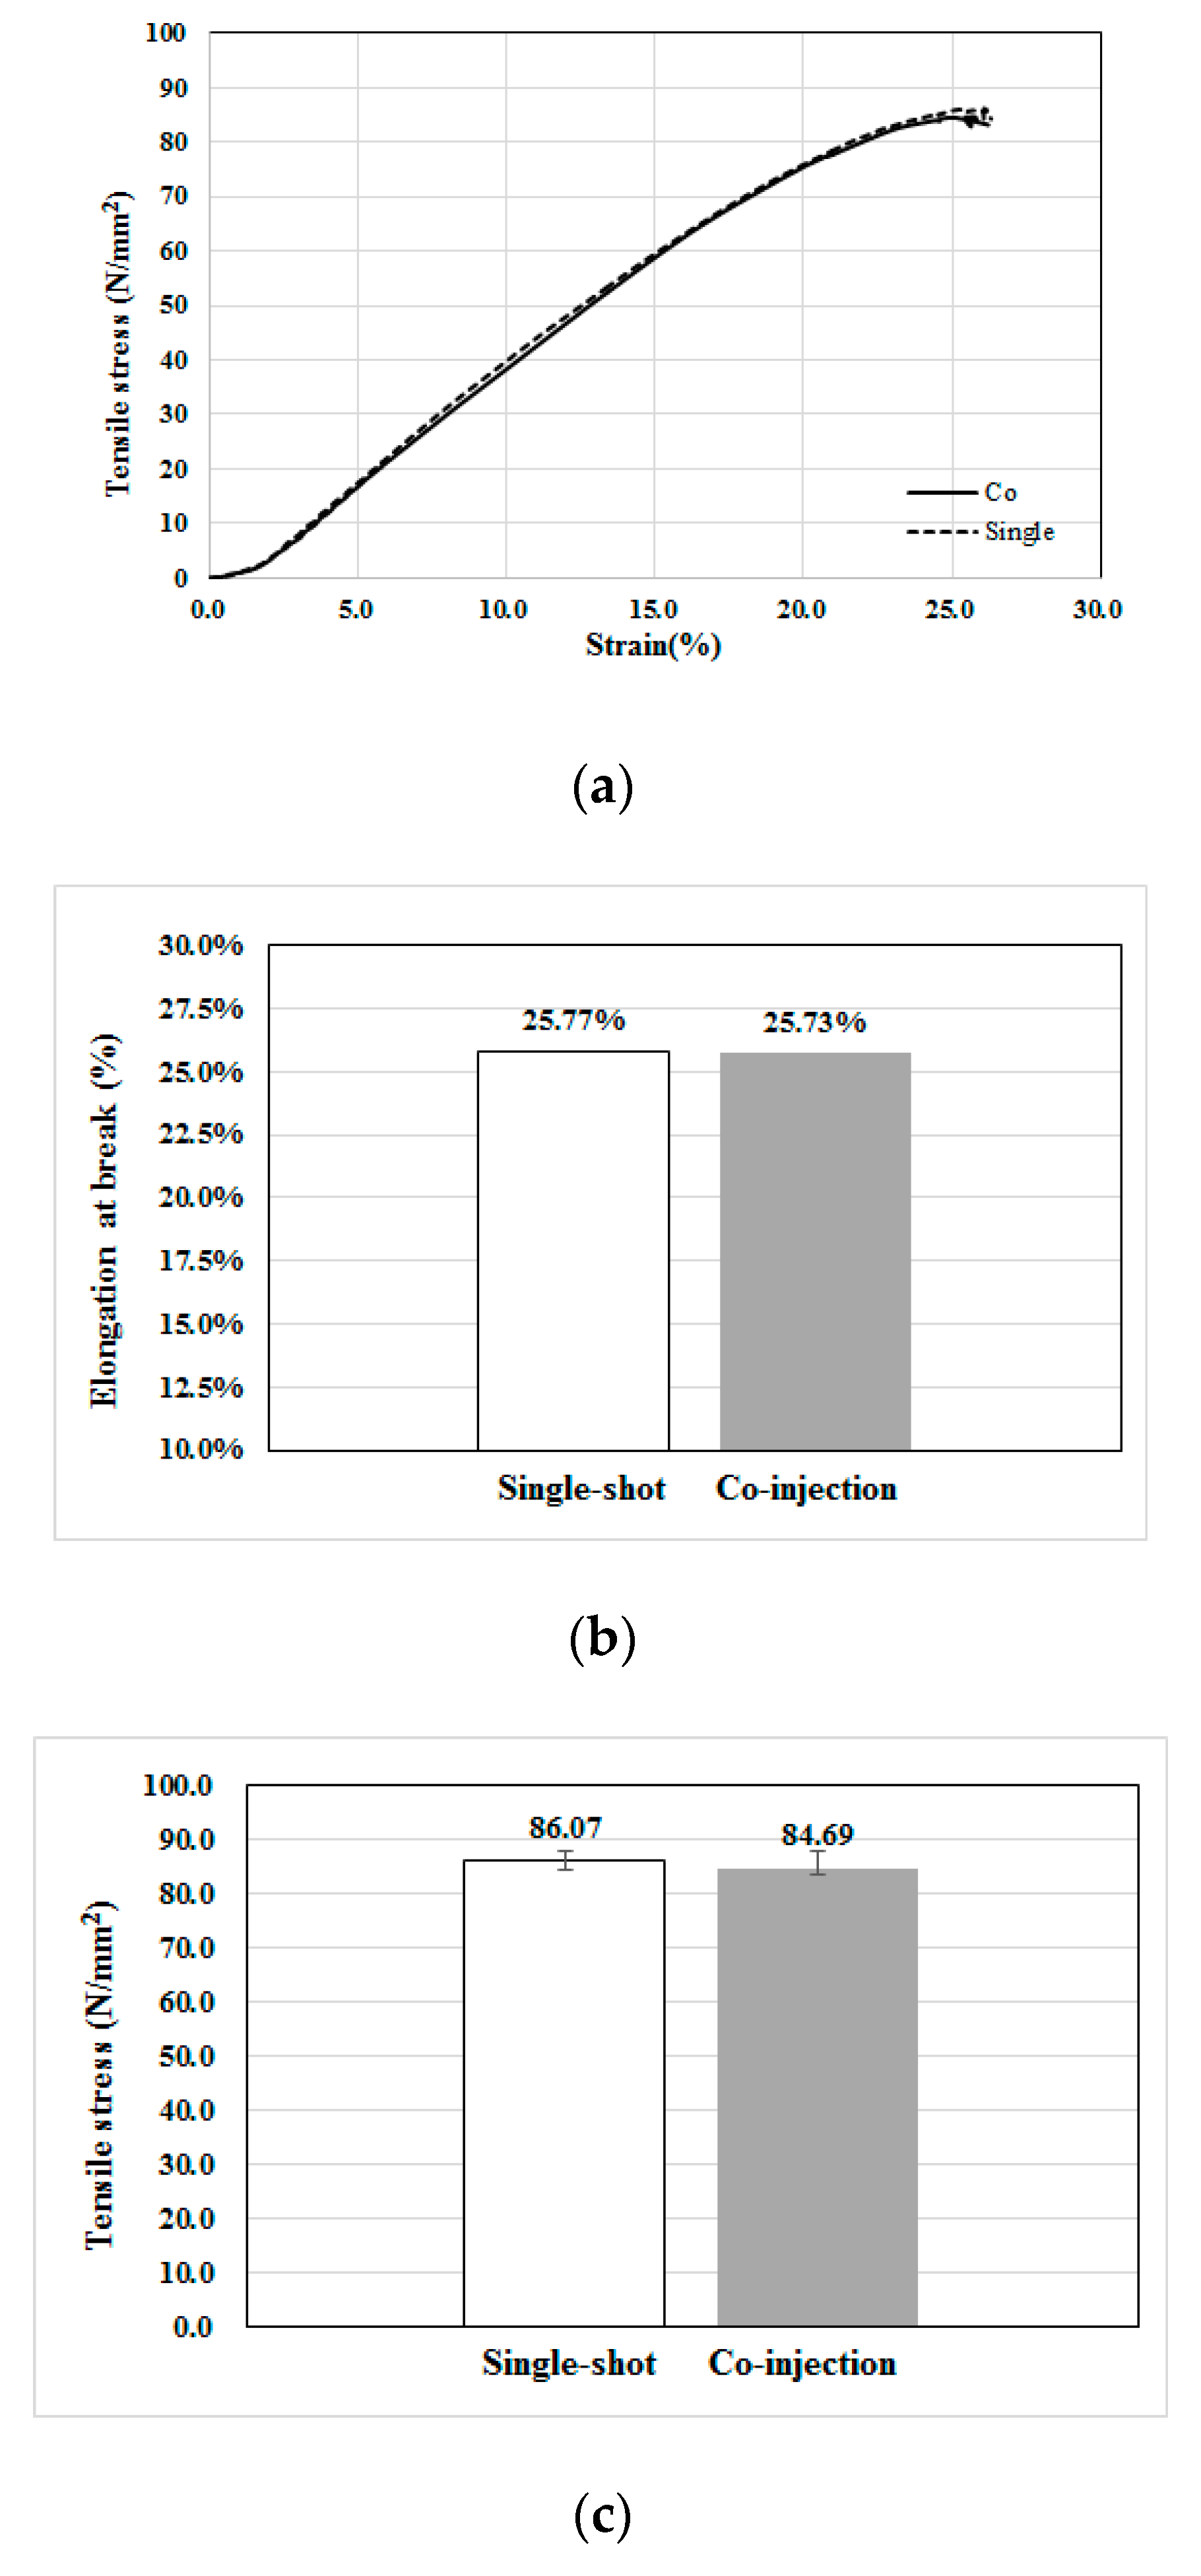
4.3.5. Tensile Property Measurement
5. Conclusions
- The skin/core ratio of 60:40 can provide suitable core-layer penetration without break-through, numerically and experimentally.
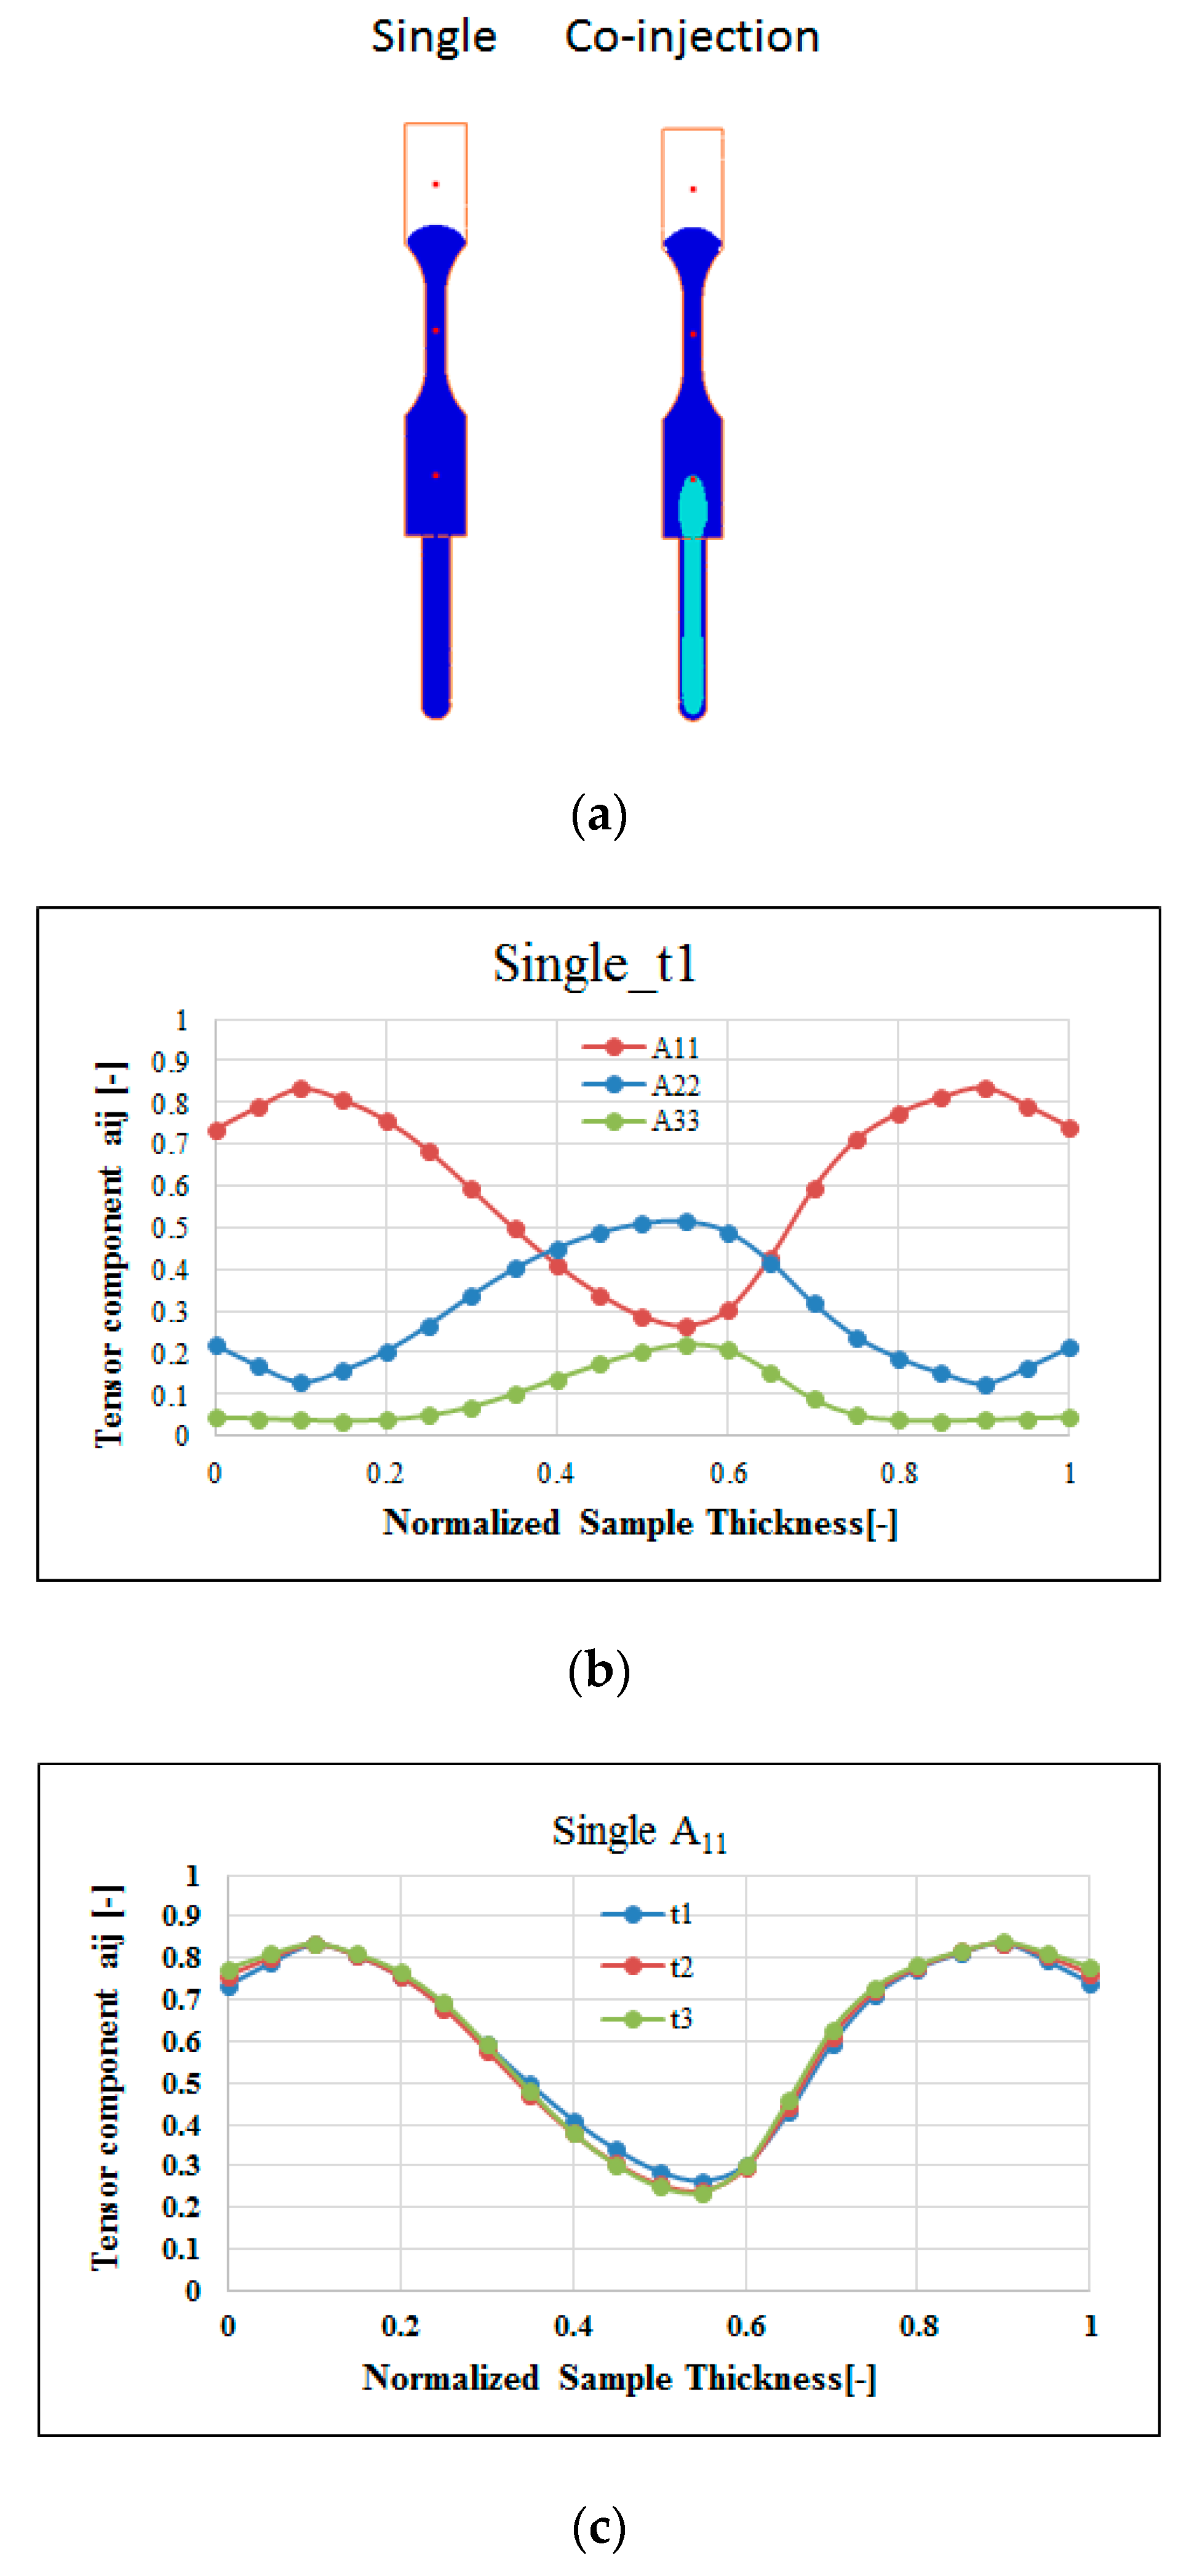
- To discover and verify the influence of the fiber orientation features, the fiber orientation distributions (FOD) of both co-injection and single-shot systems have been observed using μ-CT technology to scan the internal structures, and then software used to perform image analyses for those scanned images. Specifically, the fiber orientation tensor at flow direction (A11) of the co-injection is about 89% of that of the single-shot in the testing conditions. The lower the A11, the lower the tensile property that is expected.
- The difference of the fiber orientation tensor at flow direction (A11) between the co-injection and the single-shot systems is further verified based on the fiber morphology of the μ-CT scanned image. The observed result is consistent with that of the FOD estimation using the μ-CT scan plus image analysis.
- To validate the FOD effect on the mechanical properties due to the co-injection, tensile testing was performed. The tensile strength and tensile modulus of the co-injection part is a little weaker than that of the single-shot system. The reason inferred is that the overall fiber orientation tensor at flow direction (A11) of the co-injection system is lower than that of the single-shot system.
Author Contributions
Funding
Acknowledgments
Conflicts of Interest
References
- Hammond, L.-A. BMW i3 Carbon Fiber Aluminum Body Frame a New Ara in Electromobility. Available online: https://www.drivingthenation.com/bmw-i3-carbon-fiber-aluminum-body-frame-a-new-era-in-electromobility/, (accessed on 10 December 2019).
- Jacob, A. Carbon fibre and cars-2013 in review. In Reinforced Plastics. 2014. Available online: https://www.materialstoday.com/carbon-fiber/features/carbon-fibre-and-cars-2013-in-review/, (accessed on 10 December 2019).
- Amaechi, C.-V.; Agbomerie, C.-O.; Orok, E.-O.; Job, S.; Ye, J. Economic aspects of fiber reinforced polymer composite recycling. In Reference Module in Materials Science and Materials Engineering; Elsevier: Amsterdam, The Netherlands, 2019. [Google Scholar] [CrossRef]
- Wood, L. Global Composites Market Report 2019: $40.2 Billion Market Trends, Forecast and Competitive Analysis 2013–2018 & 2019–2024, Dublin. Available online: https://www.globenewswire.com/news-release/2019/04/12/1803326/0/en/Global-Composites-Market-Report-2019-40-2-Billion-Market-Trends-Forecast-and-Competitive-Analysis-2013-2018-2019-2024.html (accessed on 10 December 2019).
- Witten, E.; Mathes, V.; Sauer, M.; Kuhnel, M. Composites Market Report 2018: Market Developments, Trends, Outlooks and Challenges. AVK & Carbon Composites. Available online: https://eucia.eu/userfiles/files/20181115_avk_ccev_market_report_2018_final.pdf (accessed on 8 December 2019).
- Fenin, K.A.; Akinlabi, E.-T. Recycling of fiber reinforced composites: A review of current technologies. In Proceedings of the DII-2017-28, FDII-2017 Conference, Livingstone, Zambia,, 30 August–1 September 2017. [Google Scholar]
- Barnes, F. Recycled Carbon Fiber: Its Time Has Come, Composite World. Available online: https://www.compositesworld.com/columns/recycled-carbon-fiber-its-time-has-come- (accessed on 29 June 2016).
- Seldén, R. Co-injection molding: Effect of processing on material distribution and mechanical properties of a sandwich molded plate. Polym. Eng. Sci. 2000, 40, 1165. [Google Scholar] [CrossRef]
- Messaoud, D.; Sanchagrin, B.; Derdouri, A. Study on Mechanical Properties and Material Distribution of Sandwich Plaques Molded by Co-injection. Polym. Compos. 2005, 26, 265–275. [Google Scholar] [CrossRef] [Green Version]
- Gomes, M.; Martino, D.; Pontes, A.J.; Viana, J.C. Co-injection molding of immiscible polymers: skin-core structure and adhesion studies. Polym. Eng. Sci. 2011, 51, 2398–2407. [Google Scholar] [CrossRef]
- Sun, S.-P.; Hsu, C.-C.; Huang, C.-T.; Huang, K.-C.; Tseng, S.-C. Sandwich injection molding: core breakthrough and flow imbalance studies. SPE Tech. Pap. 2013, 1575837. [Google Scholar]
- Yang, W.M.; Yokoi, H. Visual analysis of the flow behavior of core material in a fork portion of plastic sandwich injection moulding. Polym. Test. 2003, 22, 37–43. [Google Scholar] [CrossRef]
- Huang, C.-T. Numerical visualization and optimization on the core penetration in multi-cavity co-injection molding with a bifurcation runner structure. Int. J. Adv. Manuf. Technol. 2017, 92, 2545–2557. [Google Scholar] [CrossRef]
- Huang, C.-T.; Tzeng, W.-J.; Chen, C.-H.; Lin, G.-G.; Hsu, C.-C.; Chang, R.-Y.; Tseng, S.-C. Study on the main driving force to cause the variation of the core material penetration behavior in different materials arranged co-injection molding. In Proceedings of the 34th International Conference of the Polymer Processing Society (PPS-34), Taipei, Taiwan, 21–25 May 2018. [Google Scholar]
- Thomason, J.L.; Vlug, M.A. Influence of fiber length and concentration on the properties of glass fiber-reinforced polypropylene: Part 1-Tensile and flexural modulus. Composites 1996, 27A, 477–484. [Google Scholar] [CrossRef]
- Thomason, J.L. The influence of fibre length and concentration on the properties of glass fibre reinforced polypropylene: Interface strength and fibre strain in injection moulded long fibre PP at high fibre content. Compos. Part A Appl. Sci. Manuf. 2007, 38, 210–216. [Google Scholar] [CrossRef] [Green Version]
- Fu, S.-Y.; Lauke, B. Effects of fiber length and fiber orientation distributions on the tensile strength of short-reinforced polymers. Compos. Sci. Technol. 1996, 56, 1179–1190. [Google Scholar] [CrossRef]
- Wang, C.; Yang, S. Thermal, tensile and dynamic mechanical properties of short carbon fibre reinforced polypropylene composites. Polym. Polym. Compos. 2013, 21, 65–71. [Google Scholar] [CrossRef]
- Lafranche, E.; Krawczak, P.; Ciolczyk, J.P.; Maugey, J. Injection moulding of long glass fibre reinforced poly-amide 6-6: Guidelines to improve flexural properties. Express Polym. Lett. 2007, 1, 456–466. [Google Scholar] [CrossRef]
- Cilleruelo, L.; Lafranche, E.; Krawczak, P.; Pardo, P.; Lucas, P. Injection moulding of long glass fibre reinforced poly(ethylene terephtalate): Influence of carbon black and nucleating agents on impact properties. Express Polym. Lett. 2012, 6, 706–718. [Google Scholar] [CrossRef]
- Folgar, F.; Tucker, C.L. Orientation behavior of fibers in concentrated suspensions. J. Reinf. Plast. Compos. 1984, 3, 98–119. [Google Scholar] [CrossRef]
- Advani, S.G.; Tucker, C.L. The use of tensors to describe and predict fiber orientation in short fiber composites. J. Rheol. 1987, 31, 751–784. [Google Scholar] [CrossRef]
- Advani, S.G. Flow and Rheology in Polymer Composites Manufacturing; Elsevier: New York, NY, USA, 1994. [Google Scholar]
- Wang, J.-J.; O’Gara, J.-F.; Tucker, C.-L. An objective model for slow orientation kinetics in concentrated fiber suspensions: Theory and rheological evidence. J. Rheol. 2008, 52, 1179–1200. [Google Scholar] [CrossRef]
- Tseng, H.-C.; Chang, R.-Y.; Hsu, C.-H. Phenomenological improvements to predictive models of fiber orientation in concentrated suspensions. J. Rheol. 2013, 57, 1597–1631. [Google Scholar] [CrossRef]
- Tseng, H.-C.; Chng, R.-Y.; Hsu, C.-H. Method and Computer Readable Media for Determining Orientation of Fibers in a Fluid. U.S. Patent No. 8,571,828, 29 October 2013. [Google Scholar]
- Tseng, H.-C.; Wang, T.-C.; Chang, Y.-J.; Hsu, C.-H.; Chang, R.-Y. Progress on fiber concentration for injection molding simulation of fiber reinforced thermoplastics. SPE Tech. Pap. 2014, 1669–1673. [Google Scholar]
- Bernasconi, A.; Cosmi, F.; Hine, P.J. Analysis of fibre orientation distribution in short fibre reinforced polymers: A comparison between optical and tomographic methods. Compos. Sci. Technol. 2012, 72, 2002–2008. [Google Scholar] [CrossRef]
- Gandhi, U.; Sebastian, D.B.; Kunc, V.; Song, Y. Method to measure orientation of discontinuous fiber embedded in the polymer matrix from computerized tomography scan data. J. Thermoplast. Mater. 2016, 29, 1696–1709. [Google Scholar] [CrossRef]
- Goris, S.; Gandhi, U.; Song, Y.-Y.; Osswald, T.A. Analysis of the process-induced microstructure in injection molding of long glass fiber-reinforced thermoplastics. SPE Tech. Pap. 2016, 348–356. [Google Scholar]
- Grellmann, W.; Seidler, S. Polymer Testing, 2nd ed.; Carl Hanser Verlag: Munich, Germany, 2013. [Google Scholar]


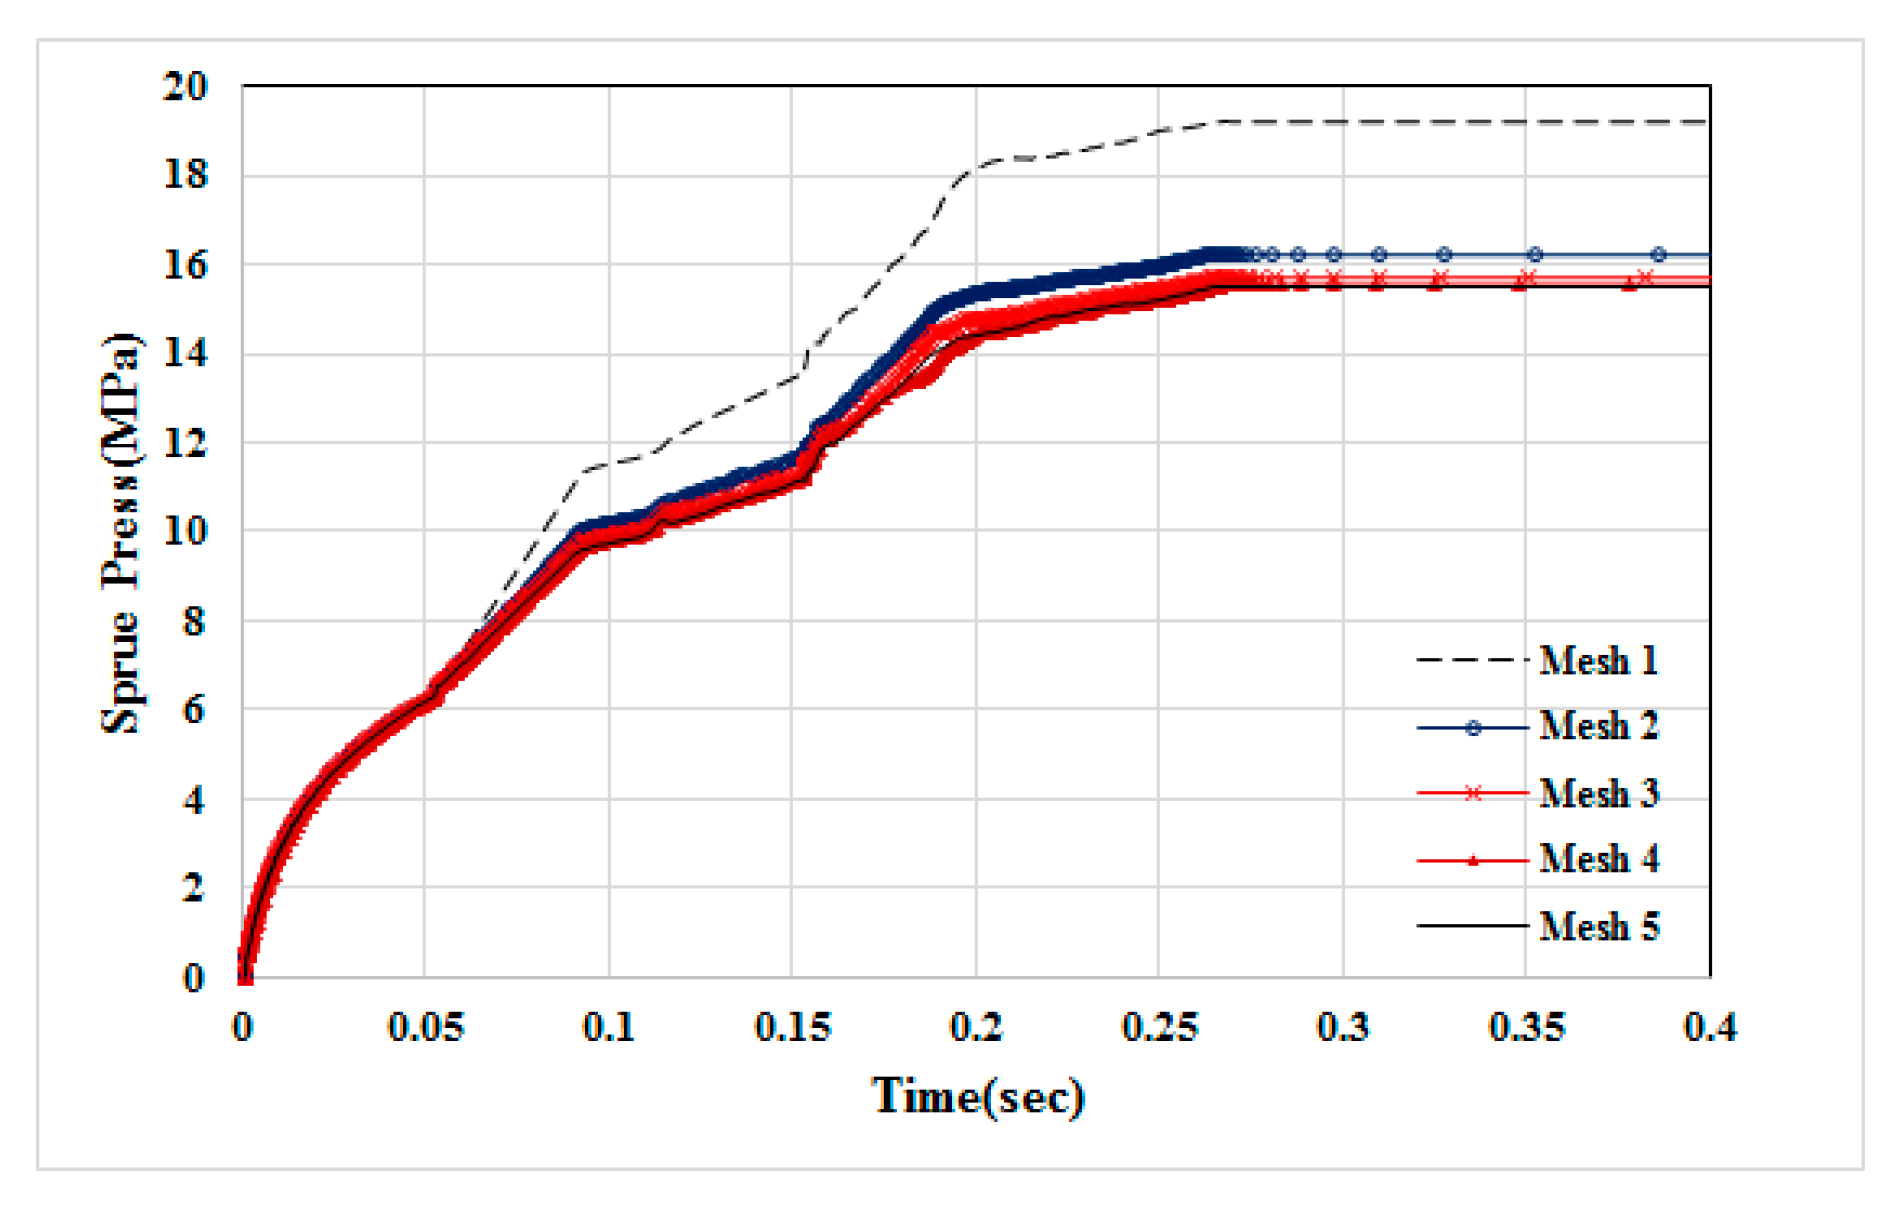
| Mesh 1 | Mesh 2 | Mesh 3 | Mesh 4 | Mesh 5 | |
|---|---|---|---|---|---|
| mesh type (runner) | tetrahedron | ||||
| mesh type (cavity) | hexahedron | ||||
| layers in thickness | 5 | 10 | 15 | 20 | 25 |
| mesh size (mm) | 0.2 | ||||
| cavity count | 51,520 | 103,040 | 154,560 | 206,080 | 257,600 |
| runner count | 22,940 | 40,560 | 49,340 | 46,640 | 66,900 |
| total element count | 74,460 | 143,600 | 203,900 | 252,720 | 324,500 |
| analysis time (h) | 0.25 | 0.45 | 0.61 | 0.75 | 1 |
| Material | Skin: PP Globalene SF7351; Core: PP Globalene SF7351 |
|---|---|
| Filling time (s) | 0.3 |
| Packing time (s) | ---- |
| Flow rate (cm3/s) | 10 |
| Melt temperature (°C) | 230 |
| Mold temperature (°C) | 35 |
| Injection pressure (MPa) | 175 |
| Core switch over (by volume filled) (%) | 60 |
| Material | PP Globalene SF7351 |
|---|---|
| Filling time (s) | 0.3 |
| Packing time (s) | 3 |
| Flow rate (cm3/s) | 10 |
| Melt temperature (°C) | 230 |
| Mold temperature (°C) | 35 |
| Injection pressure (MPa) | 175 |
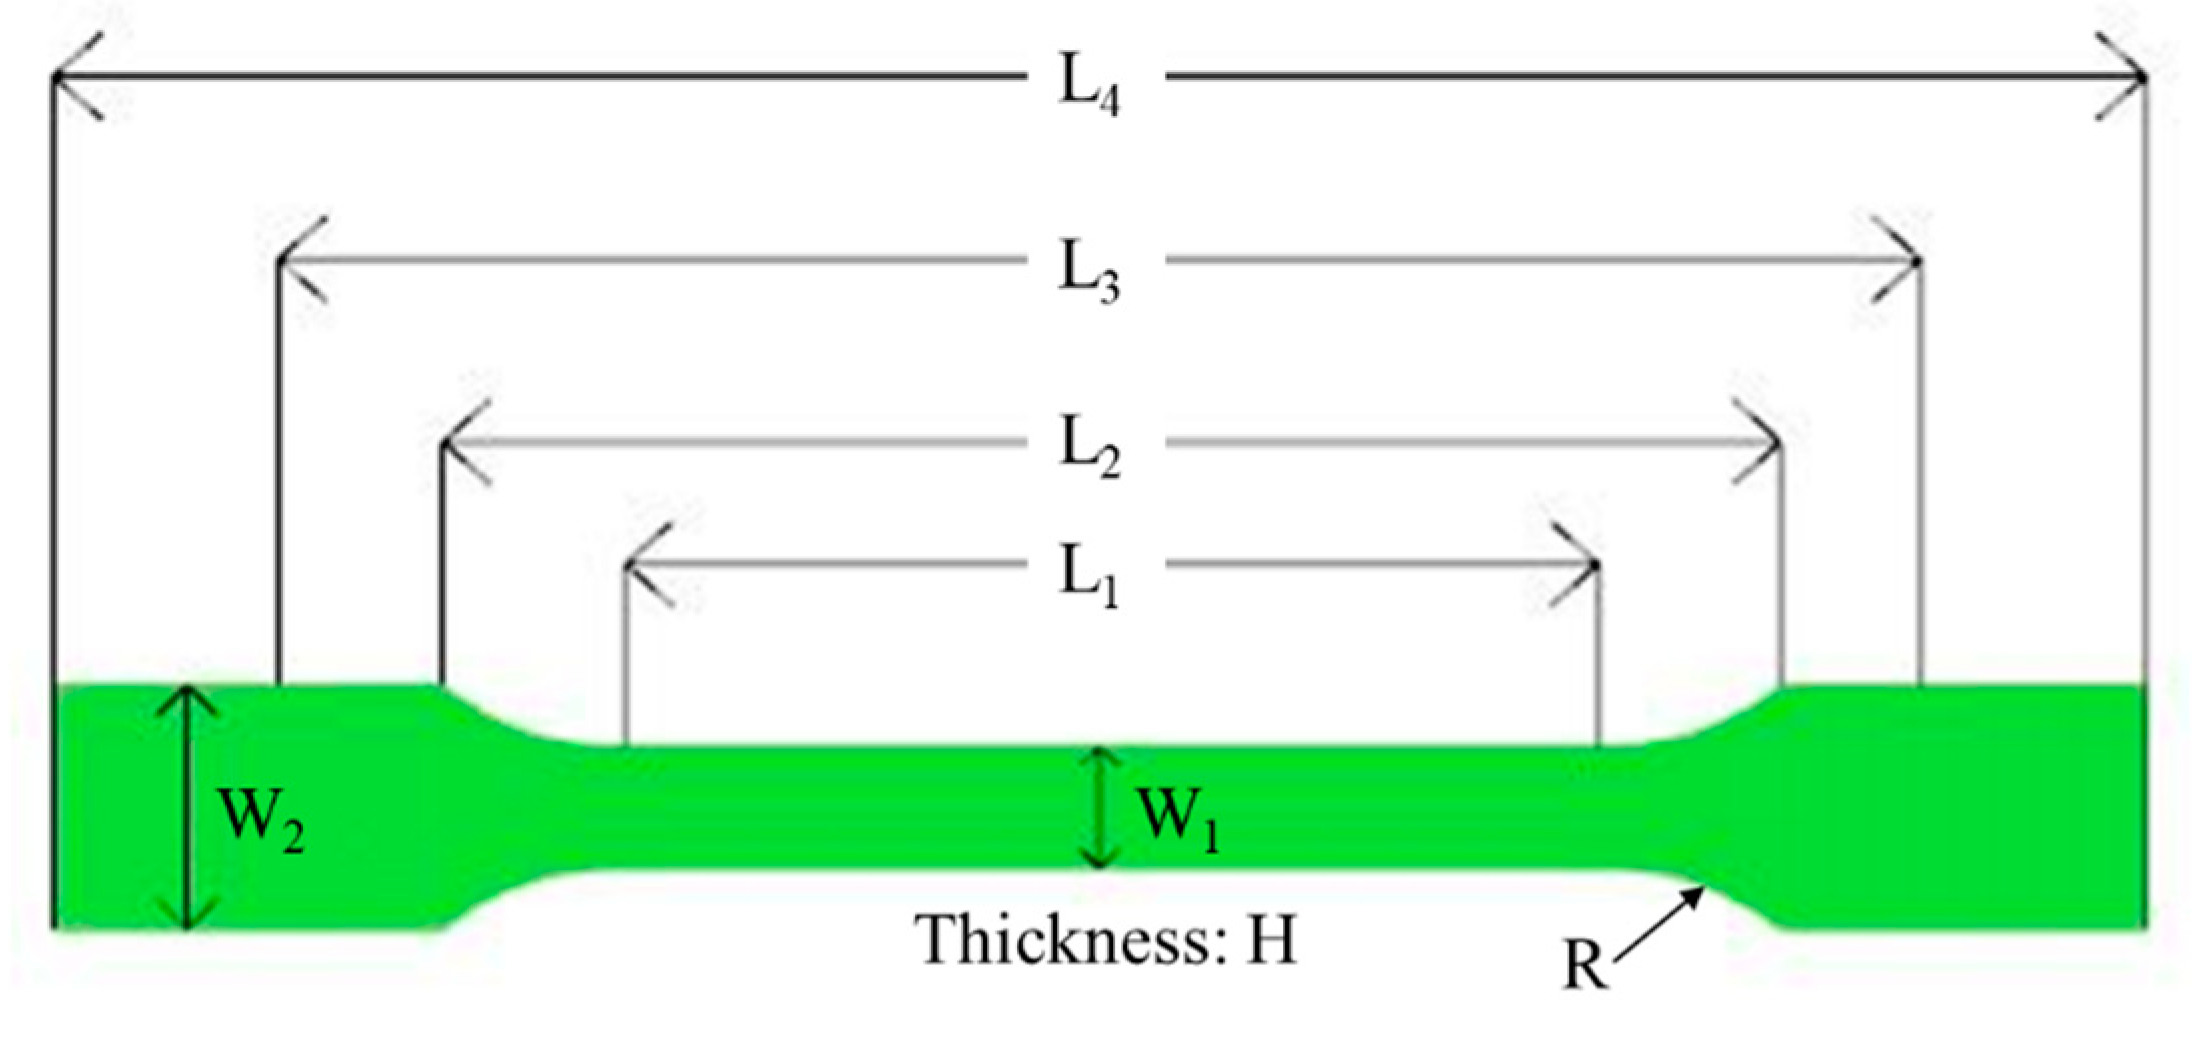
| Symbol | Definition | mm |
|---|---|---|
| L1 | Length of narrow portion | |
| L2 | Distance between broad parallel portions | |
| L3 | Initial clamping length | |
| L4 | Overall length | |
| W1 | Width of narrow portion | |
| W2 | Width at ends | |
| H | Thickness | |
| R | Radius |
| Item | Single-Shot | Co-Injection |
|---|---|---|
| Tensile Strength (N/mm2) | 86.07 | 84.69 |
| Tensile Modulus (N/mm2) | 75.93 | 39.08 |
| Elongation at Break (%) | 25.77% | 25.73% |
© 2019 by the authors. Licensee MDPI, Basel, Switzerland. This article is an open access article distributed under the terms and conditions of the Creative Commons Attribution (CC BY) license (http://creativecommons.org/licenses/by/4.0/).
Share and Cite
Huang, C.-T.; Chen, X.-W.; Fu, W.-W. Investigation on the Fiber Orientation Distributions and Their Influence on the Mechanical Property of the Co-Injection Molding Products. Polymers 2020, 12, 24. https://0-doi-org.brum.beds.ac.uk/10.3390/polym12010024
Huang C-T, Chen X-W, Fu W-W. Investigation on the Fiber Orientation Distributions and Their Influence on the Mechanical Property of the Co-Injection Molding Products. Polymers. 2020; 12(1):24. https://0-doi-org.brum.beds.ac.uk/10.3390/polym12010024
Chicago/Turabian StyleHuang, Chao-Tsai, Xuan-Wei Chen, and Wei-Wen Fu. 2020. "Investigation on the Fiber Orientation Distributions and Their Influence on the Mechanical Property of the Co-Injection Molding Products" Polymers 12, no. 1: 24. https://0-doi-org.brum.beds.ac.uk/10.3390/polym12010024