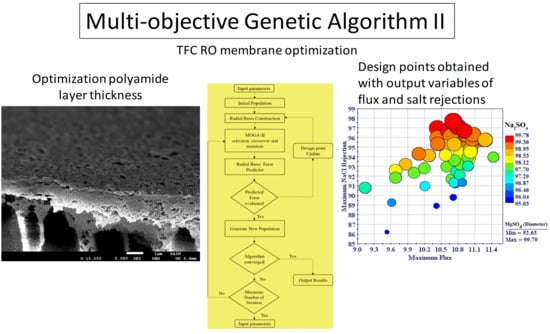
A Novel Approach to Optimize the Fabrication Conditions of Thin Film Composite RO Membranes Using Multi-Objective Genetic Algorithm II


 ,
,  and
and
Abstract
:
1. Introduction
2. Materials and Methods
2.1. Materials
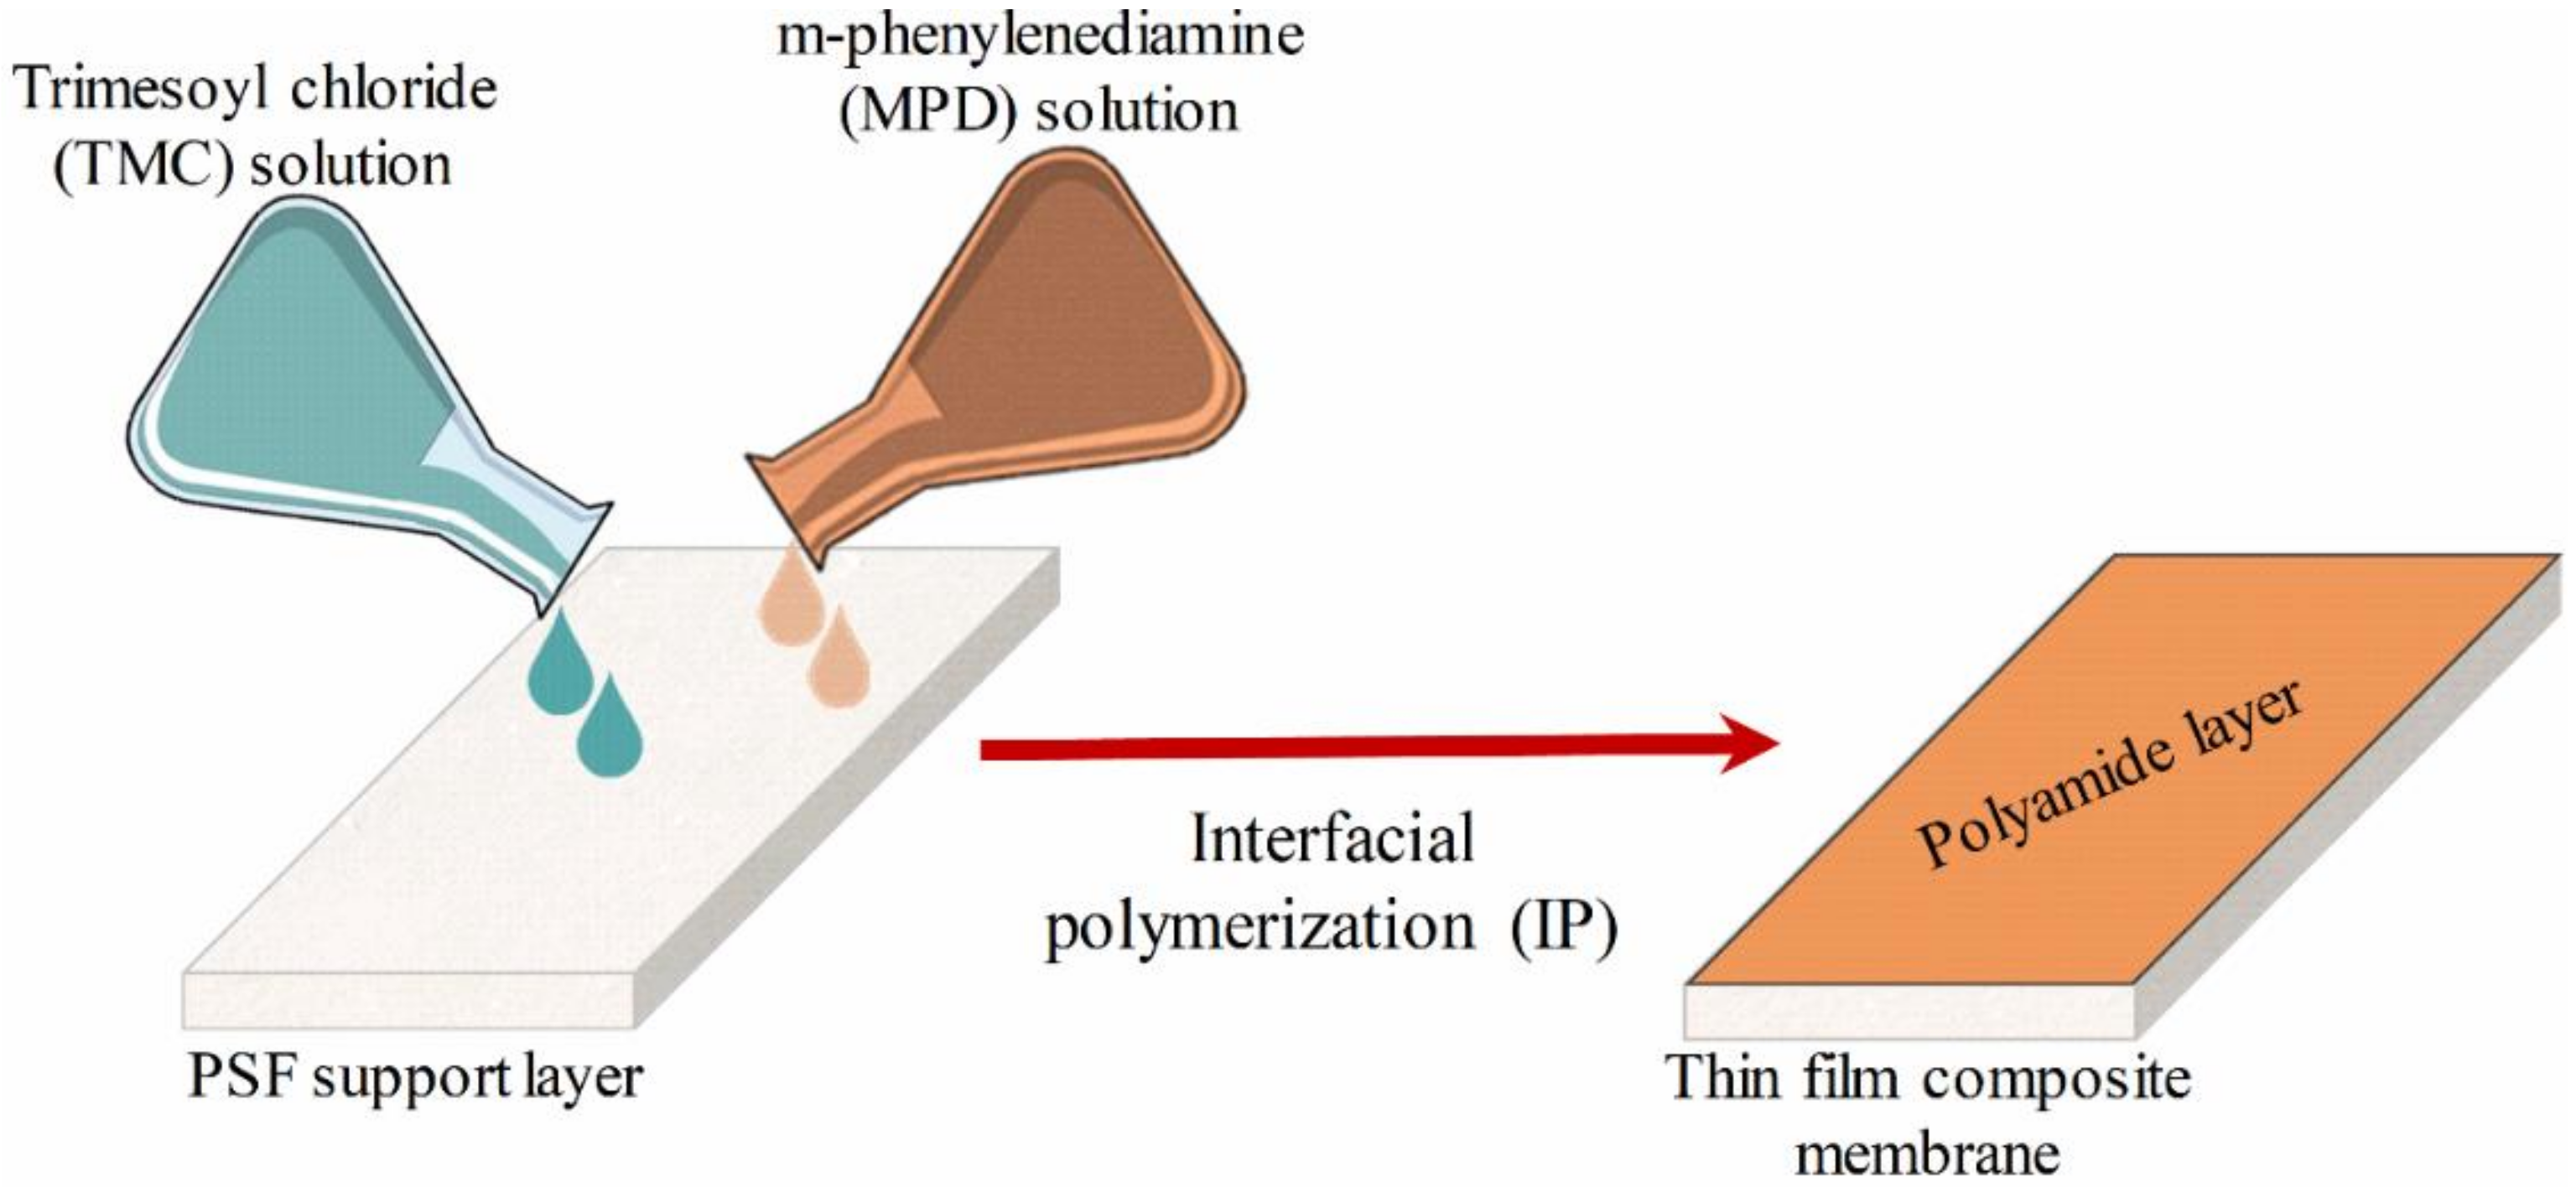
2.2. Fabrication of the Polysulfone (PSF) Support
2.3. Preparation of a Thin Film Composite (TFC) Membrane
2.4. Characterization
2.5. Performance Evaluation of TFC Membrane
3. Optimization Study
3.1. Experimental Design
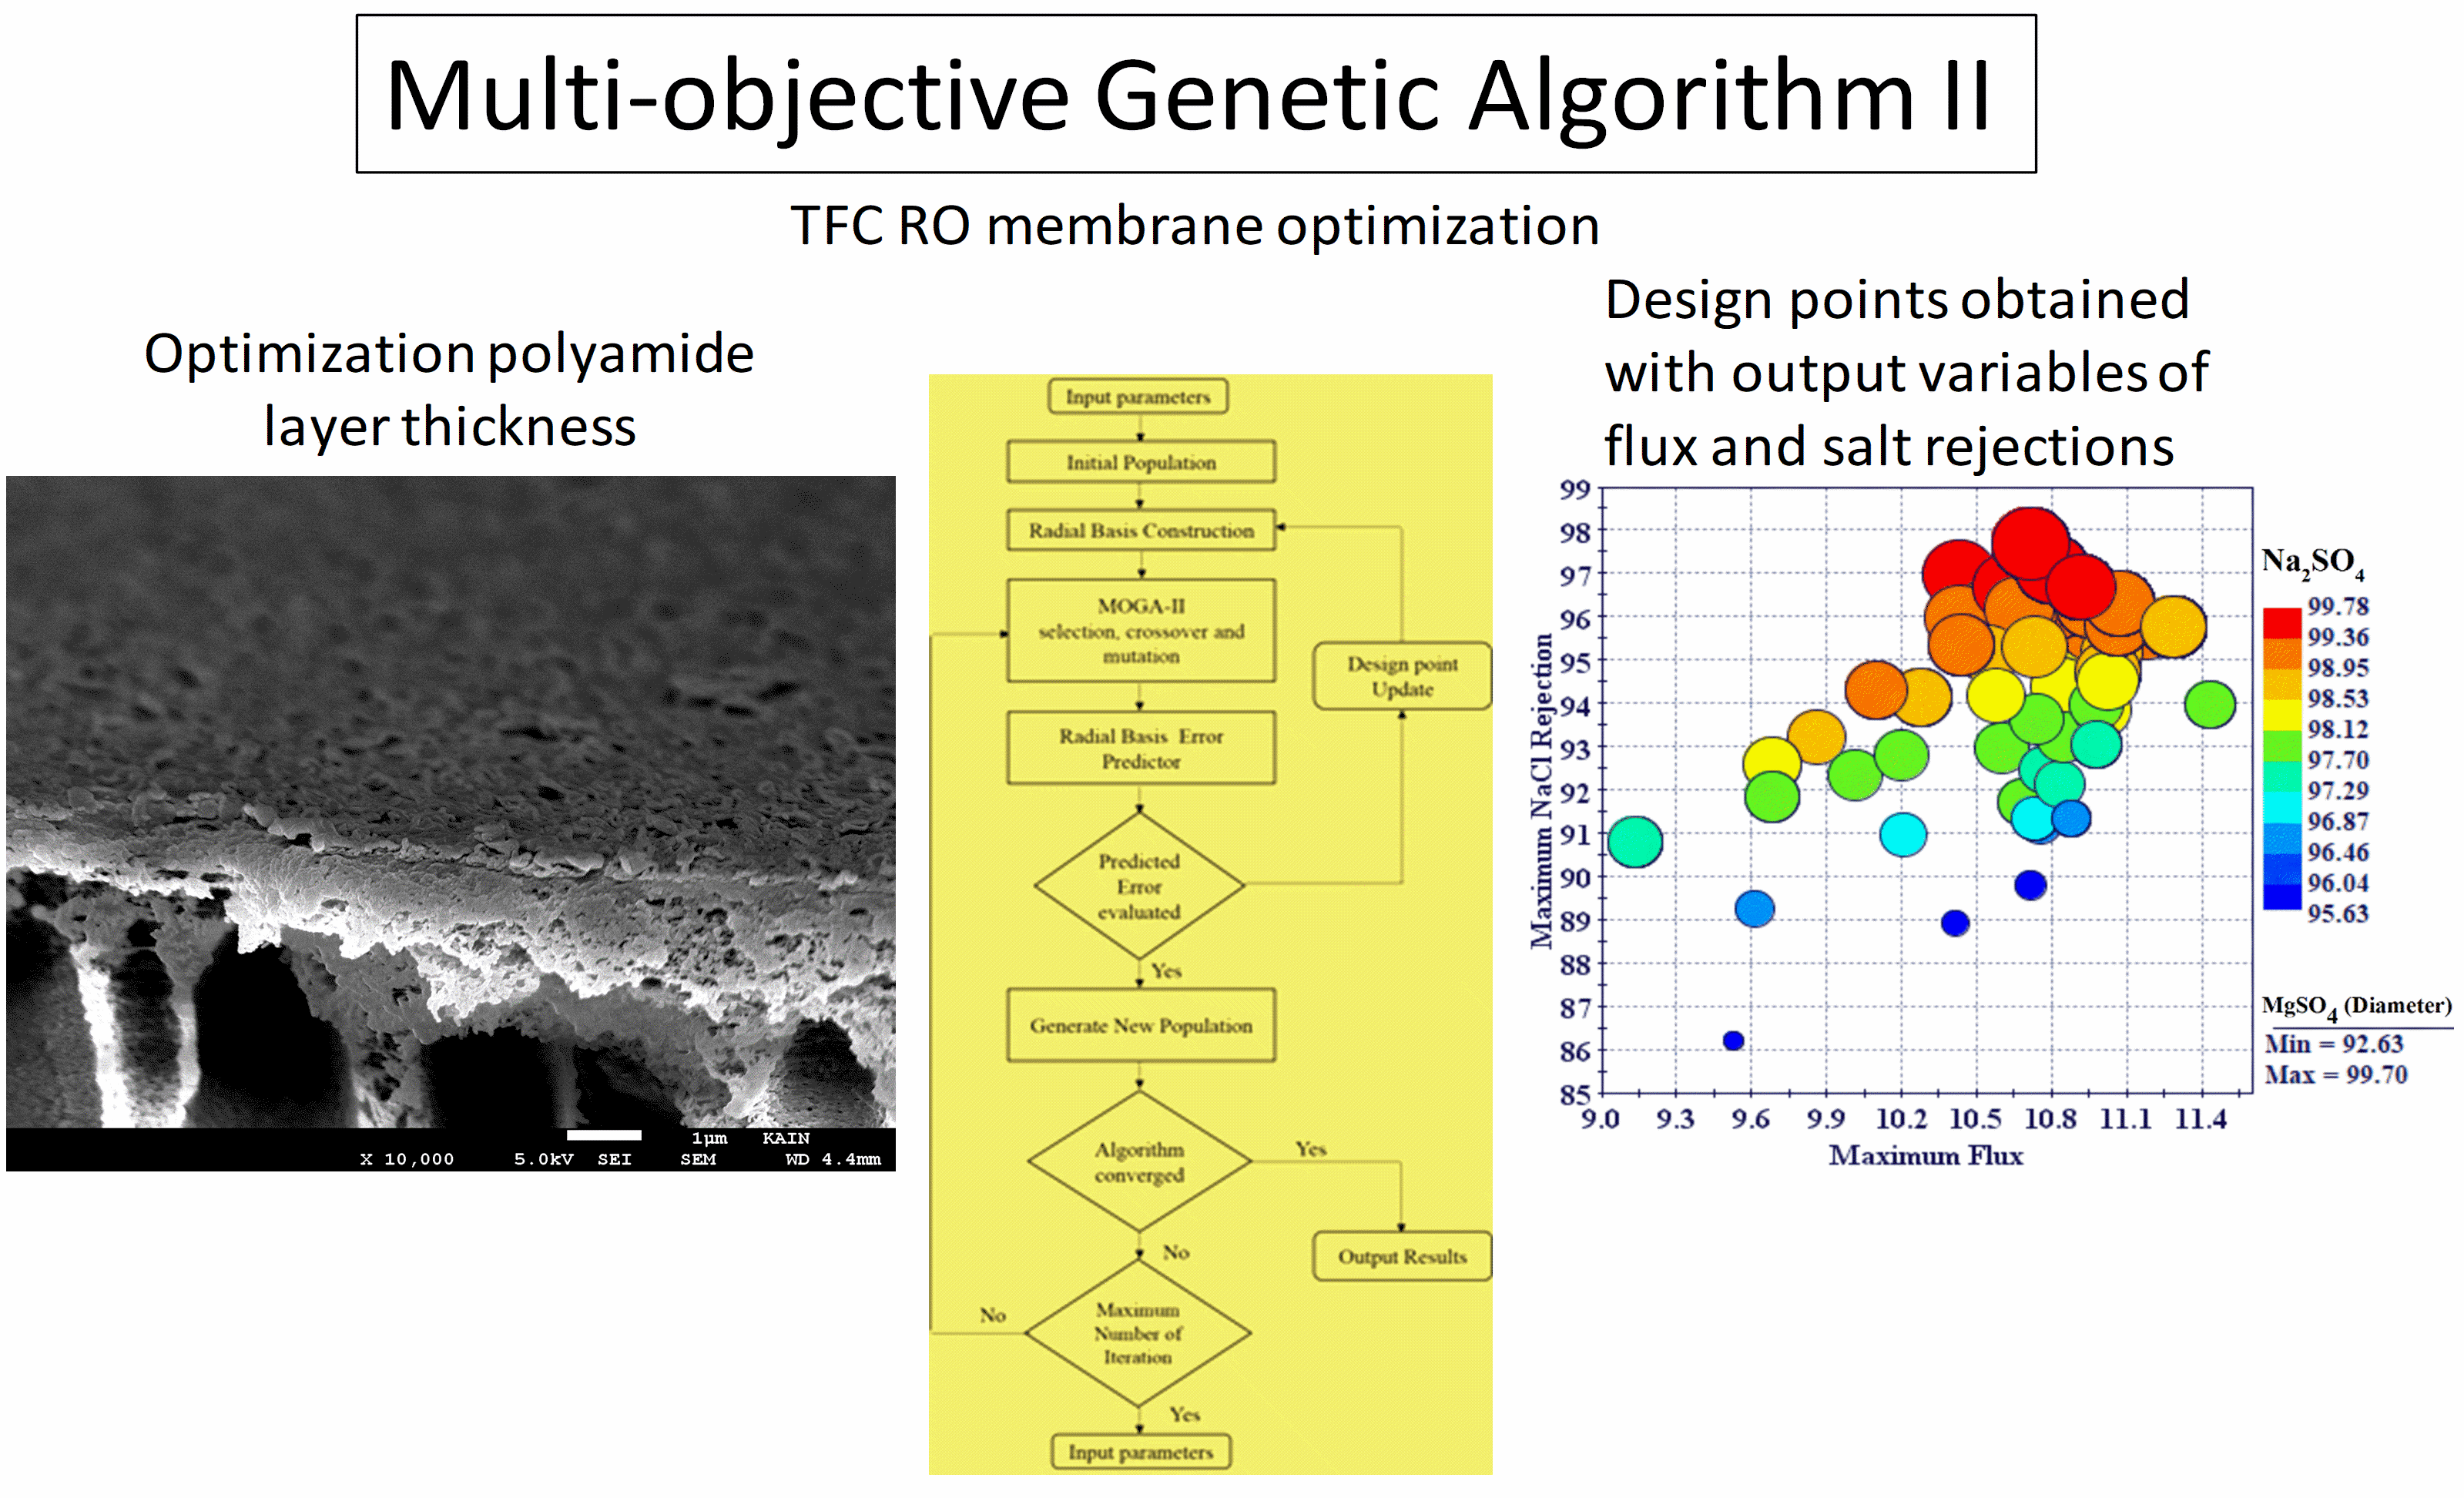
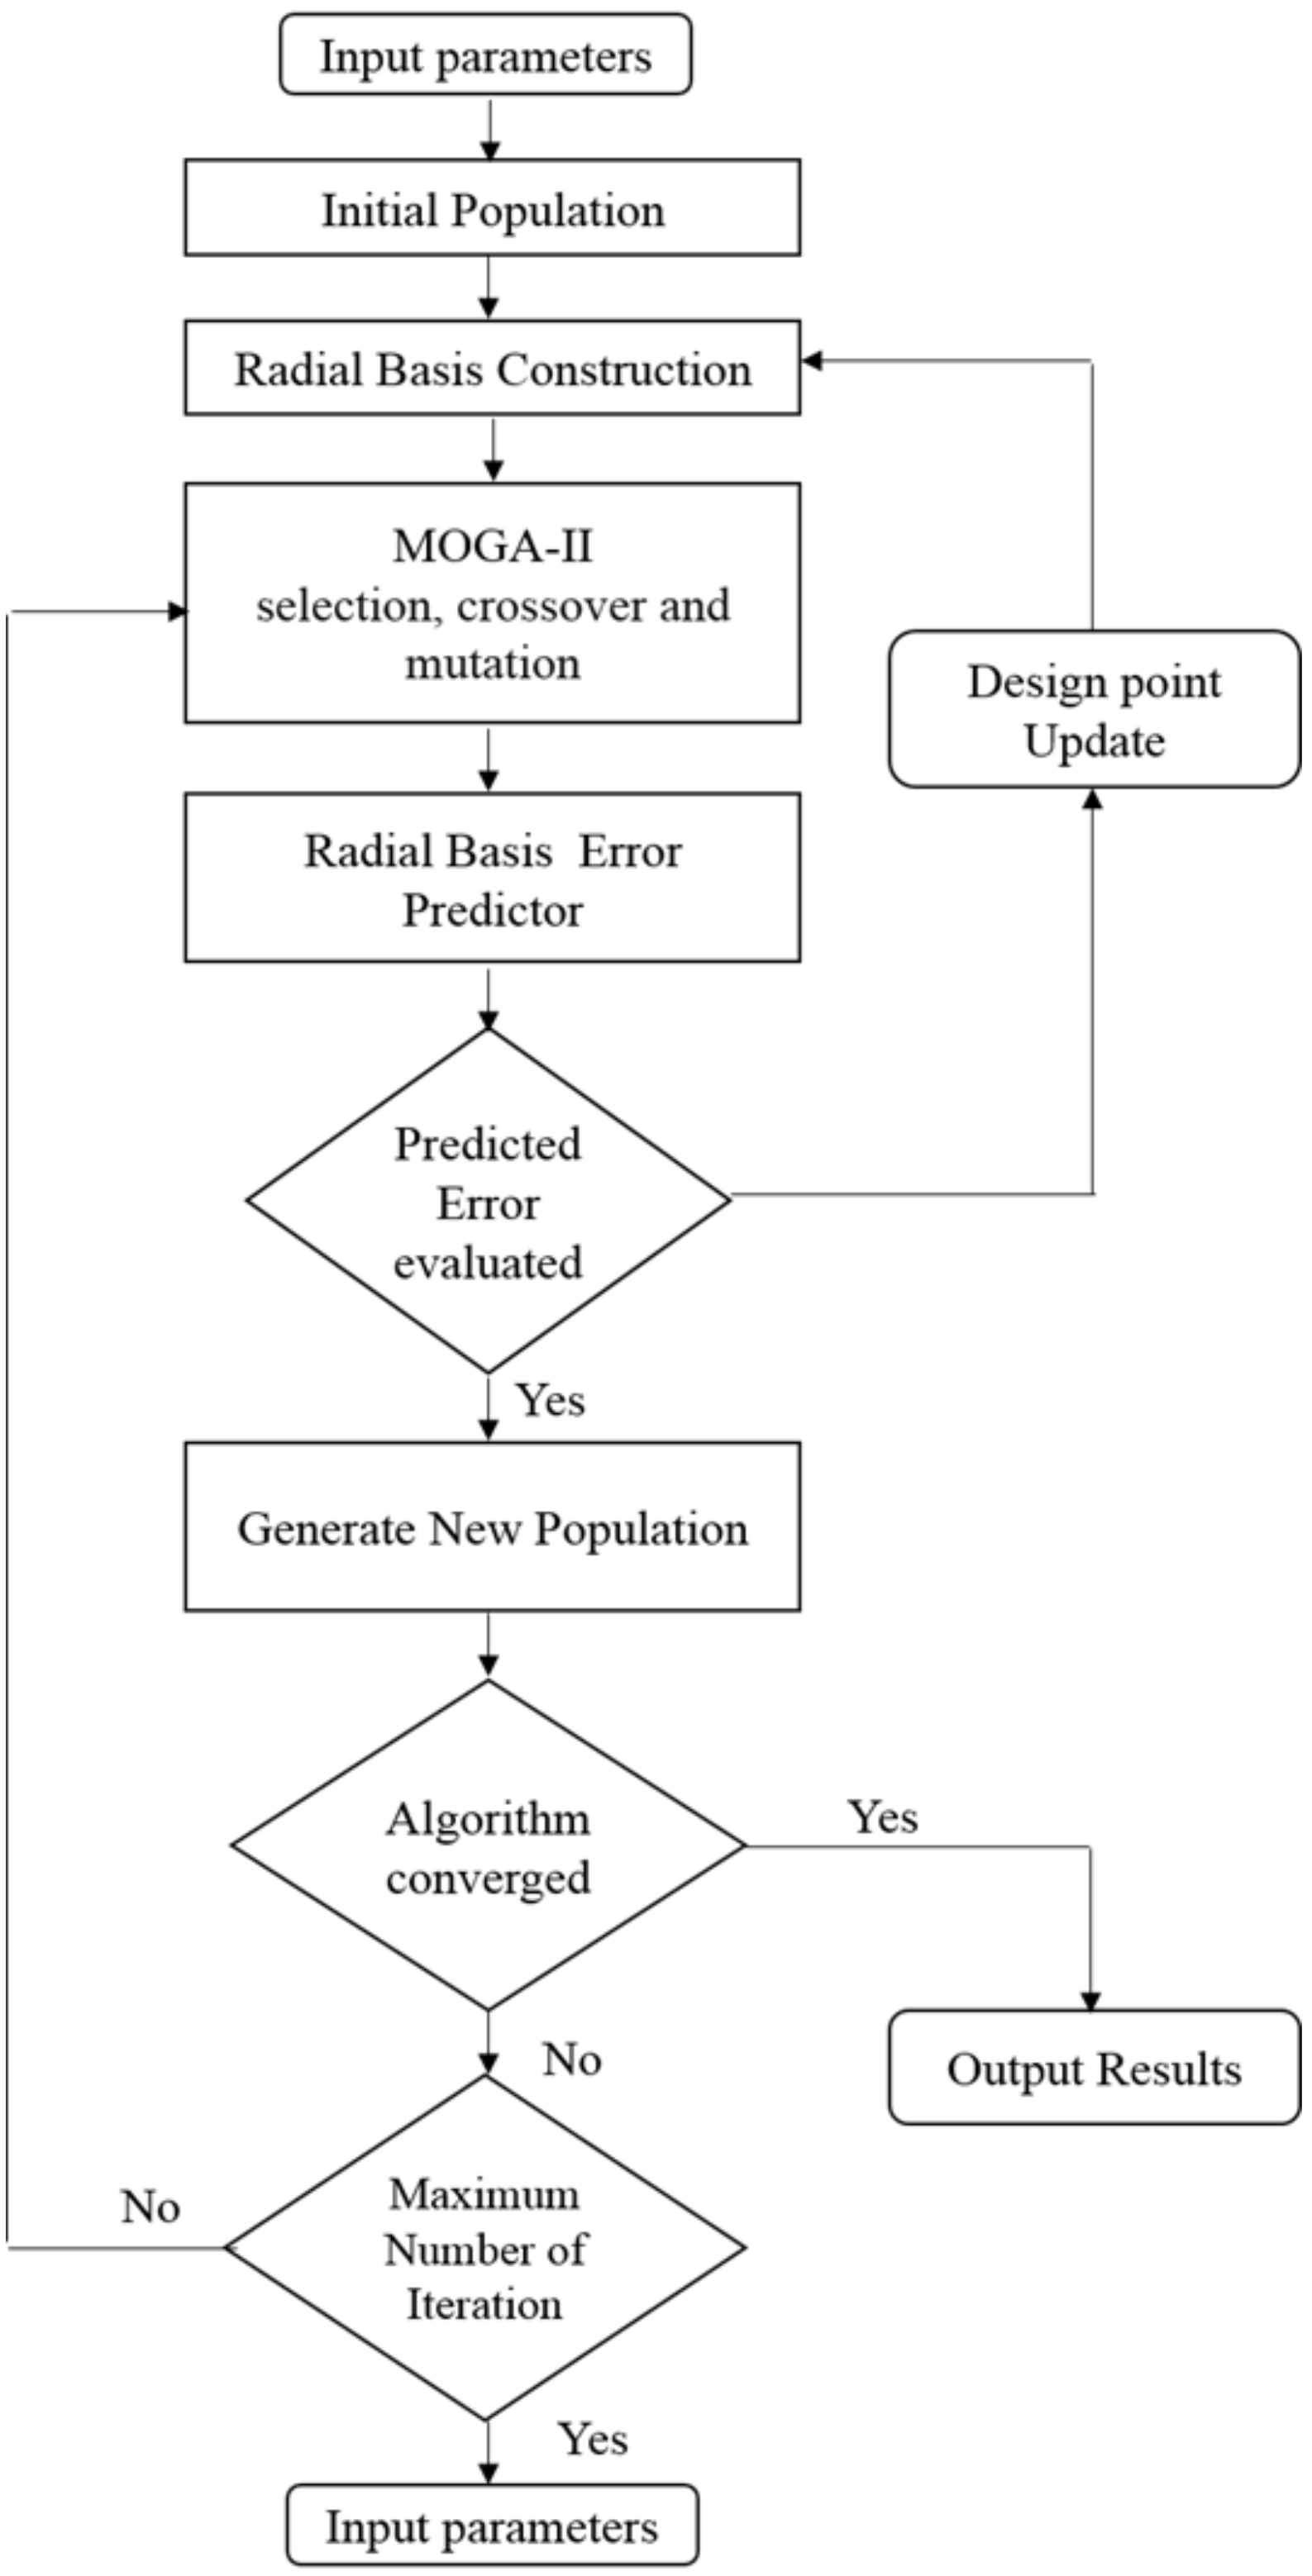
3.2. Multi-Objective Optimization
4. Results and Discussion
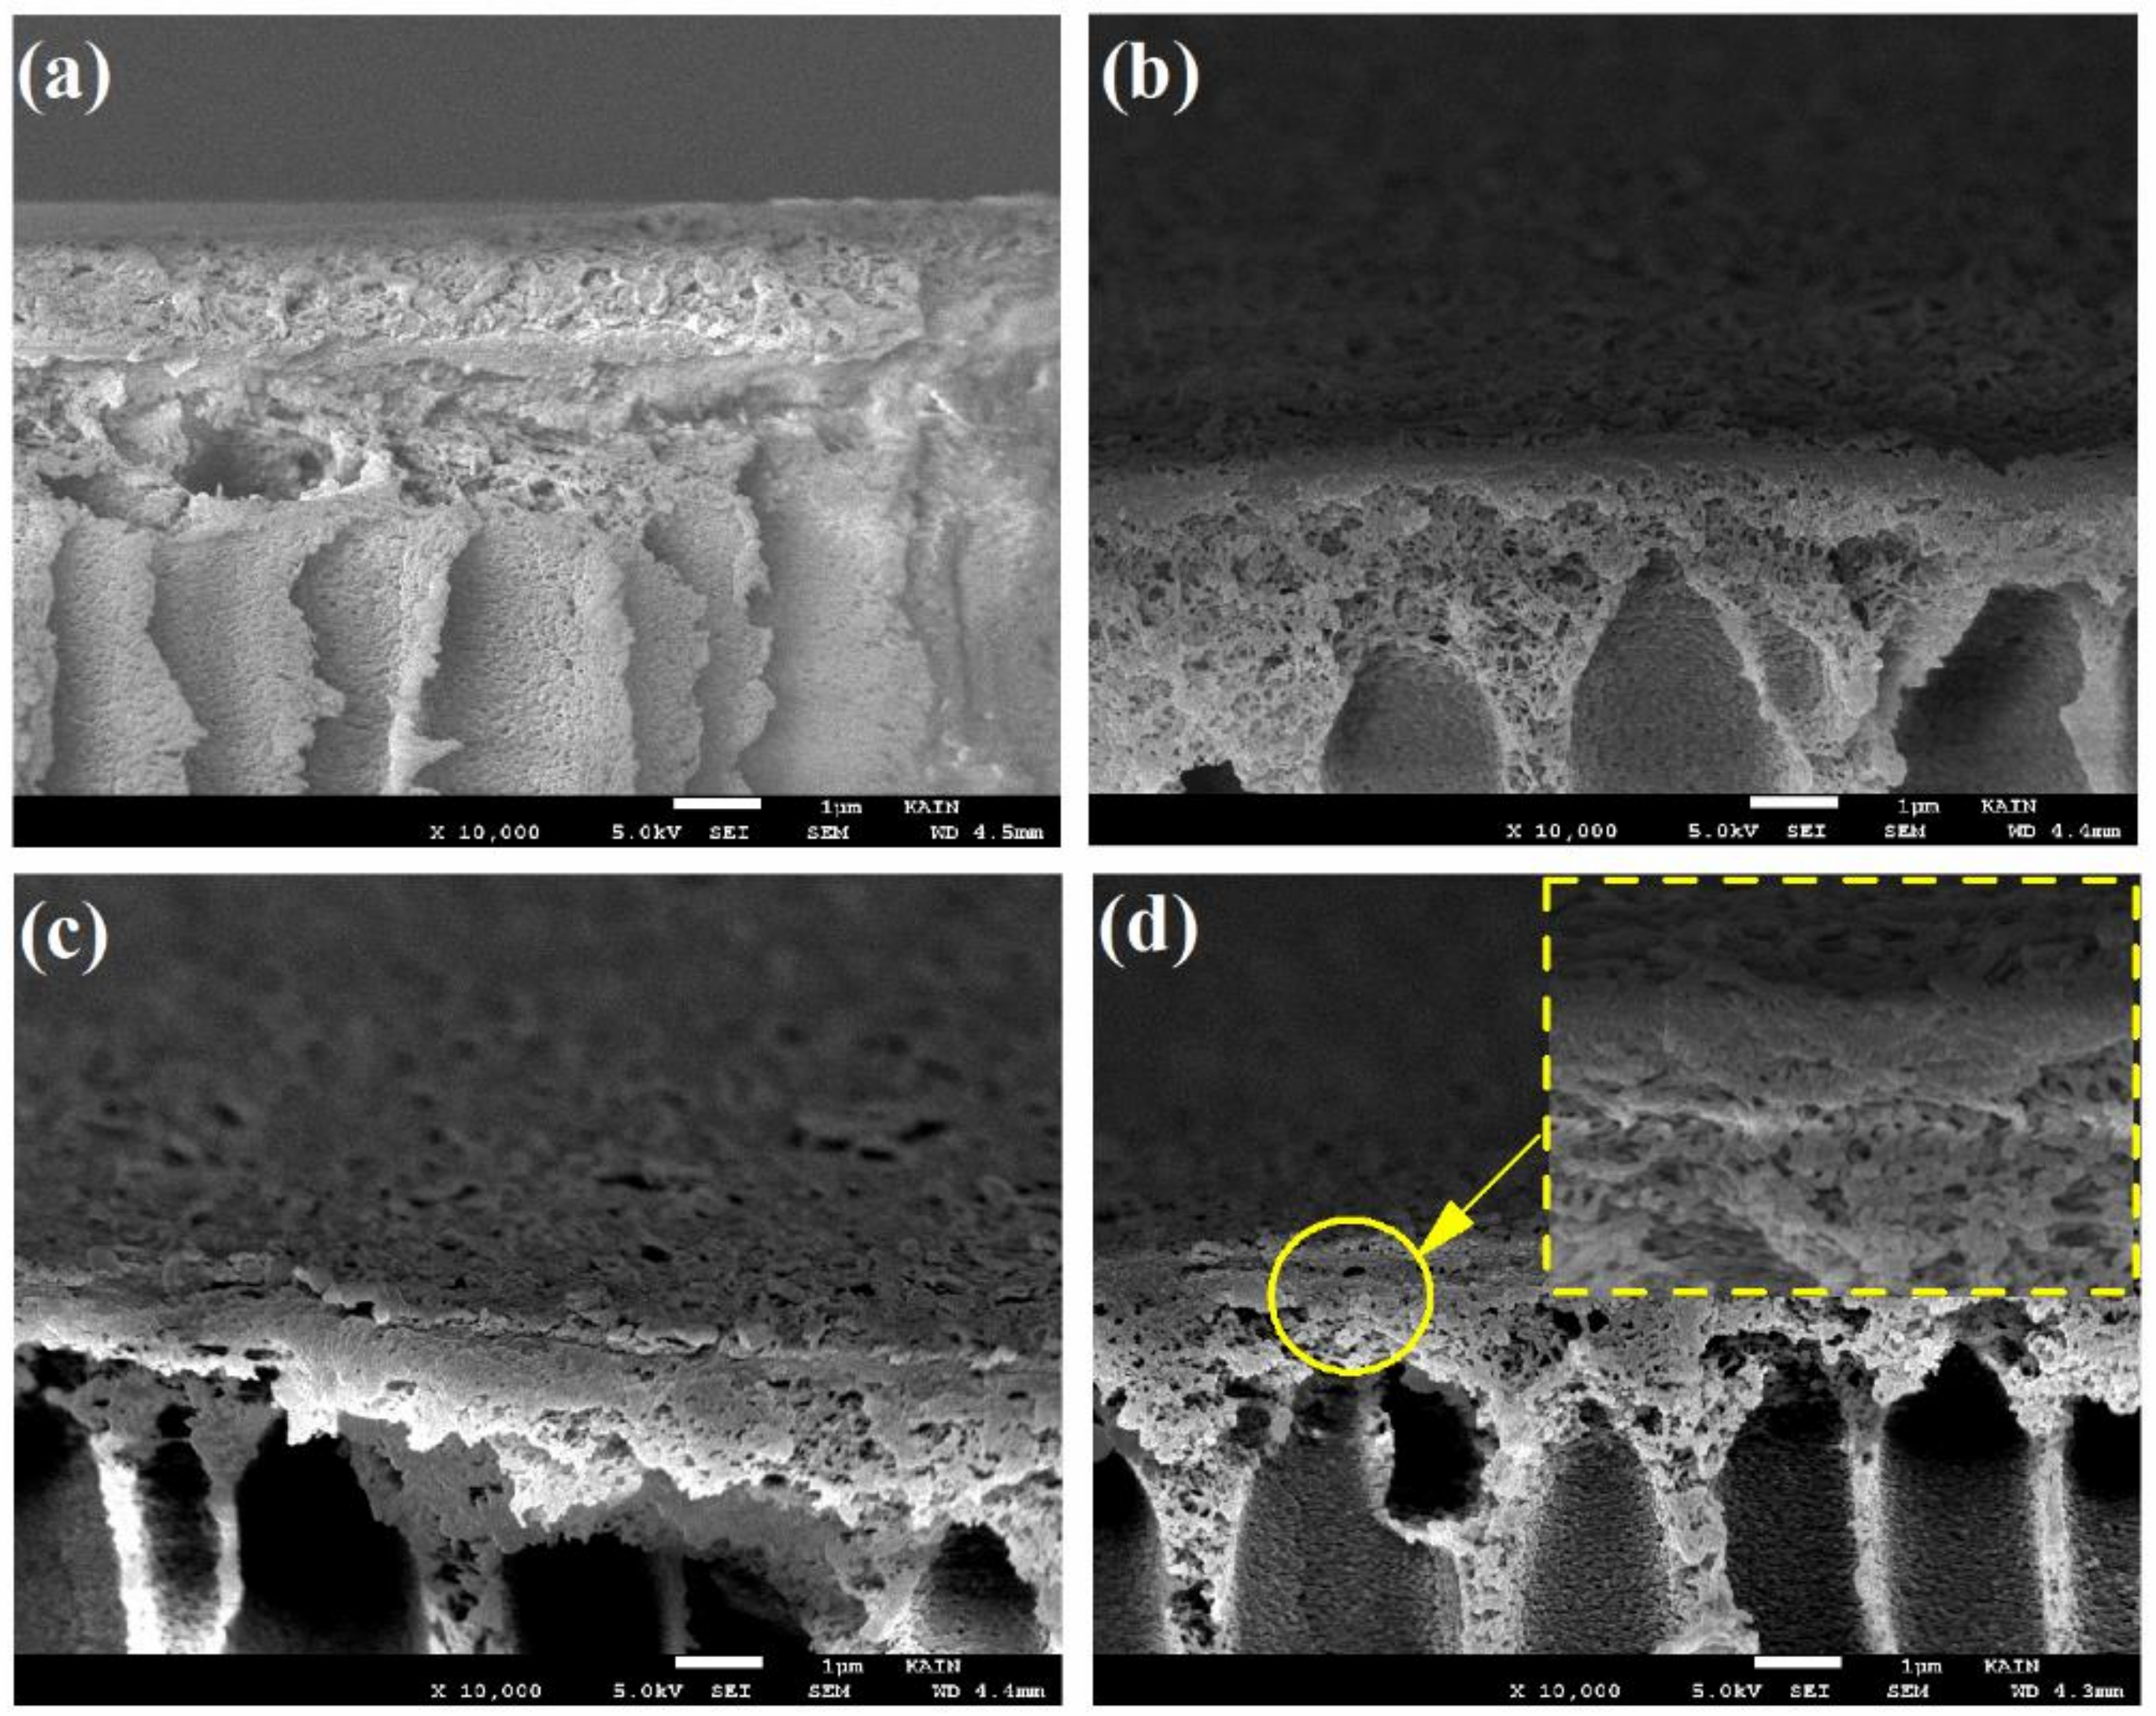
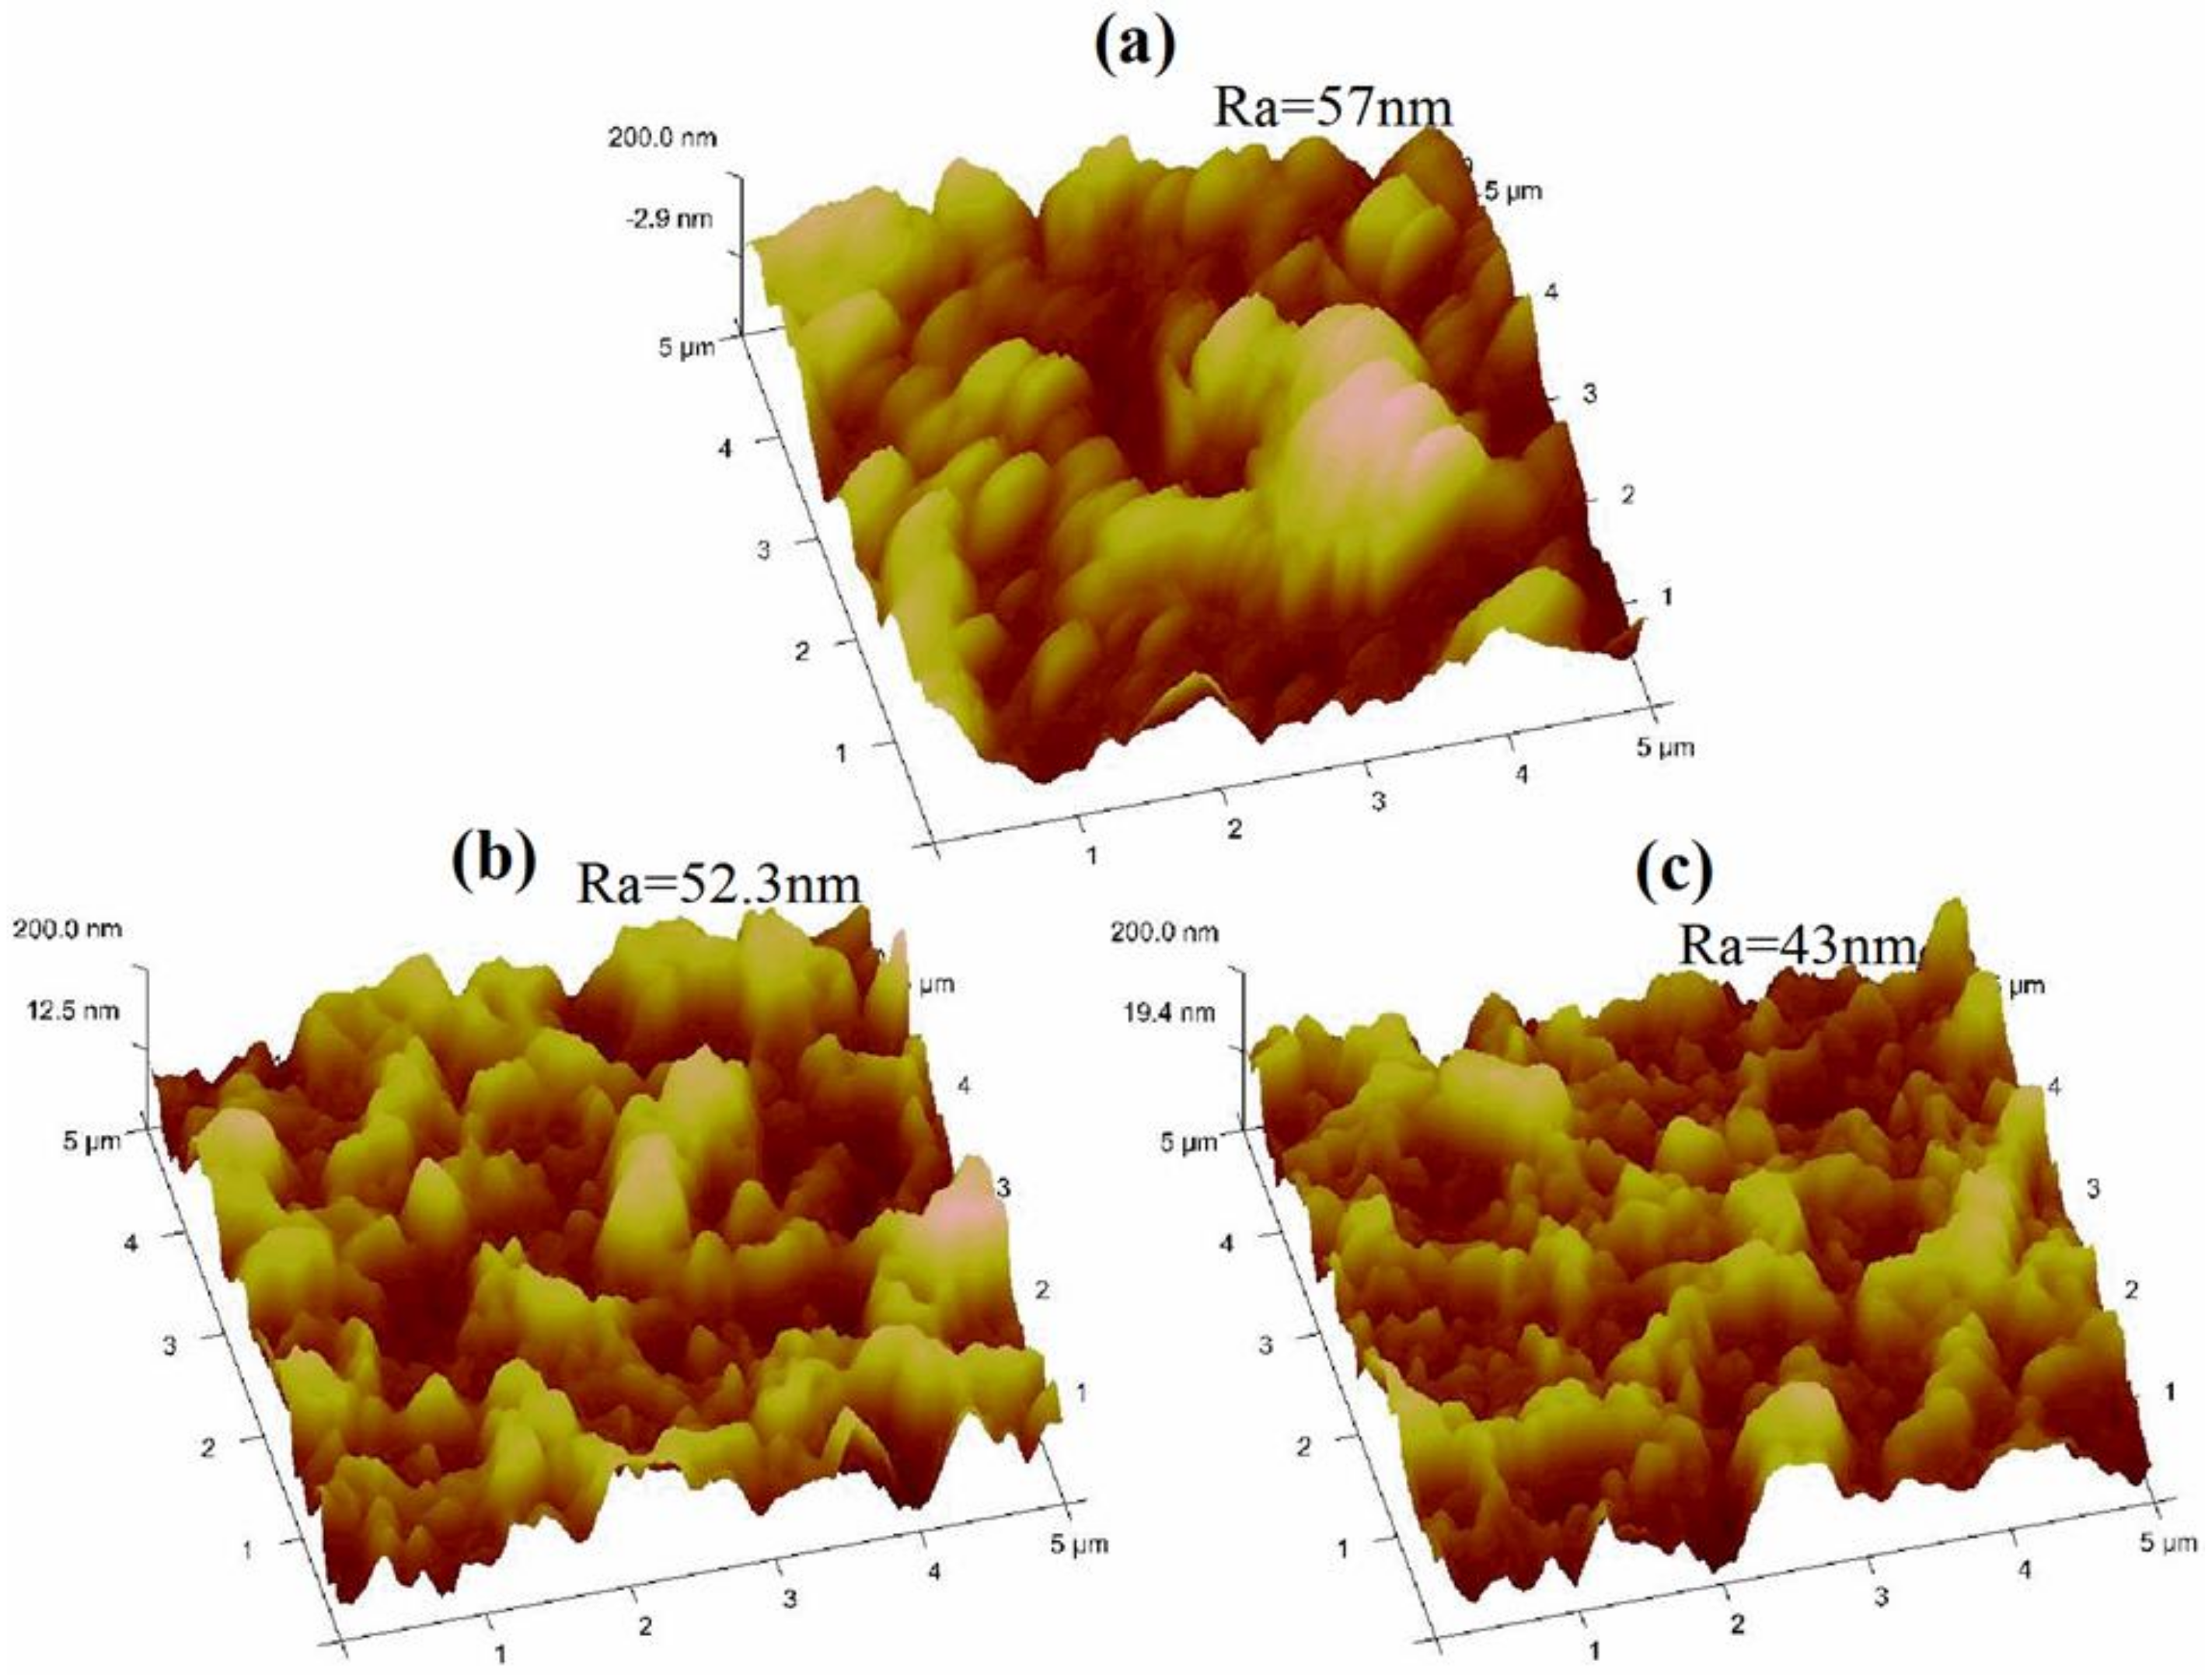
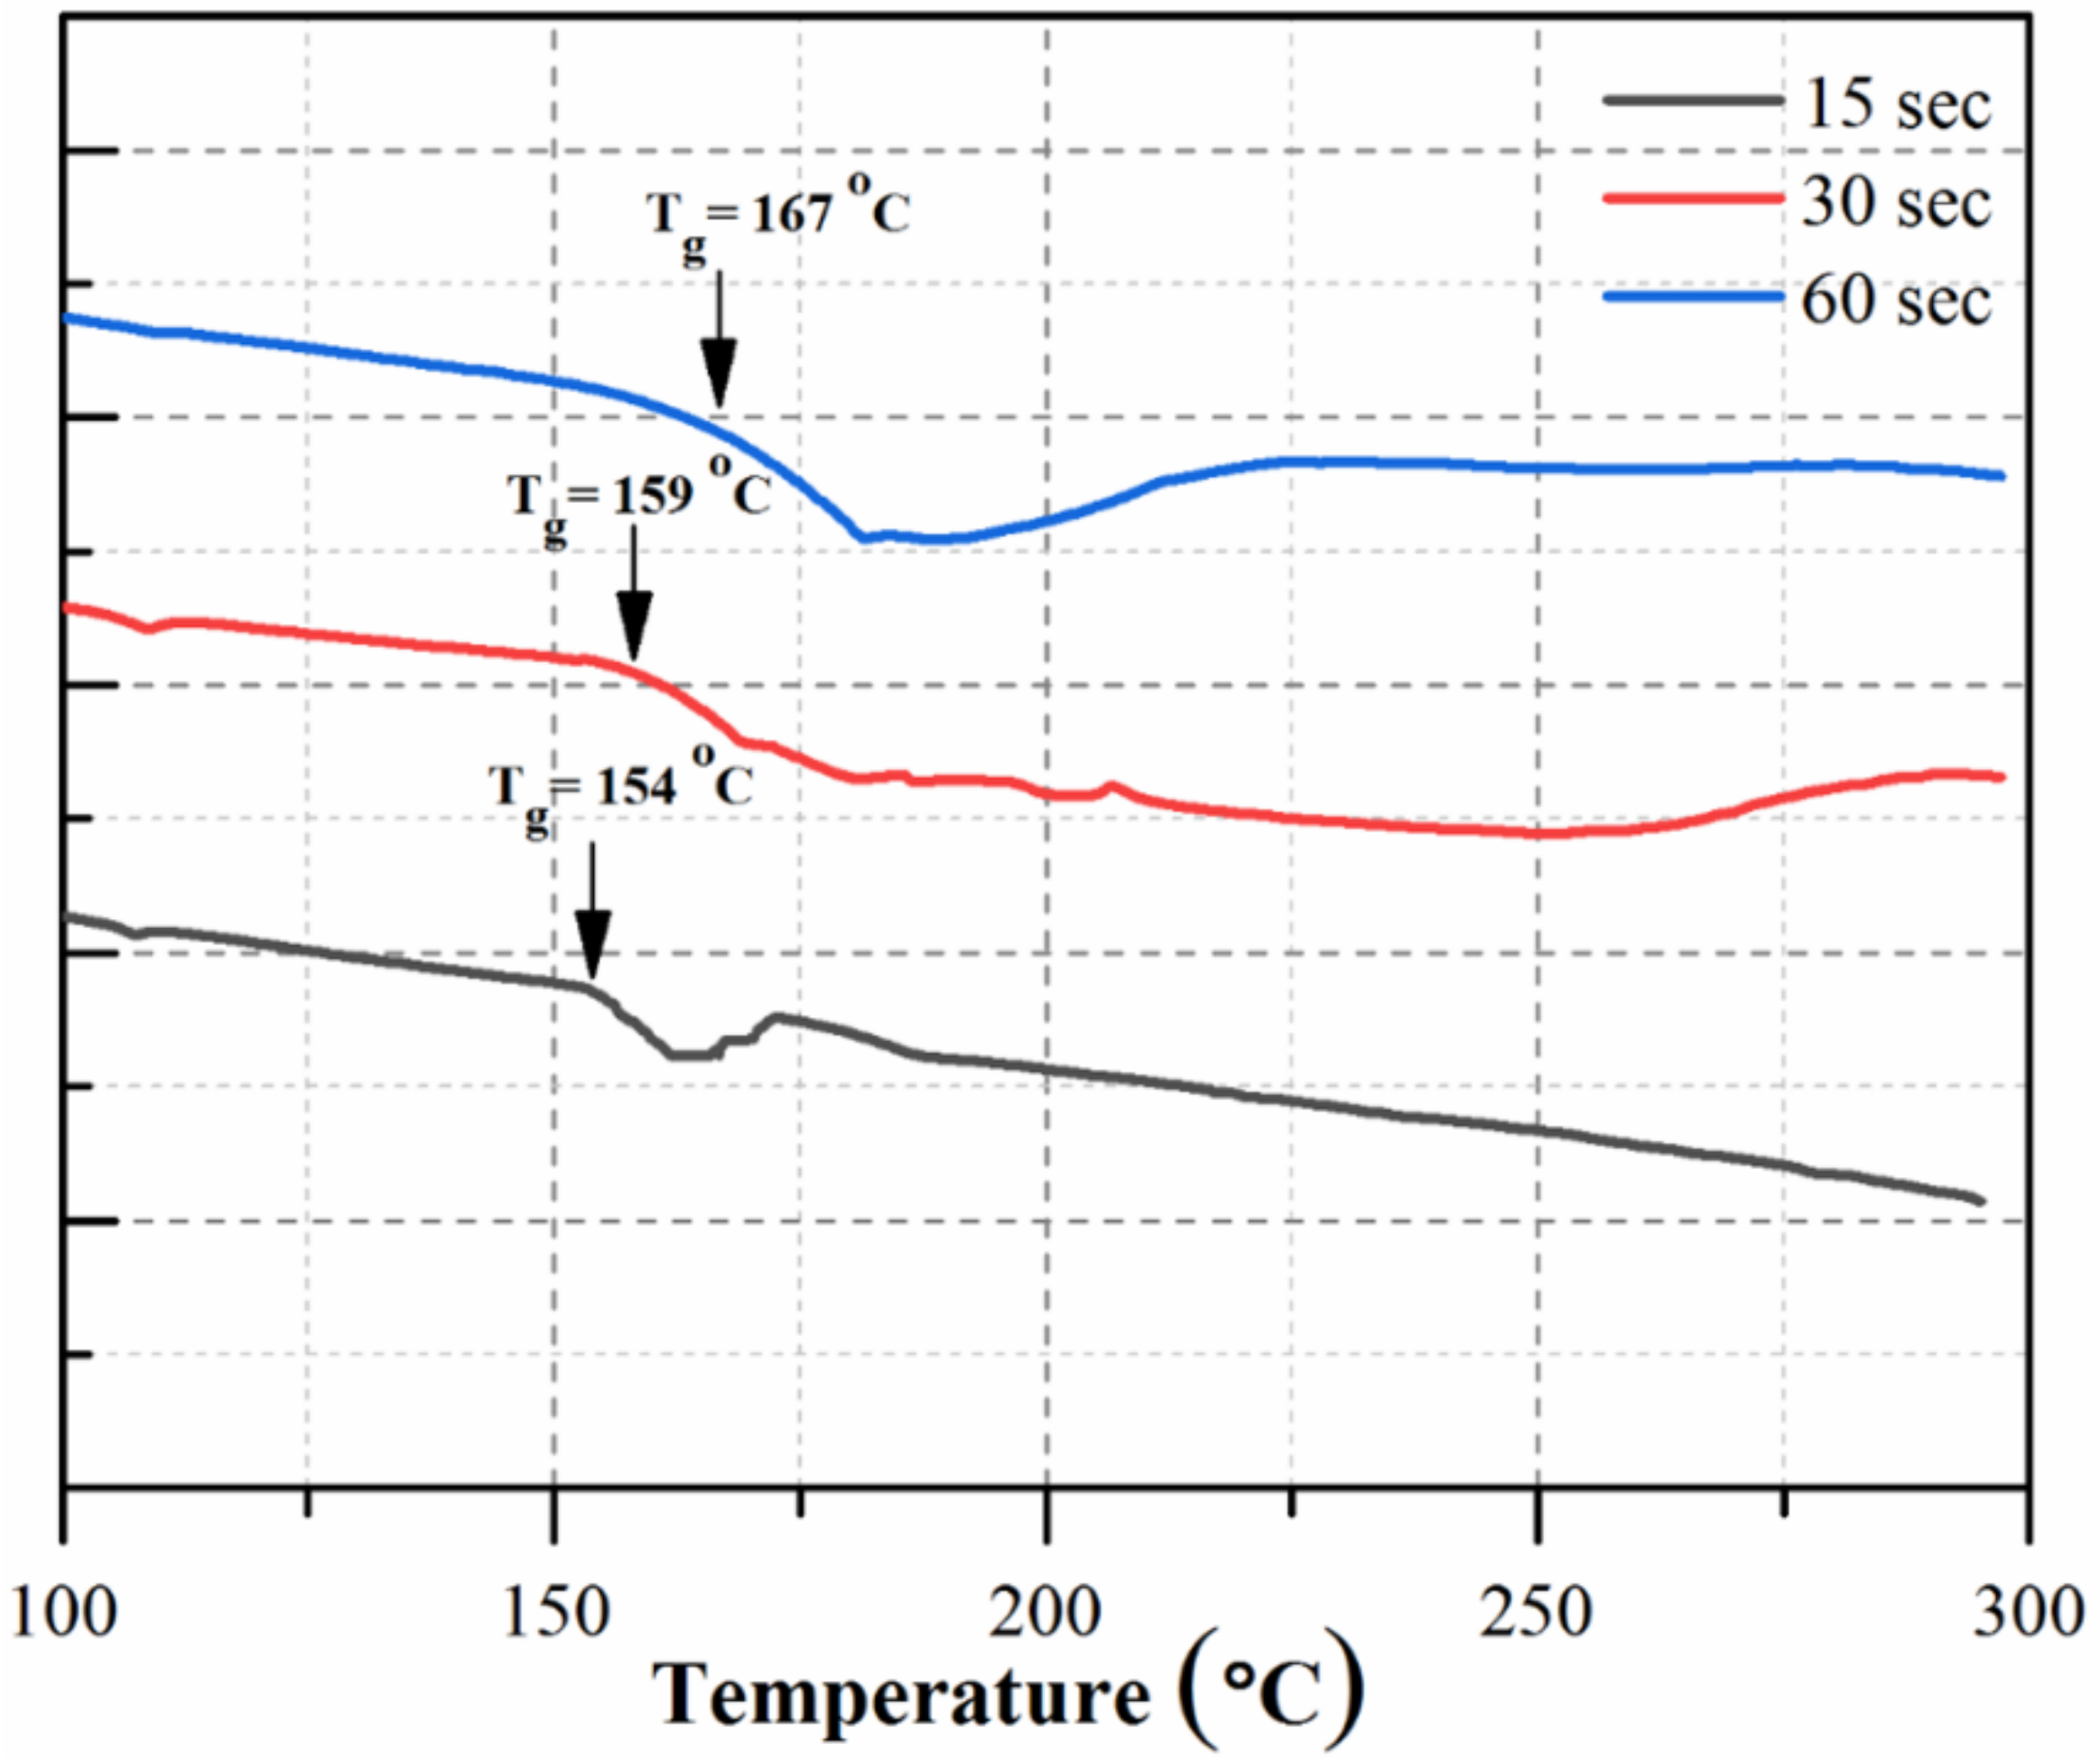
4.1. Thin Film Composite Membrane Morphology
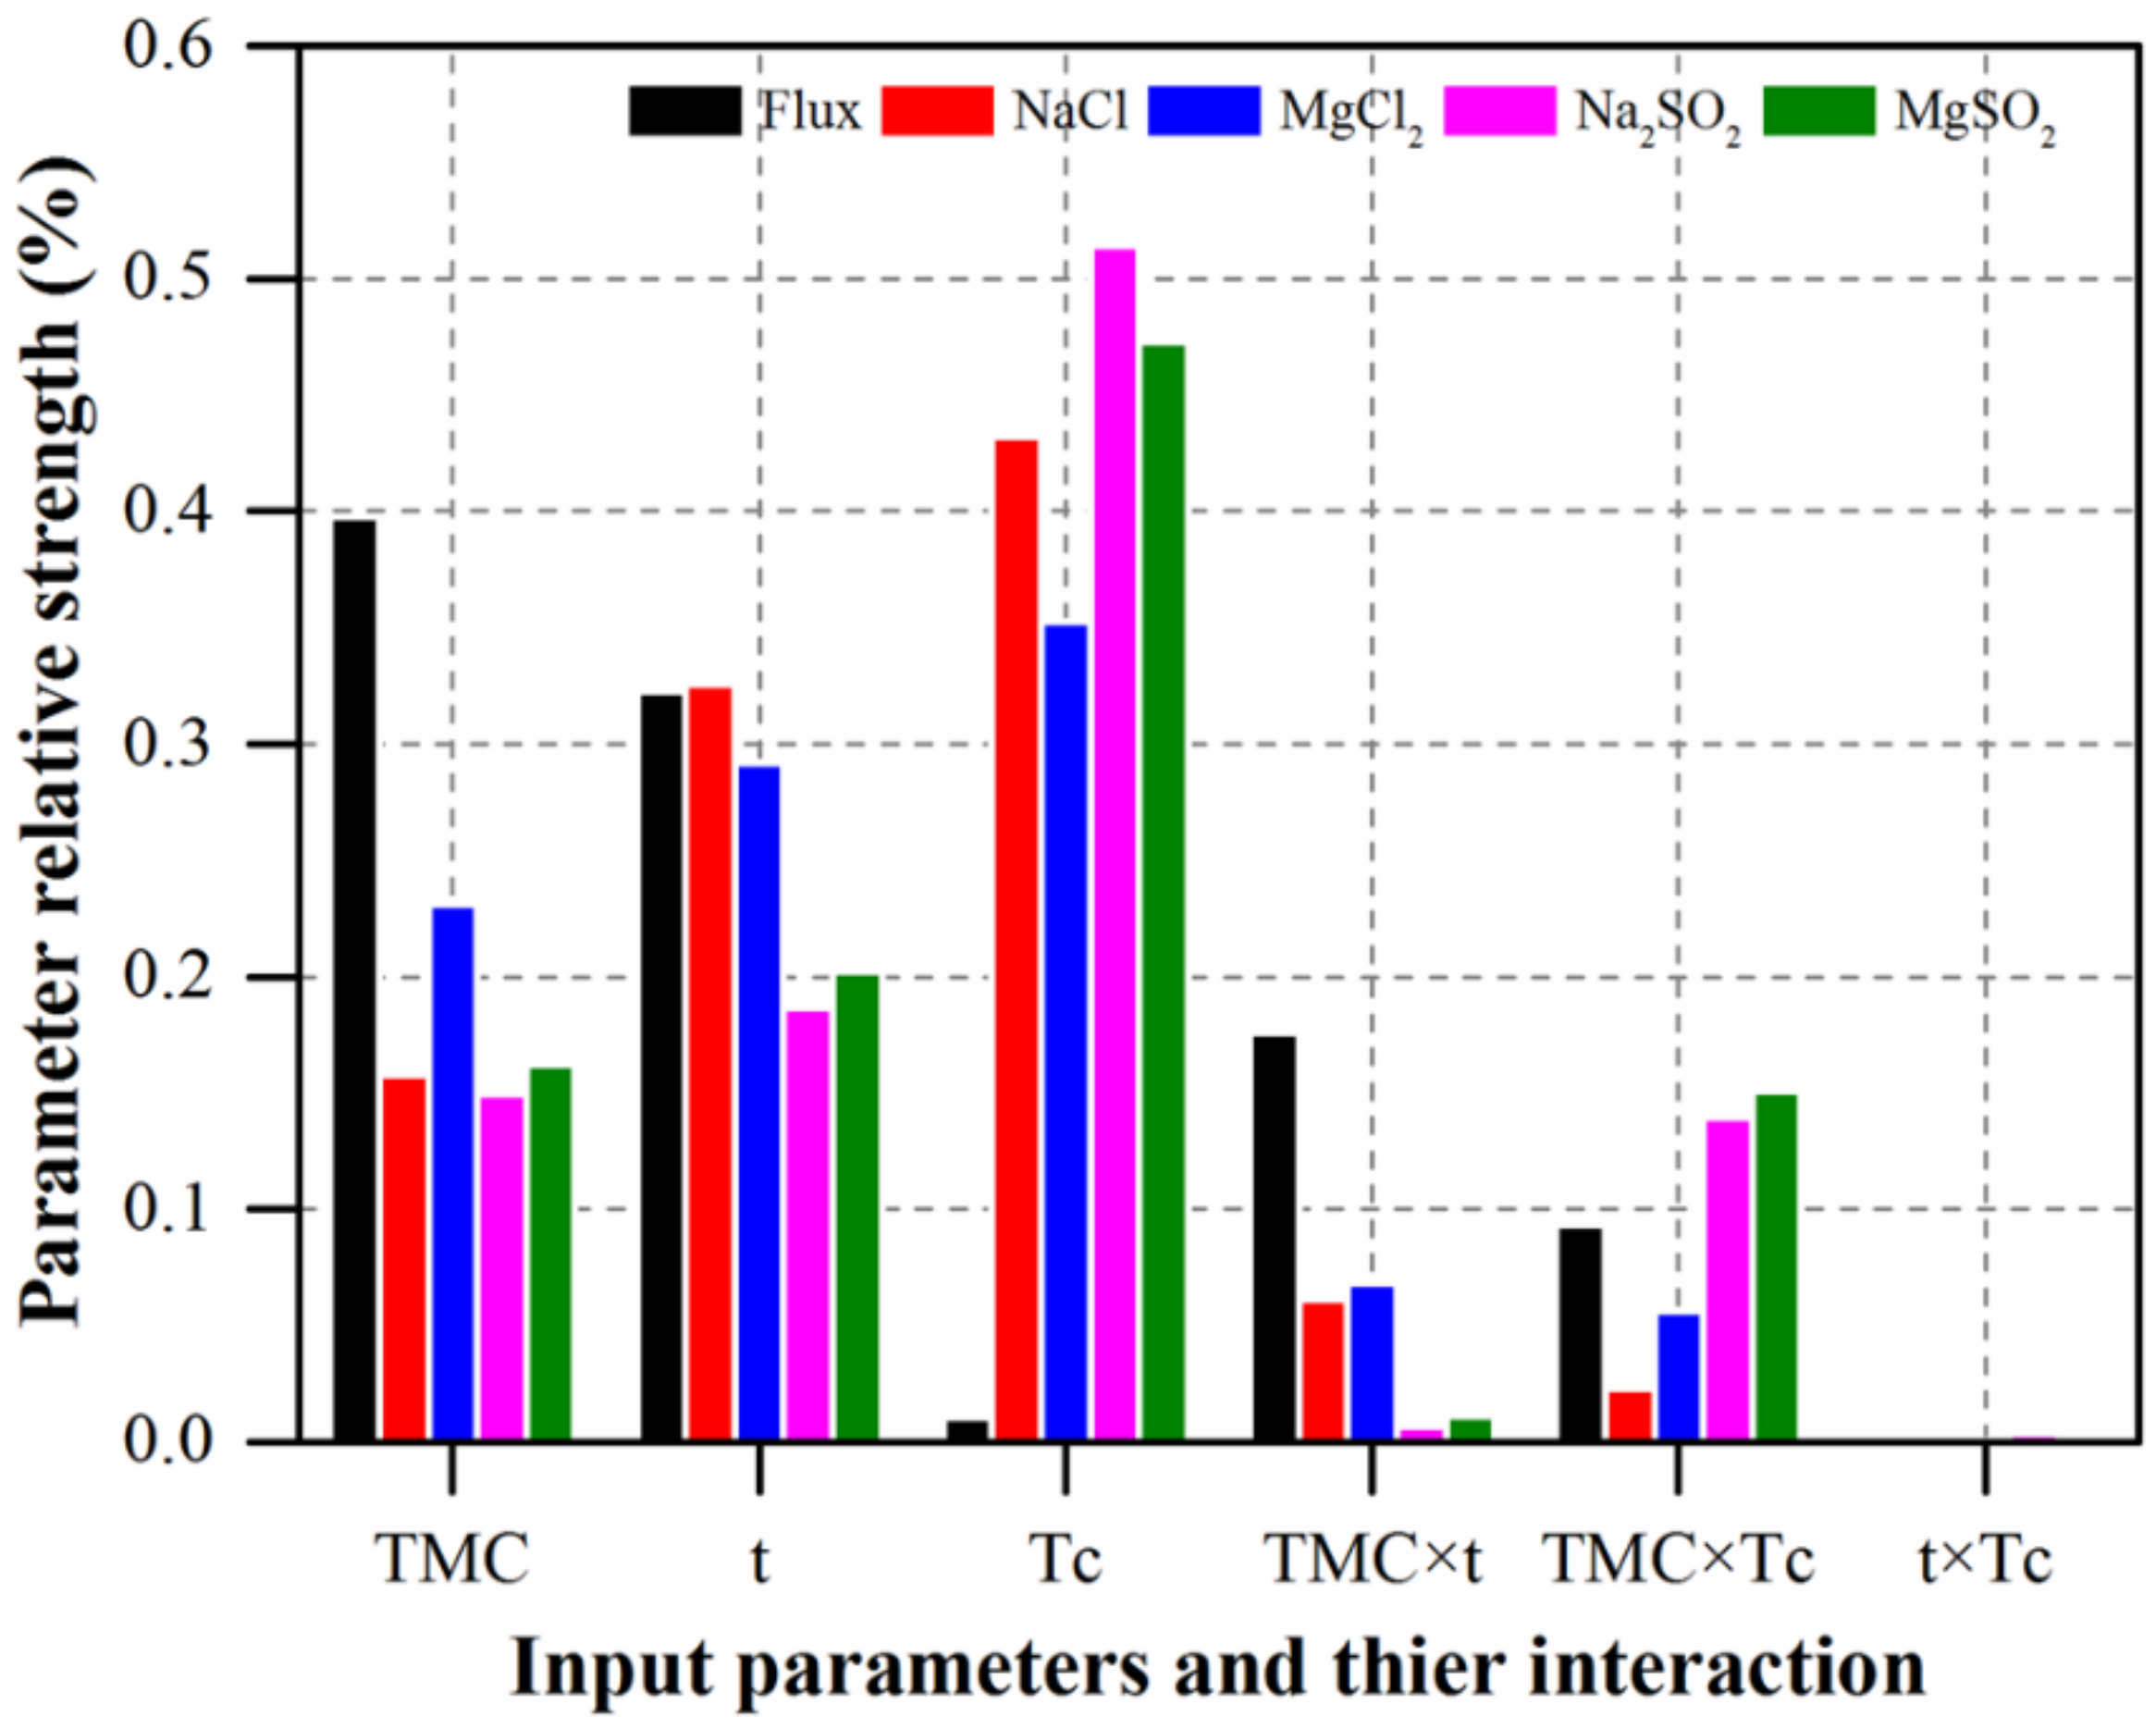
4.2. Analysis of Variance (ANOVA)
4.3. Optimization Study
5. Conclusions
Author Contributions
Funding
Acknowledgments
Conflicts of Interest
References
- Xie, W.; Geise, G.M.; Freeman, B.D.; Lee, H.S.; Byun, G.; McGrath, J.E. Polyamide interfacial composite membranes prepared from m-phenylene diamine, trimesoyl chloride and a new disulfonated diamine. J. Membr. Sci. 2012, 403, 152–161. [Google Scholar] [CrossRef]
- Misdan, N.; Lau, W.J.; Ismail, A.F. Seawater Reverse Osmosis (SWRO) desalination by thin-film composite membrane-Current development, challenges and future prospects. Desalination 2012, 287, 228–237. [Google Scholar] [CrossRef] [Green Version]
- Lee, K.P.; Arnot, T.C.; Mattia, D. A review of reverse osmosis membrane materials for desalination-Development to date and future potential. J. Membr. Sci. 2011, 370, 1–22. [Google Scholar] [CrossRef] [Green Version]
- Ba, C.; Langer, J.; Economy, J. Chemical modification of P84 copolyimide membranes by polyethylenimine for nanofiltration. J. Memb. Sci. 2009, 327, 49–58. [Google Scholar] [CrossRef]
- Petersen, R.J. Composite reverse osmosis and nanofiltration membranes. J. Membr. Sci. 1993, 83, 81–150. [Google Scholar] [CrossRef]
- Zimmermann, R. Condensation Polymers: By Interfacial and Solution Methods. Von PW Morgan. John Wiley & Sons, New York London-Sydney 1965. 1. Aufl., XVIII, 561 S., zahlr. Abb., mehrere Tab., geb.£ 9.10.–. Angew. Chem. 1966, 78, 787. [Google Scholar]
- Thong, Z.; Han, G.; Cui, Y.; Gao, J.; Chung, T.S.; Chan, S.Y.; Wei, S. Novel nanofiltration membranes consisting of a sulfonated pentablock copolymer rejection layer for heavy metal removal. Environ. Sci. Technol. 2014, 48, 13880–13887. [Google Scholar] [CrossRef]
- Fane, A.G.; Wang, R.; Hu, M.X. Synthetic membranes for water purification: Status and future. Angew. Chem. Int. Ed. 2015, 54, 3368–3386. [Google Scholar] [CrossRef]
- Cho, Y.H.; Kim, H.W.; Nam, S.Y.; Park, H.B. Fouling-tolerant polysulfone-poly (ethylene oxide) random copolymer ultrafiltration membranes. J. Membr. Sci. 2011, 379, 296–306. [Google Scholar] [CrossRef]
- Li, Y.; Zhang, L.; Li, C. Highly transparent and scratch resistant polysiloxane coatings containing silica nanoparticles. J. Colloid Interface Sci. 2020, 559, 273–281. [Google Scholar] [CrossRef]
- Liu, M.; Yu, S.; Tao, J.; Gao, C. Preparation, structure characteristics and separation properties of thin-film composite polyamide-urethane seawater reverse osmosis membrane. J. Membr. Sci. 2008, 325, 947–956. [Google Scholar] [CrossRef]
- Namvar-Mahboub, M.; Pakizeh, M. Optimization of preparation conditions of polyamide thin film composite membrane for organic solvent nanofiltration. Korean J. Chem. Eng. 2014, 31, 327–337. [Google Scholar] [CrossRef]
- Soroush, A.; Barzin, J.; Barikani, M.; Fathizadeh, M. Interfacially polymerized polyamide thin film composite membranes: Preparation, characterization and performance evaluation. Desalination 2012, 287, 310–316. [Google Scholar] [CrossRef]
- Shao, L.; Cheng, X.; Wang, Z.; Ma, J.; Guo, Z. Tuning the performance of polypyrrole-based solvent-resistant composite nanofiltration membranes by optimizing polymerization conditions and incorporating graphene oxide. J. Membr. Sci. 2014, 452, 82–89. [Google Scholar] [CrossRef]
- Ba, D.; Boyaci, I.H. Modeling and optimization i: Usability of response surface methodology. J. Food Eng. 2007, 78, 836–845. [Google Scholar]
- Myers, R.H.; Montgomery, D.C. Response Surface Methodology: Process and Product Optimization Using Designed Experiments; Wiley: Hoboken, NJ, USA, 1995; Volume 3, ISBN 9781118916018. [Google Scholar]
- Gohil, J.M.; Suresh, A.K. Development of high flux thin-film composite membrane for water desalination: A statistical study using response surface methodology. Desalin. Water Treat. 2014, 52, 5219–5228. [Google Scholar] [CrossRef]
- Mah, K.H.; Yussof, H.W.; Abu Seman, M.N.; Mohammad, A.W. Optimisation of interfacial polymerization factors in thin-film composite (TFC) polyester nanofiltration (NF) membrane for separation of xylose from glucose. Sep. Purif. Technol. 2019, 209, 211–222. [Google Scholar] [CrossRef]
- Yousefi, N.; Nabizadeh, R.; Nasseri, S.; Khoobi, M.; Nazmara, S.; Mahvi, A.H. Optimization of the synthesis and operational parameters for NOM removal with response surface methodology during nano-composite membrane filtration. Water Sci. Technol. 2018, 77, 1558–1569. [Google Scholar] [CrossRef] [Green Version]
- Rigoni, E. MOSA Multi Objective Simulated Annealing; Esteco: Trieste, Italy, 2003. [Google Scholar]
- Esteco ModeFRONTIER Software; Esteco: Trieste, Italy, 2012.
- Ganjehkaviri, A.; Mohd Jaafar, M.N.; Hosseini, S.E.; Barzegaravval, H. Genetic algorithm for optimization of energy systems: Solution uniqueness, accuracy, Pareto convergence and dimension reduction. Energy 2017, 119, 167–177. [Google Scholar] [CrossRef]
- Ghosh, A.K.; Jeong, B.H.; Huang, X.; Hoek, E.M.V. Impacts of reaction and curing conditions on polyamide composite reverse osmosis membrane properties. J. Membr. Sci. 2008, 311, 34–45. [Google Scholar] [CrossRef]
- Khorshidi, B.; Thundat, T.; Fleck, B.A.; Sadrzadeh, M. Thin film composite polyamide membranes: Parametric study on the influence of synthesis conditions. RSC Adv. 2015, 5, 54985–54997. [Google Scholar] [CrossRef] [Green Version]
- Khorshidi, B.; Thundat, T.; Fleck, B.A.; Sadrzadeh, M. A novel approach toward fabrication of high performance thin film composite polyamide membranes. Sci. Rep. 2016, 6, 22069. [Google Scholar] [CrossRef] [PubMed] [Green Version]
- Sagbas, A.; Kahraman, F.; Esme, U. Modeling and Predicting Abrasive Wear Behaviour of Poly Oxy Methylenes Using. Metalurgija 2009, 48, 117–120. [Google Scholar]
- McDonald, D.B.; Grantham, W.J.; Tabor, W.L.; Murphy, M.J. Global and local optimization using radial basis function response surface models. Appl. Math. Model. 2007, 31, 2095–2110. [Google Scholar] [CrossRef]
- Wen, J.; Yang, H.; Tong, X.; Li, K.; Wang, S.; Li, Y. Configuration parameters design and optimization for plate-fin heat exchangers with serrated fin by multi-objective genetic algorithm. Energy Convers. Manag. 2016, 117, 482–489. [Google Scholar] [CrossRef]
- Lee, J.; Hill, A.; Kentish, S. Formation of a thick aromatic polyamide membrane by interfacial polymerisation. Sep. Purif. Technol. 2013, 104, 276–283. [Google Scholar] [CrossRef]
- Yan, L.; Yang, X.; Long, J.; Cheng, X.; Pan, D.; Huang, Y.; Shao, L. Universal unilateral electro-spinning/spraying strategy to construct water-unidirectional Janus membranes with well-tuned hierarchical micro/nanostructures. Chem. Commun. 2020, 56, 478–481. [Google Scholar] [CrossRef]
- Yang, X.; Yan, L.; Ran, F.; Huang, Y.; Pan, D.; Bai, Y.; Shao, L. Mussel-/diatom-inspired silicified membrane for high-efficiency water remediation. J. Membr. Sci. 2020, 597, 117753. [Google Scholar] [CrossRef]
- Jin, Y.; Su, Z. Effects of polymerization conditions on hydrophilic groups in aromatic polyamide thin films. J. Membr. Sci. 2009, 330, 175–179. [Google Scholar] [CrossRef]
- Matthews, T.D.; Yan, H.; Cahill, D.G.; Coronell, O.; Mariñas, B.J. Growth dynamics of interfacially polymerized polyamide layers by diffuse reflectance spectroscopy and Rutherford backscattering spectrometry. J. Membr. Sci. 2013, 429, 71–80. [Google Scholar] [CrossRef]
- Wang, Z.; Jiang, X.; Cheng, X.; Lau, C.H.; Shao, L. Mussel-Inspired Hybrid Coatings that Transform Membrane Hydrophobicity into High Hydrophilicity and Underwater Superoleophobicity for Oil-in-Water Emulsion Separation. ACS Appl. Mater. Interfaces 2015, 7, 9534–9545. [Google Scholar] [CrossRef] [PubMed]
- Ueberreiter, K.; Kanig, G. Second-order transitions and mesh distribution functions of cross-linked polystyrenes. J. Chem. Phys. 1950, 18, 399–406. [Google Scholar] [CrossRef]
- Maruf, S.H.; Ahn, D.U.; Greenberg, A.R.; Ding, Y. Glass transition behaviors of interfacially polymerized polyamide barrier layers on thin film composite membranes via nano-thermal analysis. Polymer 2011, 52, 2643–2649. [Google Scholar] [CrossRef]
- Montgomery, D.C. Design and Analysis of Experiments, 7th ed.; John Wiley & Sons: New York, NY, USA, 2009. [Google Scholar]
- Freger, V.; Srebnik, S. Mathematical model of charge and density distributions in interfacial polymerization of thin films. J. Appl. Polym. Sci. 2003, 88, 1162–1169. [Google Scholar] [CrossRef]
- Liu, M.; Zheng, Y.; Shuai, S.; Zhou, Q.; Yu, S.; Gao, C. Thin-film composite membrane formed by interfacial polymerization of polyvinylamine (PVAm) and trimesoyl chloride (TMC) for nanofiltration. Desalination 2012, 288, 98–107. [Google Scholar] [CrossRef]
- Chen, G.E.; Liu, Y.J.; Xu, Z.L.; Tang, Y.J.; Huang, H.H.; Sun, L. Fabrication and characterization of a novel nanofiltration membrane by the interfacial polymerization of 1,4-diaminocyclohexane (DCH) and trimesoyl chloride (TMC). RSC Adv. 2015, 5, 40742–40752. [Google Scholar] [CrossRef]
- Yu, S.; Ma, M.; Liu, J.; Tao, J.; Liu, M.; Gao, C. Study on polyamide thin-film composite nanofiltration membrane by interfacial polymerization of polyvinylamine (PVAm) and isophthaloyl chloride (IPC). J. Membr. Sci. 2011, 379, 164–173. [Google Scholar] [CrossRef]


| Exp. No | Input Parameters | Responses | ||||||
|---|---|---|---|---|---|---|---|---|
| TMC (wt%) | t (sec) | Tc (oC) | Flux (l/m2.h) | NaCl Rejection (%) | MgCl2 Rejection (%) | Na2SO4 Rejection (%) | MgSO4 Rejection (%) | |
| 1 | 0.1 | 15 | 80 | 11.42 | 94 | 95.30 | 97.74 | 96.77 |
| 2 | 0.1 | 30 | 80 | 10.43 | 96.99 | 97.96 | 99.65 | 99.49 |
| 3 | 0.1 | 60 | 80 | 11.28 | 95.76 | 96.80 | 98.94 | 98.42 |
| 4 | 0.2 | 15 | 80 | 9.13 | 90.79 | 93.19 | 97.59 | 97.09 |
| 5 | 0.2 | 30 | 80 | 9.86 | 93.24 | 94.06 | 98.75 | 97.52 |
| 6 | 0.2 | 60 | 80 | 10.71 | 97.71 | 98.45 | 99.77 | 99.69 |
| 7 | 0.1 | 15 | 60 | 10.68 | 91.72 | 94.33 | 98.01 | 96.84 |
| 8 | 0.1 | 30 | 60 | 10.75 | 91.25 | 93.67 | 96.83 | 95.88 |
| 9 | 0.1 | 60 | 60 | 11.02 | 94.73 | 96.46 | 98.92 | 98.47 |
| 10 | 0.2 | 15 | 60 | 9.52 | 86.20 | 88.19 | 95.62 | 92.63 |
| 11 | 0.2 | 30 | 60 | 10.71 | 89.81 | 91.53 | 95.70 | 94.26 |
| 12 | 0.2 | 60 | 60 | 10.87 | 91.33 | 93.03 | 96.59 | 95.14 |
| Function Name | Function Form | Parameters | Ref. |
|---|---|---|---|
| Polynomial Regression | : Coefficient matrix structural matrix is the number of input factors is random error | [26] | |
| Neural Network | refers to input parameters | [26] | |
| Radial Basis Function | is input parameters : Coefficient matrix : RBF function : Euclidean norm | [27] |
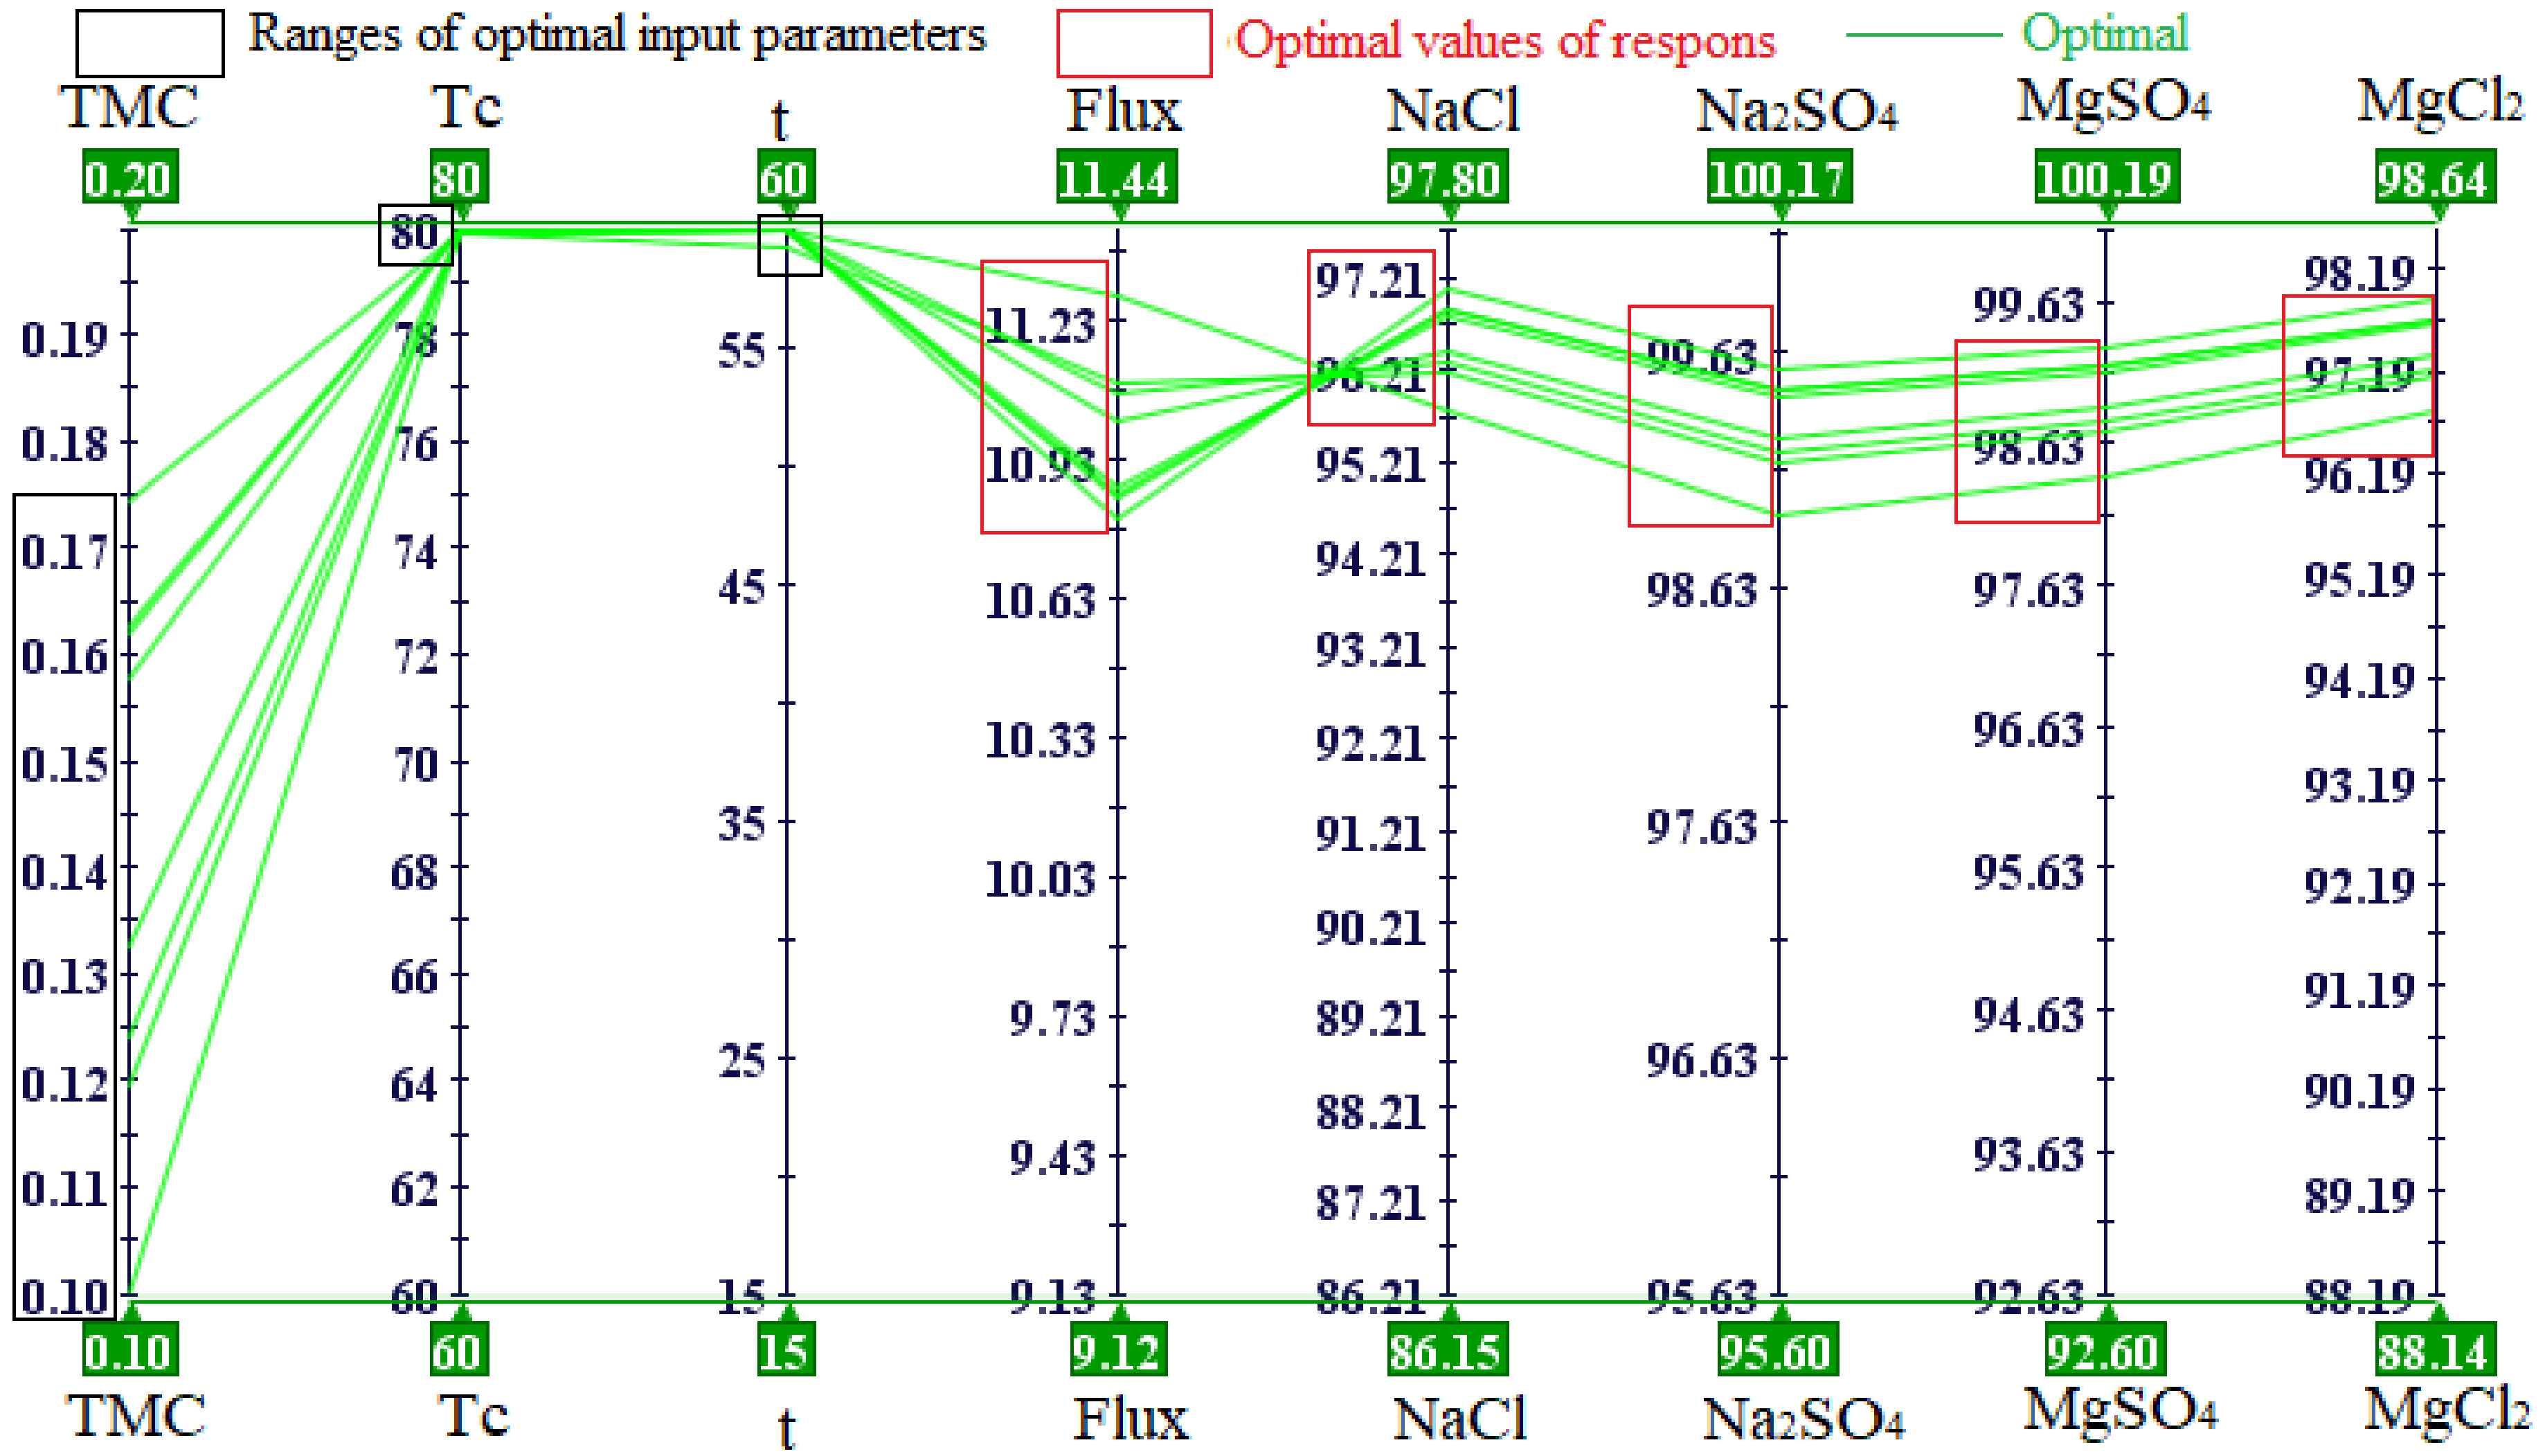
| Objective Functions | Maximize Flux Maximize NaCl Rejection |
|---|---|
| Constraints | Na2SO4 > 98% MgCl2 > 96% MgSO4 > 98% |
| Source | DF | Flux | NaCl Rejection | ||||||
|---|---|---|---|---|---|---|---|---|---|
| Adj SS | Adj MS | F-Value | p-Value | Adj SS | Adj MS | F-Value | p-Value | ||
| Model | 6 | 4.293 | 0.7156 | 3.52 | 0.094 | 108.186 | 18.0310 | 9.23 | 0.014 |
| Linear | 3 | 2.900 | 0.967 | 4.76 | 0.063 | 95.470 | 31.8233 | 16.29 | 0.005 |
| TMC | 1 | 1.579 | 1.579 | 7.78 | 0.039 | 16.448 | 16.4479 | 8.42 | 0.034 |
| t | 1 | 1.2804 | 1.280 | 6.30 | 0.054 | 33.960 | 33.9602 | 17.39 | 0.009 |
| Tc | 1 | 0.041 | 0.041 | 0.20 | 0.673 | 45.062 | 45.0619 | 23.07 | 0.005 |
| Two-Way Interaction | 3 | 1.067 | 0.356 | 1.75 | 0.272 | 8.789 | 2.9296 | 1.50 | 0.322 |
| TMC × t | 1 | 0.698 | 0.698 | 3.44 | 0.123 | 6.416 | 6.4163 | 3.29 | 0.130 |
| TMC × Tc | 1 | 0.368 | 0.368 | 1.81 | 0.236 | 2.371 | 2.3714 | 1.21 | 0.321 |
| t × Tc | 1 | 0.000 | 0.0005 | 0.00 | 0.962 | 0.001 | 0.0010 | 0.00 | 0.983 |
| Error | 5 | 1.015 | 0.203 | 9.766 | 1.9532 | ||||
| Total | 1 | 15.309 | 117.952 | ||||||
| No. | Functions | Mean Absolute Error | Mean Relative Error | Mean Normalized Error | R-Squared |
|---|---|---|---|---|---|
| 1 | Neural network | 9.54 10−1 | 1.03 10−2 | 8.30 10−2 | 0.885 |
| 2 | Polynomial SVD | 1.01 | 1.09 10−2 | 8.80 10−2 | 0.843 |
| 3 | Radial basis | 0 | 0 | 0 | 1 |
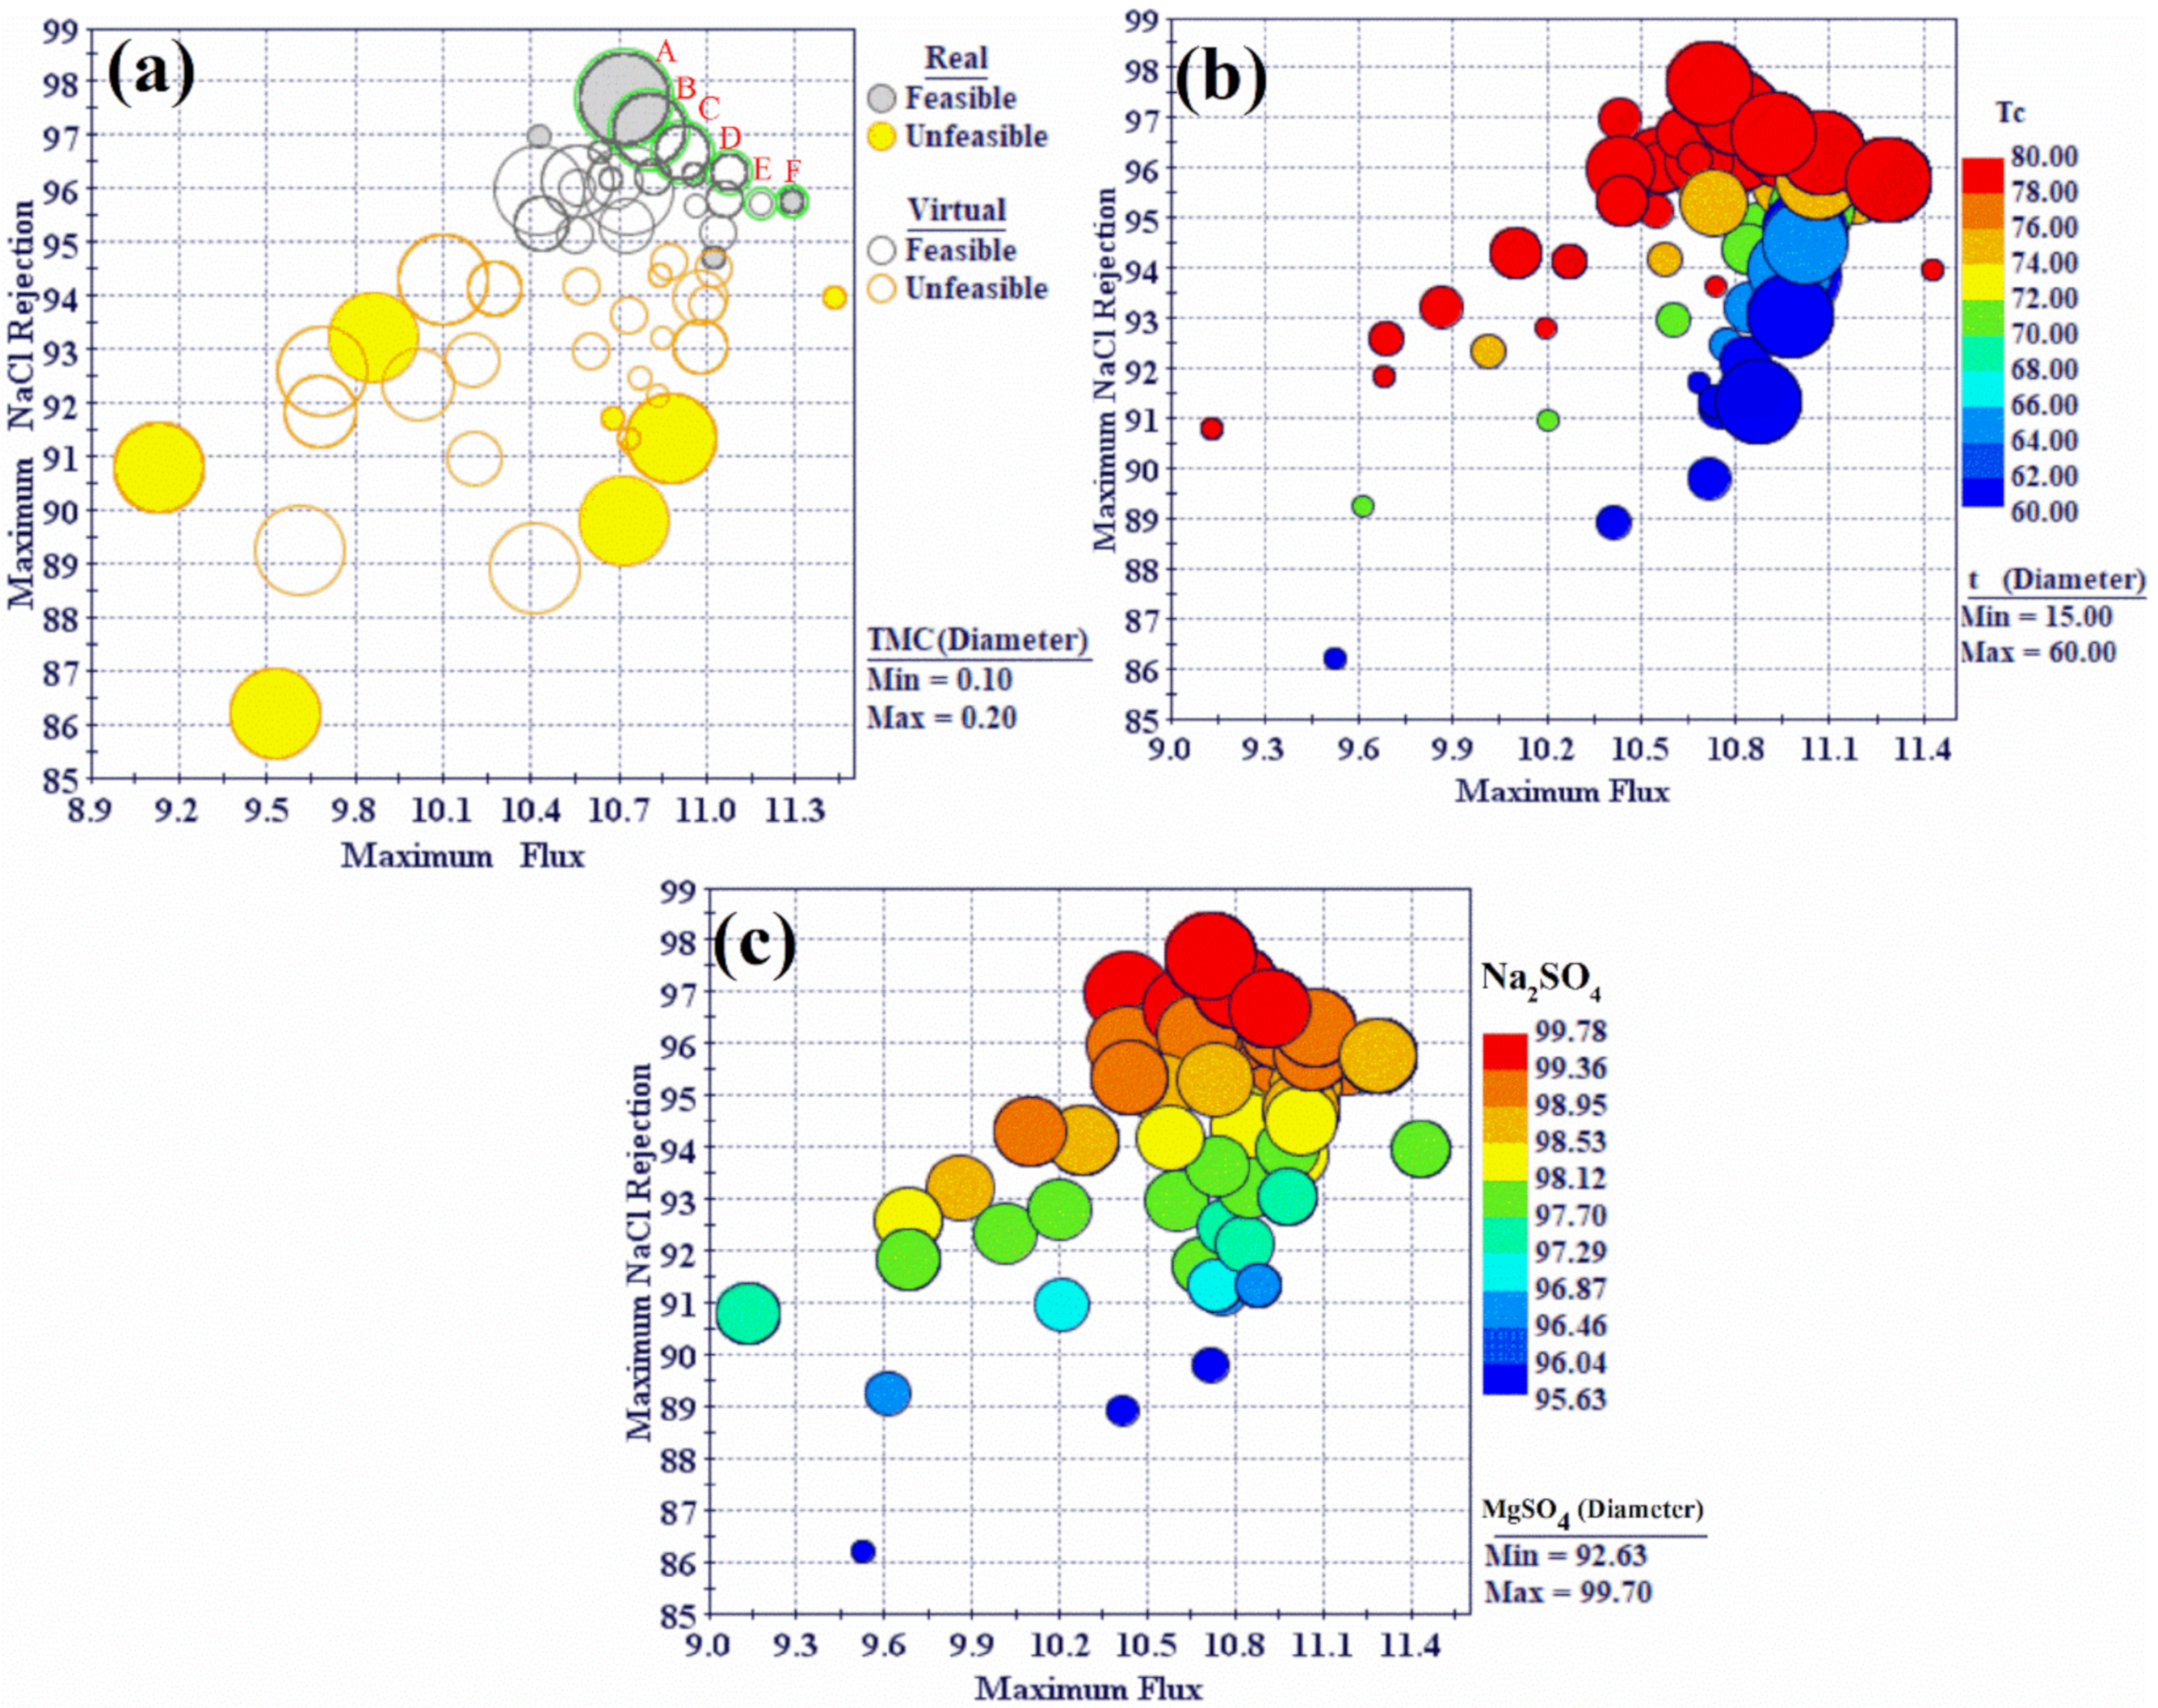
| ID | TMC | t | Tc | flux | NaCl | MgCl2 | MgSO4 | Na2SO4 |
|---|---|---|---|---|---|---|---|---|
| A | 0.2 | 60 | 80 | 10.71 | 97.712 | 98.45 | 99.77 | 99.69 |
| B | 0.18 | 60 | 80 | 10.77 | 97.21 | 97.99 | 99.61 | 99.4 |
| C | 0.16 | 60 | 80 | 10.85 | 96.82 | 97.65 | 99.45 | 99.16 |
| D | 0.15 | 55 | 80 | 10.915 | 96.69 | 97.556 | 99.392 | 99.07 |
| E | 0.126 | 56.7 | 80 | 11.003 | 96.28 | 97.22 | 99.22 | 98.82 |
| F | 0.1 | 60 | 80 | 11.28 | 95.8 | 96.8 | 98.93 | 98.42 |
© 2020 by the authors. Licensee MDPI, Basel, Switzerland. This article is an open access article distributed under the terms and conditions of the Creative Commons Attribution (CC BY) license (http://creativecommons.org/licenses/by/4.0/).
Share and Cite
Ali, F.A.A.; Alam, J.; Shukla, A.K.; Alhoshan, M.; Abdo, B.M.A.; Al-Masry, W.A. A Novel Approach to Optimize the Fabrication Conditions of Thin Film Composite RO Membranes Using Multi-Objective Genetic Algorithm II. Polymers 2020, 12, 494. https://0-doi-org.brum.beds.ac.uk/10.3390/polym12020494
Ali FAA, Alam J, Shukla AK, Alhoshan M, Abdo BMA, Al-Masry WA. A Novel Approach to Optimize the Fabrication Conditions of Thin Film Composite RO Membranes Using Multi-Objective Genetic Algorithm II. Polymers. 2020; 12(2):494. https://0-doi-org.brum.beds.ac.uk/10.3390/polym12020494
Chicago/Turabian StyleAli, Fekri Abdulraqeb Ahmed, Javed Alam, Arun Kumar Shukla, Mansour Alhoshan, Basem M. A. Abdo, and Waheed A. Al-Masry. 2020. "A Novel Approach to Optimize the Fabrication Conditions of Thin Film Composite RO Membranes Using Multi-Objective Genetic Algorithm II" Polymers 12, no. 2: 494. https://0-doi-org.brum.beds.ac.uk/10.3390/polym12020494