1. Introduction
Fibre bridging is a toughening mechanism which is able to delay delamination growth in composite structures [
1,
2,
3]. Indeed, delaminations are among the most dangerous failure mechanisms for composite material structures, due to their frequent unstable growth, which can lead to the sudden and premature collapse of structures [
4,
5,
6,
7,
8]. Actually, fracture toughness is a non-isotropic matrix property able to slow down damage progression in the weaker (out-of-plane) direction of fibre-reinforced composite laminates. Hence, improving this material property becomes mandatory to widen the possible applications of fibre-reinforced composite laminates.
To improve the fracture toughness, toughening resins and thickness reinforcements (stitching, pinning or orthogonal weaving) are generally adopted [
9,
10,
11,
12,
13]. Such reinforcements, even if able to slow down and sometimes arrest the delamination advance, can strongly reduce the in-plane mechanical properties of the fibre-reinforced composites. Indeed, in the stitching process a needle is used to pierce the laminate, in order to insert a high tensile strength yarn. Literature study [
14] demonstrates that stitching can cause breakage, kink and spread of the fibres. Furthermore, the formation of resin-rich regions, porosity and resin cracks can occur. Likewise, the presence of the z-pins creates resin pockets and skew of the fibres, leading to degradation of the in-plane strength of the composite [
15]. Another highly effective method to improve the fracture toughness is the addition of nanoparticles in the polymeric matrix [
16,
17,
18,
19,
20,
21], which improves also tensile strength, stiffness and thermal properties. On the other hand, some disadvantages are associated with nanoparticles, such as viscosity increase, dispersion problems and sedimentation [
22]. Hence, attention should be paid to alternative toughening approaches based on the modification of the manufacturing process of composites that are able to tune the sensitivity to natural toughening phenomena, such as the fibre bridging.
In order to experimentally assess the effects of toughness variations on the mechanical behaviour of composite components, Non-Destructive Testing (NDT) methods can be used, which, replacing the more uncertain “destructive sample testing”, allow the evolution of inter-laminar damage under loading conditions to be evaluated. Among others, Digital Image Correlation (DIC), which is a technique based on the acquisition of surface digital images at different loading stages, allows the strain and the displacement distributions all over the specimen to be evaluated. The analysis and comparison of the acquired images can give an idea of the damage evolution in the inspected structures [
23,
24,
25,
26]. The main advantage of the DIC is the ease of use, since significantly less equipment is needed for DIC inspections compared to other NDT techniques, such as the ones based on ultrasound [
27,
28] and thermography [
29,
30].
In this paper, a numerical/experimental study, on the compressive behaviour of delaminated composite plates, is introduced. The main aim is to investigate the effects of modifications to the manufacturing process of composites for tuning the sensitivity to fibre bridging. Two material systems have been considered: the former is a material highly sensitive to fibre bridging characterised by a toughness increase with crack length; the latter is a toughened material with constant toughness. Epoxy resin/carbon fibre coupons, characterized by an artificial through-the-width delamination, have been experimentally tested under compression to assess their inter-laminar damage behaviour. The specimens have been equipped with strain gauges to investigate the delamination buckling and growth, as a result of the compressive load. Moreover, a DIC system has been employed for the monitoring of displacements and deformation fields during the test.
A numerical study has also been carried out and the results have been used, together with the experimental data, to provide an interpretation of the effects of the Mode I fracture toughness on delamination phenomena. The adopted numerical tool, validated in [
31], is an innovative and robust Virtual Crack Closure Technique (VCCT)-based procedure, named SMXB-FB, able to simulate the interlaminar damage in composite material structure, taking into account the bridging of the fibres, as well as the resistance curve behaviour (variation of toughness with crack length).
In
Section 2, the manufacturing of the investigated plates is analysed in detail and information is provided on the experimental procedures behind the compressive mechanical tests. In
Section 3, the SMXB-FB numerical tool and the finite element model are introduced. Finally, in
Section 4, the experimental data and the numerical results are presented, compared and discussed in order to improve the knowledge about the interactions between fibre bridging and buckling behaviour of the investigated plates.
2. Specimen Manufacturing and Experiments Details
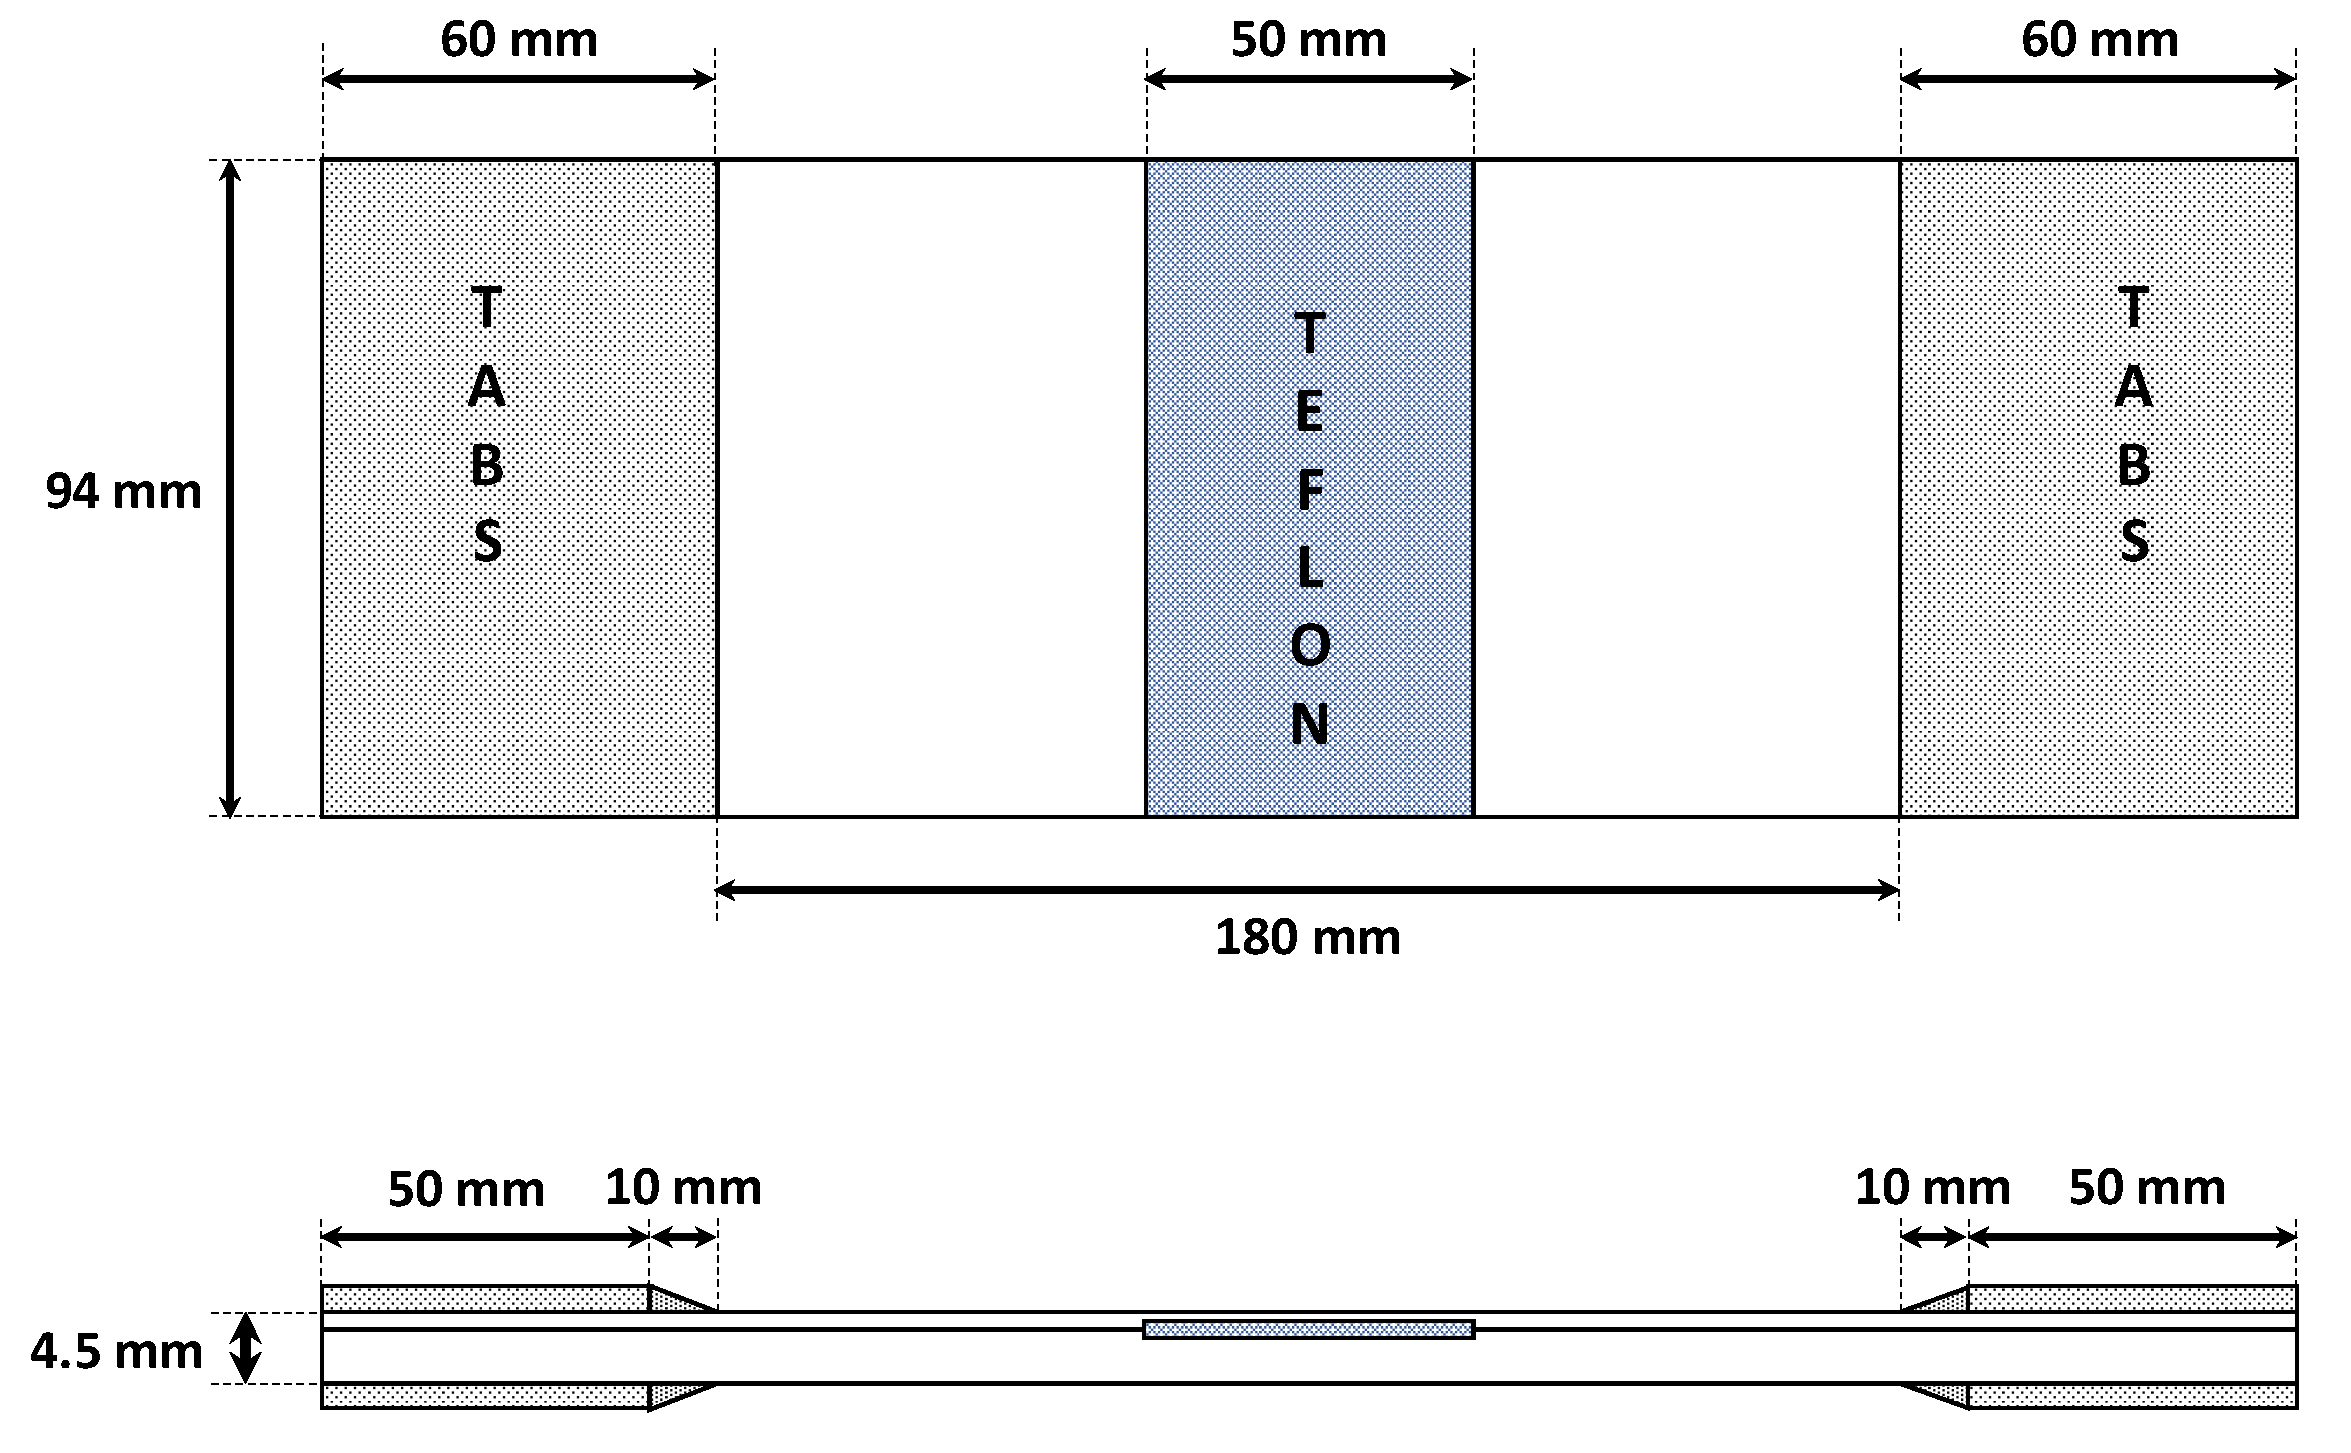
Epoxy resin/carbon fibre specimens with a 50-mm wide trough-the-width artificial delamination were manufactured according to the geometrical description given in
Figure 1. Coupons are made of 24 plies (each ply is 0.1875 mm thick) with a stacking sequence of [0,90]
6s. A rectangular Teflon film was inserted between the 4th and 5th ply, as shown in
Figure 1, to create an artificial delamination. Tabs on both sides of the samples were placed to allow a distribution as uniform as possible of the load from the test machine to the sample.
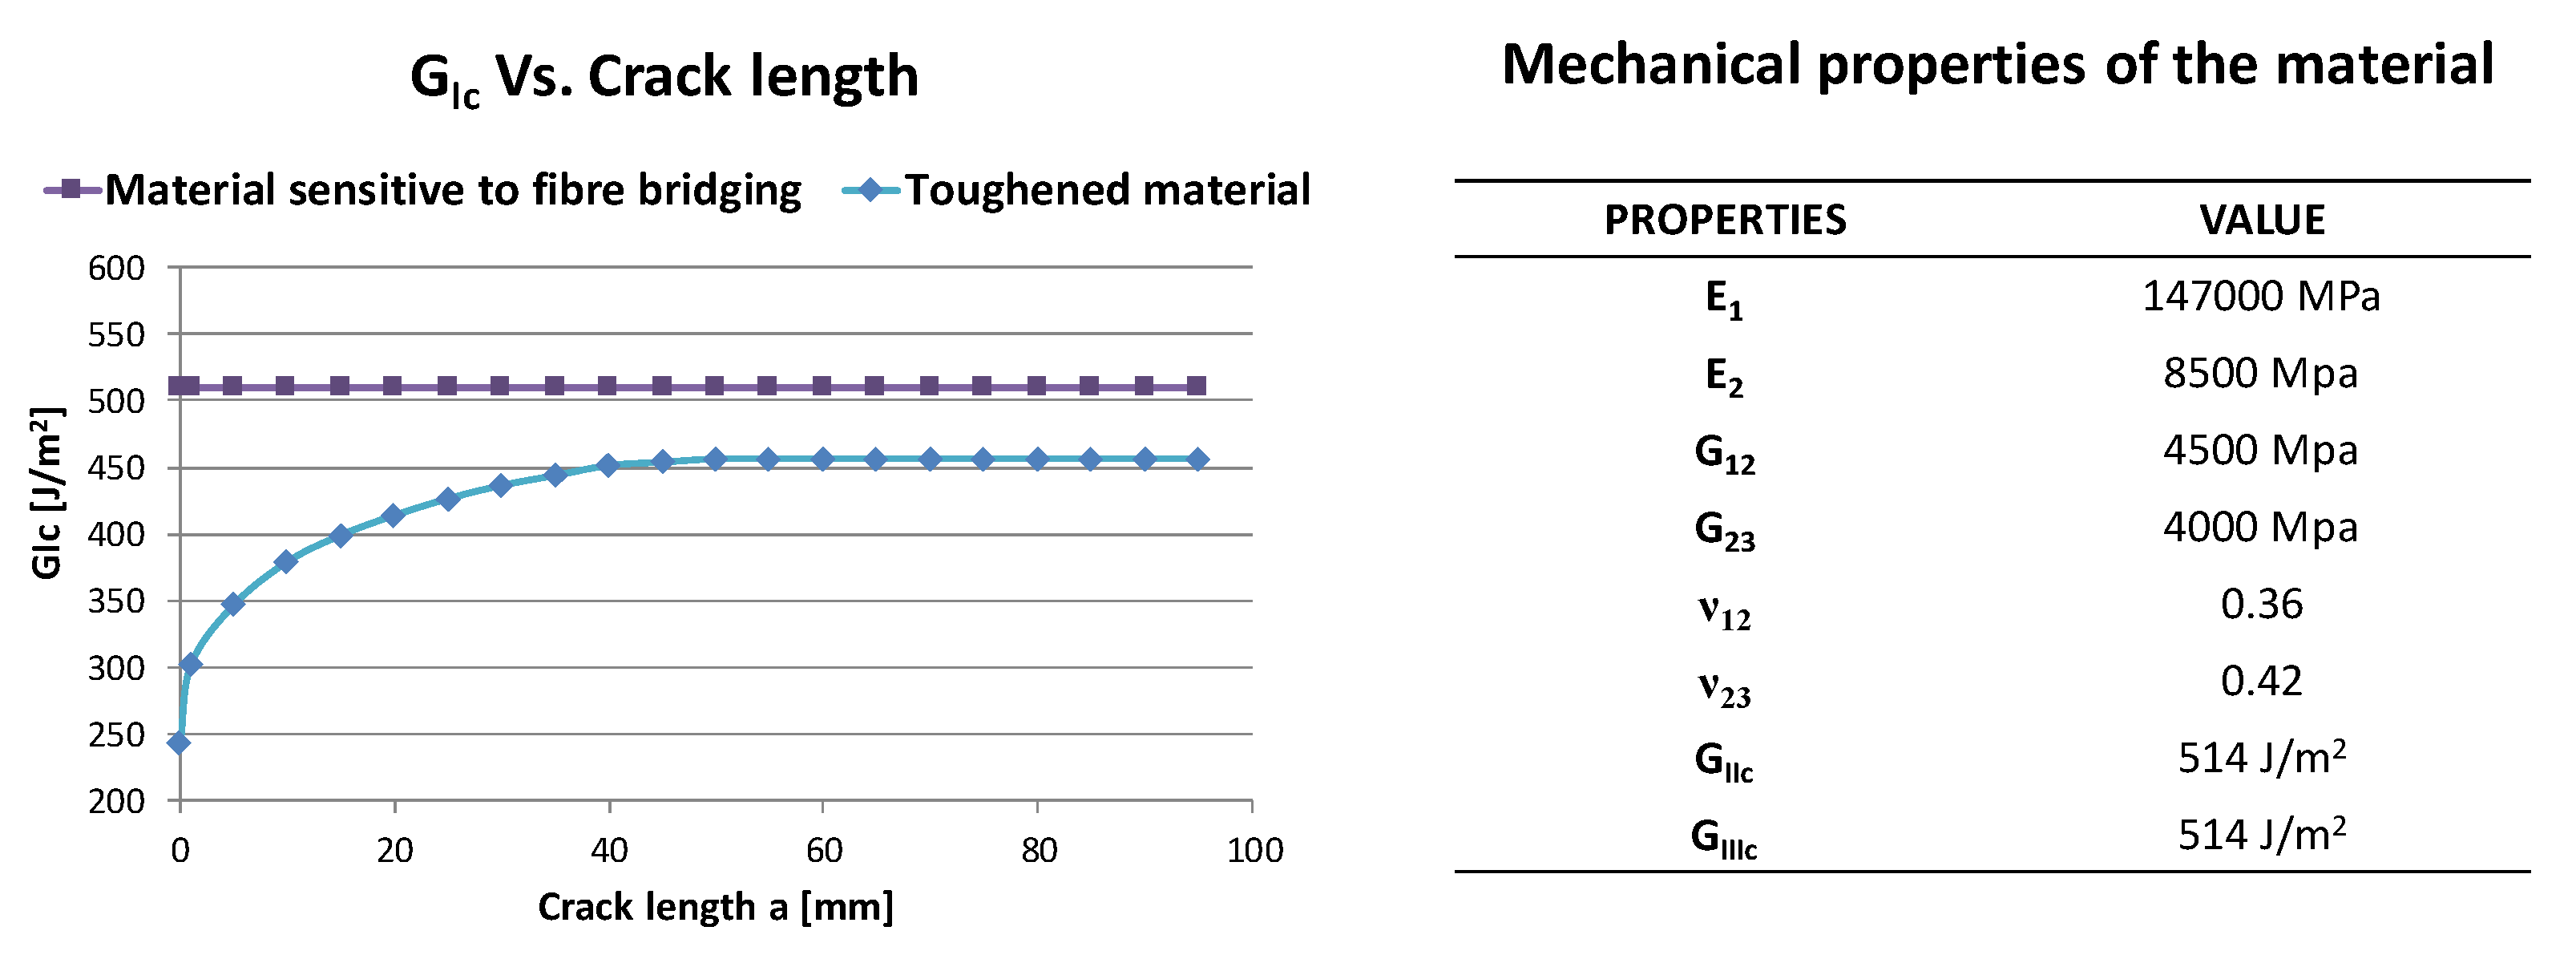
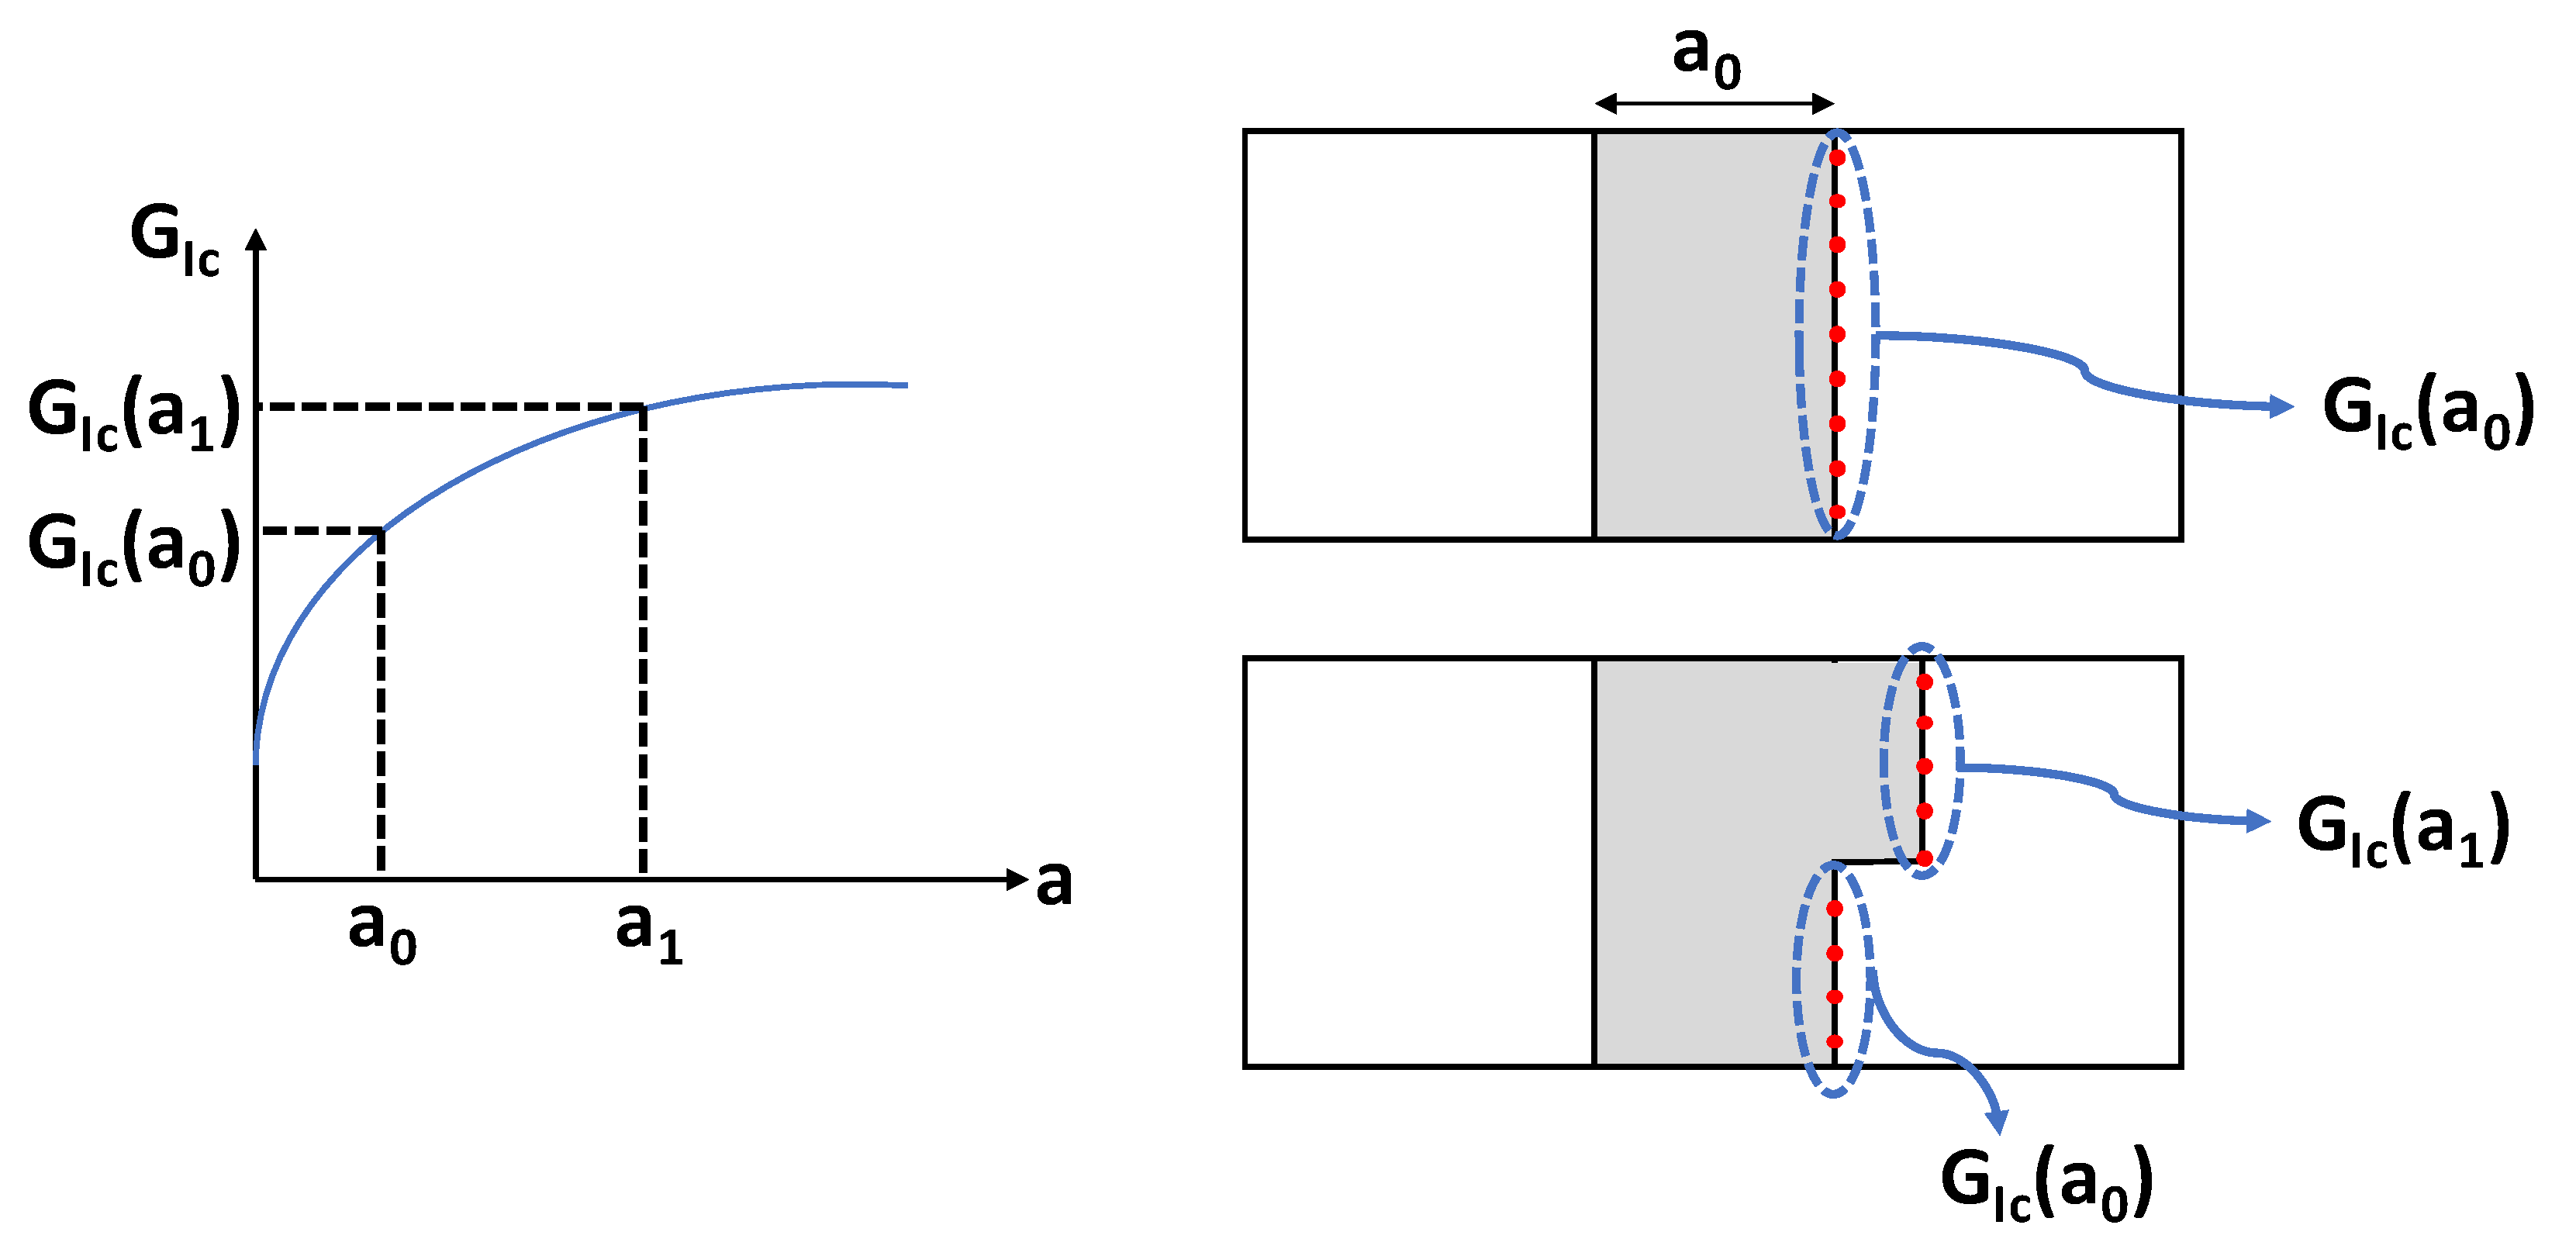
Two different curing processes have been used to manufacture the epoxy resin/carbon fibre plates. As a result, two sets of coupons have been obtained with the same mechanical properties but different Mode I fracture toughness:
set of coupons characterised by a constant GIc of 510 J/m2 (toughened material);
set of coupons characterized by a variable GIc, from 243 J/m2 to 456 J/m2 depending on delamination size (material sensitive to fibre bridging).
The resistance curves for the two sets of coupons, representing the
GIc as a function of the crack length
a, are reported in
Figure 2, together with the other mechanical properties.
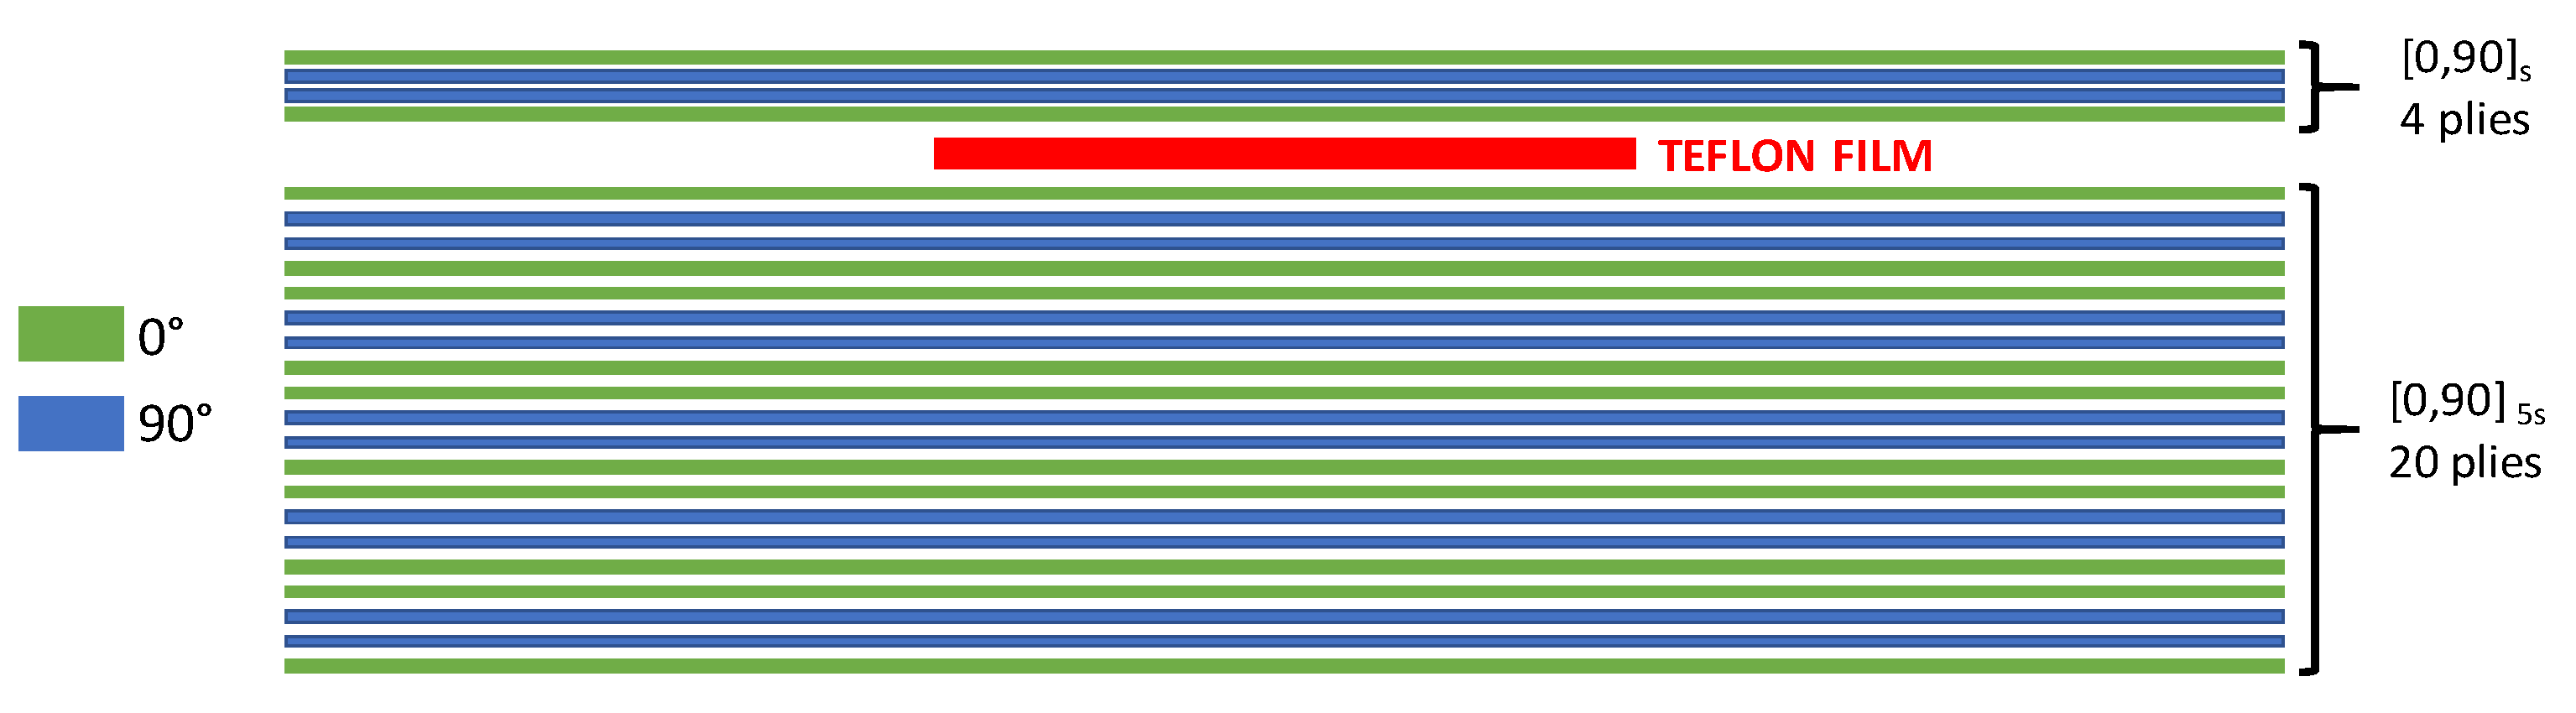
Three samples were cut from each plate, resulting in three specimens made of toughened material and three specimens made of material sensitive to fibre bridging. In
Figure 3, the stacking sequence and the position of delamination along the thickness, between the fourth and fifth ply, are introduced.
The tested coupons were labelled according to their fracture toughness characteristics, i.e., toughened material (TOUGH) and material sensitive to fibre bridging (MFB), as listed in
Table 1, where the tests matrix is reported.
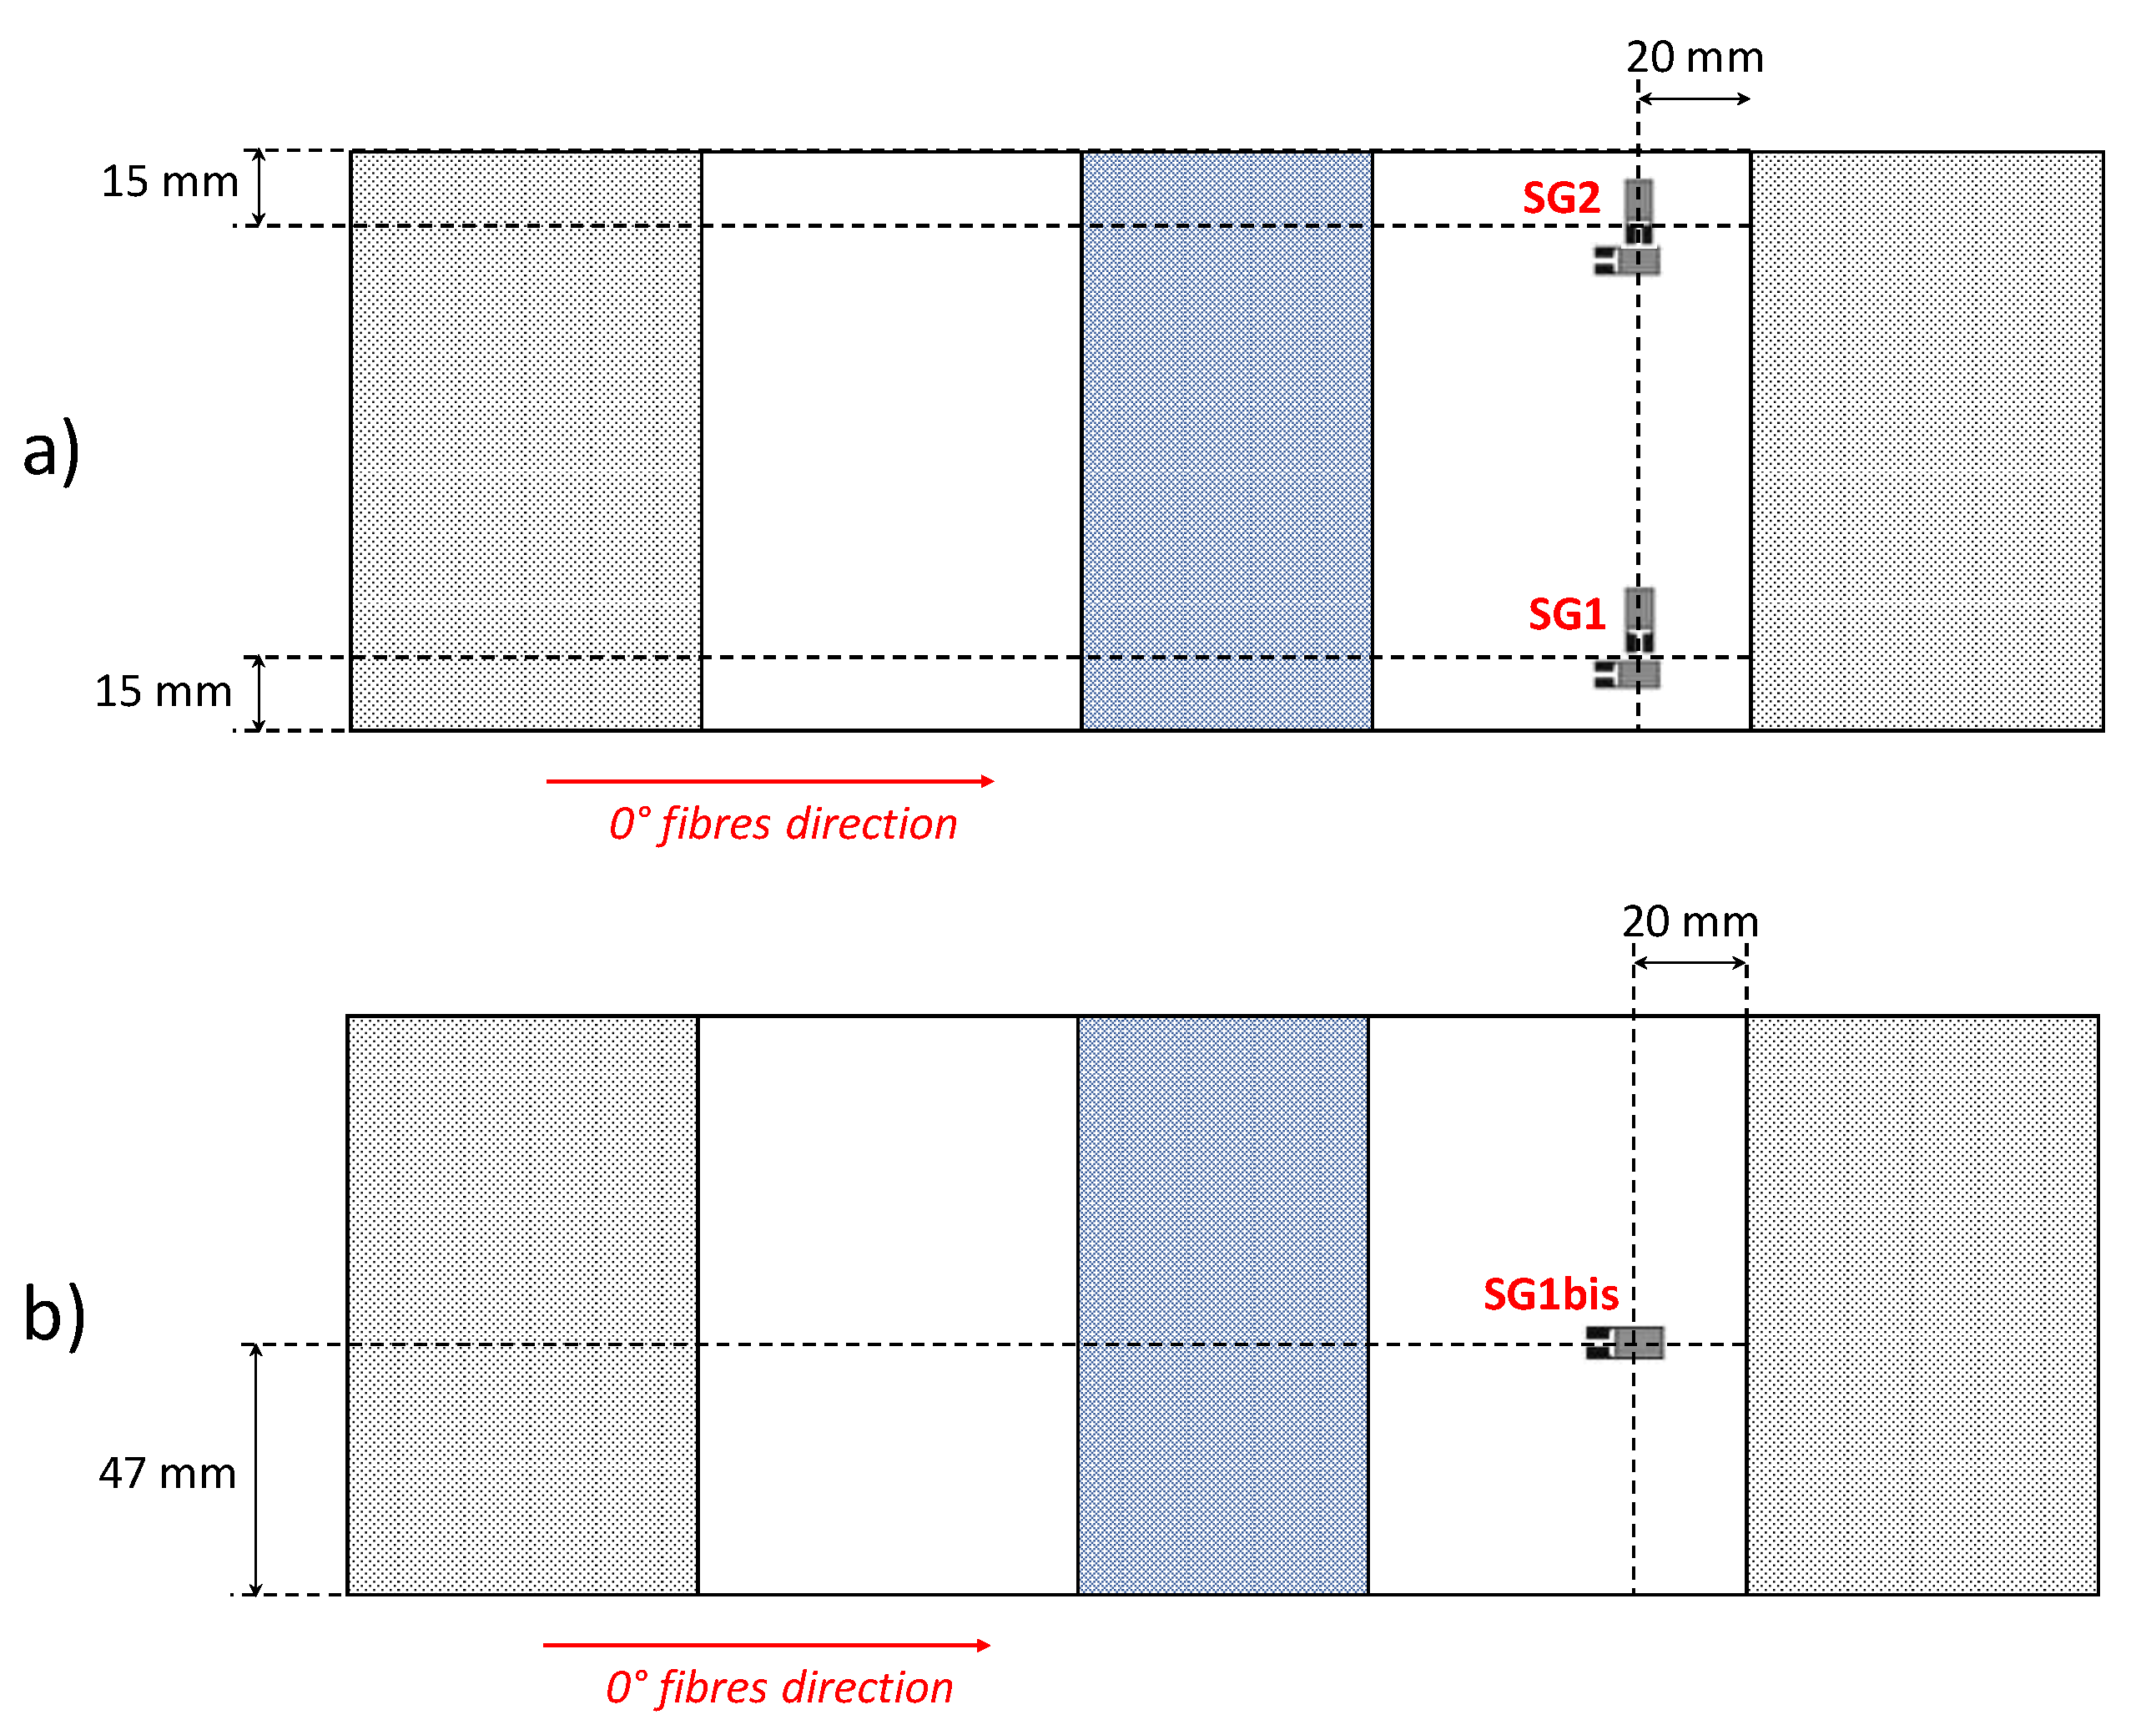
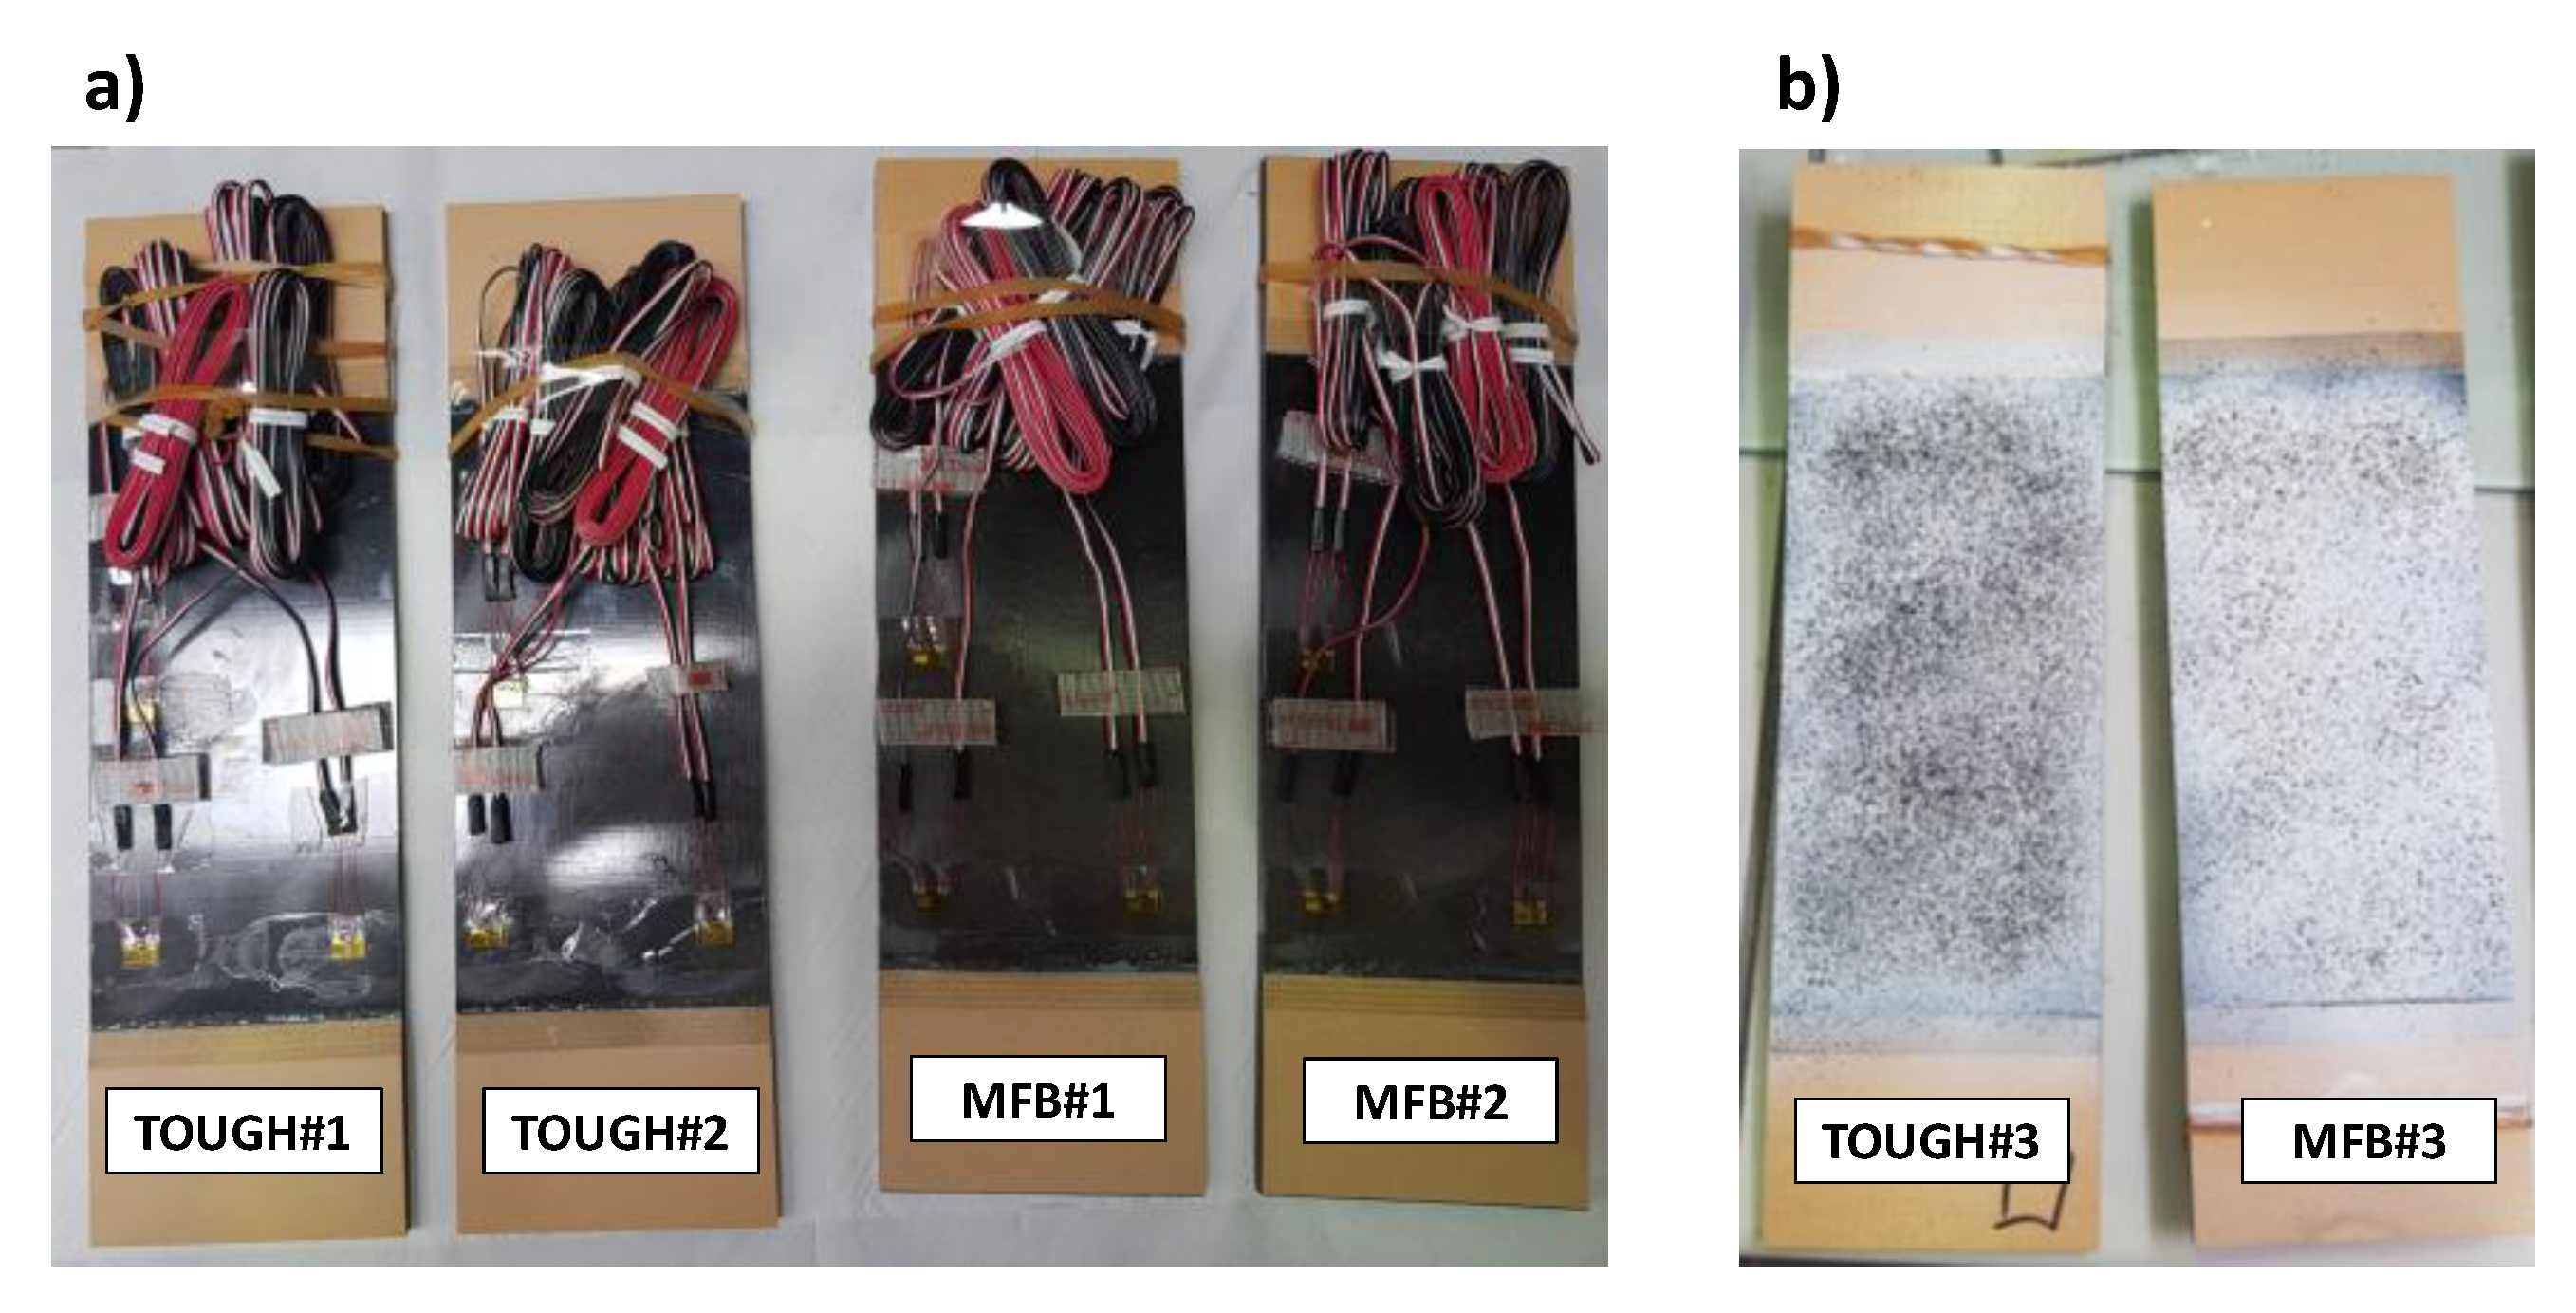
According to
Table 1, the TOUGH#1, TOUGH#2, MFB#1 and MFB#2 specimens were equipped with two strain gauge rosettes (SG1 and SG2), located, as shown in
Figure 4a, on the thicker sub-laminate side, to measure the deformations in the 0° and 90° fibre directions. The remaining samples, TOUGH#3 and MFB#3, were prepared for the DIC by painting in white and by randomly sprinkling with black pigments the thinner sub-laminate surfaces. These two last specimens were also equipped with one 0° fibre direction strain gauge (SG1bis), placed, as shown in
Figure 4b, on their thicker side.
Images of the specimens are shown in
Figure 5. Indeed, in
Figure 5a the specimen prepared for strain monitoring with strain gauges is shown, while in
Figure 5b the specimen prepared for DIC is presented.
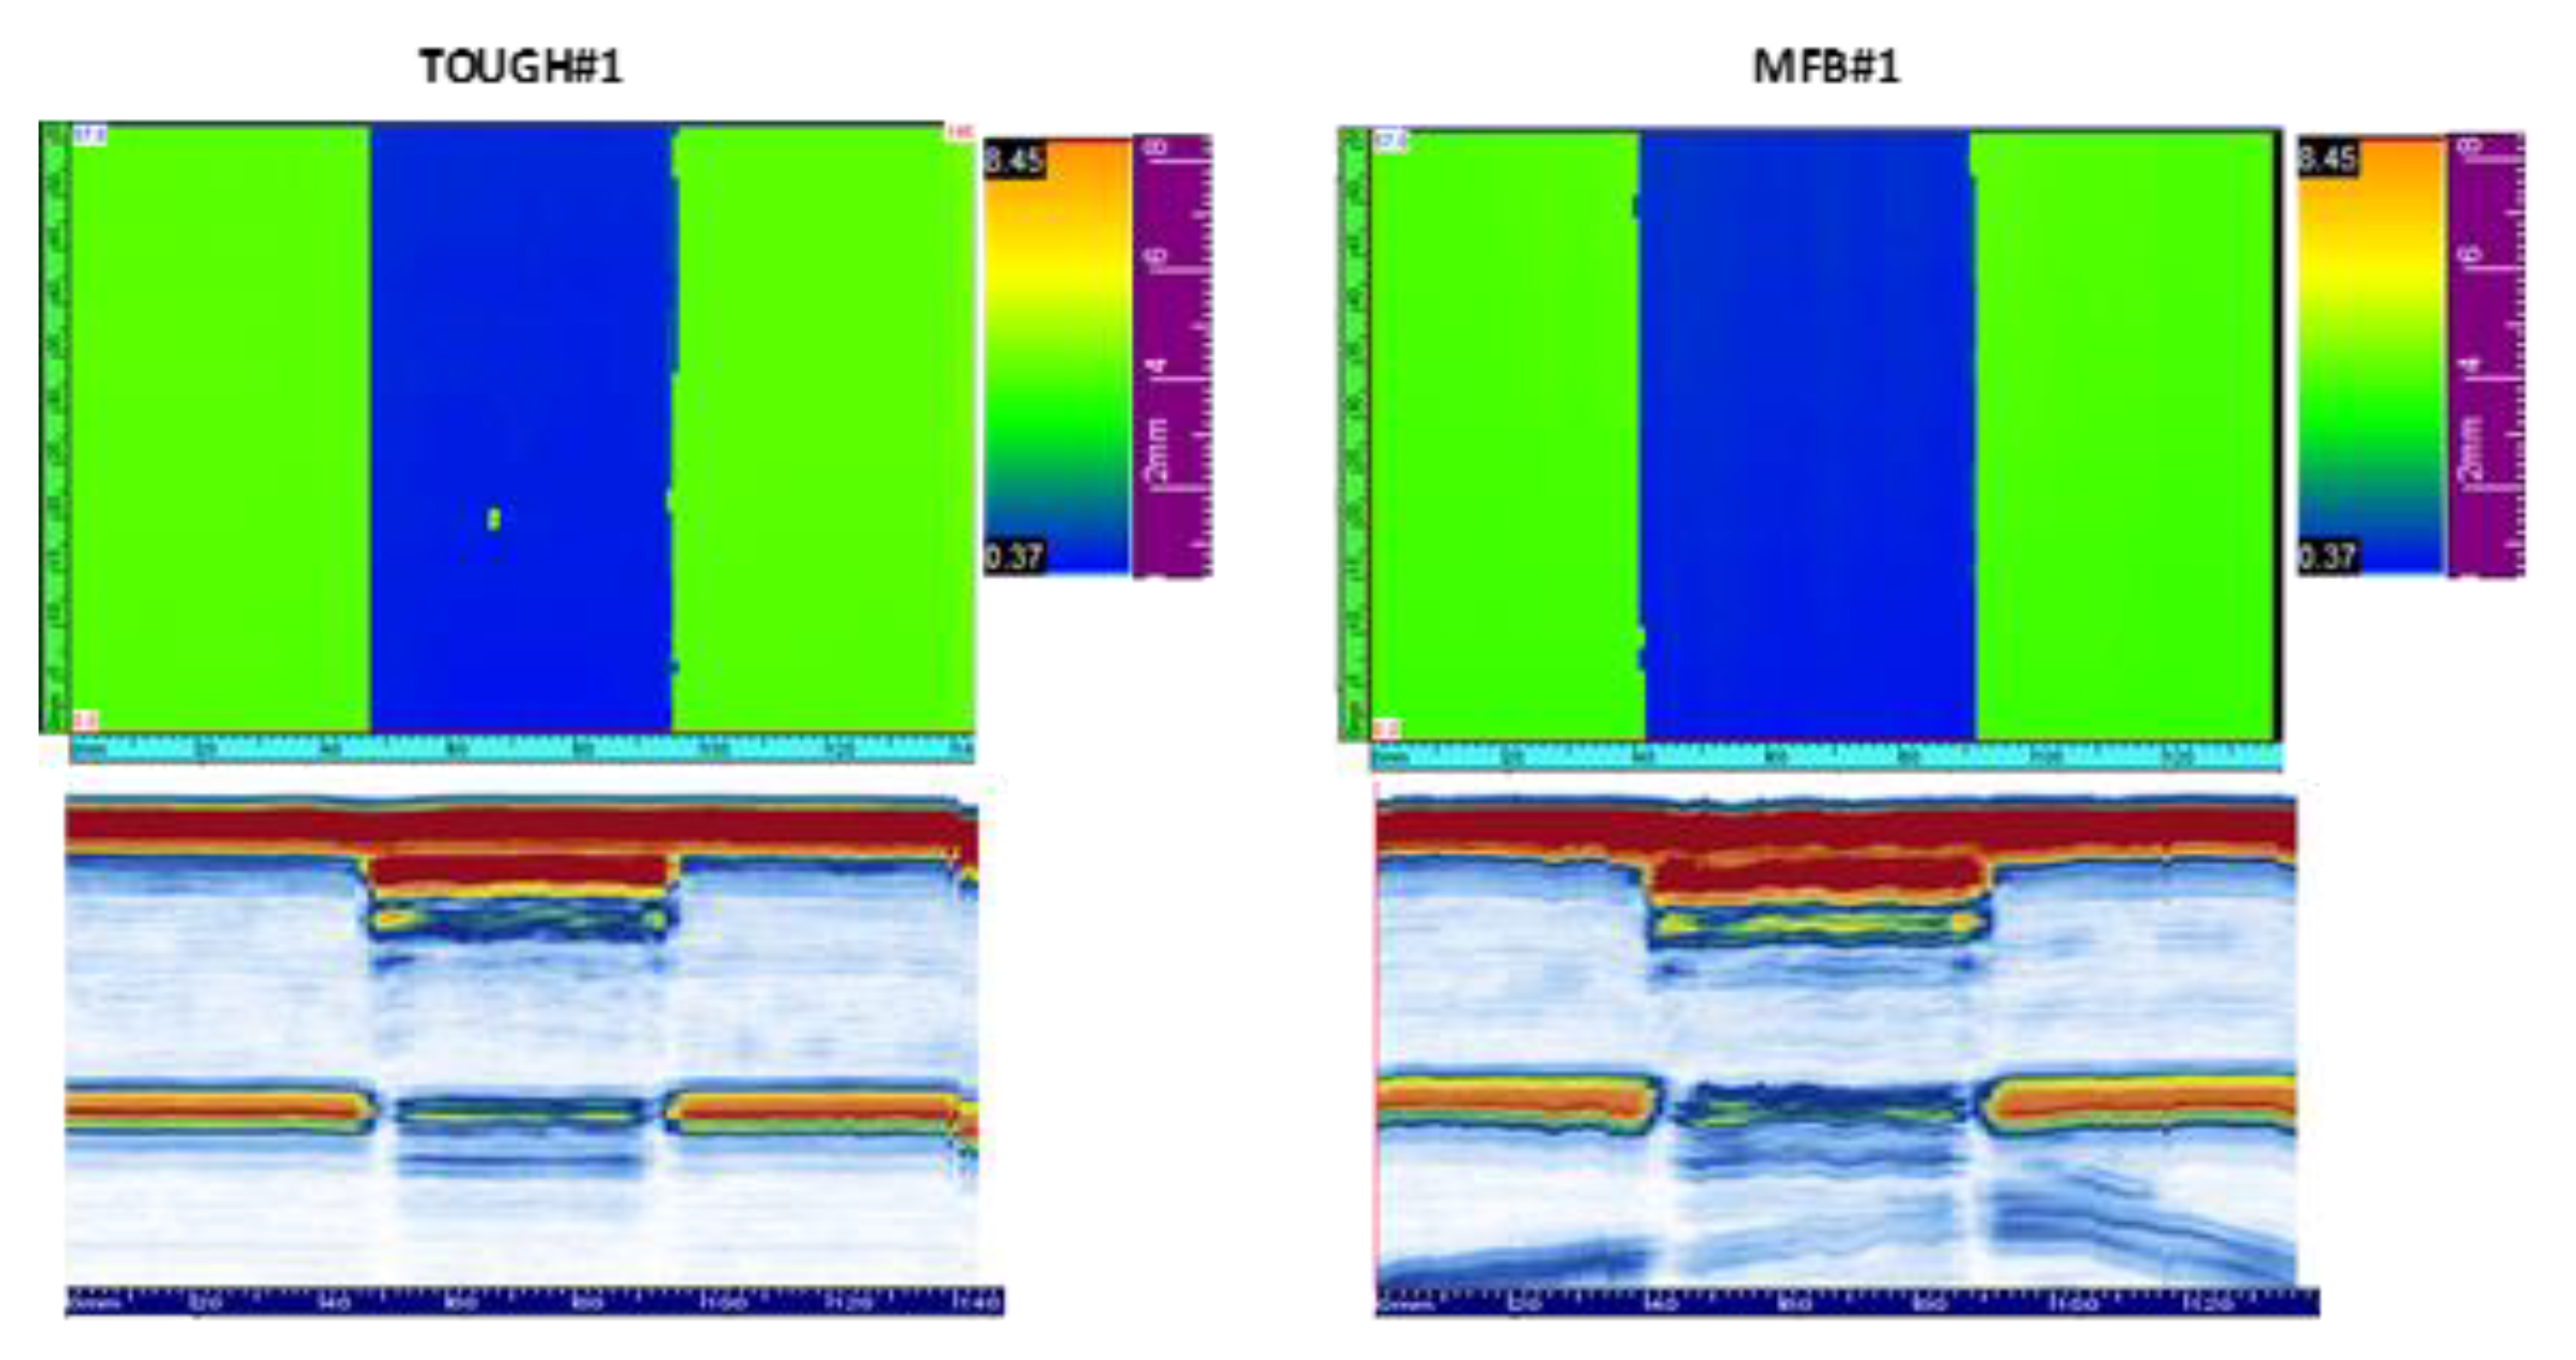
Before the compression tests, the samples were checked for manufacturing defects using ultrasonic inspections, performed by means of an ultrasonic device with an array of 64 sensors. No relevant defects have been found apart from some small voids at the edges of the Teflon film, probably due to the roughness of the Teflon film self.
Figure 6 shows the C-scans and the B-scans of the TOUGH#1 and MFB#1 samples, as an example of the performed non-destructive ultrasonic checks.
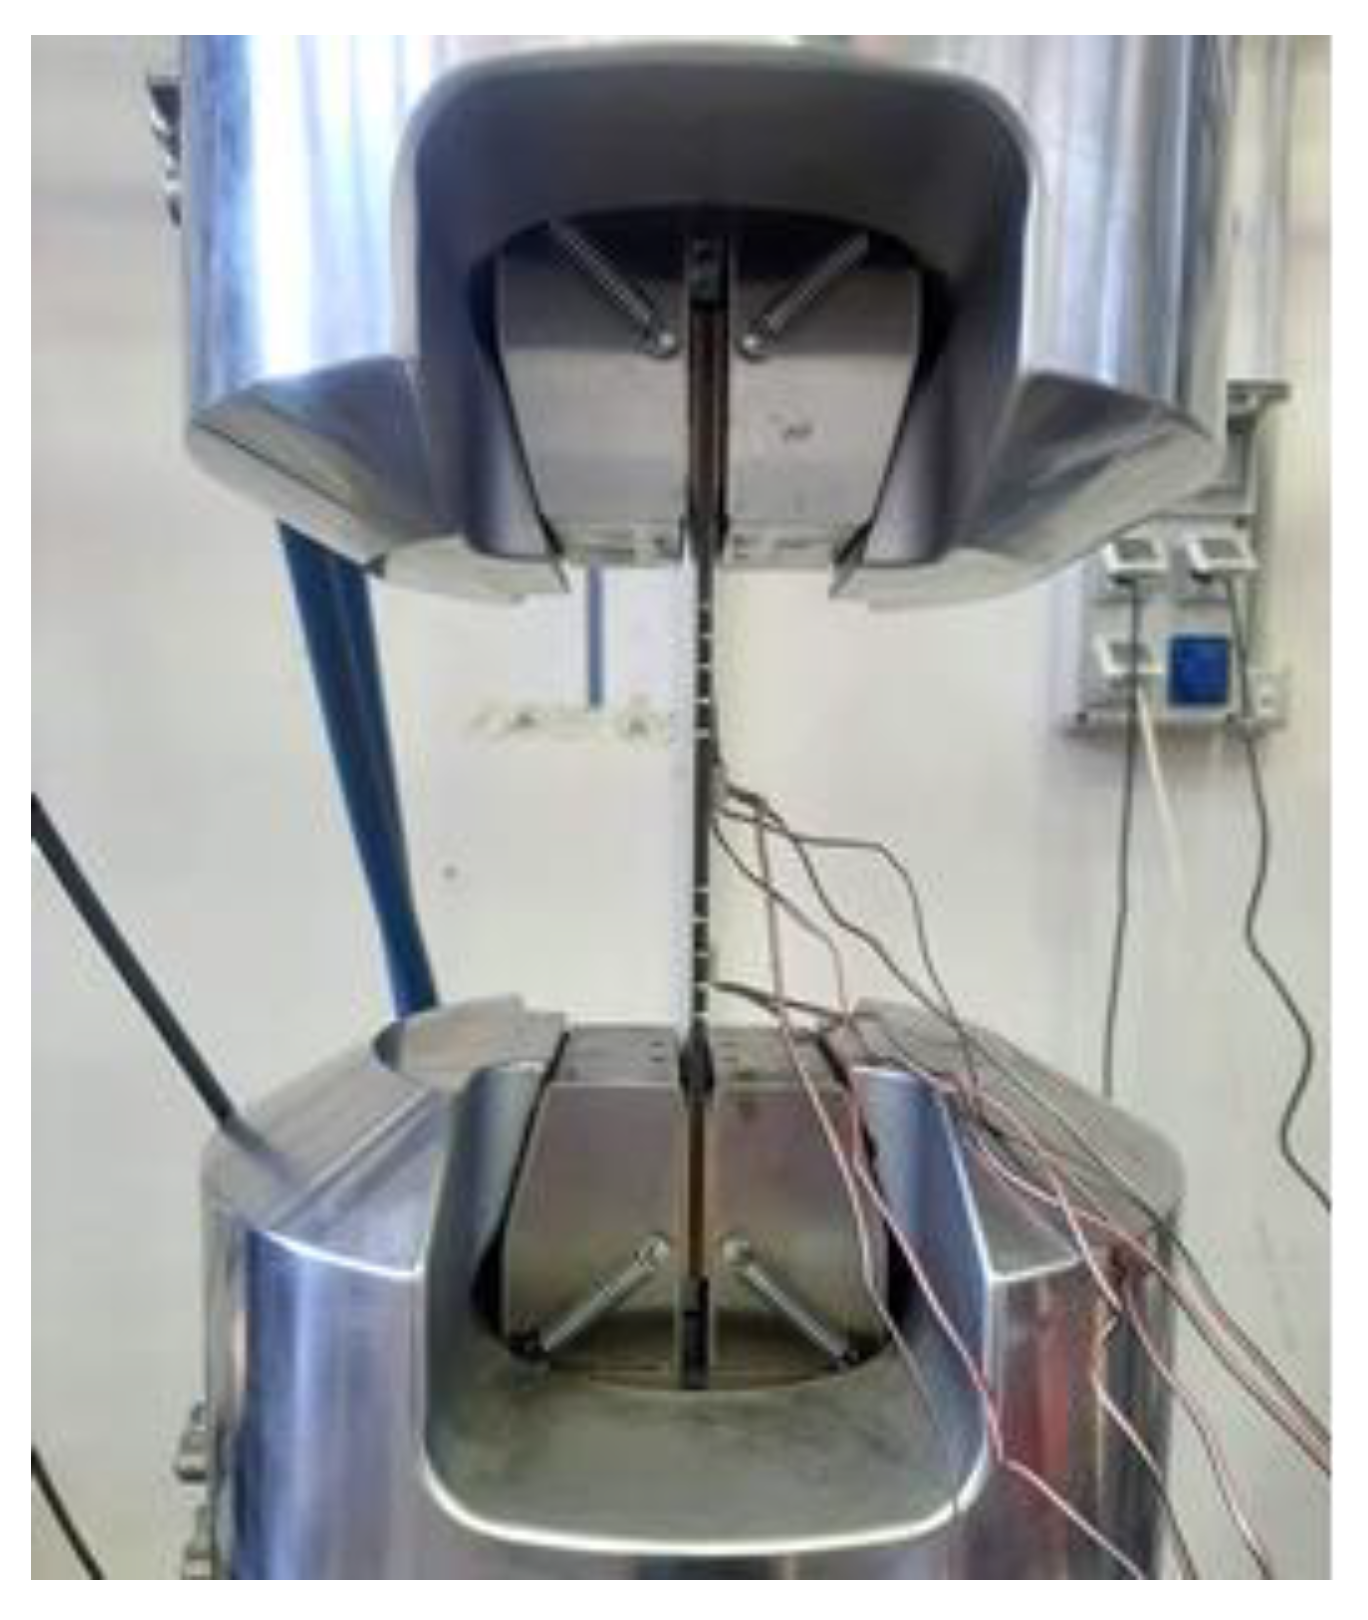
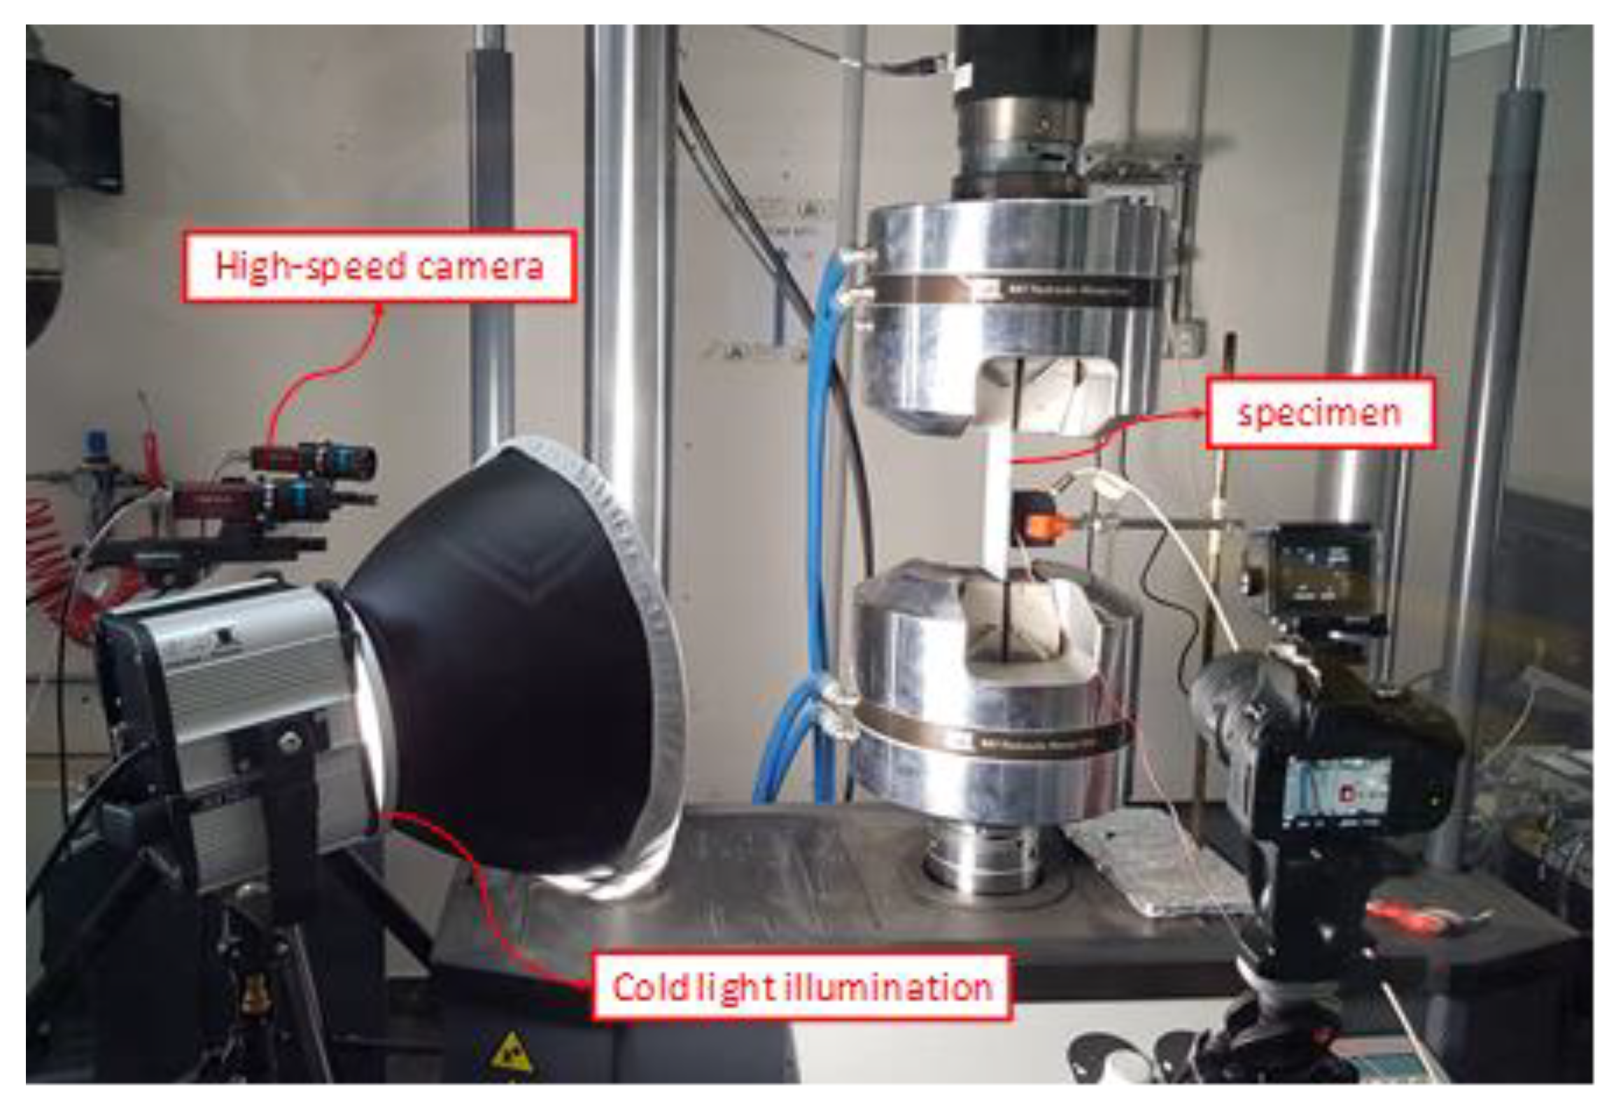
A hydraulic testing machine was used to perform compressive mechanical tests. The tabs of the specimens were clamped in the hydraulic grip and a controlled compressive displacement was applied with a rate of 0.5 mm/min. A picture of the specimen mounted in the testing rig is shown in
Figure 7. After the installation of each specimen, the strain gauges were linked to the data acquisition systems and calibrated. Consequently, the specimens were loaded with a small force before the test initiation in order to check the strain gauge measurements and verify the correct alignment and the proper introduction of the compressive load.
According to the test matrix of
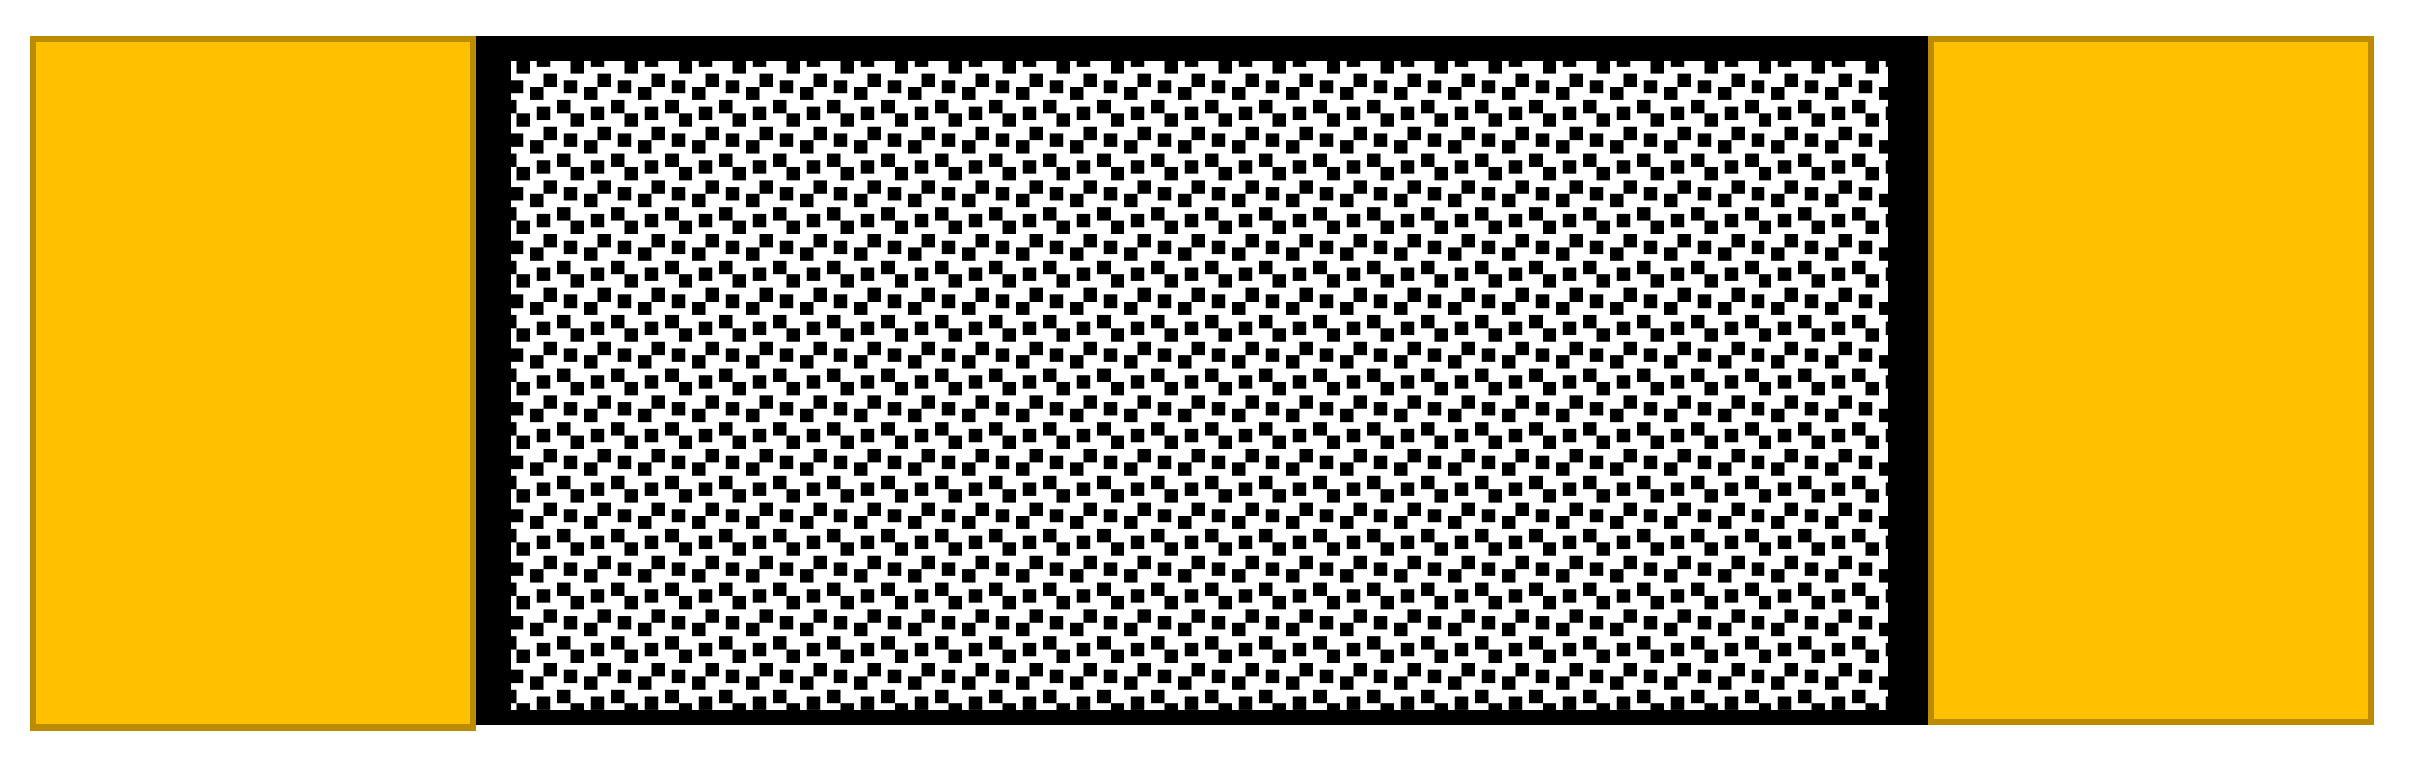
Table 1, DIC inspections were performed on TOUGH#3 and MFB#3 samples. DIC is a no-contact measurement technique based on numerical processing of digital images for the analysis of displacement and deformation fields. Through two cameras, several images are acquired, as well as an initial image representing the body in the reference condition, which is typically the undeformed configuration. The subsequent data analysis operations compare the reference image with those acquired with the body in the different deformed conditions, in order to calculate the relative displacements and deformations. In more detail, the area of interest is divided by the processing software into small square regions, named a subset. In each subset, the displacement of the central point is calculated for different time instants.
Since calculations depend on the subset correspondence within the acquired images, it is clear that the choice of suitable patterns becomes of main relevance. The special pattern used for DIC analysis is called a speckle pattern, which is typically composed of dark speckles of uniform size, distributed on a white background, to maximize contrast, as schematically shown in
Figure 8.
Proper correlation criteria have been defined to find the correspondence between each subset in the reference image and in the images acquired during the deformed states (cross correlation criteria and sum-squared differences-based criteria [
32,
33]).
In
Figure 9, the DIC instrumentation used during the tests is shown. The digital images were acquired every 3.5 s for the entire duration of the tests.
4. Numerical Results/Experimental Data Comparisons and Discussion
In this section, the experimental strain gauges reading and the DIC images and measurements are compared and integrated with the SMXB-FB numerical results, in terms of strains, out-of-plane displacements and delaminated area, as a function of the compressive load in order to better understand the influence of fracture toughness on the compressive behaviour for the analysed composite plates.
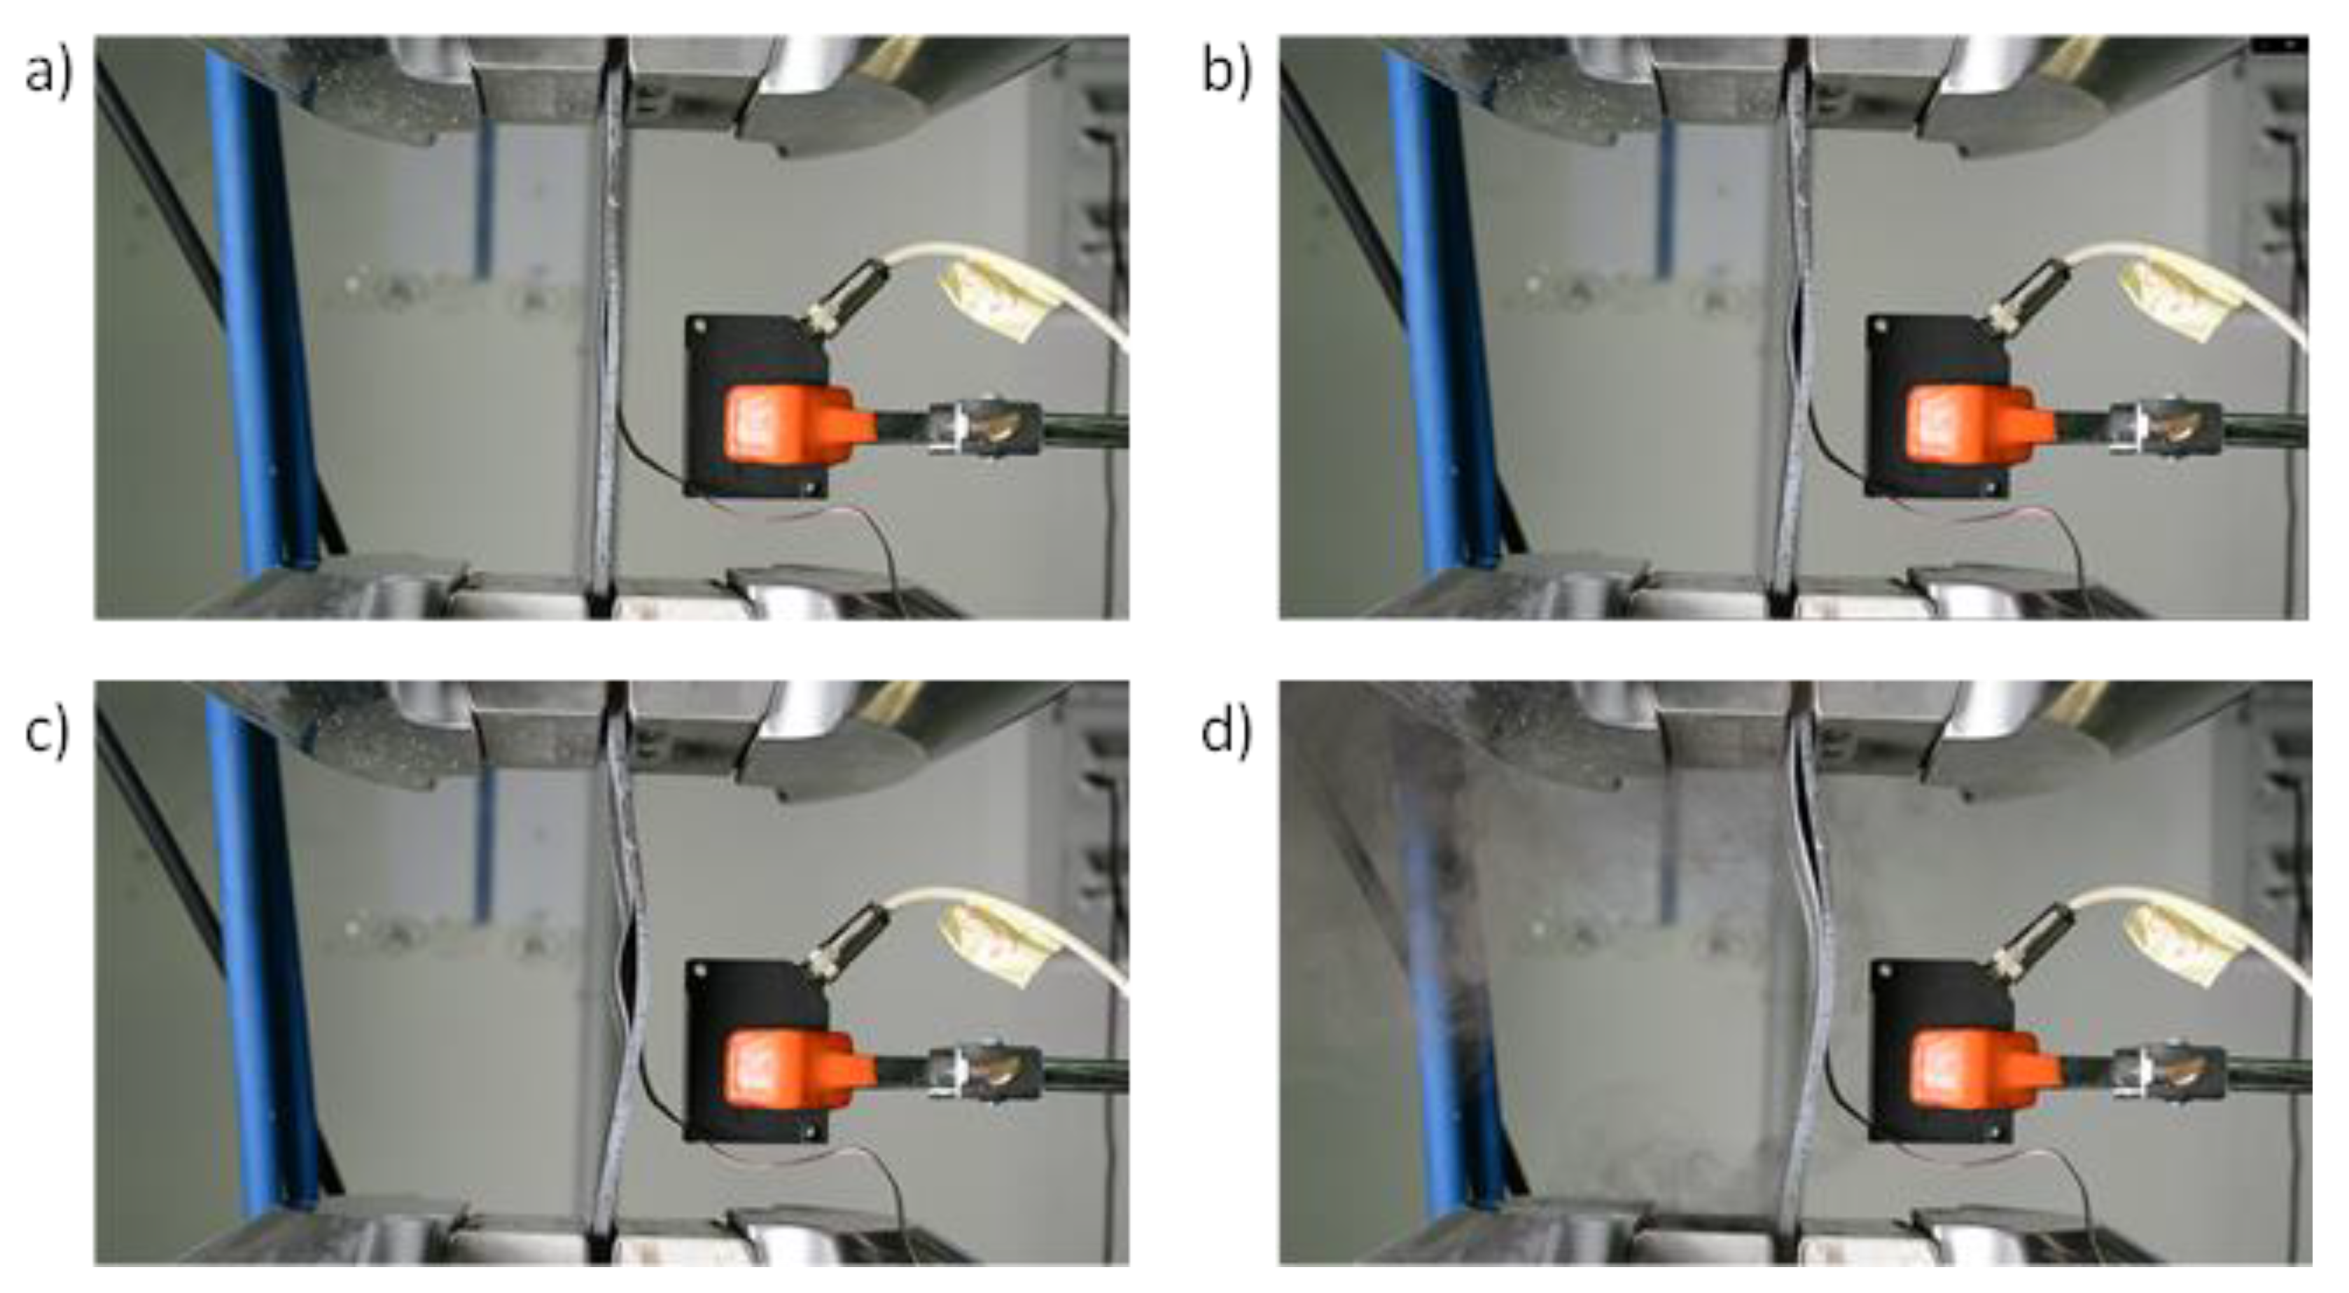
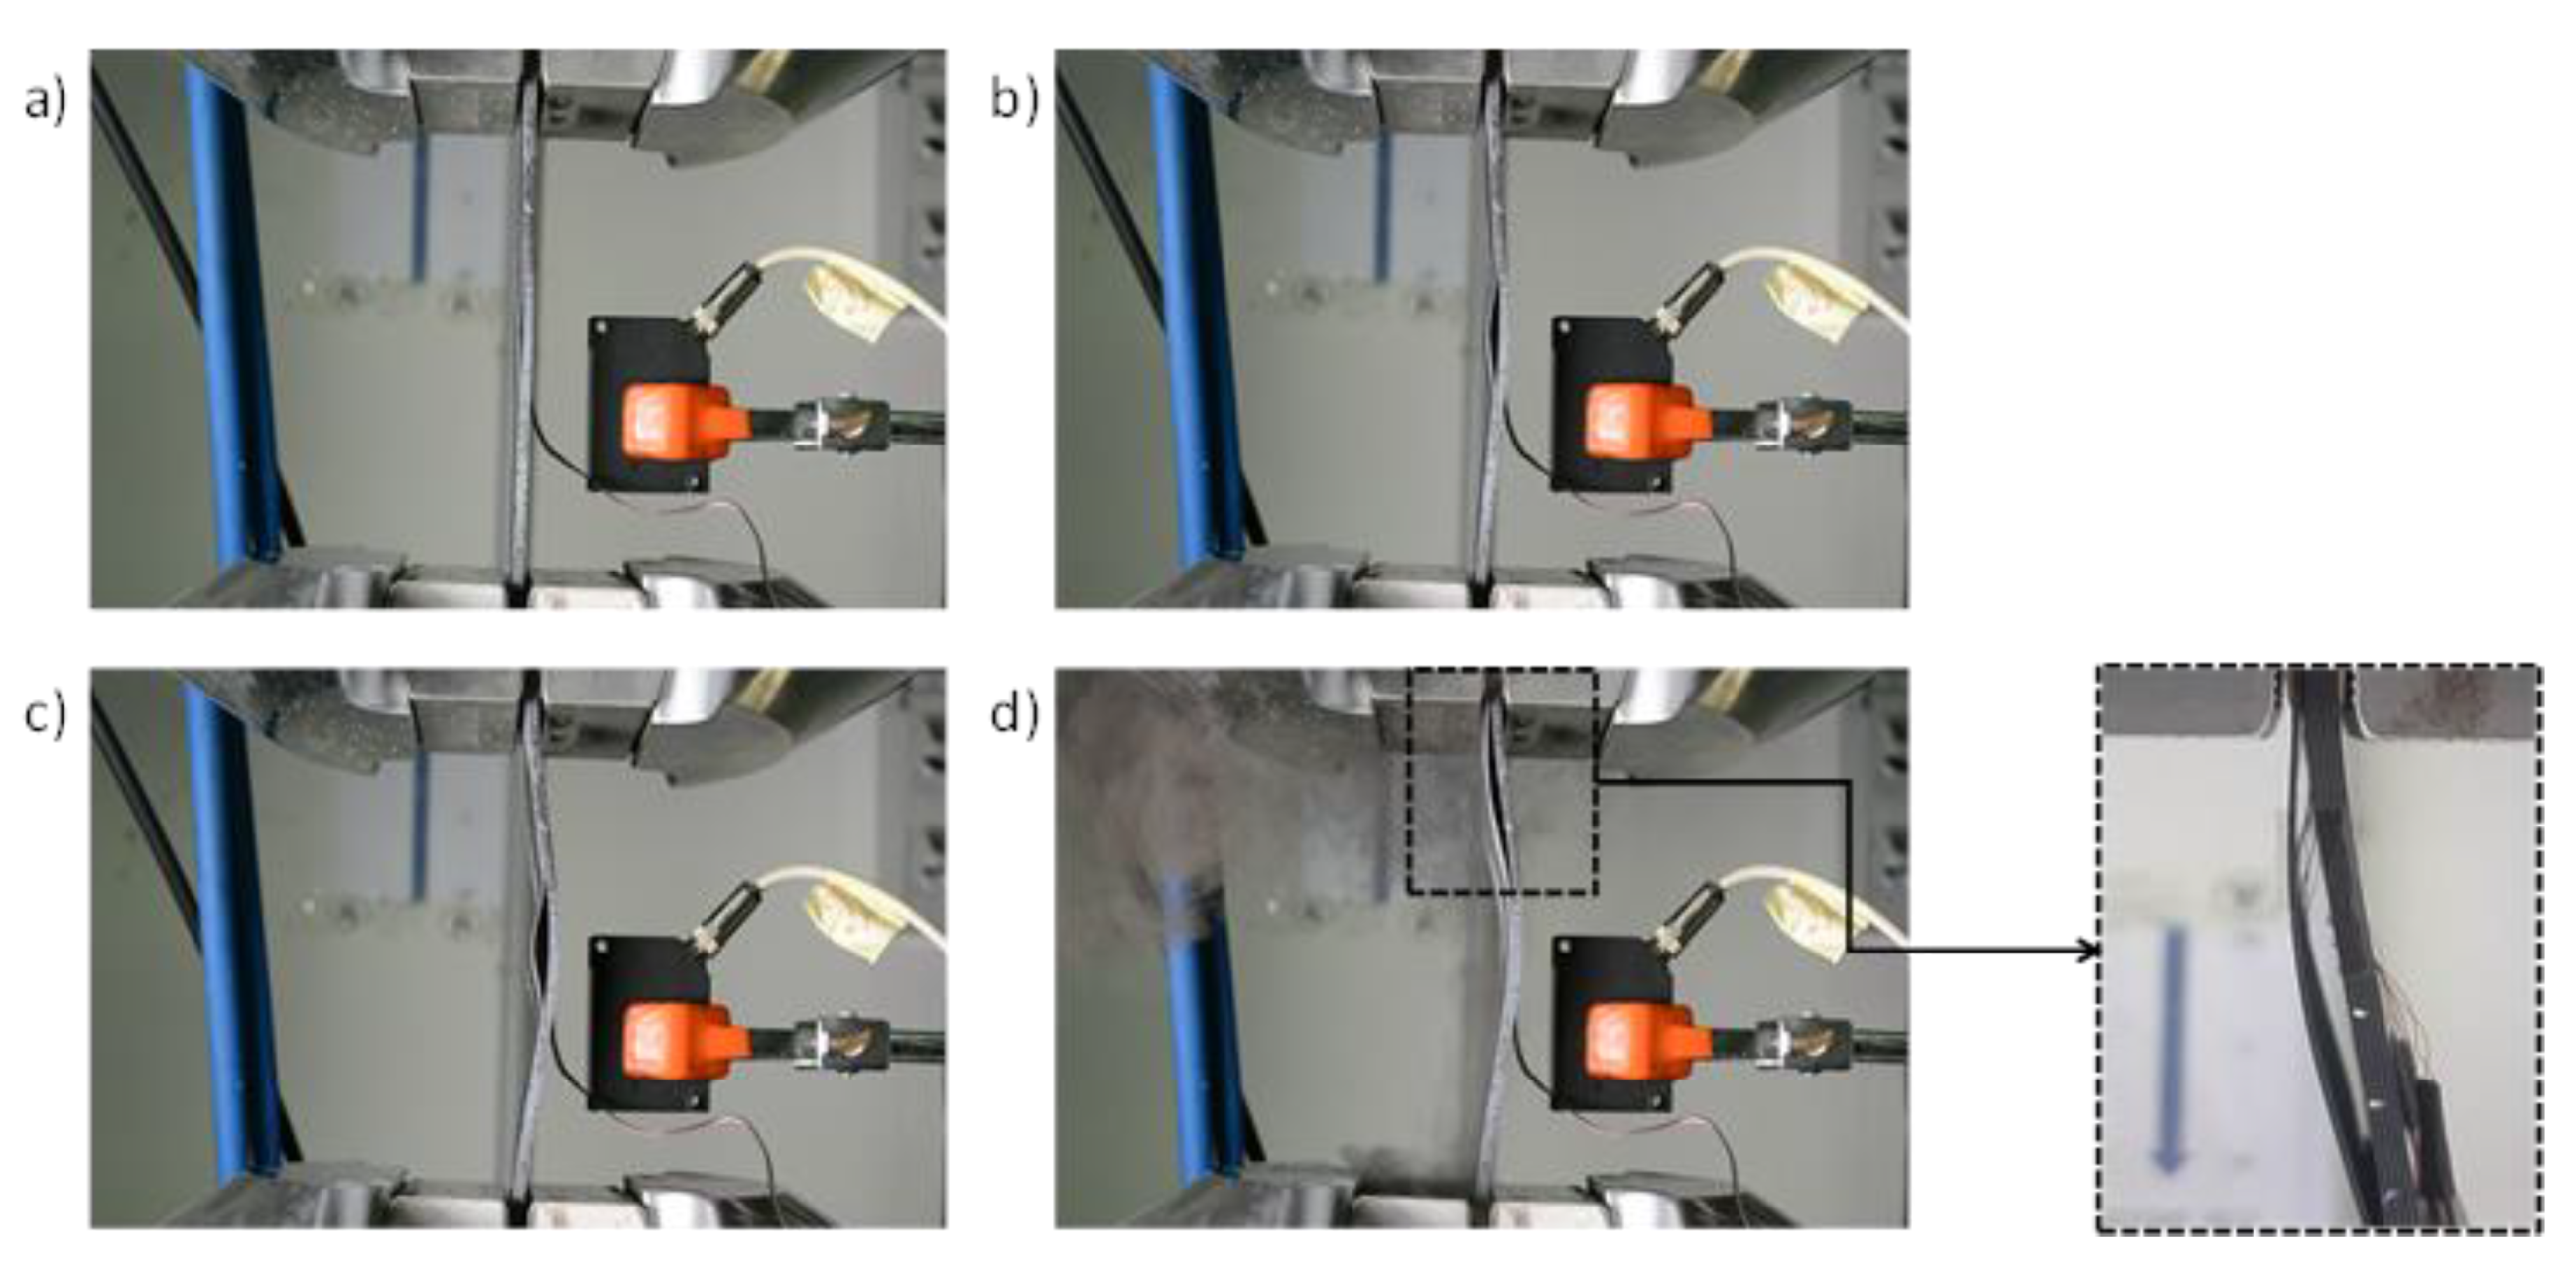
All the tested specimens showed a similar qualitative behaviour when subjected to compressive load. In order to outline the main phases during the compression tests, as an example, pictures taken during the tests are shown in
Figure 13 and
Figure 14, respectively, for a toughened sample and for a sample sensitive to fibre bridging.
In
Figure 13a and
Figure 14a the local delamination buckling onset can be seen, while in
Figure 13b and
Figure 14b the delamination growth onset can be noticed.
Figure 13c and
Figure 14c clearly show the transition to delamination buckling in the first global buckling shape, which develops in the opposite out-of-plane direction with respect to the delamination buckling. Finally,
Figure 13d and
Figure 14d show the transition to the second buckling shape (snap-through buckling phenomenon [
40,
41]) caused by a sudden delamination growth.
The fibre bridging, occurring in the coupons sensitive to fibre bridging, can be seen in
Figure 14d (zoomed view).
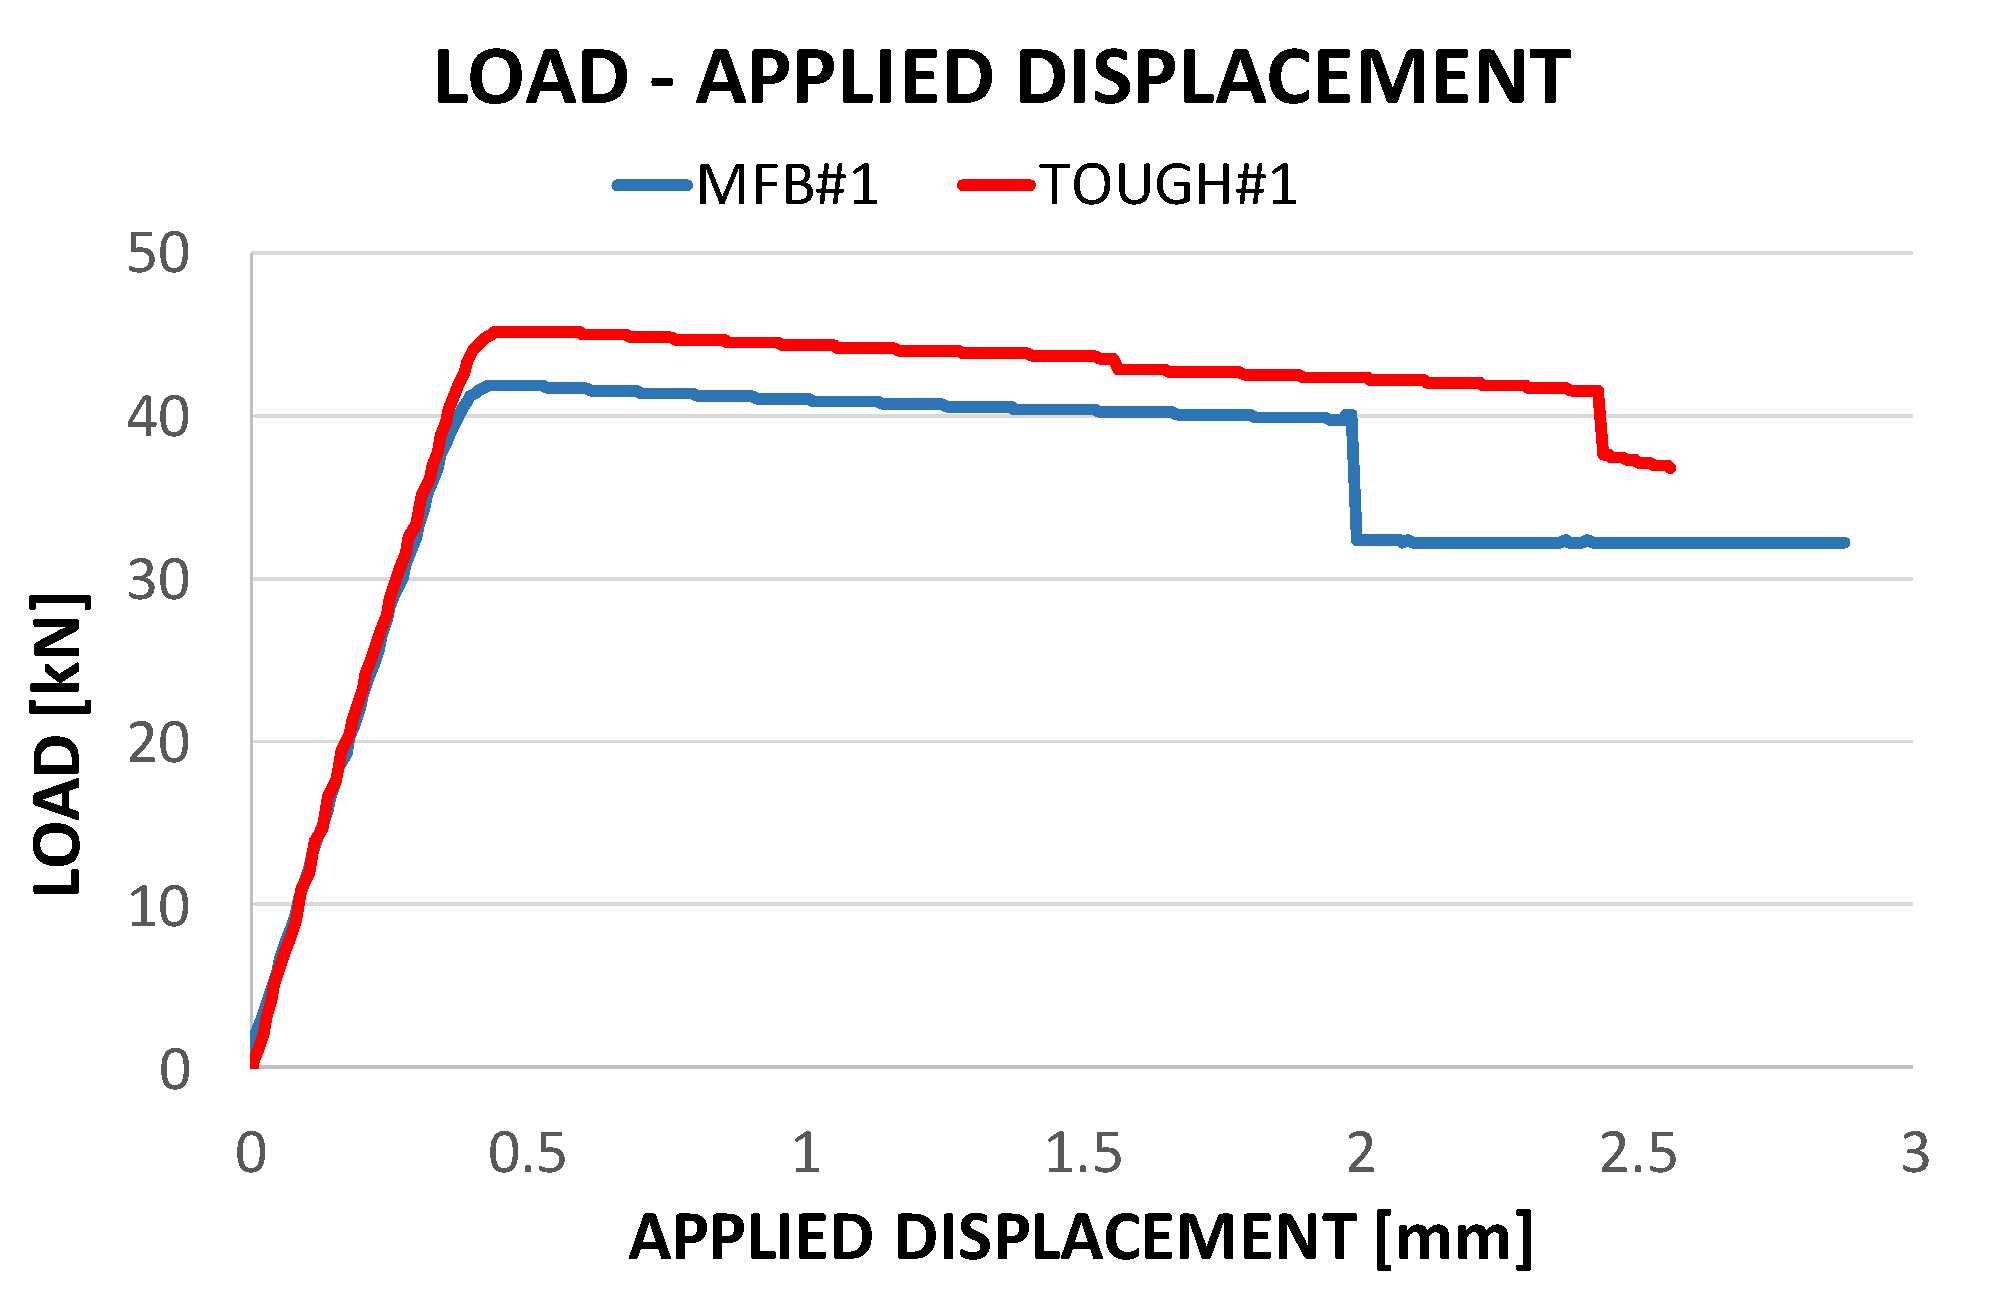
Figure 15 introduces the experimental global compressive behaviour of the coupons in terms of load vs displacements curves. Indeed, in
Figure 15 a change of slope, highlighting the global buckling phenomenon, can be observed at about 0.5 mm of applied displacement, corresponding to a compressive load of 45.2 kN in the case of toughened material and 41.2 kN in the case of material sensitive to fibre bridging. Moreover, the complete debonding state and the snap-through buckling phenomenon can be appreciated at 2.5 mm (40.4 kN) and 2 mm (39.3 kN) of applied displacement, respectively, in the case of toughened material and in the case of material sensitive to fibre bridging.
In
Table 2, a summary of the loads and strains at local delamination buckling, global buckling and snap-through is provided.
From
Table 2, it is clear that, as seen in the previous figure, the global buckling and the snap-through buckling are influenced by the fracture toughness characteristics of the material, while, since delamination growth has not yet started, the delamination buckling is, obviously, not influenced by the fracture toughness.
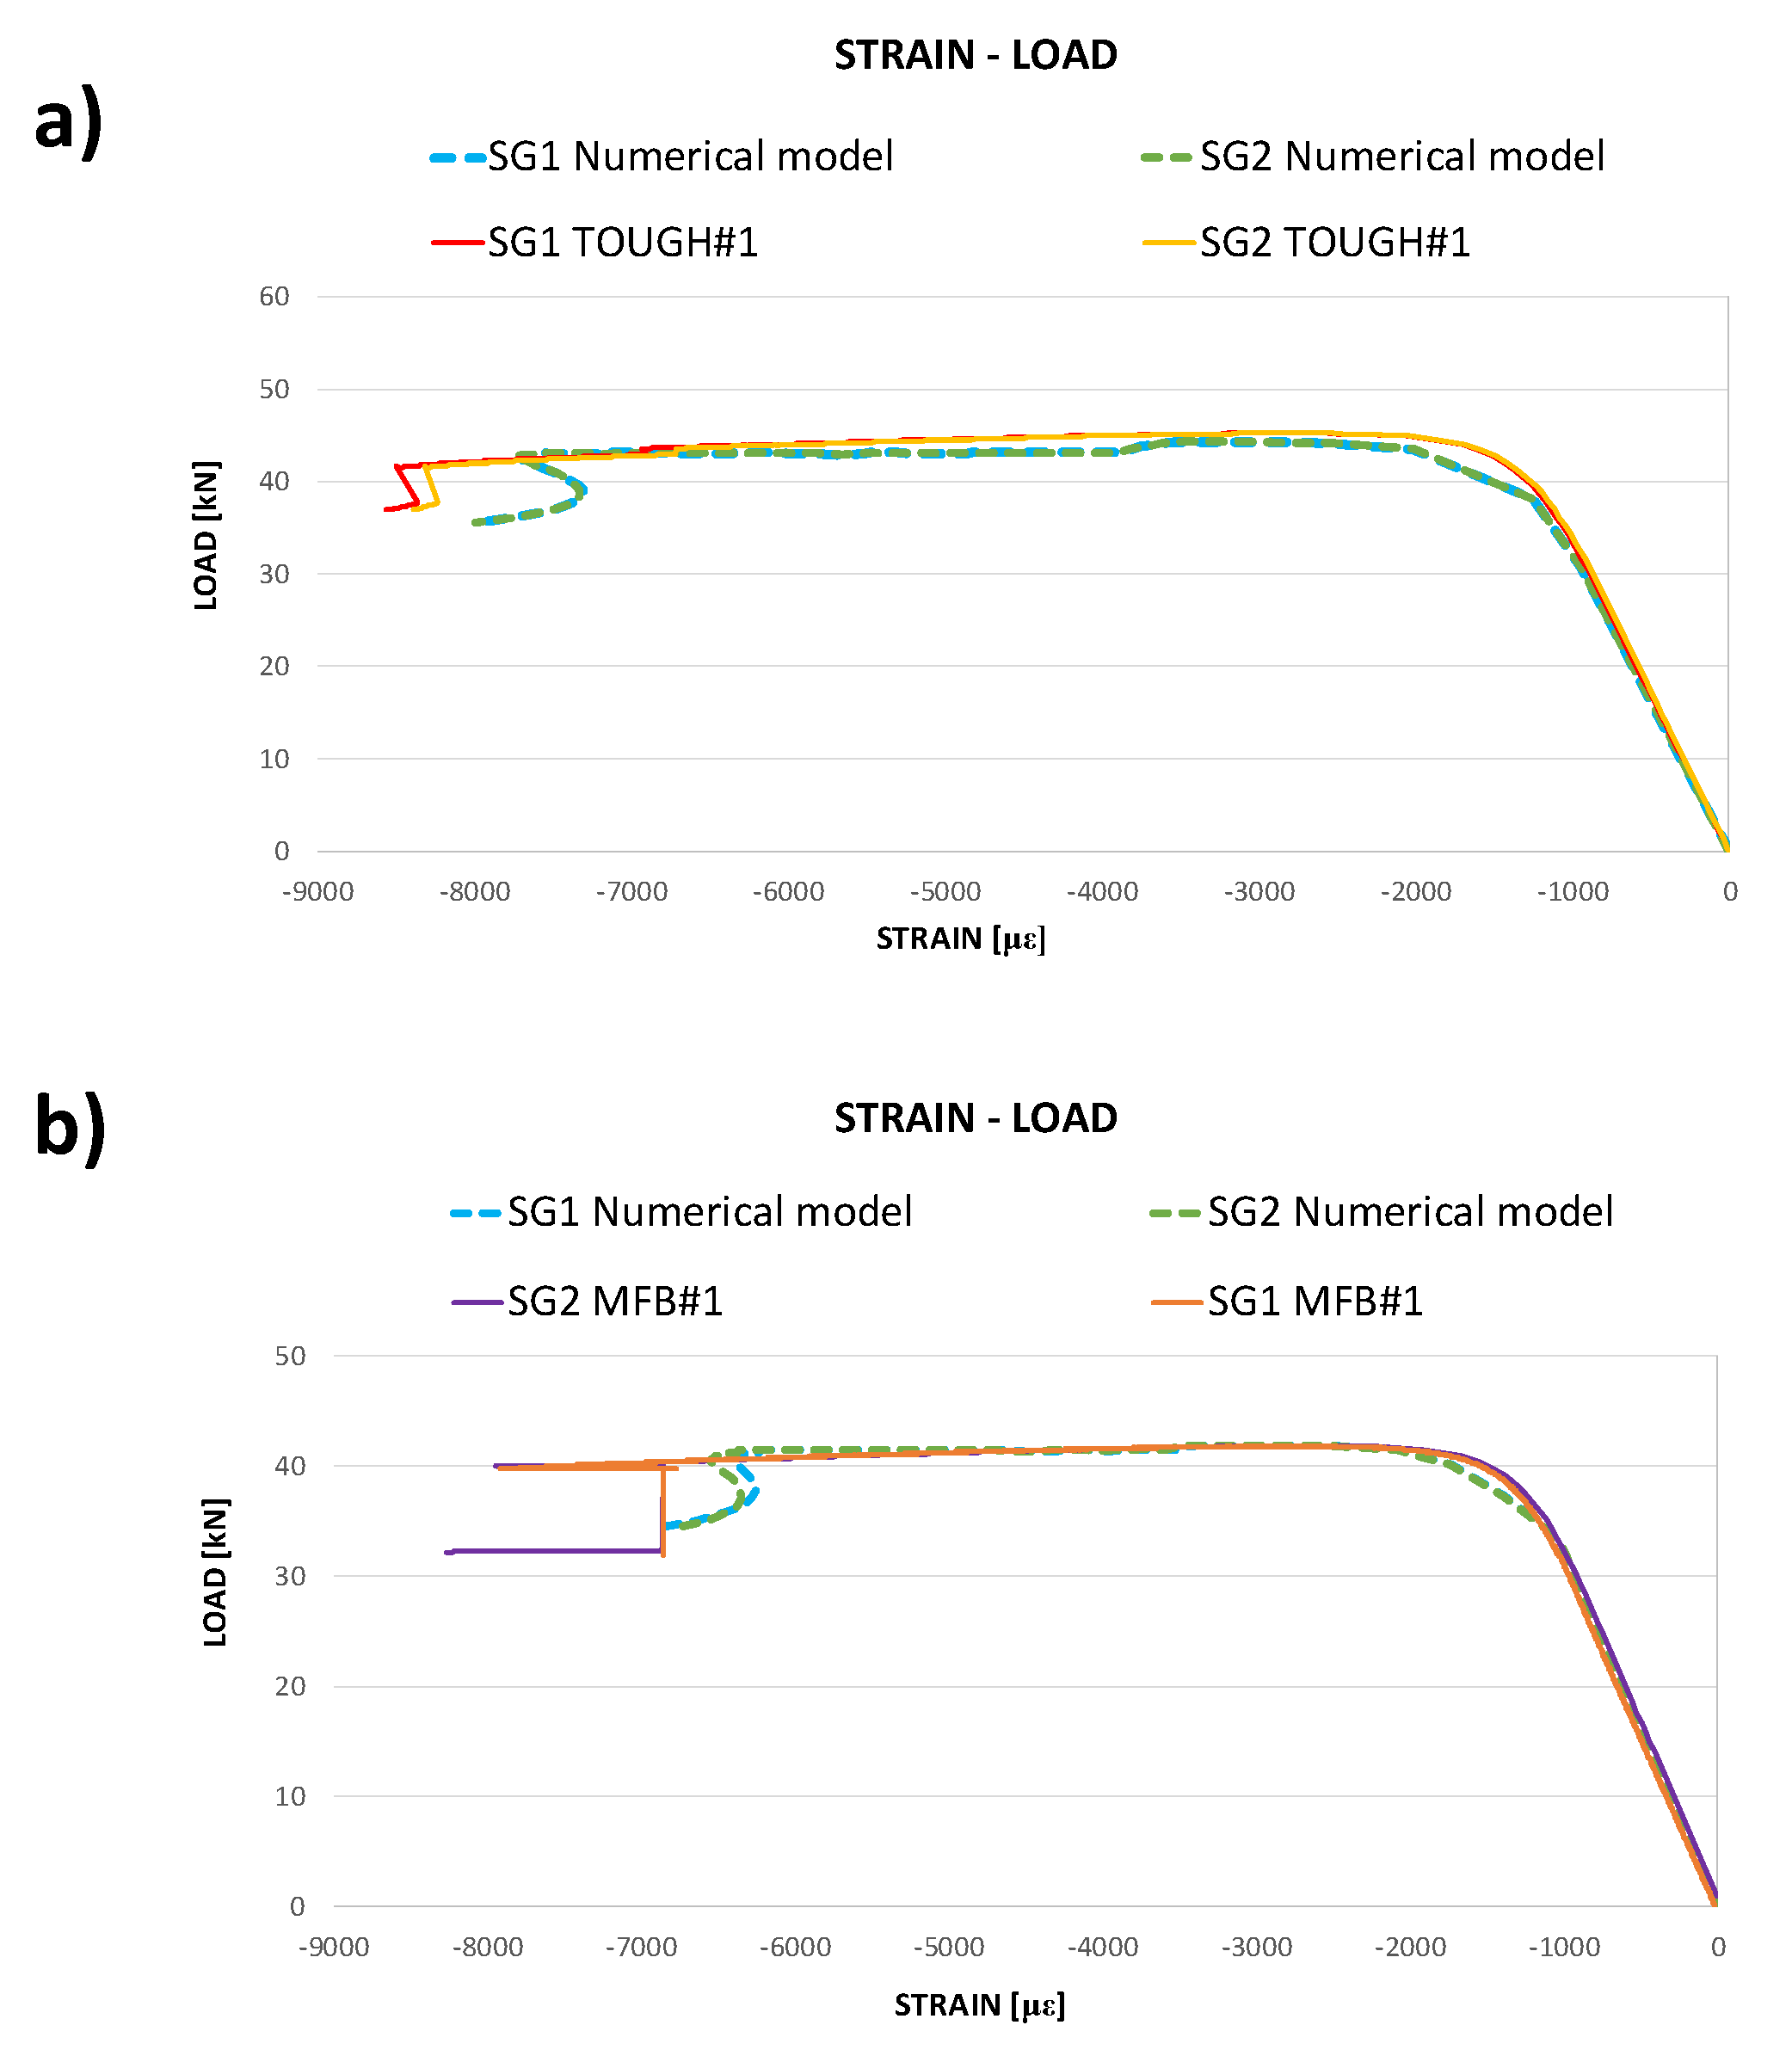
In
Figure 16, the numerical strains in the loading direction as a function of the compressive load are compared to the experimental strain gauge measurements for the toughened specimens and the specimens sensitive to fibre bridging.
According to
Figure 16, for both the analysed materials, the bending stiffness and the maximum achieved load are excellently predicted by the SMXB-FB routine. In
Figure 16, it is also possible to notice that the snap-through phenomenon is delayed in the case of toughened material and this effect is well predicted by the numerical tool used for the simulations. Indeed, the lower toughness of material sensitive to fibre bridging at delamination growth initiation causes an acceleration of the delamination growth phenomenon with consequent earlier conditions of elastic instability leading to the snap-through event, if compared to the toughened material.
However, the ultimate strains values are slightly underestimated by the numerical code for both the material configurations. Indeed, with the displacement control method, which has been used in this work, the performed static analyses can provide incomplete or misguided information about the stability of the sample in the presence of dynamic phenomena, such as snap-through buckling. Anyway, even in the presence of dynamic snap-through buckling, the trend of numerical results is in excellent agreement with that of experimental outputs, mainly due to the almost quasi-static behaviour of the sample up to the snap-through buckling.
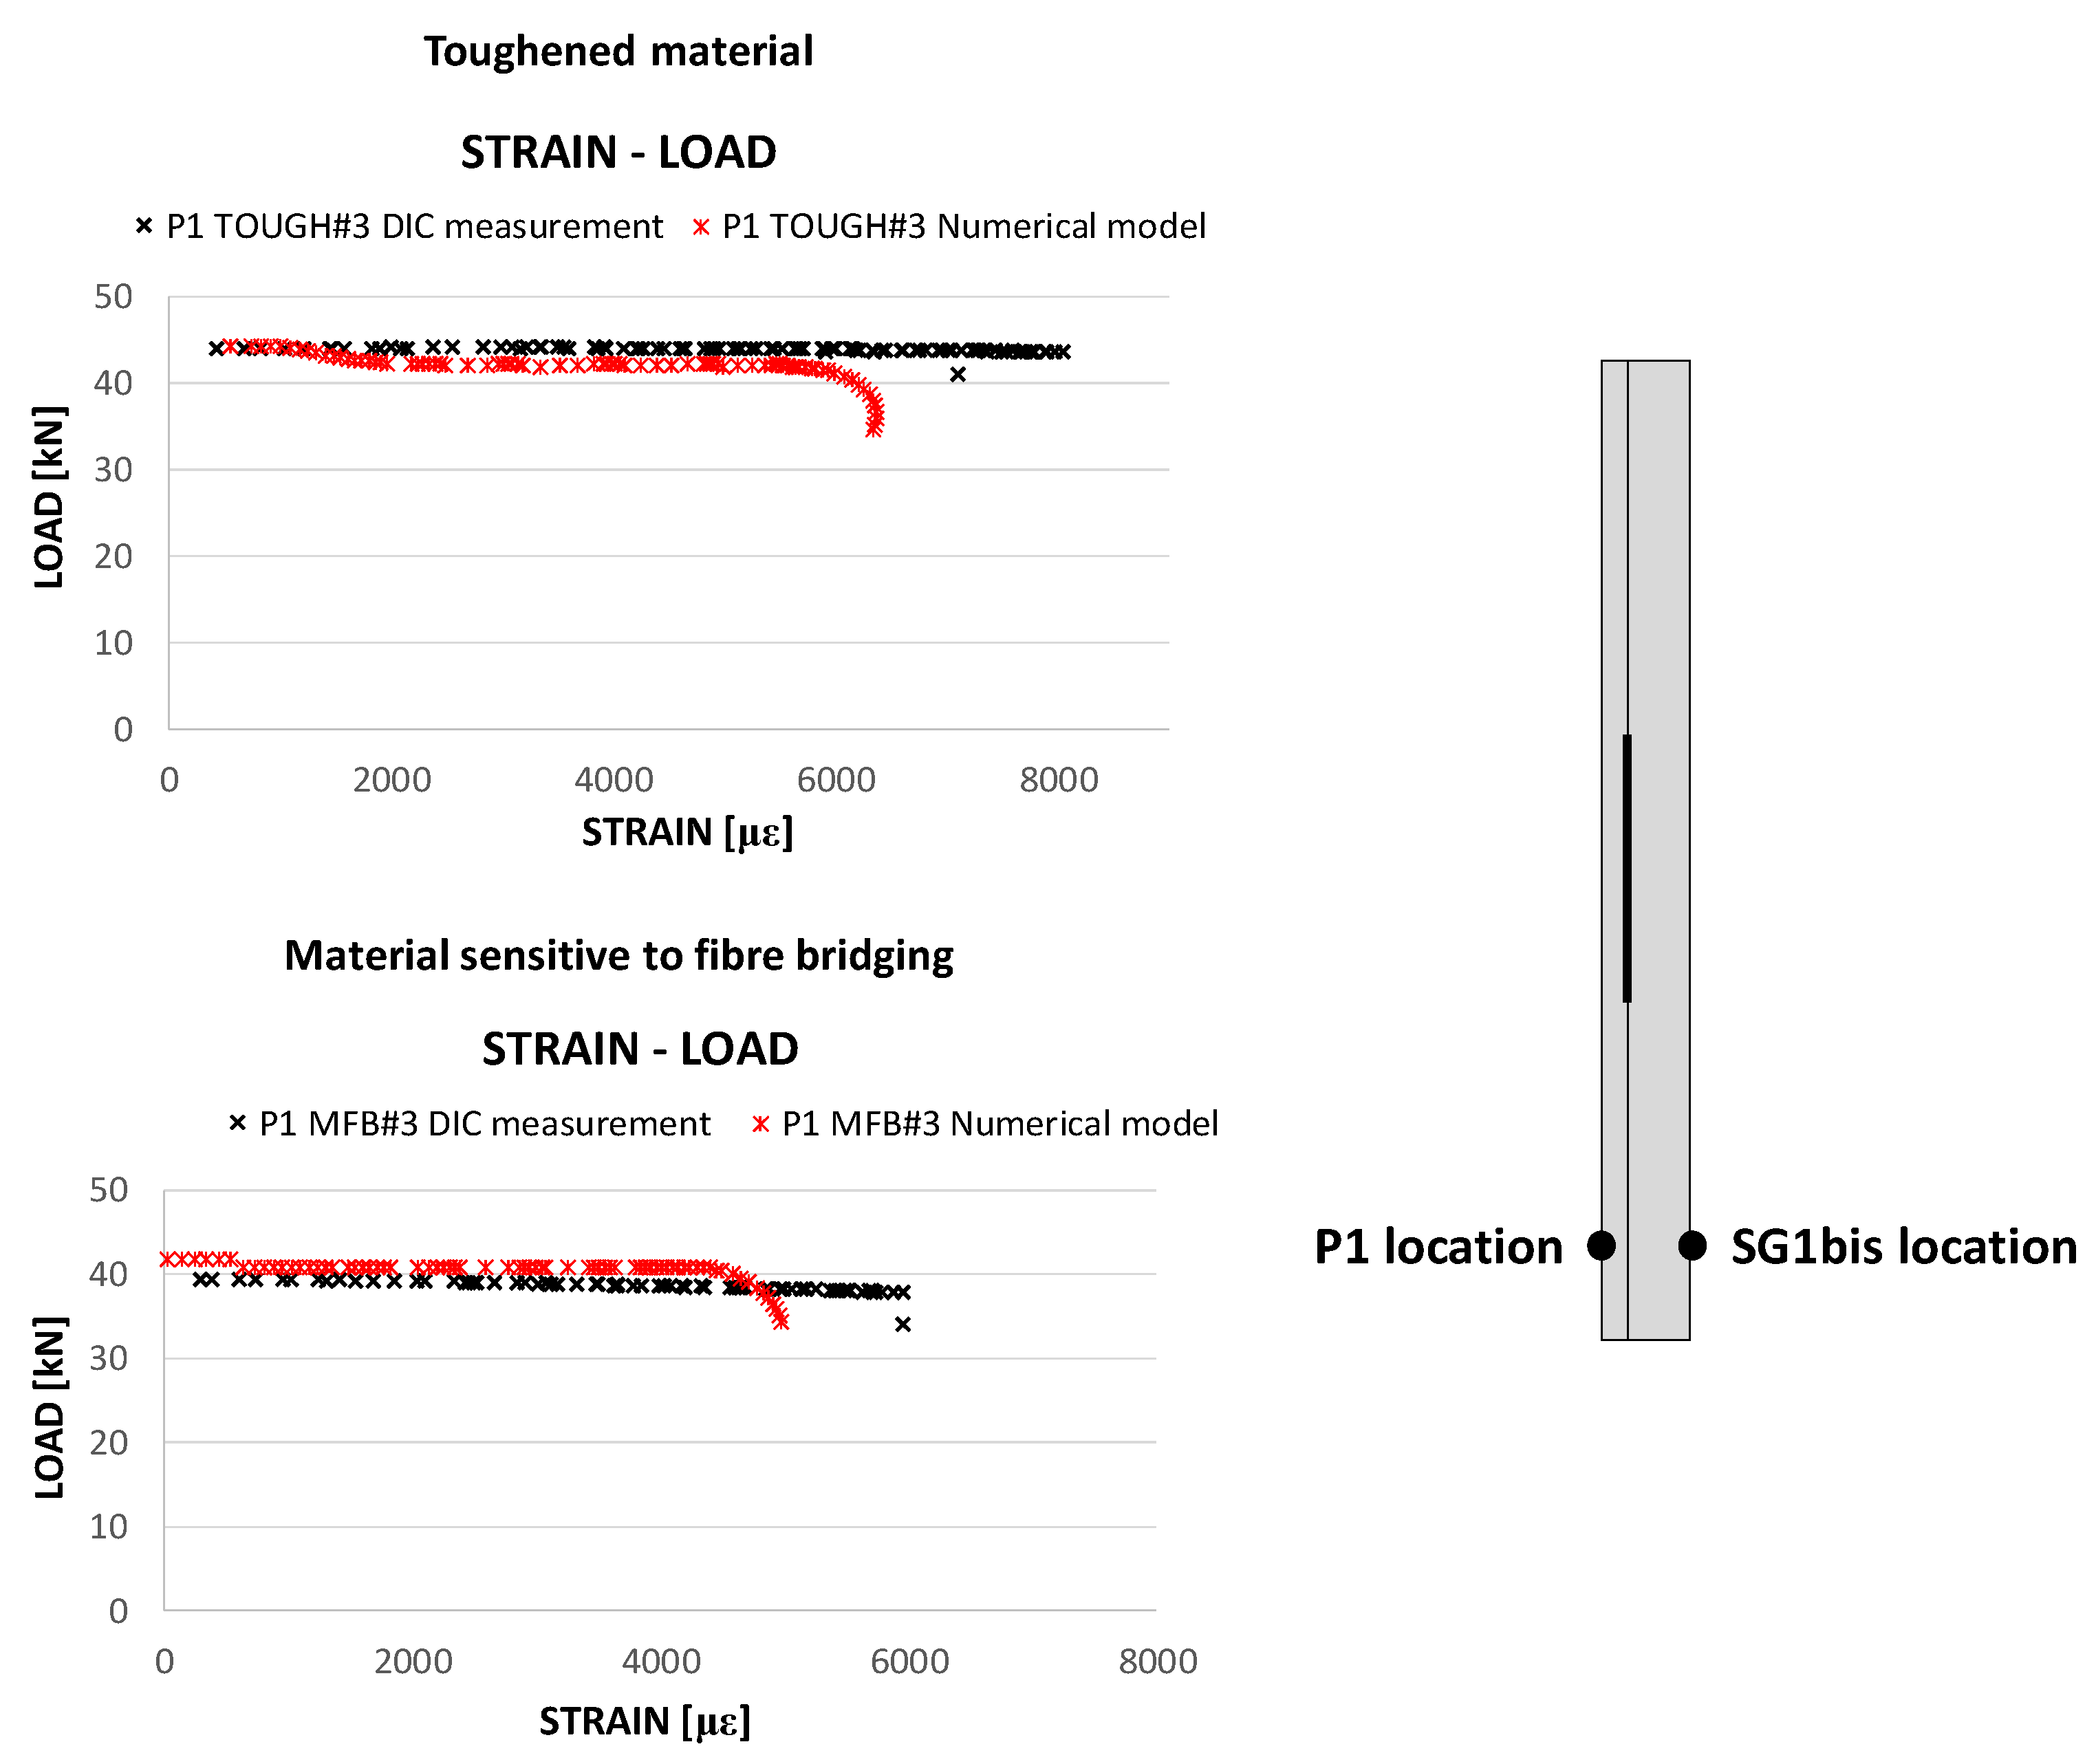
Such a discrepancy in the ultimate deformation values is also pointed out in
Figure 17, where the strains measured by means of the DIC system at the P1 location (shown in
Figure 17) are compared with the numerical strains at the same location. Indeed, at higher strain values, misalignment between numerical and experimental results can be seen because of the presence of dynamic phenomena, which were neglected in the numerical analyses.
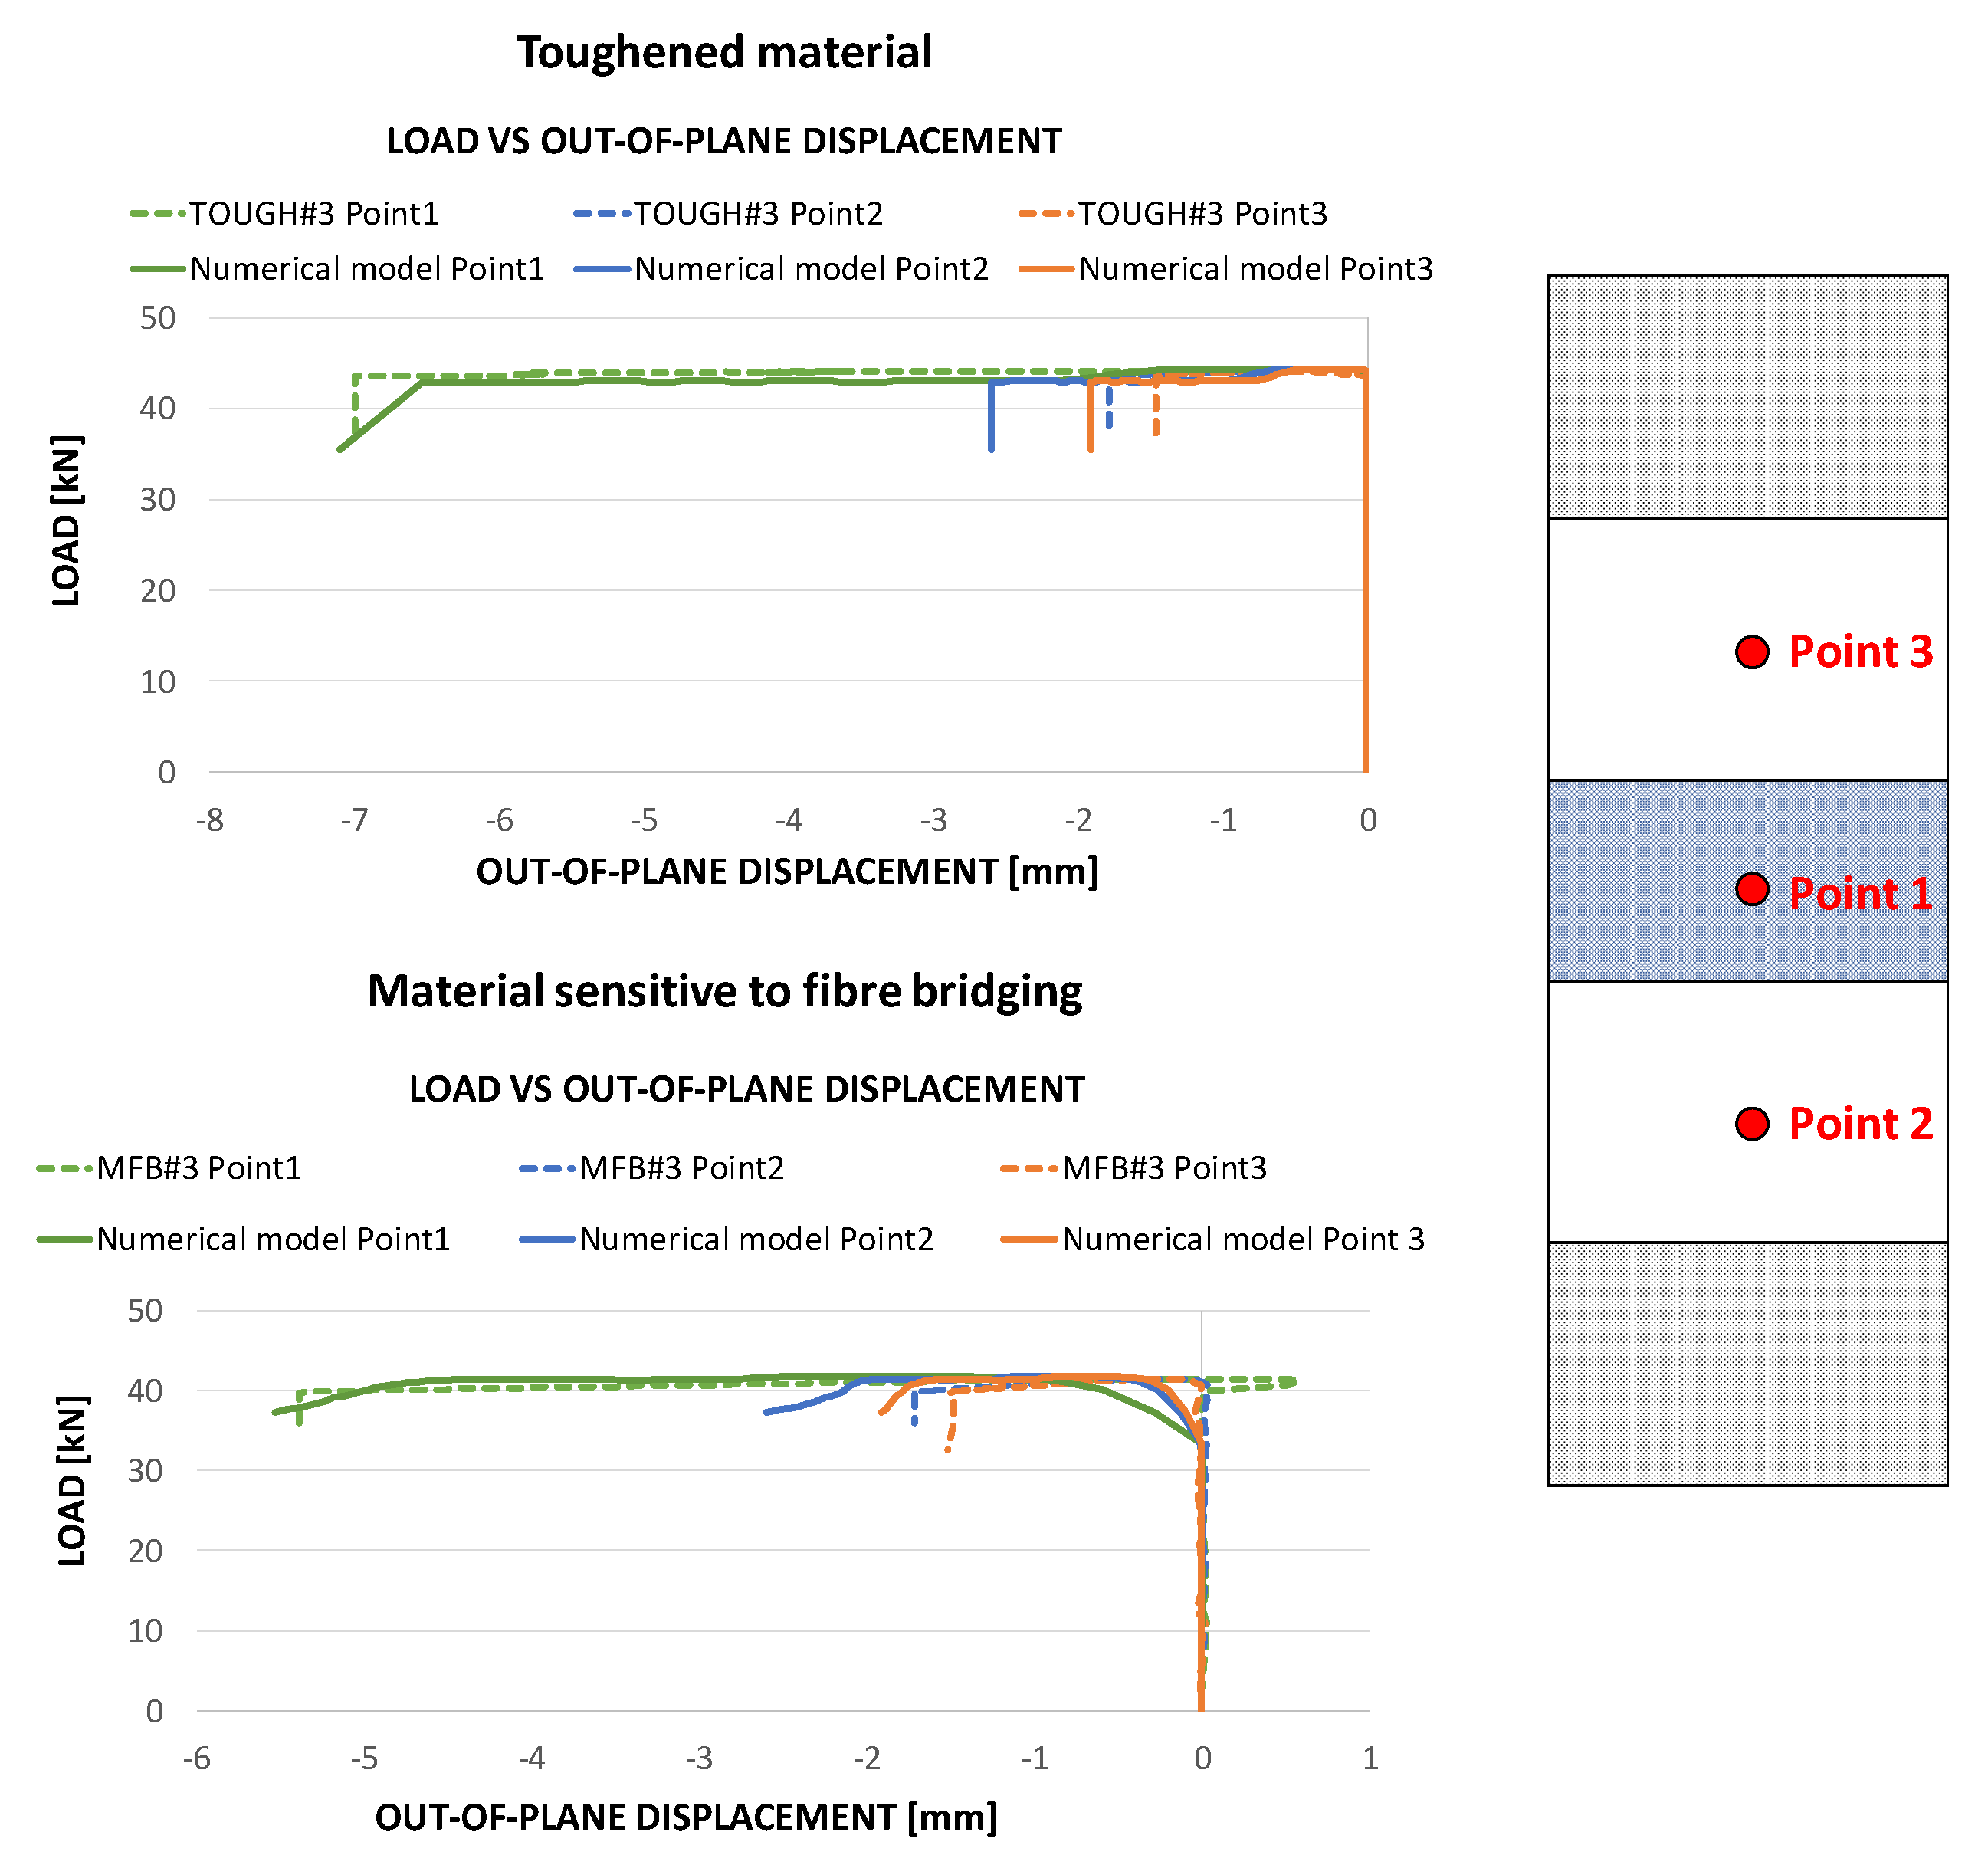
In
Figure 18, the load vs out-of-plane displacements curve, experimentally obtained by the DIC system, for the toughened material and material sensitive to fibre bridging, are compared to the numerical results. According to
Figure 18, the out-of-plane displacement at the central location (Point 1) is predicted with excellent accuracy, while the experimentally determined out-of-plane displacements at Point 2 and Point 3 locations are slightly overestimated by the numerical tool. Actually, as seen from the deformed shapes, the dynamic effects due to the buckling shape change are localised at Point 2 and Point 3.
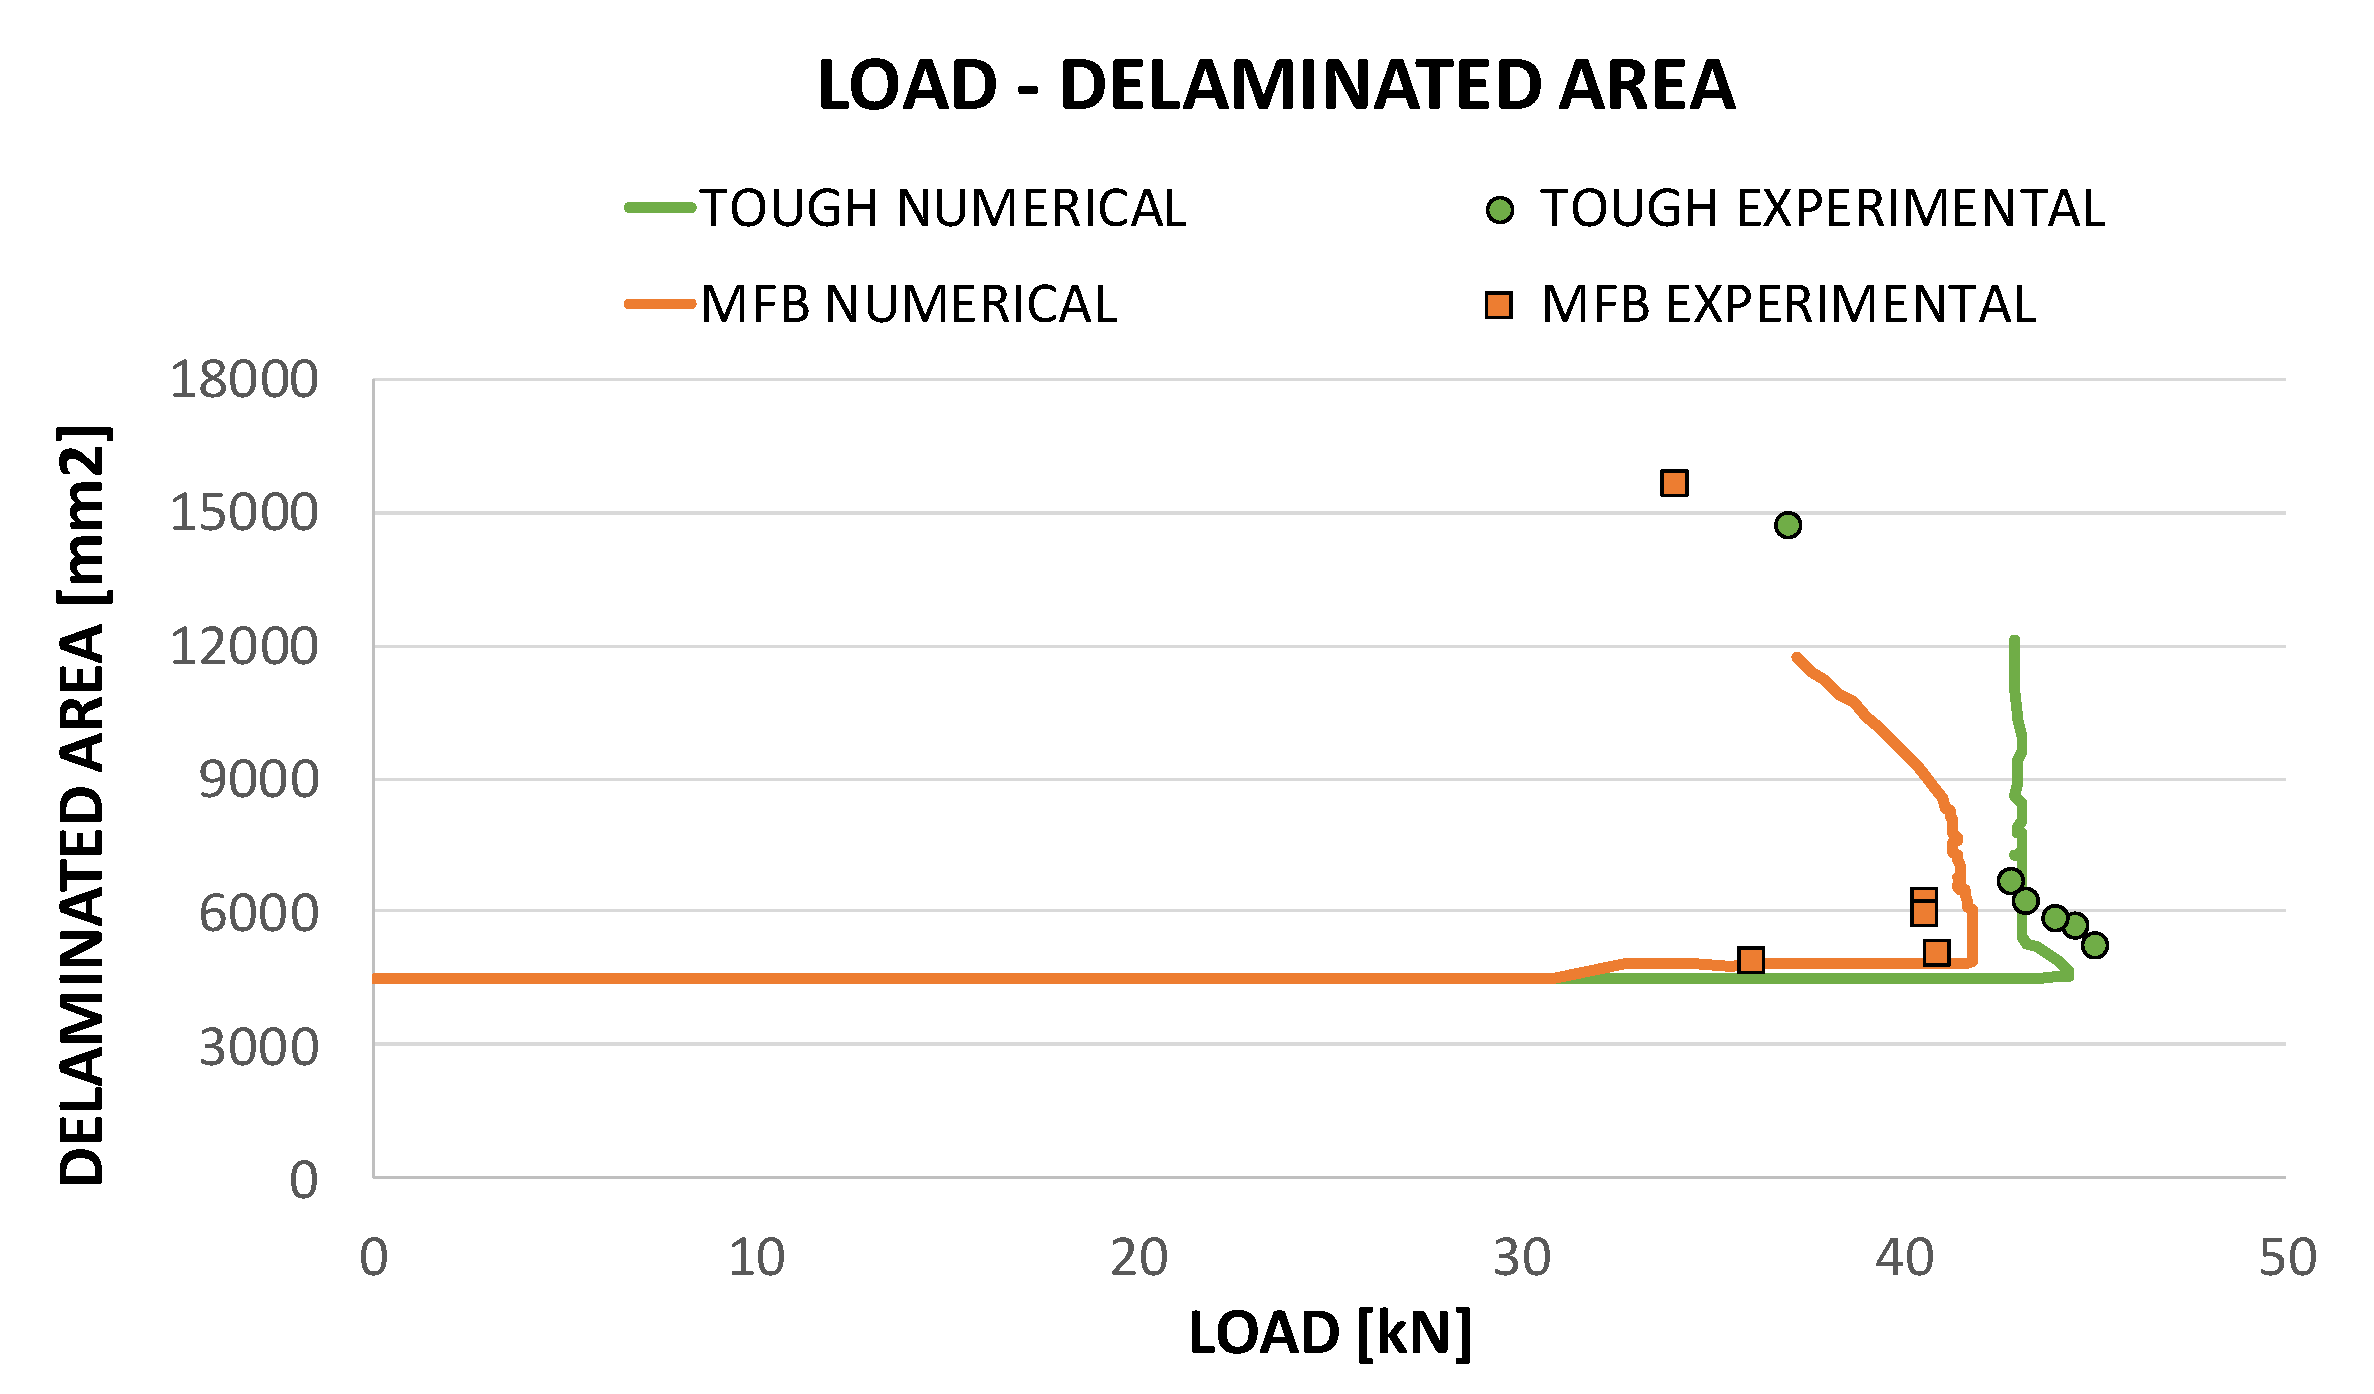
The growth of the delaminated area was analysed for the two material configurations, both experimentally and numerically during the loading process, providing interesting indications of the GIc influence on the delamination evolution. Numerical results and experimental data in terms of delamination size as a function of the compressive load are presented, compared and integrated in
Figure 19, for the two analysed material configurations.
Figure 19 shows that, for both the analysed material configurations, the numerical predictions give a valuable contribution to the clarification of experimental data. Indeed, the trends of the delaminated area vs compressive load point out that, for the material sensitive to fibre bridging, the delamination growth is anticipated (32 kN) with respect to the toughened configuration (43 kN). For the material sensitive to fibre bridging configurations, after a stable delamination opening, an unstable propagation occurs, leading to the snap-through phenomenon. On the contrary, the toughened material is characterised by a highly unstable delamination growth since delamination growth initiation occurs very close to the global buckling. As already pointed out, the numerical tool adopted for the analyses is not able to account for the dynamic effects, hence it is not able to give a prediction of the delamination growth beyond the snap-through phenomenon.
As already mentioned, digital image correlation inspections were performed on two of the tested samples (TOUGH#3 and MFB#3).
Figure 20 shows the out-of-plane displacement contour plot obtained by means of the DIC technique, as an example, for the case MFB#3.
As for
Figure 13 and
Figure 14, in
Figure 20a the local delamination buckling onset can be seen, while in
Figure 20b the delamination growth onset can be pointed out.
Figure 20c clearly shows the transition from delamination buckling to the first global buckling shape which develops in the opposite out-of-plane direction with respect to the delamination buckling. Finally,
Figure 20d shows the transition to the second buckling shape caused by a sudden and unstable delamination growth phenomenon.
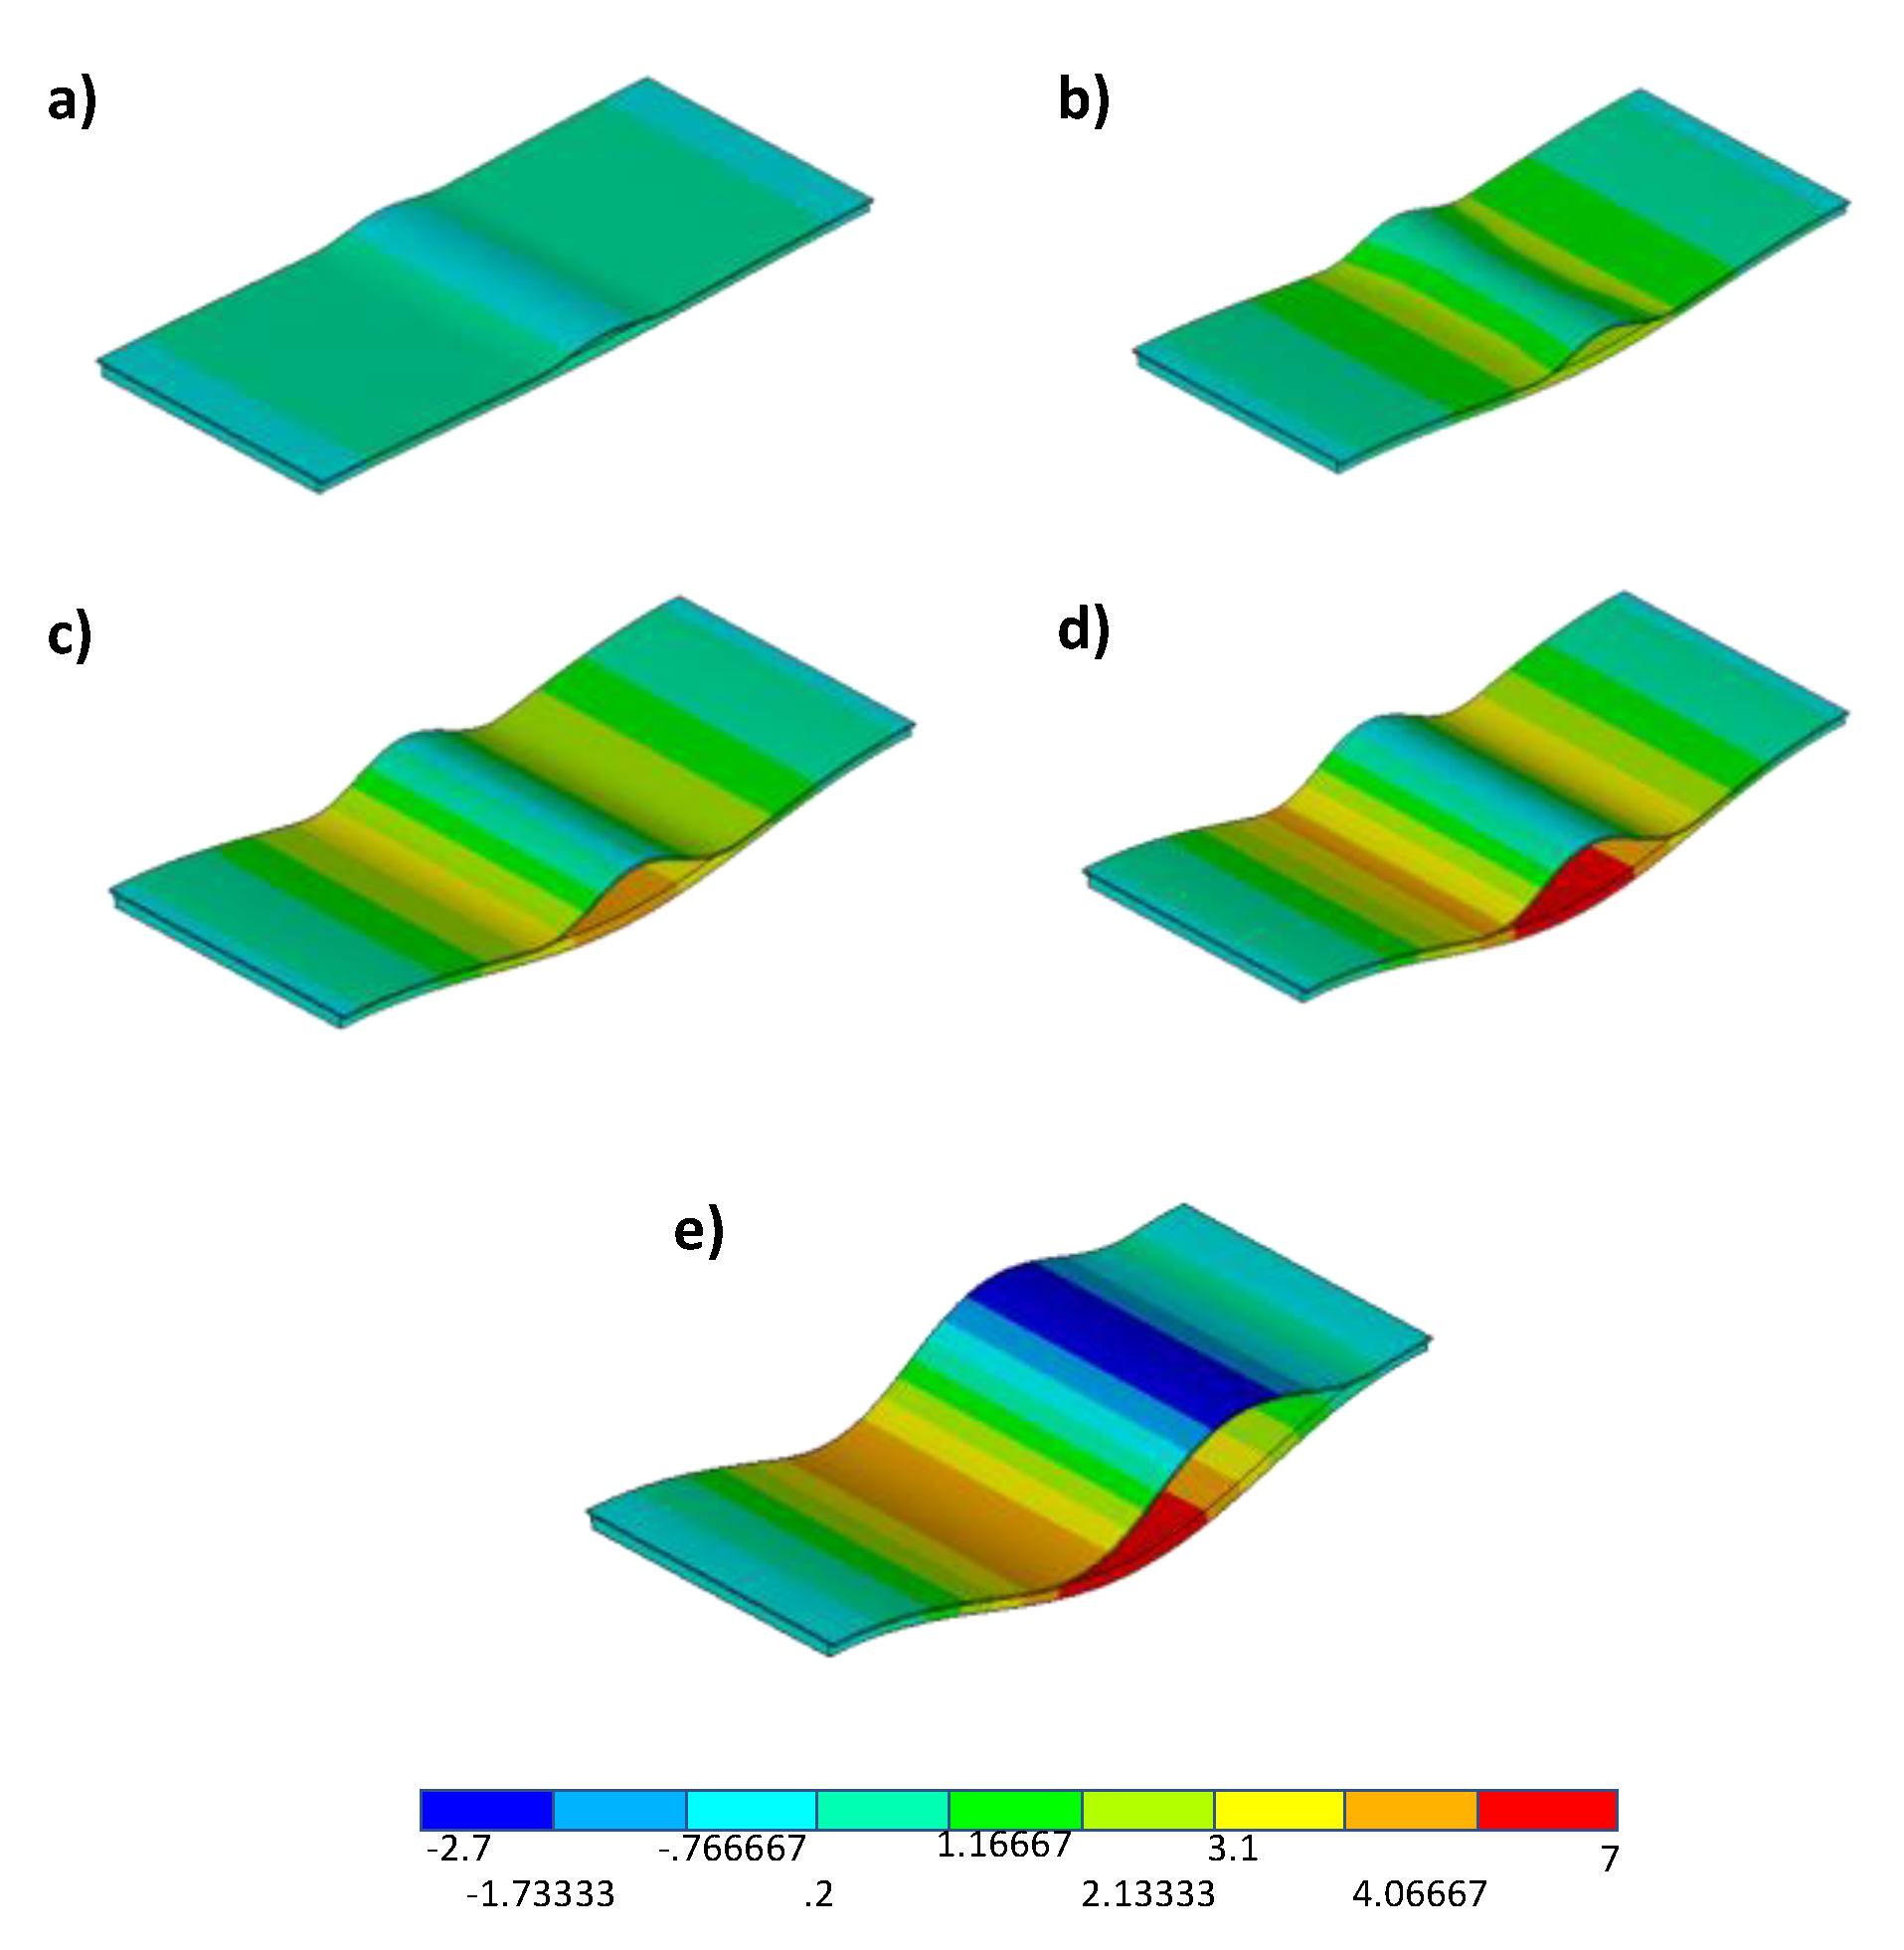
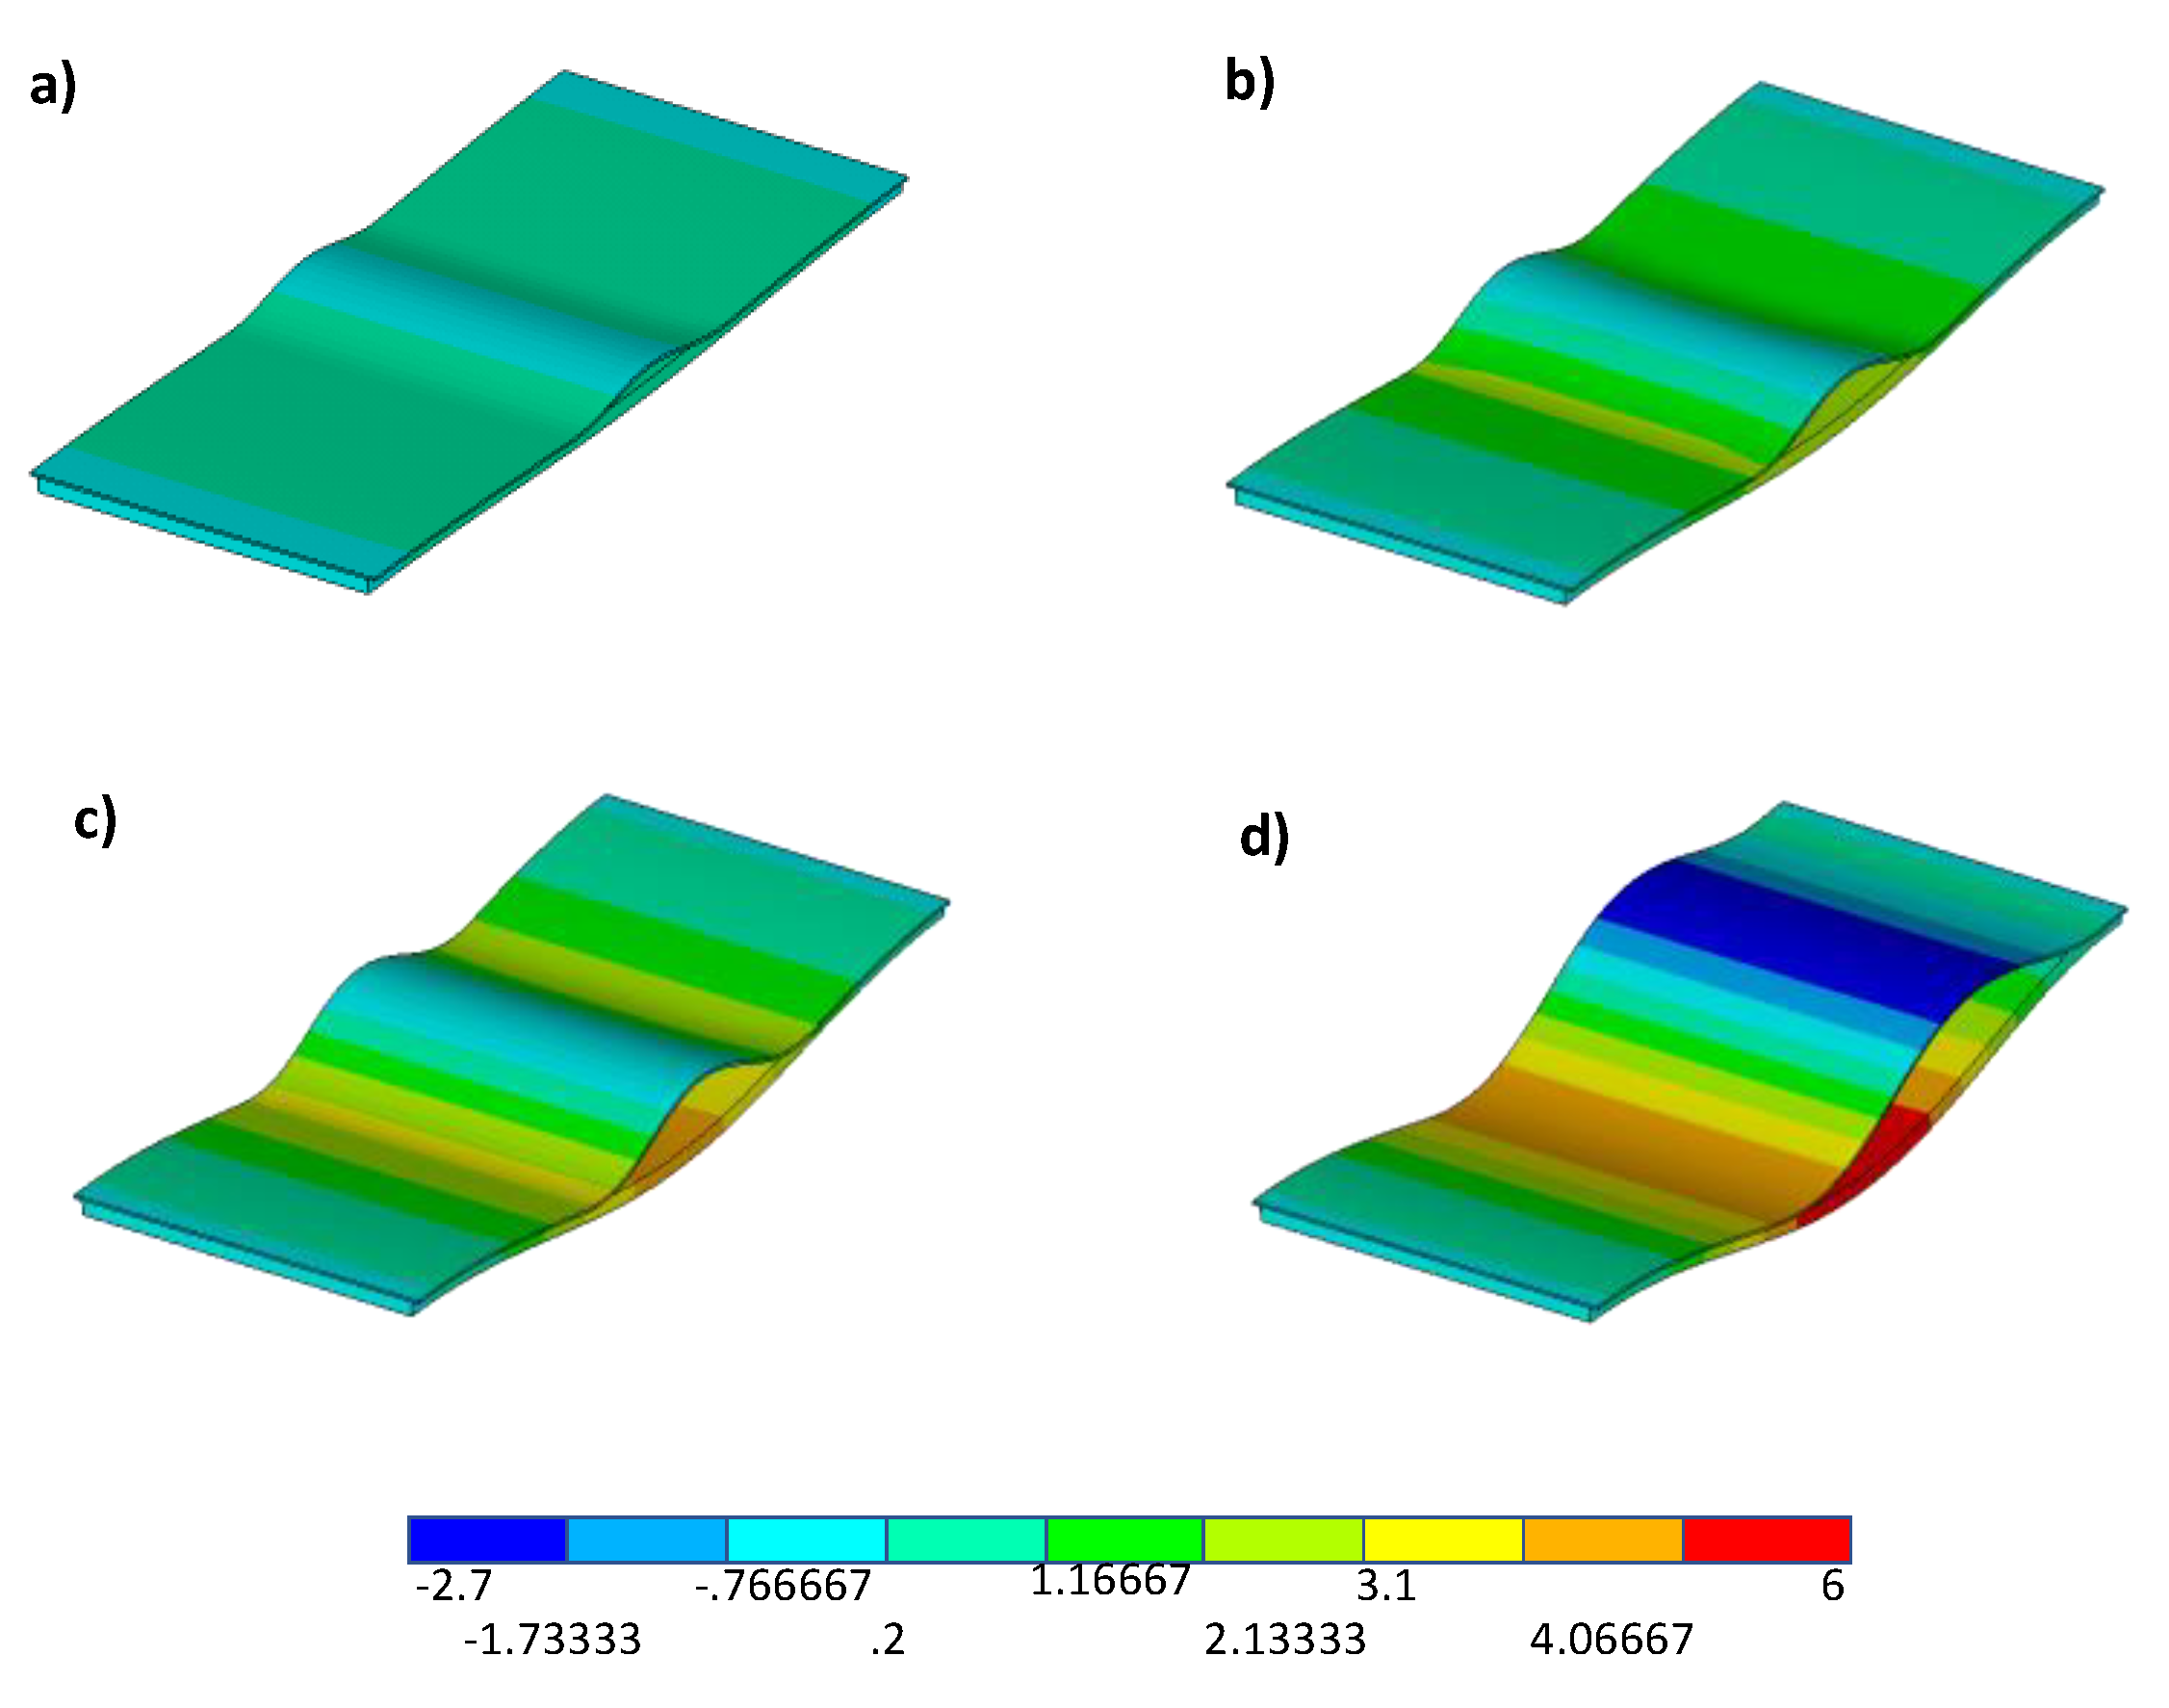
Figure 21 and
Figure 22 show the numerically deformed shapes with the out-of-plane displacement contour plot, evaluated at four fixed values of the applied displacement, respectively, for the sample characterized by toughened material and the sample characterized by material sensitive to fibre bridging.
Figure 21 and
Figure 22 point out the delay in the delamination growth phenomenon and, hence, in the snap-through phenomenon observed for the toughened material configuration, characterised by a constantly higher GIc, with respect to the material sensitive to fibre bridging configuration. Actually, the configuration made of material sensitive to fibre bridging (MFB) is characterised by a lower starting value of the fracture toughness, if compared to the toughened material (TOUGH). This leads to an earlier, even if more stable, delamination growth in the first case (MFB) with respect to the case of toughened material (TOUGH), whose delamination growth initiates with a highly unstable behaviour at higher loads (close to the global buckling load).
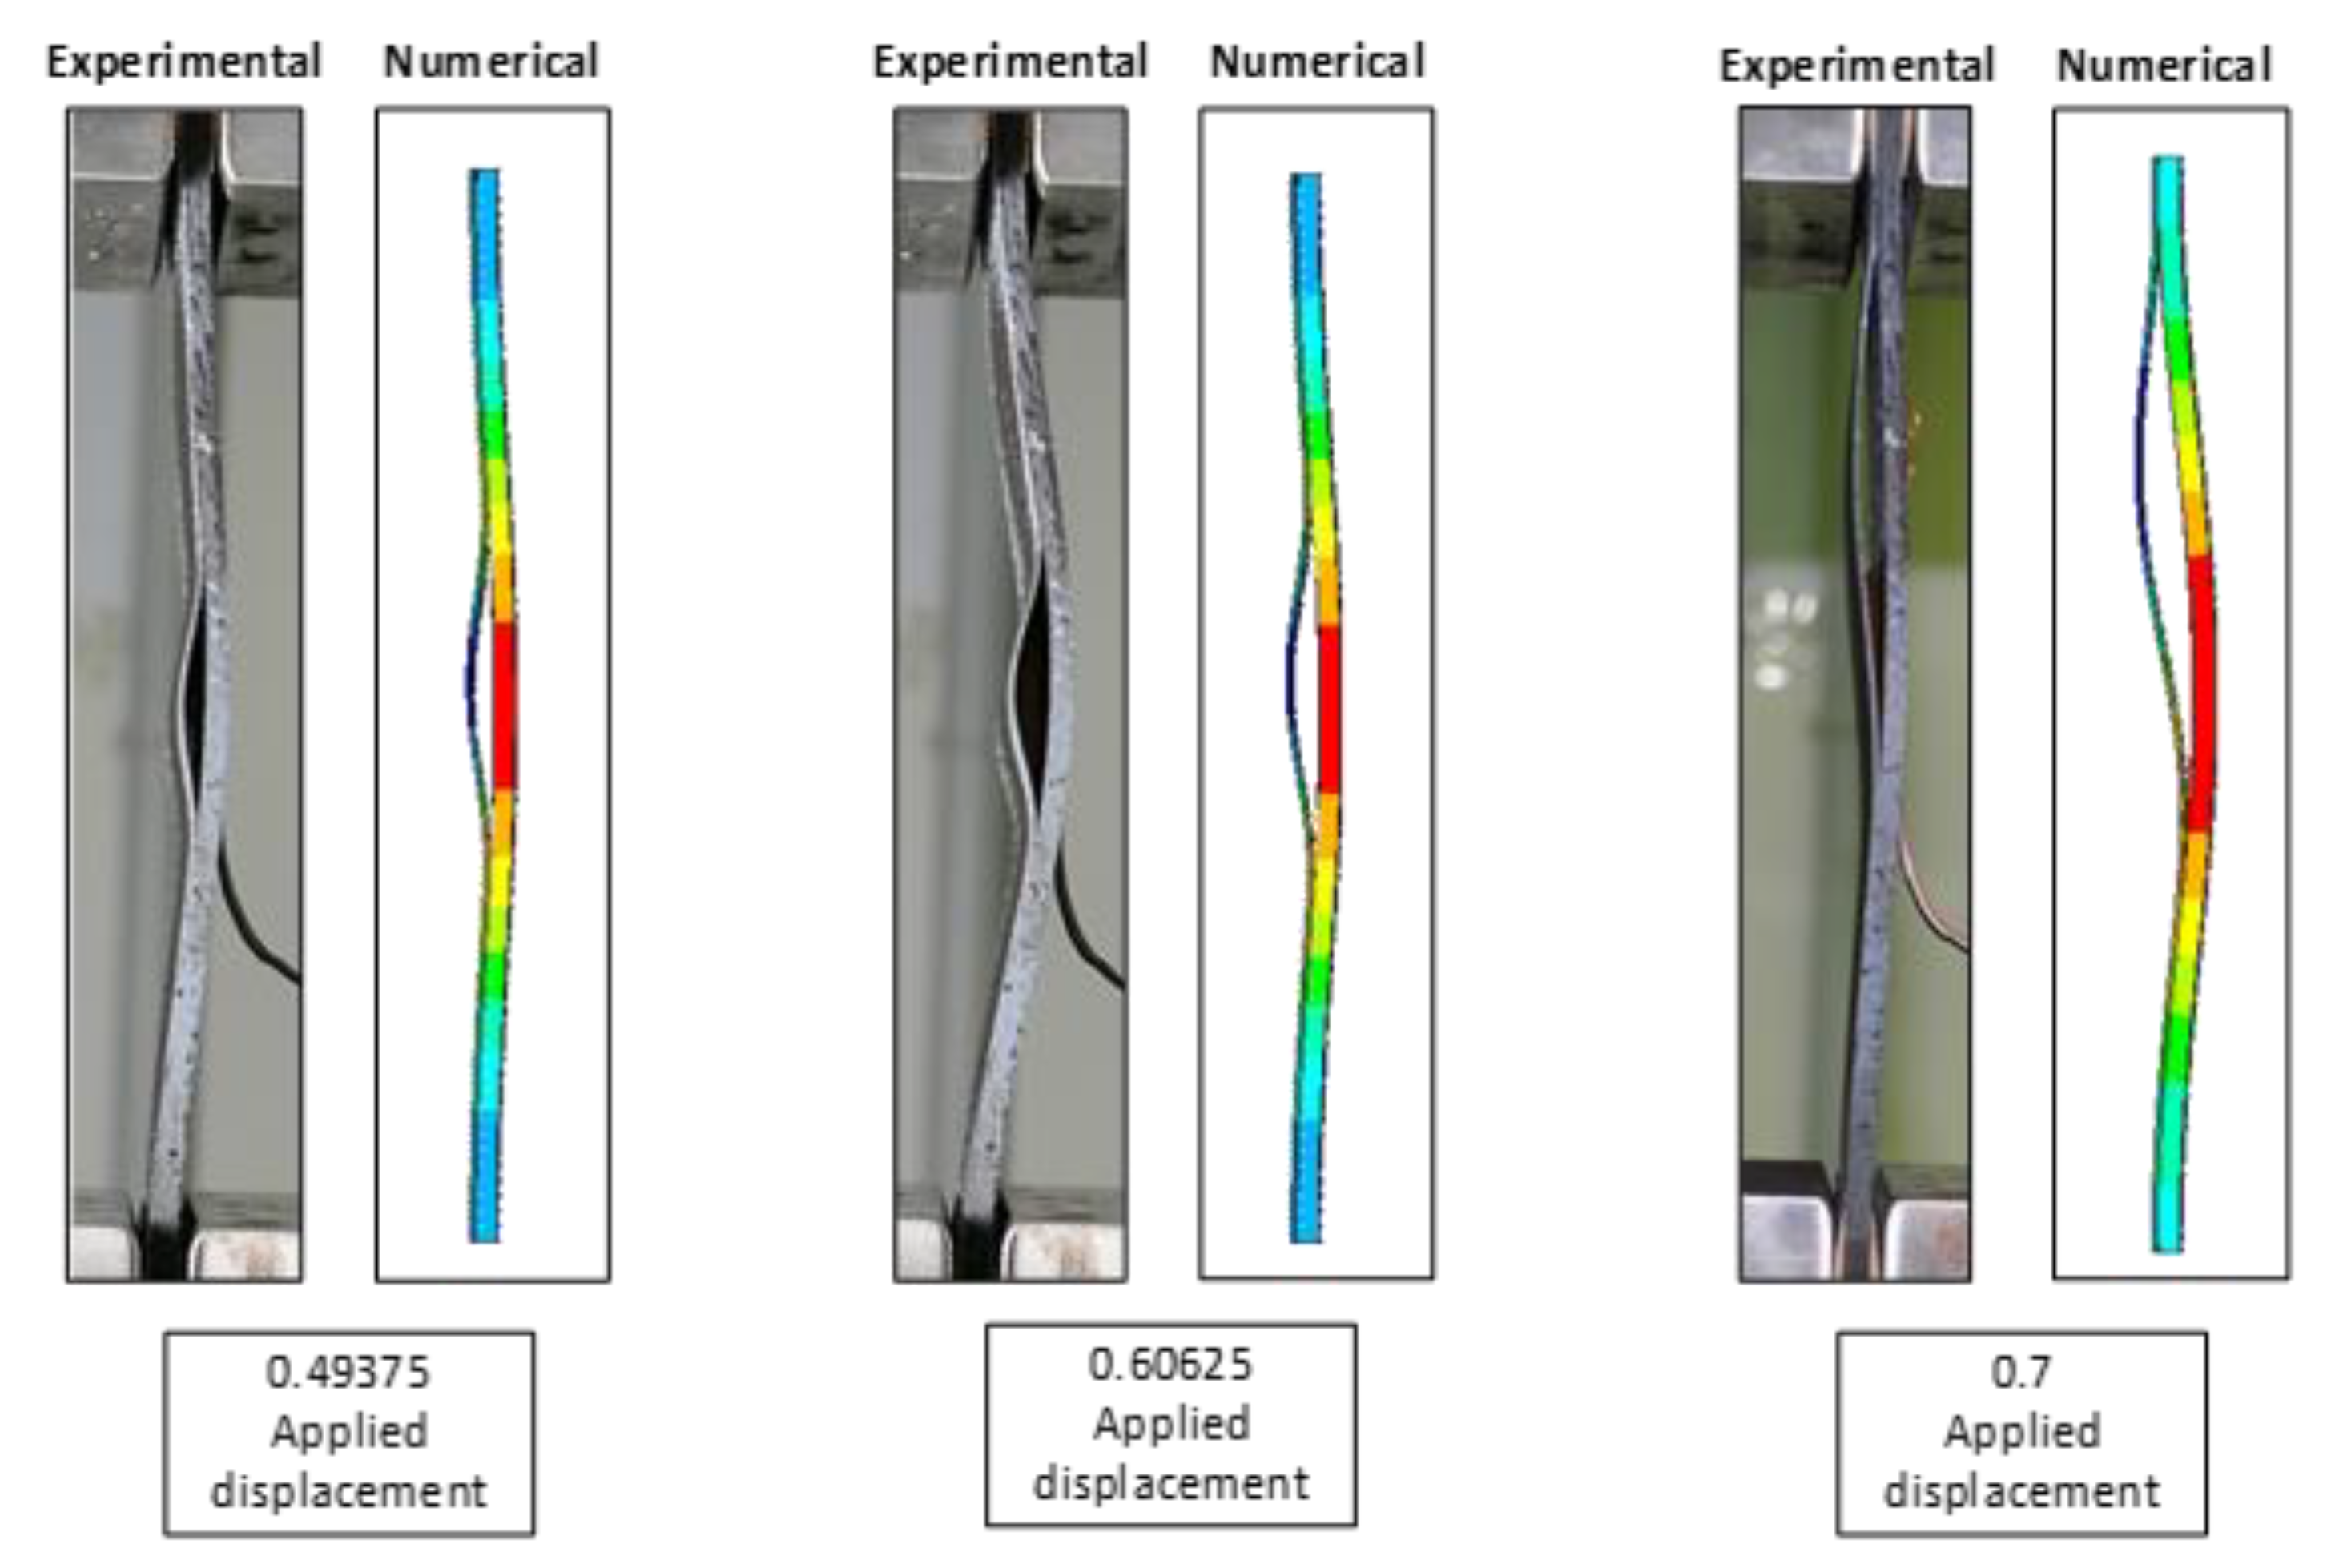
Finally, in
Figure 23, a comparison between experimental and deformed shapes at fixed values of the applied displacement, for a specimen characterised by sensitivity to fibre bridging, is introduced. The excellent agreement between experimental and numerical delamination shapes demonstrates the capability of the adopted numerical tool in predicting the compressive behaviour of the analysed delaminated composite plates, even in the presence of highly dynamic phenomena, such as the snap-through buckling.
5. Conclusions
An experimental/numerical study has been carried out to investigate the interlaminar damage behaviour of delaminated composite plates characterized by different fracture toughness under compressive loading conditions. Two fracture toughness configurations have been analysed: the toughened material configuration, characterised by a constantly high fracture toughness and the configuration sensitive to fibre bridging, characterised by an increasing value of fracture toughness. Actually, an experimental testing campaign was performed to analyse the compressive behaviour of the specimens and the DIC technique was used in order to measure samples displacements and deformations during the tests. Moreover, all the samples were equipped with strain gauges, in different locations, to measure deformations. To numerically simulate the mechanical behaviour of compressed specimen, a numerical tool able to consider the fibre bridging effects was adopted.
The experimental data and the numerical results have been found to be in excellent agreement in terms of deformed shapes, compressive load vs strain curves and out-of-plane displacements.
The two analysed configurations showed almost the same compressive behaviour characterised by the local delamination buckling onset, delamination growth onset, global buckling of the plate and transition from the global buckling shape to the second buckling shape (snap-through buckling phenomenon) caused by a sudden unstable delamination growth.
Differences in terms of delamination growth behaviour have been found, as expected, between the two analysed material configurations. Indeed, the coupons made of material sensitive to fibre bridging are characterised by a lower (standard) value of the fracture toughness at the beginning of the delamination growth phenomenon, which leads to an earlier, even if more stable, delamination growth, if compared to the toughened material configuration, whose delamination growth initiates with a highly unstable behaviour at higher loads (close to the global buckling load). These differences lead to a higher global buckling load for the toughened composite plates and to a delay in the snap-through phenomenon for these plates, if compared to the composite plates sensitive to fibre bridging. Actually, the snap-through phenomenon introduces dynamic effects which cannot be simulated by the tools used for the numerical prediction. Indeed, an underestimation of the experimental ultimate strains has been found; however, a tool has been found able to capture the difference between the two material configurations and the main phenomena occurring during the compression.

 ,
, 


