
Preparations of Poly(lactic acid) Dispersions in Water for Coating Applications


Abstract
:
1. Introduction
2. Materials and Methods
2.1. Materials
2.2. Preparation of PLA Dispersions with Sodium Dodecyl Sulfate as Surfactant and Starch as Stabilizer
2.3. Preparation of PLA Dispersions with SDS and Different Polysaccharides as Stabilizers
2.4. Preparation of PLA Dispersions with Different Surfactants Than Sodium Dodecyl Sulfate
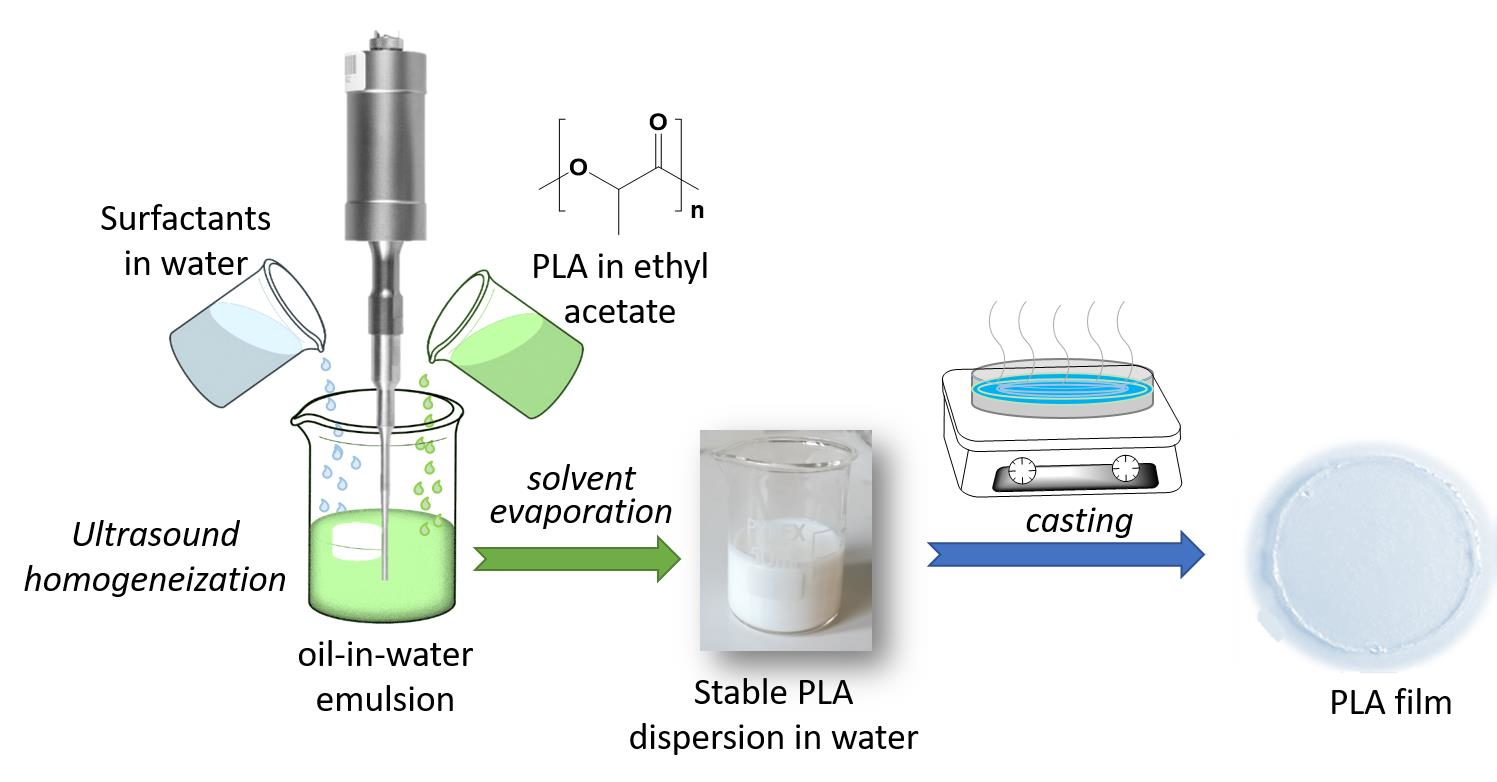
2.5. Preparations of PLA Films from Dispersions
2.6. Instruments and Characterization Methods
3. Results and Discussion
3.1. Influence of the Preparation Conditions on the Stability of PLA Dispersions in Water
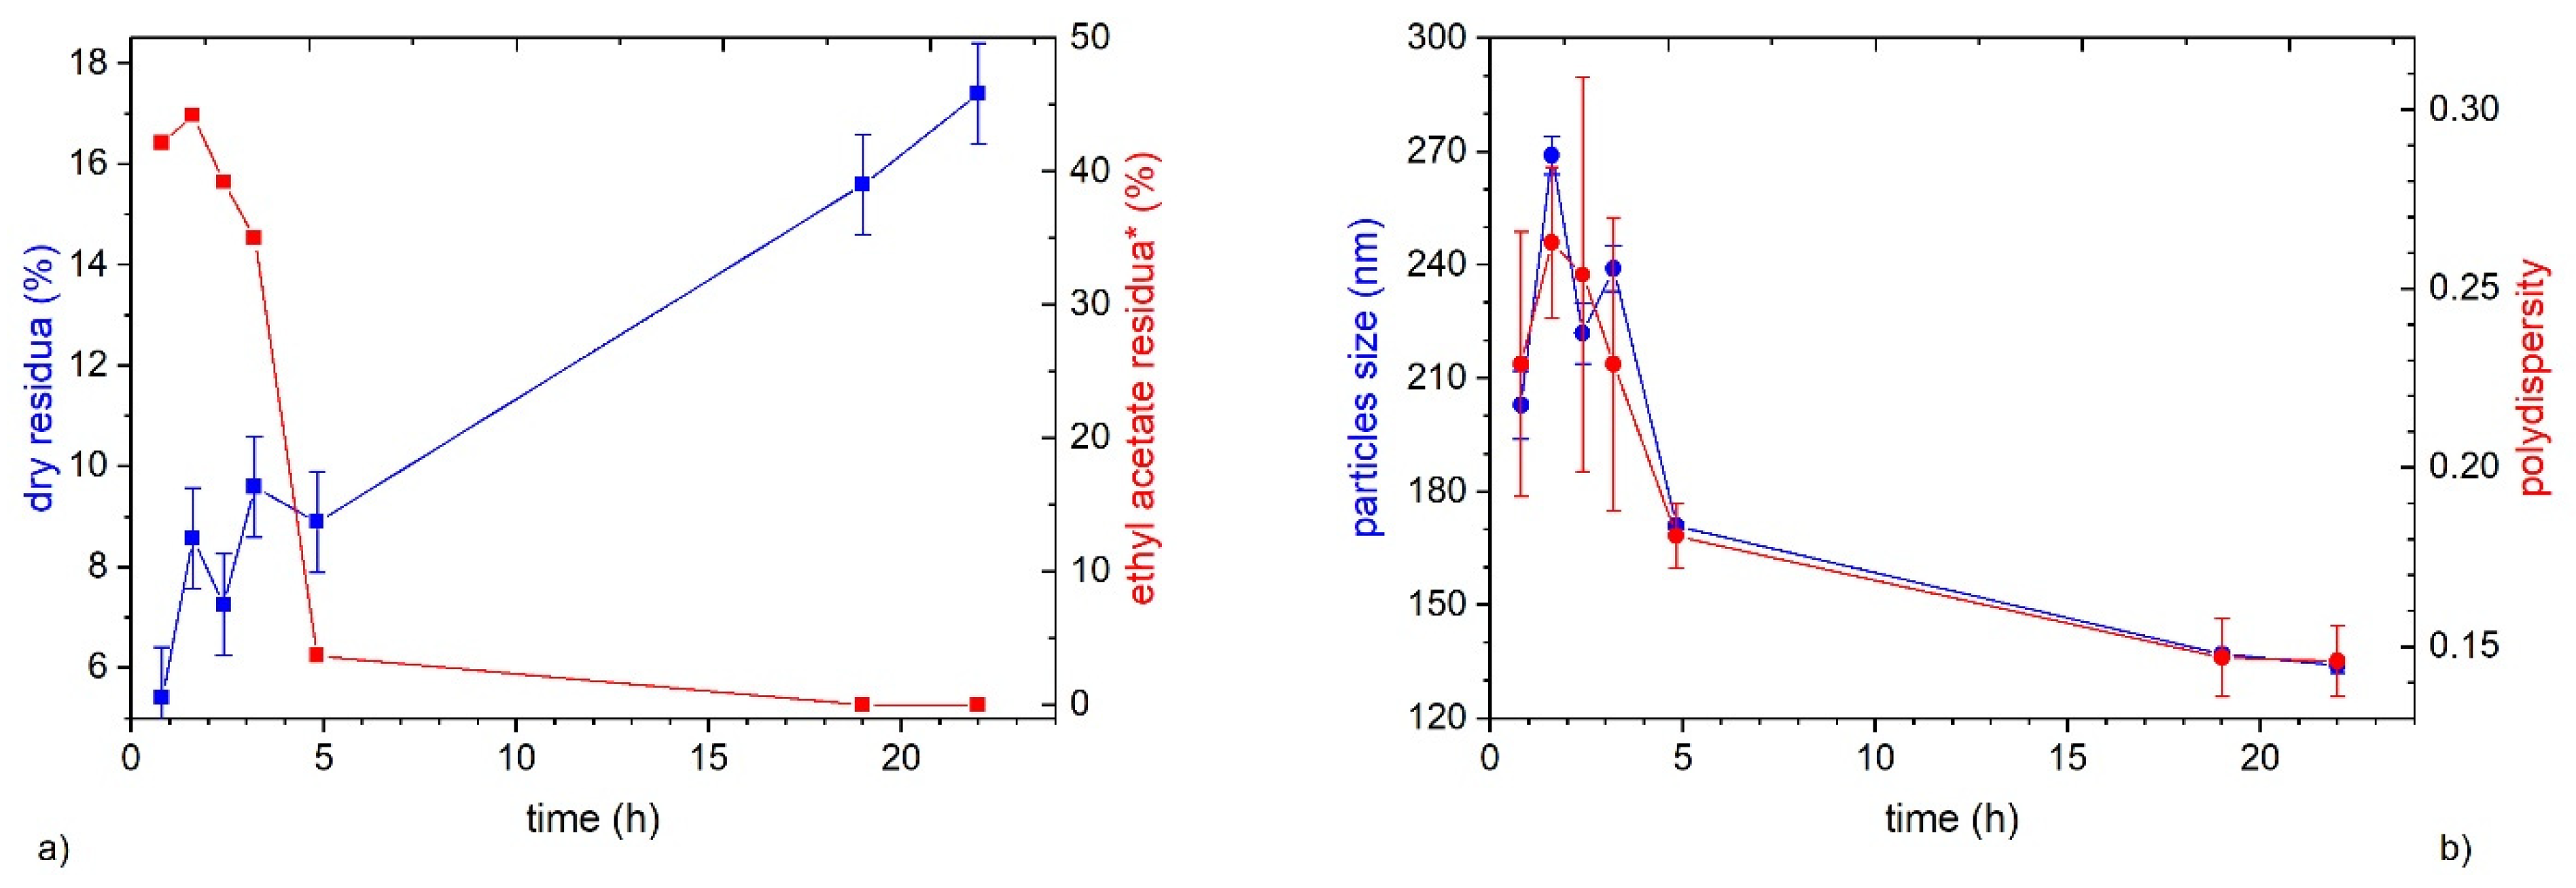
3.2. Influence of Ethyl Acetate Residua on the Emulsion Stability
3.3. Effect of Stabilizer on Dispersions Stability
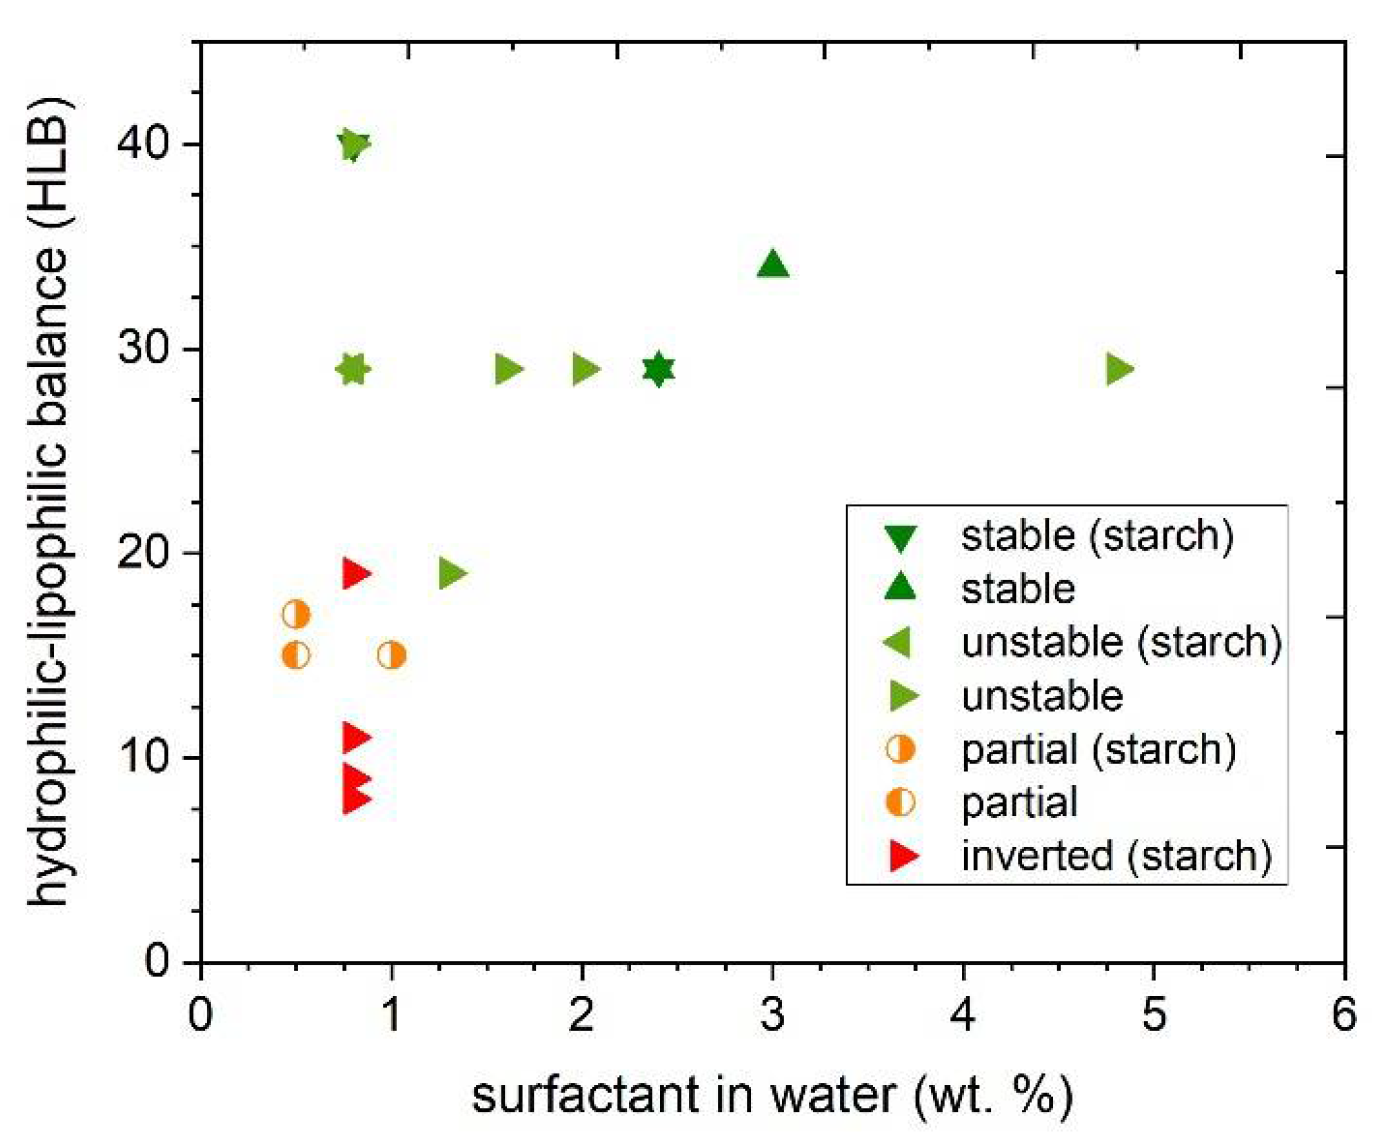
3.4. Screening of Different Emulsifiers for the Formation and Stability of the Dispersion
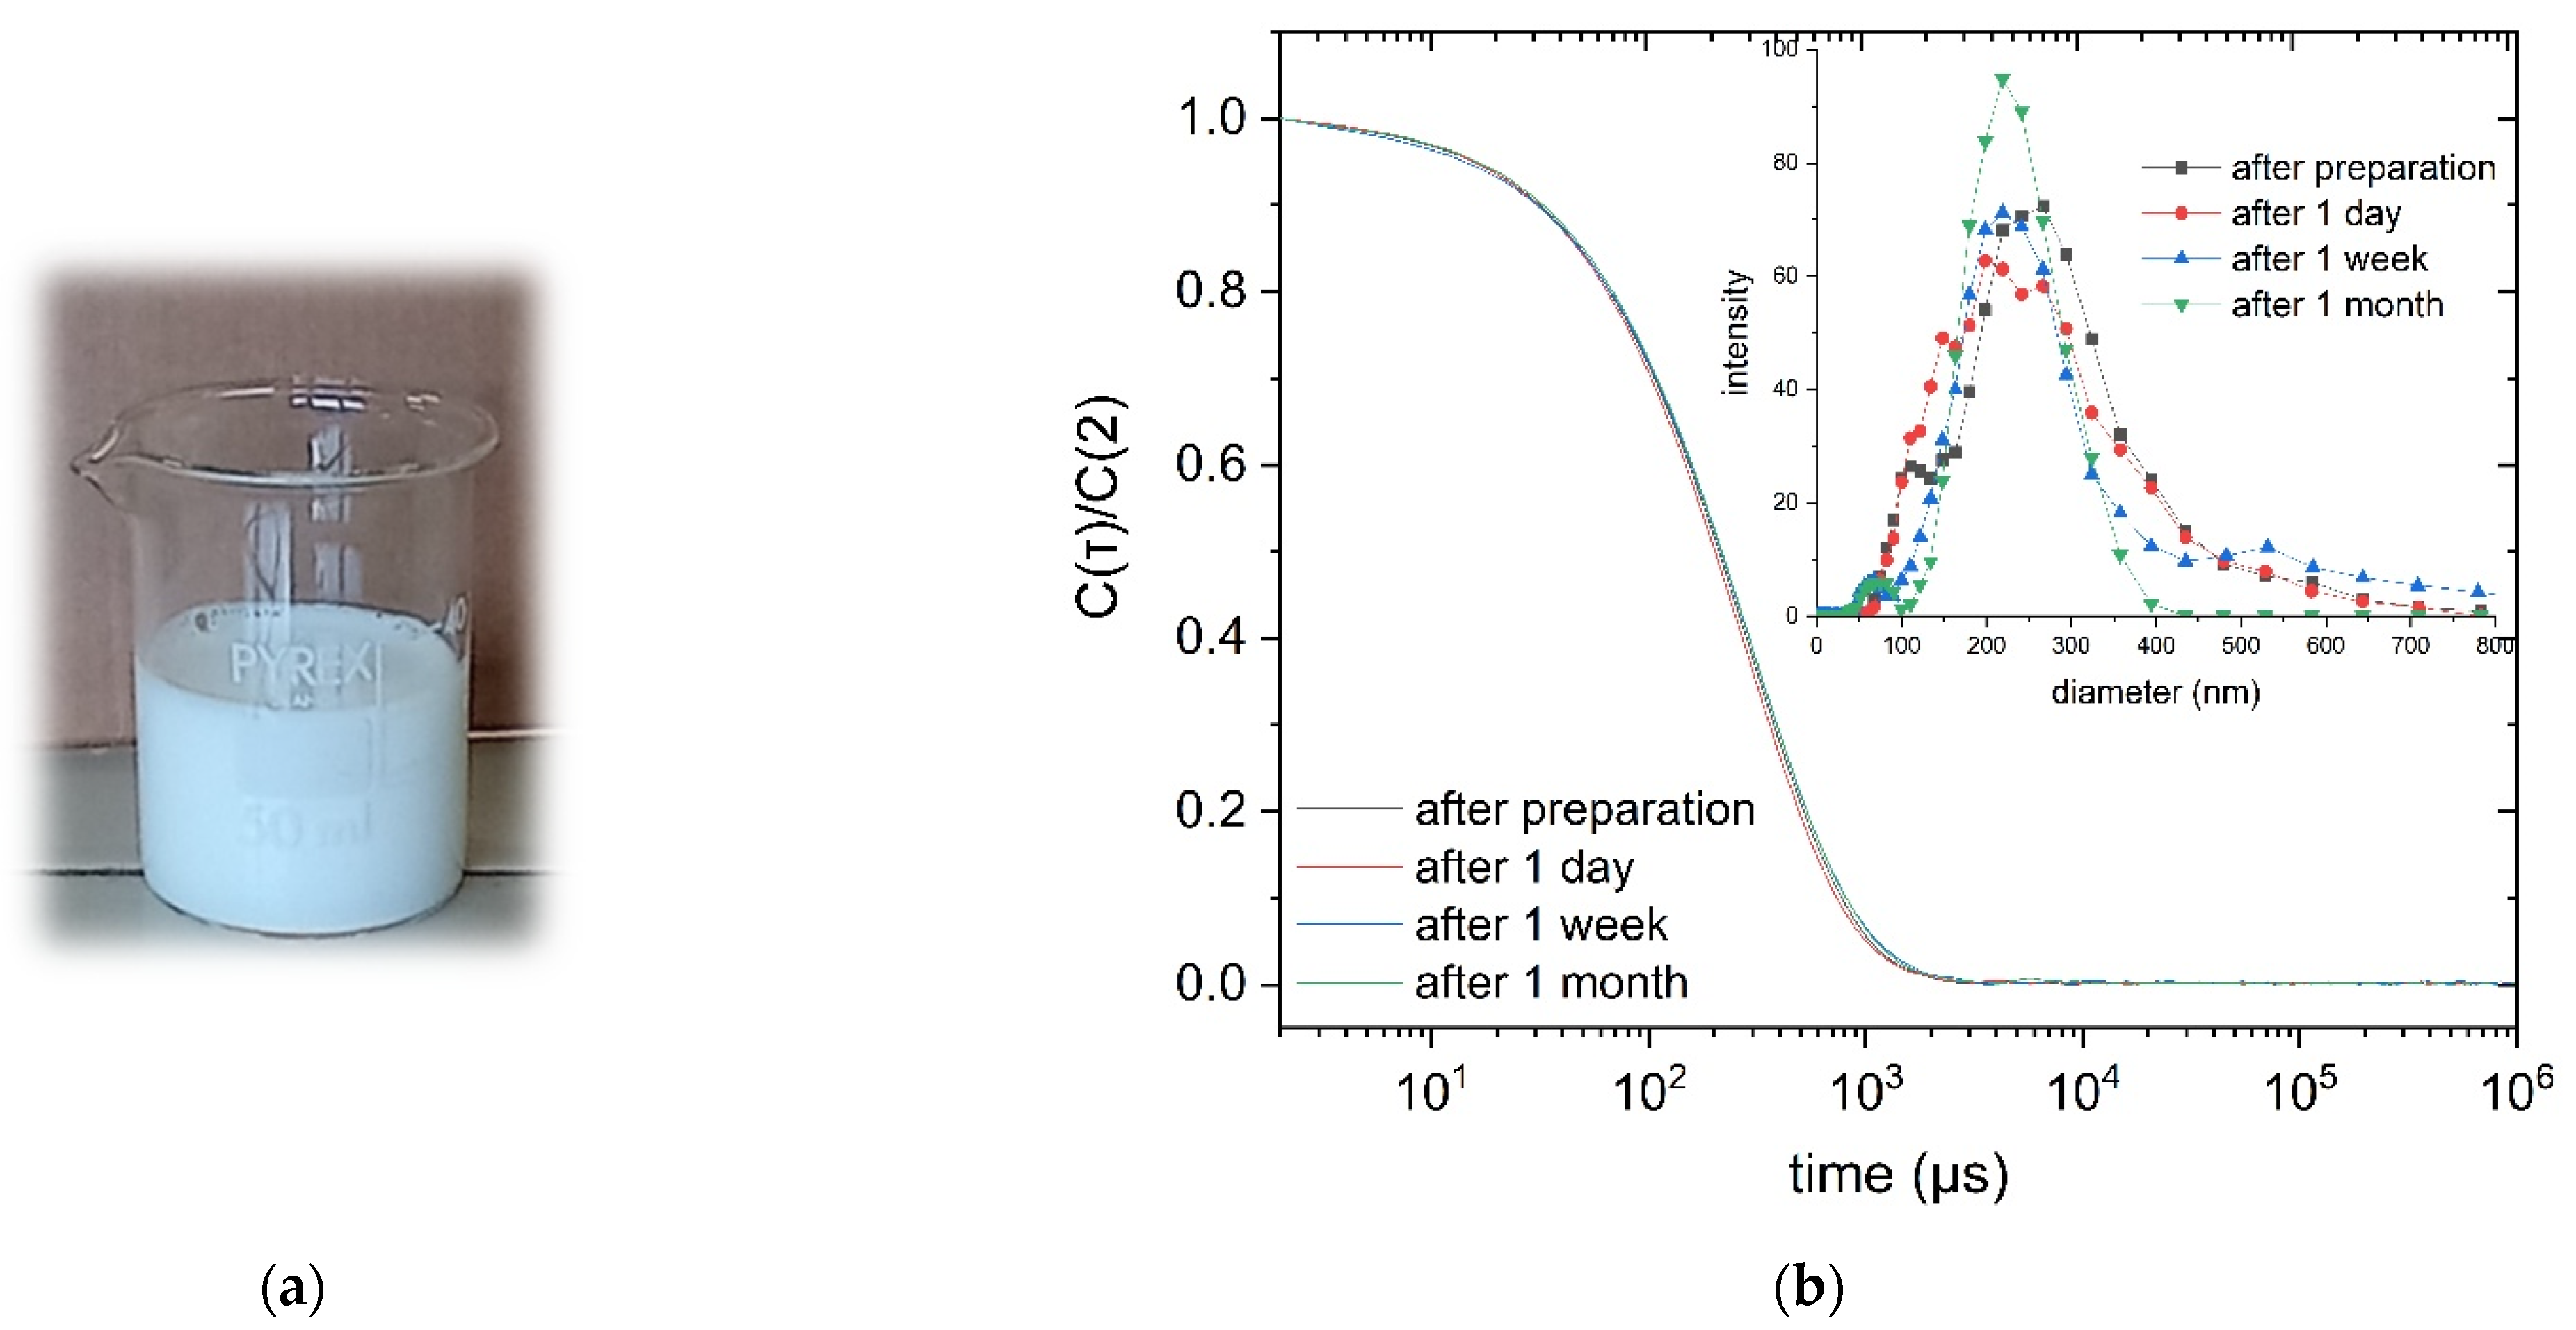
3.5. Characterization of the Dispersions
3.6. Preparation of Films from PLA Dispersions
4. Conclusions
5. Patents
Author Contributions
Funding
Institutional Review Board Statement
Informed Consent Statement
Data Availability Statement
Acknowledgments
Conflicts of Interest
References
- Rhim, J.-W.; Lee, J.-H.; Hong, S.-I. Increase in water resistance of paperboard by coating with poly(lactide). Packag. Technol. Sci. 2007, 20, 393–402. [Google Scholar] [CrossRef]
- Farah, S.; Anderson, D.G.; Langer, R. Physical and mechanical properties of PLA, and their functions in widespread applications—A comprehensive review. Adv. Drug Deliv. Rev. 2016, 107, 367–392. [Google Scholar] [CrossRef] [Green Version]
- Habel, C.; Schöttle, M.; Daab, M.; Eichstaedt, N.J.; Wagner, D.; Bakhshi, H.; Agarwal, S.; Horn, M.A.; Breu, J. High-Barrier, Biodegradable Food Packaging. Macromol. Mater. Eng. 2018, 303, 1800333. [Google Scholar] [CrossRef]
- Auras, R.; Harte, B.; Selke, S. An Overview of Polylactides as Packaging Materials. Macromol. Biosci. 2004, 4, 835–864. [Google Scholar] [CrossRef] [PubMed]
- Tawakkal, I.S.M.A.; Cran, M.J.; Miltz, J.; Bigger, S. A Review of Poly(Lactic Acid)-Based Materials for Antimicrobial Packaging. J. Food Sci. 2014, 79, R1477–R1490. [Google Scholar] [CrossRef] [PubMed]
- Ahmed, J.; Varshney, S.K. Polylactides—Chemistry, Properties and Green Packaging Technology: A Review. Int. J. Food Prop. 2011, 14, 37–58. [Google Scholar] [CrossRef]
- Jabeen, N.; Majid, I.; Nayik, G.A. Bioplastics and food packaging: A review. Cogent Food Agric. 2015, 1, 1117749. [Google Scholar] [CrossRef]
- Lim, L.-T.; Auras, R.; Rubino, M. Processing technologies for poly(lactic acid). Prog. Polym. Sci. 2008, 33, 820–852. [Google Scholar] [CrossRef]
- Castro-Aguirre, E.; Iñiguez-Franco, F.; Samsudin, H.; Fang, X.; Auras, R. Poly(lactic acid)—Mass production, processing, industrial applications, and end of life. Adv. Drug Deliv. Rev. 2016, 107, 333–366. [Google Scholar] [CrossRef] [Green Version]
- Rhim, J.-W.; Mohanty, A.K.; Singh, S.P.; Ng, P.K.W. Effect of the processing methods on the performance of polylactide films: Thermocompression versus solvent casting. J. Appl. Polym. Sci. 2006, 101, 3736–3742. [Google Scholar] [CrossRef]
- Wang, L.-F.; Rhim, J.-W.; Hong, S.-I. Preparation of poly(lactide)/poly(butylene adipate-co-terephthalate) blend films using a solvent casting method and their food packaging application. LWT 2016, 68, 454–461. [Google Scholar] [CrossRef]
- Duan, H.; Shao, Z.; Zhao, M.; Zhou, Z. Preparation and properties of environmental-friendly coatings based on carboxymethyl cellulose nitrate ester & modified alkyd. Carbohydr. Polym. 2016, 137, 92–99. [Google Scholar] [CrossRef]
- Athawale, V.D.; Nimbalkar, R.V. Waterborne Coatings Based on Renewable Oil Resources: An Overview. J. Am. Oil Chem. Soc. 2010, 88, 159–185. [Google Scholar] [CrossRef]
- Horváth, I.T. Solvents from nature. Green Chem. 2008, 10, 1024–1028. [Google Scholar] [CrossRef]
- Mehravar, S.; Ballard, N.; Tomovska, R.; Asua, J.M. Polyurethane/Acrylic Hybrid Waterborne Dispersions: Synthesis, Properties and Applications. Ind. Eng. Chem. Res. 2019, 58, 20902–20922. [Google Scholar] [CrossRef]
- Lossada, F.; Jiao, D.; Yao, X.; Walther, A. Waterborne Methacrylate-Based Vitrimers. ACS Macro Lett. 2019, 9, 70–76. [Google Scholar] [CrossRef]
- Asif, A.; Hu, L.; Shi, W. Synthesis, rheological, and thermal properties of waterborne hyperbranched polyurethane acrylate dispersions for UV curable coatings. Colloid Polym. Sci. 2009, 287, 1041–1049. [Google Scholar] [CrossRef]
- Santamaria-Echart, A.; Fernandes, I.; Barreiro, F.; Corcuera, M.; Eceiza, A. Advances in Waterborne Polyurethane and Polyurethane-Urea Dispersions and Their Eco-friendly Derivatives: A Review. Polymers 2021, 13, 409. [Google Scholar] [CrossRef]
- Alvarez, G.A.; Fuensanta, M.; Orozco, V.; Giraldo, L.F.; Martín-Martínez, J.M. Hybrid waterborne polyurethane/acrylate dispersion synthesized with bisphenol A-glicidylmethacrylate (Bis-GMA) grafting agent. Prog. Org. Coat. 2018, 118, 30–39. [Google Scholar] [CrossRef] [Green Version]
- Zhang, T.; Wu, W.; Wang, X.; Mu, Y. Effect of average functionality on properties of UV-curable waterborne polyurethane-acrylate. Prog. Org. Coat. 2010, 68, 201–207. [Google Scholar] [CrossRef]
- Diaconu, G.; Paulis, M.; Leiza, J.R. Towards the synthesis of high solids content waterborne poly(methyl methacrylate-co-butyl acrylate)/montmorillonite nanocomposites. Polymers 2008, 49, 2444–2454. [Google Scholar] [CrossRef]
- Guo, X.; Ge, S.; Wang, J.; Zhang, X.; Zhang, T.; Lin, J.; Zhao, C.X.; Wang, B.; Zhu, G.; Guo, Z. Waterborne acrylic resin modified with glycidyl methacrylate (GMA): Formula optimization and property analysis. Polymers 2018, 143, 155–163. [Google Scholar] [CrossRef]
- Di Crescenzo, M.M.; Zendri, E.; Sánchez-Pons, M.; Fuster-López, L.; Yusá-Marco, D.J. The use of waterborne paints in contemporary murals: Comparing the stability of vinyl, acrylic and styrene-acrylic formulations to outdoor weathering conditions. Polym. Degrad. Stab. 2014, 107, 285–293. [Google Scholar] [CrossRef]
- Grøstad, K.; Pedersen, A. Emulsion Polymer Isocyanates as Wood Adhesive: A Review. J. Adhes. Sci. Technol. 2010, 24, 1357–1381. [Google Scholar] [CrossRef]
- Zhou, X.; Li, Y.; Fang, C.; Li, S.; Cheng, Y.; Lei, W.; Meng, X. Recent Advances in Synthesis of Waterborne Polyurethane and Their Application in Water-based Ink: A Review. J. Mater. Sci. Technol. 2015, 31, 708–722. [Google Scholar] [CrossRef]
- Lei, L.; Zhong, L.; Lin, X.; Li, Y.; Xia, Z. Synthesis and characterization of waterborne polyurethane dispersions with different chain extenders for potential application in waterborne ink. Chem. Eng. J. 2014, 253, 518–525. [Google Scholar] [CrossRef]
- Bandera, D.; Meyer, V.R.; Prevost, D.; Zimmermann, T.; Boesel, L.F. Polylactide/Montmorillonite Hybrid Latex as a Barrier Coating for Paper Applications. Polymers 2016, 8, 75. [Google Scholar] [CrossRef] [PubMed] [Green Version]
- Nestorson, A.; Neoh, K.G.; Kang, E.-T.; Järnström, L.; Leufvén, A. Enzyme immobilization in latex dispersion coatings for active food packaging. Packag. Technol. Sci. 2008, 21, 193–205. [Google Scholar] [CrossRef]
- Imoto, T. Film formation mechanism of latices. J. Jpn. Soc. Colour Mater. 1966, 39, 34–41. [Google Scholar] [CrossRef] [Green Version]
- Felton, L.A. Mechanisms of polymeric film formation. Int. J. Pharm. 2013, 457, 423–427. [Google Scholar] [CrossRef]
- Keddie, J.; Meredith, P.; Jones, R.; Donald, A.M. Kinetics of Film Formation in Acrylic Latices Studied with Multiple-Angle-of-Incidence Ellipsometry and Environmental SEM. Macromol. 1995, 28, 2673–2682. [Google Scholar] [CrossRef]
- Cummings, S.; Zhang, Y.; Smeets, N.; Cunningham, M.; Dubé, M.A. On the Use of Starch in Emulsion Polymerizations. Process 2019, 7, 140. [Google Scholar] [CrossRef] [Green Version]
- Keddie, J.L. Reports: A Review Journal Film formation of latex. Mater. Sci. Eng. 1997, 21, 101–170. [Google Scholar] [CrossRef]
- Brodnyan, J.G.; Cala, J.A.; Konen, T.; Kelley, E. The mechanism of emulsion polymerization. I. Studies of the polymerization of methyl methacrylate and n-butyl methacrylate. J. Colloid Sci. 1963, 18, 73–90. [Google Scholar] [CrossRef]
- Bao, J.; Zhang, A. Poly(methyl methacrylate) nanoparticles prepared through microwave emulsion polymerization. J. Appl. Polym. Sci. 2004, 93, 2815–2820. [Google Scholar] [CrossRef]
- Meneghetti, P.; Qutubuddin, S. Synthesis of Poly(methyl methacrylate) Nanocomposites via Emulsion Polymerization Using a Zwitterionic Surfactant. Langmuir 2004, 20, 3424–3430. [Google Scholar] [CrossRef]
- Qiu, J.; Gaynor, S.G.; Matyjaszewski, K. Emulsion Polymerization of n-Butyl Methacrylate by Reverse Atom Transfer Radical Polymerization. Macromolecules 1999, 32, 2872–2875. [Google Scholar] [CrossRef]
- Xaviera, J.L.L.; Guyota, A.; Bourgeat-Lami, E. Synthesis and Characterization of Silica/Poly (Methyl Methacrylate) Nanocomposite Latex Particles through Emulsion Polymerization Using a Cationic Azo Initiator. J. Colloid Interface Sci. 2002, 250, 82–92. [Google Scholar] [CrossRef]
- Noreen, A.; Zia, K.M.; Zuber, M.; Tabasum, S.; Saif, M.J. Recent trends in environmentally friendly water-borne polyurethane coatings: A review. Korean J. Chem. Eng. 2015, 33, 388–400. [Google Scholar] [CrossRef]
- Agnol, L.D.; Dias, F.T.G.; Ornaghi, H.L.; Sangermano, M.; Bianchi, O. UV-curable waterborne polyurethane coatings: A state-of-the-art and recent advances review. Prog. Org. Coat. 2021, 154, 106156. [Google Scholar] [CrossRef]
- Allémann, E.; Gurny, R.; Doelker, E. Preparation of aqueous polymeric nanodispersions by a reversible salting-out process: Influence of process parameters on particle size. Int. J. Pharm. 1992, 87, 247–253. [Google Scholar] [CrossRef]
- Grunlan, M.A.; Xing, L.-L.; Glass, J.E. Waterborne Coatings with an Emphasis on Synthetic Aspects: An Overview. ACS Symp. Ser. 1997, 1–26. [Google Scholar] [CrossRef] [Green Version]
- Noble, K.-L. Waterborne polyurethanes. Prog. Org. Coat. 1997, 32, 131–136. [Google Scholar] [CrossRef]
- Lassalle, V.; Ferreira, M.L. PLA Nano- and Microparticles for Drug Delivery: An Overview of the Methods of Preparation. Macromol. Biosci. 2007, 7, 767–783. [Google Scholar] [CrossRef] [PubMed]
- Lee, B.K.; Yun, Y.; Park, K. PLA micro- and nano-particles. Adv. Drug Deliv. Rev. 2016, 107, 176–191. [Google Scholar] [CrossRef] [Green Version]
- Hong, J.S.; Srivastava, D.; Lee, I. Fabrication of poly(lactic acid) nano- and microparticles using a nanomixer via nanoprecipitation or emulsion diffusion. J. Appl. Polym. Sci. 2018, 135, 46199. [Google Scholar] [CrossRef]
- Legrand, P.; Lesieur, S.; Bochot, A.; Gref, R.; Raatjes, W.; Barratt, G.; Vauthier, C. Influence of polymer behaviour in organic solution on the production of polylactide nanoparticles by nanoprecipitation. Int. J. Pharm. 2007, 344, 33–43. [Google Scholar] [CrossRef] [PubMed]
- Pandey, S.K.; Patel, D.; Thakur, R.; Mishra, D.P.; Maiti, P.; Haldar, C. Anti-cancer evaluation of quercetin embedded PLA nanoparticles synthesized by emulsified nanoprecipitation. Int. J. Biol. Macromol. 2015, 75, 521–529. [Google Scholar] [CrossRef]
- Gavory, C.; Durand, A.; Six, J.-L.; Nouvel, C.; Marie, E.; Leonard, M. Polysaccharide-covered nanoparticles prepared by nanoprecipitation. Carbohydr. Polym. 2011, 84, 133–140. [Google Scholar] [CrossRef]
- Allémann, E.; Leroux, J.; Gurny, R.; Doelker, E. In Vitro Extended-Release Properties of Drug-Loaded Poly(DL-Lactic Acid) Nanoparticles Produced by a Salting-Out Procedure. Pharm. Res. 1993, 10, 1732–1737. [Google Scholar] [CrossRef]
- Mendoza-Muñoz, N.; Quintanar-Guerrero, D.; Allémann, E. The impact of the salting-out technique on the preparation of colloidal particulate systems for pharmaceutical applications. Recent Patents Drug Deliv. Formul. 2012, 6, 236–249. [Google Scholar] [CrossRef] [PubMed]
- Balakrishanan, M.H.; Rajan, M. Size-controlled synthesis of biodegradable nanocarriers for targeted and controlled cancer drug delivery using salting out cation. Bull. Mater. Sci. 2016, 39, 69–77. [Google Scholar] [CrossRef] [Green Version]
- Trimaille, T.; Pichot, C.; Fessi, H.; Delair, T. Poly(d,l-lactic acid) nanoparticle preparation and colloidal characterization. Colloid Polym. Sci. 2003, 281, 1184–1190. [Google Scholar] [CrossRef]
- Quintanar-Guerrero, D.; Fessi, H.; Allémann, E.; Doelker, E. Influence of stabilizing agents and preparative variables on the formation of poly(d,l-lactic acid) nanoparticles by an emulsification-diffusion technique. Int. J. Pharm. 1996, 143, 133–141. [Google Scholar] [CrossRef]
- Coffin, M.D.; McGinity, J.W. Biodegradable Pseudolatexes: The Chemical Stability of Poly(D,L-Lactide) and Poly (ε-Caprolactone) Nanoparticles in Aqueous Media. Pharm. Res. Off. J. Am. Assoc. Pharm. Sci. 1992, 9, 200–205. [Google Scholar]
- Zhang, H.; Xiang, S.; Luan, Q.; Bao, Y.; Deng, Q.; Zheng, M.; Liu, S.; Song, J.; Tang, H.; Huang, F. Development of poly (lactic acid) microspheres and their potential application in Pickering emulsions stabilization. Int. J. Biol. Macromol. 2018, 108, 105–111. [Google Scholar] [CrossRef]
- Xu, W.; Shen, R.; Yan, Y.; Gao, J. Preparation and characterization of electrospun alginate/PLA nanofibers as tissue engineering material by emulsion eletrospinning. J. Mech. Behav. Biomed. Mater. 2017, 65, 428–438. [Google Scholar] [CrossRef]
- Sébastien, F.; Stéphane, G.; Copinet, A.; Coma, V. Novel biodegradable films made from chitosan and poly(lactic acid) with antifungal properties against mycotoxinogen strains. Carbohydr. Polym. 2006, 65, 185–193. [Google Scholar] [CrossRef]
- Grande, R.; Carvalho, A. Compatible Ternary Blends of Chitosan/poly(vinyl alcohol)/poly(lactic acid) Produced by Oil-in-Water Emulsion Processing. Biomacromolecules 2011, 12, 907–914. [Google Scholar] [CrossRef] [PubMed]
- Li, X.; Hegyesi, N.; Zhang, Y.; Mao, Z.; Feng, X.; Wang, B.; Pukánszky, B.; Sui, X. Poly(lactic acid)/lignin blends prepared with the Pickering emulsion template method. Eur. Polym. J. 2018, 110, 378–384. [Google Scholar] [CrossRef] [Green Version]
- Zhang, Y.; Wu, J.; Wang, B.; Sui, X.; Zhong, Y.; Zhang, L.; Mao, Z.; Xu, H. Cellulose nanofibril-reinforced biodegradable polymer composites obtained via a Pickering emulsion approach. Cellulose 2017, 24, 3313–3322. [Google Scholar] [CrossRef]
- Zhang, Y.; Jiang, Y.; Han, L.; Wang, B.; Xu, H.; Zhong, Y.; Zhang, L.; Mao, Z.; Sui, X. Biodegradable regenerated cellulose-dispersed composites with improved properties via a pickering emulsion process. Carbohydr. Polym. 2018, 179, 86–92. [Google Scholar] [CrossRef] [PubMed]
- Horianopoulos, D.; Horianopoulos, S. Traffic-Actuated Electrical Generator Apparatus. U.S. Patent 20070085342A1, 19 April 2007. [Google Scholar]
- Kratz, F. Bisphosphonate-Prodrugs. Patent No. WO/2011/023367, 3 March 2011. [Google Scholar]
- Zembyla, M.; Murray, B.S.; Sarkar, A. Water-in-oil emulsions stabilized by surfactants, biopolymers and/or particles: A review. Trends Food Sci. Technol. 2020, 104, 49–59. [Google Scholar] [CrossRef]
- Kume, G.; Gallotti, M.; Nunes, G. Review on Anionic/Cationic Surfactant Mixtures. J. Surfactants Deterg. 2007, 11, 1–11. [Google Scholar] [CrossRef]
- Foley, P.; Pour, A.K.; Beach, E.; Zimmerman, J. Derivation and synthesis of renewable surfactants. Chem. Soc. Rev. 2011, 41, 1499–1518. [Google Scholar] [CrossRef] [PubMed]
- Dickinson, E. Mixed biopolymers at interfaces: Competitive adsorption and multilayer structures. Food Hydrocoll. 2011, 25, 1966–1983. [Google Scholar] [CrossRef]
- Li, C.; Fu, X.; Luo, F.; Huang, Q. Effects of maltose on stability and rheological properties of orange oil-in-water emulsion formed by OSA modified starch. Food Hydrocoll. 2012, 32, 79–86. [Google Scholar] [CrossRef]
- Pasquali, R.C.; Taurozzi, M.P.; Bregni, C. Some considerations about the hydrophilic–lipophilic balance system. Int. J. Pharm. 2008, 356, 44–51. [Google Scholar] [CrossRef] [PubMed]
- Habibi, H.; Khosravi-Darani, K. Effective variables on production and structure of xanthan gum and its food applications: A review. Biocatal. Agric. Biotechnol. 2017, 10, 130–140. [Google Scholar] [CrossRef]
- Yazid, N.S.M.; Abdullah, N.; Muhammad, N.; Matias-Peralta, H.M. Application of Starch and Starch-Based Products in Food Industry. J. Sci. Technol. 2018, 10. [Google Scholar] [CrossRef] [Green Version]
- Winuprasith, T.; Suphantharika, M. Microfibrillated cellulose from mangosteen (Garcinia mangostana L.) rind: Preparation, characterization, and evaluation as an emulsion stabilizer. Food Hydrocoll. 2013, 32, 383–394. [Google Scholar] [CrossRef]
- Raso, J.; Mañas, P.; Pagán, R.; Sala, F.J. Influence of different factors on the output power transferred into medium by ultrasound. Ultrason. Sonochem. 1999, 5, 157–162. [Google Scholar] [CrossRef]
- Agama-Acevedo, E.; Bello-Perez, L. Starch as an emulsions stability: The case of octenyl succinic anhydride (OSA) starch. Curr. Opin. Food Sci. 2017, 13, 78–83. [Google Scholar] [CrossRef]
- Winuprasith, T.; Suphantharika, M. Properties and stability of oil-in-water emulsions stabilized by microfibrillated cellulose from mangosteen rind. Food Hydrocoll. 2015, 43, 690–699. [Google Scholar] [CrossRef]
- Hemar, Y.; Tamehana, M.; Munro, P.; Singh, H. Influence of xanthan gum on the formation and stability of sodium caseinate oil-in-water emulsions. Food Hydrocoll. 2001, 15, 513–519. [Google Scholar] [CrossRef]
- Eom, Y.; Choi, B.; Park, S.-I. A Study on Mechanical and Thermal Properties of PLA/PEO Blends. J. Polym. Environ. 2018, 27, 256–262. [Google Scholar] [CrossRef]
- Erukhimovich, I.; de la Cruz, M.O. Phase equilibria and charge fractionation in polydisperse polyelectrolyte solutions. J. Polym. Sci. Part B: Polym. Phys. 2007, 45, 3003–3009. [Google Scholar] [CrossRef]


| Entry | Organic Phase | EtOAc/H2O | SDS Conc. (wt.%) | Vol.Tot. (mL) | PLA/Water 2 (wt.%) | Dispersion Features | |||
|---|---|---|---|---|---|---|---|---|---|
| PLA (wt./vol.%) 1 | Vol. (mL) | Vol. Ratio | Homogenizer 3 | Stability 4 | Particles Size 5 (nm) | ||||
| 1 | 11 | 45.0 | 1.3 | 0.8 | 80 | 14 | UT | coa. | - |
| 2 | 11 | 45.0 | 1.3 | 0.8 | 80 | 14 | UH | yes | 214 ± 2 |
| 3 | 11 | 45.0 | 1.3 | 0.8 | 80 | 14 | UVC | yes | 203 ± 7 |
| 4 | 11 | 62.5 | 1.8 | 0.8 | 97 | 20 | UVC | cl. | 225 ± 3 |
| 5 | 8 | 62.5 | 1.8 | 0.8 | 97 | 14 | UVC | yes | 178 ± 2 |
| 6 | 8 | 20.8 | 1.8 | 0.8 | 32 | 14 | UVC | yes | 167 ± 1 |
| 7 | 8 | 87.5 | 2.5 | 0.8 | 122 | 20 | UVC 6 | cl. | 202 ± 2 |
| 8 | 8 | 87.5 | 2.5 | 0.8 | 122 | 20 | UH 6 | yes | 130 ± 10 |
| 9 | 8 | 50.0 | 2.5 | 0.8 | 70 | 20 | UVC | coa. | - |
| 10 | 8 | 50.0 | 2.5 | 0.8 | 70 | 20 | UH 6 | yes | 138 ± 23 |
| 11 | 8 | 50.0 | 5.0 | 0.8 | 60 | 15 | UH | coa. | - |
| 12 | 8 | 50.0 | 2.1 | 0.3 | 74 | 17 | UH | yes | 158 ± 12 |
| 13 | 8 | 20.8 | 1.8 | 0.5 | 58 | 15 | UVC | yes | 183 ± 2 |
| Aqueous Phase | Organic Phase | EtOAc/H2O | Dispersion Feature | |||
|---|---|---|---|---|---|---|
| Entry | Stabilizer | wt.% | PLA (wt./vol.%) 1 | Vol. (mL) | Vol. Ratio | Stability 2 |
| 1 | - | - | 11 | 45.0 | 1.3 | no |
| 2 | - | - | 8 | 62.5 | 1.8 | no |
| 3 | MFC | 0.500 | 11 | 45.0 | 1.3 | sed. |
| 4 | XG | 0.090 | 11 | 15.0 | 1.3 | no |
| 5 | XG | 0.009 | 11 | 15.0 | 1.3 | yes |
| 6 | XG | 0.009 | 11 | 45.0 | 1.3 | coa. |
| Entry | Surfactant | Description | Aqueous Phase | Dispersion Stability 1 | ||
|---|---|---|---|---|---|---|
| Surfactant Conc. (wt.%) | HLB | Starch Conc. (wt.%) | ||||
| 1 | SDS | Anionic surfactant | 0.8 | 40 | 0 | unstable |
| 2 2 | SDS Span 80 | Anionic surfactant Non-ionic surfactant | 2.5 0.5 | 34 | 0 | stable |
| 3 | SYN | Block copolymer PEO/PPO | 4.8 | 29 | 0 | unstable |
| 4 | SYN | 2.4 | 29 | 0 | stable | |
| 5 | SYN | 2.0 | 29 | 0 | unstable | |
| 6 | SYN | 1.6 | 29 | 0 | unstable | |
| 7 | SYN | 0.8 | 29 | 0 | unstable | |
| 8 | SYN Span 80 | Block copolymer PEO/PPO Non-ionic surfactant | 0.8 0.5 | 19 | 0 | unstable |
| 9 | Tween 80 | Non-ionic surfactant | 0.5 | 15 | 0 | partial |
| 10 | SYN | Block copolymer PEO/PPO | 2.4 | 29 | 0.5 | stable |
| 11 | SYN | 0.8 | 29 | 0.5 | unstable | |
| 12 | Met. 388 | Non-ionic compound | 0.8 | 19 | 0.5 | inverted |
| 13 | Tween 20 | Non-ionic surfactant | 0.5 | 17 | 0.5 | partial |
| 14 | Tween 80 | Non-ionic surfactant | 1.0 | 15 | 0.5 | partial |
| 15 | SA | Anionic polysaccharide | 0.8 | 11 | 0.5 | inverted |
| 16 | NaCMC | Anionic cellulose derivative | 0.8 | 11 | 0.5 | inverted |
| 17 | SSL | Anionic surfactant | 0.8 | 9 | 0.5 | inverted |
| 18 | Met. 368 | Ester based | 0.8 | 8 | 0.5 | inverted |
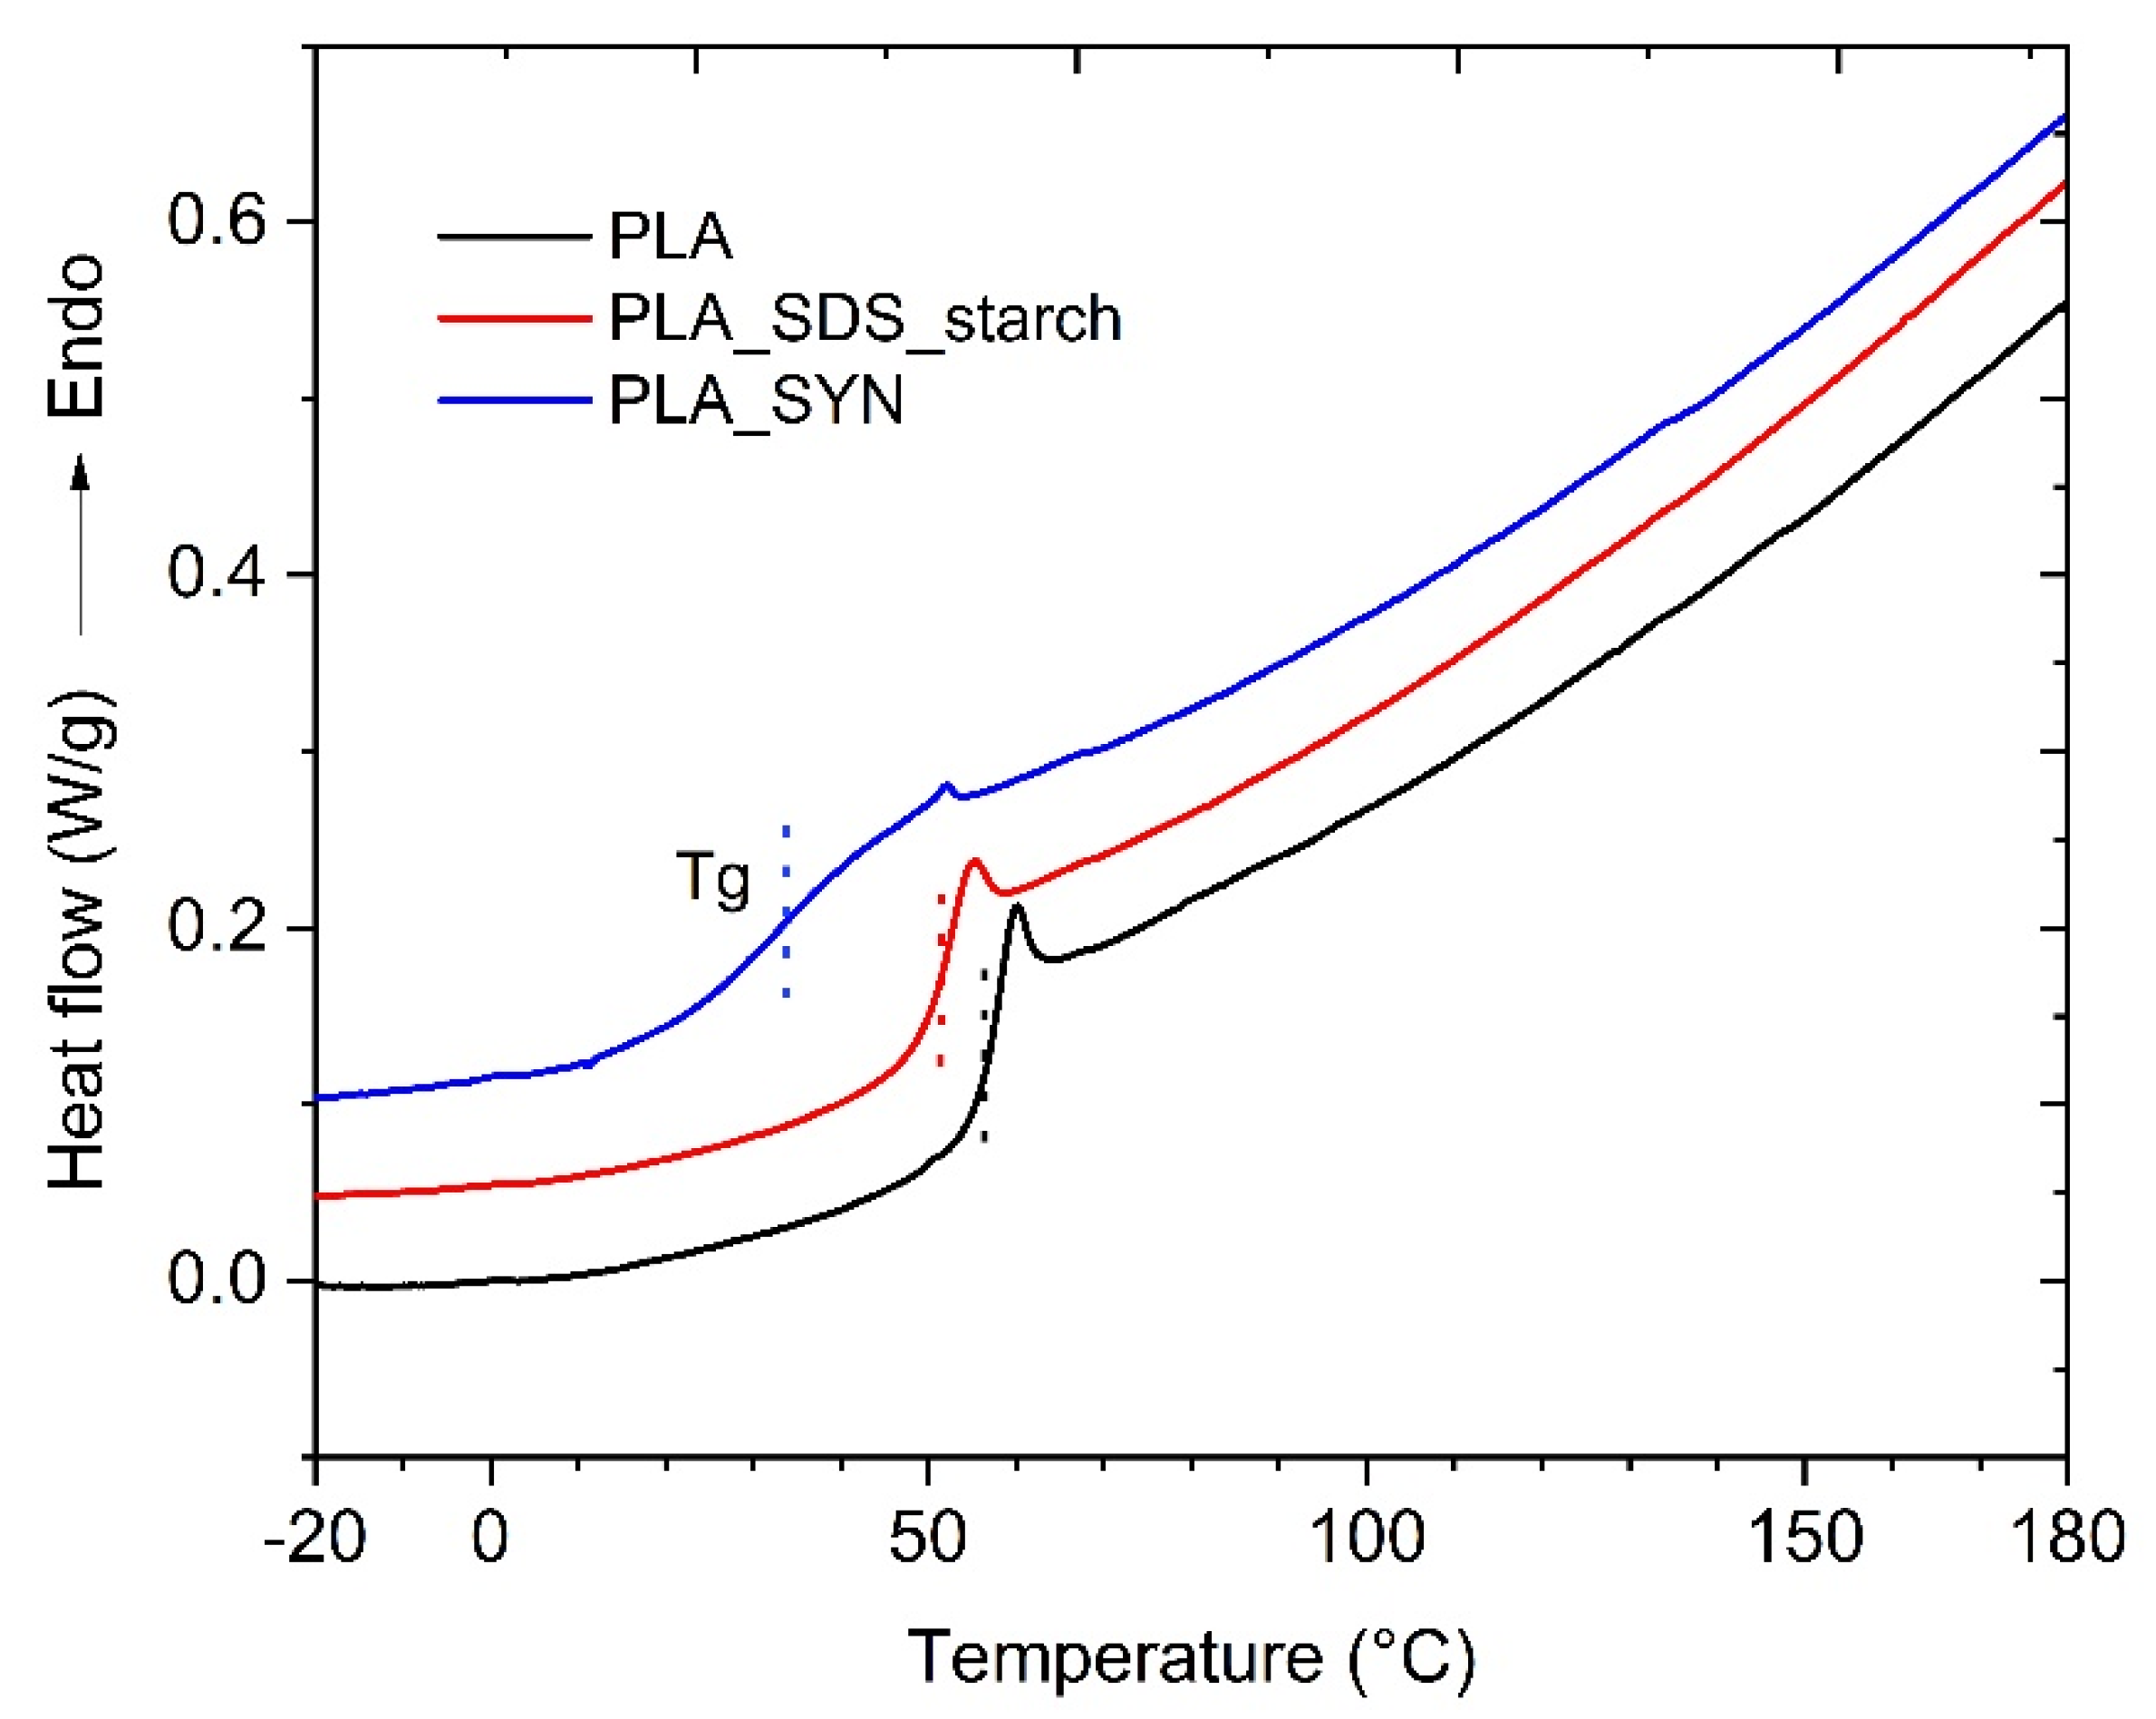
| Sample | Drying Temperature (°C) | |||
|---|---|---|---|---|
| PLA | - | 113.8 | 166.1 | 1.46 |
| PLA_SDS_starch | rt | 109.6 | 157.8 | 1.44 |
| PLA_SYN | rt | 119.5 | 164.9 | 1.38 |
| PLA_SDS_starch | 60 | 96.8 | 141.3 | 1.46 |
| PLA_SYN | 60 | 102.2 | 134.9 | 1.32 |
| PLA_SDS_starch | 80 | 92.3 | 133.8 | 1.45 |
| PLA_SYN | 80 | 85.6 | 123.3 | 1.44 |
| PLA_SDS_starch | 100 | 99.6 | 143.4 | 1.44 |
| PLA_SYN | 100 | 88.9 | 131.5 | 1.48 |
Publisher’s Note: MDPI stays neutral with regard to jurisdictional claims in published maps and institutional affiliations. |
© 2021 by the authors. Licensee MDPI, Basel, Switzerland. This article is an open access article distributed under the terms and conditions of the Creative Commons Attribution (CC BY) license (https://creativecommons.org/licenses/by/4.0/).
Share and Cite
Belletti, G.; Buoso, S.; Ricci, L.; Guillem-Ortiz, A.; Aragón-Gutiérrez, A.; Bortolini, O.; Bertoldo, M. Preparations of Poly(lactic acid) Dispersions in Water for Coating Applications. Polymers 2021, 13, 2767. https://0-doi-org.brum.beds.ac.uk/10.3390/polym13162767
Belletti G, Buoso S, Ricci L, Guillem-Ortiz A, Aragón-Gutiérrez A, Bortolini O, Bertoldo M. Preparations of Poly(lactic acid) Dispersions in Water for Coating Applications. Polymers. 2021; 13(16):2767. https://0-doi-org.brum.beds.ac.uk/10.3390/polym13162767
Chicago/Turabian StyleBelletti, Giada, Sara Buoso, Lucia Ricci, Alejandro Guillem-Ortiz, Alejandro Aragón-Gutiérrez, Olga Bortolini, and Monica Bertoldo. 2021. "Preparations of Poly(lactic acid) Dispersions in Water for Coating Applications" Polymers 13, no. 16: 2767. https://0-doi-org.brum.beds.ac.uk/10.3390/polym13162767