3.1. Structural Properties of SrTiO3 and BaSrTiO3 and Their Composites with the TPU:TPO
The XRD patterns of SrTiO
3 and BaSrTiO
3 and their composites with the TPU:TPO 2:1 blends are presented in
Figure 1 and
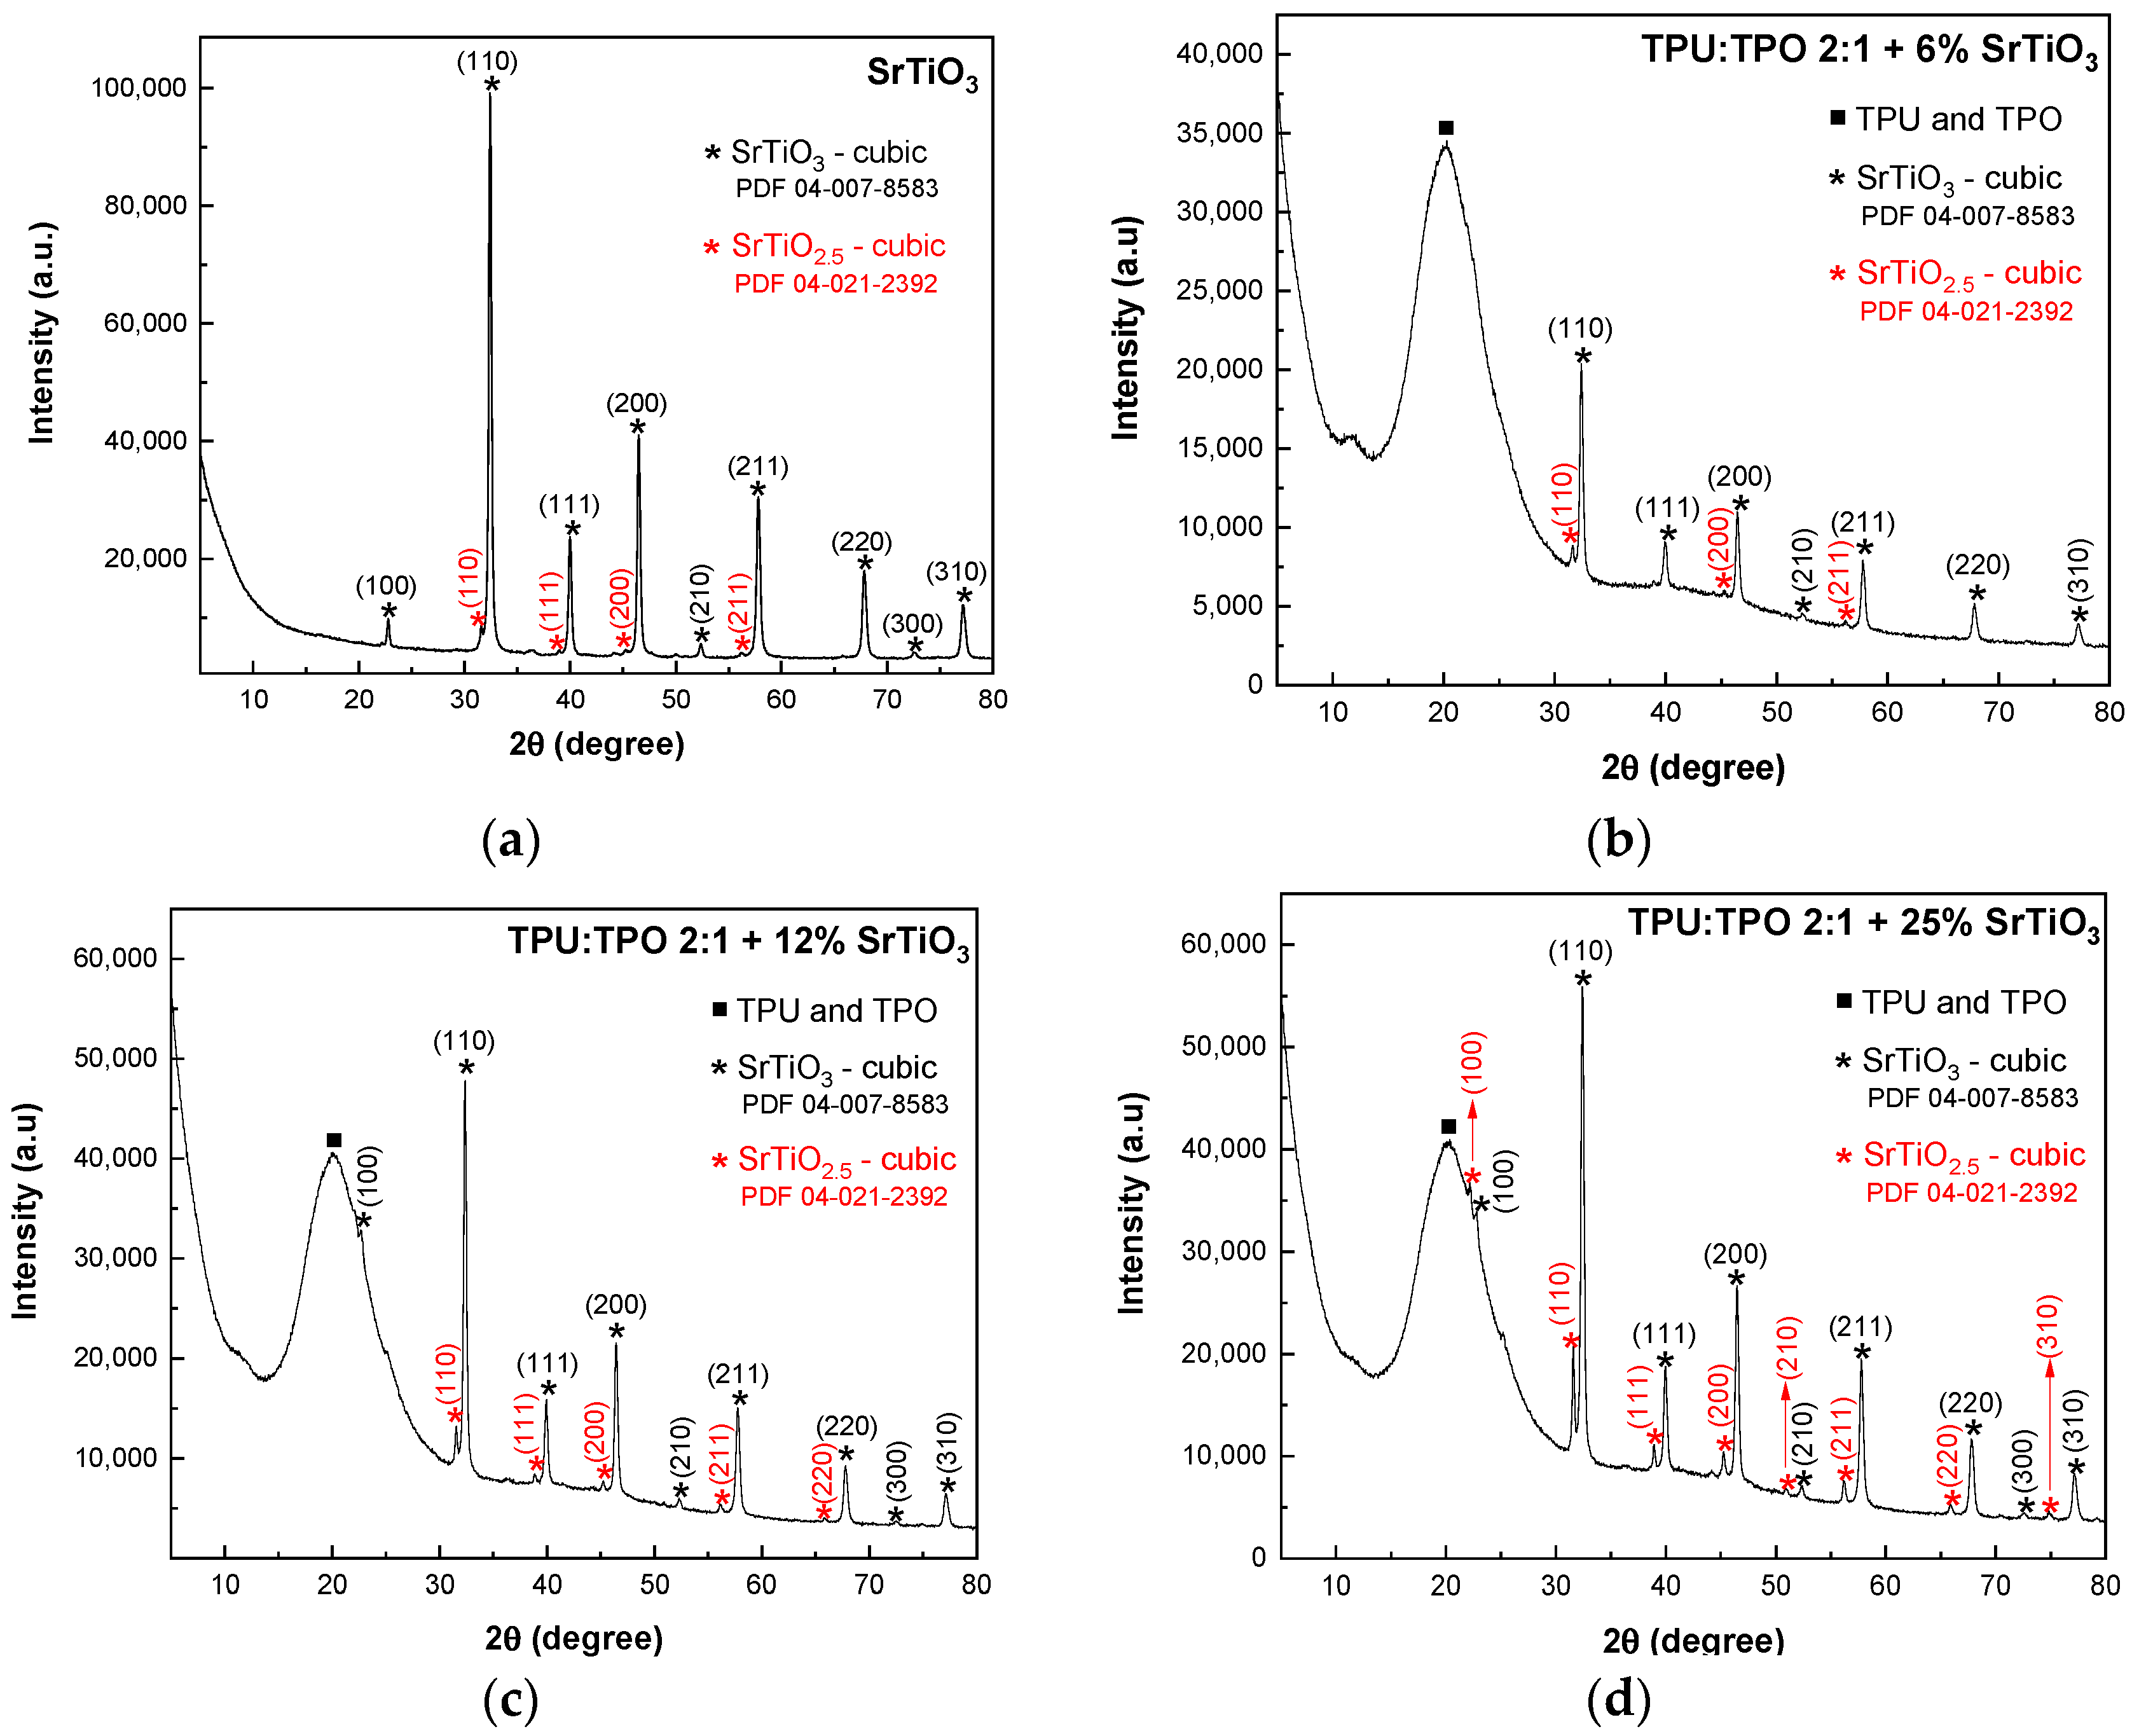
Figure 2, indicating a high purity of the samples. The XRD pattern from
Figure 1a shows a main cubic phase of SrTiO
3 with the diffraction peaks attributed to the (100), (110), (111), (200), (210), (211), (220), (300), and (310) crystallographic planes, according to the PDF 04-007-8583 database. In addition to this phase, a secondary phase of SrTiO
2.5 is revealed, and the peaks are associated with the (110), (111), (200), and (211) planes (PDF 04-021-2392 database). In composites-assisted blends of TPU:TPO 2:1 and SrTiO
3 nanoparticles, the XRD patterns from
Figure 1b–d show an amorphous phase located at a maximum 2θ of 20.2° attributed to the non-crystalline structure of TPU:TPO blends. The crystallites’ size was determined with the Scherrer equation, D = k × λ/(B cos θ), where D, k, λ, B, and θ correspond to the crystallite size, the shape factor, the X-ray wavelength, the half-maximum of the diffraction peak, and the Bragg angle. According to the results shown in
Figure 1, the crystallite size varies with a slight decrease from 27.4 nm (SrTiO
3 sample) to 24.6 nm (TPU:TPO 2:1 + 25%SrTiO
3), 24.5 nm (TPU:TPO 2:1 + 12% SrTiO
3), and 24.3 nm (TPU:TPO 2:1 + 6% SrTiO
3).
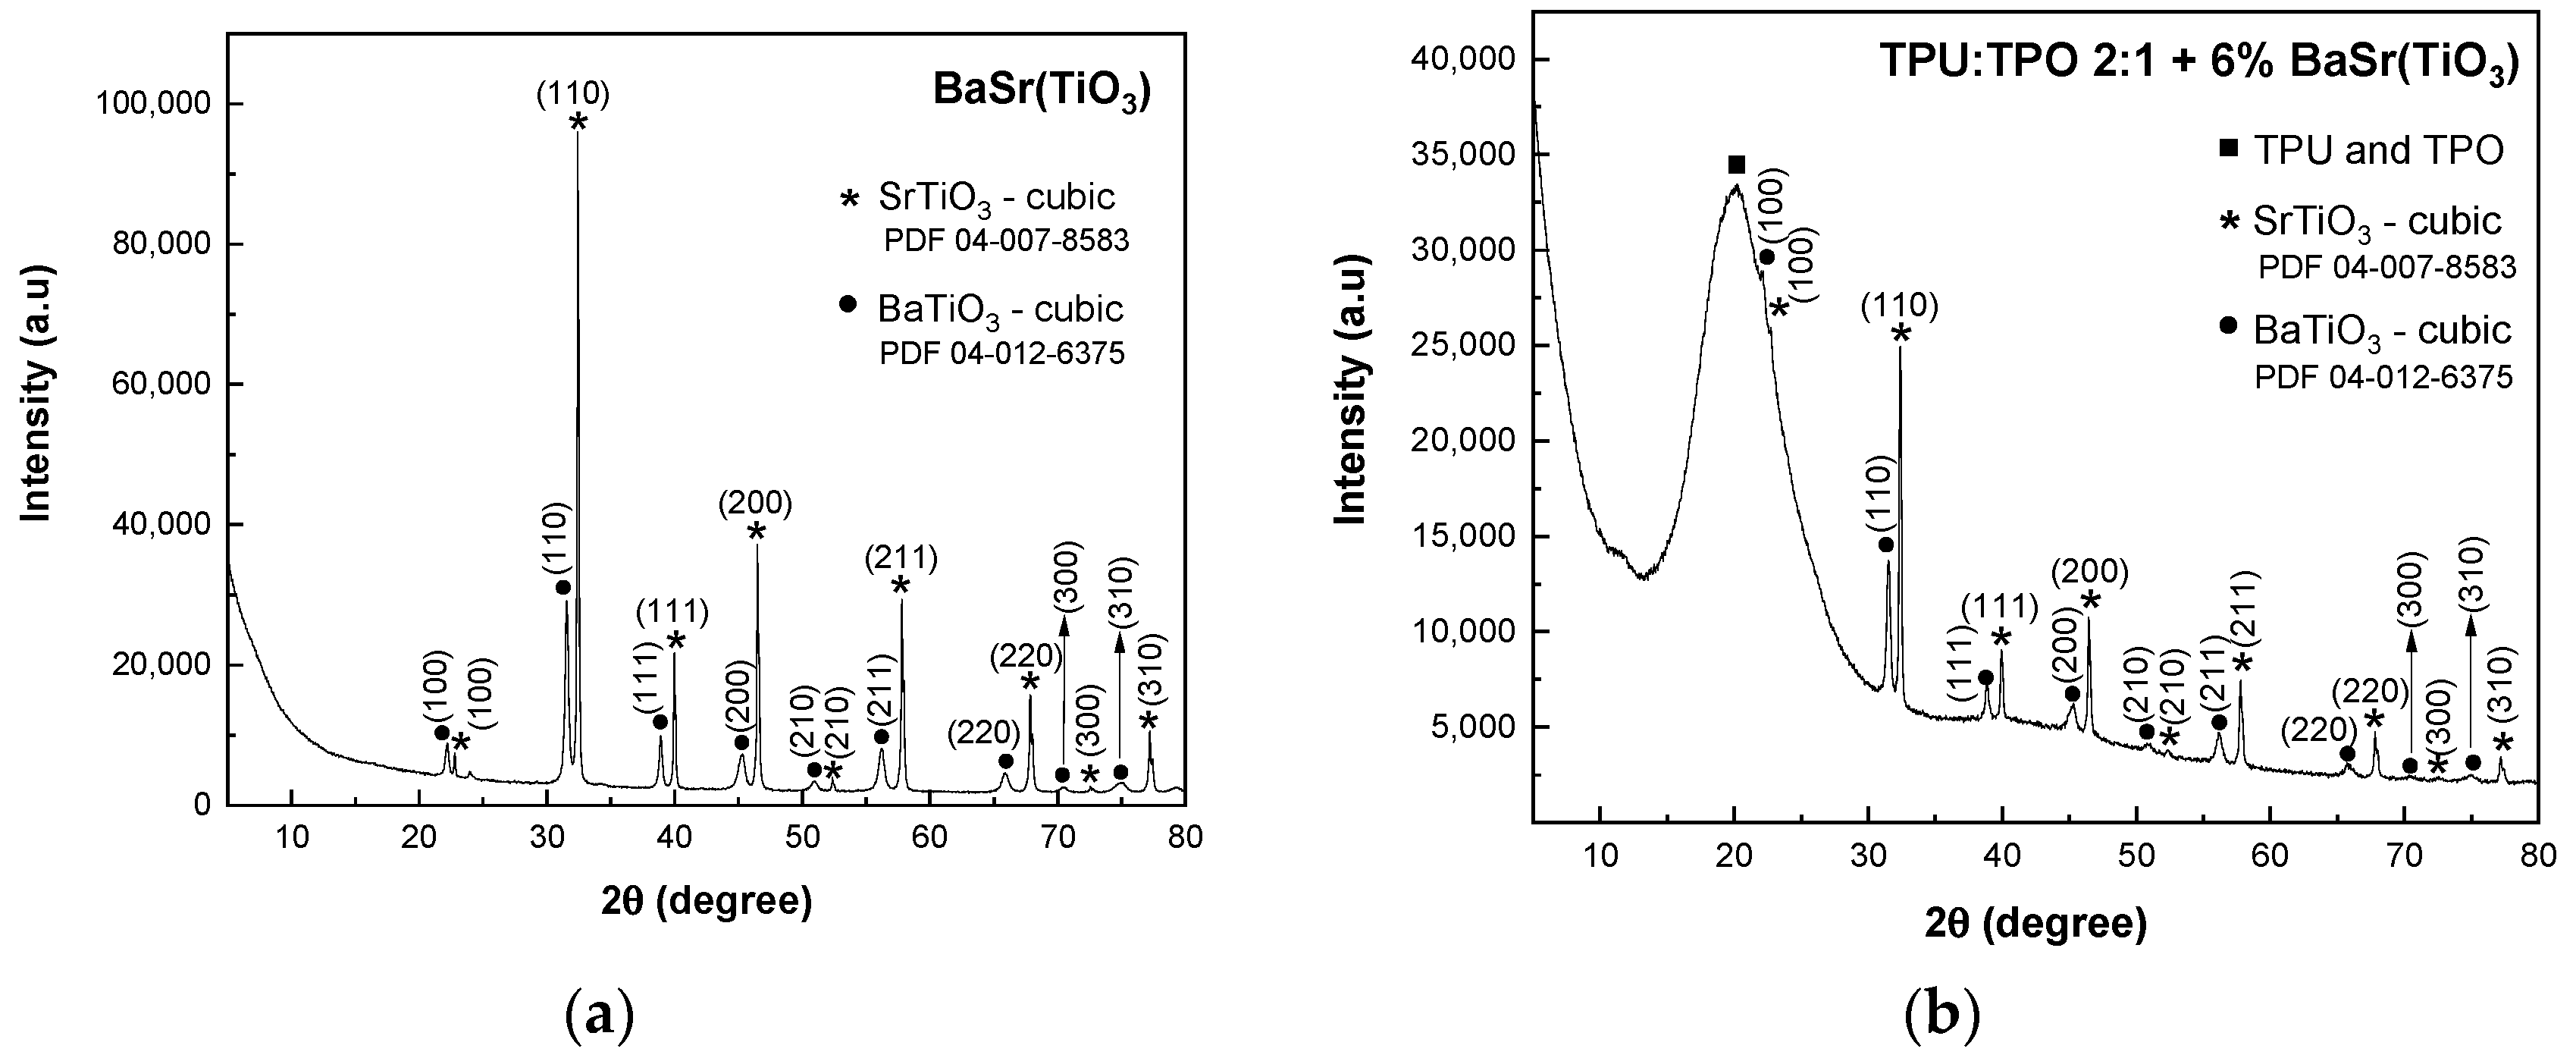
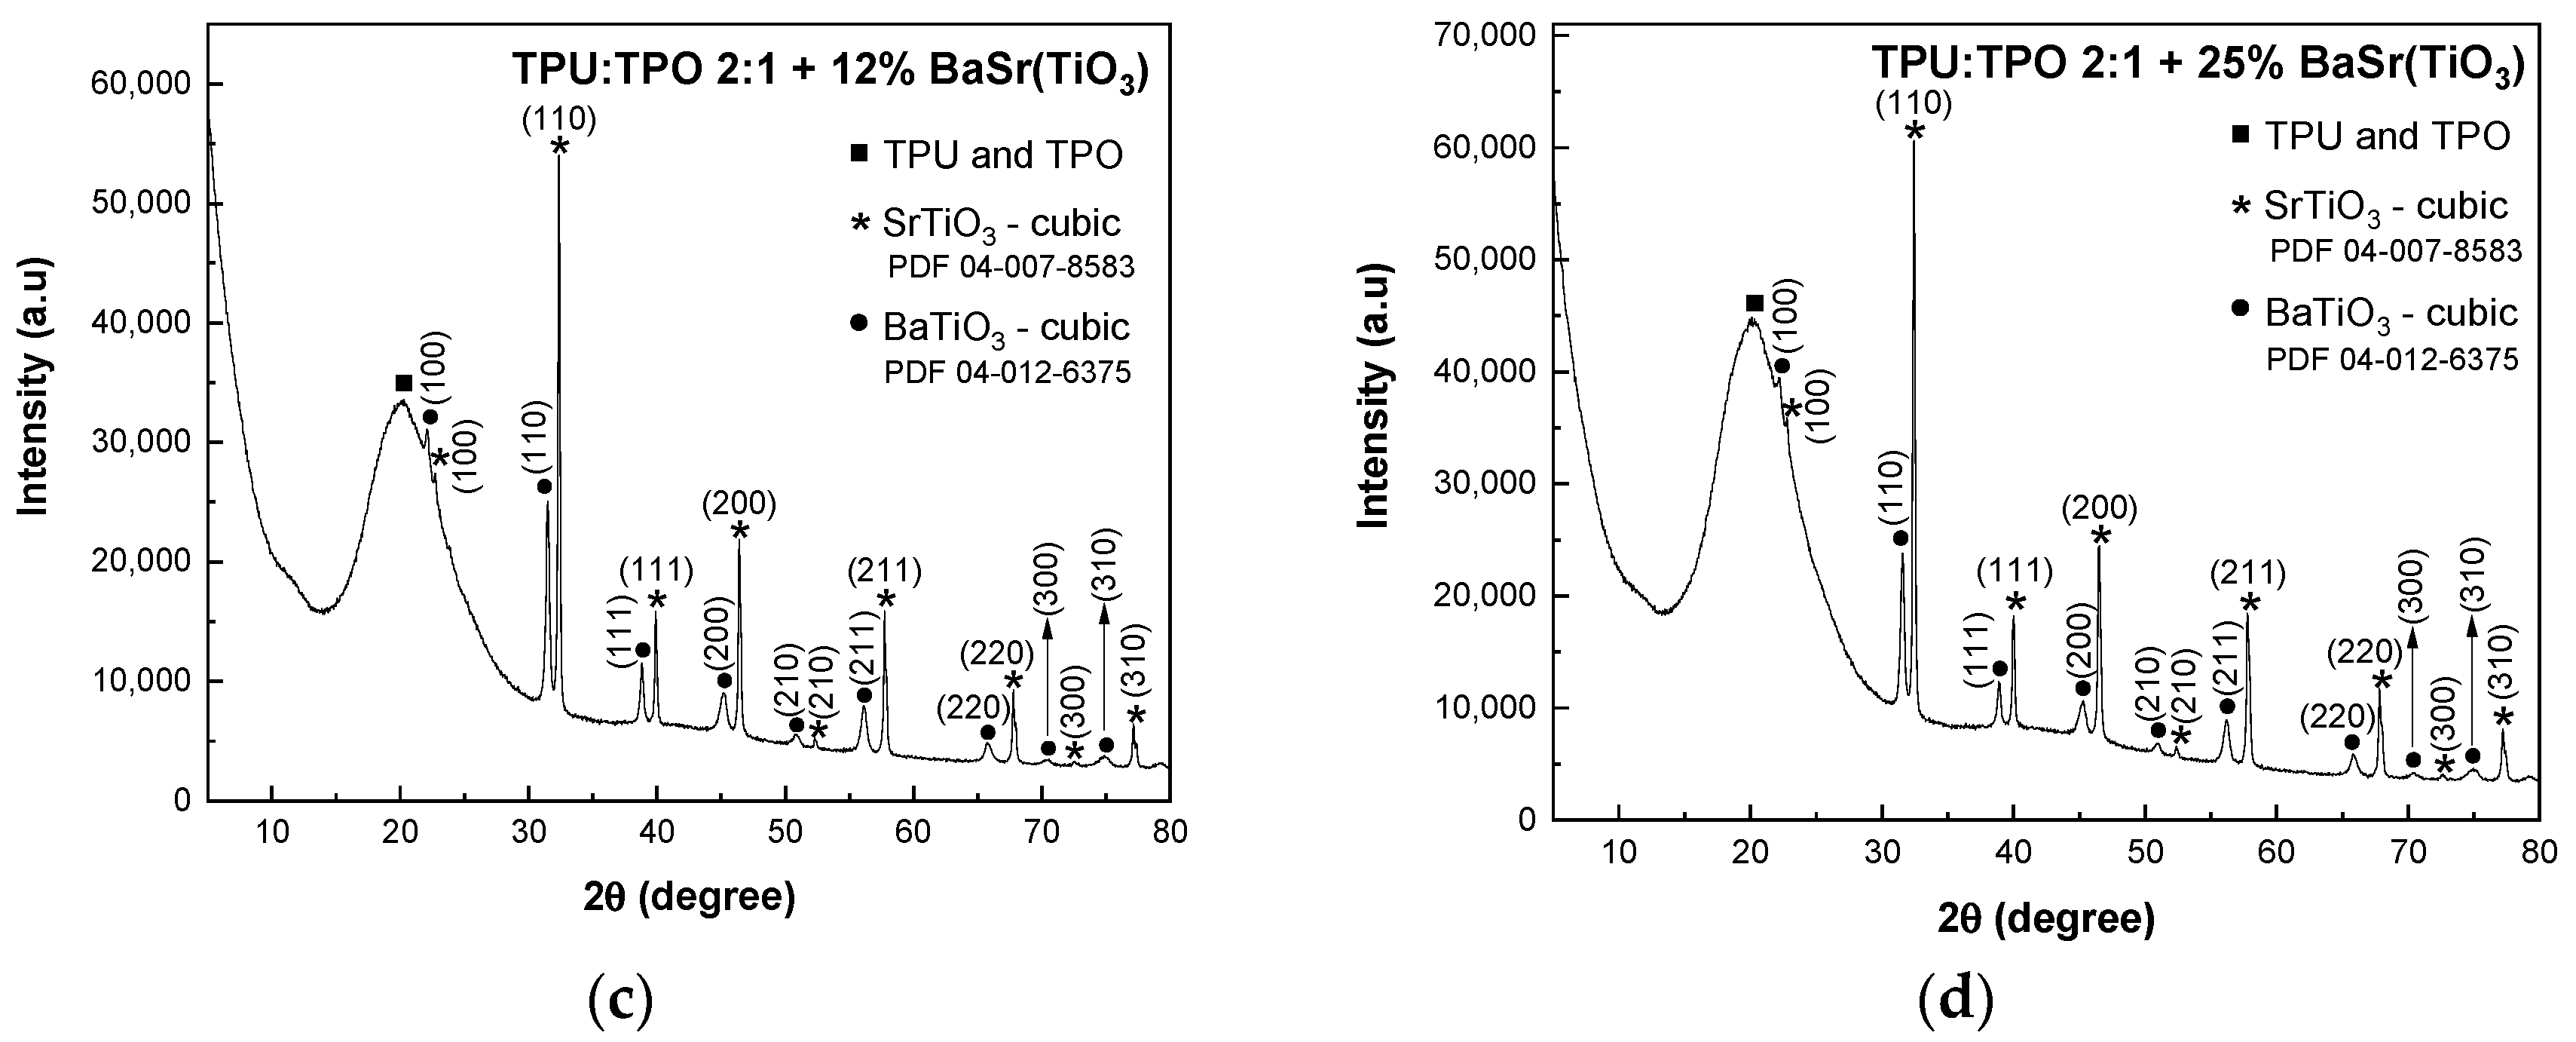
In
Figure 2a, the XRD pattern of BaSrTiO
3 shows the crystallographic plane of SrTiO
3 and the characteristic peaks of a cubic structure of BaTiO
3 identified with the crystallographic planes of (100), (110), (111), (200), (210), (211), (220), (300) and (310) (PDF 04-12-6375 database).
In BaSrTiO
3, the cubic phase of BaTiO
3 overlaps the characteristic peaks of the SrTiO
2.5 compound. Similar to the previous mixtures, in this case, the composites of BaSrTiO
3 and TPU:TPO blends show in the XRD patterns (
Figure 2b–d) the presence of the amorphous broad peak of TPU:TPO blends. Similar to the previous composites, the crystallite sizes have a decrease with decreasing the concentration of BaSrTiO
3, varying from 47 nm (BaSrTiO
3 sample) to 38.5 nm (TPU:TPO 2:1 + 25 wt % BaSrTiO
3). 37.2 nm (TPU:TPO 2:1 + 12 wt % BaSrTiO
3) and 35.2 nm (TPU:TPO 2:1 + 6 wt % BaSrTiO
3). The decrease in the crystallites size must to be correlated with the ultra-sonication process of CNs carried out in the mixture of the thermoplastic polymers, TPU and TPO, when there is a dispersion of these nanoparticles in the macromolecular compounds mass, assisted by the polymers’ adsorption onto the crystallite surface, similar to that reported in the case of BaTiO
3 [
12], which will prevent their reconnection.
3.2. The Vibrational Properties of the Composites Based on TPU:TPO and the SrTiO3 and BaSrTiO3 CNs
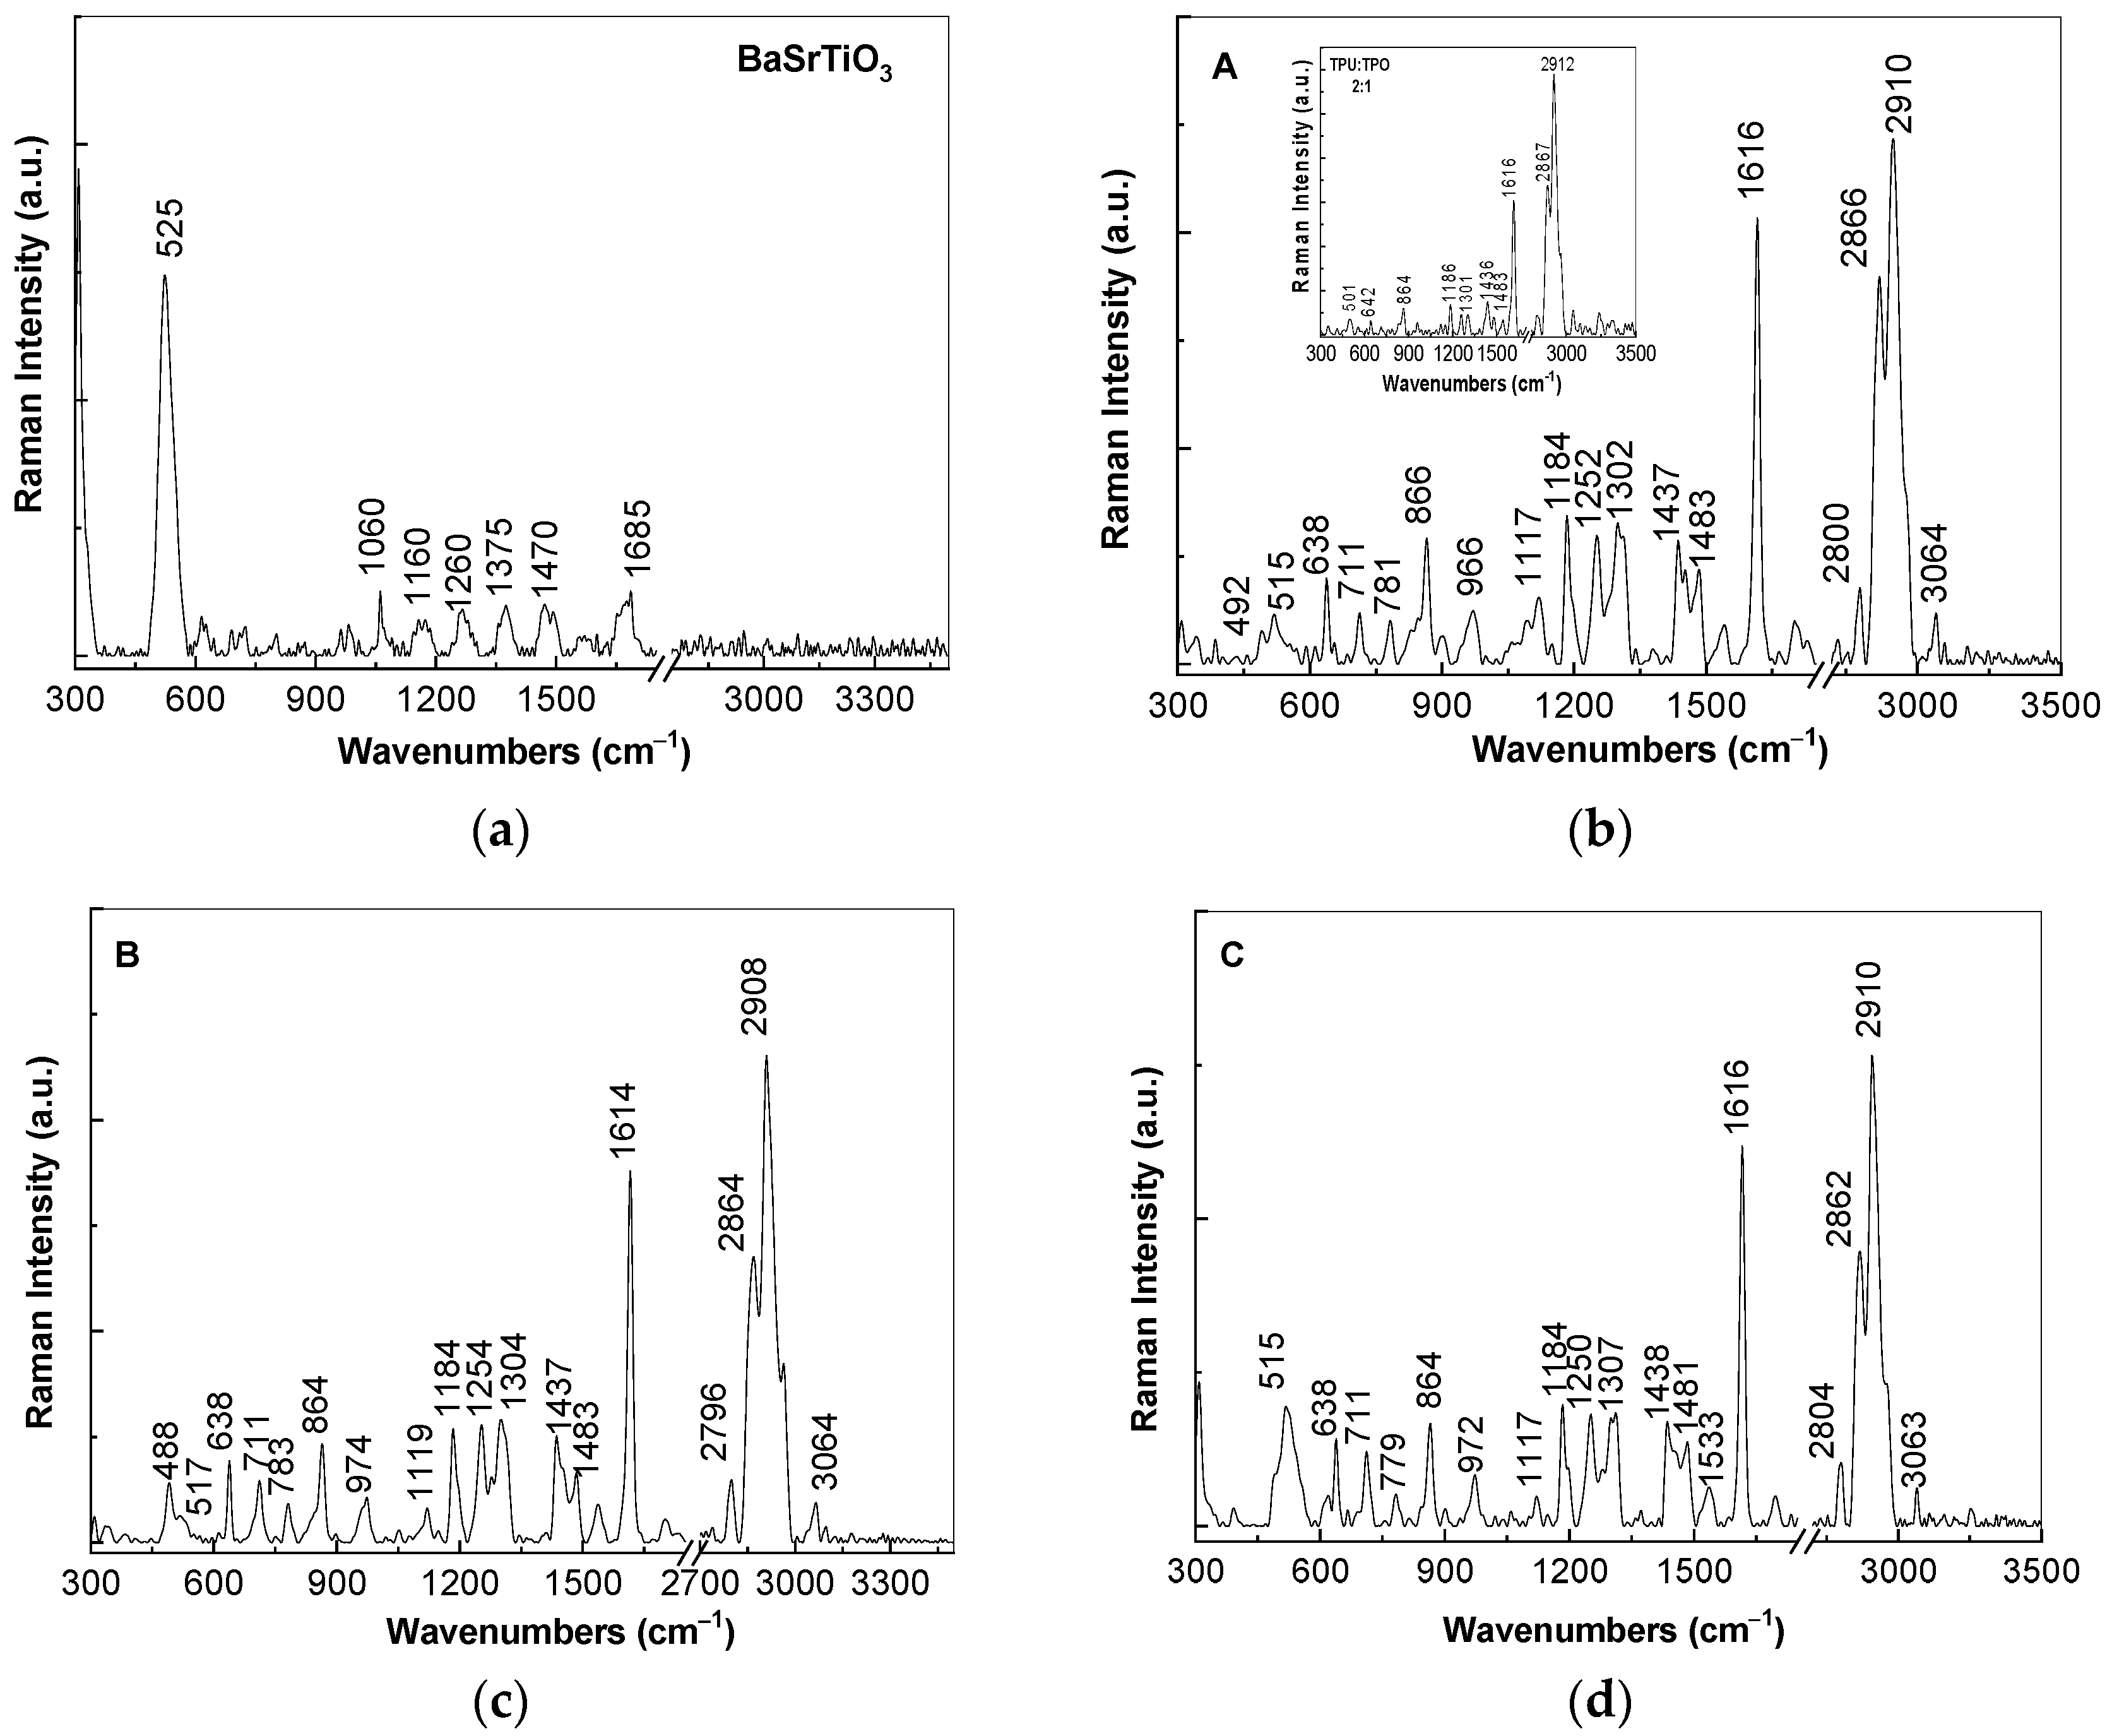
At the excitation wavelength of 1064 nm, Raman spectrum of (i) BaSrTiO
3 is dominated of an intense Raman line with the maximum at 525 cm
−1 (
Figure 3a) assigned to the A
1(TO) vibrational mode [
15], while in the case of (ii) the TPU:TPO blend, an intense Raman complex band at 2867–2912 cm
−1 accompanied by other lines of low intensity with peaks at 1616, 1436 and 1301 cm
−1 is reported. The assignment of the Raman lines of the TPU:TPO blend is shown in
Table 1.
The ratios between the intensities of the Raman lines localized in the spectral ranges are as follows: (i) 1600–1650 and 2800–2950 cm
−1 (I
1600–1650/I
2800–2950) is equal to ≈0.5; (ii) 1000–1200 and 2800–2950 cm
−1 (I
1000–1200/I
2800–2950) is equal to ≈0.11; (iii) 1250–1350 and 2800–2950 cm
−1 (I
1250–1350/I
2800–2950) is equal to ≈0.08; and (iv) 1400–1450 and 2800–2950 cm
−1 (I
1400–1450/I
2800–2950) is equal to ≈0.13. According to
Figure 3b–d, the following changes are induced to the TPU:TPO blend in the presence of CNs of the type BaSrTiO
3: (i) a down-shift of the Raman line from 2920 cm
−1 (the insert in
Figure 3b) to 2908–2910 cm
−1; (ii) an increase in the intensity of the Raman line situated in the spectral range 1600–1650 cm
−1, the fact that induces a change of the I
1600–1650/I
2800–2950 ratio to ≈0.8; and (iii) the I
1000–1200/I
2800–2950, I
1250–1350/I
2800–2950, and I
1400–1450/I
2800–2950 ratios increase almost twice, as increasing the BaSrTiO
3 concentration in the polymeric matrix from 6 wt % (0.28, 0.27, and 0.24,
Figure 3b) to 12 wt % (0.23, 0.25, and 0.22,
Figure 3c) and 25 wt % (0.25, 0.24, and 0.22,
Figure 3d). These changes are similar to those reported in the case of the composites based on the TPU:TPO blend and BaTiO
3 [
12]. A careful analysis of
Figure 3 highlights that the Raman line of BaSrTiO
3 peaked at 525 cm
−1 (
Figure 3a), assigned to the A1(TO) vibrational mode [
15], is shifted to 515–517 cm
−1 in the case of the A, B, and C samples, i.e., when the CNs concentration as well as their crystallites size in the TPU:TPO thermoplastic polymers mass decreases. This result is in good agreement with our previous study reported on BaTiO
3 [
12], its origin being in the defects generated during the preparation of the A, B, and C samples, as above mentioned.
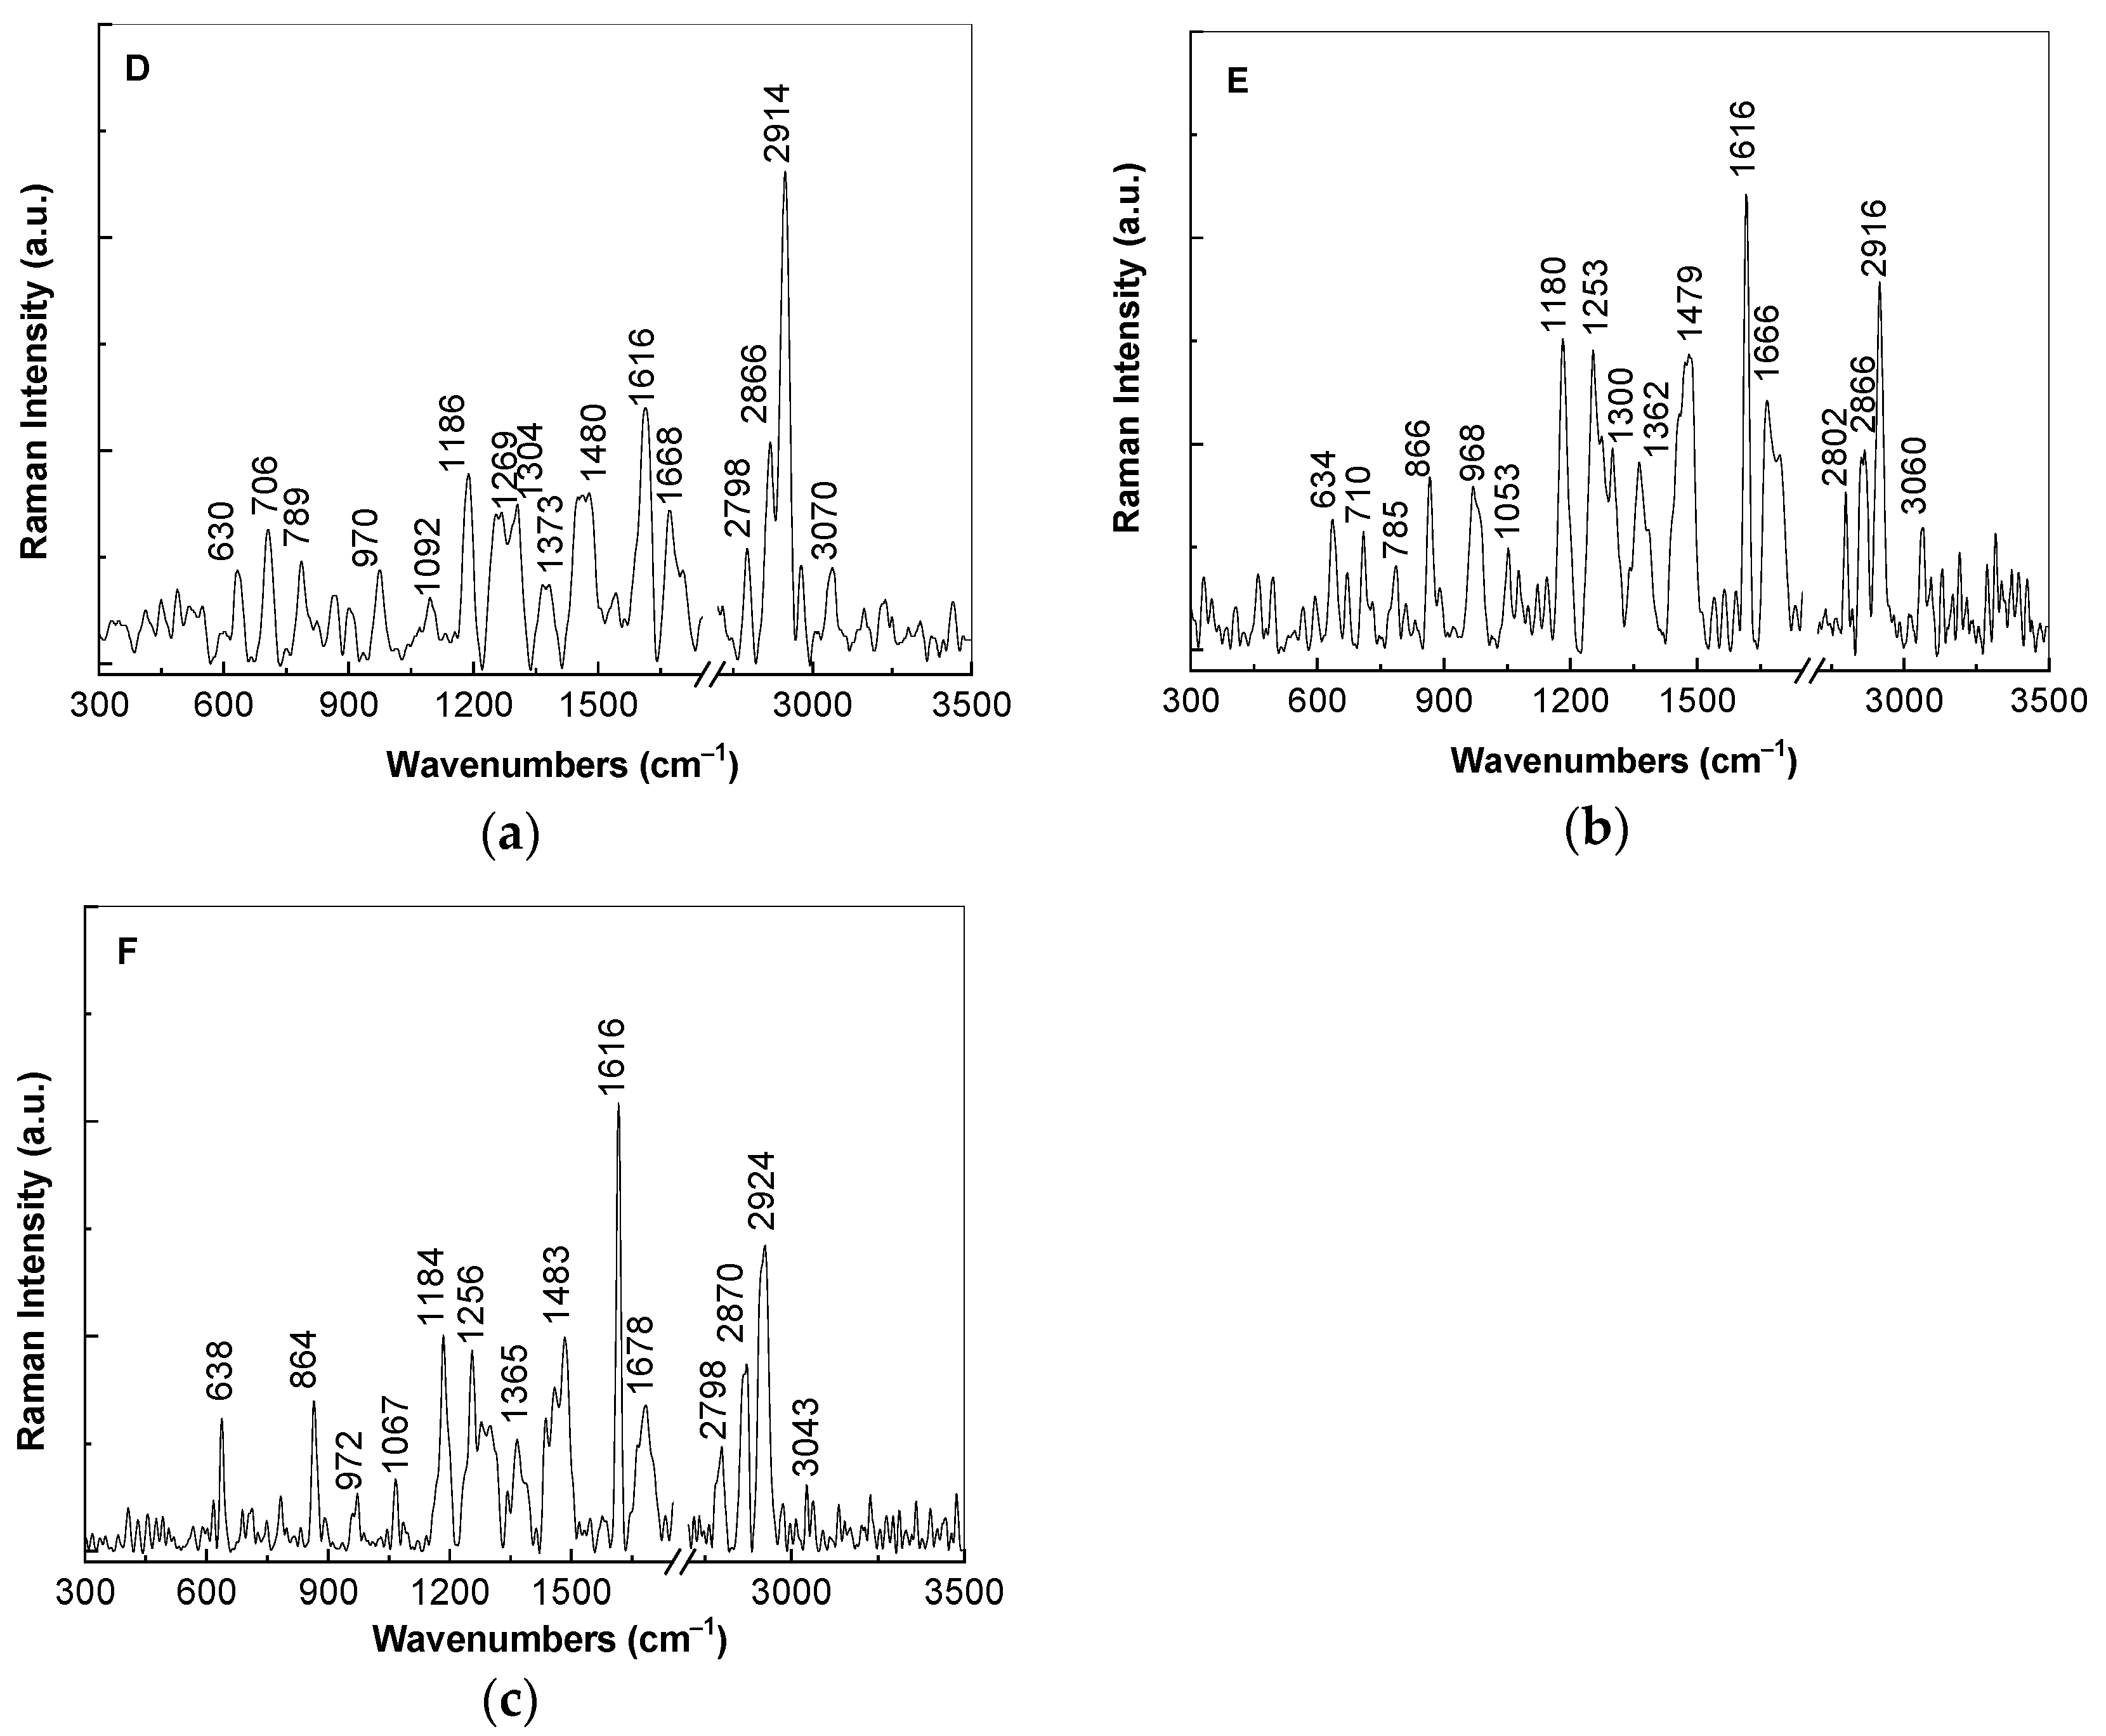
A careful analysis of
Figure 4 highlights the following changes induced to the Raman spectrum of the TPU:TPO blend as a consequence of the increase of the SrTiO
3 concentration in the mass of the D, E, and F samples: (i) an increase in the intensity of the Raman line localized in the spectral range 1600–1650 cm
−1 inducing a variation of the I
1600–1650/I
2800–2950 ratio from ≈0.5 (the insert of
Figure 3b) to 0.52 (
Figure 4a), 1.24 (
Figure 4b), and 1.46 (
Figure 4c), when the CNs concentration is equal to 6 wt %, 12 wt %, and 25 wt %, respectively; (ii) the appearance of a new Raman line in the spectral range 1650–1700 cm
−1, which often was attributed to vibrational modes of the C=O bonds in the COO− functional groups; (iii) an enhancement of the Raman line situated in the spectral range 1400–1500 cm
−1 from 0.07 (the insert of
Figure 3b) to 0.35 (
Figure 4a), 0.8 (
Figure 4b), and 0.7 (
Figure 4c); and (iv) a gradual increase of the I
1000–1200/I
2800–2950, I
1250–1350/I
2800–2950, and I
1400–1450/I
2800–2950 ratios, when the SrTiO
3 concentration is equal to 6 wt % (0.38, 0.32, and 0.35,
Figure 4a), 12 wt % (0.84, 0.55, and 0.8,
Figure 4b) and 25 wt % (0.71, 0.41, and 0.7,
Figure 4c).
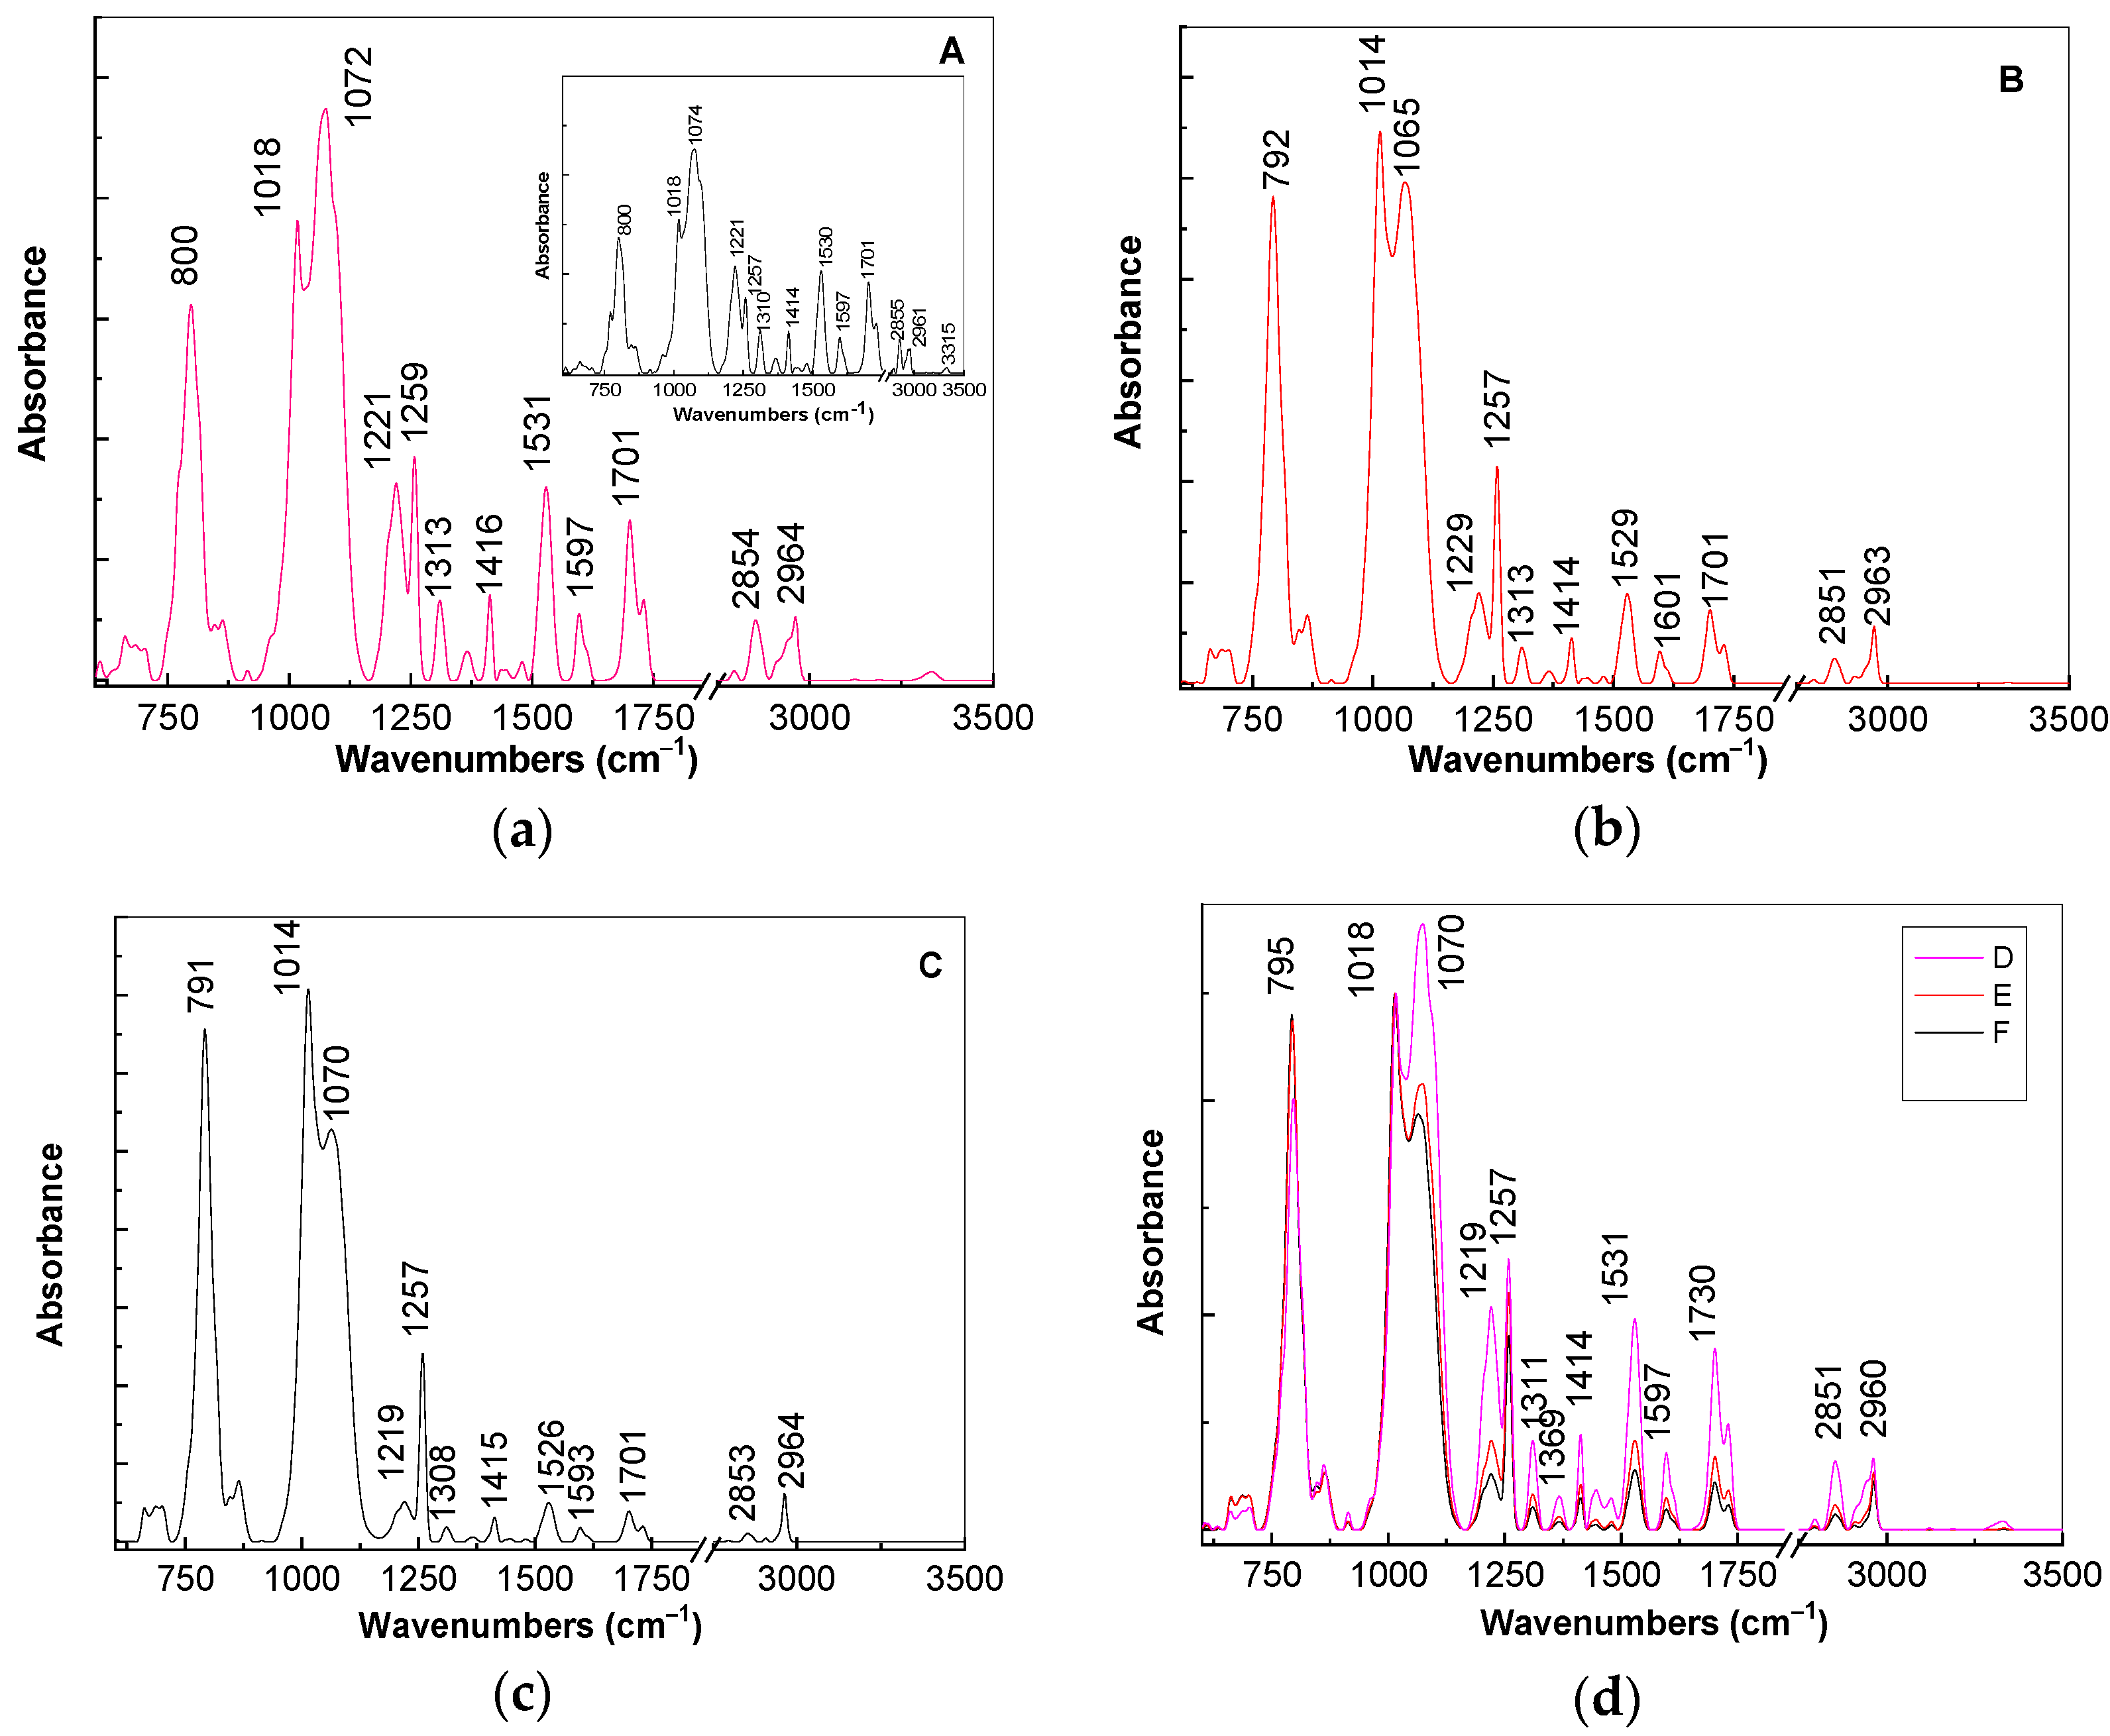
For a better explanation of above changes in
Figure 5, we show the IR spectra of the composites based on the TPU:TPO blends and CNs of the type BaSrTiO
3 and SrTiO
3. According to the insert of
Figure 5a, the main vibrational features of the TPU:TPO blend are shown in
Table 2.
The ratios between the absorbances of the IR bands situated at: (i) 1016 and 1074 cm
−1; (ii) 1221 and 1257 cm
−1; (iii) 800 and 1074 cm
−1 are equal to ≈0.69, ≈1.42, and ≈0.61, respectively. The increase in concentration of BaSrTiO
3 in the composite weight containing the TPU:TPO blend induces the following changes in the IR spectrum of the thermoplastic polymers: (i) a gradual down-shift of the IR band from 800 to 791 cm
−1, simultaneous with the increase in the absorbance, such that the ratio between the absorbance of the IR bands situated at 800 and 1074–1065 cm
−1 is changed from 0.61 (insert of
Figure 5a) to 0.65 (
Figure 5a), 0.87 (
Figure 5b), and 1.24 (
Figure 5c); (ii) a progressive change of the complex IR band localized in the spectral range 980–1125 cm
−1; the ratio between the absorbance of the two IR bands at 1014–1018 and 1065–1074 cm
−1 varies from 0.69 (insert in
Figure 5a) to 0.8 (
Figure 5a), 1.1 (
Figure 5b), and 1.34 (
Figure 5c); and (iii) a decrease in the absorbance of the IR bands situated in the spectral range 1450–1750 cm
−1, which is accompanied by the variation of the ratio between the absorbance of IR bands at 1221 and 1257 cm
−1 from 1.42 (insert in
Figure 5a) to 0.55 (
Figure 5a), 0.43 (
Figure 5b), and 0.21 (
Figure 5c).
A careful analysis of
Figure 5d highlights a similar behavior in the case of the A, B, and C samples, i.e., when the SrTiO
3 concentration increases to 6 wt %, 12 wt %, and 25 wt % in the thermoplastic polymers matrix. These variations of vibrational properties of the TPU:TPO blend in the presence of the BaSrTiO
3 and SrTiO
3 CNs are found to be similar to those in the case of the TPU:TPO/BaTiO
3 composites [
12]. Taking into account all these, we conclude that both in the presence of the BaSrTiO
3 and SrTiO
3 CNs, the most reactive repeating units are those of TPU, the adsorption process of the thermoplastic polymer onto the CNs surface involving an exchange reaction similar to that reported in Ref. [
12]. Moreover, this statement can be approved from XRD patterns by considering the decreasing ratio between the relative peak intensities of (110) planes of SrTiO
3 and SrTiO
2.5 from: (a) 3.32 (BaSrTiO
3) to 1.81 (A sample) and (b) 11.38 (SrTiO
3) to 2.3 (D sample). Additional information concerning the adsorption of the TPU:TPO thermoplastic polymers onto the CNs surface are shown in the following by anisotropic photoluminescence.
3.3. The Photoluminescence Properties of the Composites Based on TPU:TPO and the SrTiO3 and BaSrTiO3 CNs
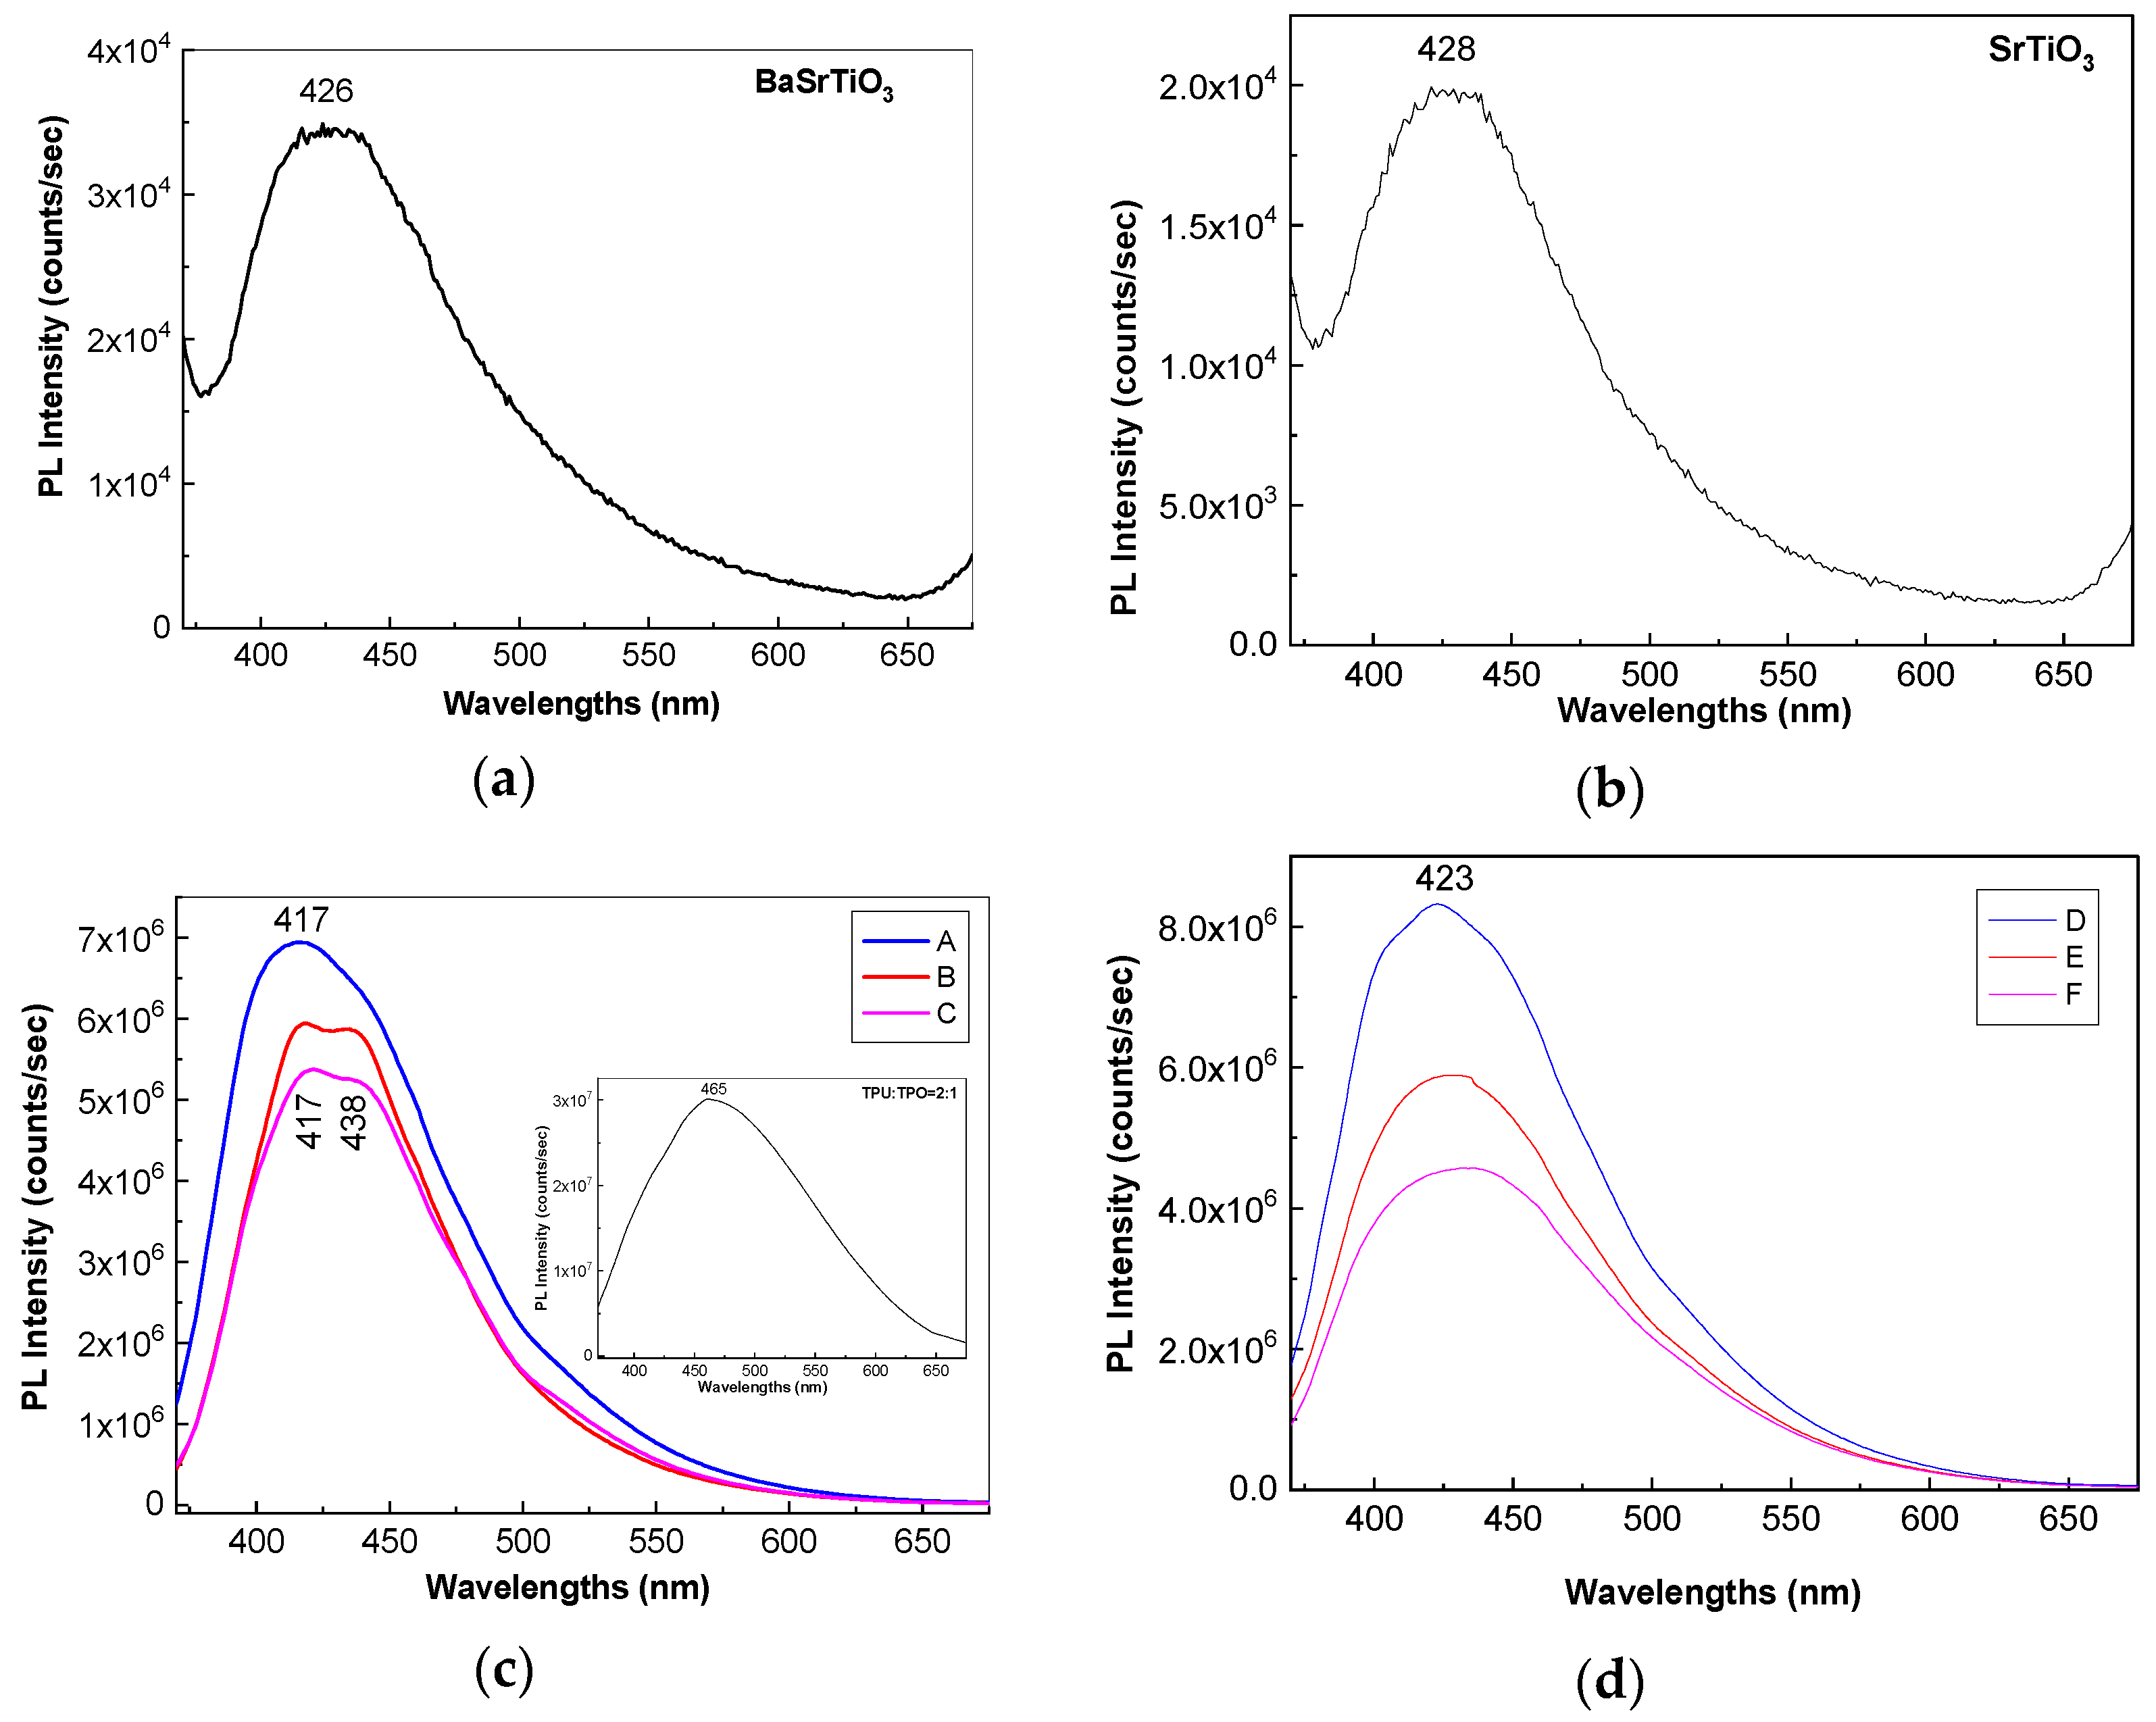
Figure 6a,b show PL spectra of BaSrTiO
3 and SrTiO
3 CNs recorded at the excitation wavelength of 350 nm. Both BaSrTiO
3 and SrTiO
3 are characterized by an emission band with the maximum at 426 nm, having the intensity around 3.4 × 10
4 and 1.98 × 10
4 counts/s, respectively. The insert of the
Figure 6c highlights that the emission band of the TPU:TPO blend is peaked at 465 nm having the intensity around of 3.01 × 10
7 counts/s. According to our previous study, the position of the PL band of the TPU:TPO blend is dependent of the weight ratio of the two thermoplastic polymers [
12]. Thus, when the TPU:TPO mass ratio is equal to 1:1 and 2:1, the PL band of the TPU:TPO blends is peaked at 486 nm and 465 nm, respectively. The maximum of these PL bands does not correspond to a sum effect of the PL bands of TPU and TPO, which have the maxima at 410 nm and 441 nm, respectively. This fact was explained as a consequence of the exchange reaction between the two thermoplastic polymers [
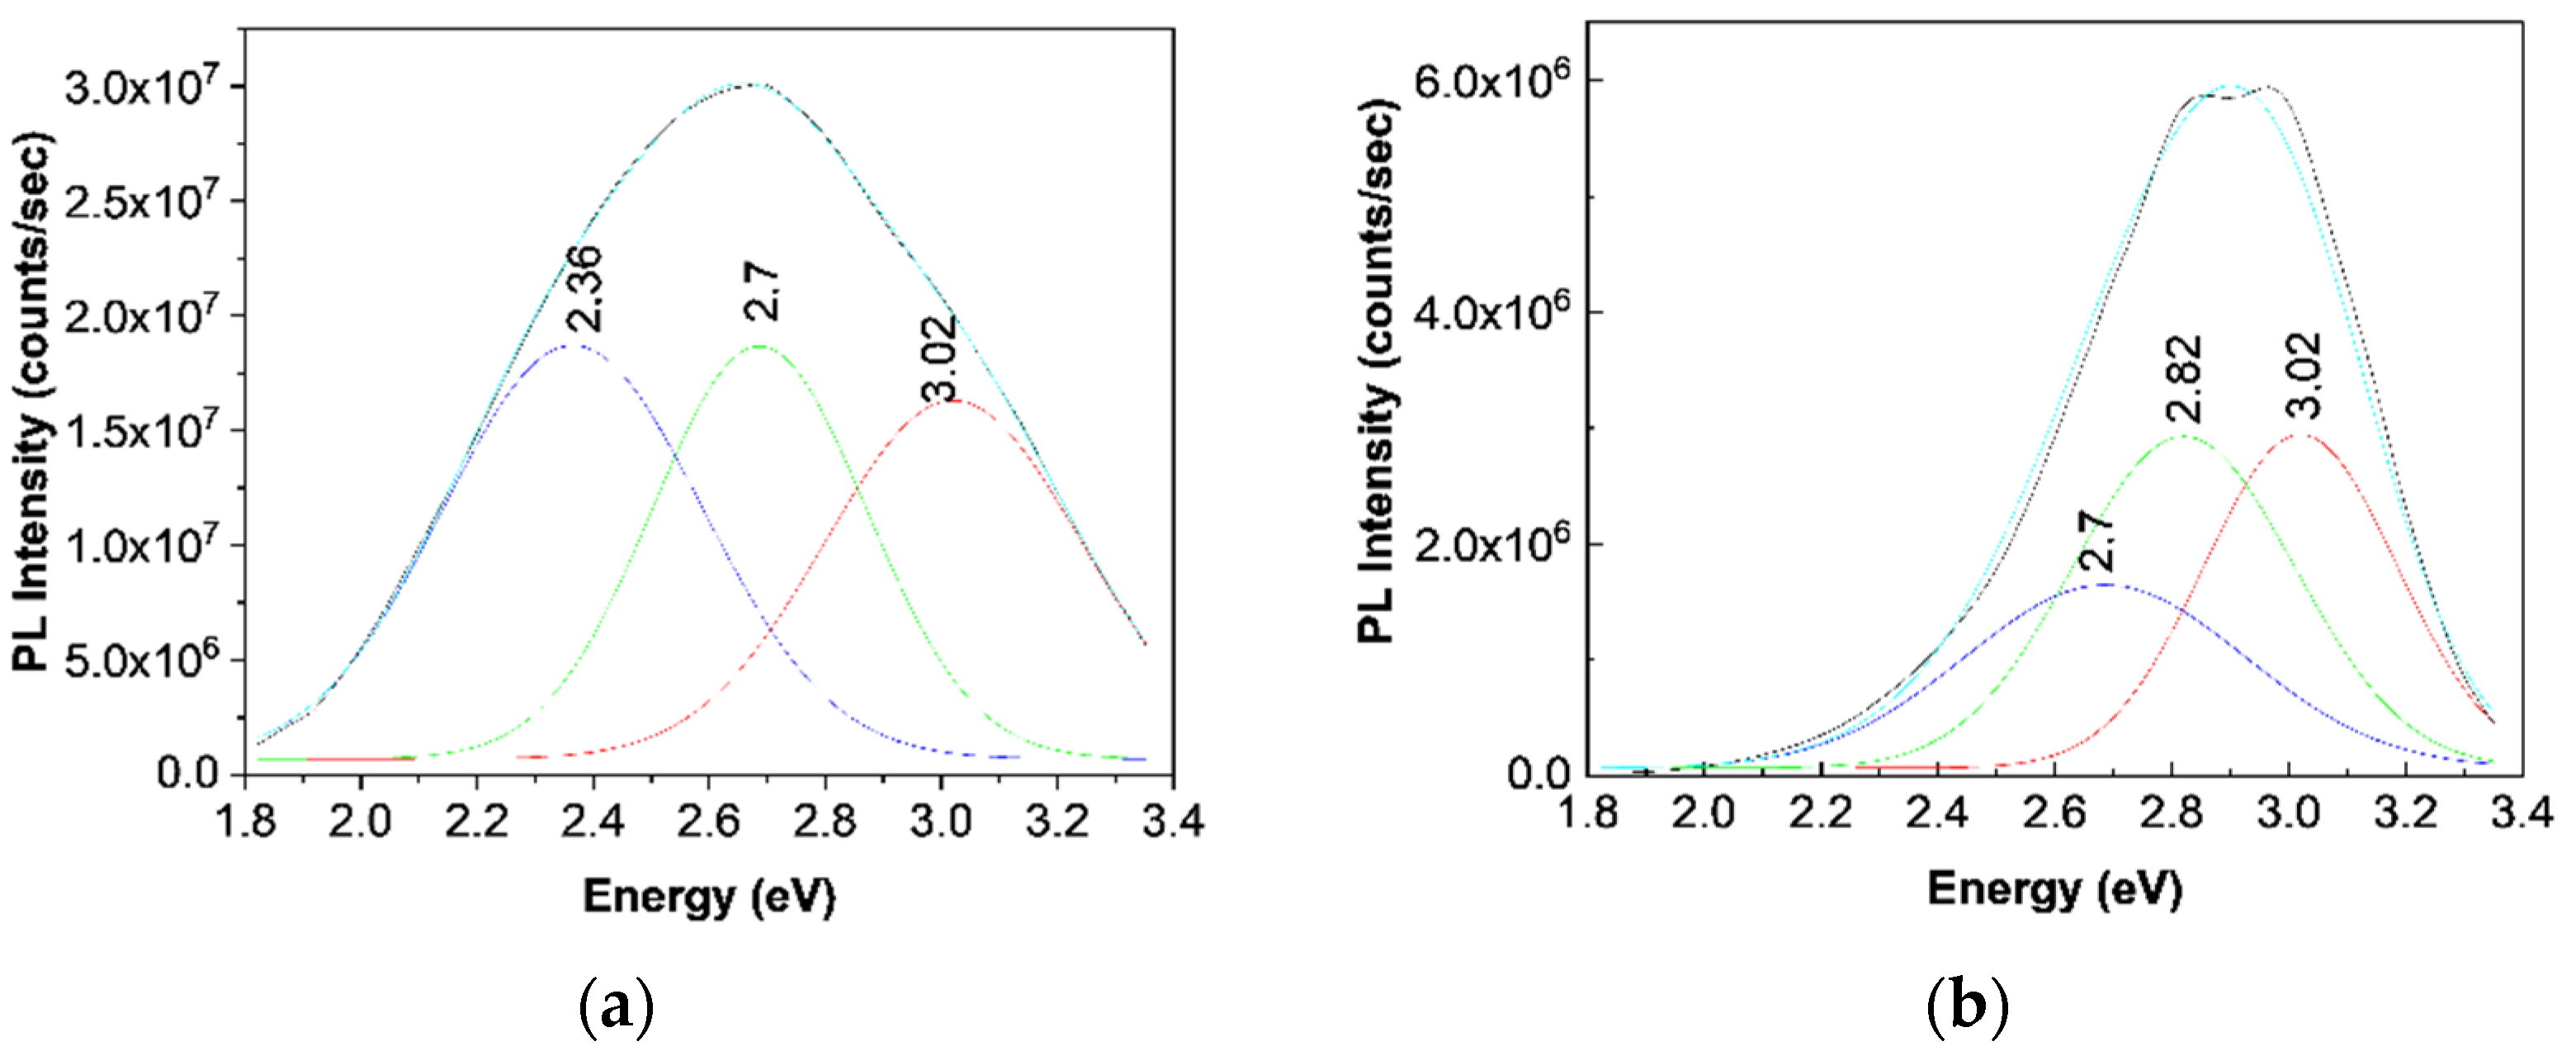
12]. According to
Figure 7a, the PL spectrum of the TPU:TPO blend shows three emission bands peaked at 3.02 eV (410 nm), 2.7 eV (459 nm), and 2.36 eV (525 nm), which originate in the electronic transitions belonging to the repeating units of TPU, TPO, and the TPU:TPO blend, respectively [
12].
Returning to
Figure 6, a down-shift of the PL band of the TPU:TPO blend from 465 nm (insert in
Figure 6c) to ≈423 nm (
Figure 6d) and ≈417 nm (
Figure 6c) is reported to be induced in the presence of the BaSrTiO
3 and SrTiO
3, respectively. This behavior is similar to that reported in the case of the PL spectra of the TPU:TPO blends, when the TPU weight increases simultaneously with the decrease of the TPO weight in the TPU:TPO blend mass [
12]. In the present case, an increase of the TPO weight in the TPU:TPO blend mass can be explained only if we accept that an interaction of the TPU:TPO blends with BaSrTiO
3 CNs took place. A puzzling fact is that an emission band with the maximum at 438 nm was also reported in the case of the composites based on the TPU:TPO blend and BaTiO
3 CNs 25 wt % [
12]. For a better understanding of the PL band at ≈438 nm,
Figure 7b shows a deconvolution of the PL spectrum of the B sample. In this last case, three emission bands peaked at 3.02 eV (≈410 nm), 2.82 eV (≈439 nm), and 2.7 eV (≈459 nm). The differences remarked in the case of the TPU:TPO blend and the B sample highlight clearly an up-shift of the emission bands associated to the electronic transitions belonging to the repeating units of TPO and the TPU:TPO blend. This result indicates that the BaSrTiO
3 CNs interact with the repeating units of the type TPU and TPU:TPO. In this context, we note that the frequency separations between the PL bands, which peaked at (i) 3.02 and 2.82 eV and (ii) 2.82 and 2.7 eV, are equal to 1613 cm
−1 (0.2 eV) and 968 cm
−1 (0.12 eV), which are situated no longer to those peaked at 1614–1616 cm
−1 and 966–974 cm
−1 (
Figure 3) belonging to the vibration modes of the aromatic structure stretching and out-of-plane benzene bending in TPU [
24]. The higher intensity of the Raman line situated to 966–974 and 1614–1616 cm
−1 suggests the presence of steric hindrance effects induced of the adsorption of thermoplastic polymers onto the CNs surface. An additional variation induced of the two CNs is the decrease in the intensity of the TPU:TPO blend PL band from 3.01 × 10
7 counts/s (the insert in
Figure 6c) to (i) 6.94 × 10
6 counts/s (A sample, blue curve in
Figure 6c), 5.93 × 10
6 counts/s (B sample, red curve in
Figure 6c), and 5.36 × 10
6 counts/s (C sample, magenta curve in
Figure 6c) and (ii) 8.32 × 10
6 counts/s (D sample, blue curve in
Figure 6d), 5.88 × 10
6 counts/s (E sample, red curve in
Figure 6c), and 4.56 × 10
6 counts/s (F sample, magenta curve in
Figure 6d). This behavior confirms the role of the BaSrTiO
3 and SrTiO
3 CNs as PL quenching agent of the TPU:TPO blend.
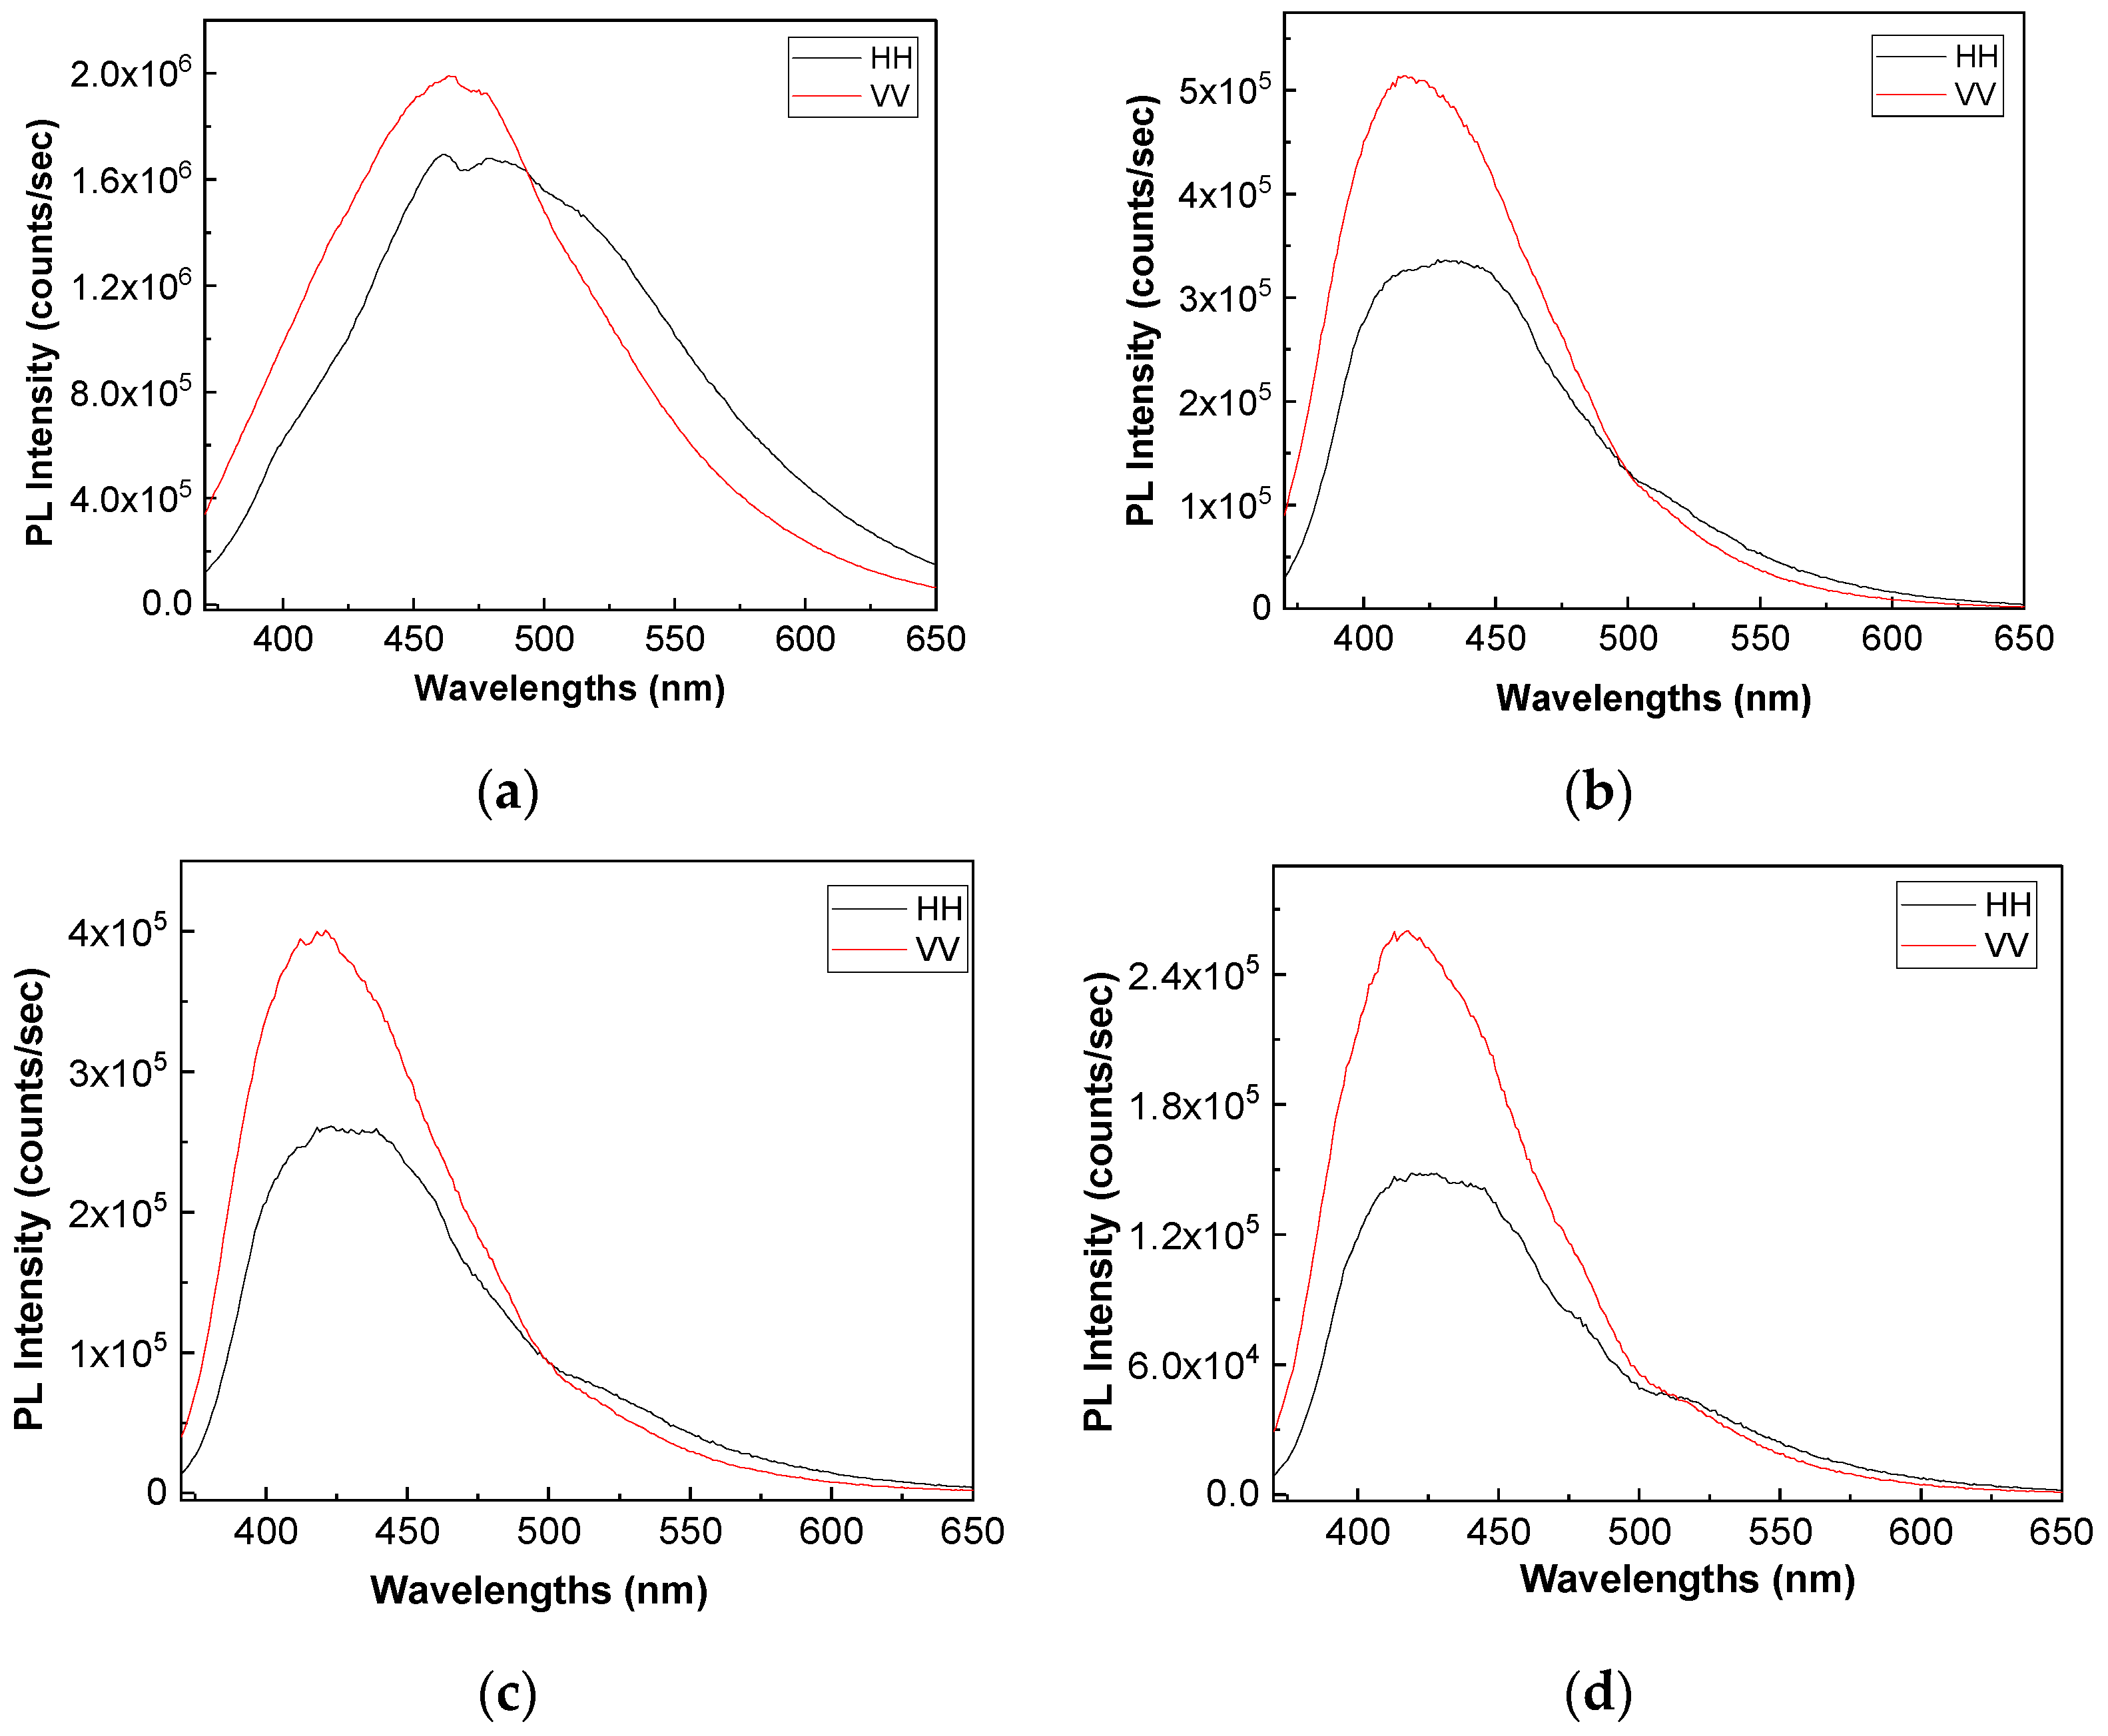
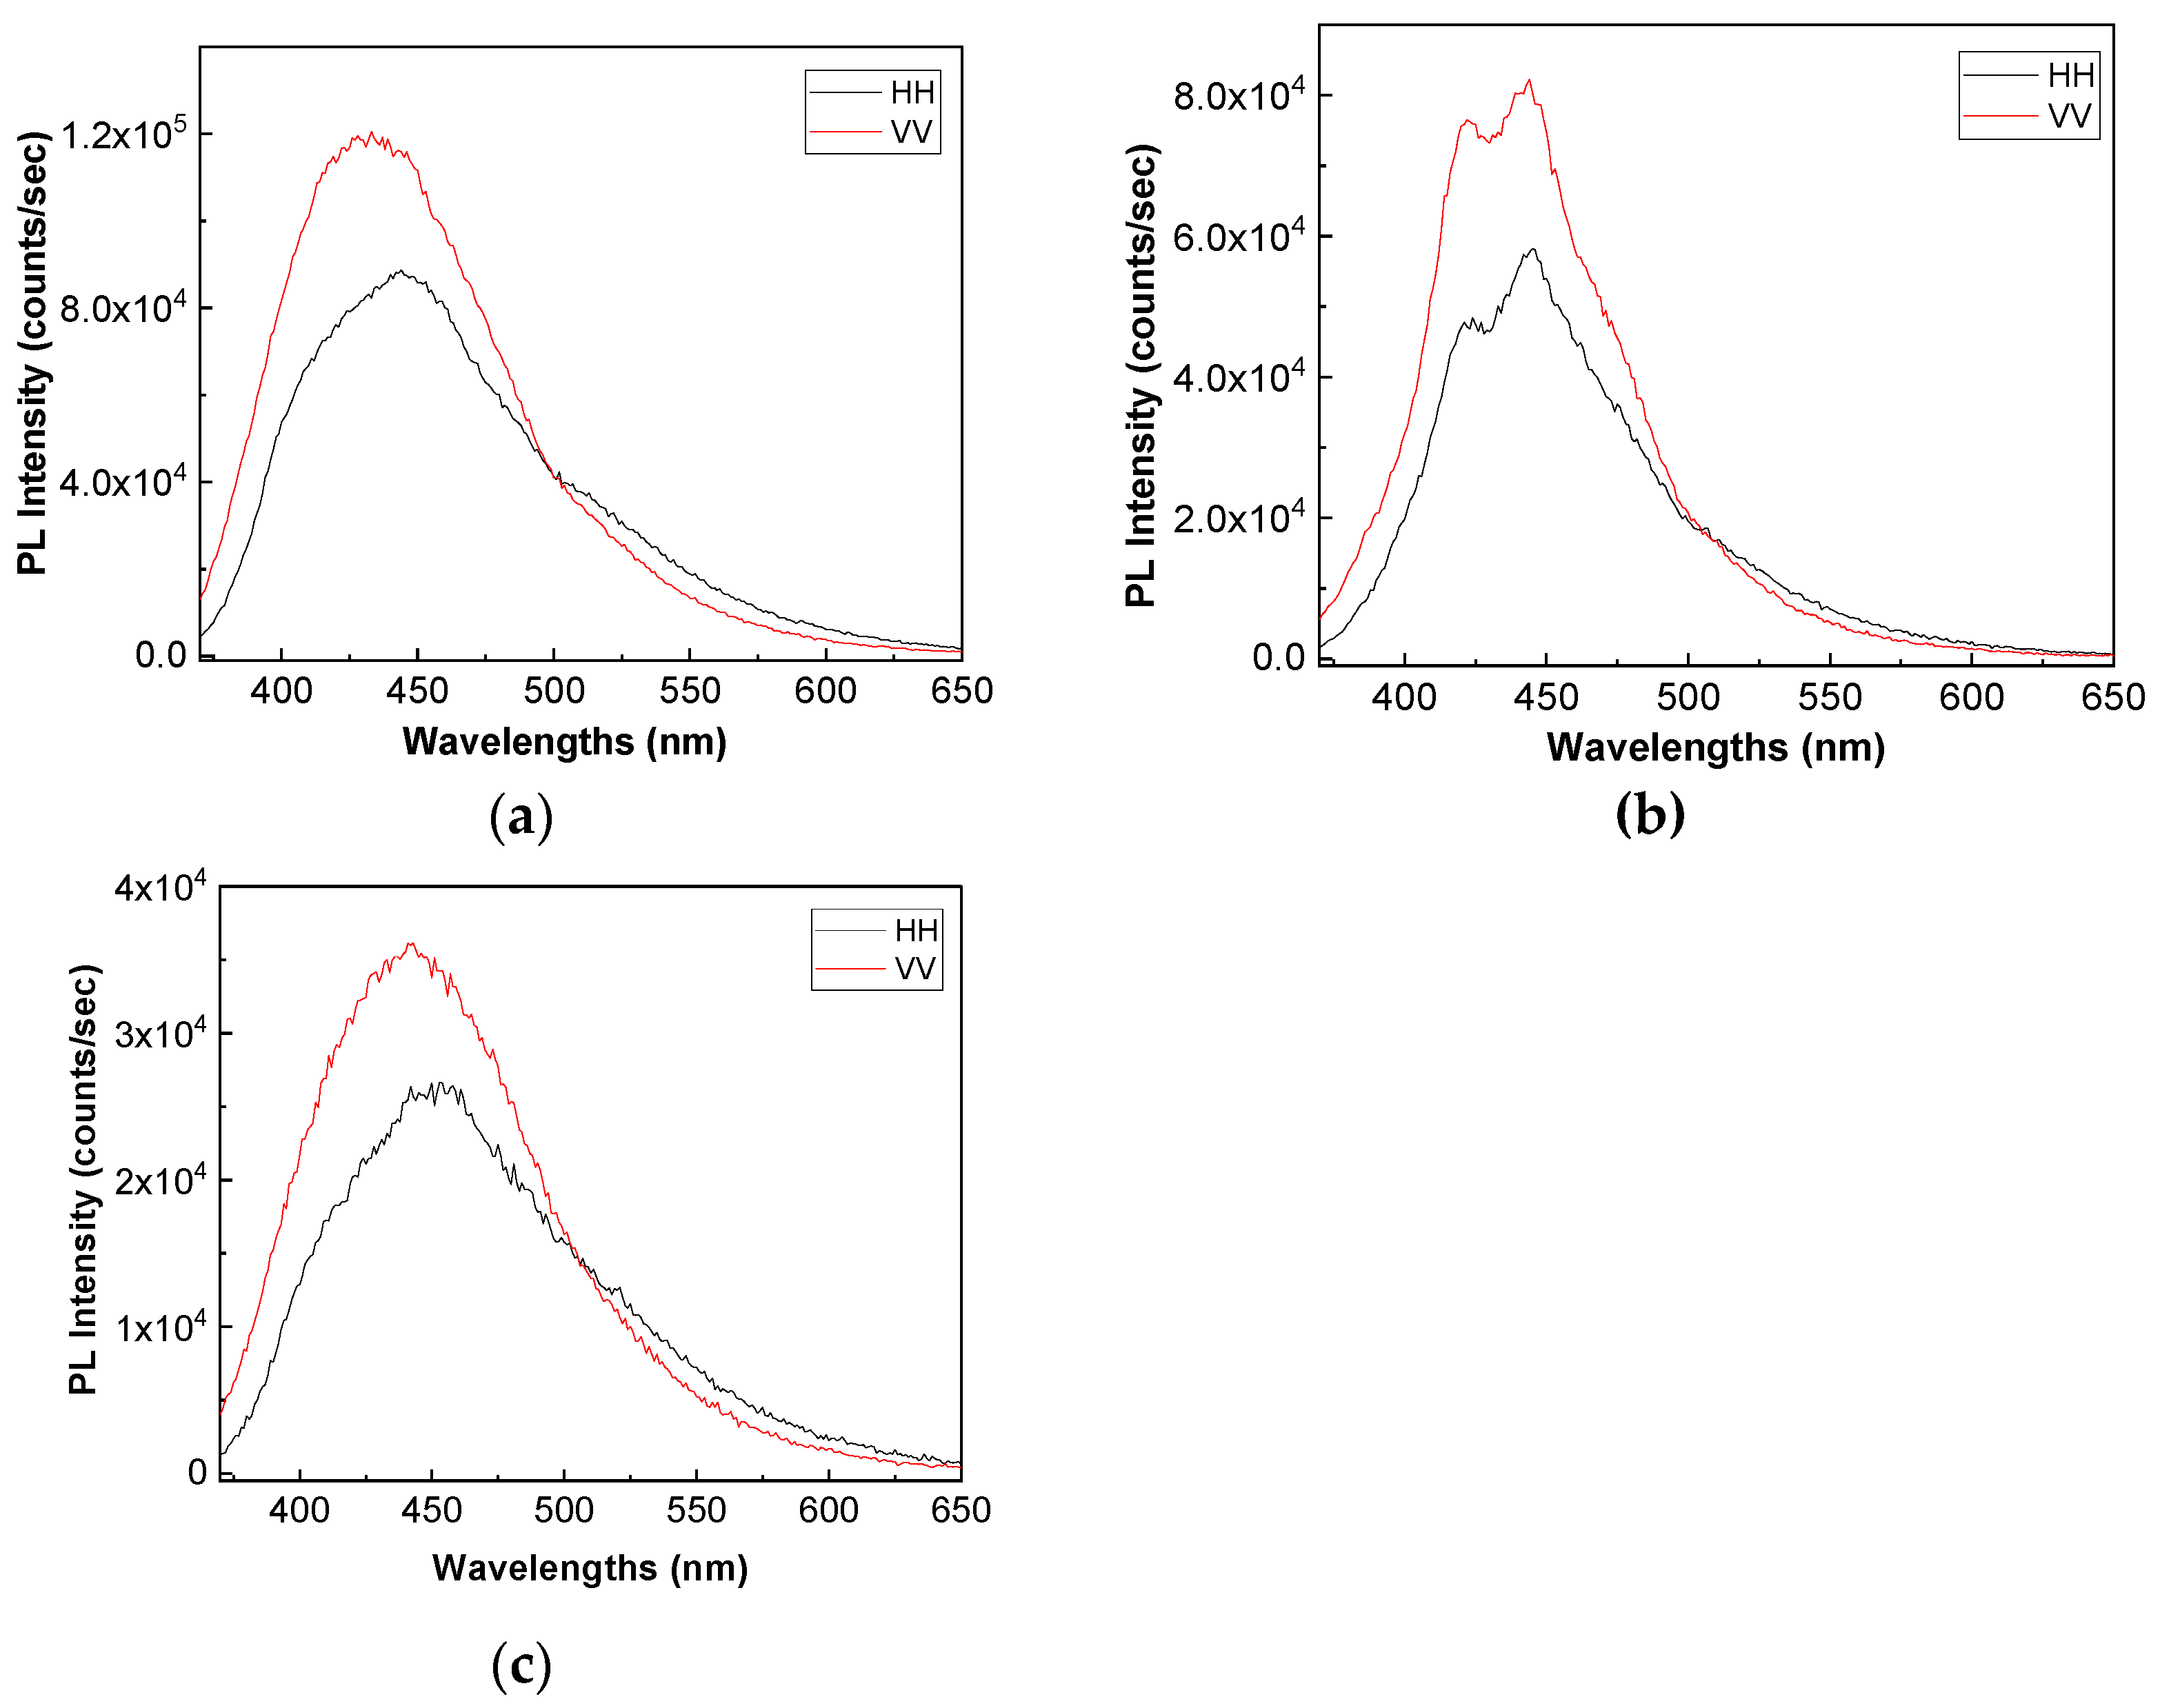
Figure 8 and
Figure 9 show the PL spectra in polarized light of the A, B, C, D, E, and F samples. The black and red curves in
Figure 8 and
Figure 9 correspond to PL spectra recorded when the emission and excitation polarizors are both in horizontal (HH) and vertical (VV) position. According to the anisotropic PL measurements shown in
Figure 8 and
Figure 9, a dependence of PL spectra with the light polarization in the case of the A, B, C, D, E, and F samples is reported.
Considering the mathematic algoritm shown in Ref. [
25], in the case of the single-phonon excitation, we calculate the anisotropy (r) and angle of the binding (θ
PL) of the following: (i) the TPU:TPO thermoplastic polymers in the absence of the CNs to be equal to 0.302 and 23.7° [
26]; (ii) the TPU:TPO thermoplastic polymers adsorbed onto BaSrTiO
3 to be around of: (a) 0.08 and 46.9° for the A sample, (b) 0.03 and 51.5° for the B sample, and (c) 0.05 and 49.3° for the C sample; and (iii) the TPU:TPO thermoplastic polymers adsorbed onto SrTiO
3 to be around of (a) 0.04 and 66° fo the D sample, (b) 0.61 and 52.4° for the E sample, and (c) 0.01 and 53.4° for the F sample. These results indicate that in the presence of CNs, an increase in θ
PL takes place, as a consequence of the exchange reaction between urethanic-type repeating units of the TPU:TPO blend and CNs. Depending on the type of CNs, BaSrTiO
3, or SrTiO
3, the biggest differences between θ
PL are reported for the composites having a concentration of CNs equal to 6 wt %. At higher CNs concentrations, i.e., 12 wt % and 25 wt %, the differences between θ
PL values are smaller as a consequence of the potential aggregation processes of nanoparticles during the preparation of the thermoplastic polymers/ceramic nanoparticles composites as free membranes.
3.4. The Dielectric and Conductive Properties of the Composites Based on TPU:TPO and the SrTiO3 and BaSrTiO3 CNs
The three main processes of dielectric relaxation (dipole, interfacial polarization, and electrode polarization) plus conduction mechanism can be observed and studied through the spectra of corresponding electrical quantities.
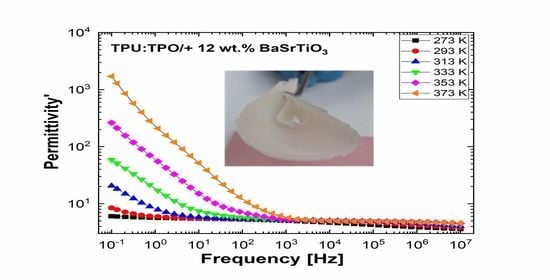
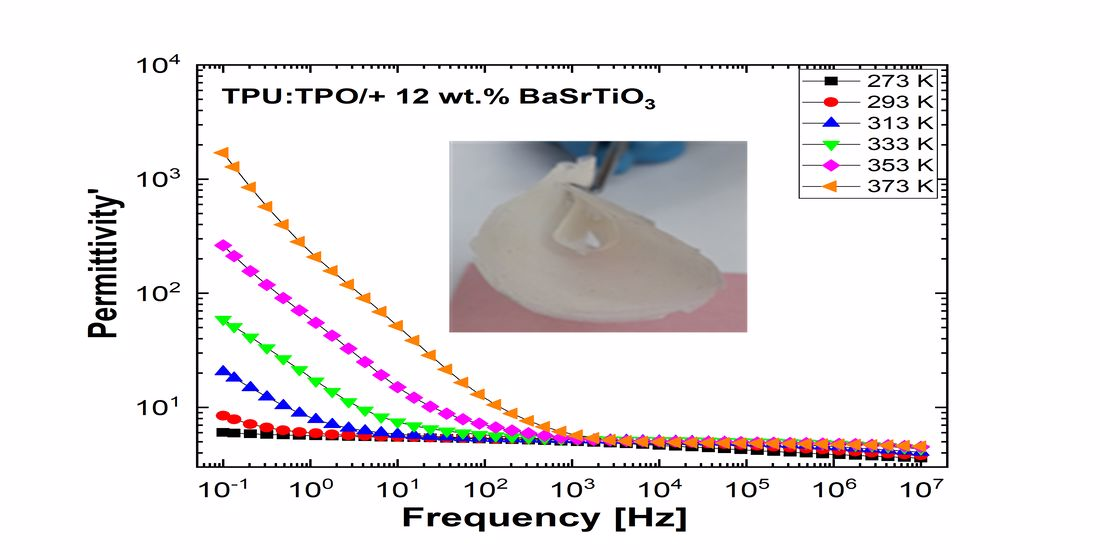
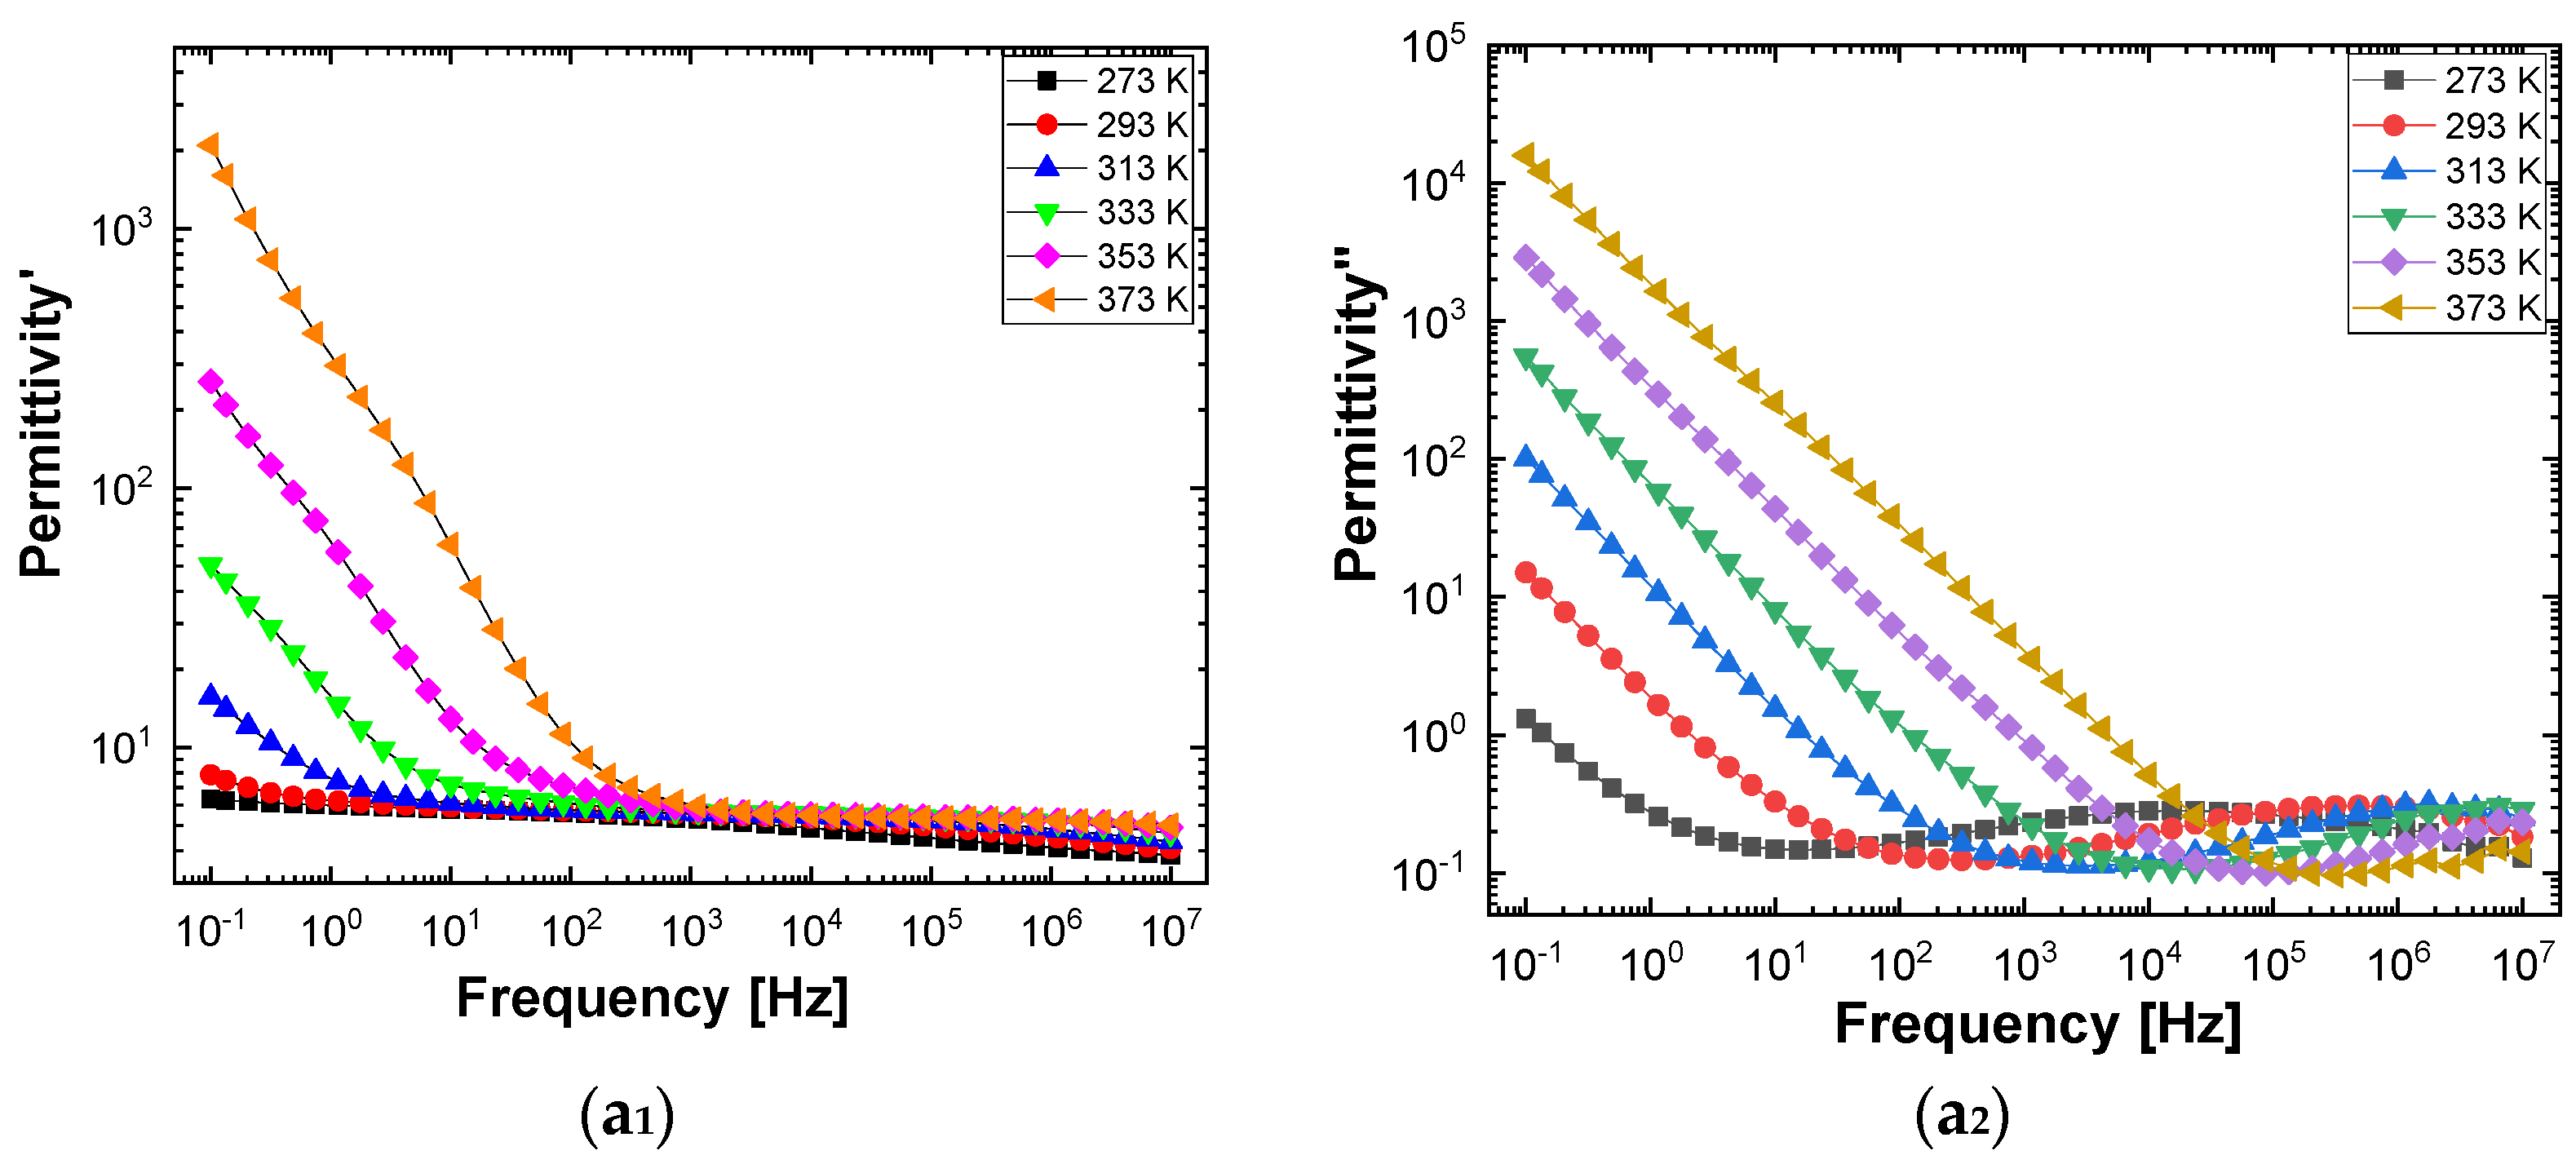
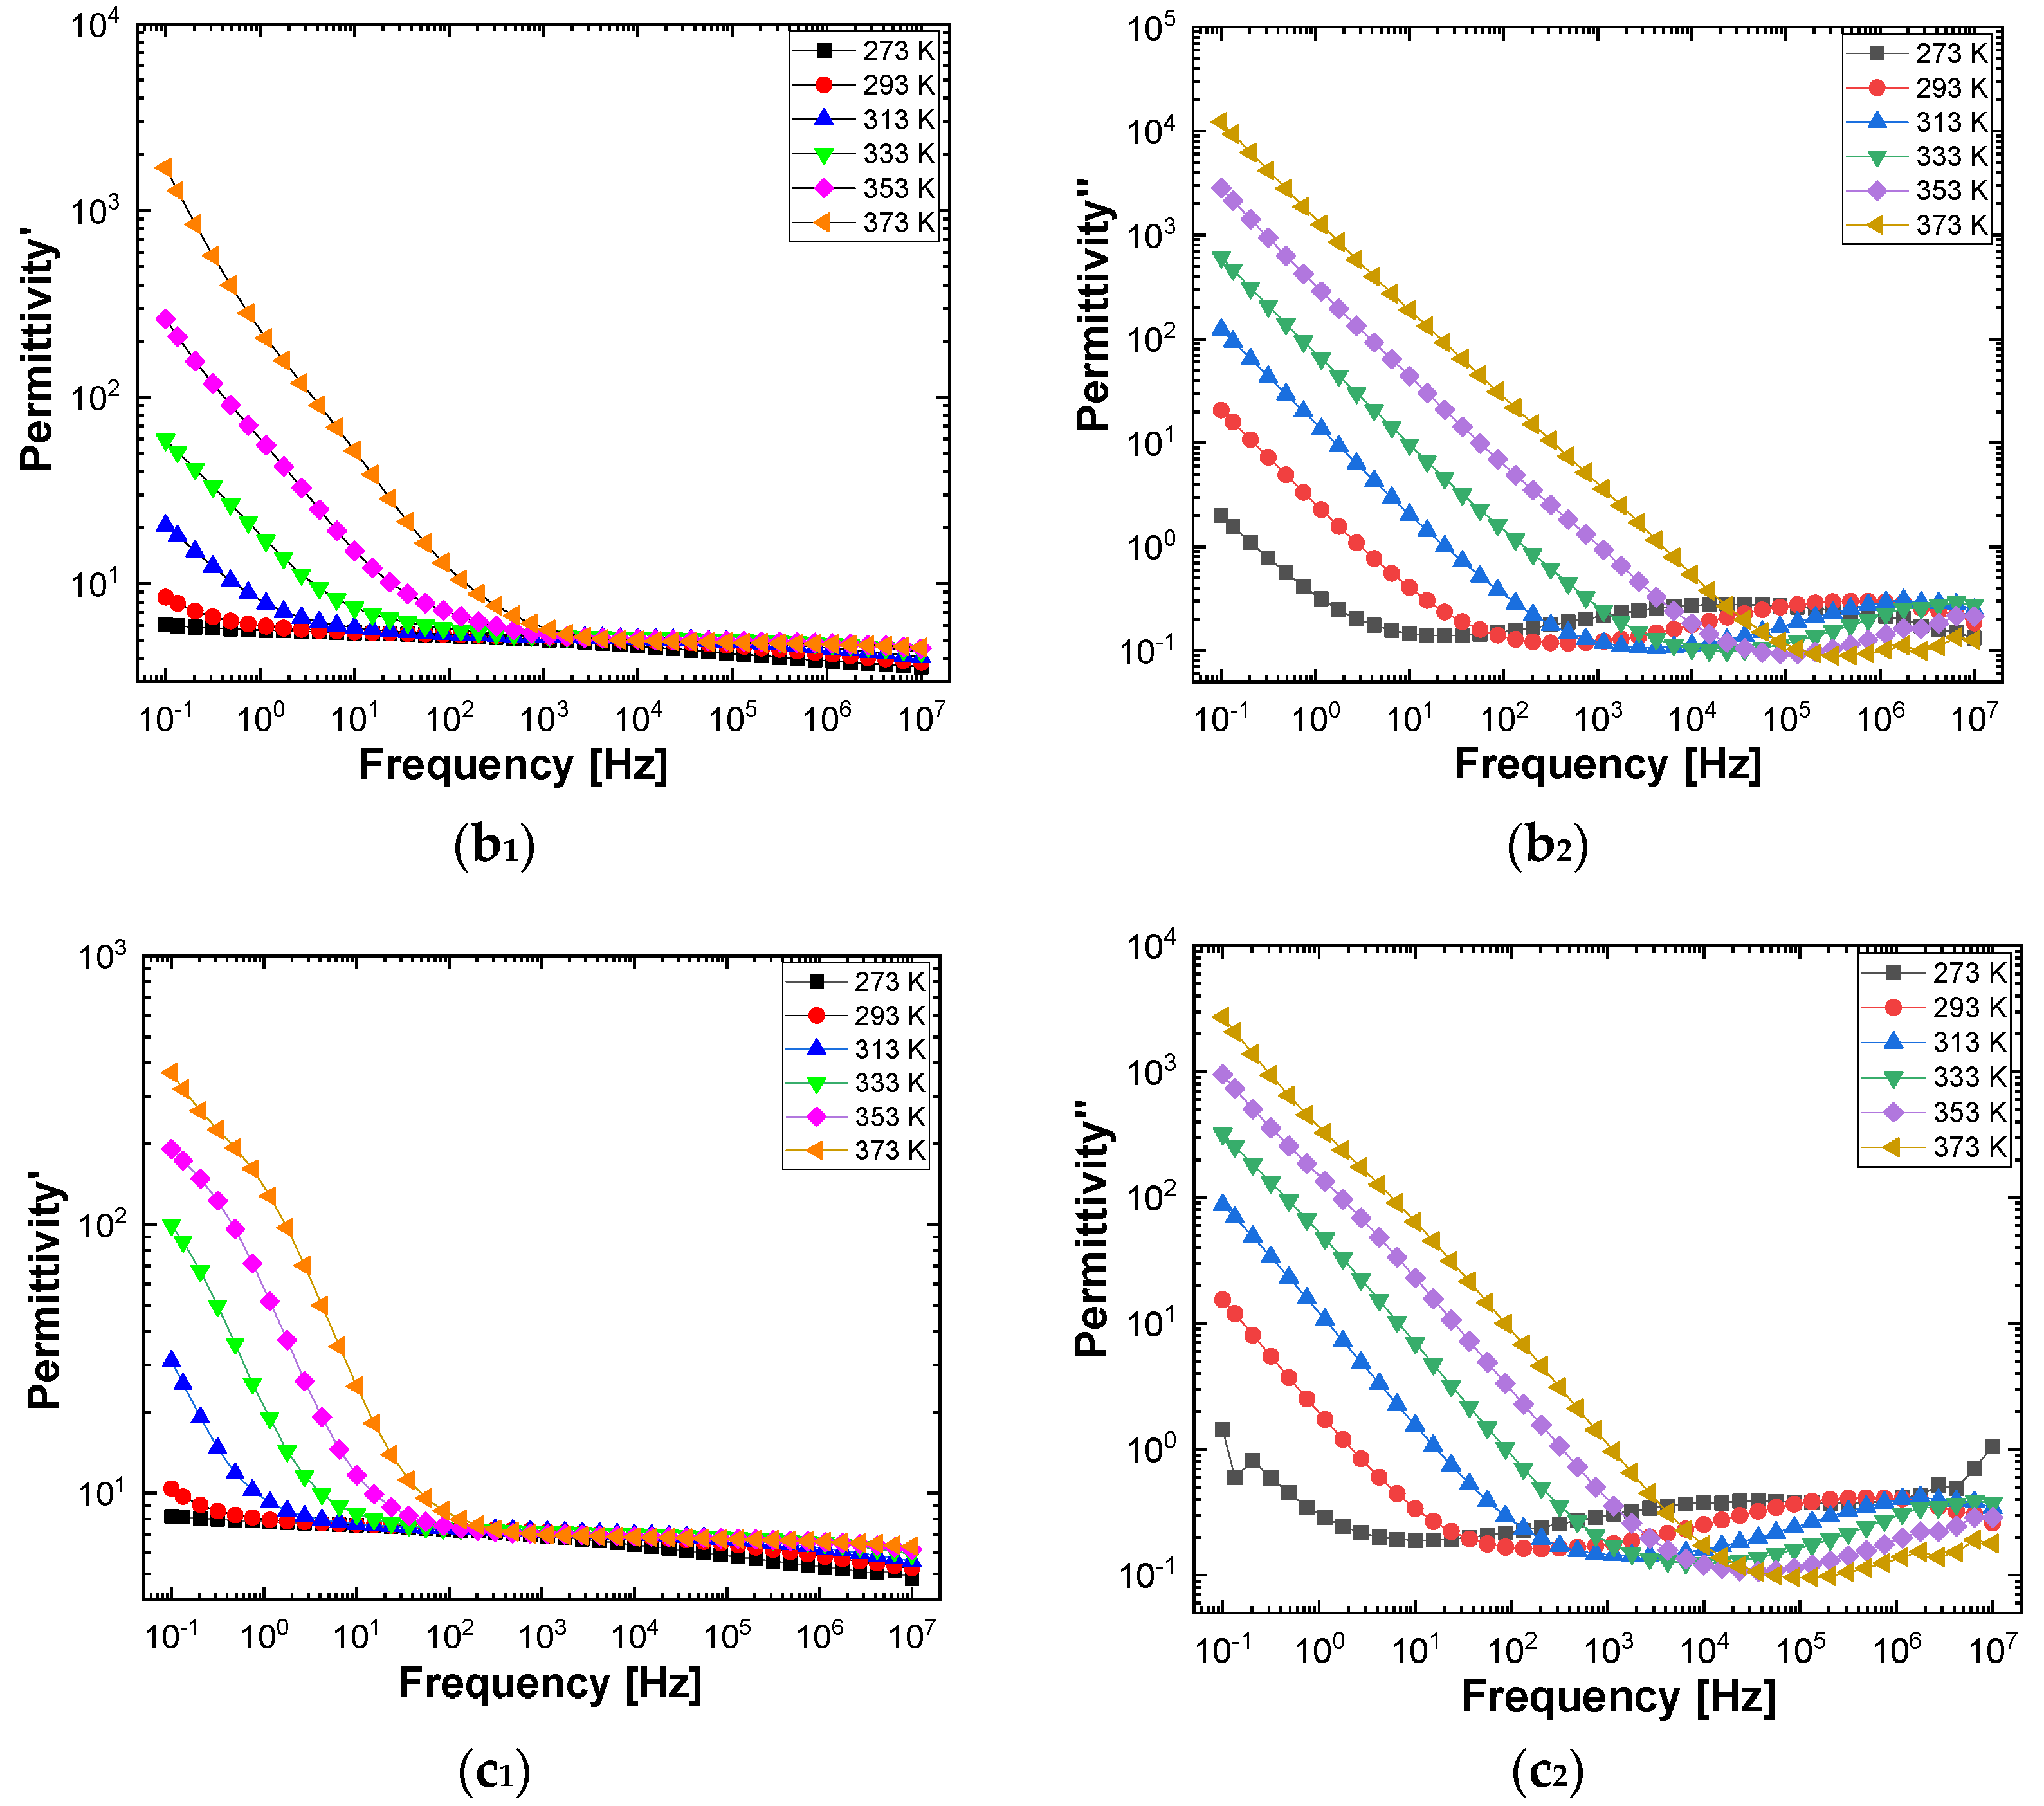
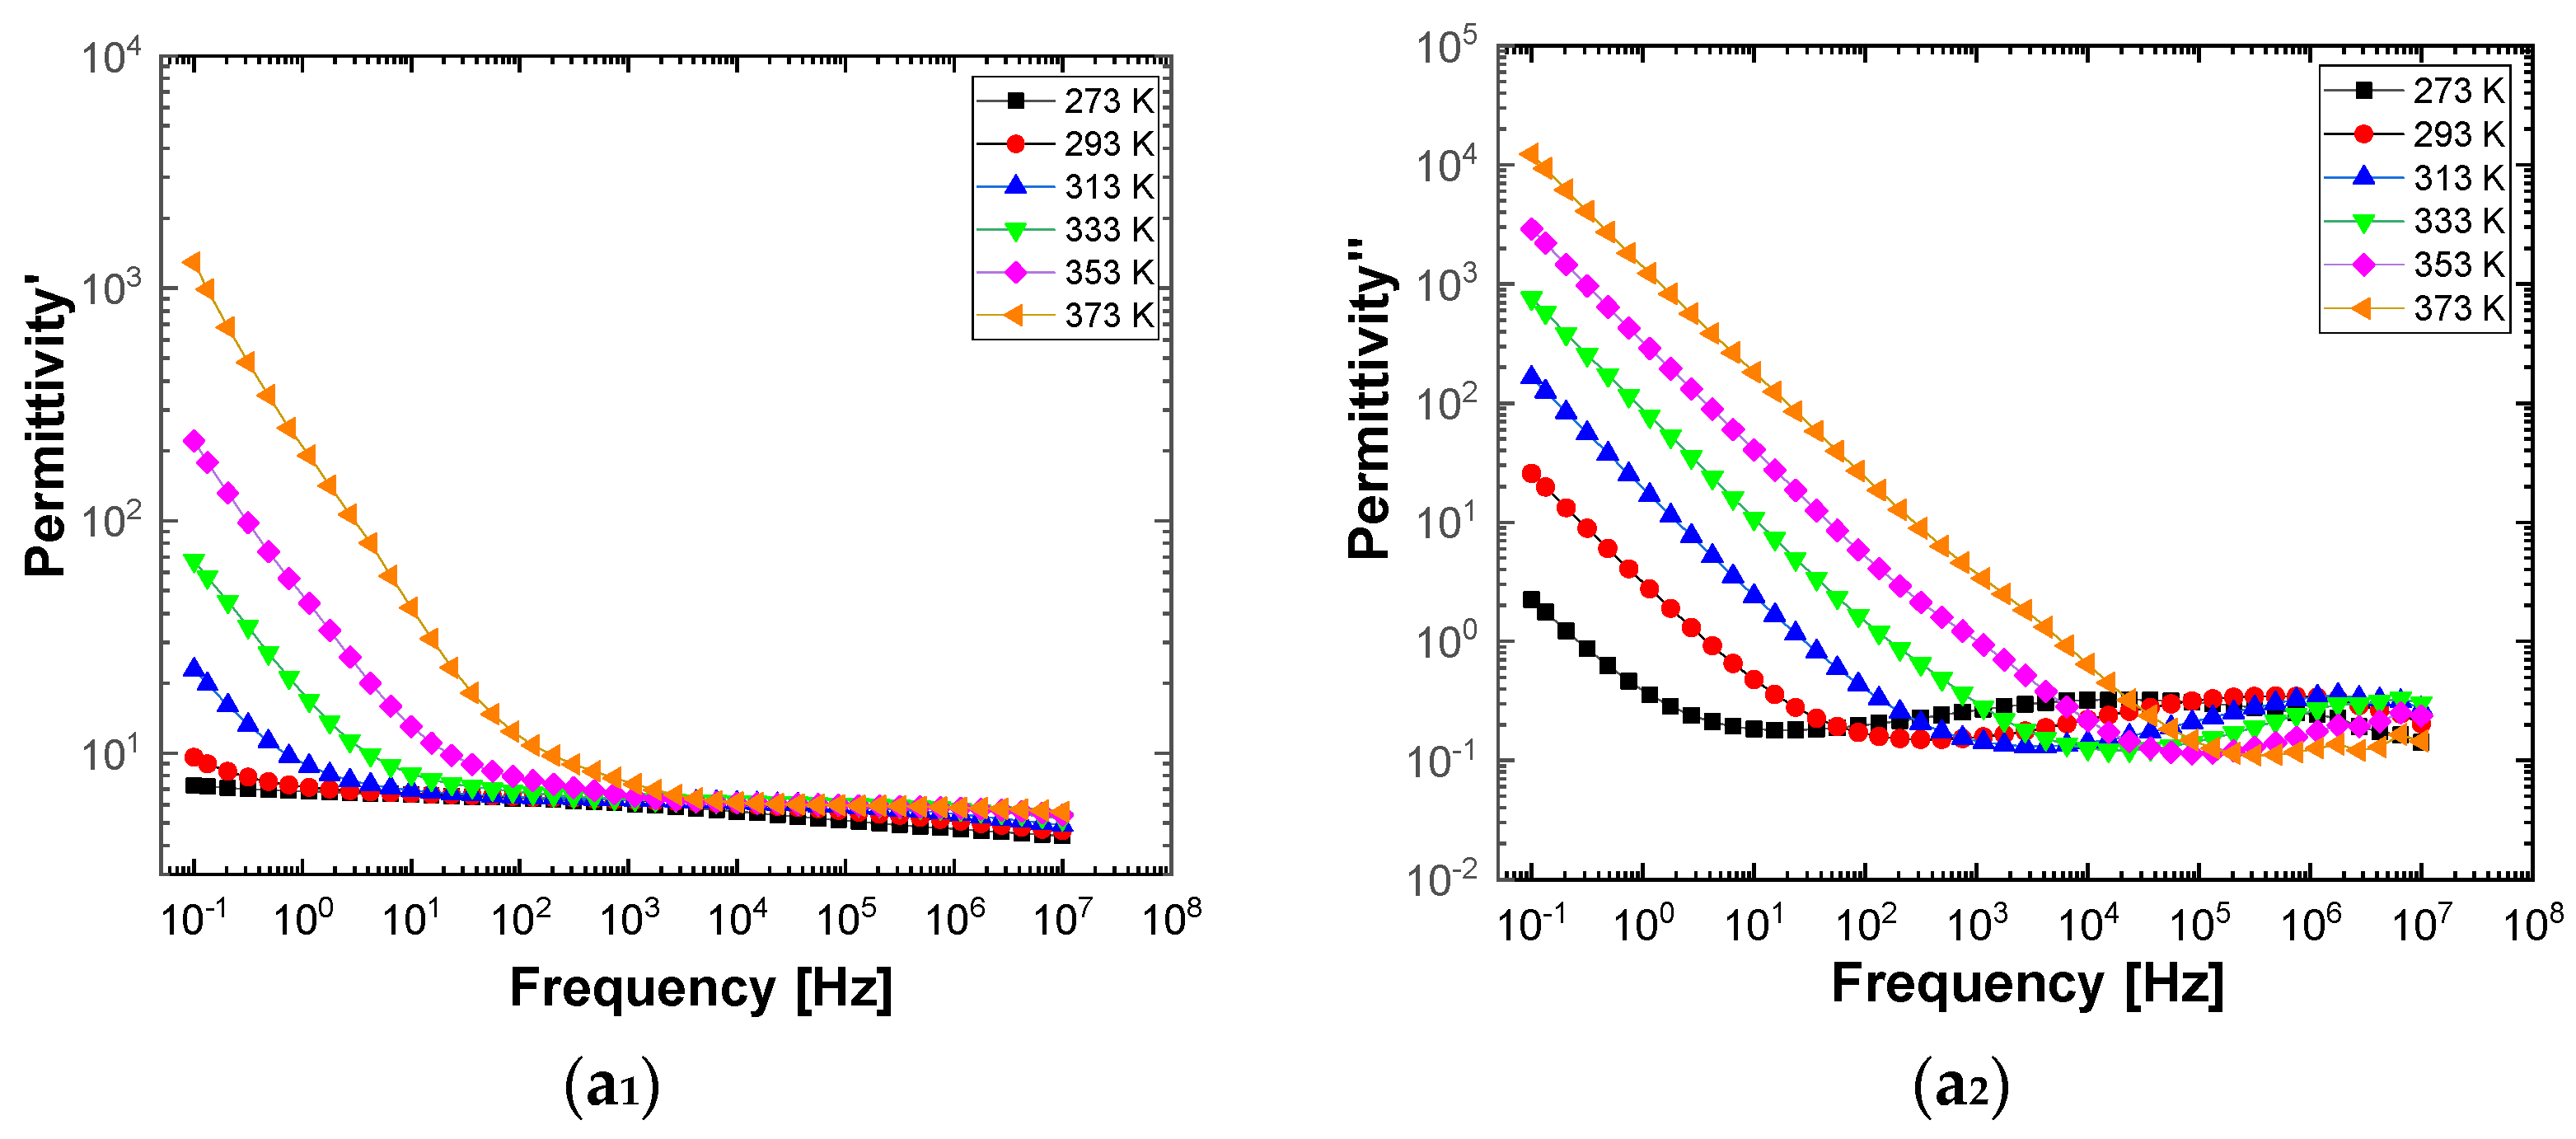
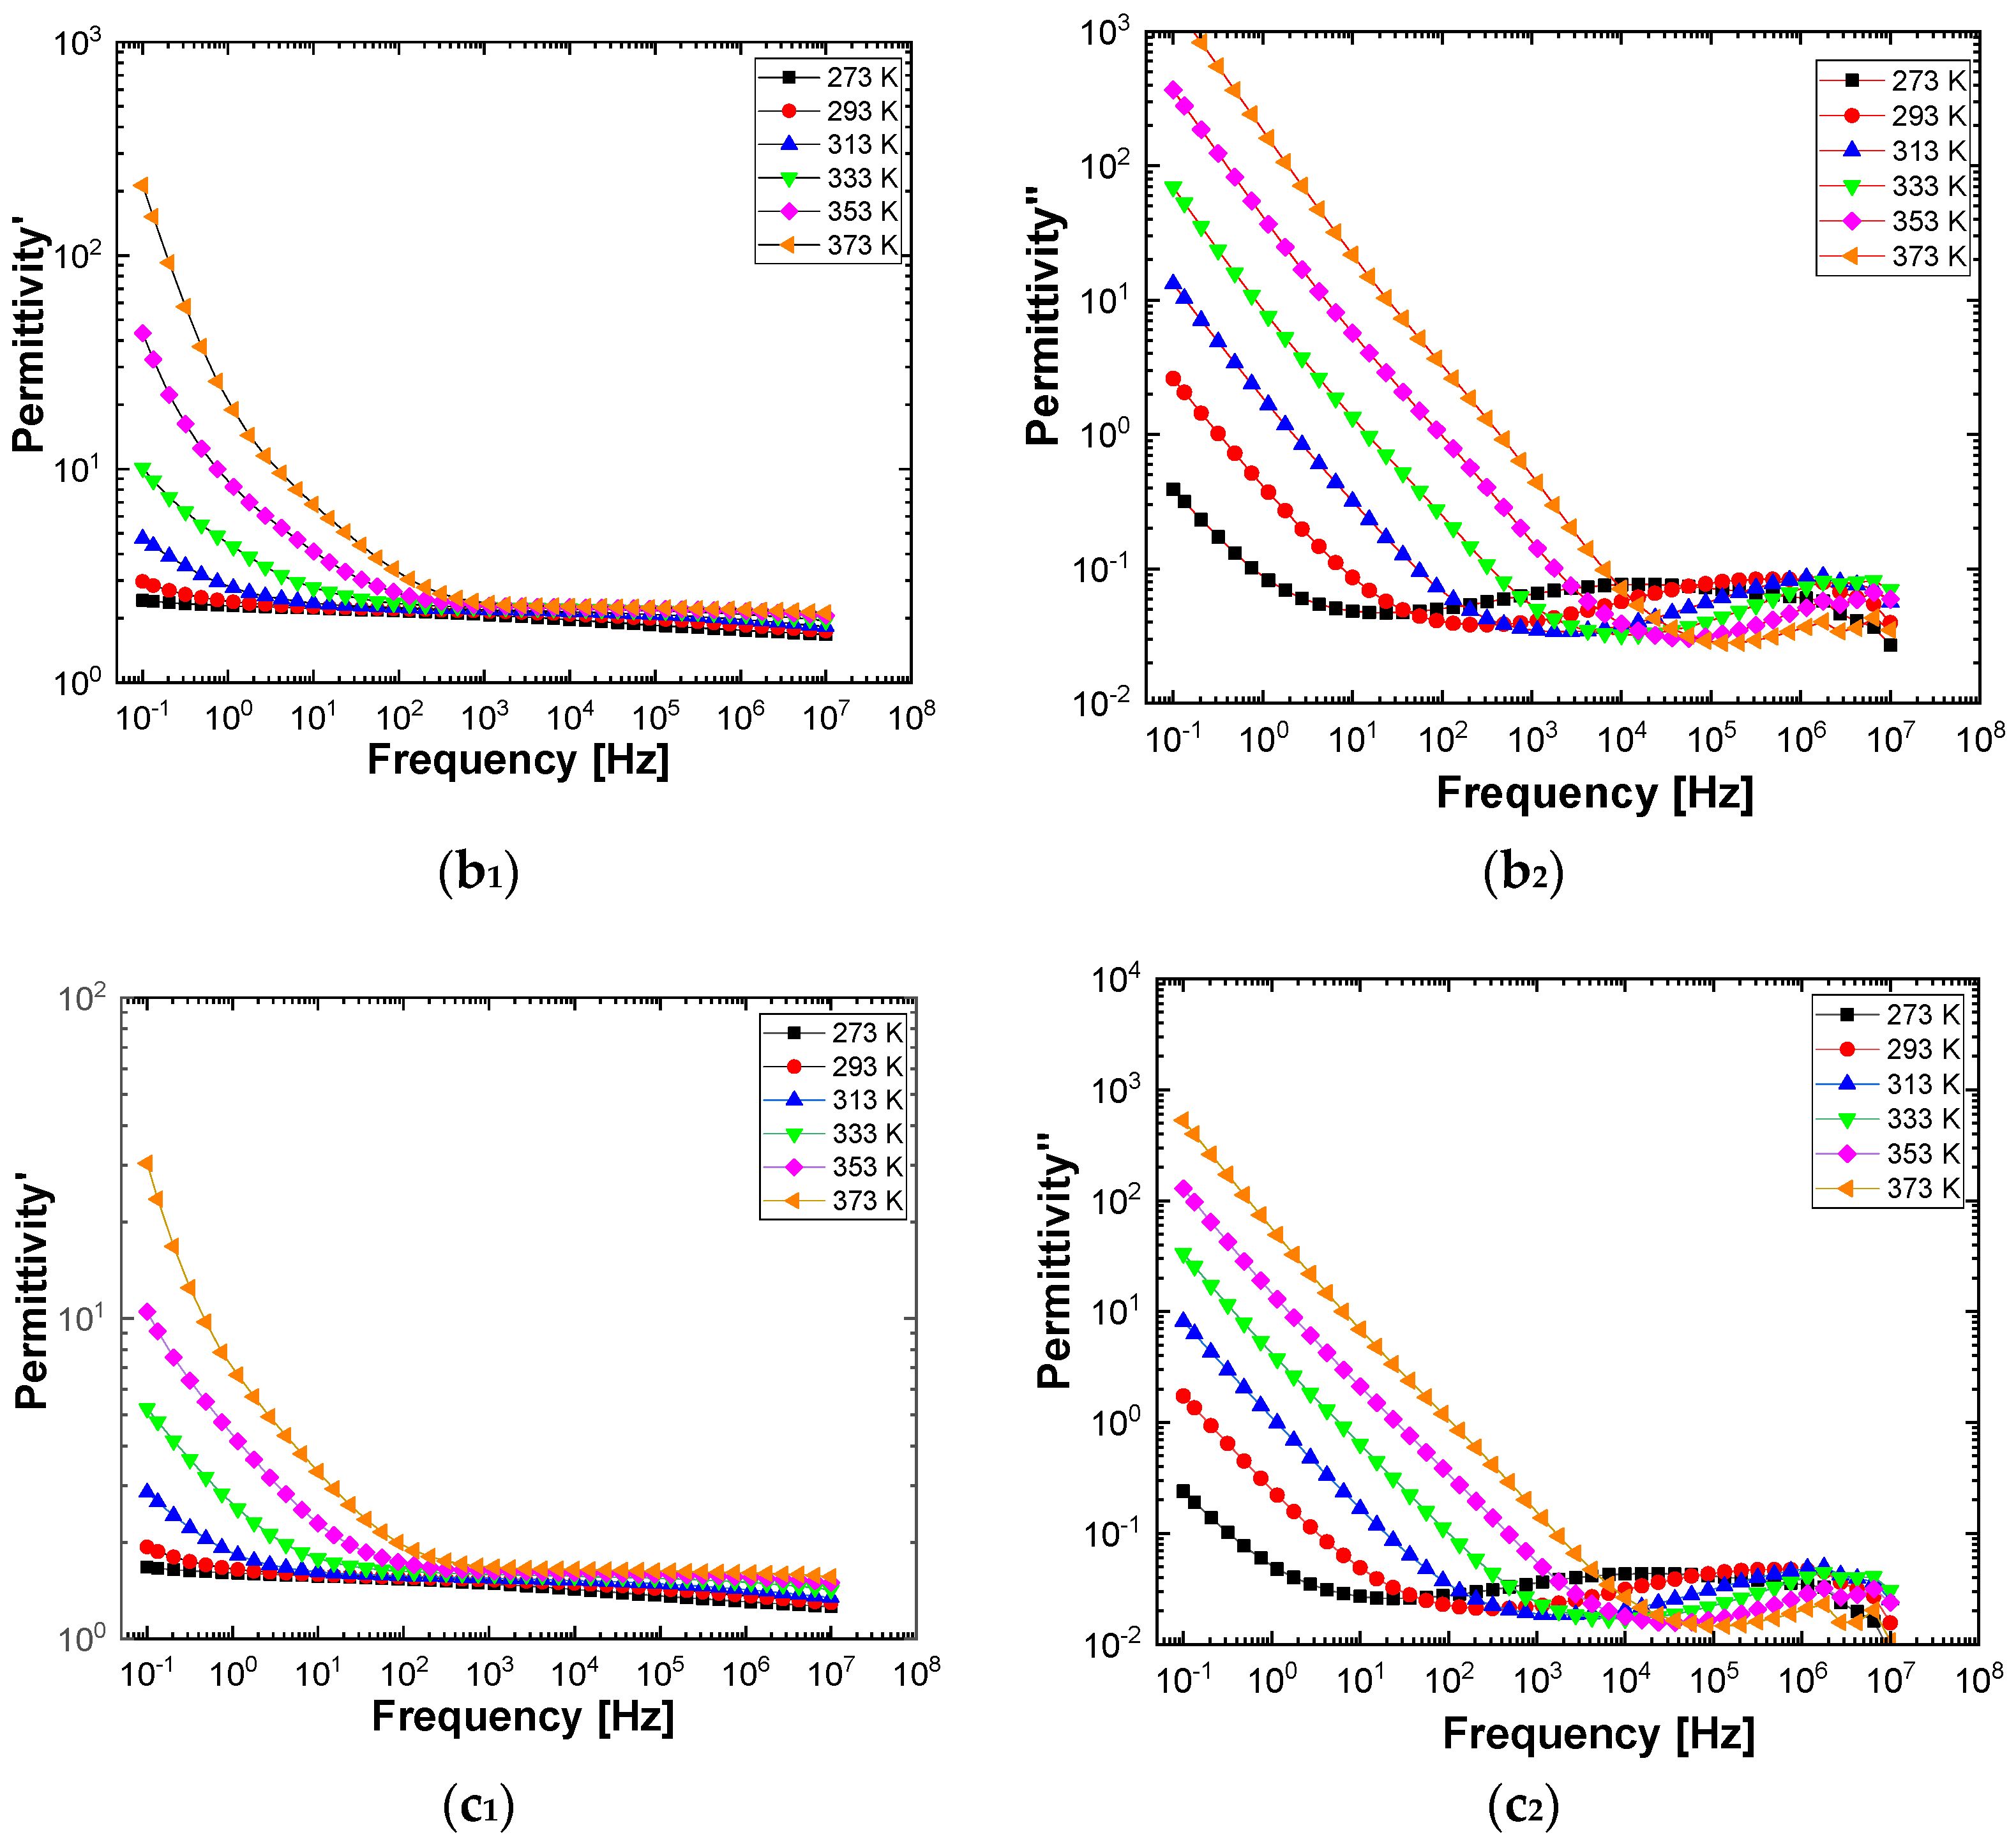
Figure 10 and
Figure 11 show separately the spectra of dielectric constant and dielectric losses for the A, B, C, D, E, and F samples. From the entire range, six temperature values were uniform distributed as such: T = 273 °K, T = 293 °K, T = 323 °K, T = 333 °K, T = 353 °K, T = 373 °K. For the six samples, it is found that the spectra of dielectric constant, ε’(ω), and of the dielectric losses, ε’’(ω), shows common features. In the low-frequency region, a decreasing branch is observed, with increasing frequency, for both components of permittivity; the variation of the two quantities is of several orders of magnitude. A significant increase of the permittivity components at the mentioned frequency can be attributed to an electrical conduction mechanism through charge carriers, electrons, or ions. In the same spectra, in addition to electrical conduction, there is also a dielectric relaxation mechanism that manifests itself at higher frequencies, over 1 kHz.
It is best observed in the spectra of dielectric losses, in the form of a “hill” that has an ascending side, a maximum point, and a descending side. According to
Figure 10 and
Figure 11, one observes that the maximum point moves to higher frequencies as the temperature increases.
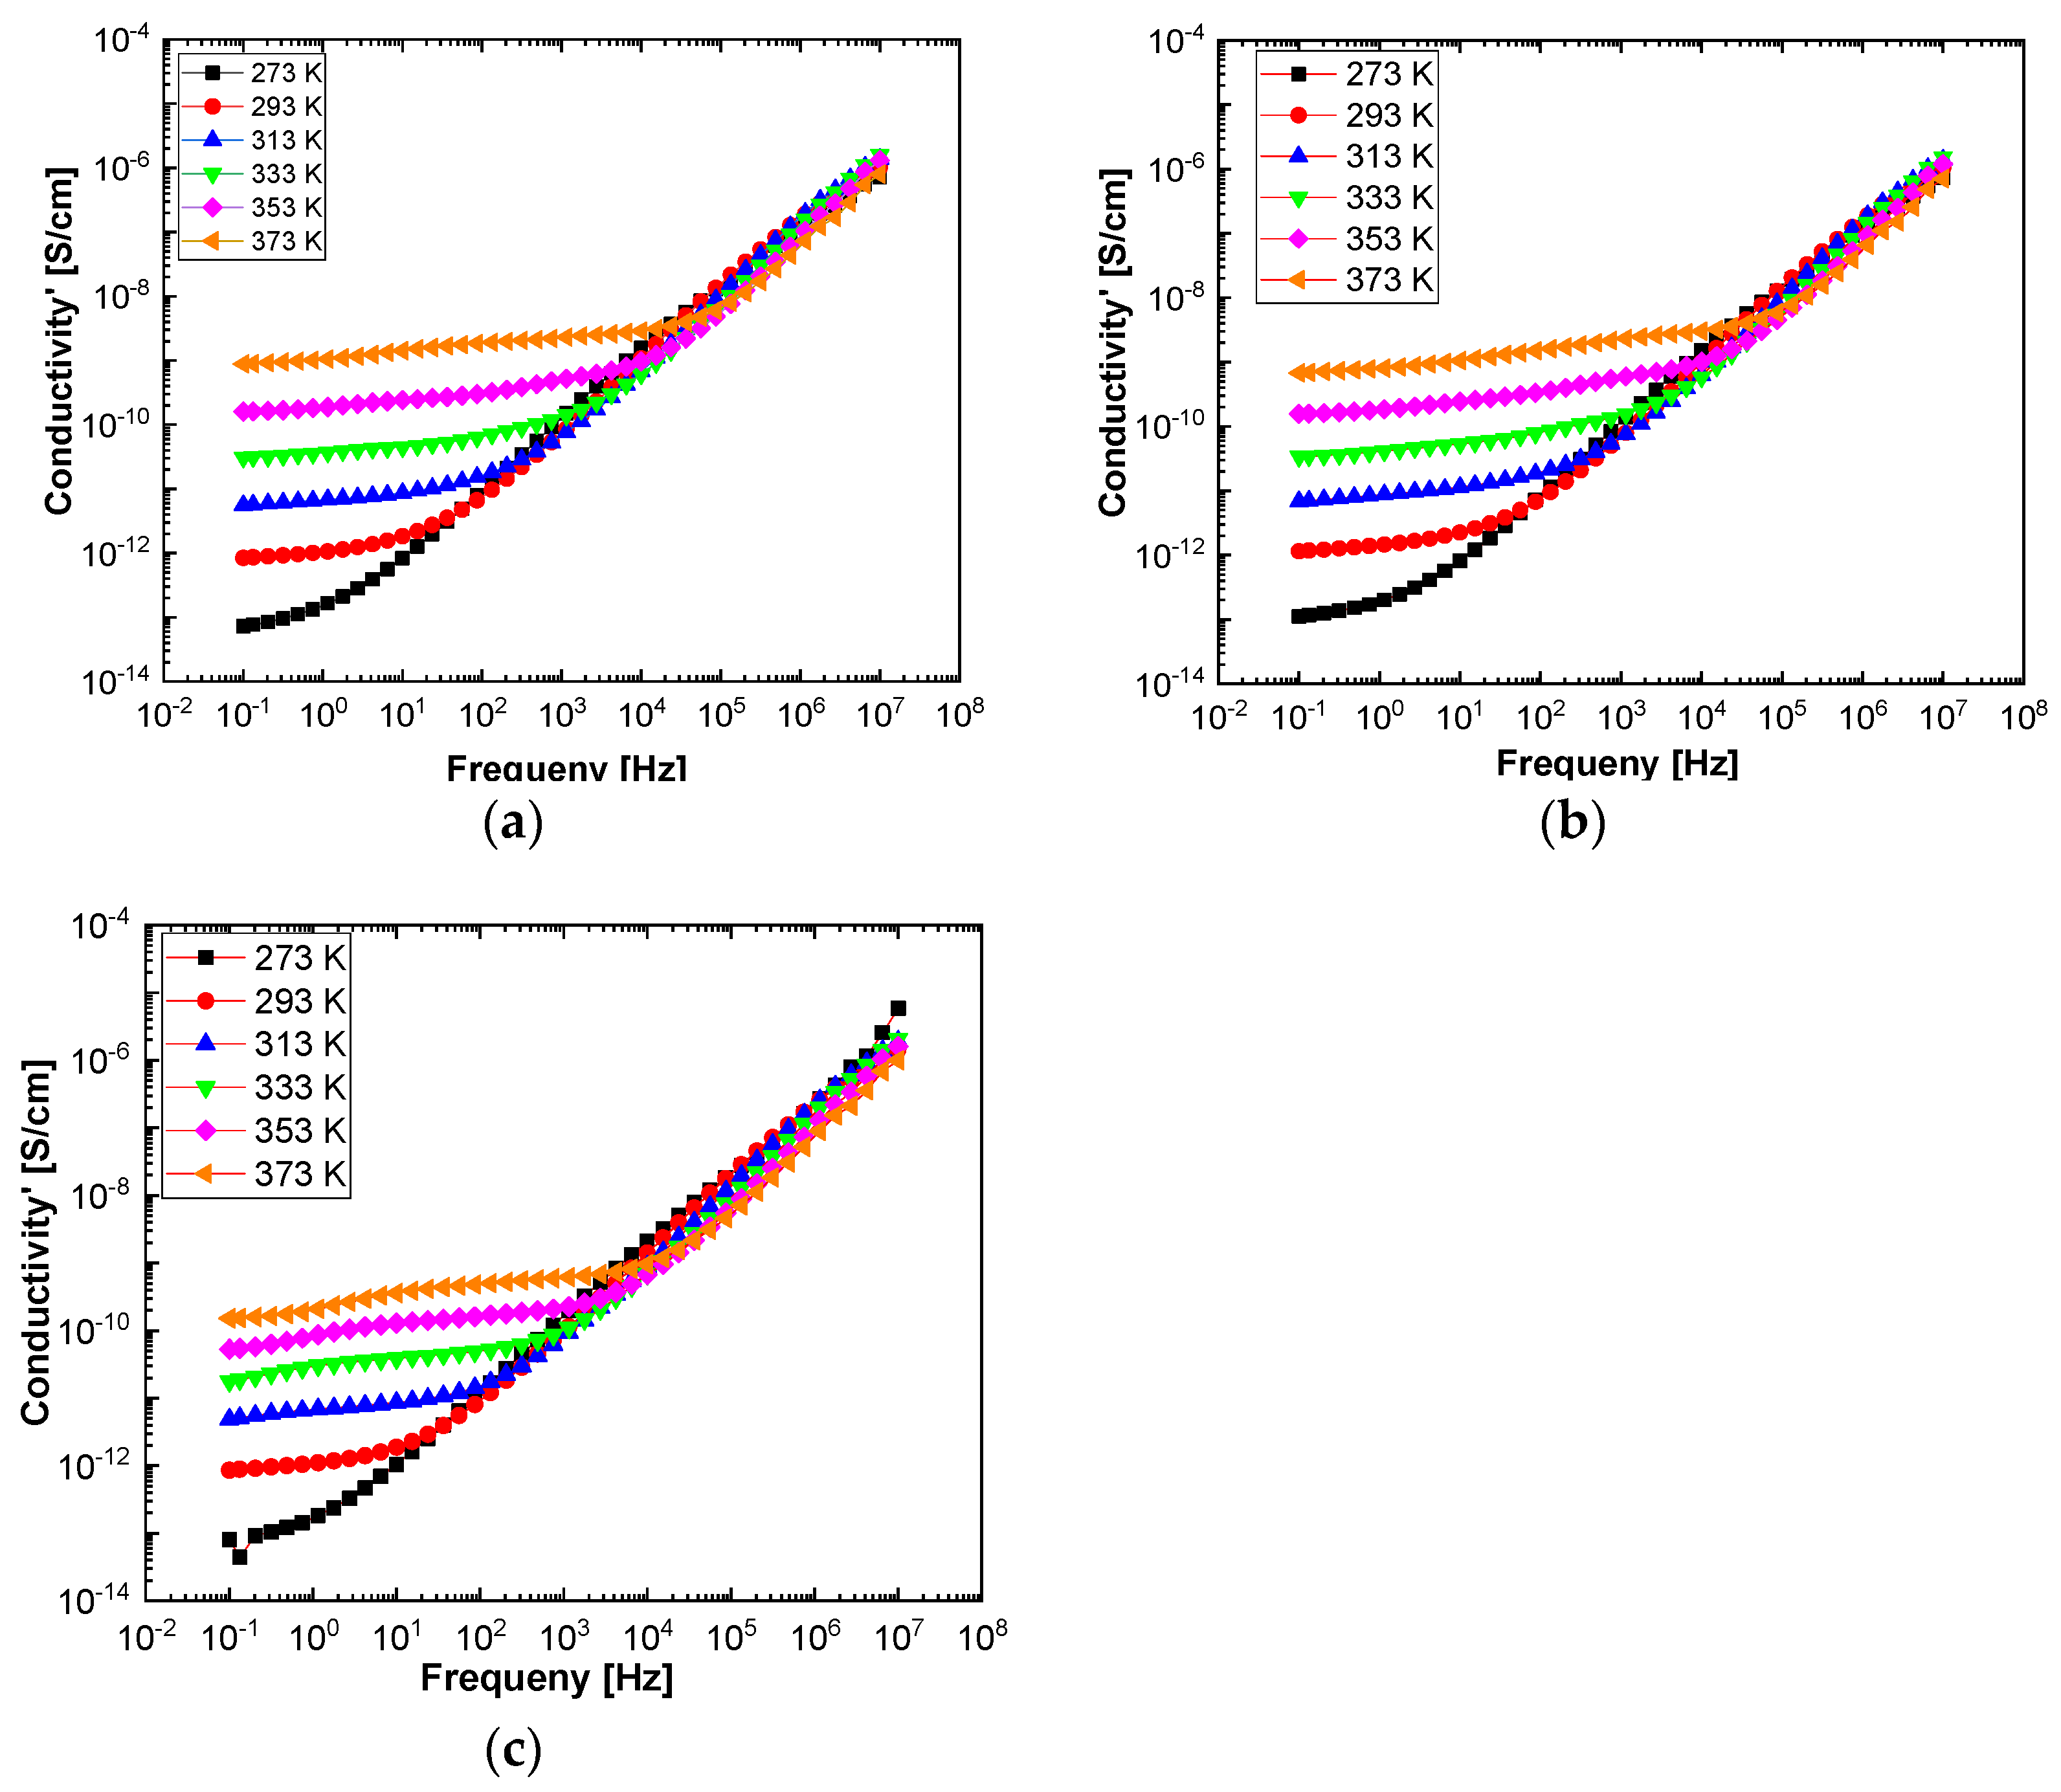
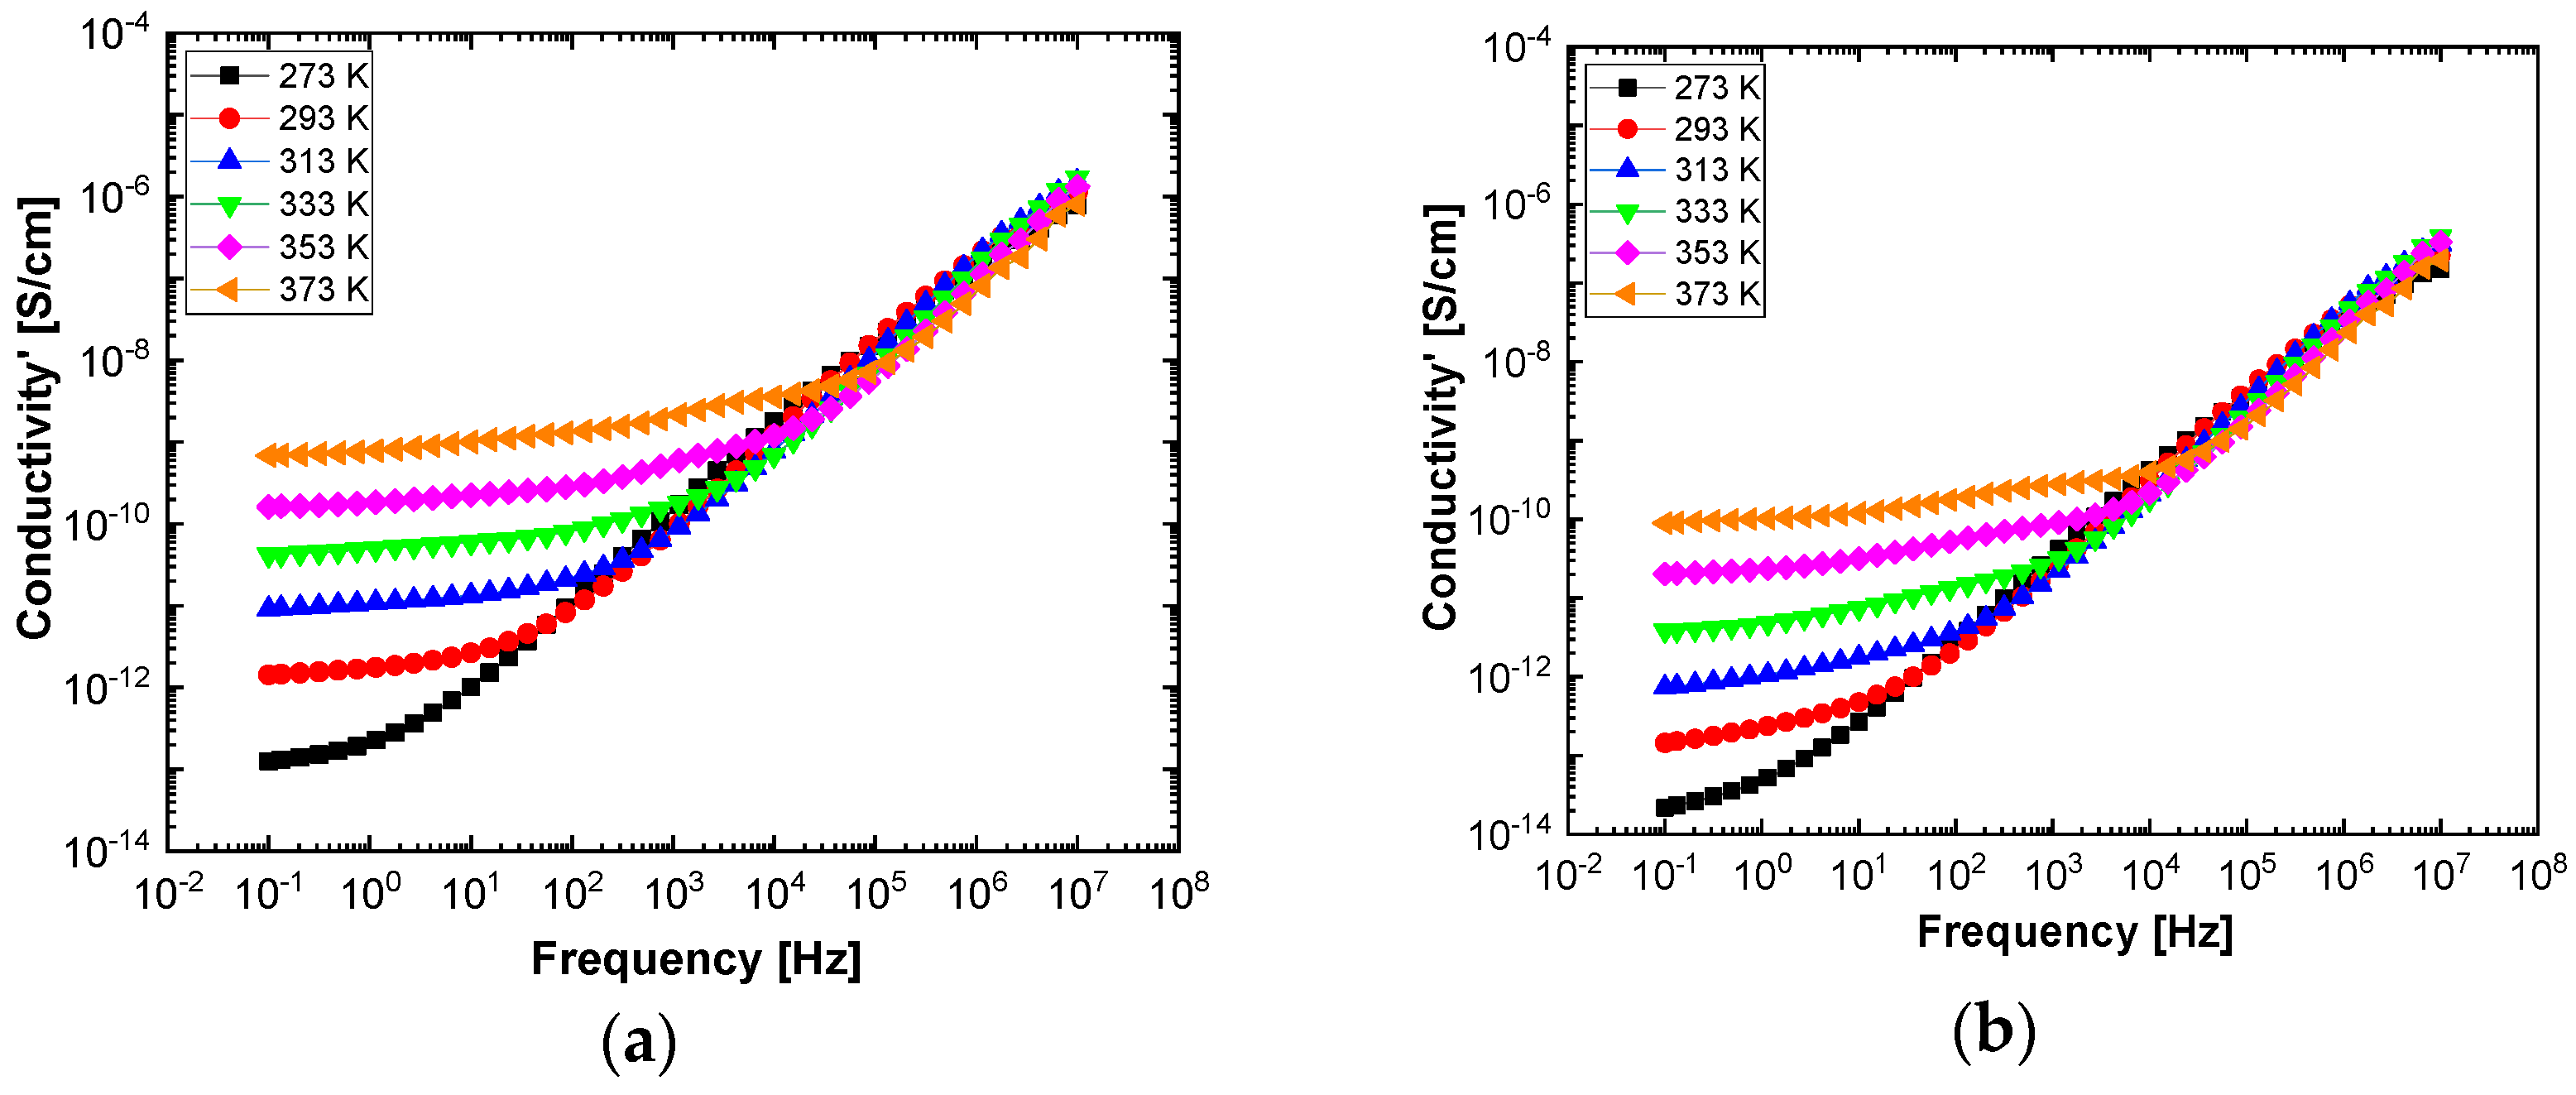
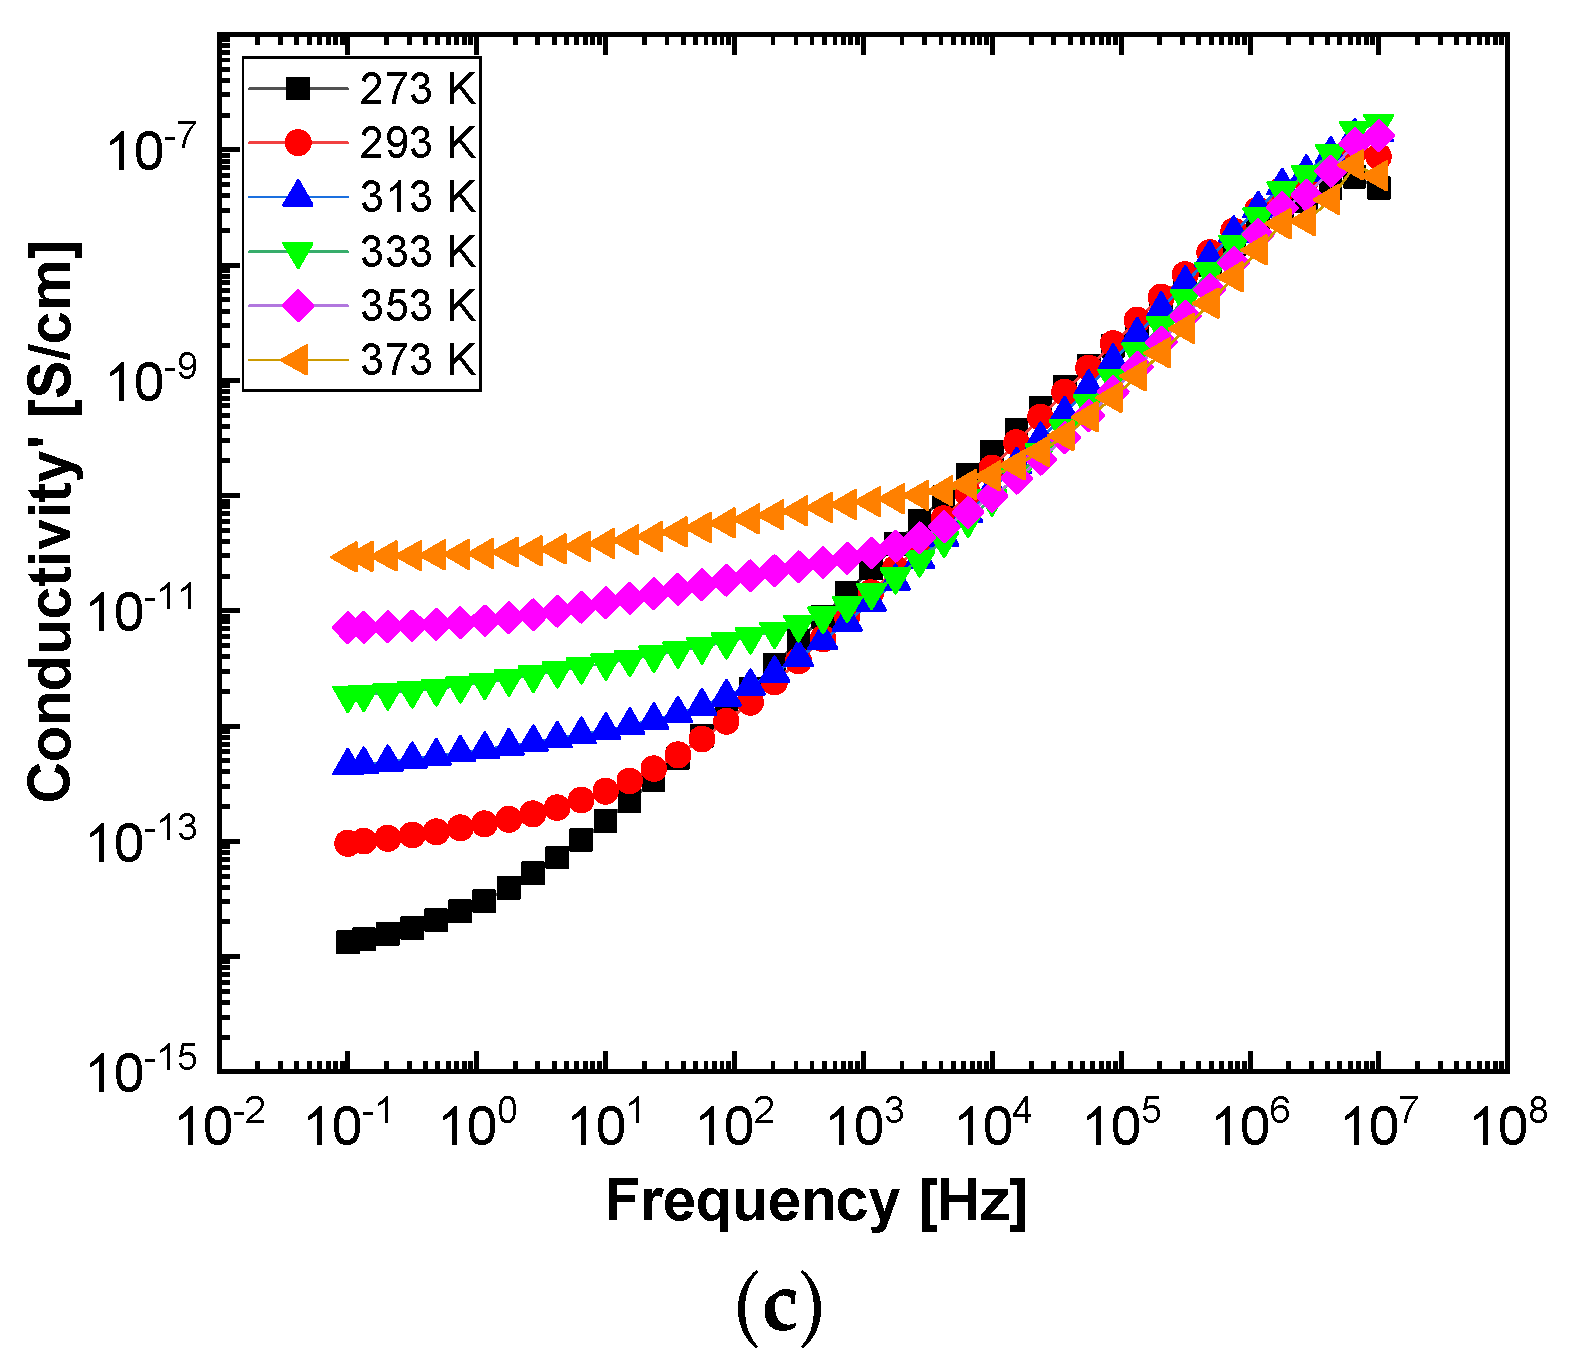
In order to highlight properties related to electrical conductibility, we examine the shape of the electrical conductivity, σ’, as seen in
Figure 12 and
Figure 13. The same temperature values were chosen as in the case of permittivity. Regardless of the CNs type, i.e., BaSrTiO
3 or SrTiO
3, for all samples, i.e., A, B, C, D, E, and F, the conductivity spectra at different temperatures show an ascending branch at higher frequencies, over 100–1000 Hz, and a plateau region, where the conductivity has a small variation at lower frequencies, below 10–100 Hz. As the temperature increases, the plateau moves to the higher values of conductivity and expands more to higher frequencies. This is due to the electrical conductivity through free charge carriers and sustains the results shown in
Figure 12 and
Figure 13. Consequently, at low frequencies, the electrical conductivity has a constant value, while at high frequencies, it depends on the frequency, varying approximately as a power of it. It should be noted that similar spectra of electrical conductivity depending on temperature and frequency are found in a wide variety of homogeneous or heterogeneous samples in solid or liquid state (e.g., doped crystals that have ionic conduction, ionic glasses, polymers, amorphous semiconductors, solid state electrolytes, and so on). For the analysis of these spectra of macaroscopic conductivity, Joncher proposes the overlapping of two different contributions: a direct current (DC) conductivity, which is temperature dependent but is independent of frequency, and an alternating current component, which is frequency dependent but weakly temperature dependent. Thus, the real part of the electrical conductivity is written as the sum
, where the alternating current component is according to the law
, 0 < s < 1, which is called the “universal dielectric response” [
27,
28].
By processing spectra with certain model functions, which adequately describe the dielectric relaxation processes, we can obtain information about the different mechanisms of molecular dynamics. In our case, as permittivity and conductivity spectra are presented, the used fit function has the following mathematical expression [
29,
30,
31,
32]:
On the right side of the equation, the first term is given by the contribution of the electrical conductivity to the behavior of the samples, and in the right parenthesis is the Hvriliak–Negami fitting function. The fitting parameters have the following means: σ
0 conductivity; N is a sub-unit exponent; ∆ε = ε
0 − ε
∞ is called dielectric strength, where
The characteristic time is inversely proportional to the frequency (angular velocity) at which the dielectric losses have a maximum point (ε″(ωmax) = ε″max); the sub-unit exponents, α, β called shape parameters, influence the extension (widening) and asymmetry of the relaxation curve around the dielectric losses maximum point; 0 < α ≤ 1, 0 < β ≤ 1. The parameter β is kept fixed during the fitting processes, with the value β = 1. The other parameters are free to be modified by the fitting program for optimization by the least-squares method.
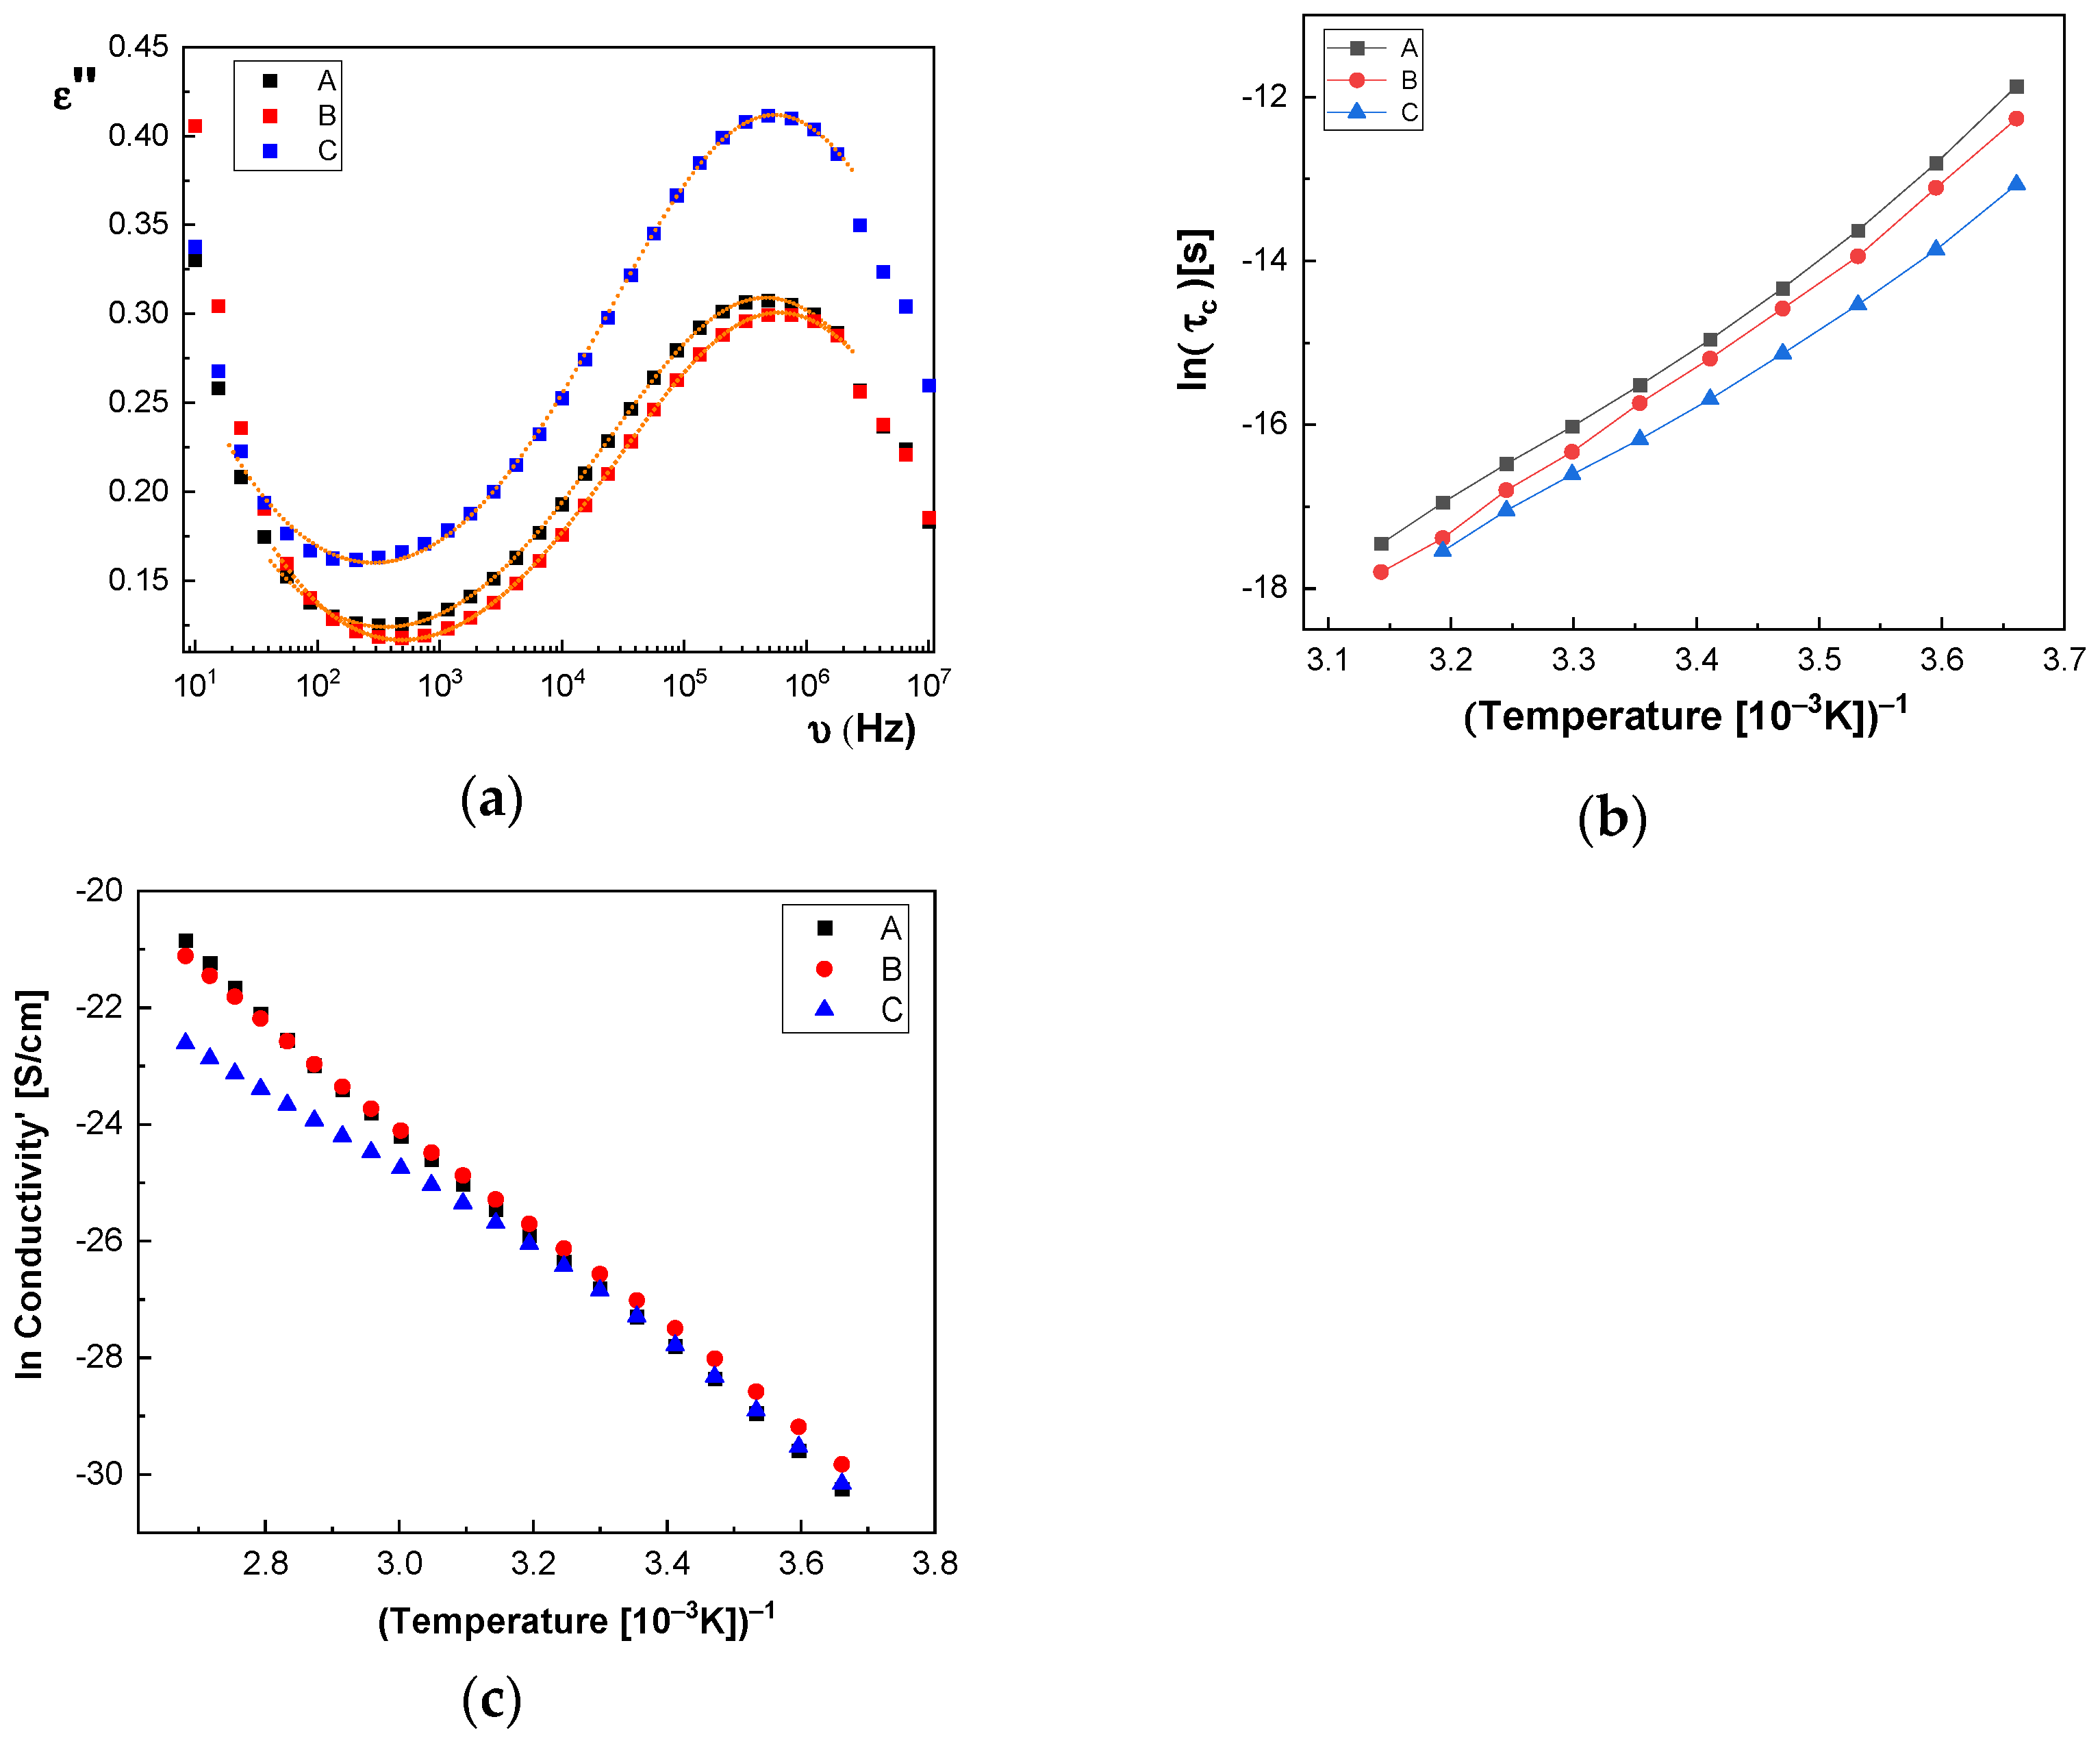
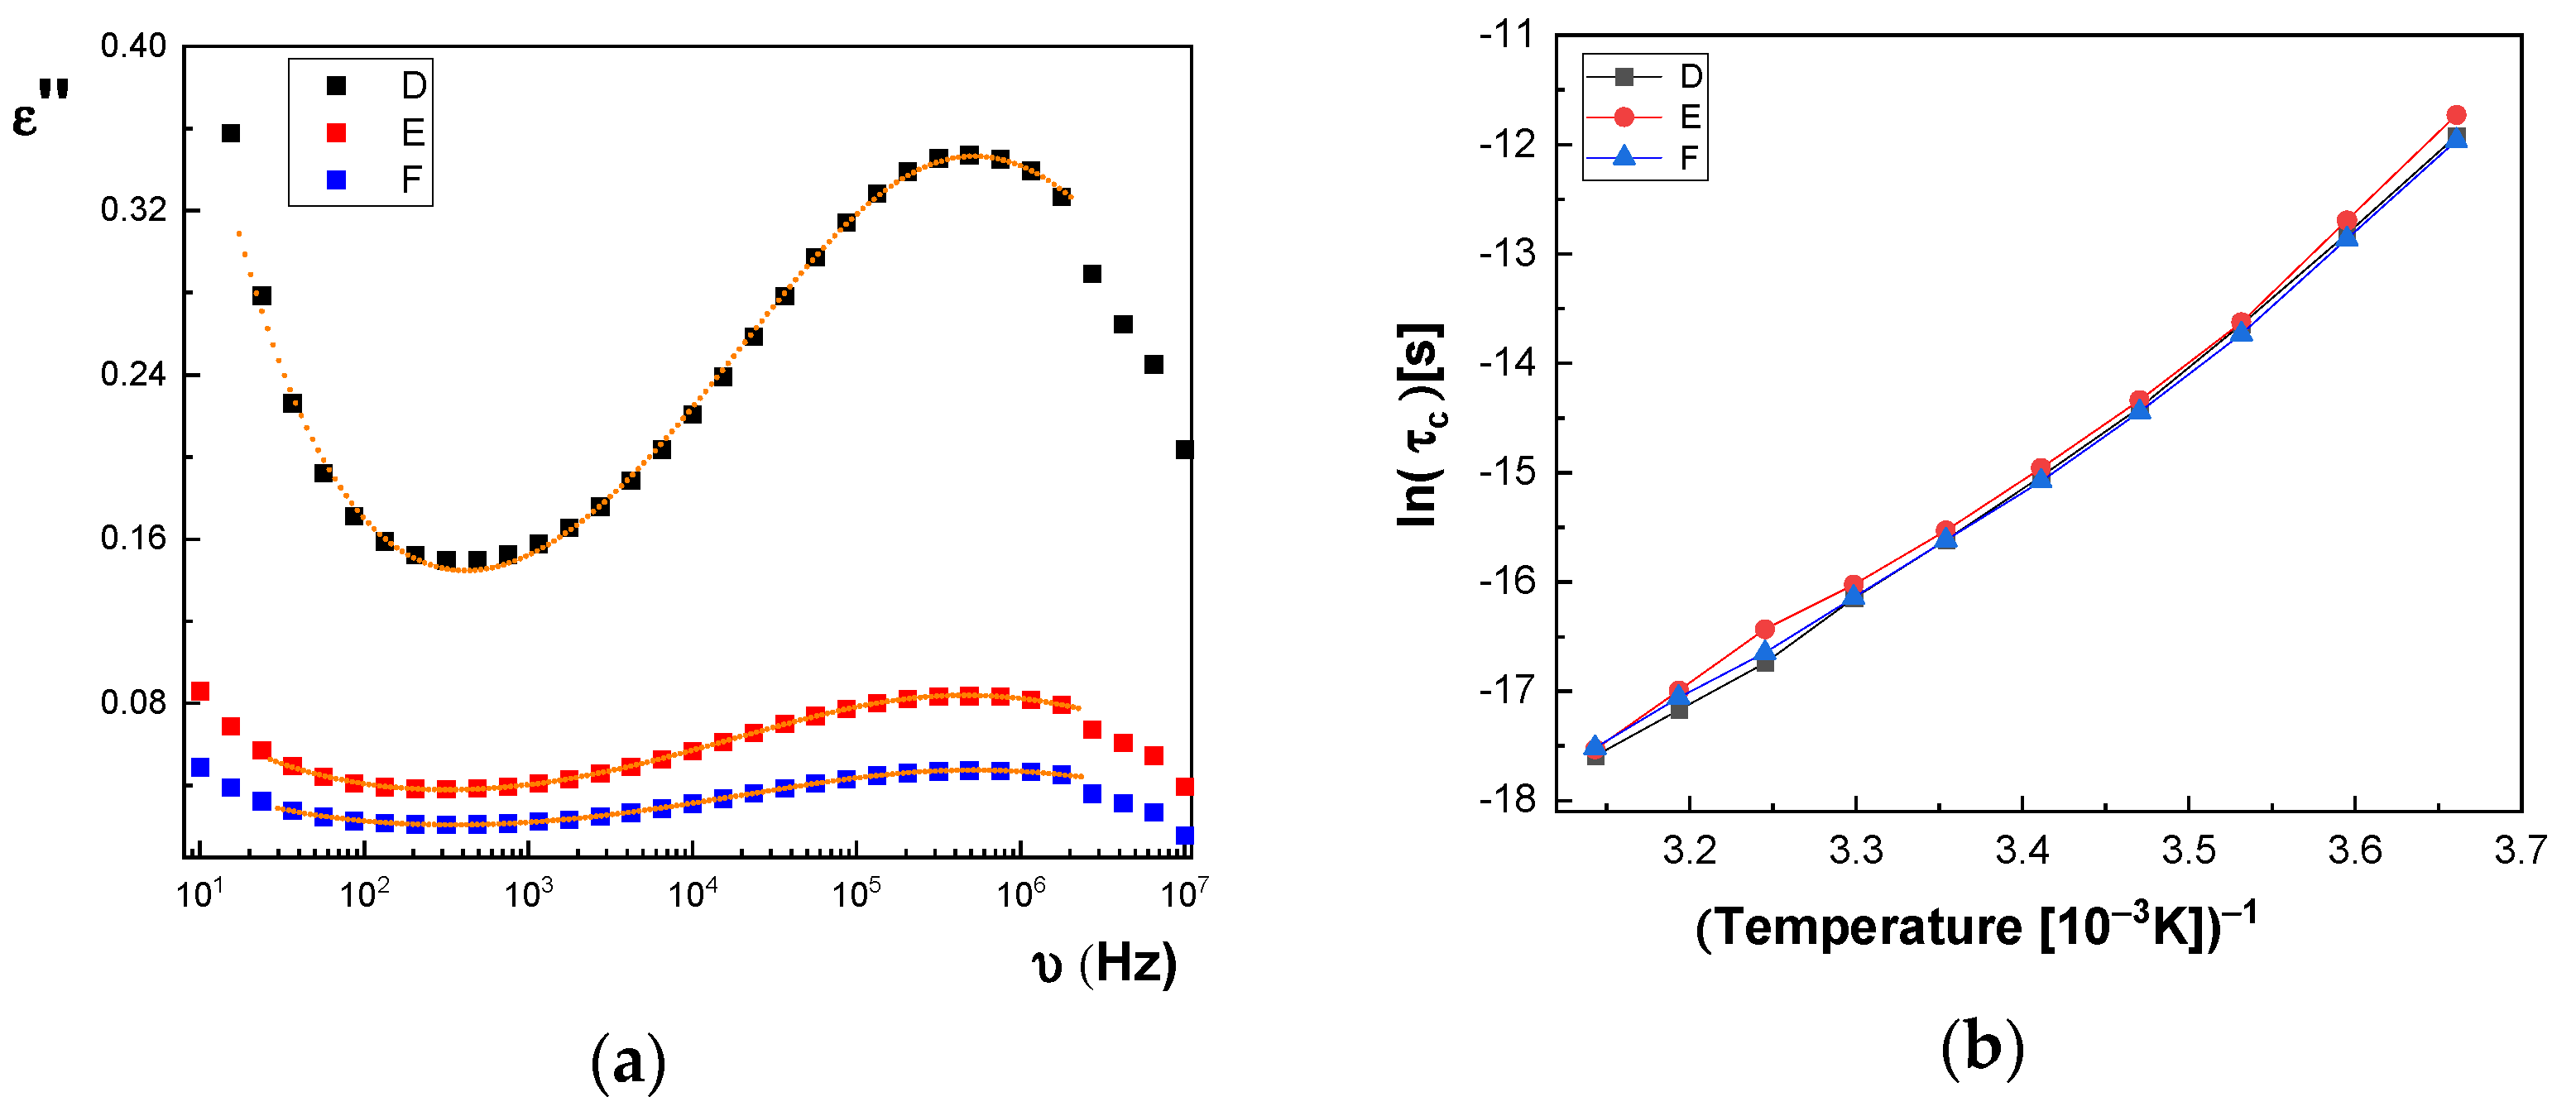
In
Figure 14a and
Figure 15a, we represent on the same graph the spectra of dielectric losses for the A, B, C, D, E, and F samples over which are drawn the corresponding fitting functions. The temperature value is T = 293 °K. In this way, we can compare the relative position of the maximum points, as in
Figure 14a and
Figure 15a, but also the good overlap between the experimental data and fitting functions. The values obtained for characteristic time corresponding to maximum point to the left side of the graph: (a) the A sample, τ
c = 3.190 × 10
−7 s; (b) the B sample, τ
c = 2.527 × 10
−7 s; (c) the C sample, τ
c = 2.68 × 10
−7 s; (d) the D sample, τ
c = 2.953 × 10
−7 s; (e) the E sample, τ
c = 3.193 × 10
−7 s; and (f) the F sample, τ
c = 2.831 × 10
−7 s. For all samples, the shape parameter (α) has values between 0.284 and 0.48. It means that the spectrum dielectric losses shape around the maximum point is flattened (extended). The dielectric relaxation process is a non-Debye electrical dipole relaxation, in which the exponent has values different from 1. As a result of the fittings, we notice that the relaxation time depends on the temperature. The Arrhenius diagram contains the graphical representation of characteristic time as a function of inverse of the temperature: τ
c = f(1/T).
In the Arrhenius diagram, the fit function is given by Vogel–Fulcher–Tammann (VFT) empirical law [
33,
34,
35,
36]:
where the material constant,
WA, is associated with the activation energy of dielectric or dipolar relaxation process, k
B is the Boltzmann constant,
TV is the Vogel temperature, τ
∞ is the characteristic time limit value when the temperature tends to very high values,
. The activation constant is equal to the slope of curve for higher temperature values (on left side of
Figure 14b and
Figure 15b), and the Vogel temperature produces a more pronounced variation at lower temperatures, which can be seen on the graph’s right side, (
Figure 14b and
Figure 15b). In a particular case where
TV = 0, the above function obeys the Arrhenius law,
, and the constant
WA is equal to the activation energy. The VHT empirical law is generally used because it adapts much better to the data presented by a large number of different samples. As observed in
Figure 14b, the characteristic time for the dielectric relaxation process has lower and lower values when passing from the A sample to the C sample, while in
Figure 15b, the curves corresponding to the D, E, and F samples are very close. Based on the values of fitting parameters, in
Table 3 and
Table 4, we can make a comparison between the samples, which differ from each other by CNs concentration. First, we note that τ
∞ is very sensitive to the fitting process; for this reason, it can have important fluctuations, and we cannot take it into account to compare the samples. The activation constant,
WA, globally highlights the characteristic time dependence on temperature and, as a result, it is less sensitive to the fitting performed.
According to
Table 3, one observes that there is a tendency for the W
A value to increase with increasing concentration of BaSrTiO
3 nanoparticles in the case of the A, B, and C samples. A different behavior, the slight decrease of the
WA value, is noted in the case of the D, E, and F samples containing the SrTiO
3 nanoparticles (see
Table 4). Moreover, there is a tendency to decrease the Vogel temperature value,
TV, for samples A, B, and C, depending on the concentration, and a small trend to increase the
TV for samples D, E, and F, respectively. The high obtained value of
TV (100 °K–200 °K) is specific to the samples that present “the glass transition”, as is the case of the macromolecular compounds [
37,
38]. Returning to
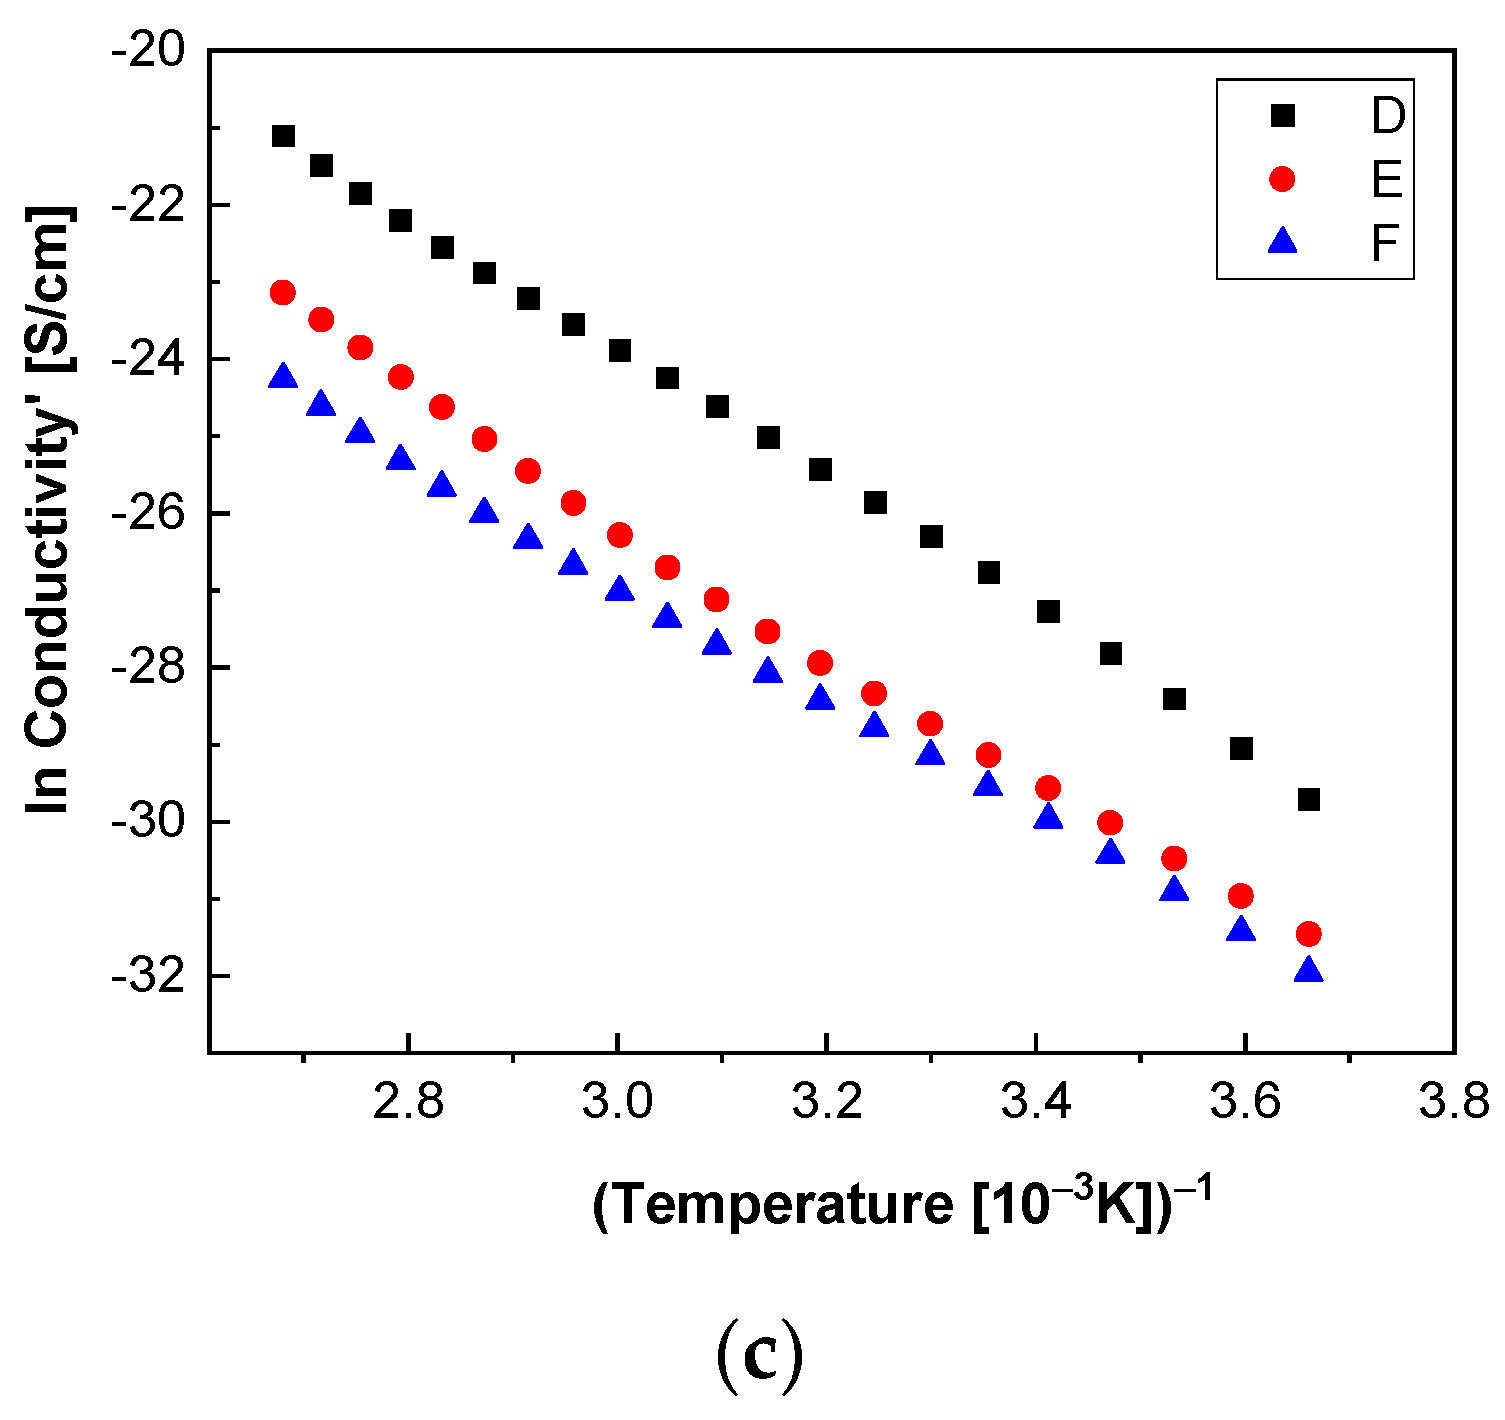
Figure 12 and
Figure 13, the conductivity spectra show that it depends on the temperature. The DC electric conductivity is based on a mechanism that is thermic activated, governed by the Arrhenius law for a large amount of samples. From Arrhenius plot, in which the conductivity is represented as a function of the inverse of the temperature, we can obtain the activation energy of the electrical conduction mechanism, i.e., the necessary energy to generate electrical charge carriers. The conductivity fitting function is defined in accordance with Arrhenius law [
39,
40], as follows:
By fitting the curves with the Arrhenius function, as shown in Equation (3), the activation energy of the electrical conductivity (E
a) has the value for: (i) A sample, 80.277 × 10
−3 eV; (ii) B sample, 74.806 × 10
−3 eV; (iii) C sample, 74.637 × 10
−3 eV; (iv) D sample, 72.96 × 10
−3 eV; (v) E sample, 72.944 × 10
−3 eV; and (vi) F sample, 67.409 × 10
−3 eV.
Figure 14c and
Figure 15c highlight a straight line for the A and B samples as well as in the case of the D, E, and F samples, which indicates an Arrhenius-type activation. The graph of the C sample (
Figure 14c) seems to have a more pronounced curvature, which suggest the existence of two possible conduction activation mechanisms, i.e., one at lower temperatures and another at higher temperatures. The conductivity values of the A, B, and C samples are not significantly different (see
Figure 14c). All conductivities curves overlap at lower temperature. Therefore, the change of the BaSrTiO
3 concentration in the sample does not contribute to the mechanism of generating electric charge carriers. For D, E, and F samples, the conductivity shows a decreasing tendency with the SrTiO
3 concentration of several orders of magnitude from one sample to another.
Summarizing these results, we can conclude that the A, B, C, D, E, and F samples show two mechanisms: (a) one regarding the type of electrical conduction, which is manifested by the simultaneous increase of the dielectric constant and dielectric losses with several orders of magnitude at low frequencies as well as the appearance of a plateau region in the of electrical conductivity in same frequency range; a variation of the electrical conductivity is observed only for the D, E, and F samples, without a change in the charge carriers’ generation mechanism; and (b) another one regarding the type of electric dipolar relaxation process that appears at high frequencies, which is best observed in dielectric losses spectra by the presence of a maximum point; it is a non-Debye relaxation mechanism; dipole-relaxation activation energy shows an increase with increasing CNs concentration only for the A, B, and C samples.


 ,
, 


