On the Mutual Relationships between Molecular Probe Mobility and Free Volume and Polymer Dynamics in Organic Glass Formers: cis-1,4-poly(isoprene)

 , , and
Abstract
:1. Introduction
2. Materials and Methods
2.1. Materials
2.2. Electron Spin Resonance (ESR)
2.3. Positron Annihilation Lifetime Spectroscopy (PALS)
2.4. Broadband Dielectric Spectroscopy
2.5. Light Scattering
3. Results
3.1. ESR Data
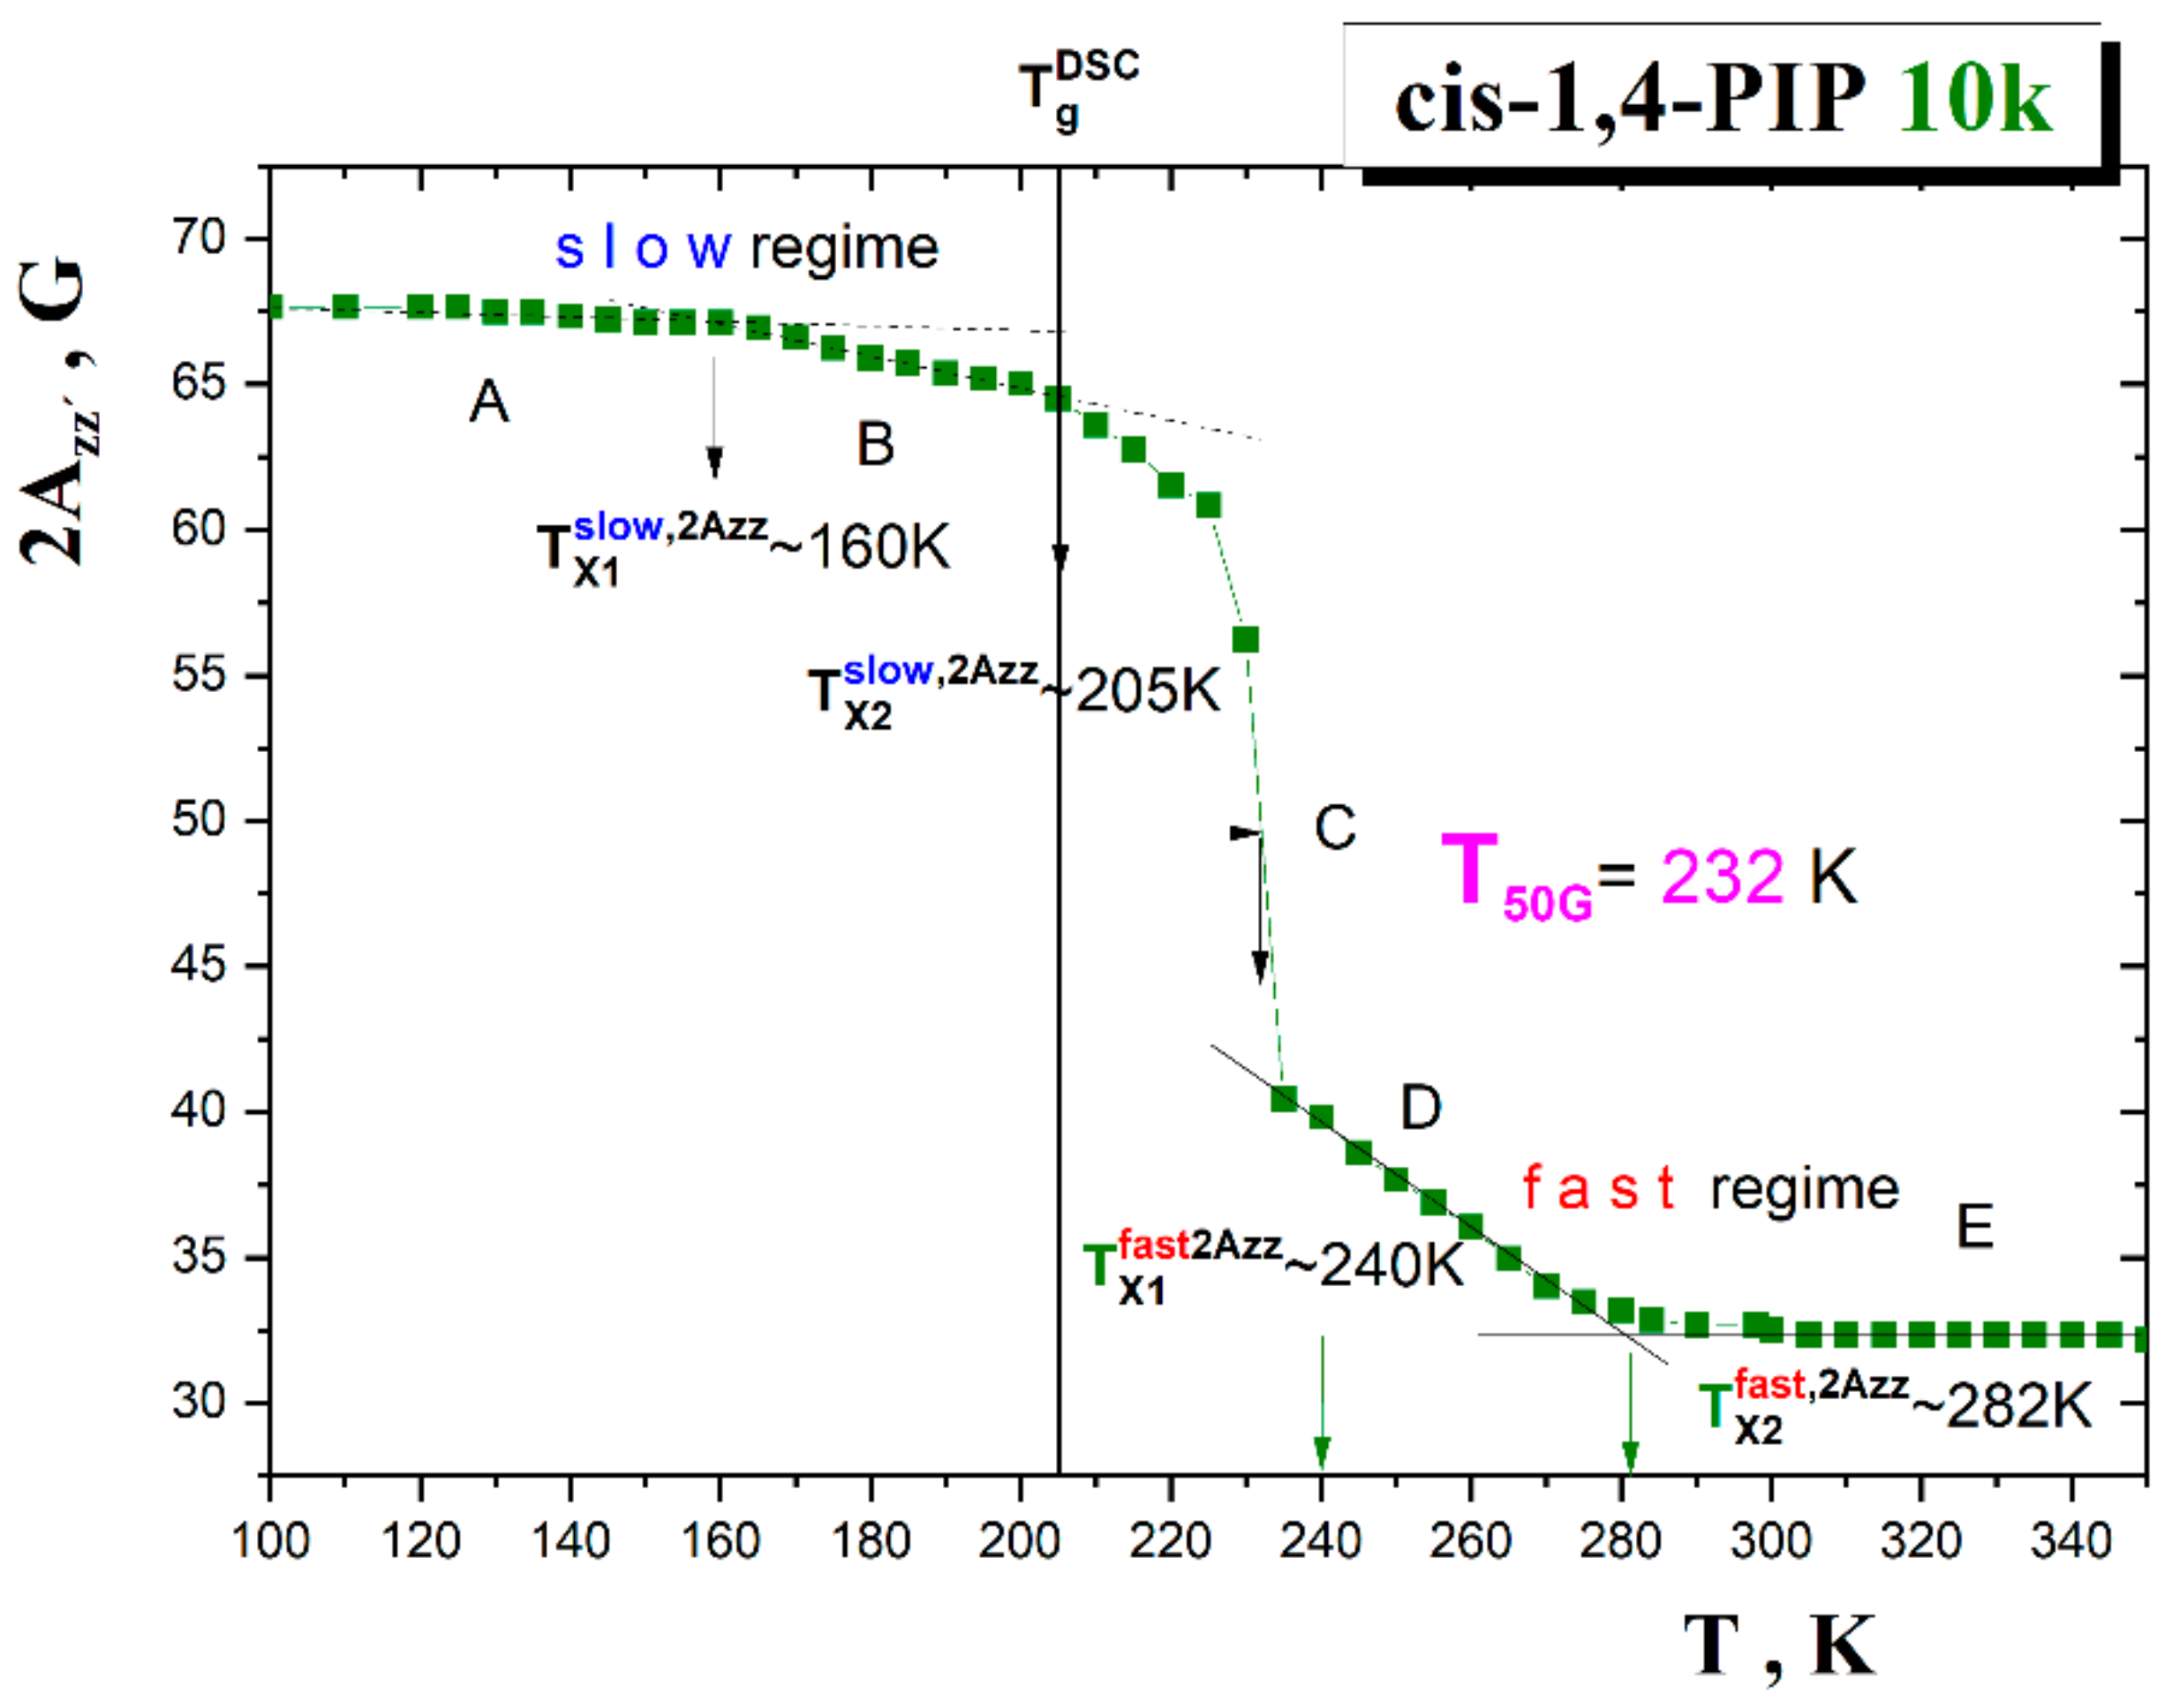
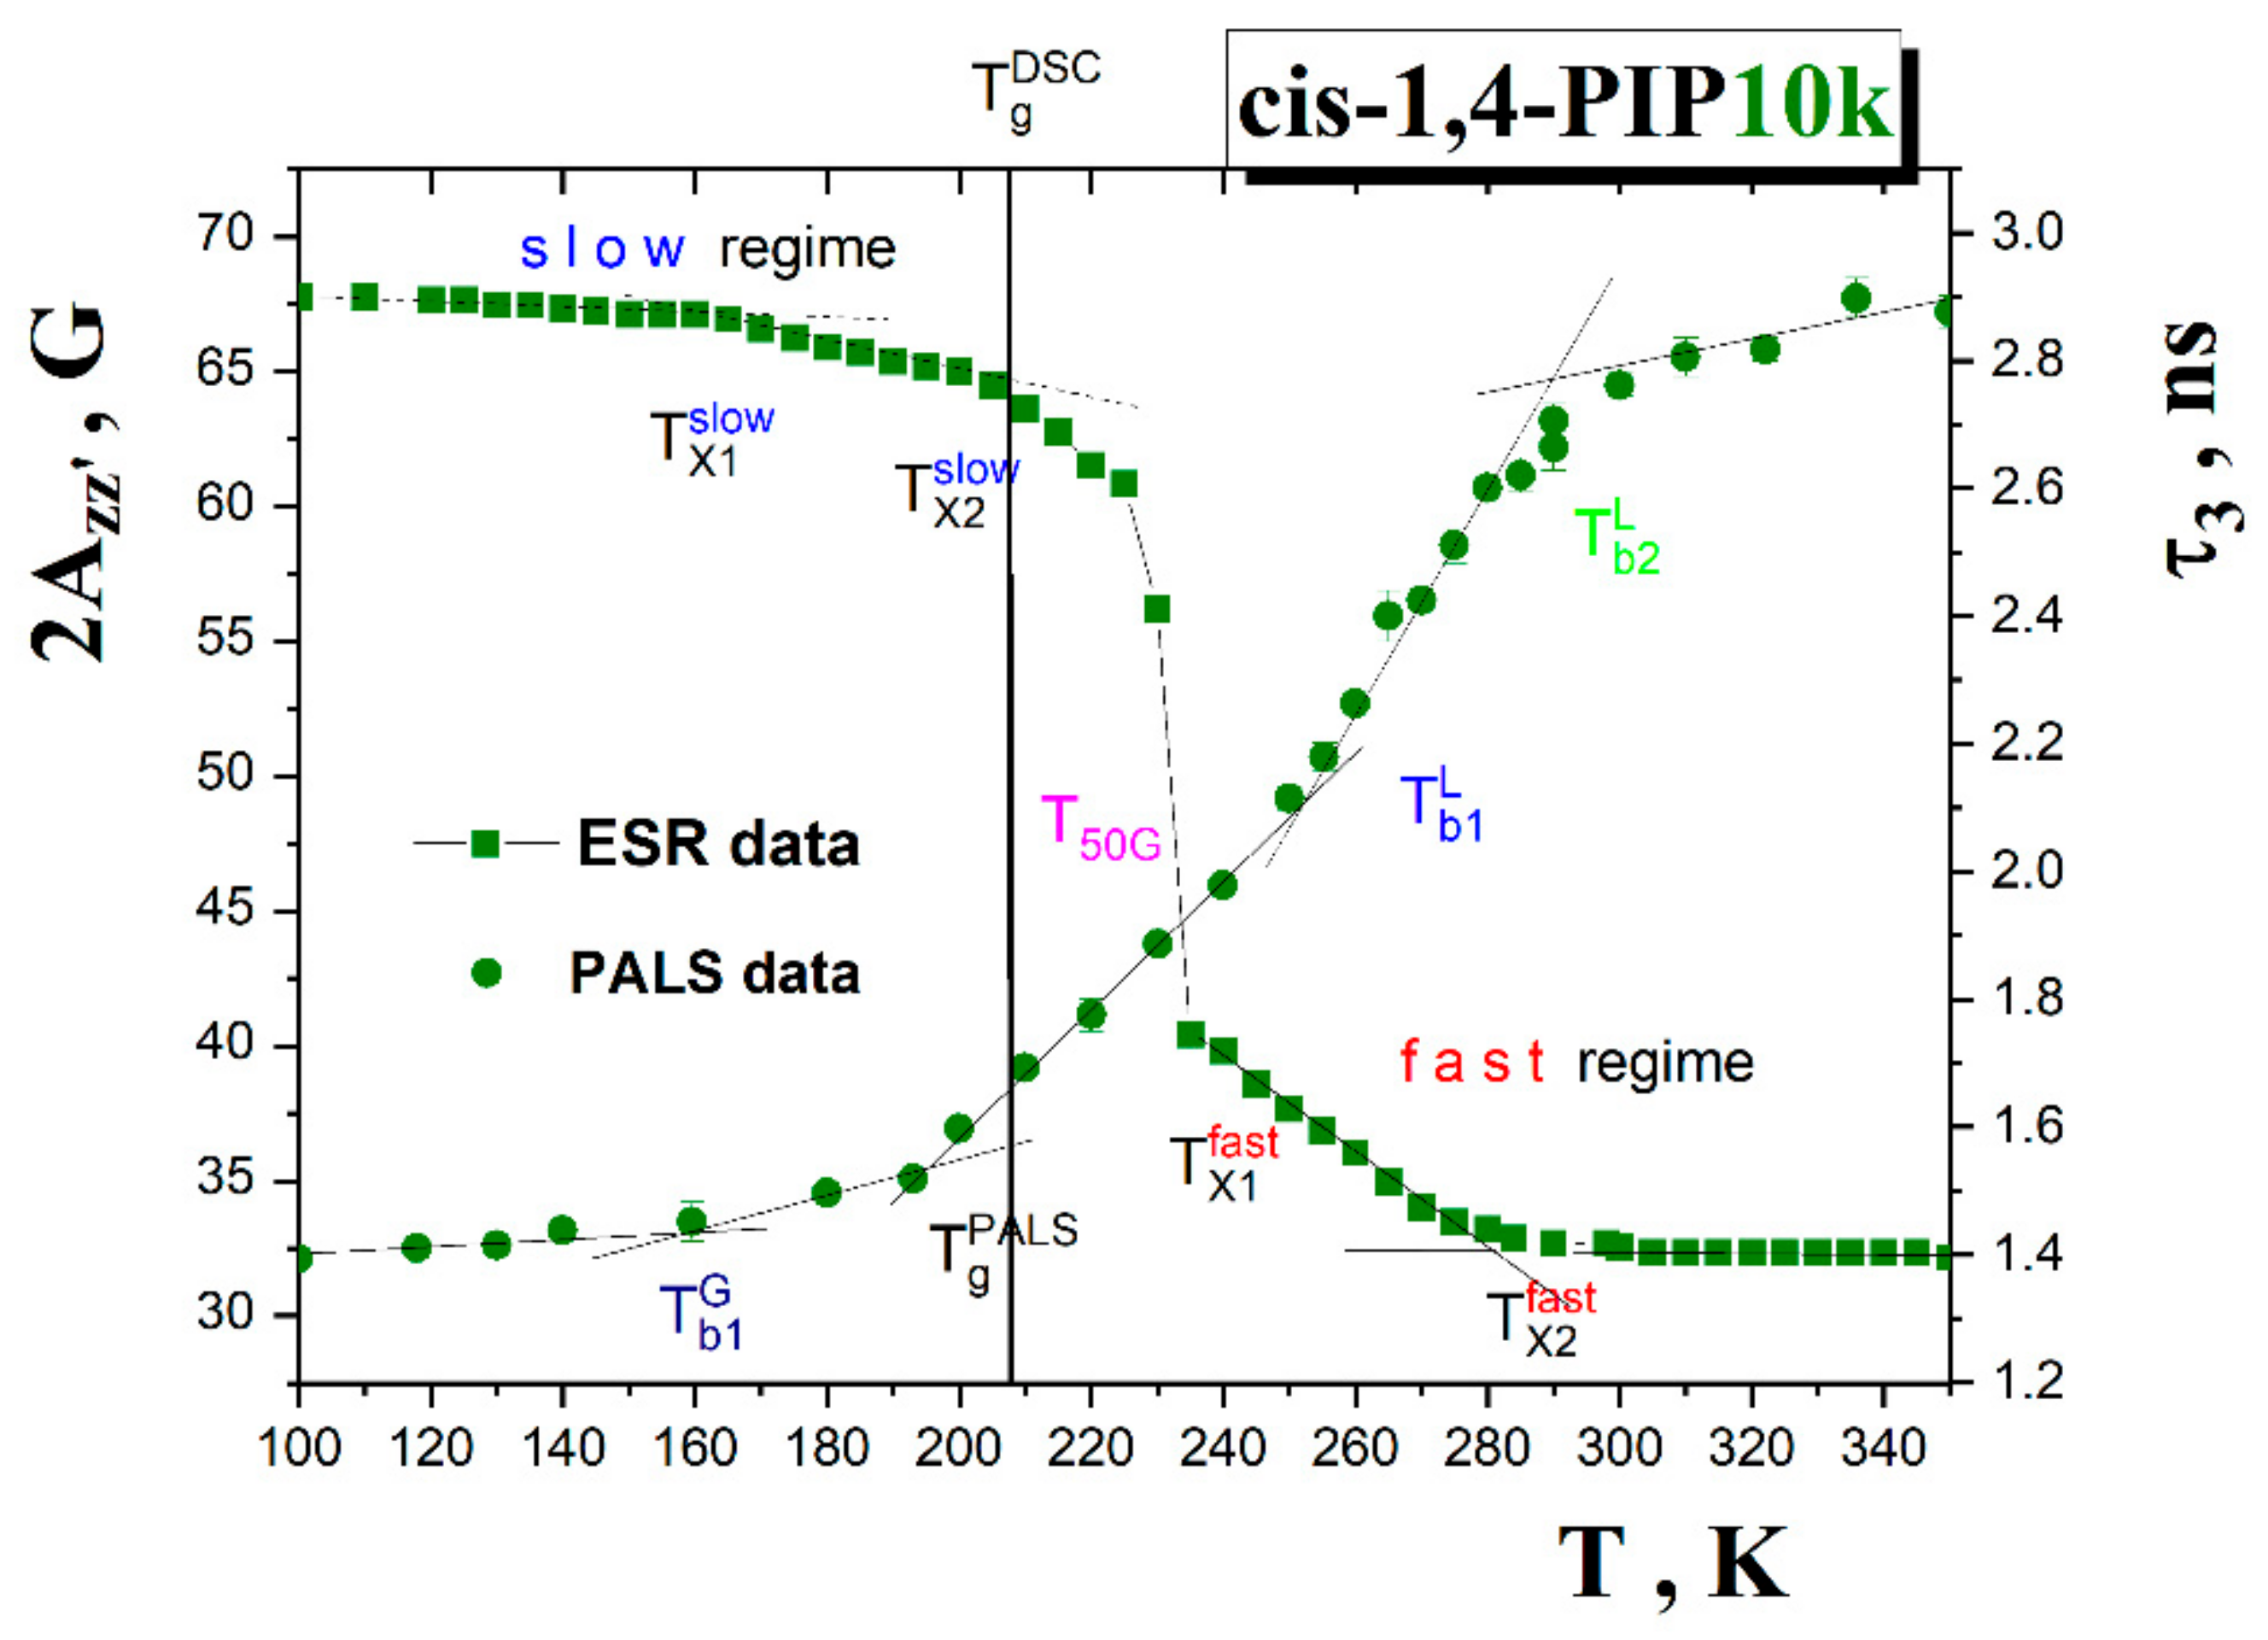
3.1.1. Spectral Parameter of Mobility, 2Azz′
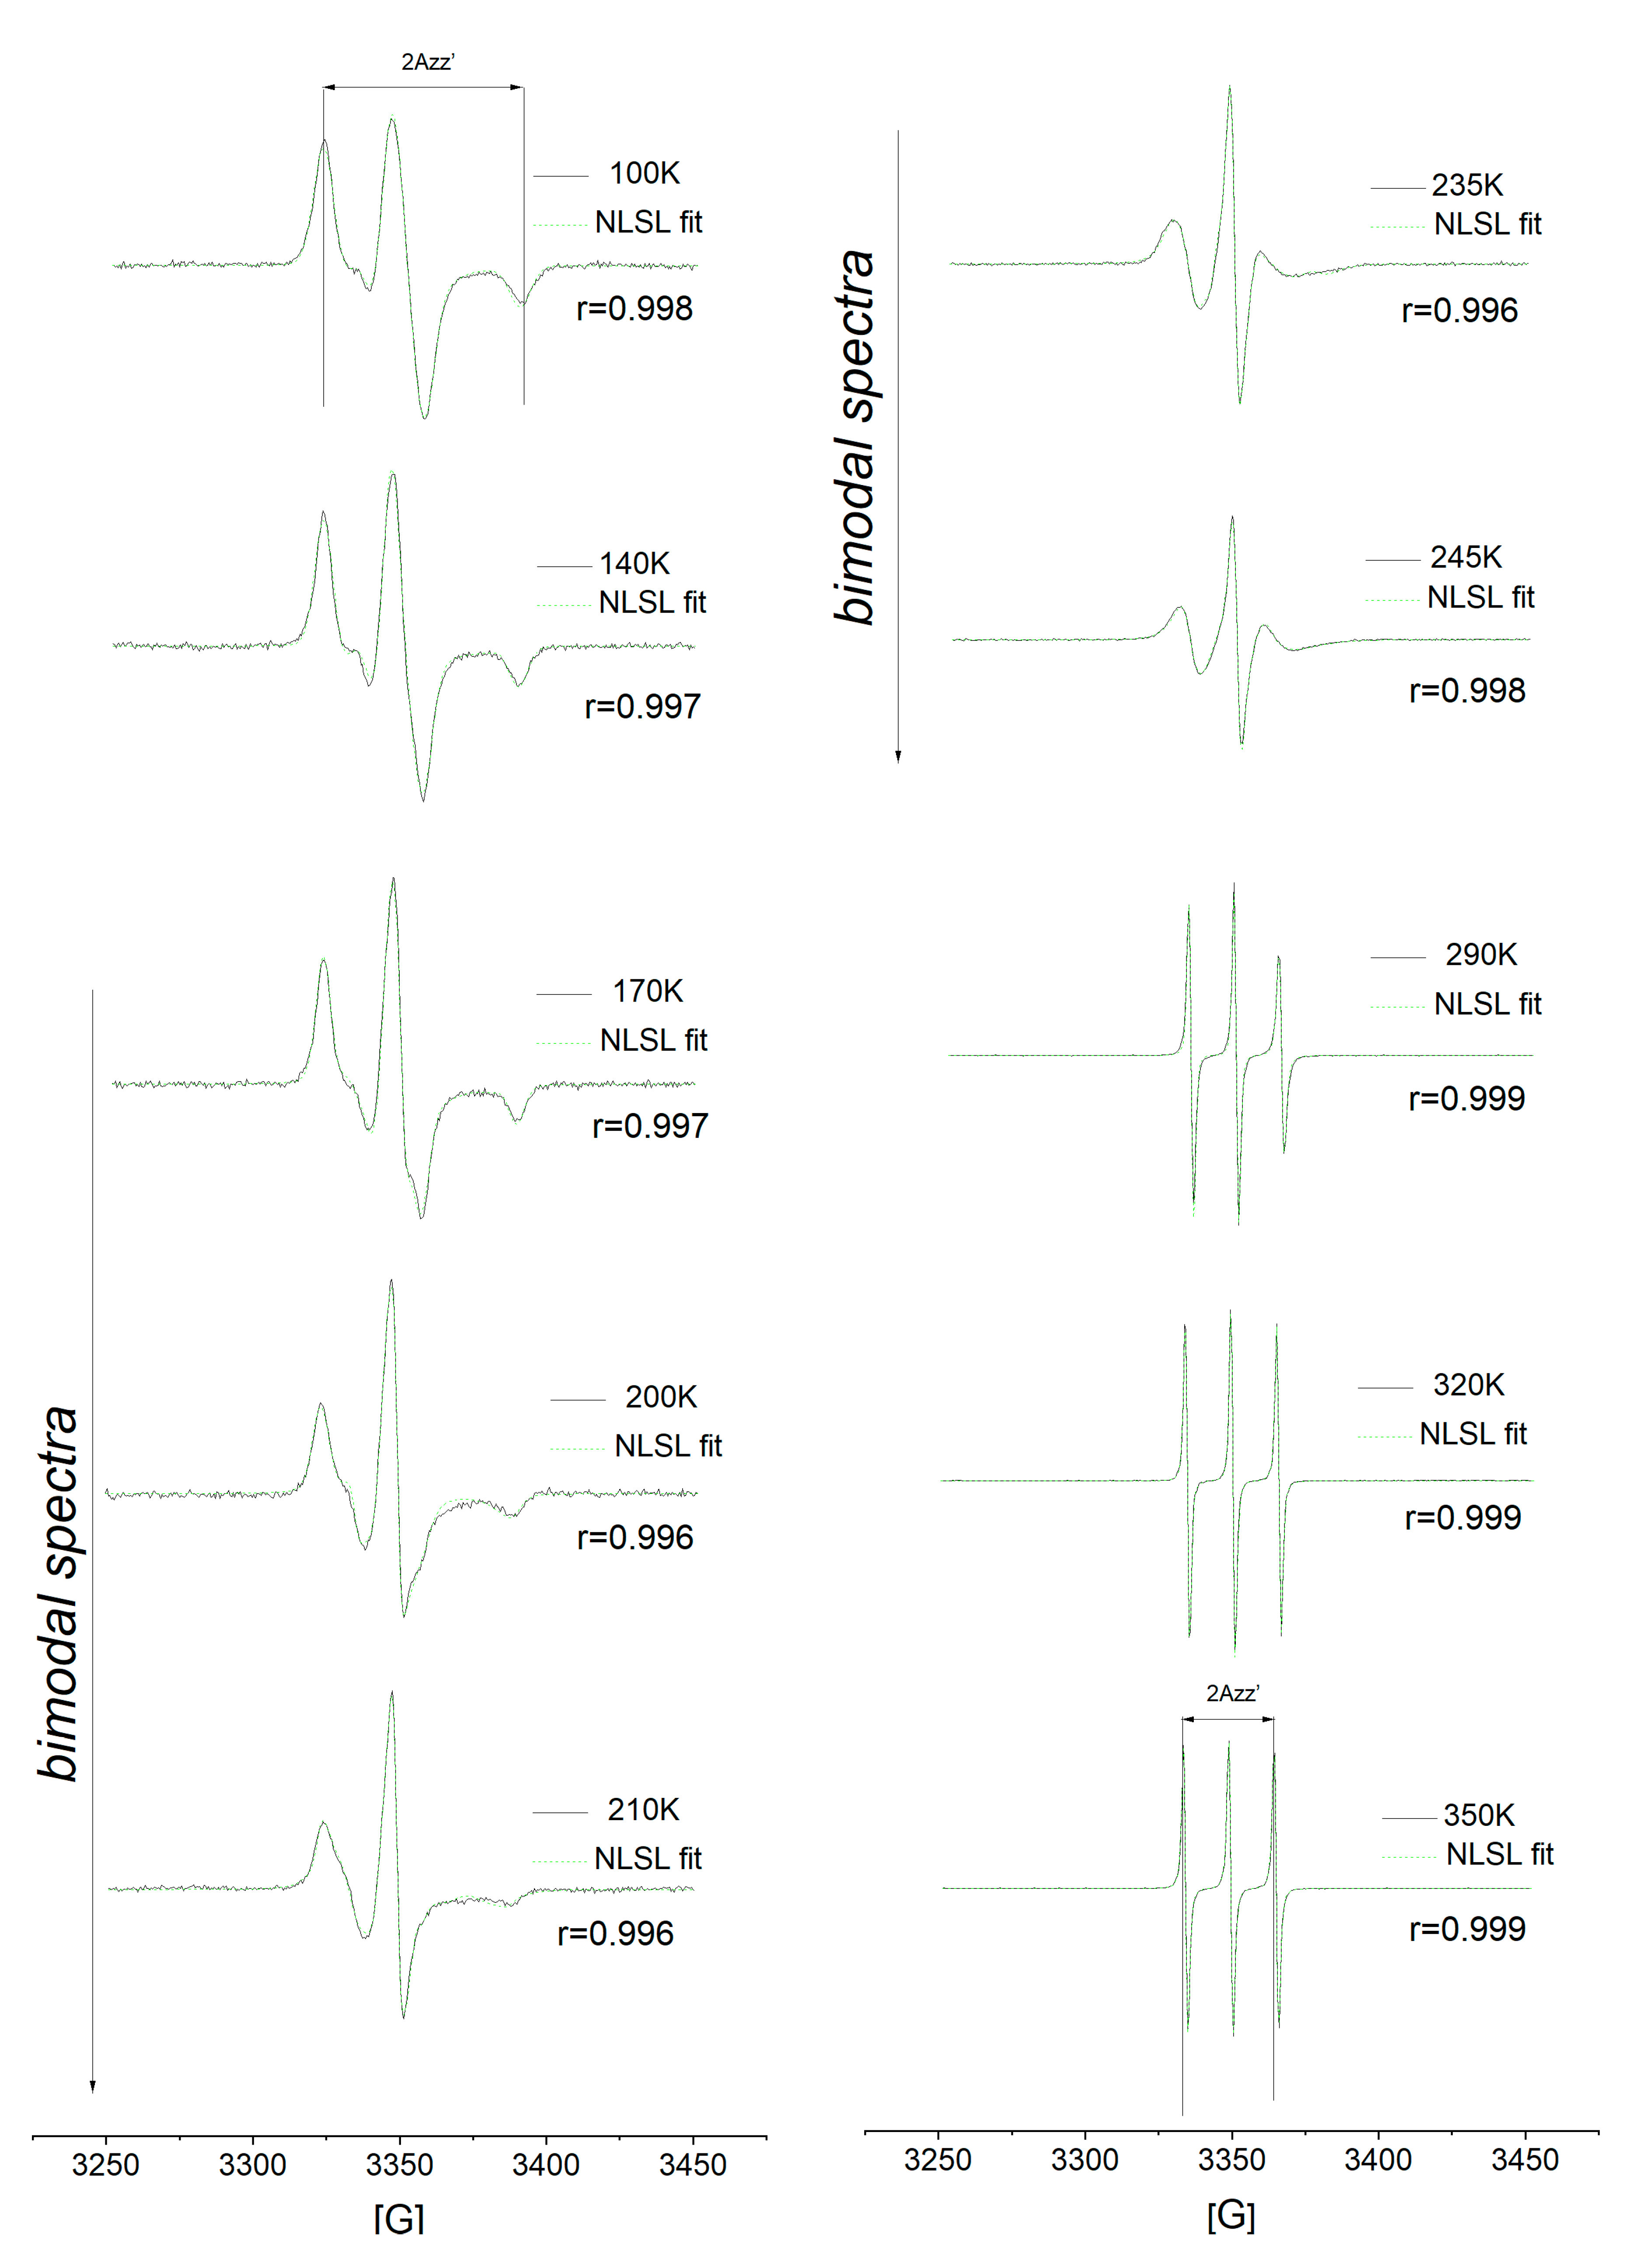
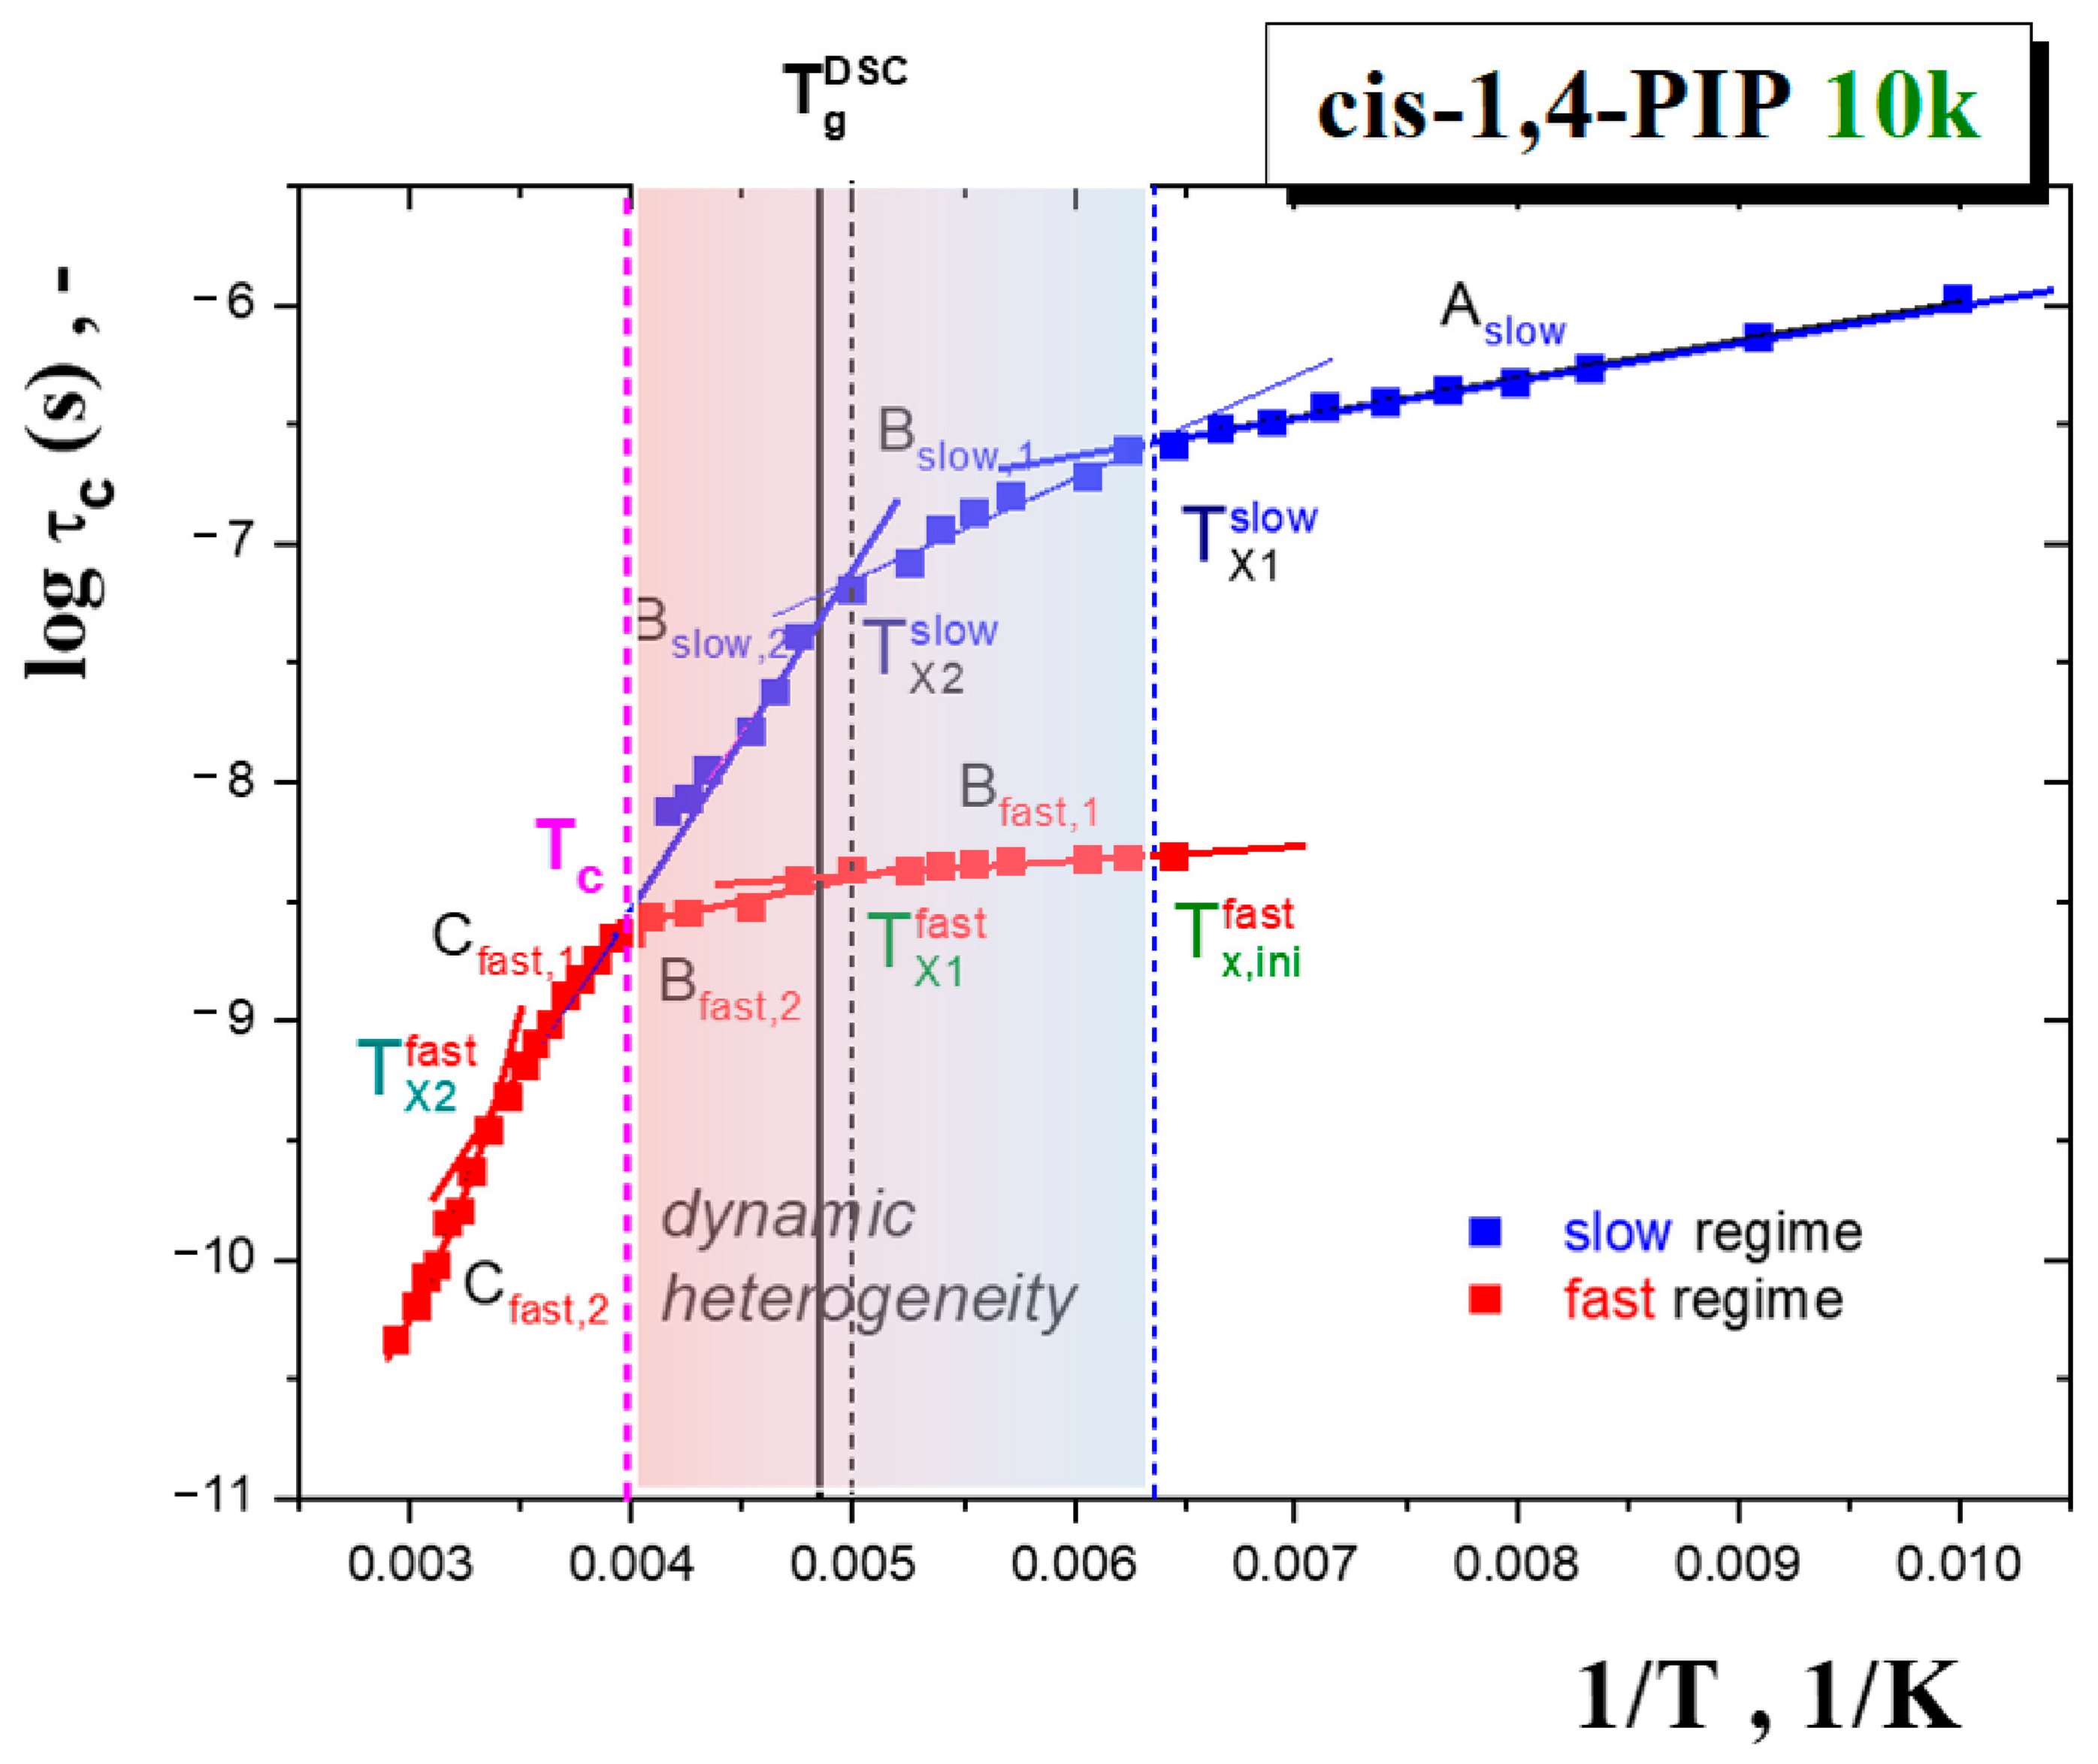
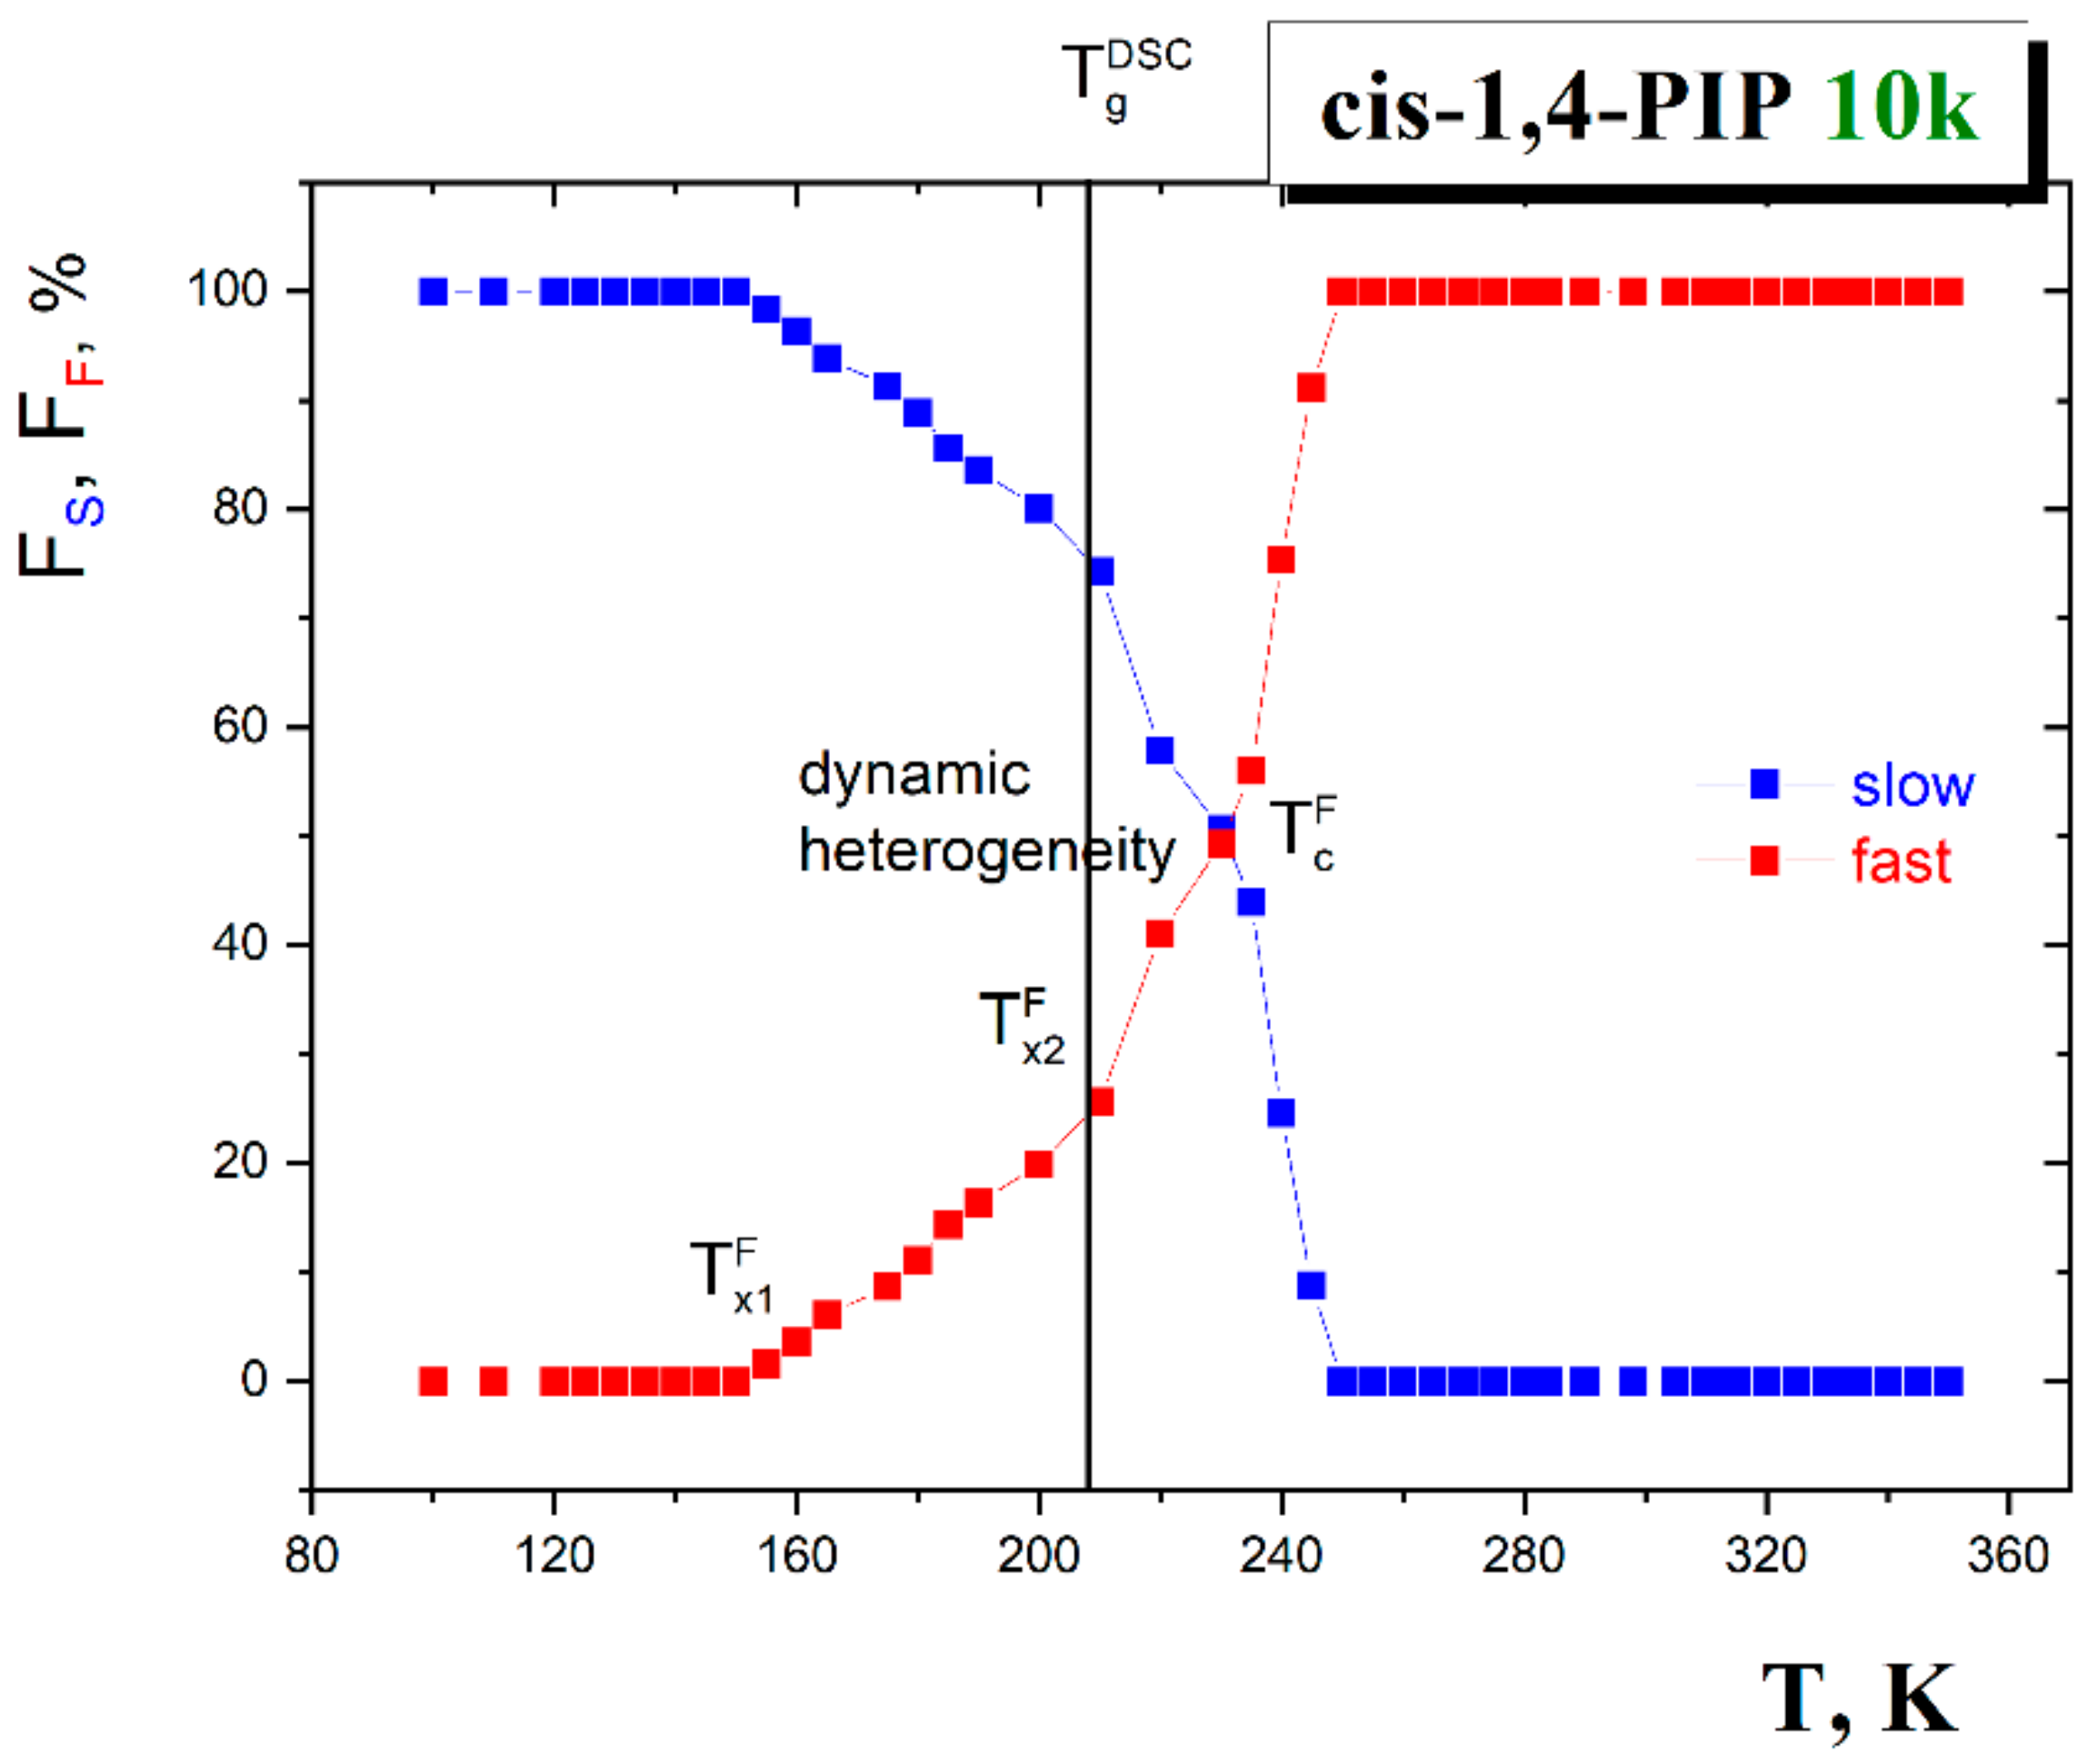
3.1.2. Spectral Simulations
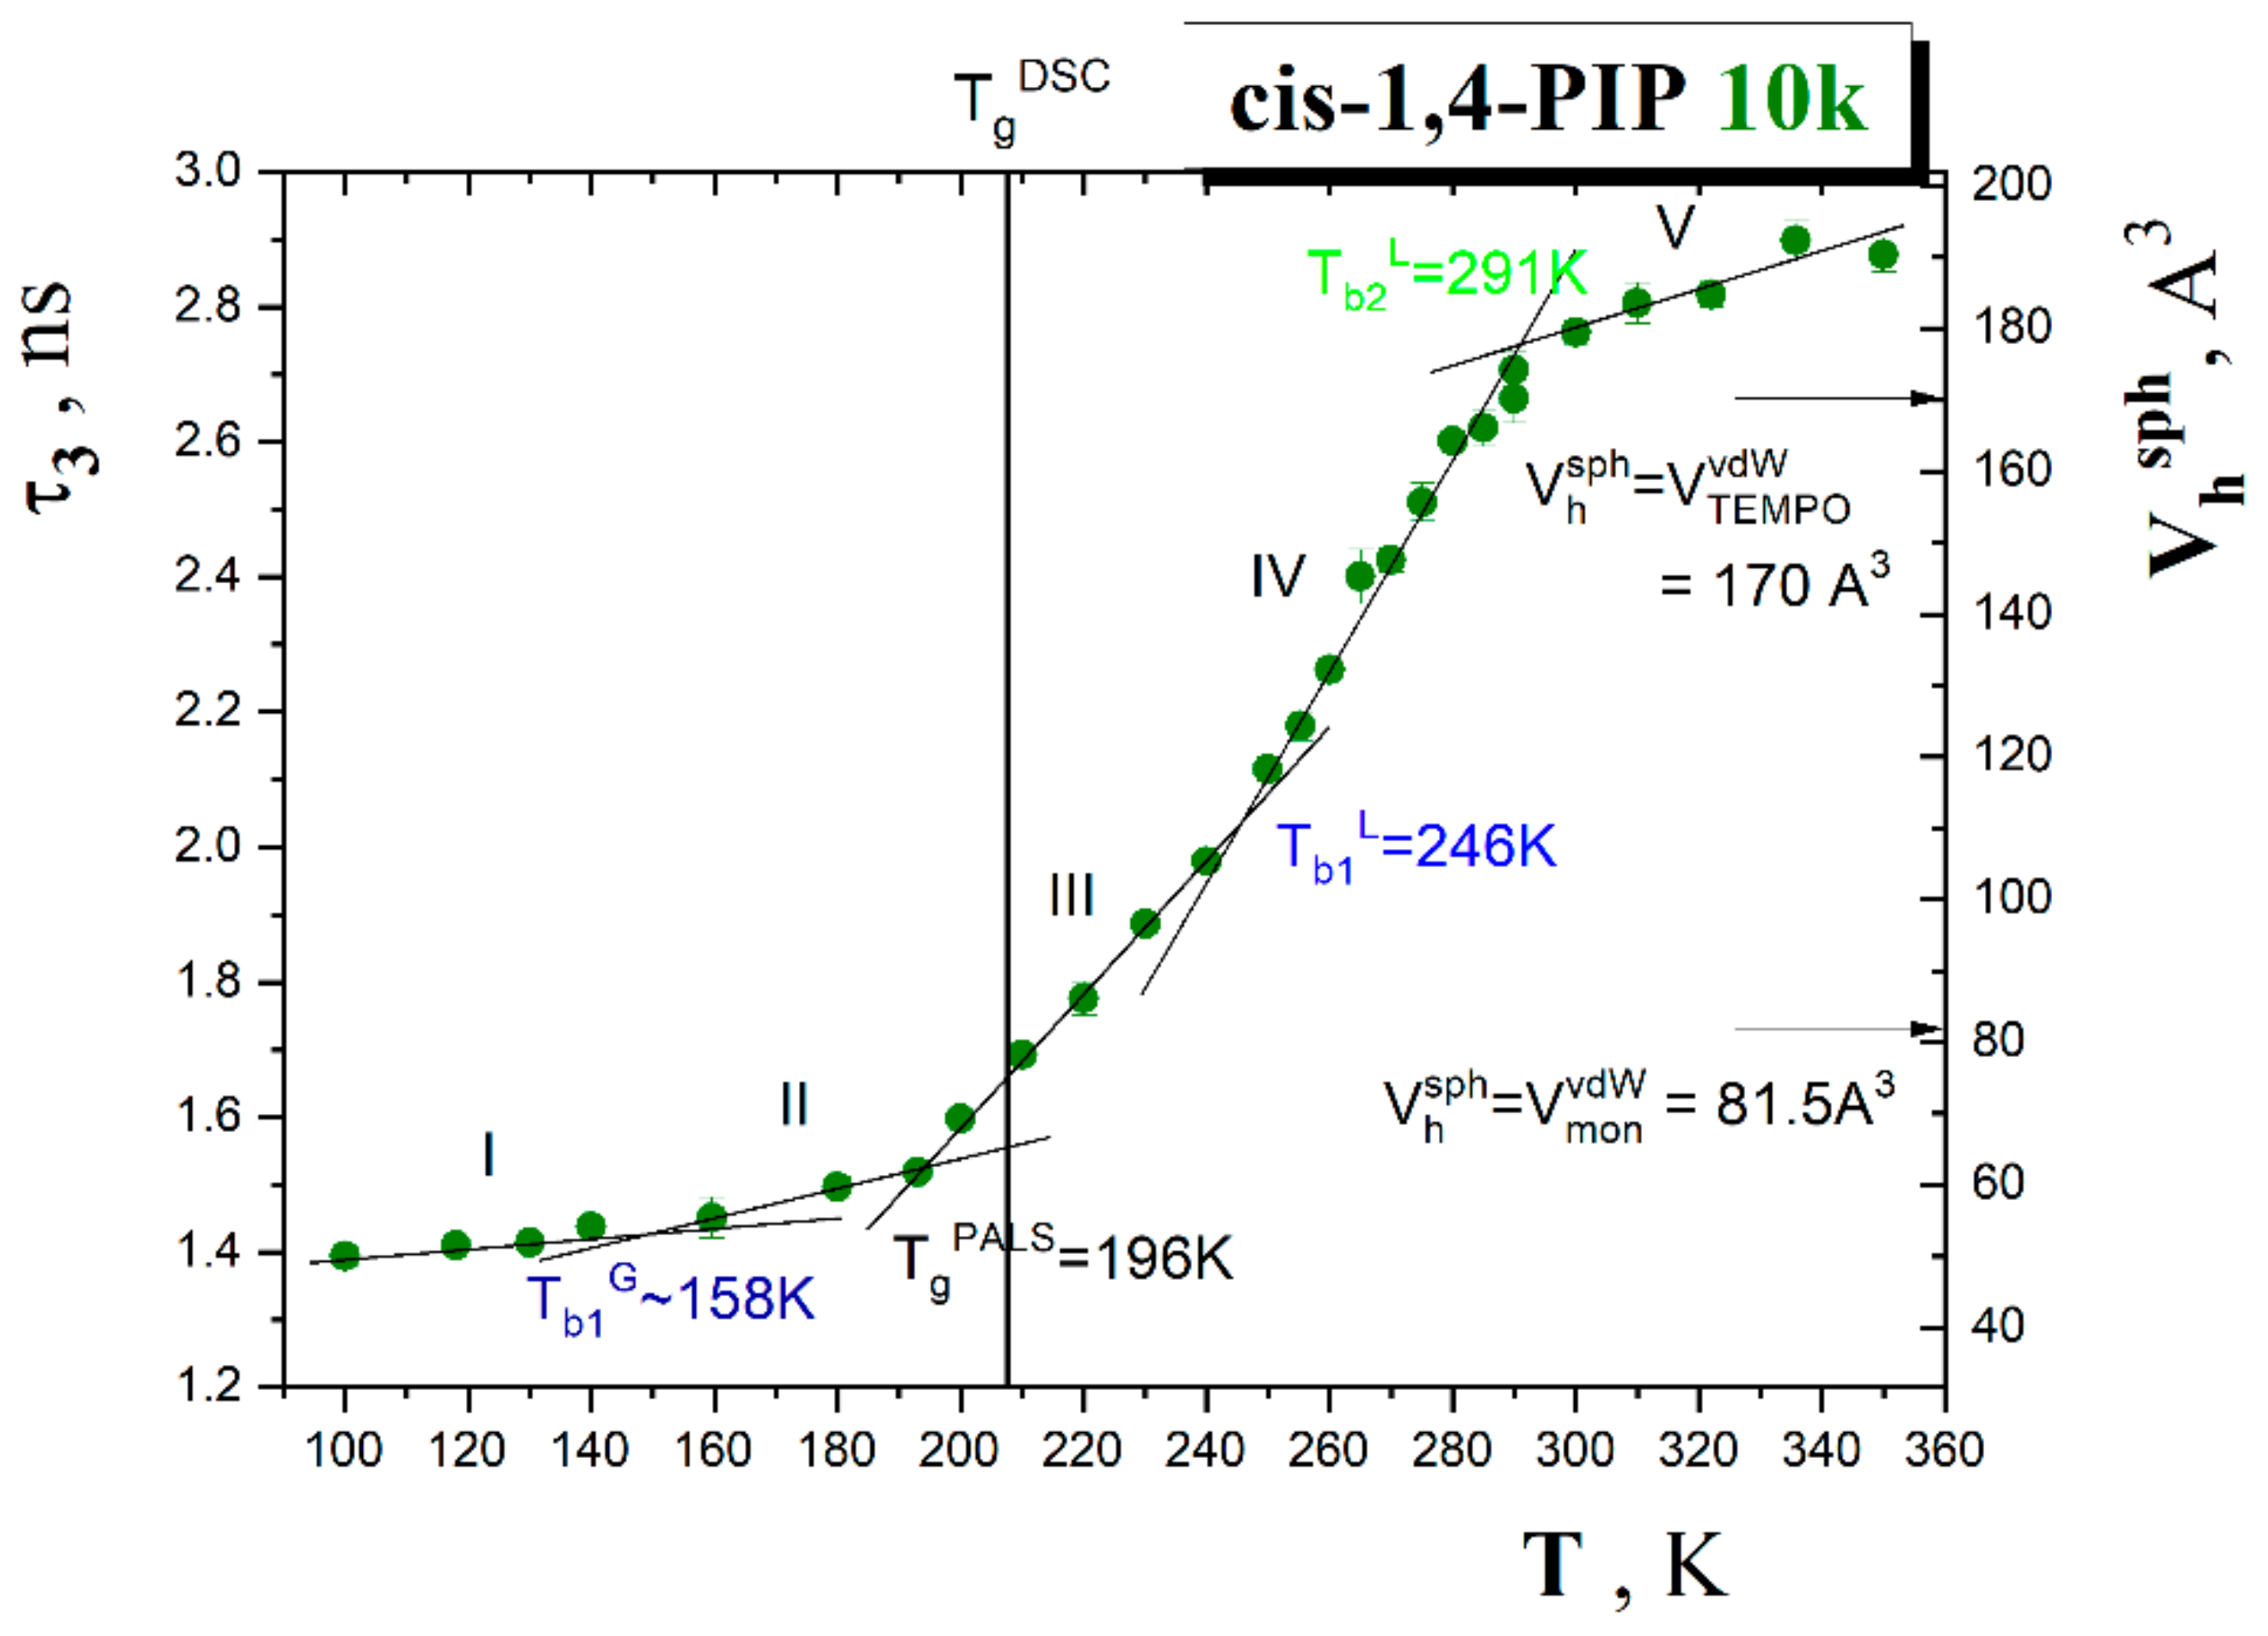
3.2. PALS Data
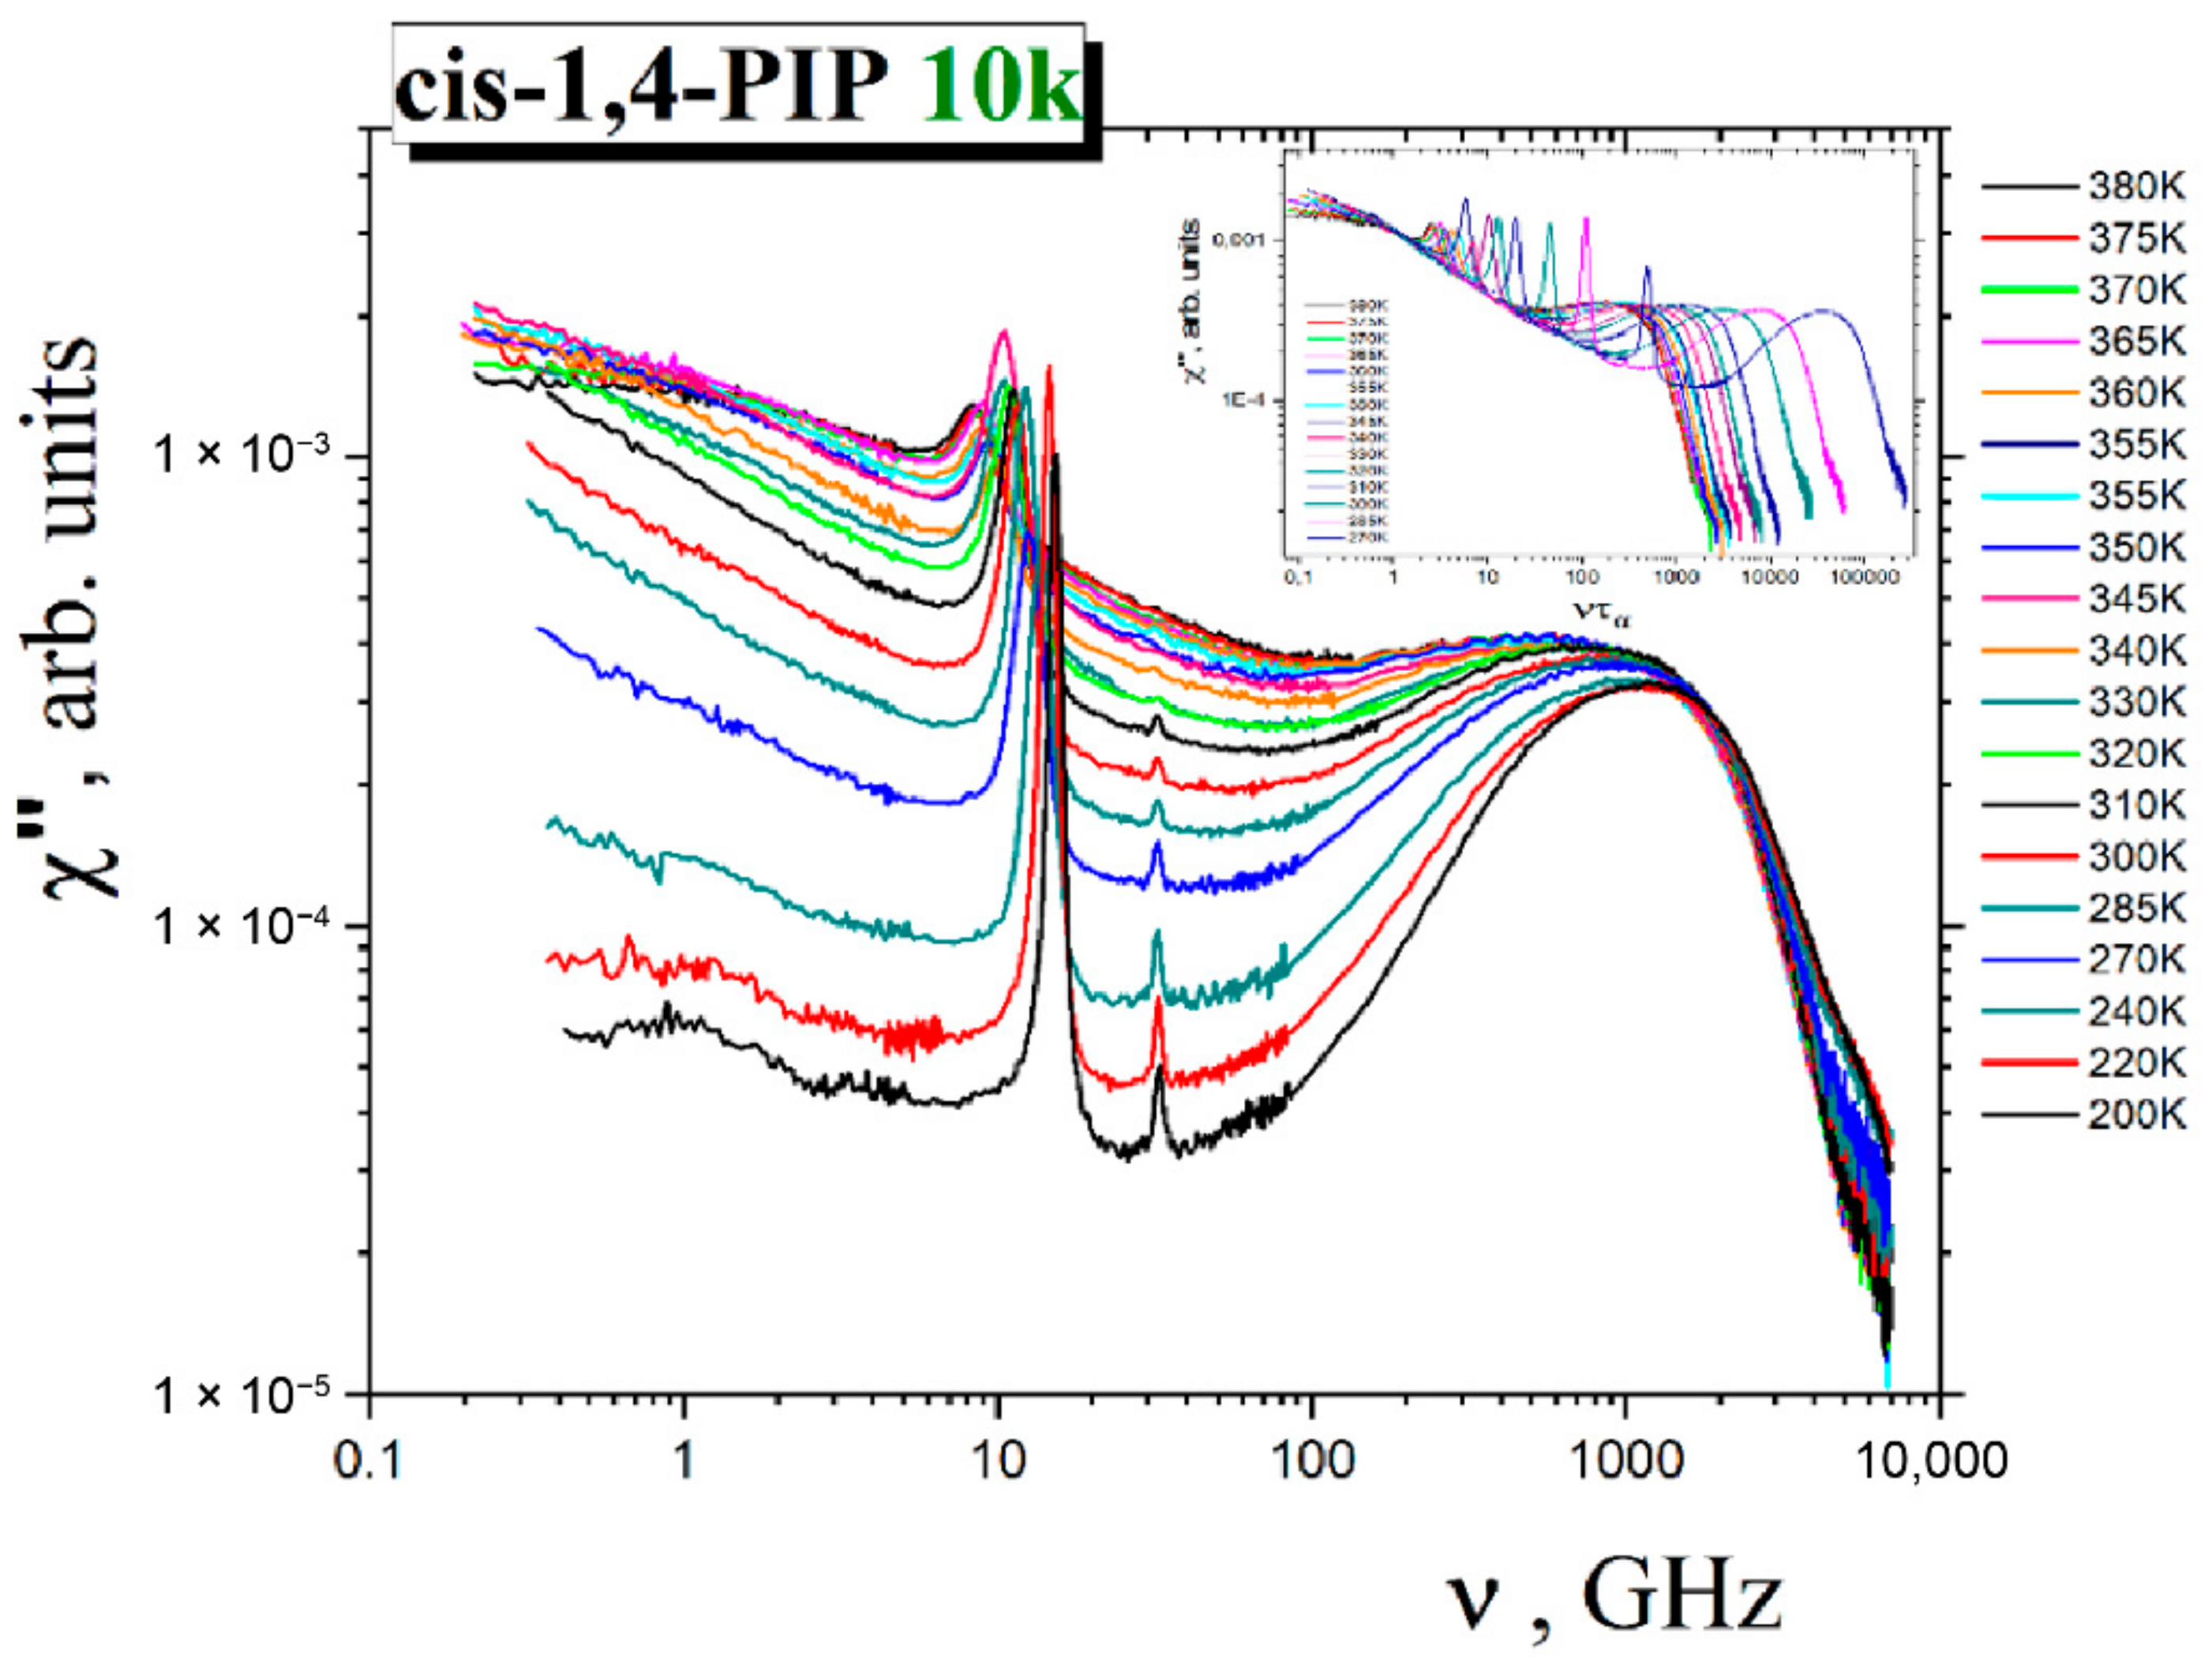
3.3. LS Data
3.3.1. Phenomenological Analysis of the Slow Dynamics
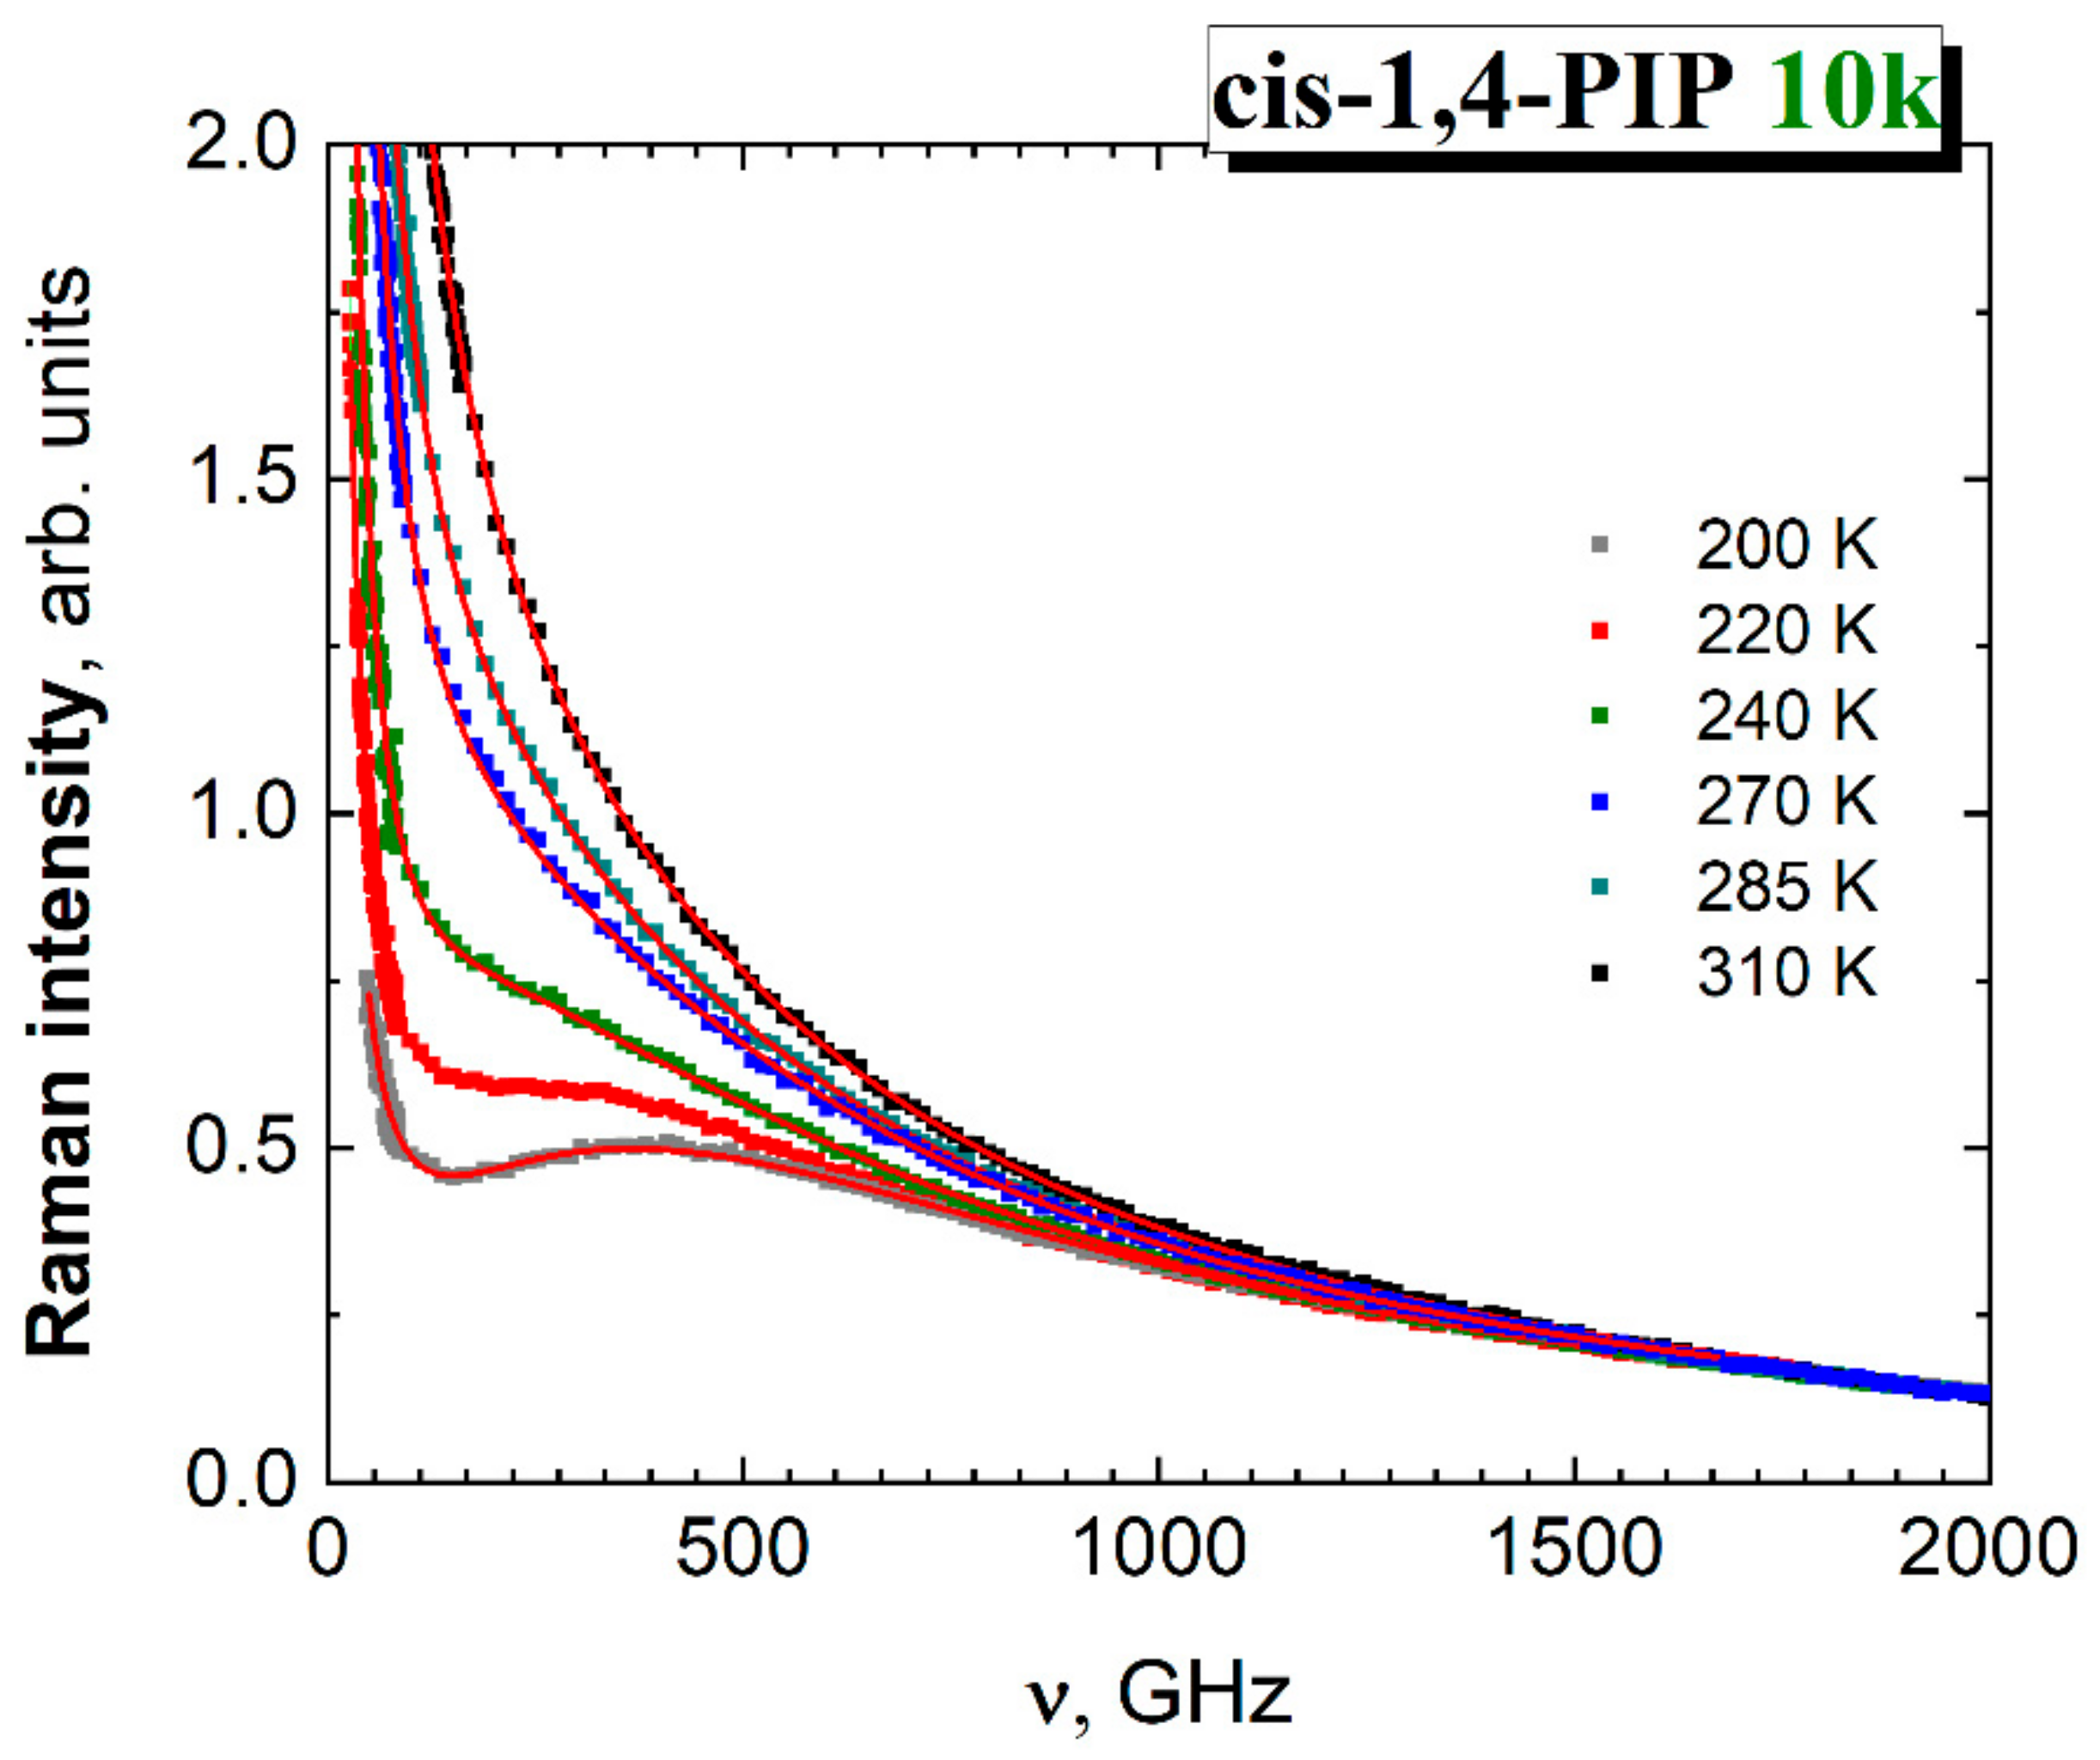
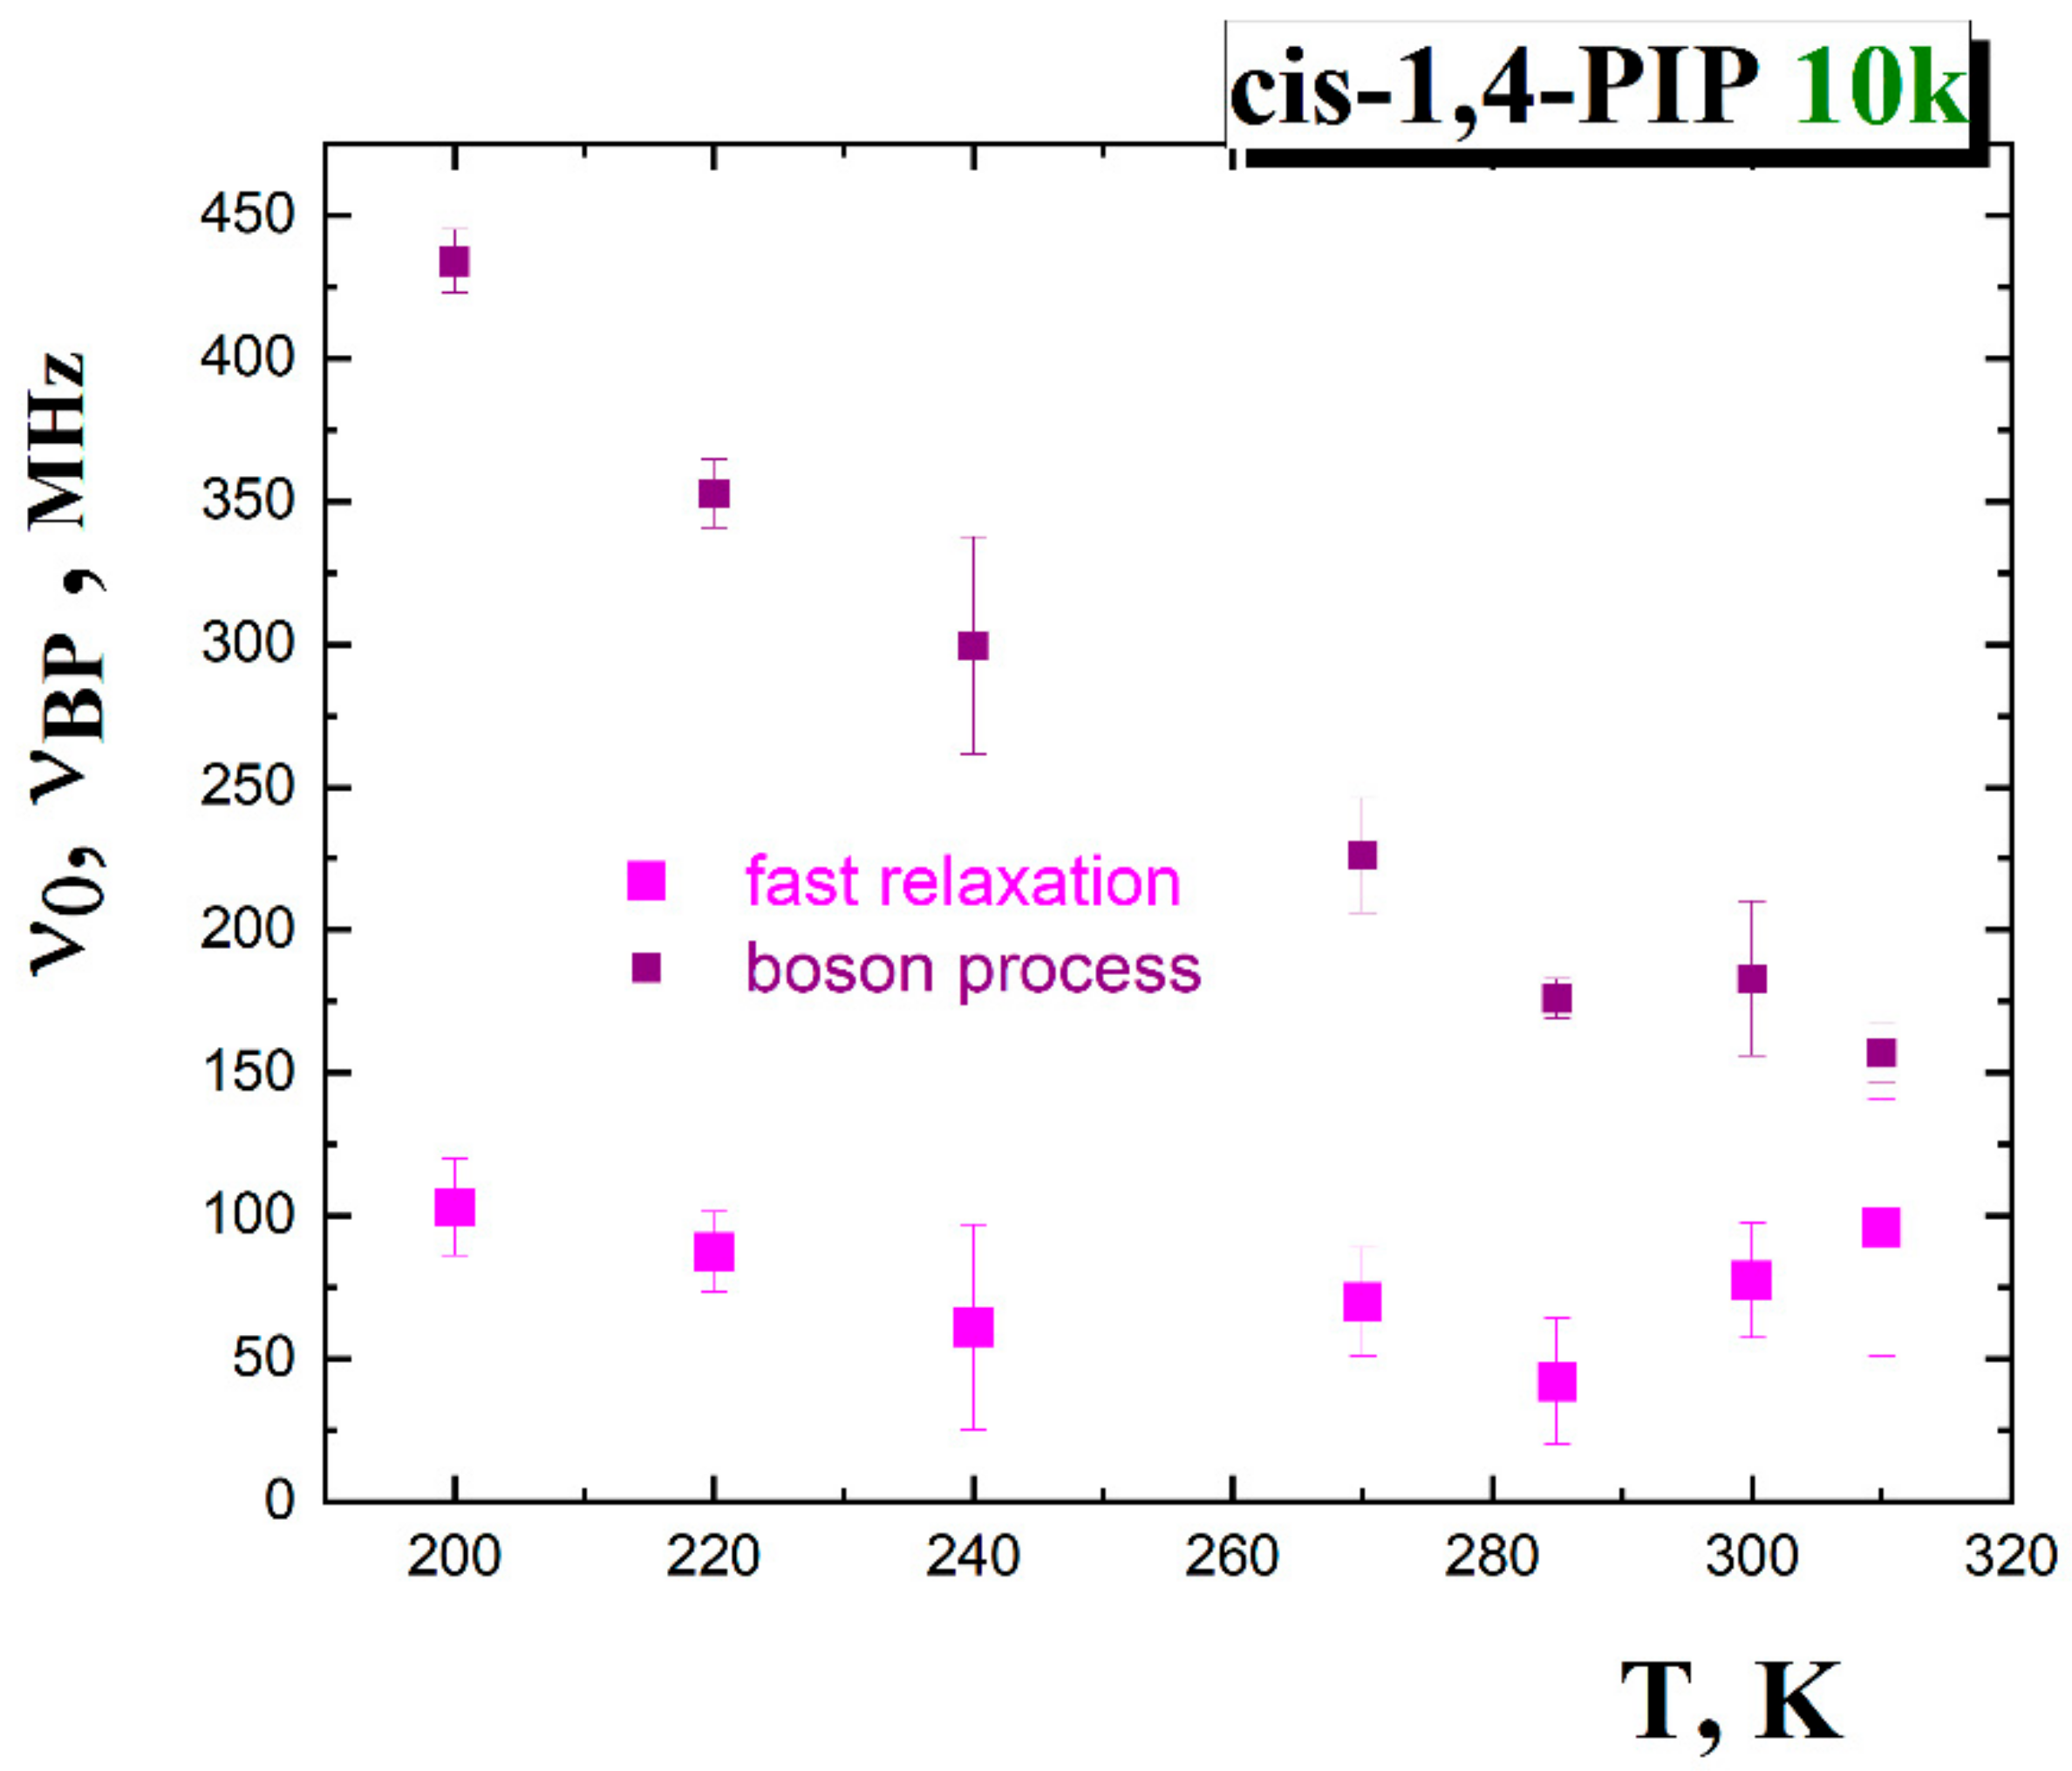
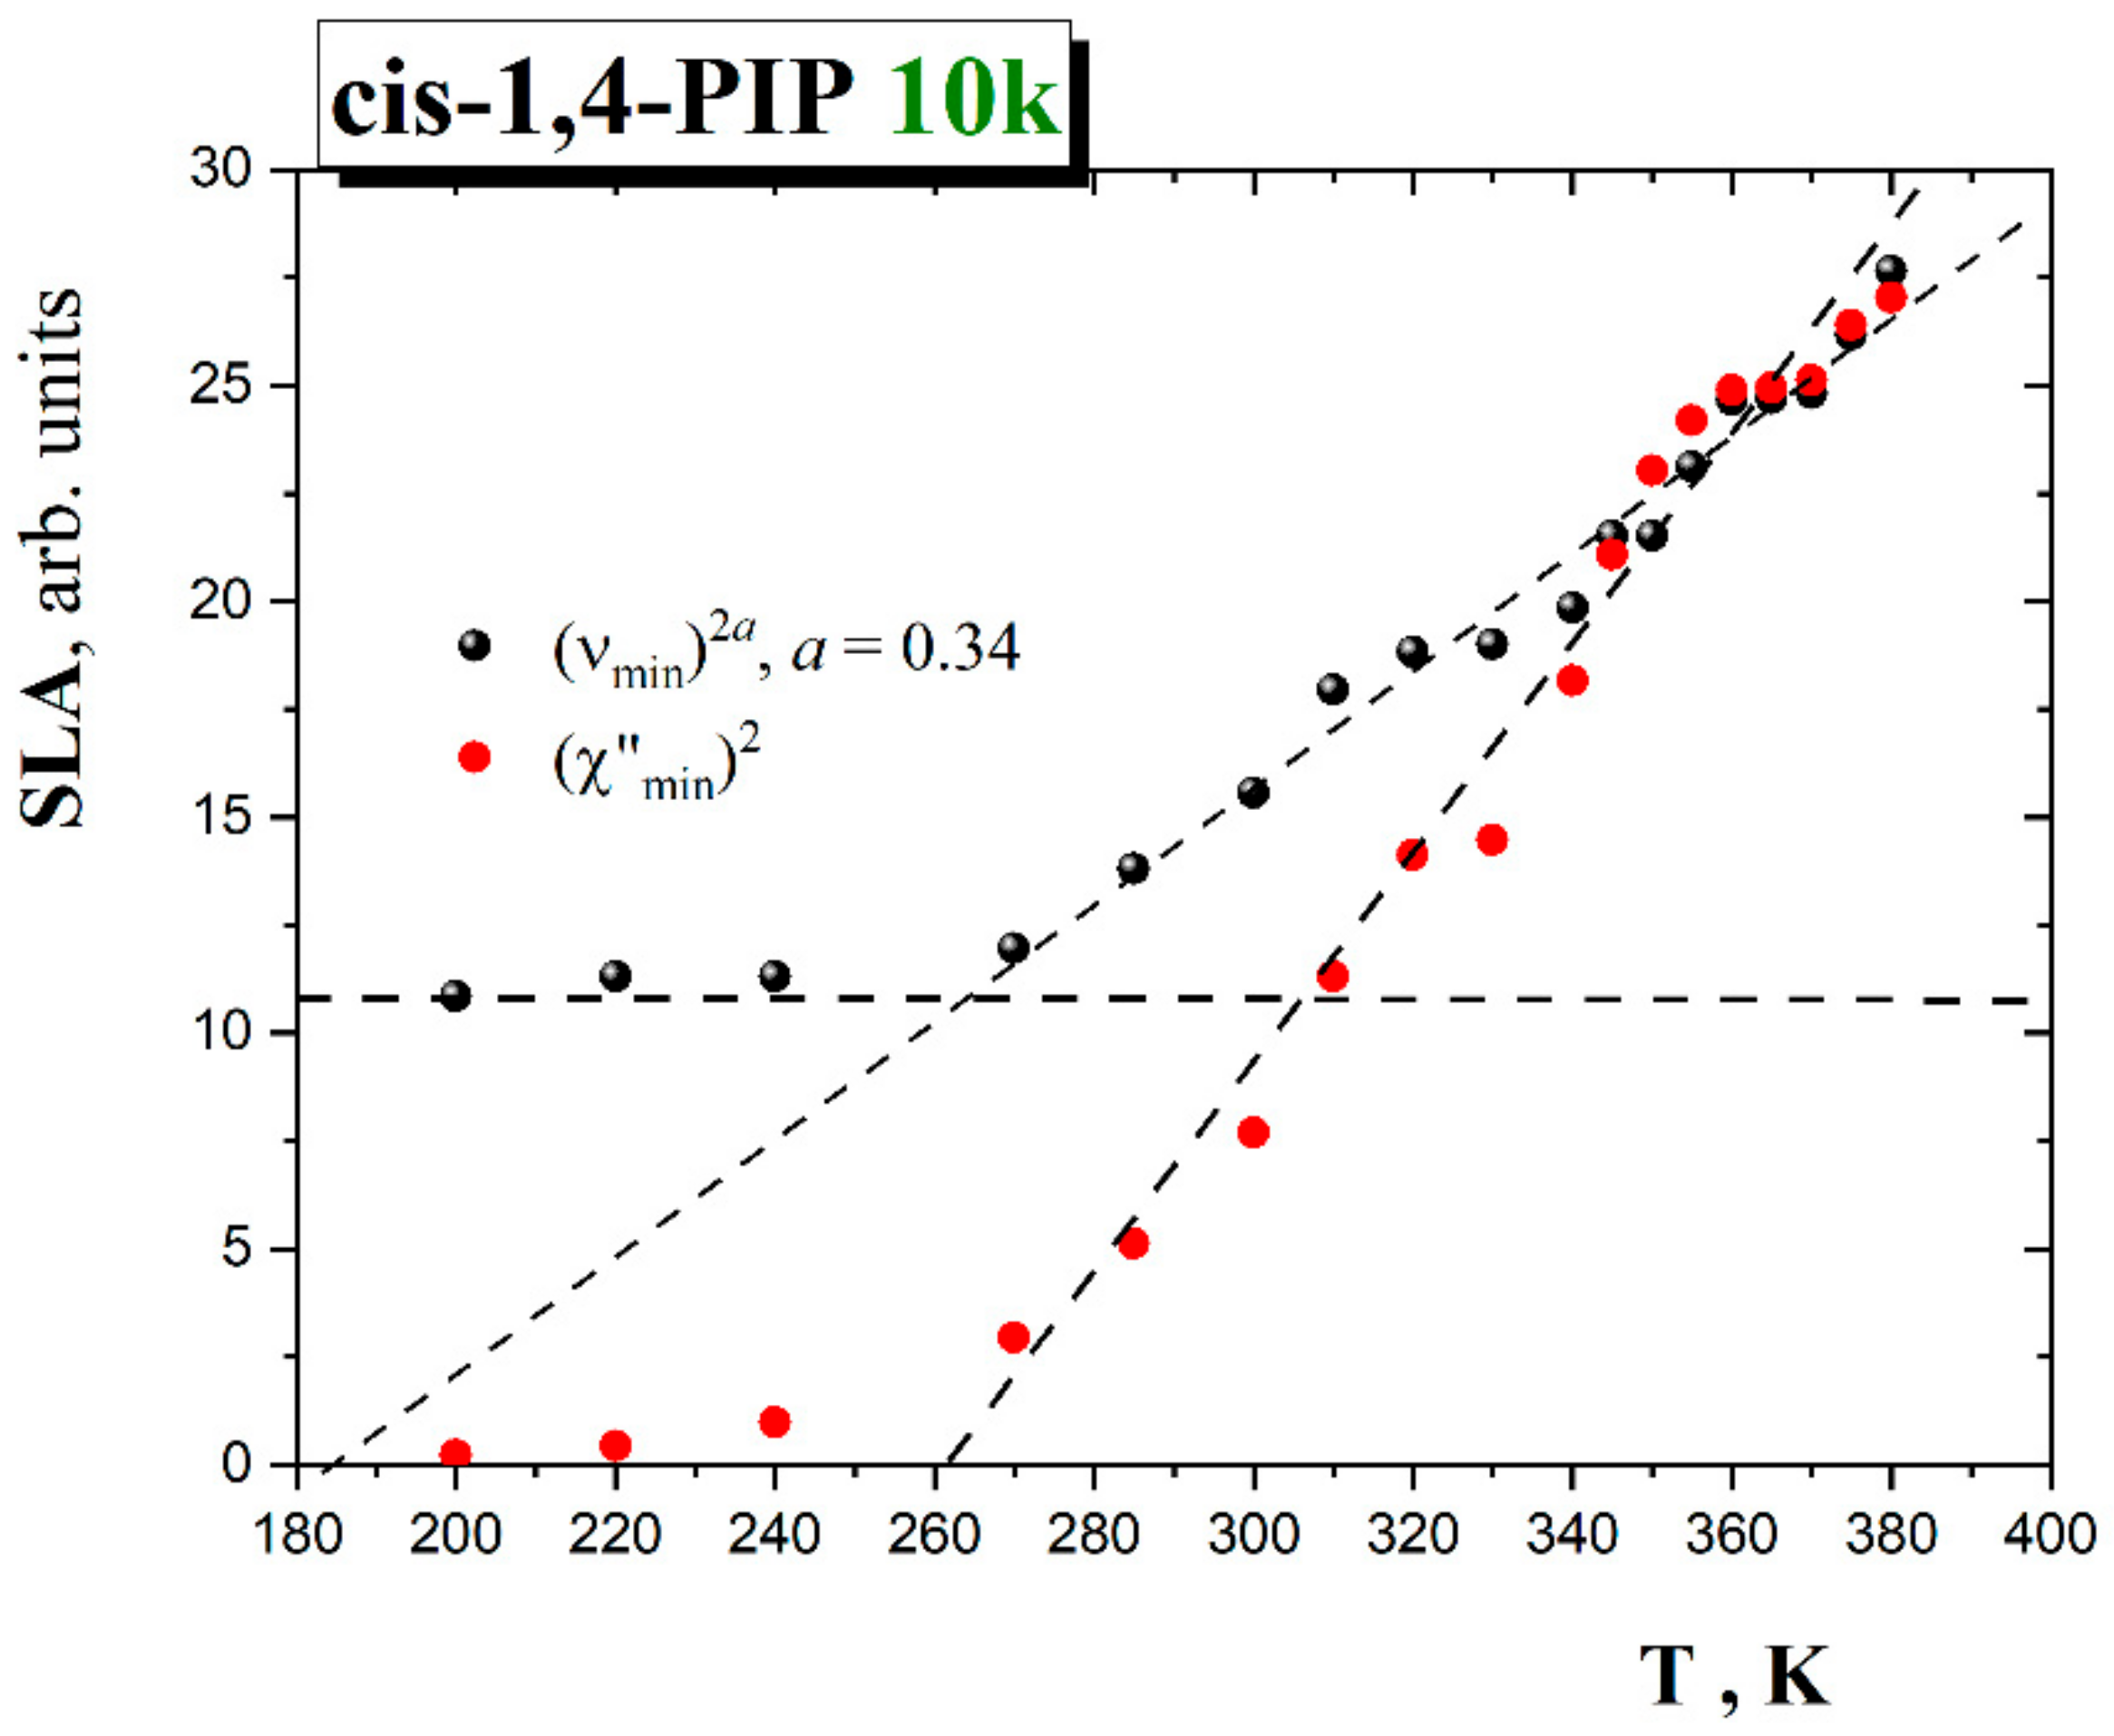
3.3.2. Analysis of the Fast Dynamics
3.3.3. MCT Analysis
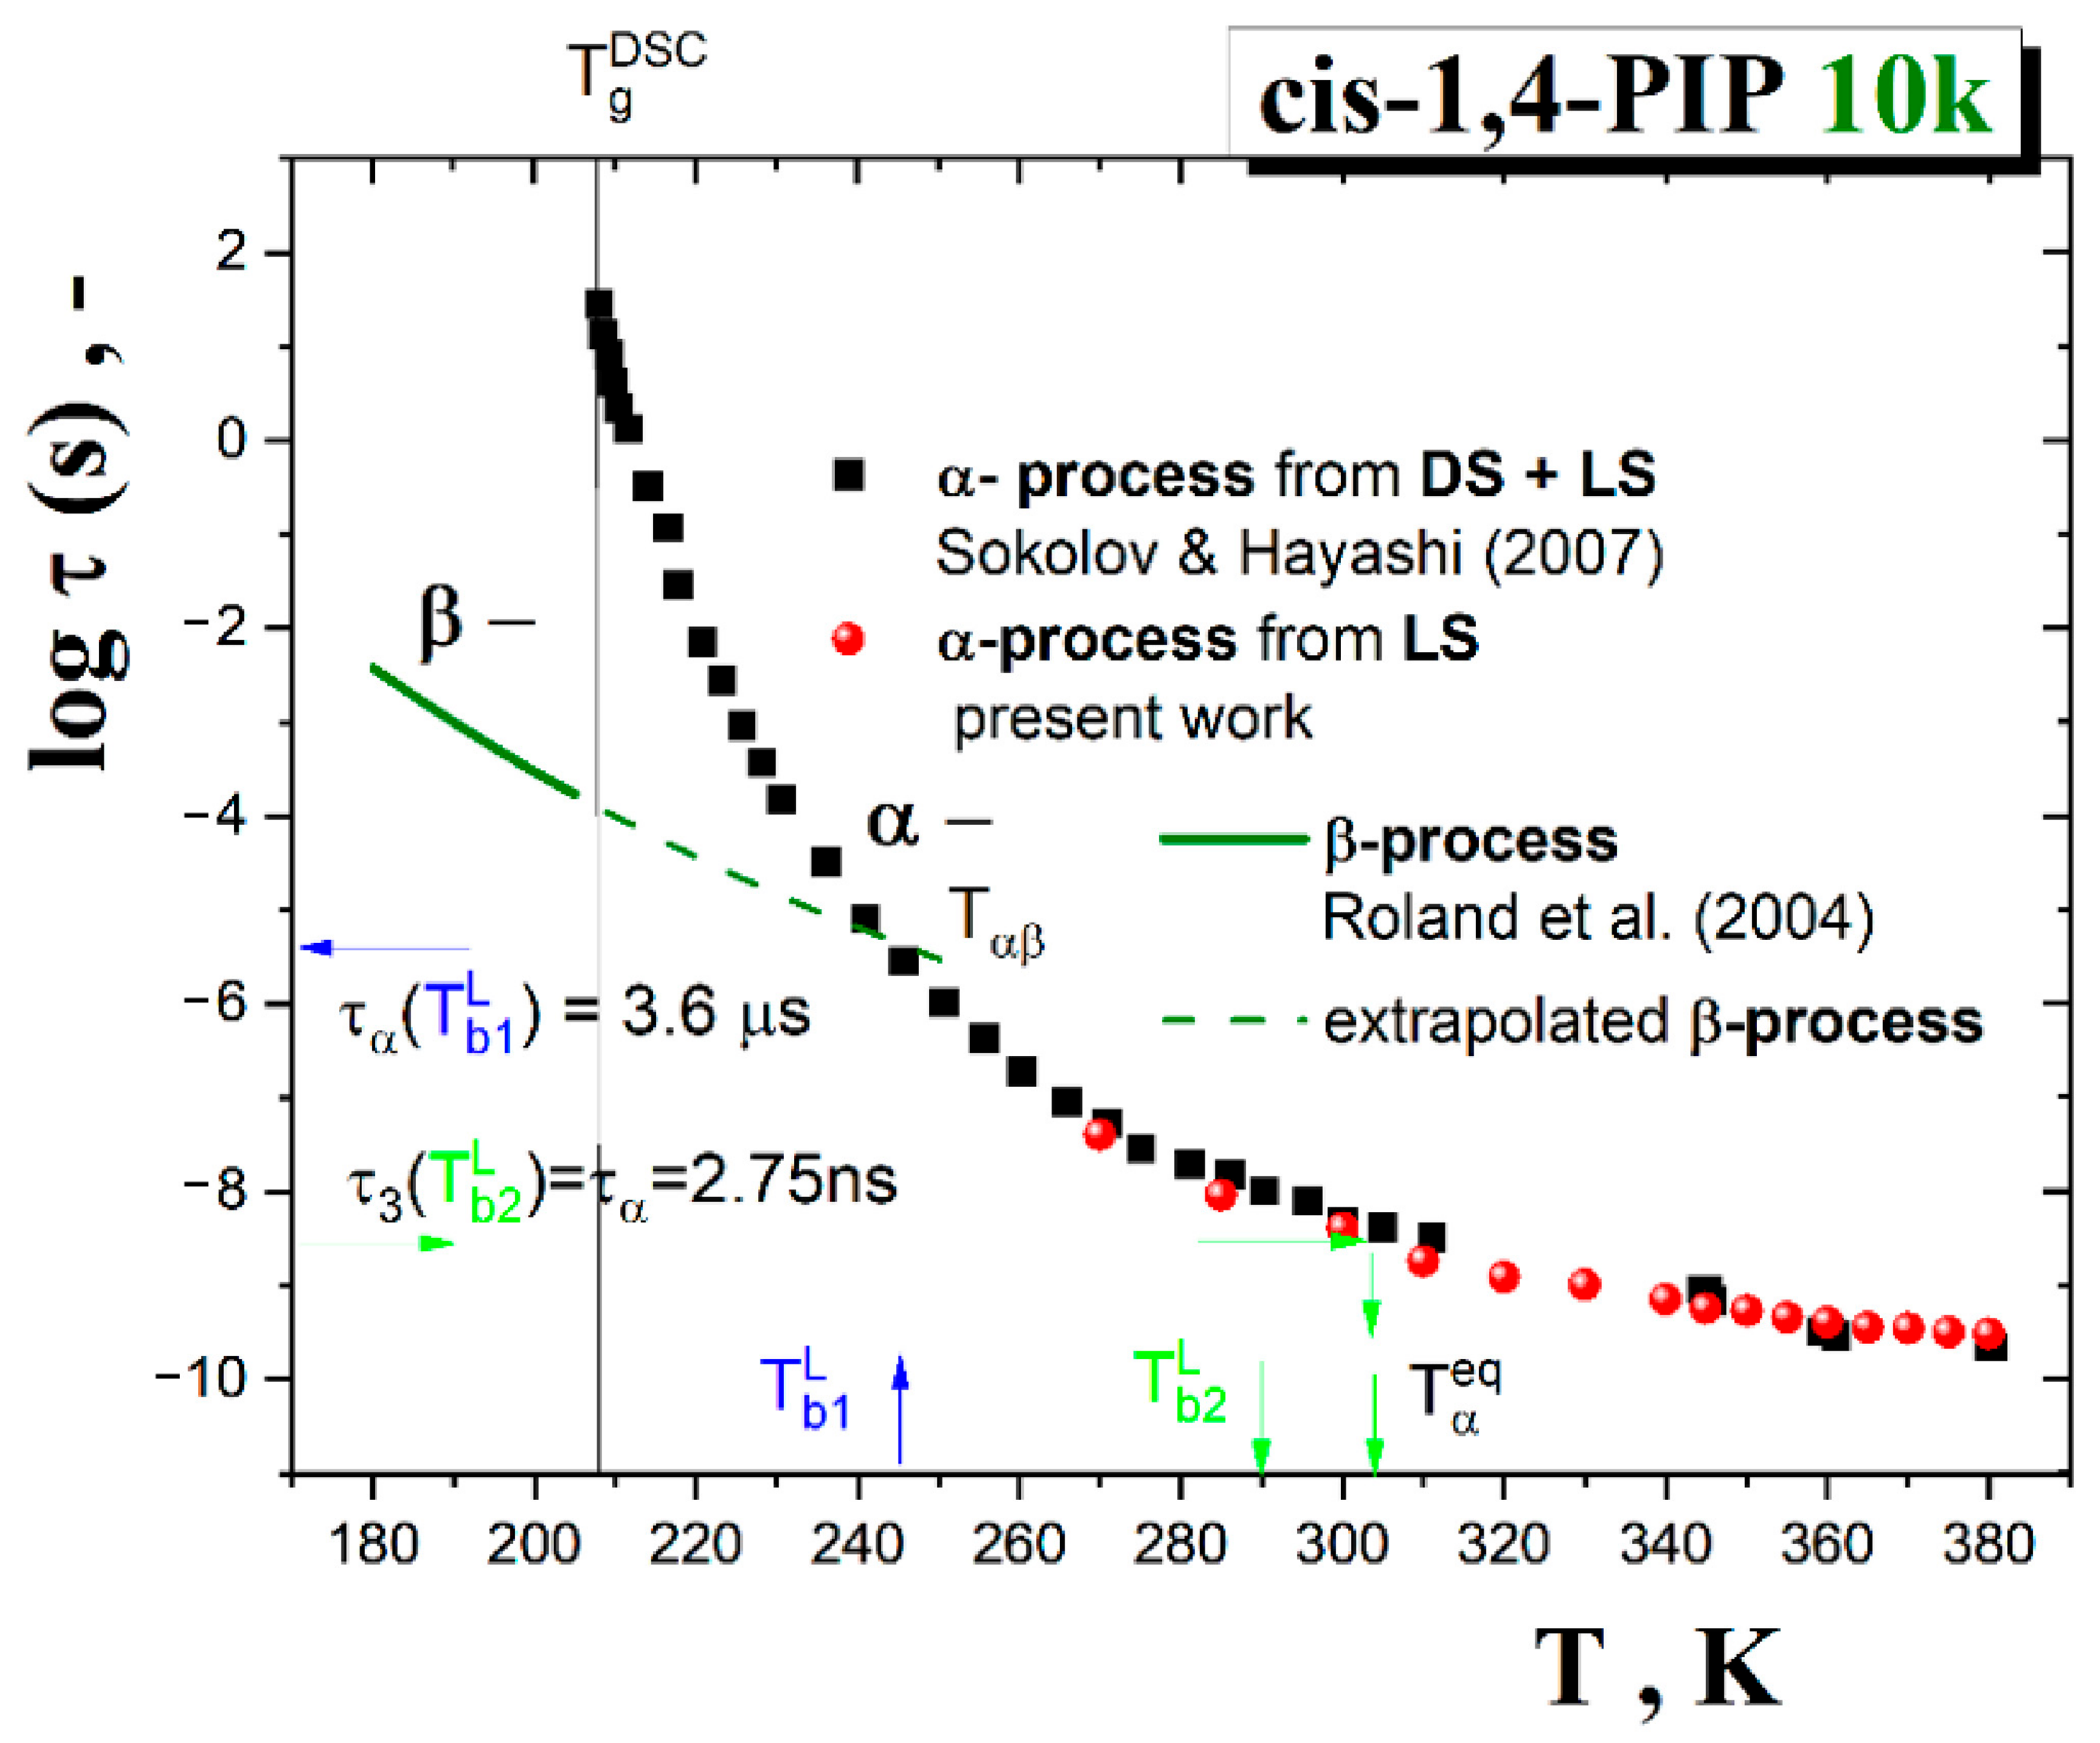
3.3.4. Segmental α Relaxation of cis-1,4-PIP10k in Terms of the Power Law (PL) Function or Mode Coupling Theory (MCT) Model and the Two-Order Parameter (TOP) Model
4. Discussion
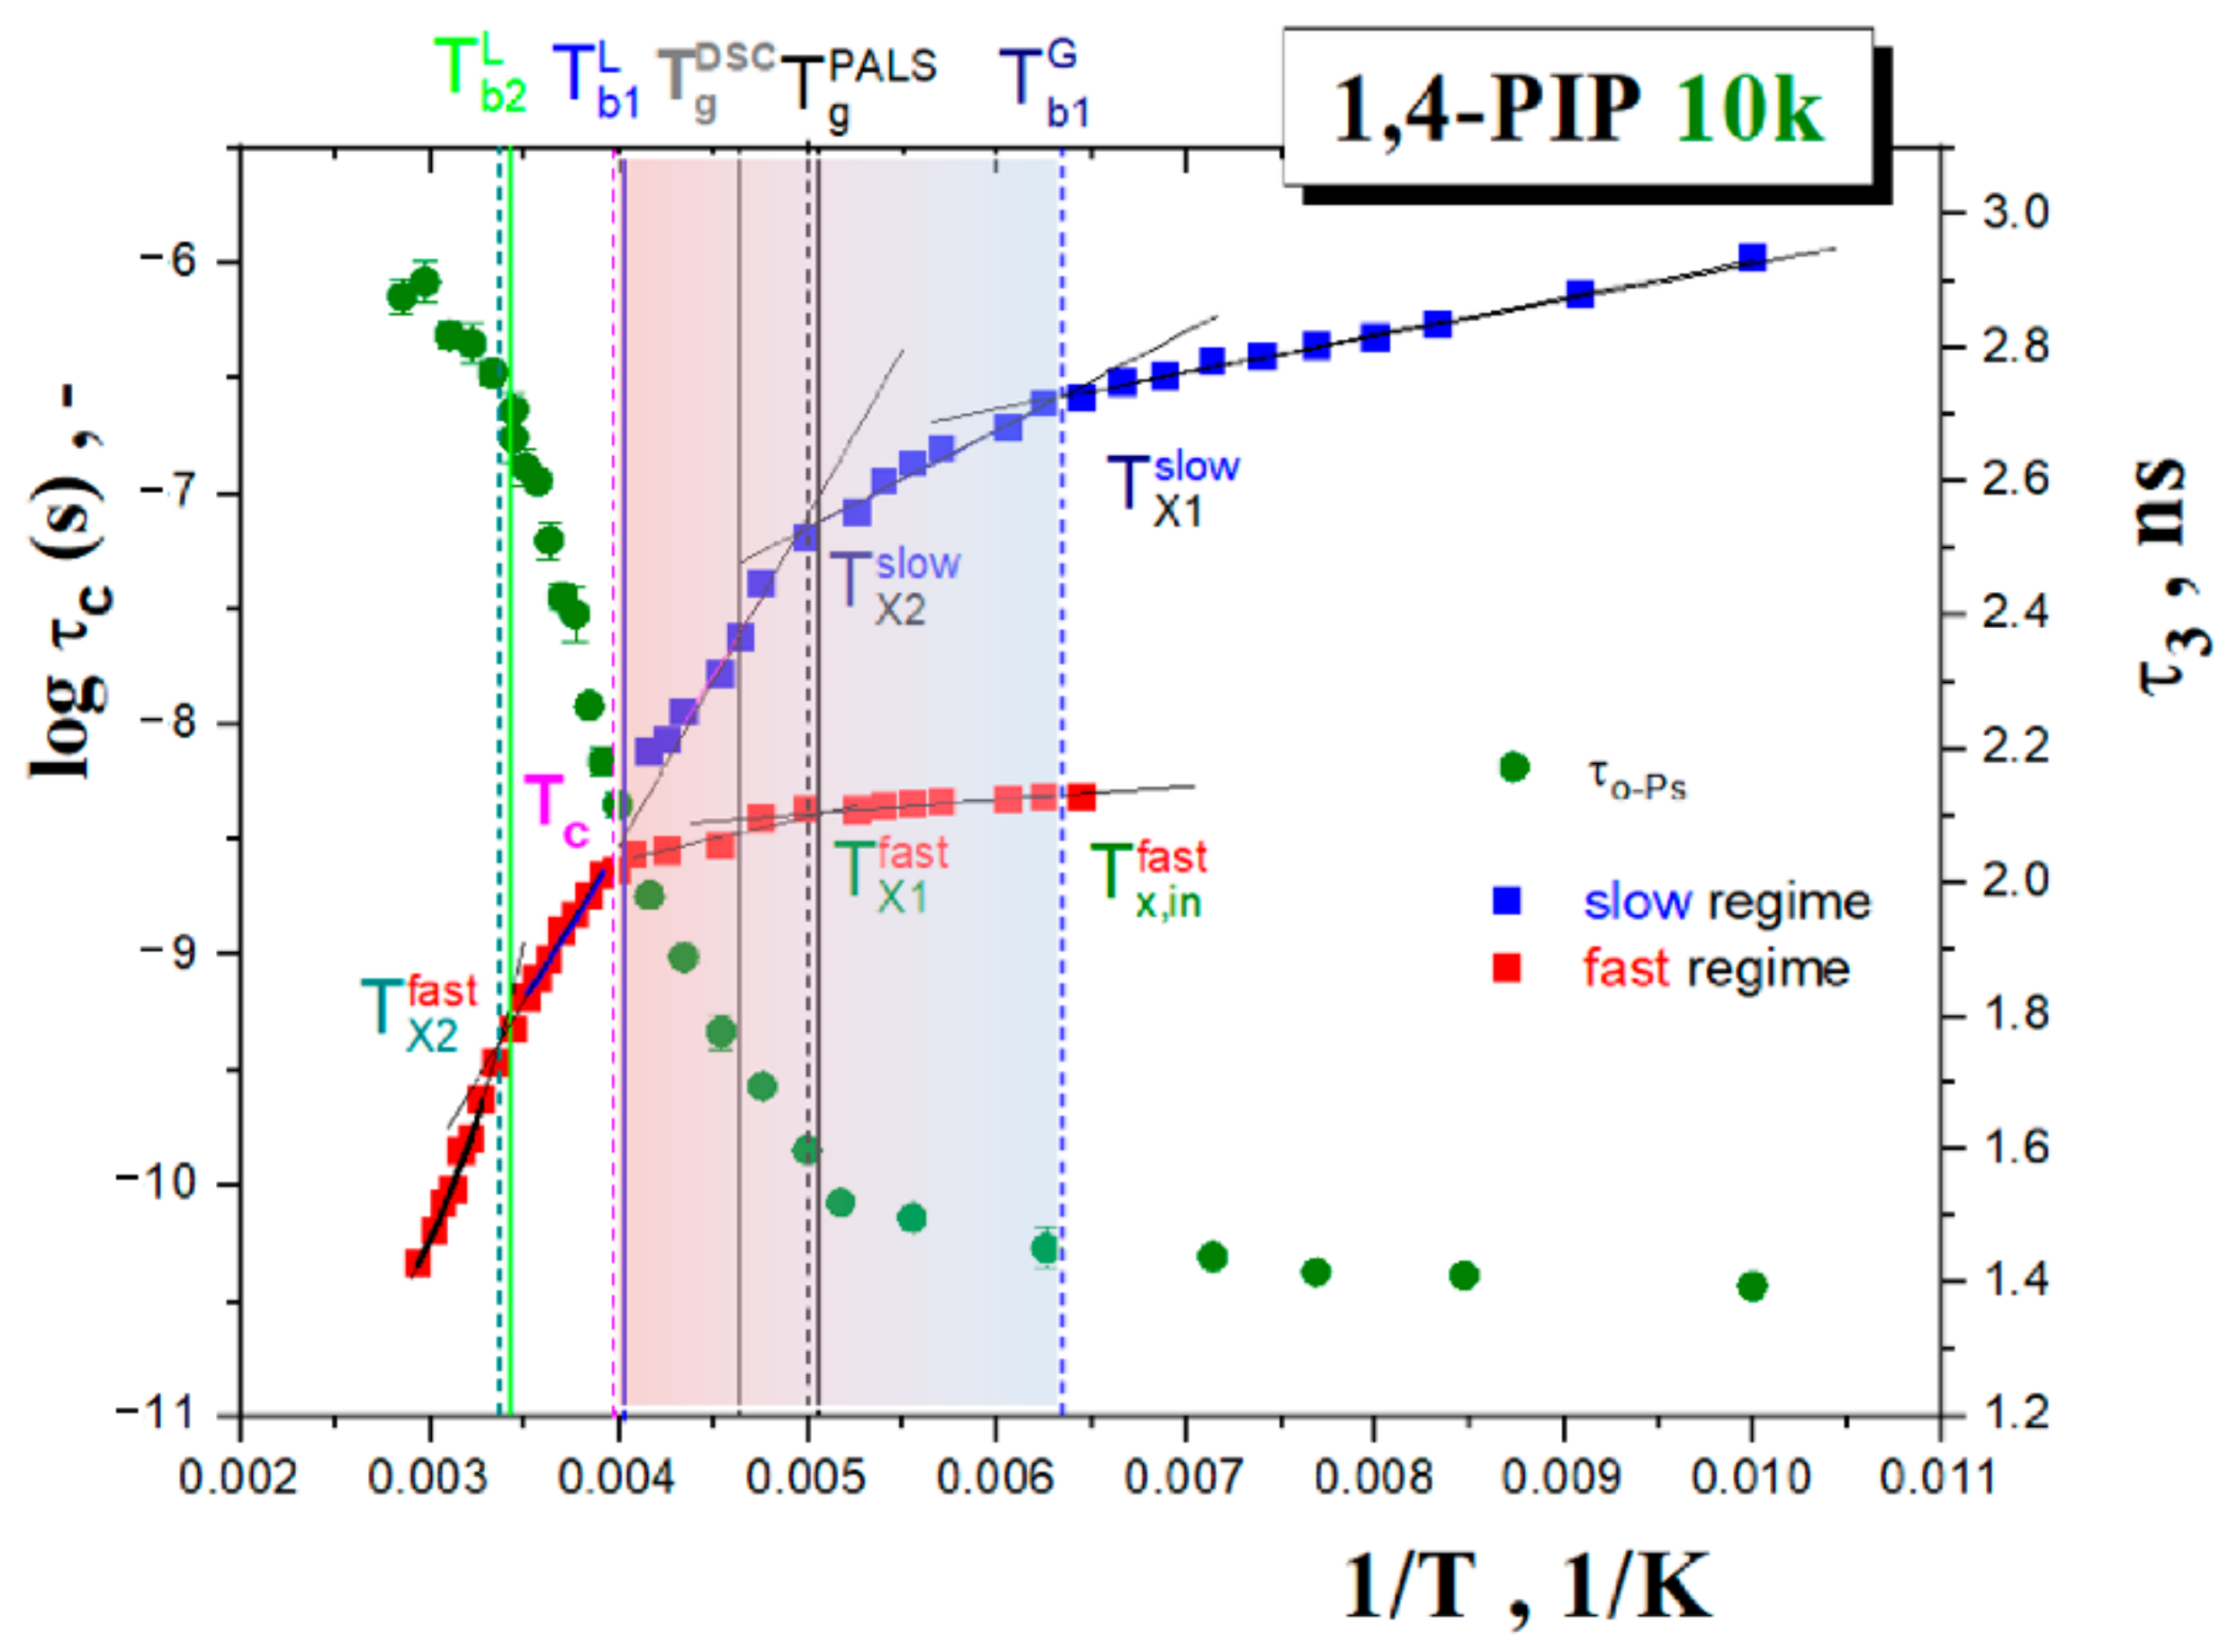
4.1. ESR vs. PALS Data Comparison in Terms of 2Azz′ vs. τ3 and τc vs. τ3
4.2. Comparison of ESR and PALS Responses for Polymeric cis-1,4-PIP10k vs. Oligomeric cis-1,4-PIP0.8k
4.3. Relationships between the Time Scales from ESR and BDS, LS and Further Dynamic Techniques
5. Conclusions
Author Contributions
Funding
Institutional Review Board Statement
Informed Consent Statement
Data Availability Statement
Acknowledgments
Conflicts of Interest
References
- Angell, C.A.; Ngai, K.L.; McKenna, G.B.; McMillan, P.F.; Martin, S.W. Relaxation in glassforming liquids and amorphous solids. J. Appl. Phys. 2000, 88, 3113–3157. [Google Scholar] [CrossRef] [Green Version]
- Ediger, M.D.; Harrowell, P. Perspective: Supercooled liquids and glasses. J. Chem. Phys. 2012, 137, 080901. [Google Scholar] [CrossRef] [PubMed] [Green Version]
- Stillinger, F.H.; Debenedetti, P.G. Glass transition thermodynamics and kinetics. Annu. Rev. Condens. Matter Phys. 2013, 4, 263–285. [Google Scholar] [CrossRef] [Green Version]
- Biroli, G.; Garrahan, J.P. Perspective: The glass transition. J. Chem. Phys. 2013, 138, 12A301. [Google Scholar] [CrossRef]
- Frick, B.D.; Richter, D.; Ritter, C. Structural changes near the glass transition-neutron diffraction on a simple polymer. Europhys. Lett. 1989, 9, 557–562. [Google Scholar] [CrossRef]
- Eckstein, E.; Qian, J.; Hentschke, R.; Thurn-Albrecht, T.; Steffen, W.; Fischer, E.W. X-ray scattering study and molecular simulation of glass forming liquids: Propylene carbonate and salol. J. Chem. Phys. 2000, 113, 4751–4762. [Google Scholar] [CrossRef]
- Colmenero, J.; Arbe, A. Recent progress on polymer dynamics by neutron scattering: From simple polymers to complex materials. J. Polym. Sci. B Polym. Phys. 2013, 51, 87–113. [Google Scholar] [CrossRef] [Green Version]
- Richter, D.; Monkenbusch, M.; Arbe, A.; Colmenero, J. Neutron Spin Echo in Polymer Systems; Springer: Berlin/Heidelberg, Germany, 2005; Volume 174, pp. 1–221. [Google Scholar]
- Zorn, R. Microscopic dynamics of glass-forming polymers. J. Phys. Condens. Matter 2003, 15, R1025–R1046. [Google Scholar] [CrossRef]
- Berne, B.J.; Pecora, R. Dynamic Light Scattering; John Wiley: New York, NY, USA, 1976. [Google Scholar]
- Kruk, D.; Herrmann, A.; Rössler, E.A. Field-cycling NMR relaxometry of viscous liquids and polymers. Prog. Nucl. Magn. Reson. Spectrosc. 2012, 63, 33–64. [Google Scholar] [CrossRef]
- Lunkenheimer, P.; Köhler, M.; Kastner, S.; Loidl, A. Dielectric Spectroscopy of Glassy Dynamics. In Structural Glasses and Supercooled Liquids: Theory, Experiment, and Applications; Wolynes, P.G., Lubchenko, V., Eds.; John Wiley & Sons: Hoboken, NJ, USA, 2012; pp. 115–149. [Google Scholar]
- Kremer, F.; Schönhals, A. (Eds.) Broadband Dielectric Spectroscopy; Springer: Berlin/Heidelberg, Germany, 2003. [Google Scholar]
- Barlow, A.J.; Lamb, J.; Matheson, A.J. Viscous behavior of supercooled liquids. Proc. Roy. Soc. 1966, 292, 322–342. [Google Scholar]
- Schönhals, A.; Kremer, F.; Hofmann, A.; Fischer, E.W.; Schlösser, E. Anomalies in the scaling of the dielectric α-relaxation. Phys. Rev. Lett. 1993, 70, 34–3462. [Google Scholar] [CrossRef] [PubMed]
- Stickel, F.; Fischer, E.W.; Richert, R.J. Dynamics of glass-forming liquids. I. Temperature-derivative analysis of dielectric relaxation data. J. Chem. Phys. 1995, 102, 6251–6257. [Google Scholar]
- Schönhals, A. Evidence for a universal crossover behavior of the dynamic glass transition. Europhys. Lett. 2001, 56, 815–821. [Google Scholar] [CrossRef]
- Alegría, A.; Colmenero, J.; Mari, P.O.; Campbell, I.A. Dielectric investigation of the temperature dependence of the nonexponentiality of the dynamics of polymer melts. Phys. Rev. 1999, 59, 6888–6895. [Google Scholar]
- Leon, C.; Ngai, K.L. Rapidity of the change of the Kohlrausch exponent of the α-relaxation of glass-forming liquids at TB or Tβ and consequences. J. Phys. Chem. 1999, 103, 4045–4051. [Google Scholar] [CrossRef]
- Ngai, K.L.; Roland, M. Development of cooperativity in the local segmental dynamics of poly(vinylacetate): Synergy of thermodynamics and intermolecular coupling. Polymer 2002, 43, 567–573. [Google Scholar] [CrossRef]
- Berthier, L.; Biroli, G.; Bouchaud, J.-P.; Cipelletti, L.; van Saarloos, W. (Eds.) Dynamical Heterogeneities in Glasses, Colloids and Granular Materials; Oxford University Press: New York, NY, USA, 2011. [Google Scholar]
- Hutchison, C.; Bhattarai, A.; Wang, A.; Mohanty, U. Fluctuation Effects in the Adam–Gibbs Model of Cooperative Relaxation. J. Phys. Chem. B 2019, 123, 8086–8090. [Google Scholar] [CrossRef]
- Dlubek, G. Encyklopedia of Polymer Science and Technology; Siedel, A., Ed.; John Wiley & Sons: Hoboken, NJ, USA, 2008. [Google Scholar]
- Jean, Y.C.; Mallon, P.E.; Schrader, D.M. Principles and Application of Positron and Positronium Chemistry; World Scientific: Singapore, 2003. [Google Scholar]
- Veksli, Z.; Andreis, M.; Rakvin, B. ESR spectroscopy for the study of polymer heterogeneity. Progr. Polym. Sci. 2000, 25, 949–986. [Google Scholar] [CrossRef]
- Cameron, G.G. Comprehensive Polymer Science; Booth, C., Price, C., Eds.; Pergamon Press: Oxford, UK, 1989; Volume 1, p. 517. [Google Scholar]
- Berliner, L.J. Spin Labelling Theory and Applications; Academic Press: New York, NY, USA, 1976. [Google Scholar]
- Bartoš, J.; Šauša, O.; Bandžuch, P.; Zrubcová, J.; Krištiak, J. Free volume factor on supercooled liquid dynamics. J. Non-Cryst. Solids 2002, 307–310, 417–425. [Google Scholar]
- Švajdlenková, H.; Bartoš, J. Spin probe mobility in relation to free volume and relaxation dynamics of glass-formers: A series of spin probes in poly(isobutylene). J. Polym. Sci. Polym. Phys. 2009, 47, 1058–1068. [Google Scholar]
- Rabold, G.P. Spin-probe studies. II. Applications to polymer characterization. J. Polym. Sci. 1969, A 17, 1203–1223. [Google Scholar] [CrossRef]
- Bartoš, J.; Andreozzi, L.; Faetti, M.; Šauša, O.; Račko, D.; Krištiak, J. Free volume in poly(propylene glycol) and its relationships to spin probe reorientation. J. Non-Cryst. Solids 2006, 352, 4785–4789. [Google Scholar] [CrossRef]
- Švajdlenková, H.; Šauša, O.; Iskrová-Miklošovičová, M.; Majerník, V.; Krištiak, J.; Bartoš, J. On the relationships between guest molecular dynamics and free volume in a series of small molecular and polymer glass-formers. Chem. Phys. Lett. 2012, 539–540, 39–44. [Google Scholar] [CrossRef]
- Bartoš, J.; Šauša, O.; Krištiak, J.; Blochowicz, T.; Rössler, E. Free-volume microstructure of glycerol and its supercooled liquid-state dynamics. J. Phys. Cond. Matter 2001, 13, 11473–11484. [Google Scholar]
- Bartoš, J.; Šauša, O.; Račko, D.; Krištiak, J.; Fontanella, J.J. Positron annihilation lifetime response and relaxation dynamics in glycerol. J. Non-Cryst. Solids 2005, 351, 2599–2604. [Google Scholar]
- Bartoš, J.; Šauša, O.; Köhler, M.; Švajdlenková, H.; Lunkenheimer, P.; Krištiak, J.; Loidl, A. Positron annihilation and broadband dielectric spectroscopy: A series of propylene glycols. J. Non-Cryst. Solids 2011, 357, 376–384. [Google Scholar]
- Bartoš, J.; Šauša, O.; Cangialosi, D.; Alegria, A.; Švajdlenková, H.; Krištiak, J.; Arbe, A.; Colmenero, J. Positron annihilation and relaxation dynamics from dielectric spectroscopy: Poly (vinylmethylether). J. Phys. Cond. Matter 2012, 24, 155104. [Google Scholar]
- Bartoš, J.; Švajdlenková, H. On the mutual relationships between spin probe mobility, free volume and relaxation dynamics in organic glass-formers: Glycerol. Chem. Phys. Letts. 2017, 670, 58–63. [Google Scholar]
- Bartoš, J.; Švajdlenková, H.; Šauša, O.; Lukešová, M.; Ehlers, D.; Michl, M.; Lunkenheimer, P.; Loidl, A. Molecular probe dynamics and free volume in organic glass-formers and their relationships to structural relaxation: 1-propanol. J. Phys. Cond. Matter 2016, 28, 015101–015111. [Google Scholar]
- Švajdlenková, H.; Arrese-Igor, S.; Nógellová, Z.; Alegría, A.; Bartoš, J. Molecular dynamic heterogeneity in relation to free volume and relaxation dynamics in organic glass-formers: Oligomeric cis-1,4-poly(isoprene). Phys. Chem. Chem. Phys. 2017, 19, 15215–15226. [Google Scholar] [CrossRef] [Green Version]
- Švajdlenková, H.; Šauša, O.; Čechová, K.; Bartoš, J. Dynamic and free volum aspects of spin probe TEMPO in organic glass formers: Polymer cis-1,4-poly(isoprene). AIP Conf. Proc. 2018, 1981, 020056-1–020056-4. [Google Scholar]
- Budil, D.E.; Lee, S.; Saxena, A.S.; Freed, J.H. Nonlinear-least-squares analysis of slow-motion EPR spectra in one and two dimensions using a modified Levenberg-Marquardt algorithm. J. Magn. Reson. 1996, 120, 155–189. [Google Scholar] [CrossRef] [Green Version]
- Kansy, J. Microcomputer program for analysis of positron annihilation lifetime spectra. Nucl. Inst. and Methods Phys. Res. A 1996, 374, 235–244. [Google Scholar] [CrossRef]
- Tao, S.J. Positronium annihilation in molecular substrances. J. Chem. Phys. 1972, 56, 5499–5510. [Google Scholar] [CrossRef]
- Eldrup, M.; Lightbody, D.; Sherwood, J.N. The temperature dependence of positron lifetimes in solid pivalic acid. Chem. Phys. 1981, 63, 51–58. [Google Scholar] [CrossRef]
- Nakanishi, H.; Jean, Y.C.; Wang, S.J. Positron Annihilation Studies of Fluids; Sharma, S.C., Ed.; World Scientific: Singapore, 1988; p. 292. [Google Scholar]
- Consolati, G. Positronium trapping in small voids: Influence of their shape on positron annihilation results. J. Chem. Phys. 2002, 117, 7279–7283. [Google Scholar] [CrossRef]
- Consolati, G. On the thermal expansion of nanohole free volume in perfluoropolyethers. J. Phys. Chem. 2005, 109, 10096–10099. [Google Scholar] [CrossRef]
- Consolati, G. Temperature dependence of holes free volume in polypropylene glycols. Appl. Phys. Letts. 2006, 88, 111902. [Google Scholar] [CrossRef]
- Bradac, C.; Consolati, G.; Quasso, S. Temperature dependence of free volume in atactic polypropylene. Eur. Polym. J. 2009, 45, 3010–3015. [Google Scholar] [CrossRef]
- Sokolov, A.P.; Hayashi, Y. Breakdown of time-temperature superposition: From experiment to the coupling model and beyond. J. Non-Cryst. Solids 2007, 353, 3838–3844. [Google Scholar] [CrossRef]
- Havriliak, S.; Negami, S. A complex plane representation of dielectric and mechanical relaxation processes in some polymers. Polymer 1967, 8, 161–210. [Google Scholar] [CrossRef]
- Havriliak, S.; Negami, S. A complex plane analysis of α-dispersions in some polymer systems. J. Polym. Sci. C Polym. Symp. 1966, 14, 99–117. [Google Scholar] [CrossRef]
- Surovtsev, N.V. Suppression of spurious background in low-frequency Raman spectroscopy. Optoelectron. Instrum. Data Process. 2017, 53, 250–254. [Google Scholar] [CrossRef]
- Surovtsev, N.V.; Wiedersich, J.A.H.; Novikov, V.N.; Rössler, E.; Sokolov, A.P. Light-scattering spectra of fast relaxation in glasses. Phys. Rev. 1998, 58, 14888–14891. [Google Scholar] [CrossRef]
- Barshilia, H.C.; Li, G.; Shen, G.Q.; Cummins, H.Z. Depolarized light scattering spectroscopy of Ca0.4K0.6(NO3)1.4: A reexmination of the “knee”. Phys. Rev. E 1999, 59, 5625–5628. [Google Scholar]
- Popova, V.A.; Surovtsev, S.V. Transition from Arrhenius to non-Arrhenius temperature dependence of structural relaxation time in glass-forming liquids: Continuous versus discontinuous scenario. Phys. Rev. 2014, 90, 032308-1–032308-8. [Google Scholar] [CrossRef]
- Vogel, H. Das Temperaturabhaengigkeitsgesetz der Viskositaet von Fluessigkeiten. Phys. Z. 1921, 22, 645. [Google Scholar]
- Fulcher, G.S. Analysis of recent measurements of the viscosity of glasses. J. Am. Ceram. Soc. 1925, 8, 339–355. [Google Scholar] [CrossRef]
- Tamman, G.; Hesse, W. Die abhängigkeit der viscosität von der temperatur bie unterkühlten Flüssigkeiten. Z. Anorg. Allg. Chem. 1926, 156, 245–257. [Google Scholar] [CrossRef]
- Davidson, D.W.; Cole, R.H. Dielectric relaxation in glycerol, propylene glycol, and n-propanol. J. Chem. Phys. 1951, 19, 1484–1490. [Google Scholar] [CrossRef]
- Böttcher, C.J.F.; Bordewijk, P. Theory of Electric Polarization; Elsevier: Amsterdam, The Netherlands, 1978. [Google Scholar]
- Gilroy, K.S.; Phillips, W.A. An asymmetric double-well potential model for structural relaxation processes in amorphous materials. Philos. Mag. B 1981, 43, 735–746. [Google Scholar] [CrossRef]
- Adichtchev, S.V.; Surovtsev, N.V.; Wiedersich, J.; Brodin, A.; Novikov, V.N.; Rössler, E.A. Fast relaxation processes in glasses as revealed by depolarized light scattering. J. Non-Cryst. Solids 2007, 353, 1491–1500. [Google Scholar] [CrossRef]
- Malinovsky, V.K.; Novikov, V.N.; Sokolov, A.P. Log-normal spectrum of low-energy vibrational excitations in glasses. Phys. Lett. 1991, 153, 63–66. [Google Scholar] [CrossRef]
- Götze, W. Recent tests of the mode-coupling theory for glassy dynamics. J. Phys. Cond. Matter 1999, 11, A1. [Google Scholar] [CrossRef]
- Götze, W.; Sjögren, L. Relaxation processes in supercooled liquids. Rep. Progr. Phys. 1992, 55, 241–376. [Google Scholar]
- Taborek, T.; Kleinman, R.N.; Bishop, D.J. Power-law behavior in the viscosity of supercooled liquids. Phys. Rev. 1986, 34, 1835–1840. [Google Scholar] [CrossRef]
- Tanaka, H. Two-order-parameter model of the liquid-glass transition. I. relation between glass transition and crystallization. J. Non-Cryst. Solids 2005, 351, 3371–3384. [Google Scholar] [CrossRef]
- Tanaka, H. Two-order-parameter model of the liquid-glass transition. II. structural relaxation and dynamic heterogeneity. J. Non-Cryst. Solids 2005, 351, 3385–3395. [Google Scholar] [CrossRef]
- Tanaka, H. Two-order-parameter model of the liquid-glass transition. III. Universal patterns of relaxations in glass-forming liquids. J. Non-Cryst. Solids 2005, 351, 3396–3413. [Google Scholar] [CrossRef]
- Mallamace, F.; Bra, C.; Corsaro, C.; Leone, N.; Spooren, J.; Chen, S.H.; Stanley, H.E. Transport properties of glass-forming liquids suggest that dynamic crossover temperature is as important as the glass transition temperature. Proc. Natl. Acad. Sci. USA 2010, 107, 22457–22462. [Google Scholar] [CrossRef] [Green Version]
- Mallamace, F.; Corsaro, C.; Stanley, H.E.; Chen, S.H. The Role of the Dynamical Crossover Temperature and the Arrest in Glass Forming Fluids. Eur. Phys. J. E 2011, 34, 94–105. [Google Scholar]
- Winberg, P.; Eldrup, M.; Maurer, F.H. Free volume dilatation in polymers by ortho-positronium. J. Chem. Phys. 2012, 136, 244902-1–244902-6. [Google Scholar] [CrossRef] [PubMed] [Green Version]
- Roland, C.M.; Schroeder, M.J.; Fontanella, J.J.; Ngai, K. Evolution of the dynamics in 1,4-polyisoprene from a nearly constant loss to a Johari-Goldstein β-relaxation to the α-relaxation. Macromolecules 2004, 37, 2630–2635. [Google Scholar] [CrossRef]
- Zorn, R.; Frick, B.; Fetters, L.J. Quasielastic neutron scattering study of the methyl group dynamics in polyisoprene. J. Chem. Phys. 2002, 116, 845–853. [Google Scholar] [CrossRef] [Green Version]


| Region | ΔT, K | τ∞,i, s | Ei*, kJ/mol | r |
|---|---|---|---|---|
| Aslow | 100–150 | (2.52 ± 0.94) × 10−8 | 3.1 ± 0.1 | 0.998 |
| Bslow,1 | 155–200 | (5.53 ± 0.65) × 10−10 | 8.1 ± 0.6 | 0.958 |
| Bslow,2 | 210–240 | (2.06 ± 0.33) × 10−14 | 25.1 ± 2.1 | 0.973 |
| Bfast,1 | 155–200 | (2.55 ± 0.93) × 10−9 | 0.8 ± 0.1 | 0.958 |
| Bfast,2 | 210–245 | (2.99 ± 0.63) × 10−10 | 4.3 ± 0.7 | 0.944 |
| Cfast,1 | 255–284 | (1.58 ± 0.65) × 10−14 | 25.2 ± 1.0 | 0.990 |
| Cfast,2 | 305–340 | (7.67 ± 0.18) × 10−13 |
| T, K | C | a | D | b | ν0, GHz | ABP | νBP, GHz | σ | δ2 = Sfast/SBP |
|---|---|---|---|---|---|---|---|---|---|
| 200 | 54 | 0.2 | 25 | 1 | 103 | 0.44 | 434 | 1.38 | 0.052 |
| 220 | 76 | 0.2 | 22.7 | 1 | 87.4 | 0.49 | 353 | 1.5 | 0.044 |
| 240 | 132 | 0.22 | 18.7 | 1 | 61 | 0.56 | 299 | 1.55 | 0.035 |
| 270 | 297 | 0.3 | 29.7 | 1 | 69.8 | 0.69 | 226 | 1.68 | 0.049 |
| 285 | 490 | 0.39 | 54.6 | 1 | 42 | 0.83 | 176 | 1.8 | 0.081 |
| 300 | 655 | 0.37 | 46.7 | 1 | 77.3 | 0.79 | 183 | 1.76 | 0.075 |
| 310 | 916 | 0.39 | 25.4 | 1 | 96 | 0.89 | 157 | 1.78 | 0.041 |
Publisher’s Note: MDPI stays neutral with regard to jurisdictional claims in published maps and institutional affiliations. |
© 2021 by the authors. Licensee MDPI, Basel, Switzerland. This article is an open access article distributed under the terms and conditions of the Creative Commons Attribution (CC BY) license (http://creativecommons.org/licenses/by/4.0/).
Share and Cite
Švajdlenková, H.; Šauša, O.; Adichtchev, S.V.; Surovtsev, N.V.; Novikov, V.N.; Bartoš, J. On the Mutual Relationships between Molecular Probe Mobility and Free Volume and Polymer Dynamics in Organic Glass Formers: cis-1,4-poly(isoprene). Polymers 2021, 13, 294. https://0-doi-org.brum.beds.ac.uk/10.3390/polym13020294
Švajdlenková H, Šauša O, Adichtchev SV, Surovtsev NV, Novikov VN, Bartoš J. On the Mutual Relationships between Molecular Probe Mobility and Free Volume and Polymer Dynamics in Organic Glass Formers: cis-1,4-poly(isoprene). Polymers. 2021; 13(2):294. https://0-doi-org.brum.beds.ac.uk/10.3390/polym13020294
Chicago/Turabian StyleŠvajdlenková, Helena, Ondrej Šauša, Sergey V. Adichtchev, Nikolay V. Surovtsev, Vladimir N. Novikov, and Josef Bartoš. 2021. "On the Mutual Relationships between Molecular Probe Mobility and Free Volume and Polymer Dynamics in Organic Glass Formers: cis-1,4-poly(isoprene)" Polymers 13, no. 2: 294. https://0-doi-org.brum.beds.ac.uk/10.3390/polym13020294