
Flexural Fatigue in a Polymer Matrix Composite Material Reinforced with Continuous Kevlar Fibers Fabricated by Additive Manufacturing
 , ,
, ,
Abstract
:1. Introduction
2. Background
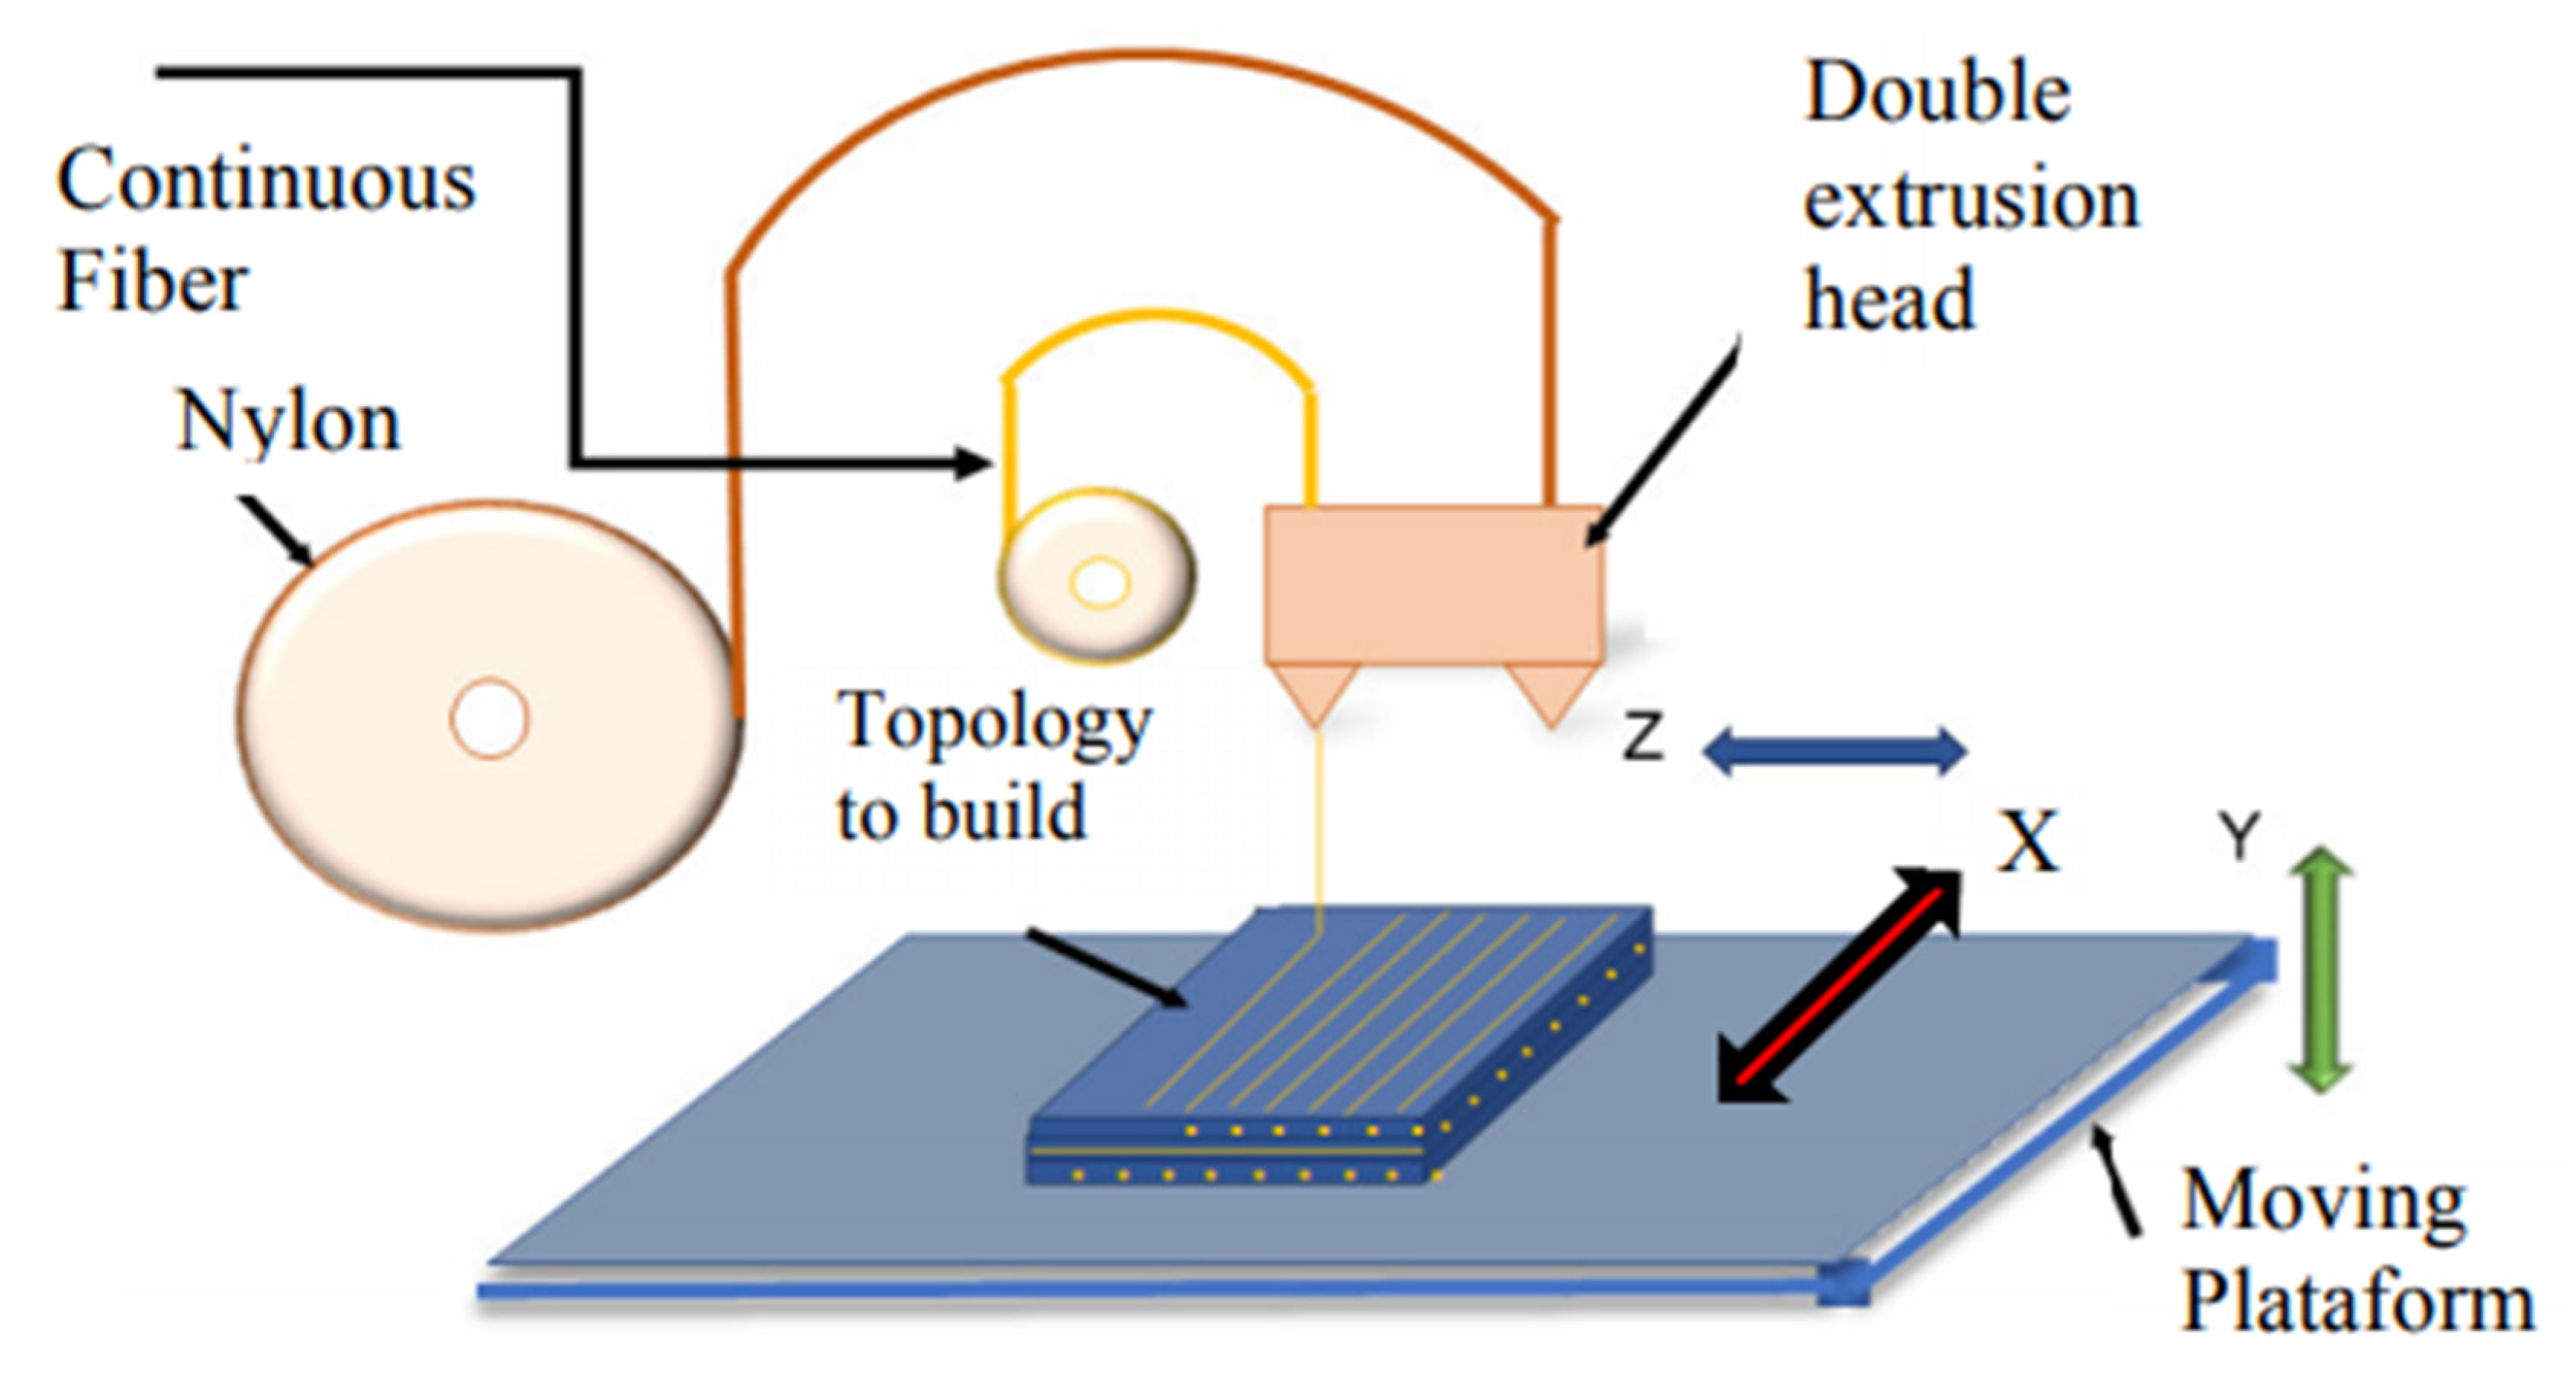
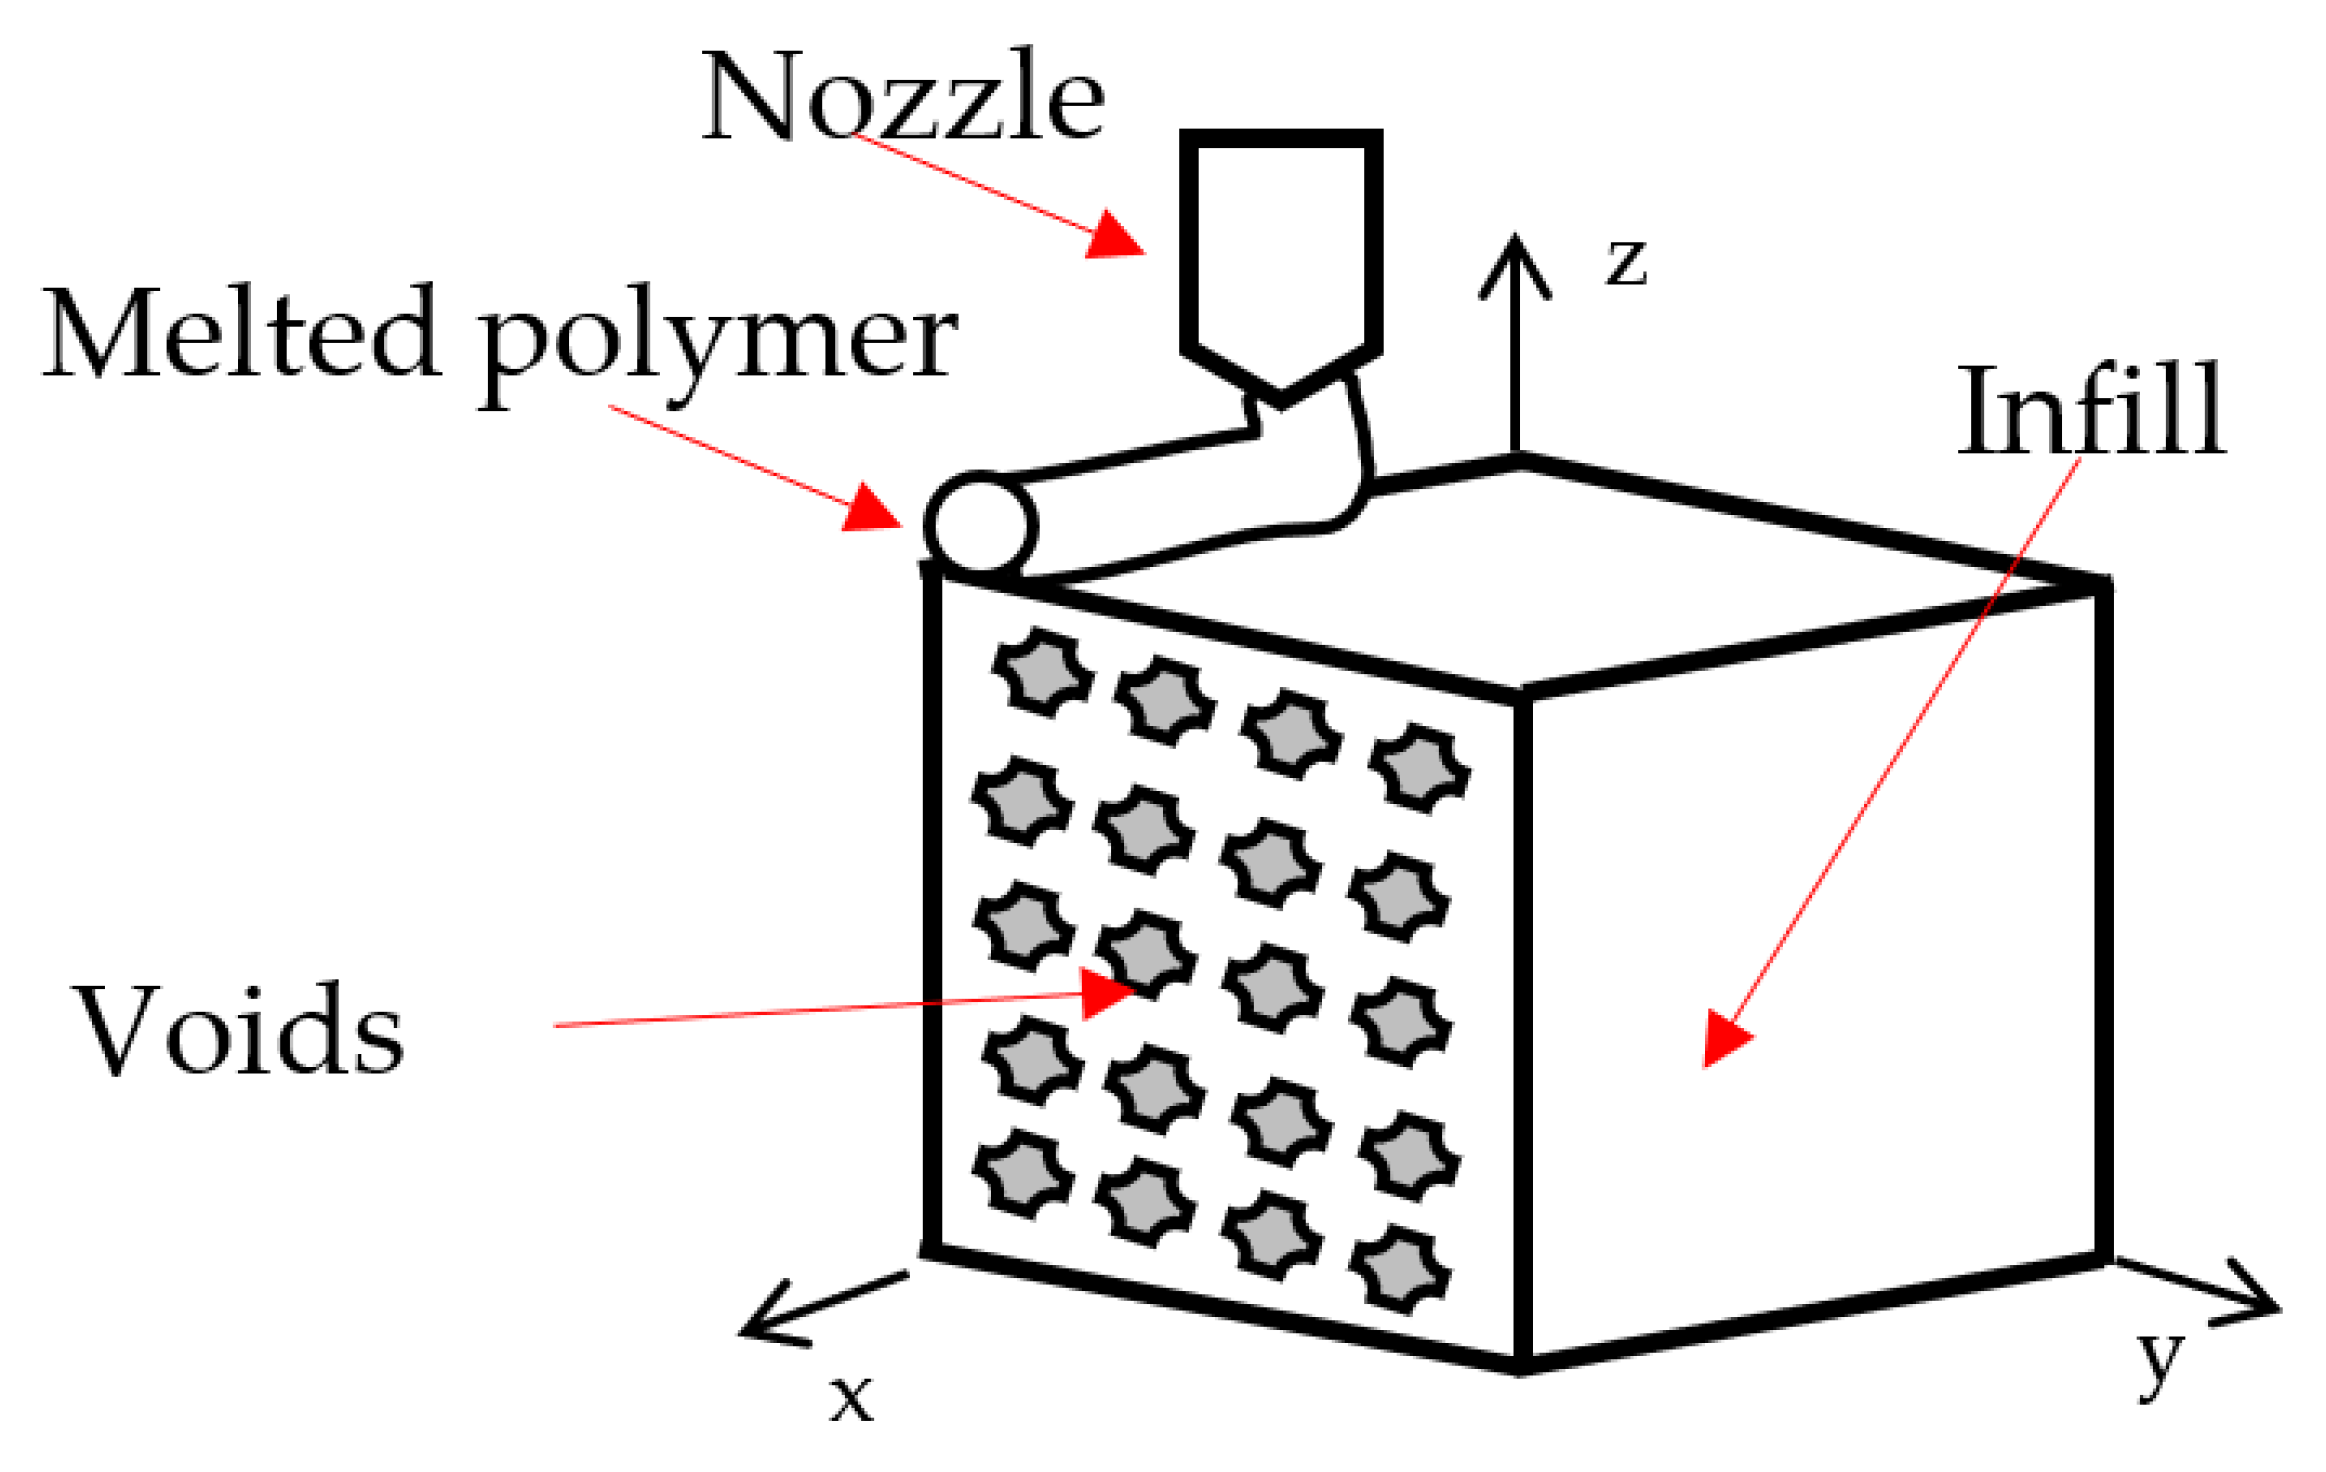
2.1. Additive Manufacturing
2.2. Fatigue
3. Materials and Methods
3.1. Static Test
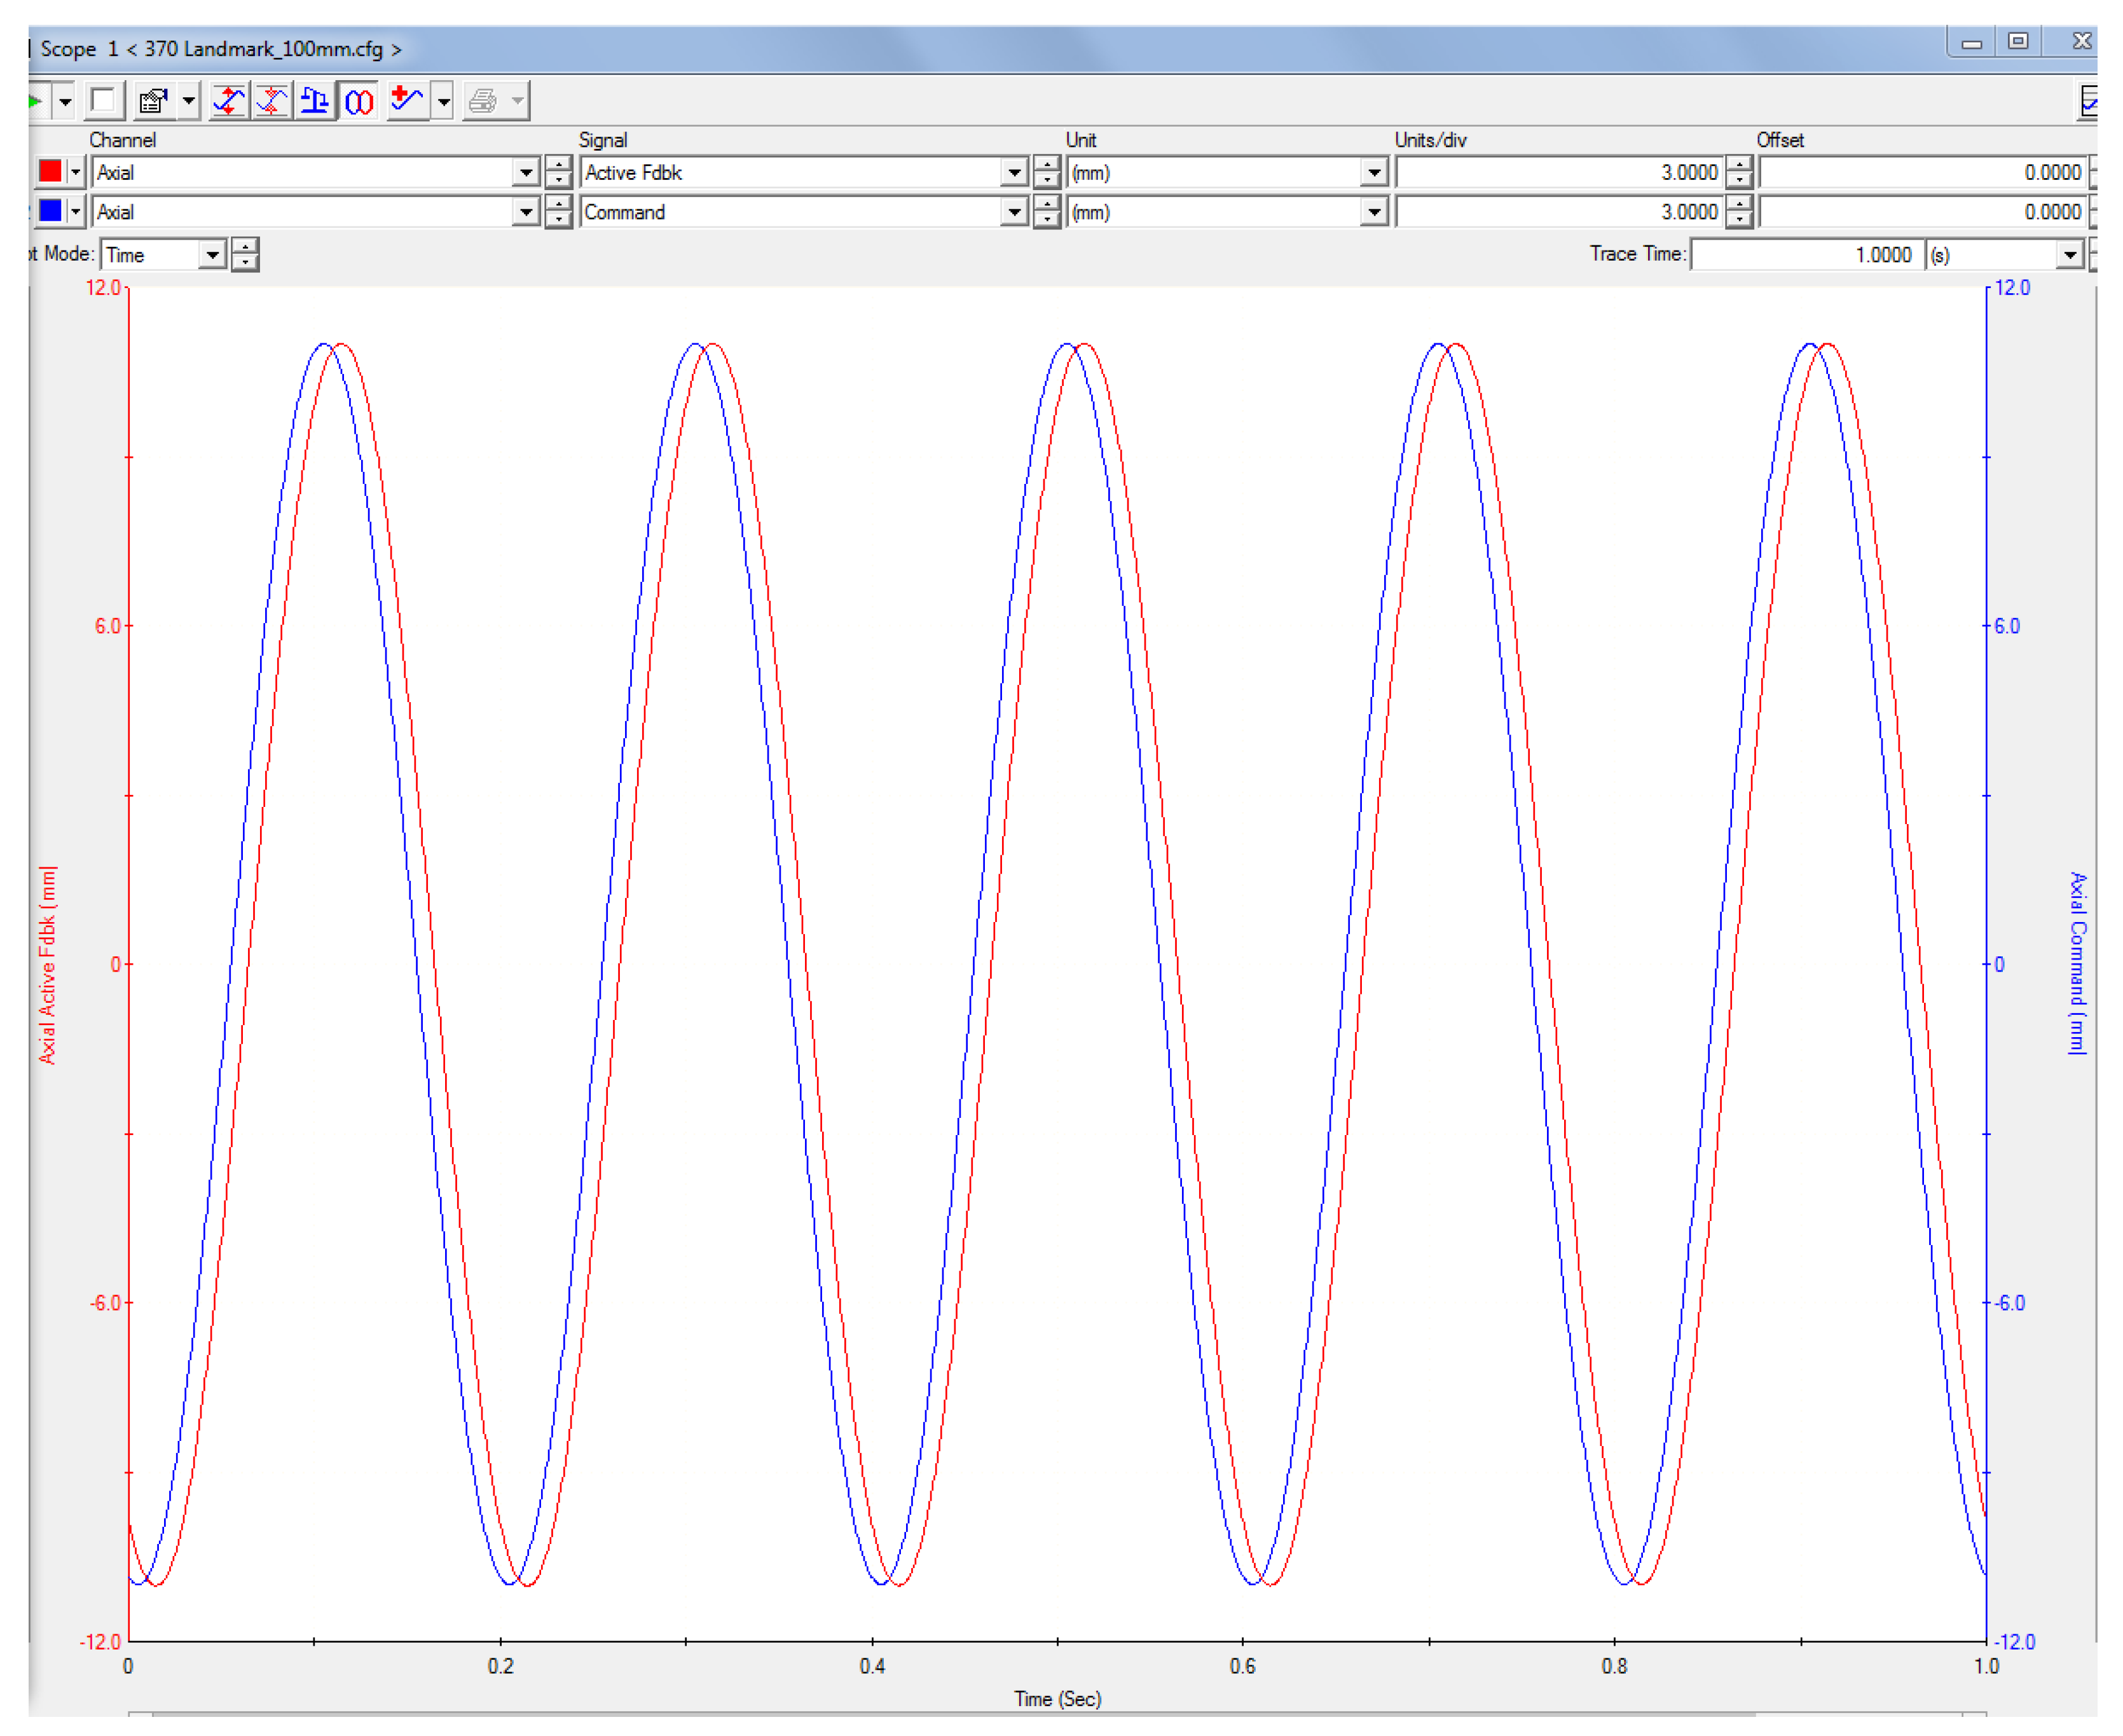
3.2. Fatigue Tests
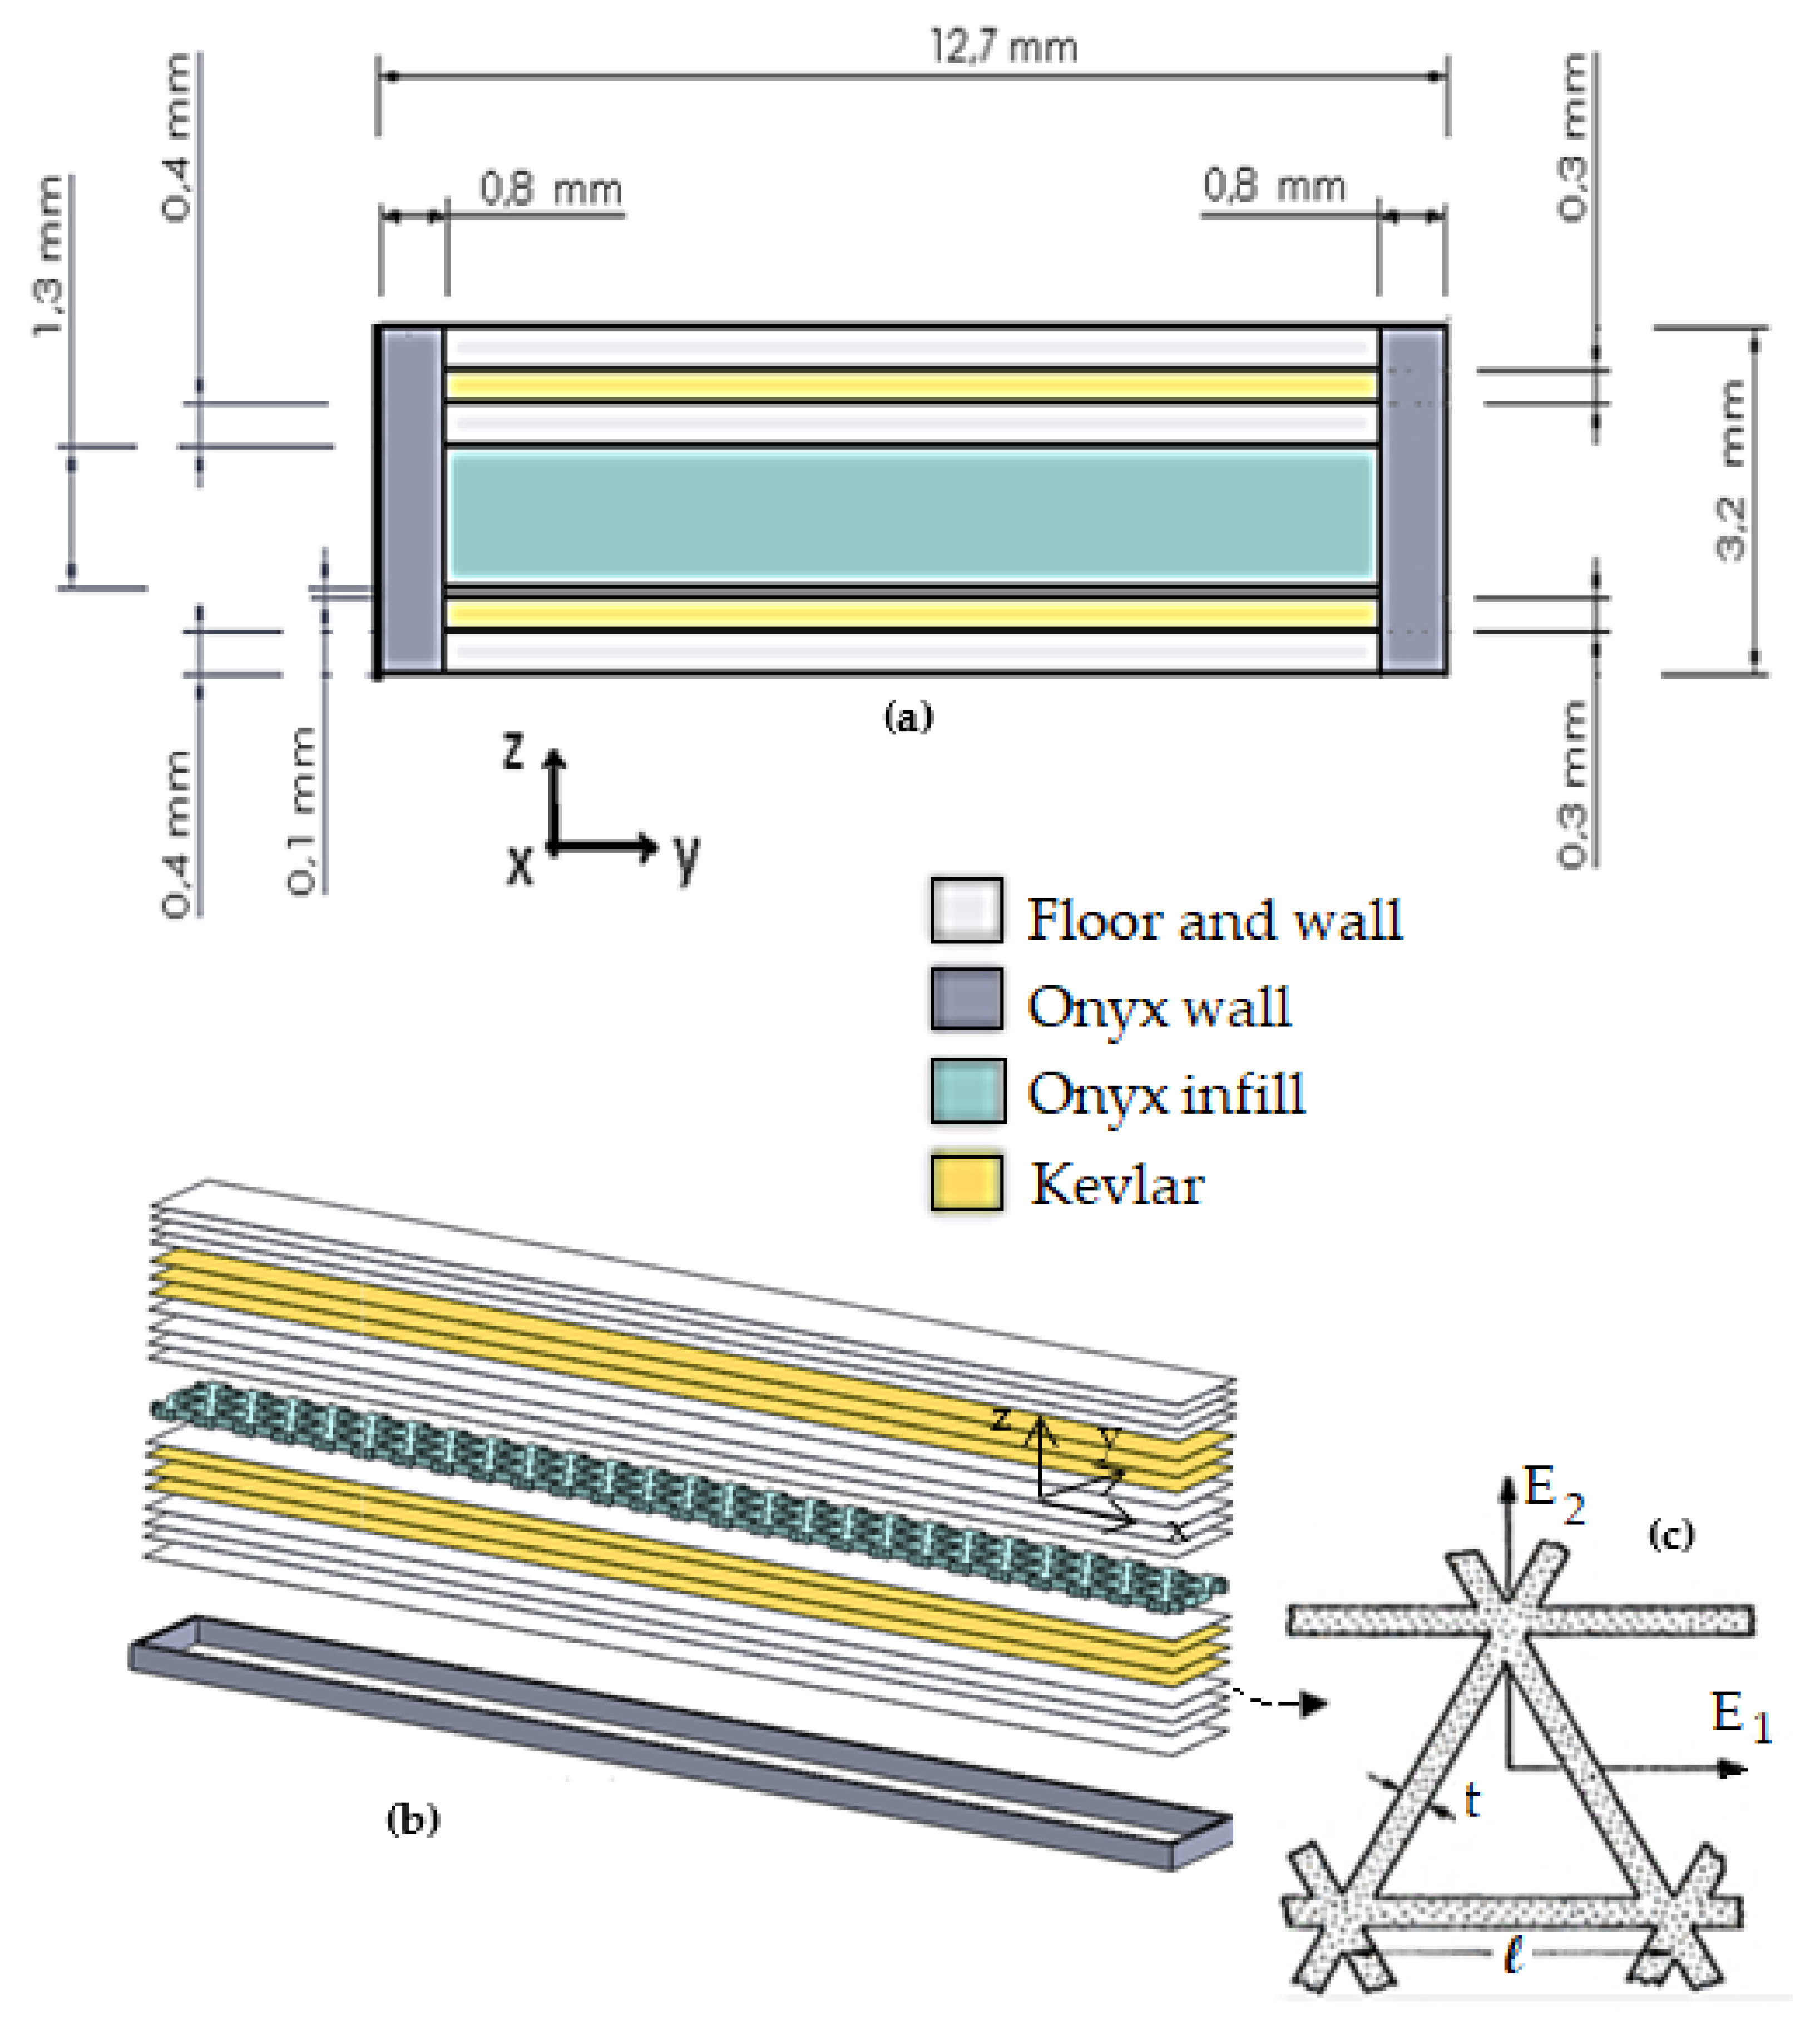
3.3. Numerical Modeling
3.4. Microscopy
4. Mechanical Properties Estimation
4.1. Triangular Fill Properties Estimation
4.2. Solid Onyx Region Properties Estimation
4.3. Estimation of the Properties for the Continuous Fiber-Reinforced Regions
5. Results and Discussion
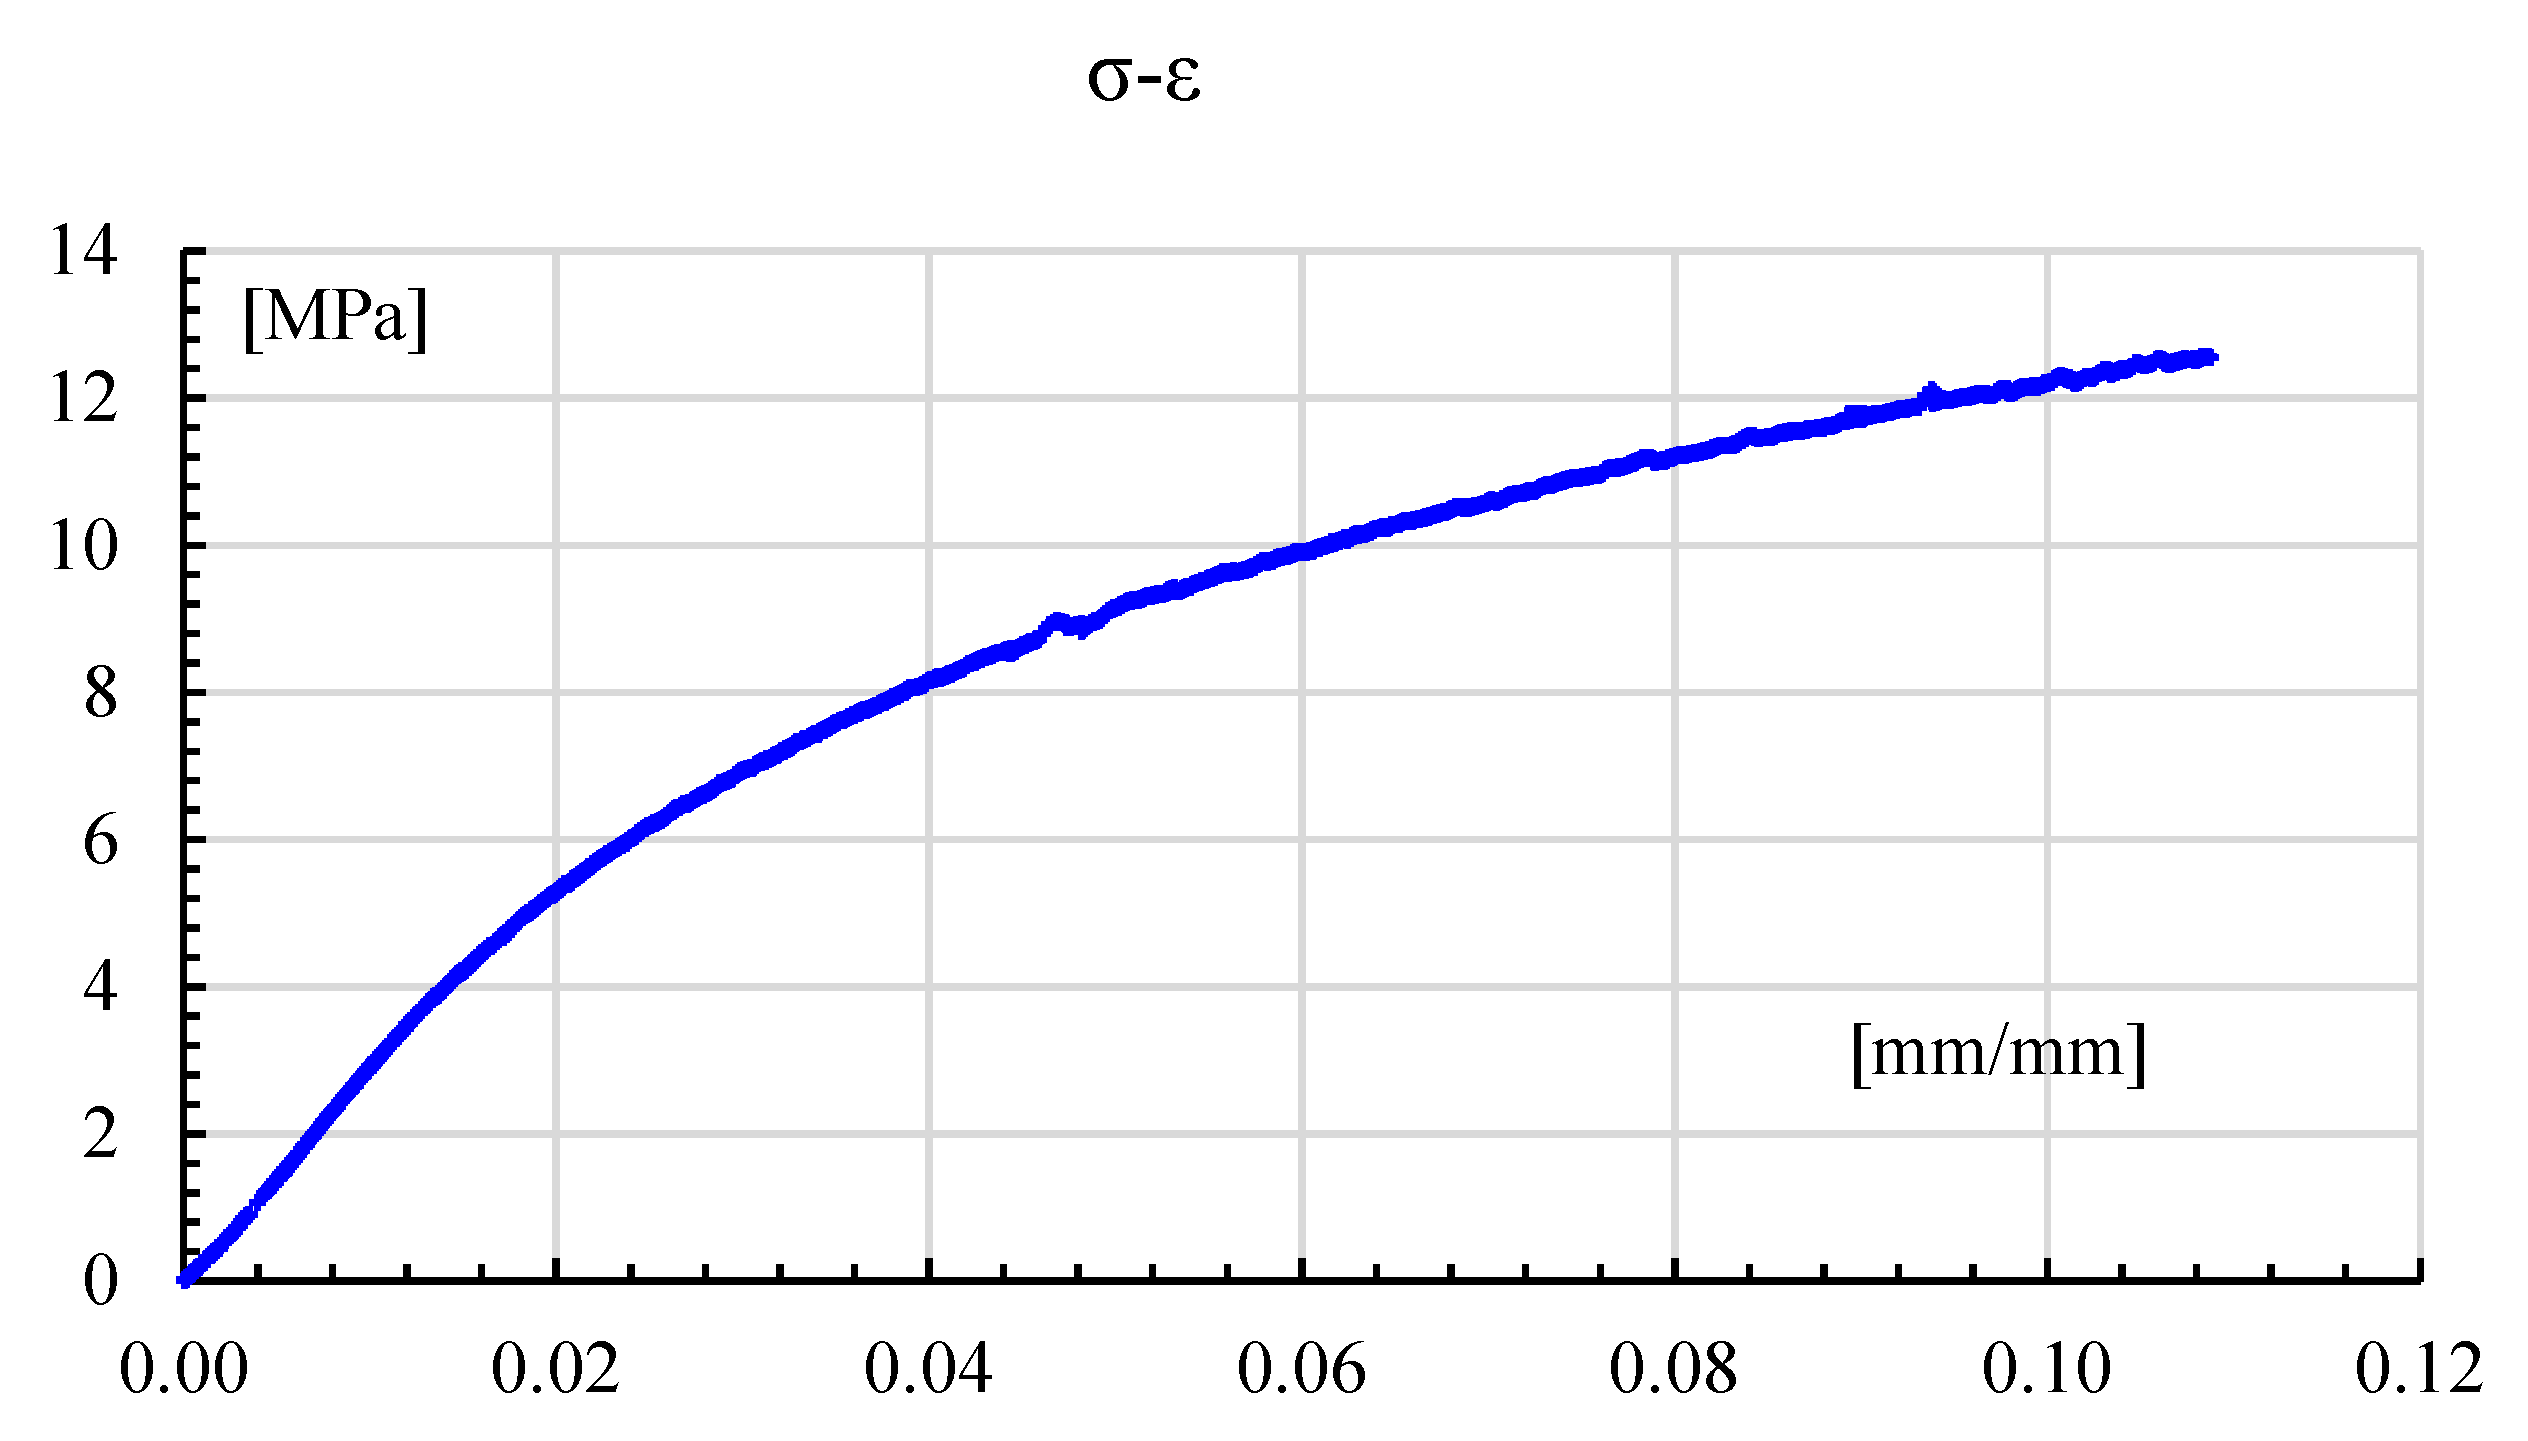
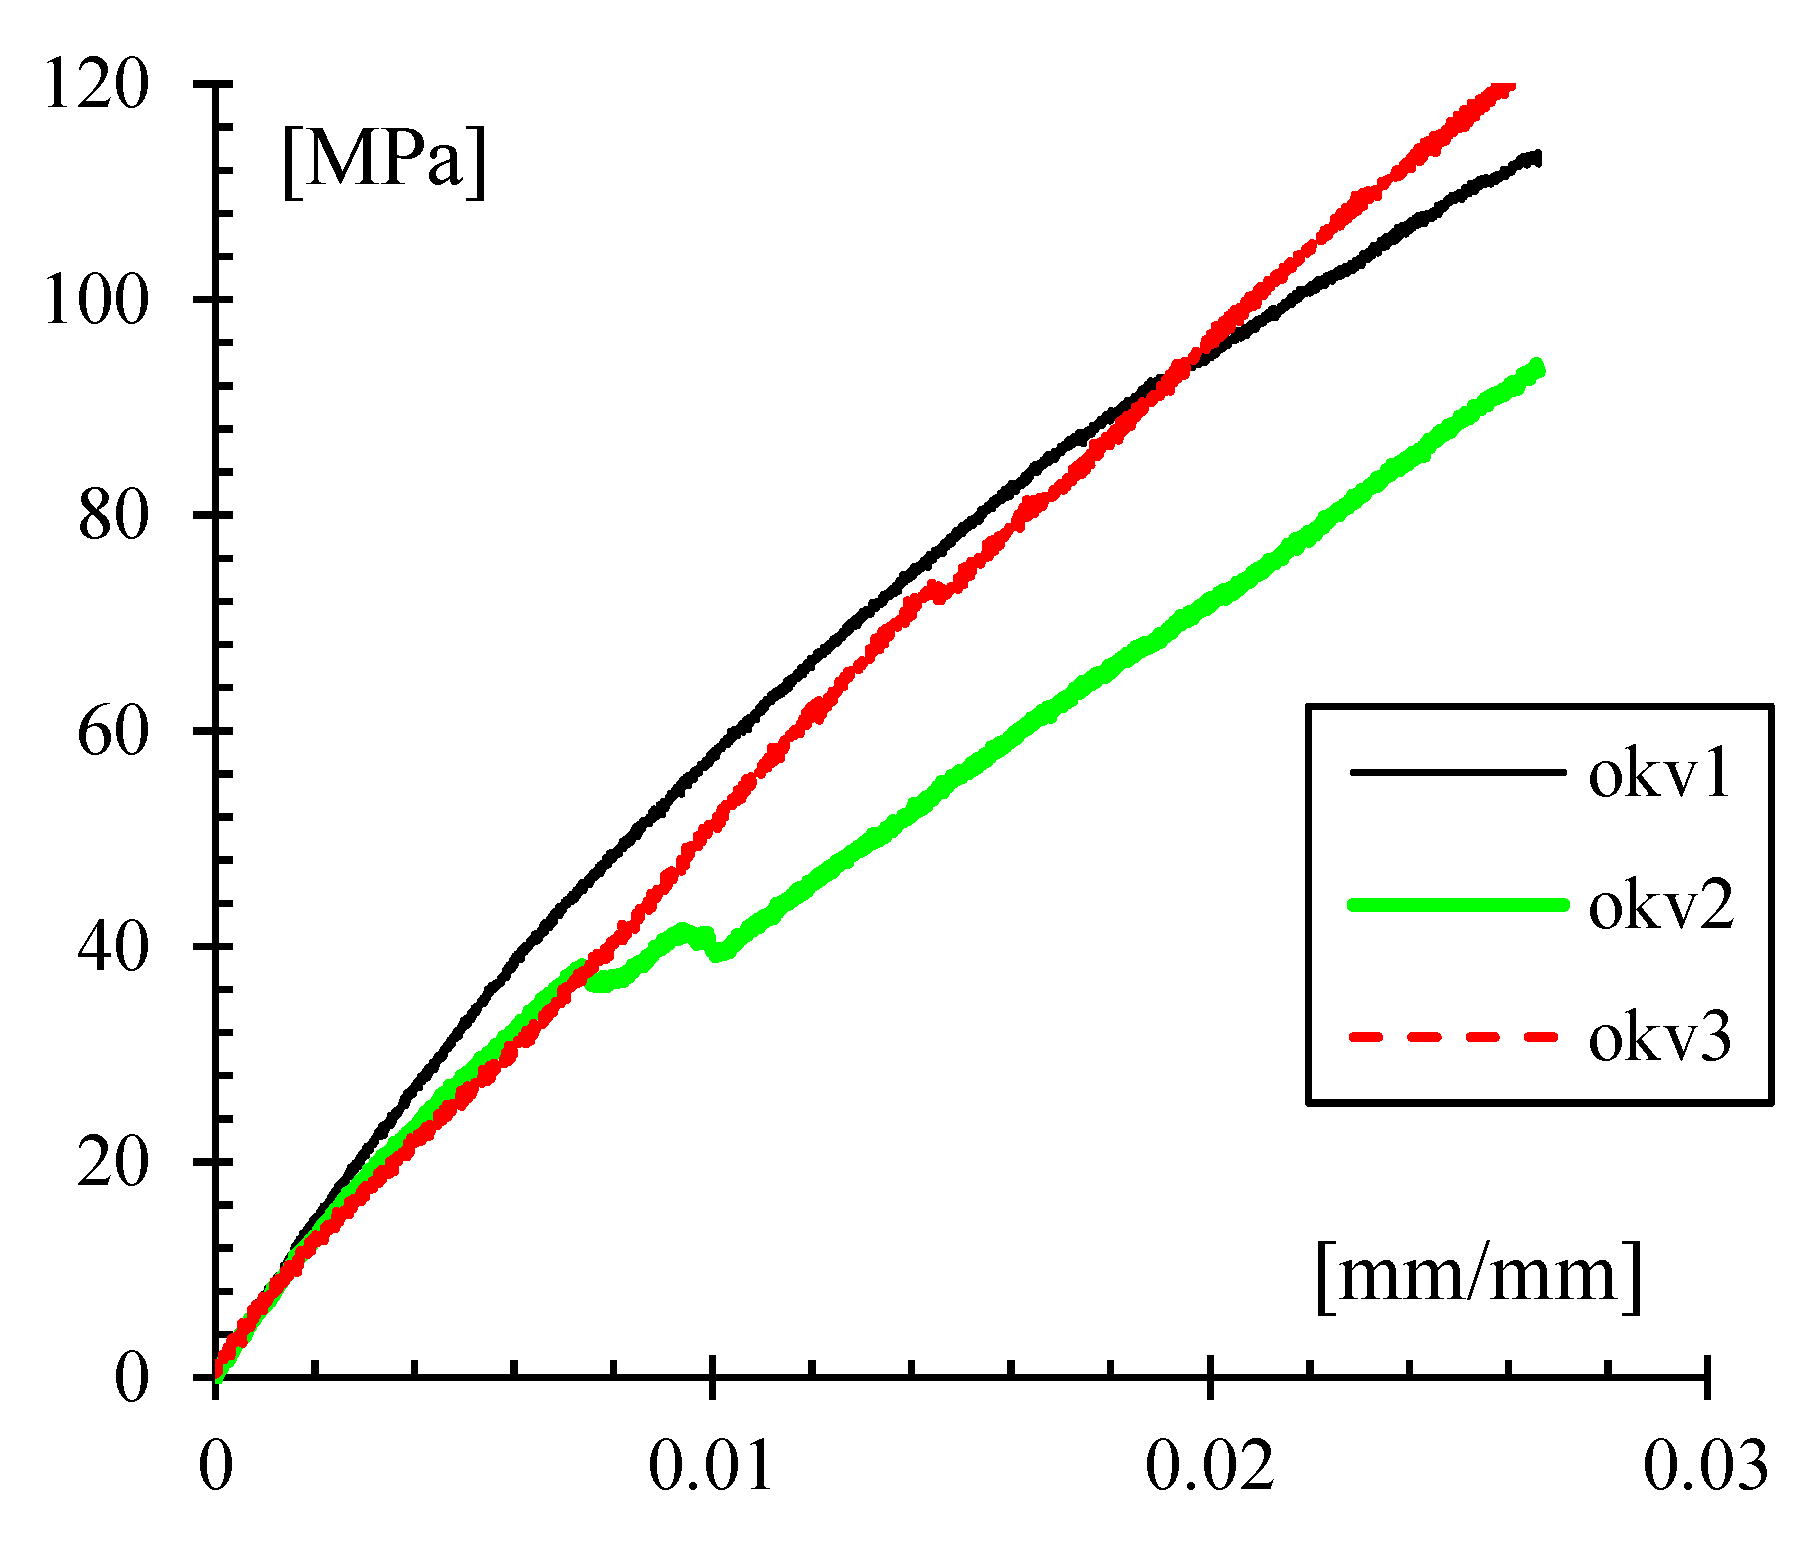
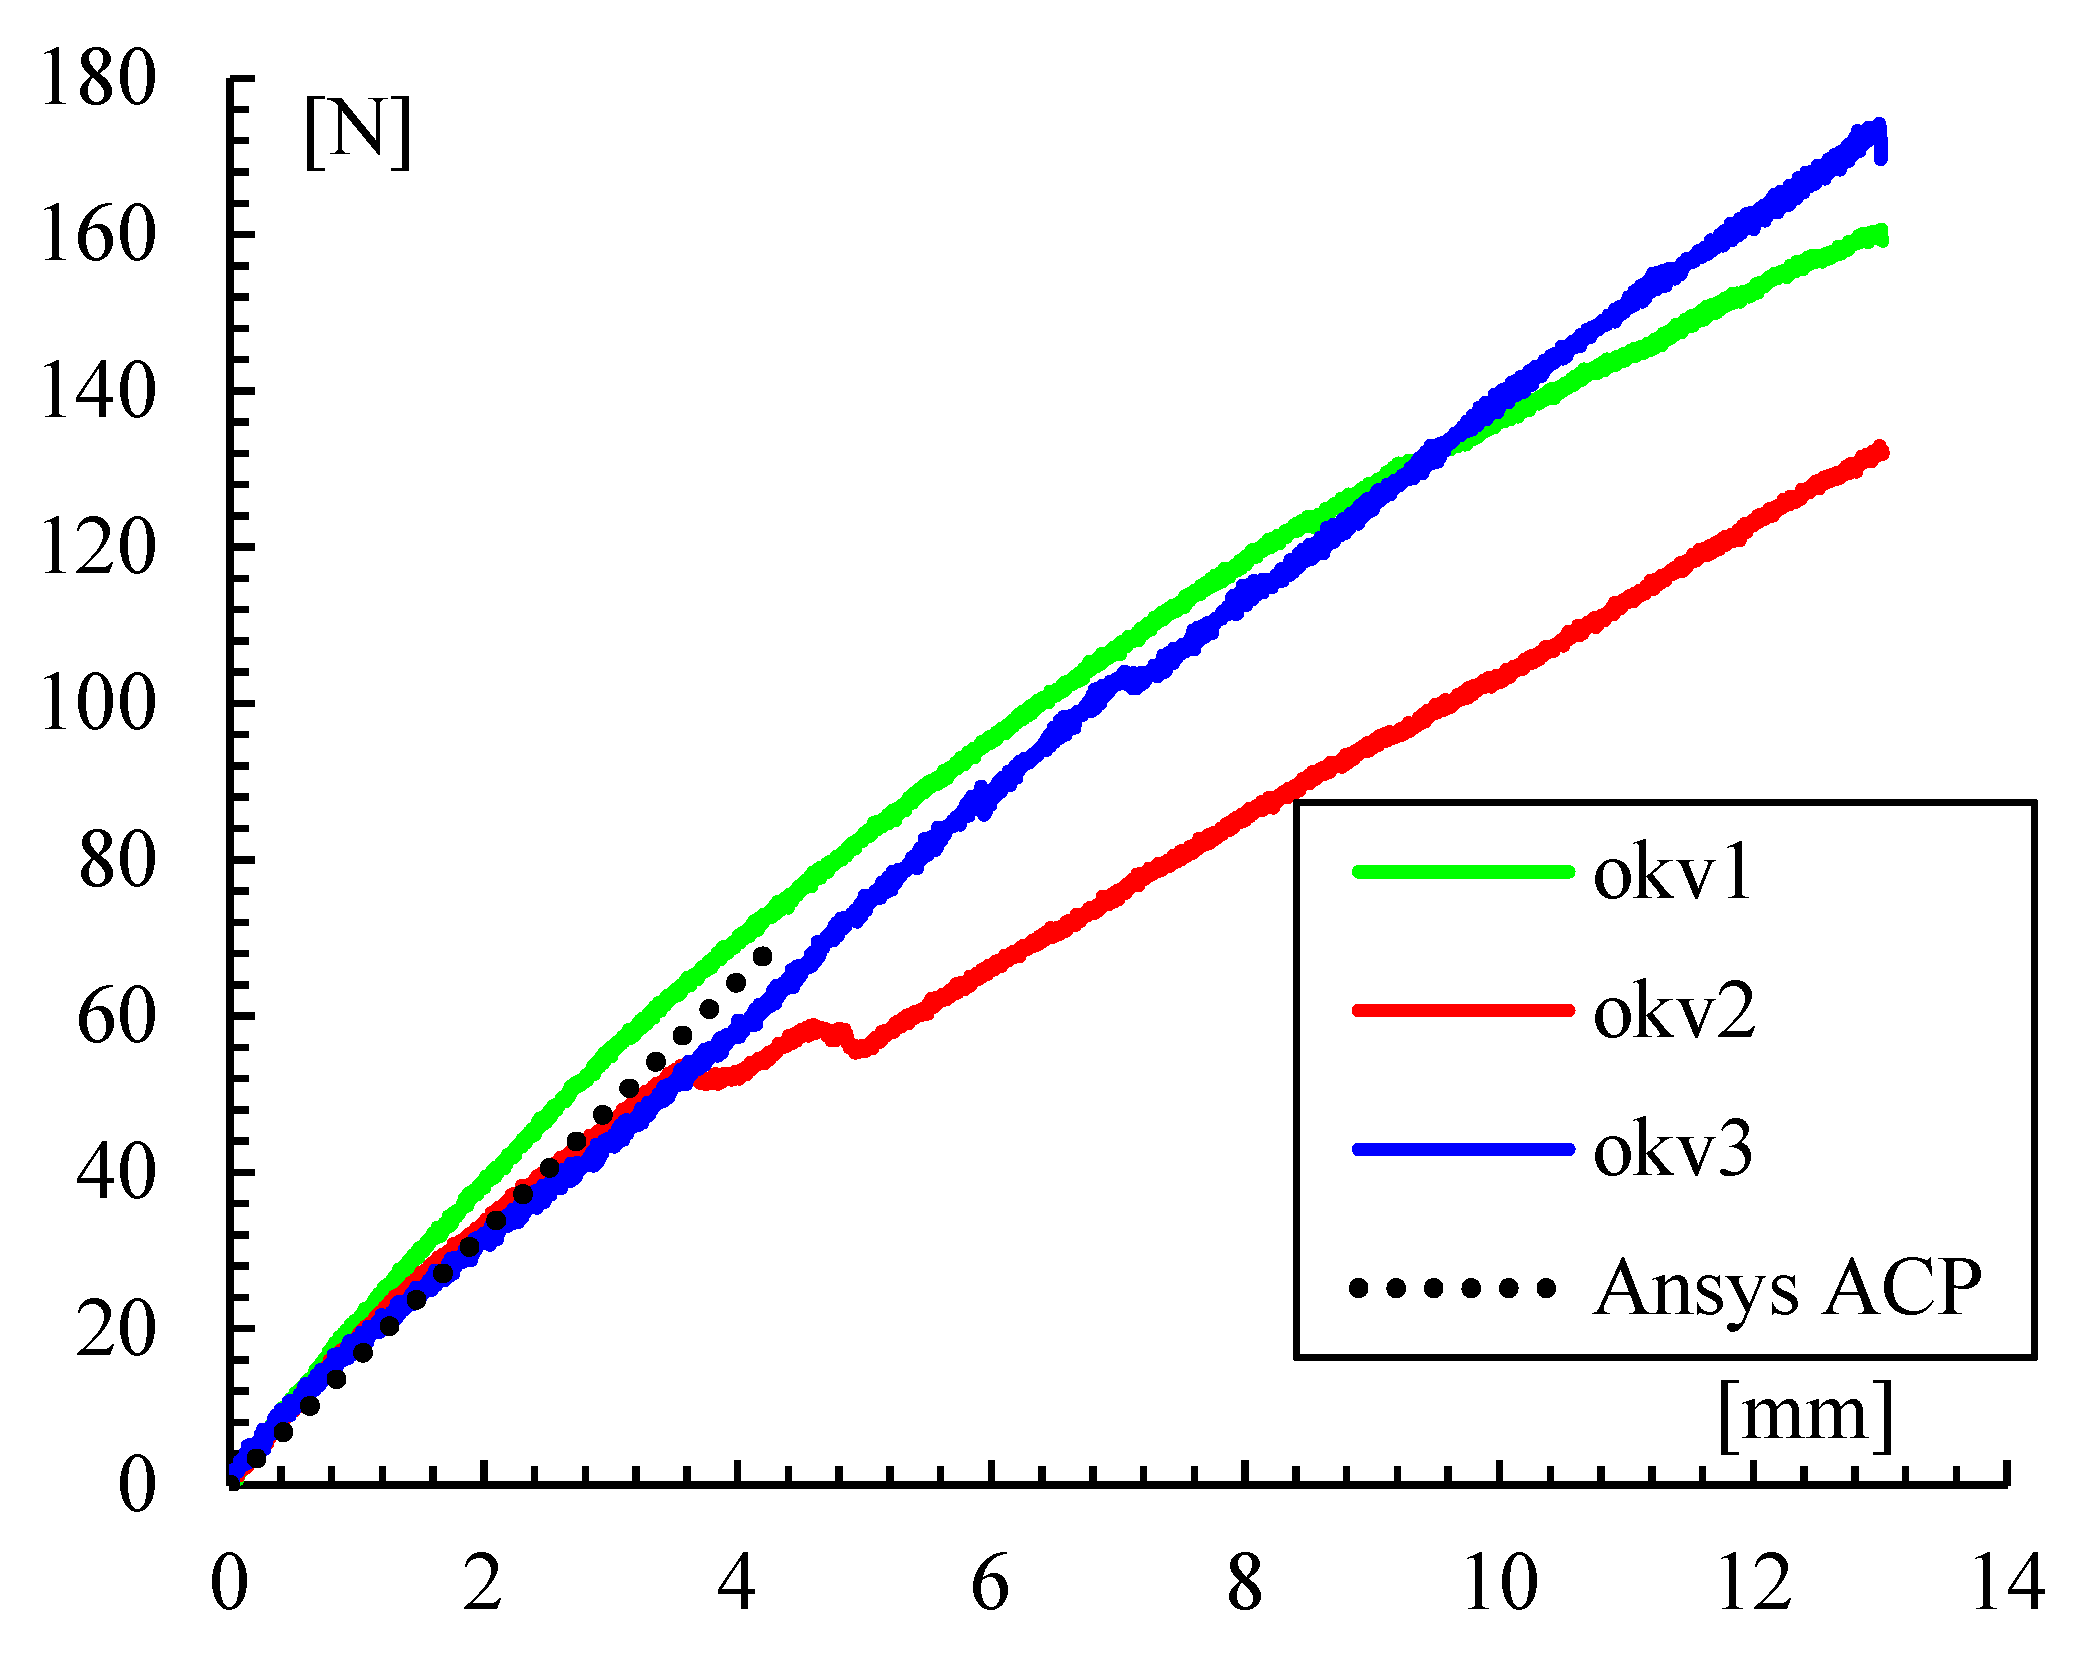
5.1. Static Tests
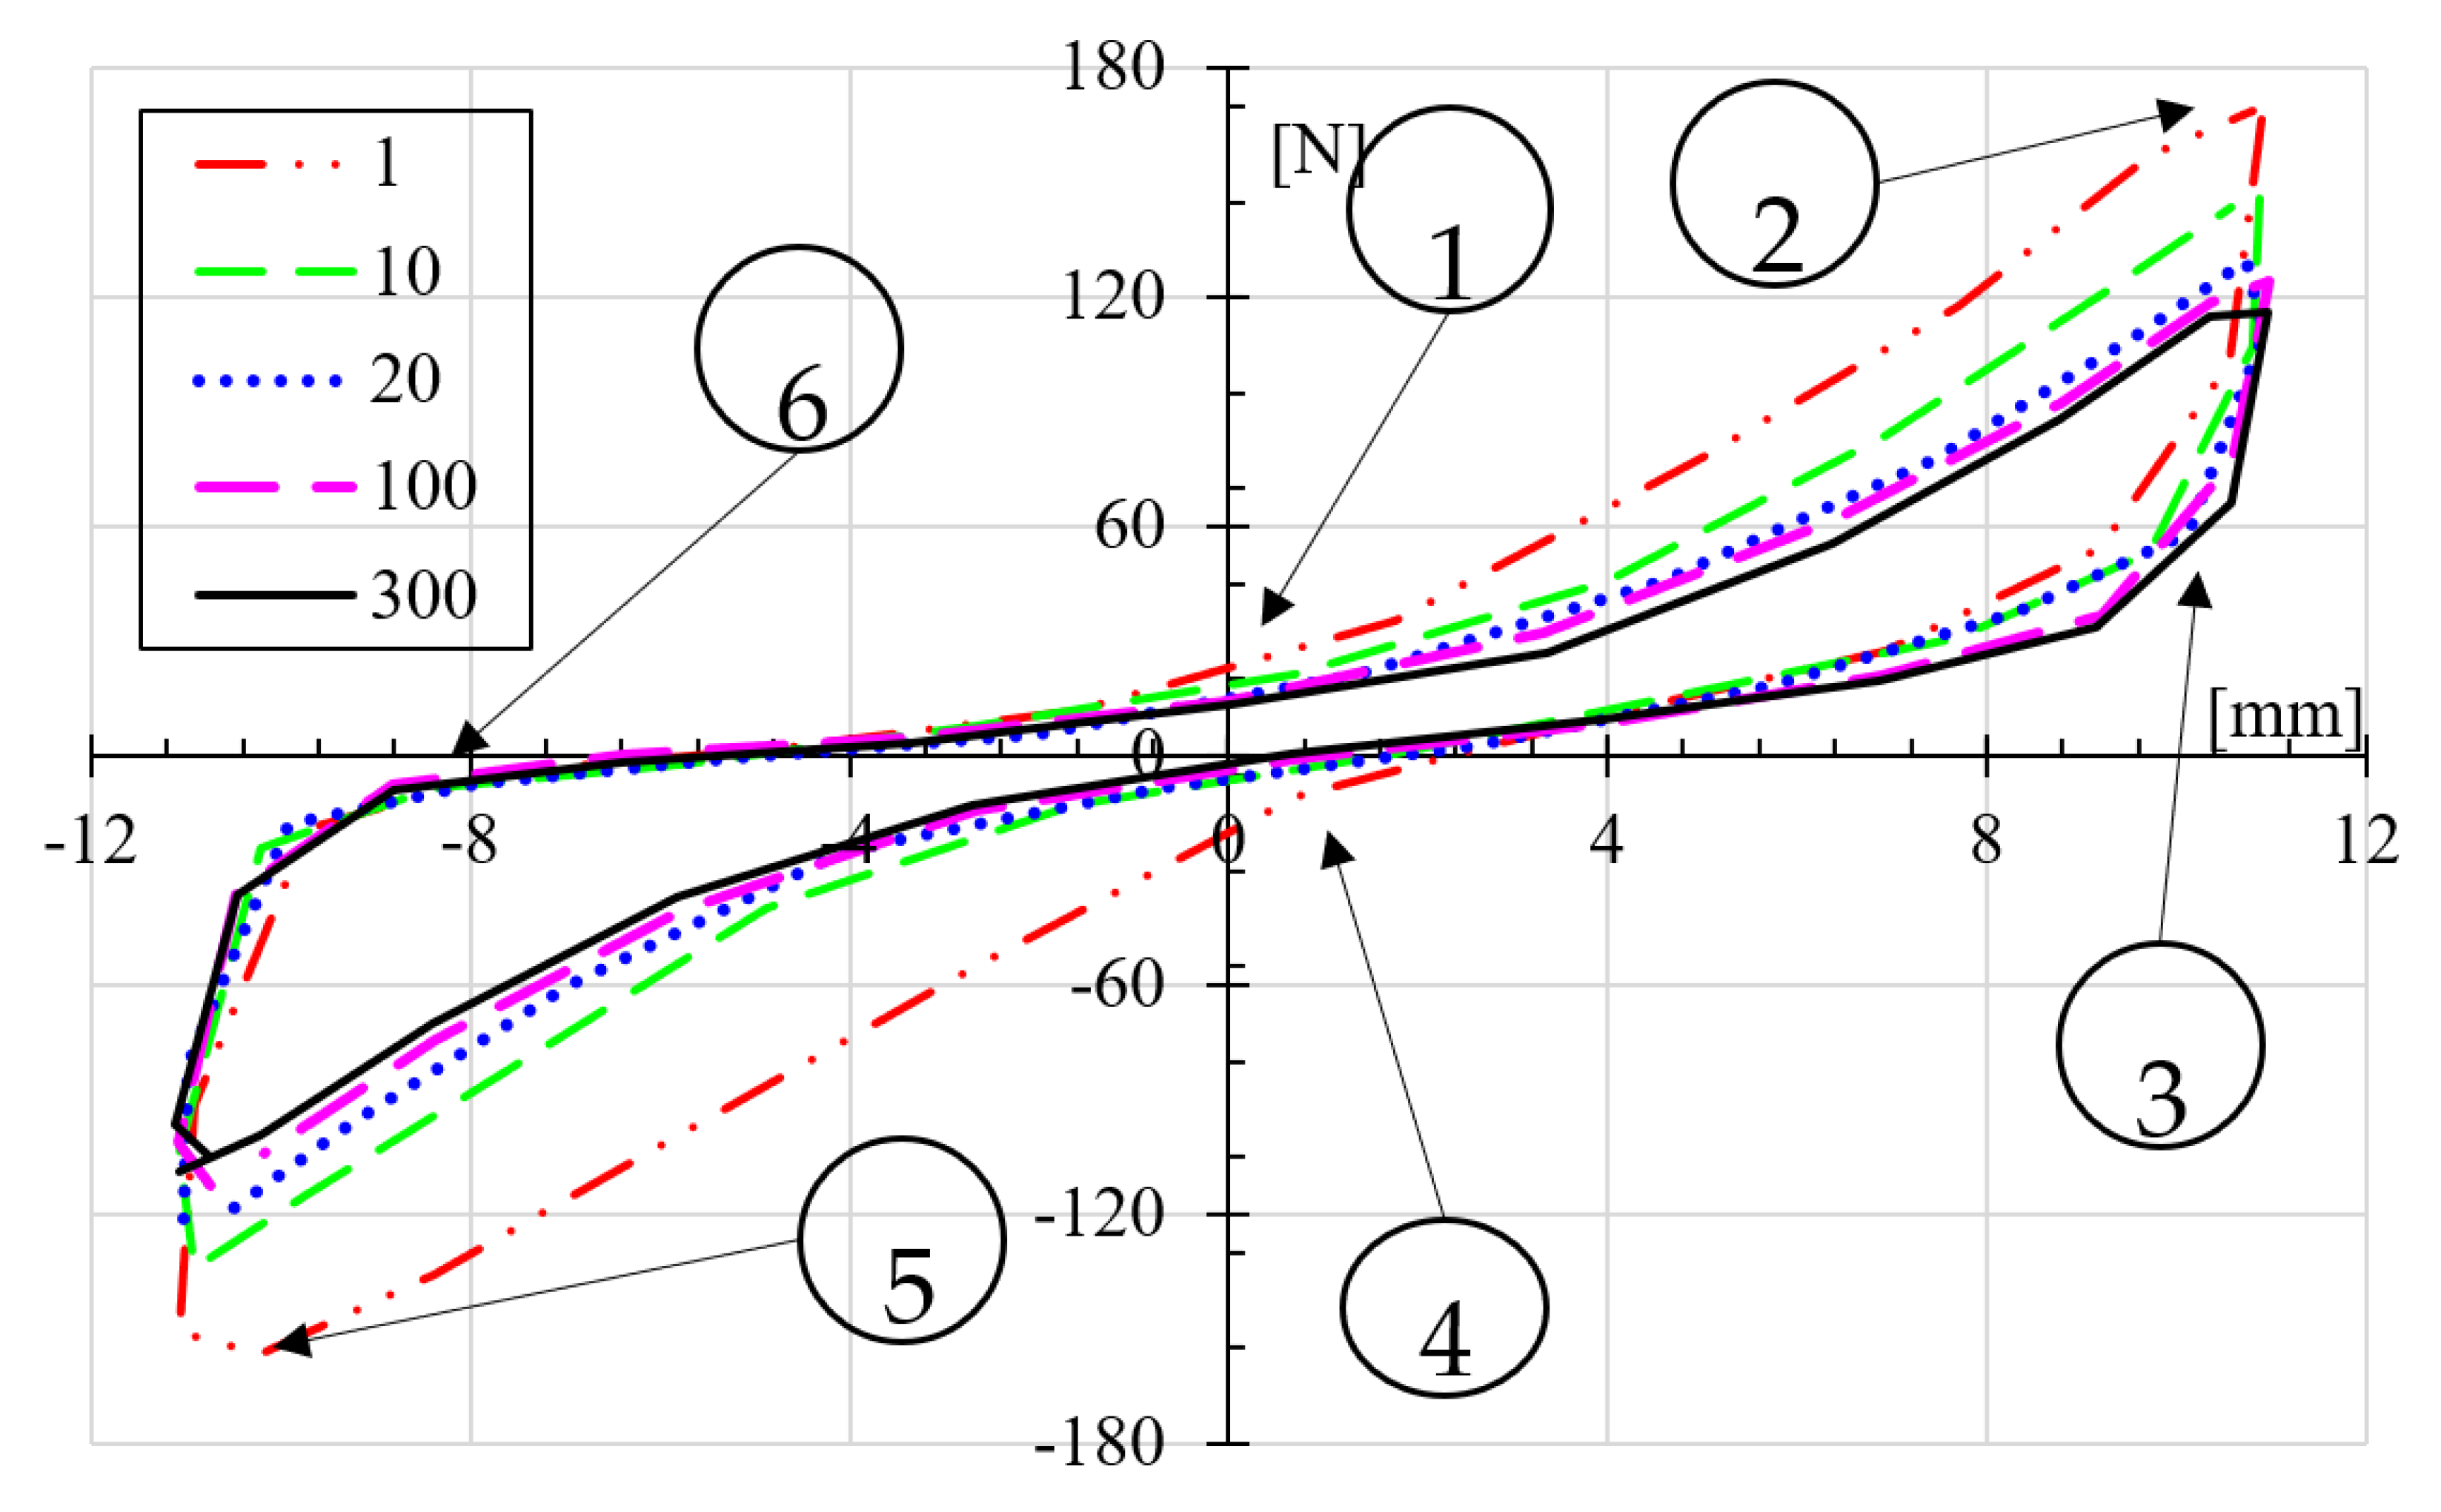
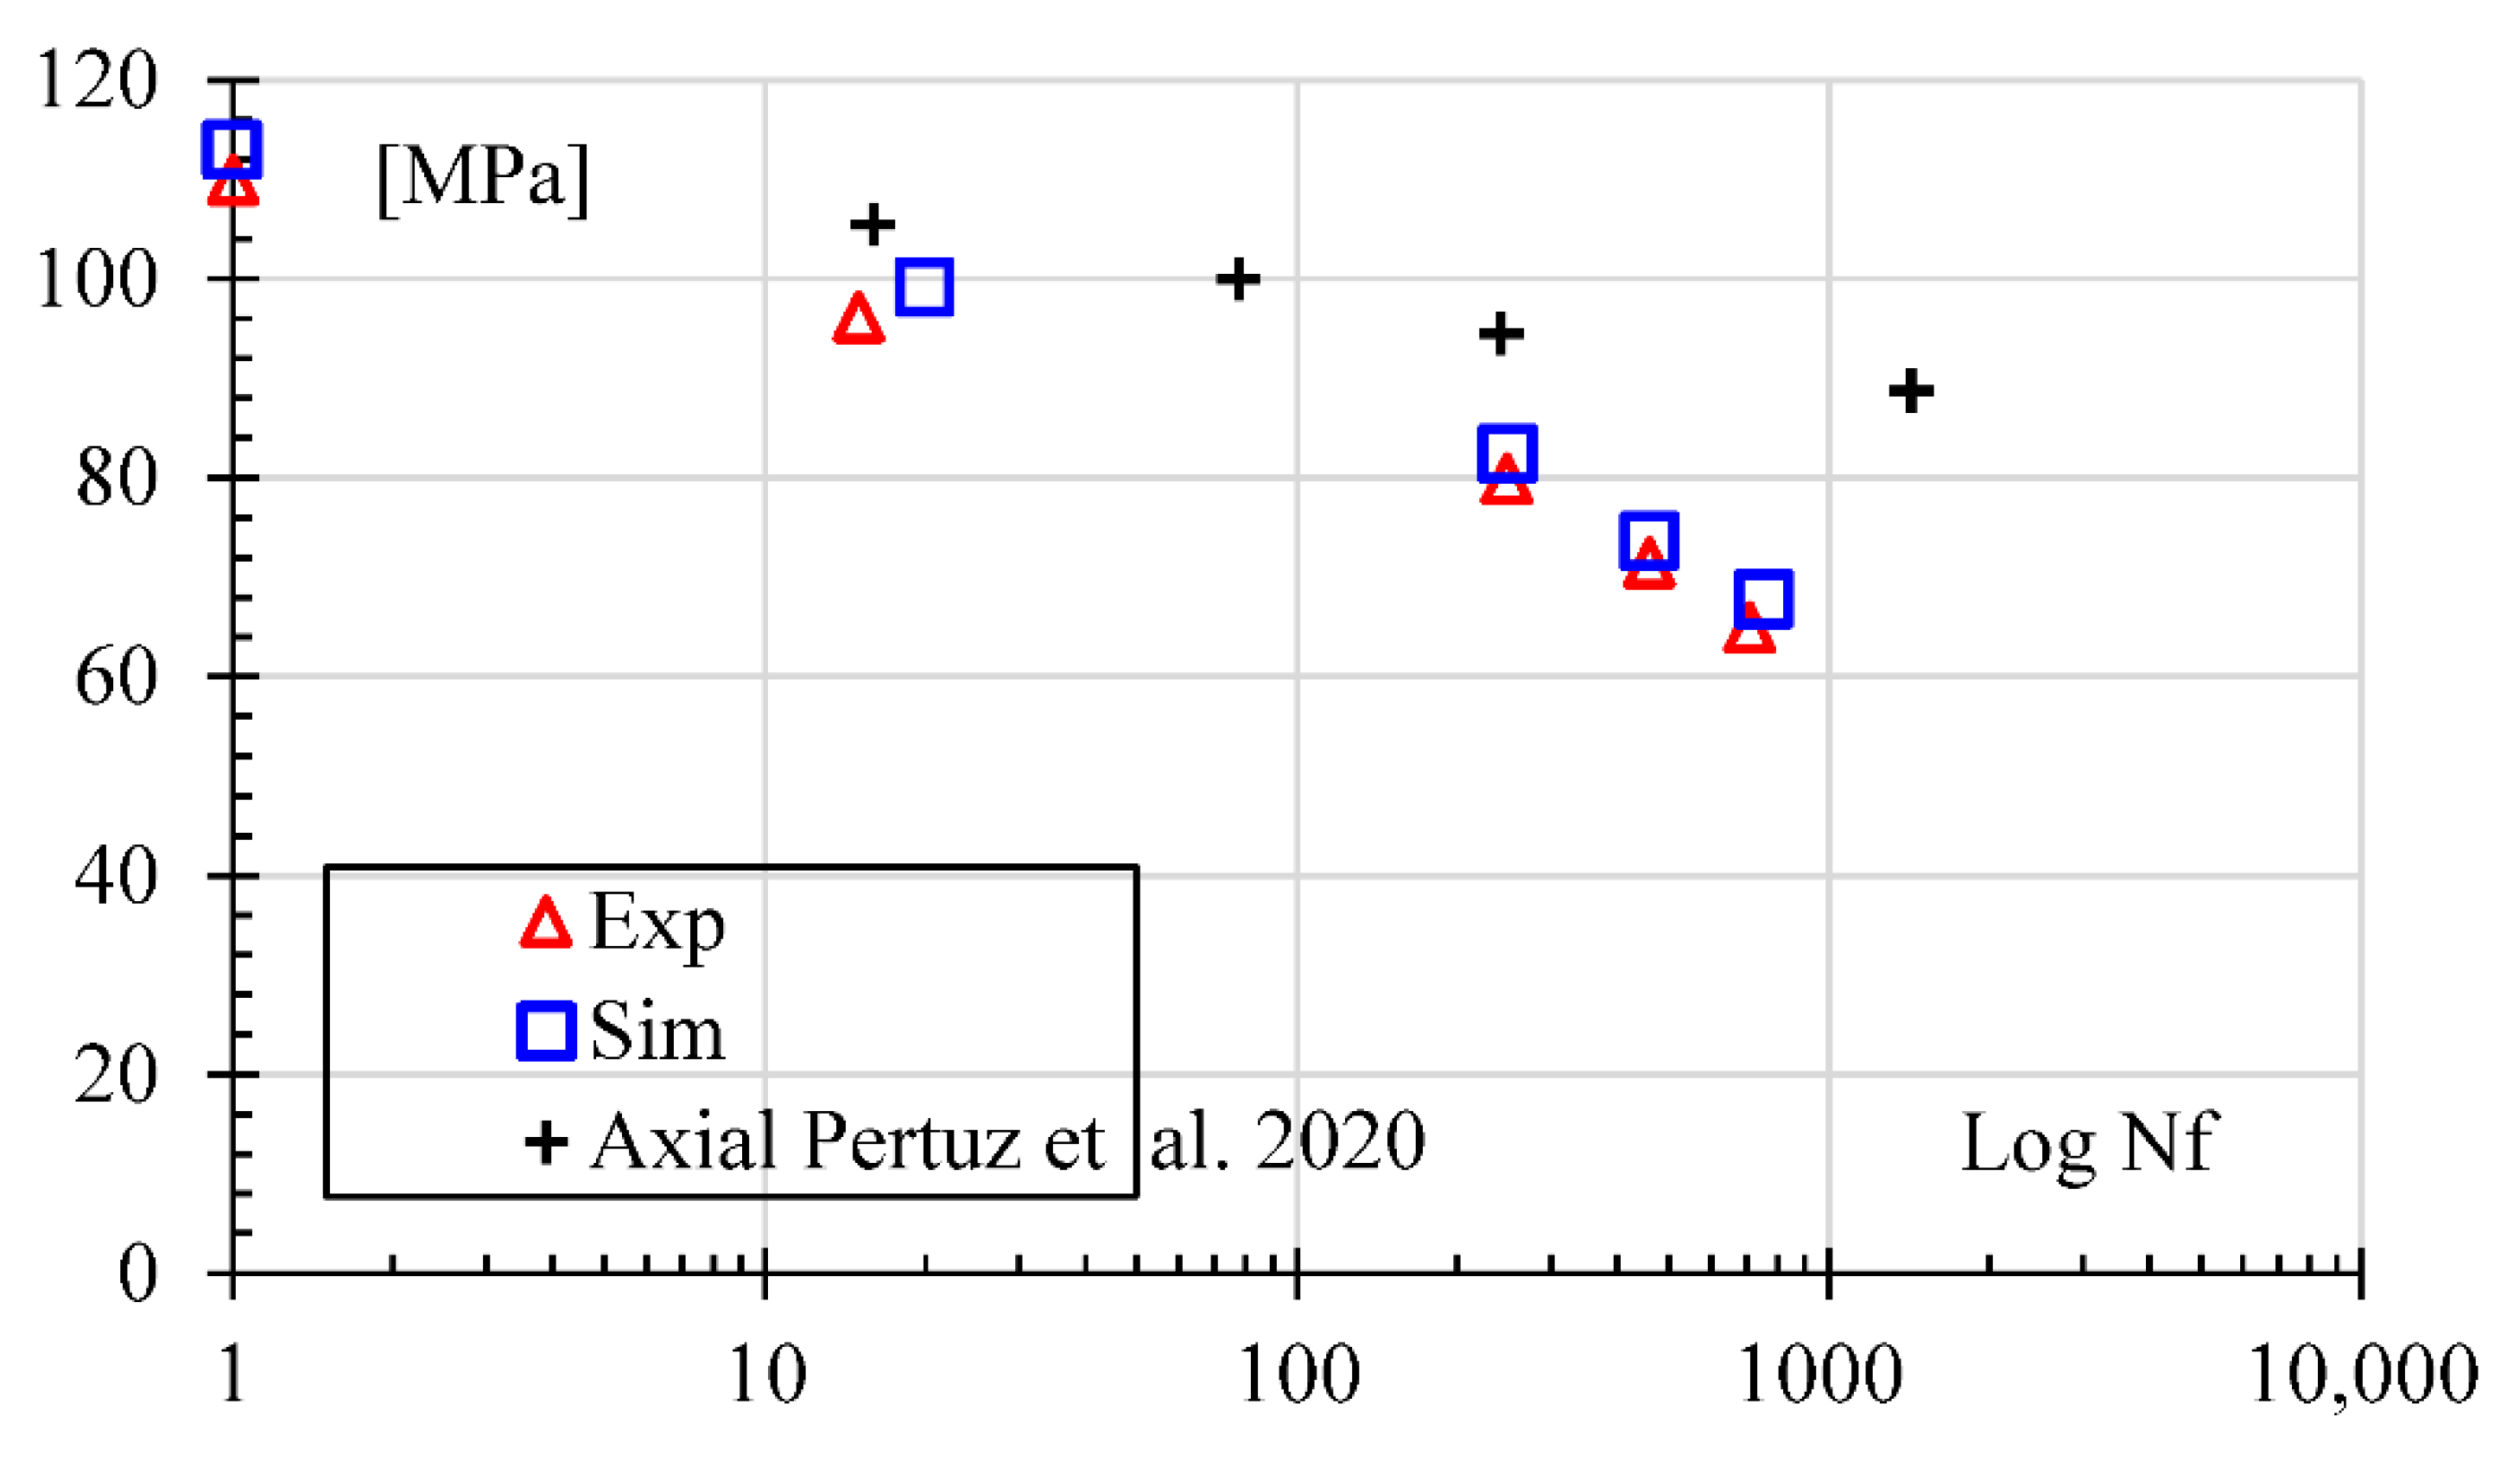
5.2. Fatigue Tests
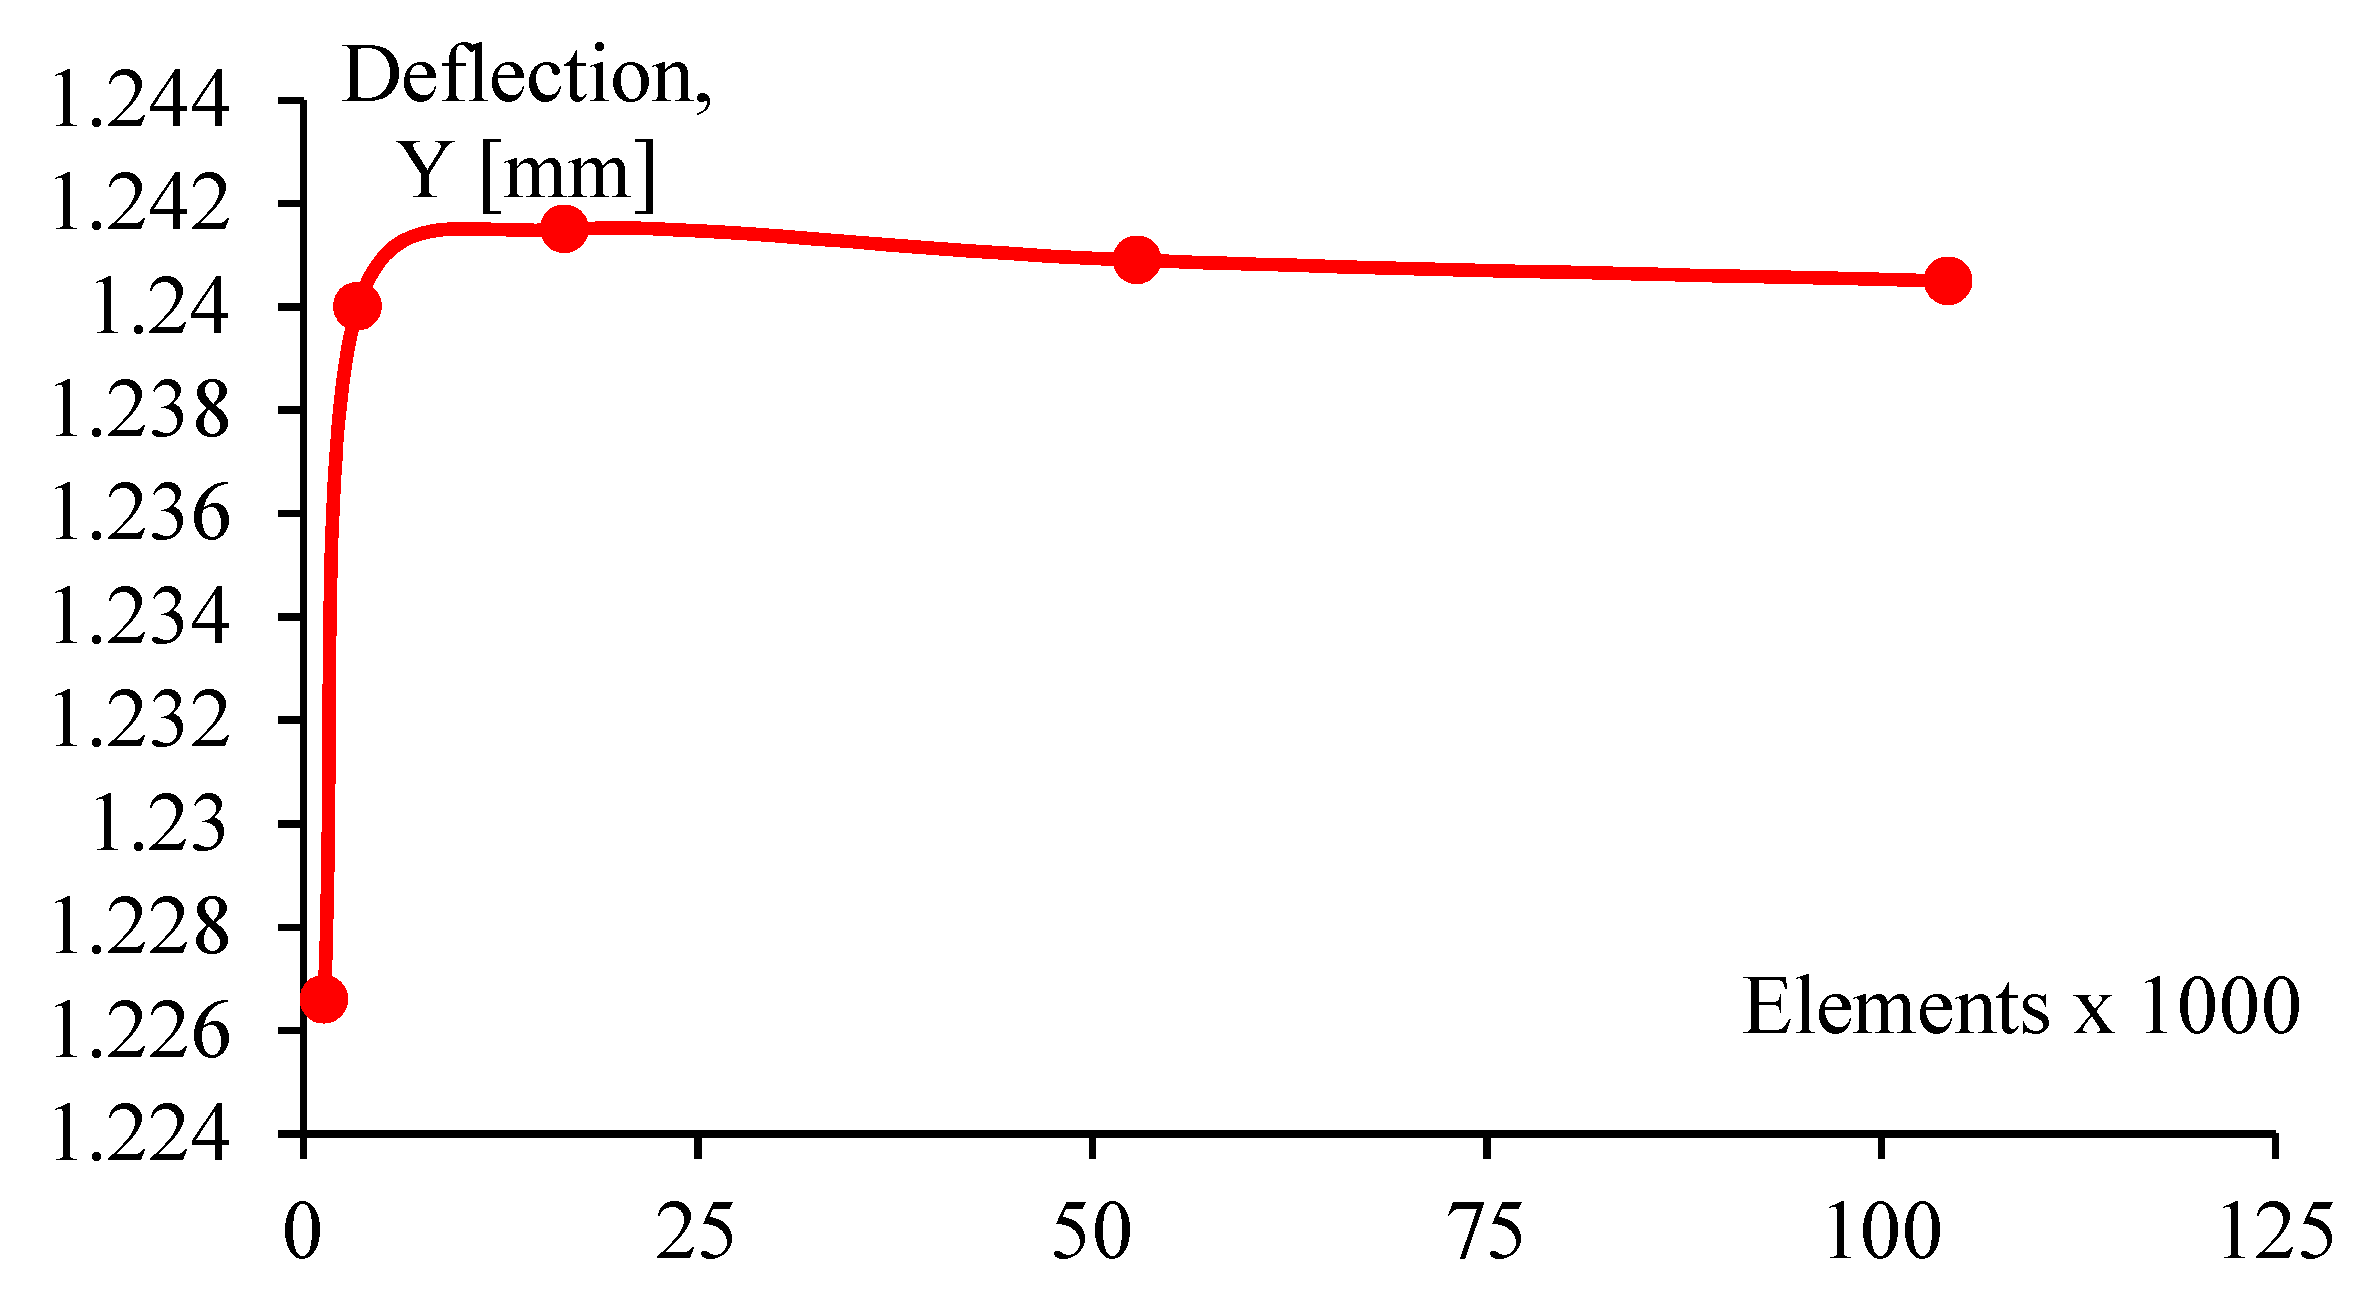
5.3. Numerical Simulation
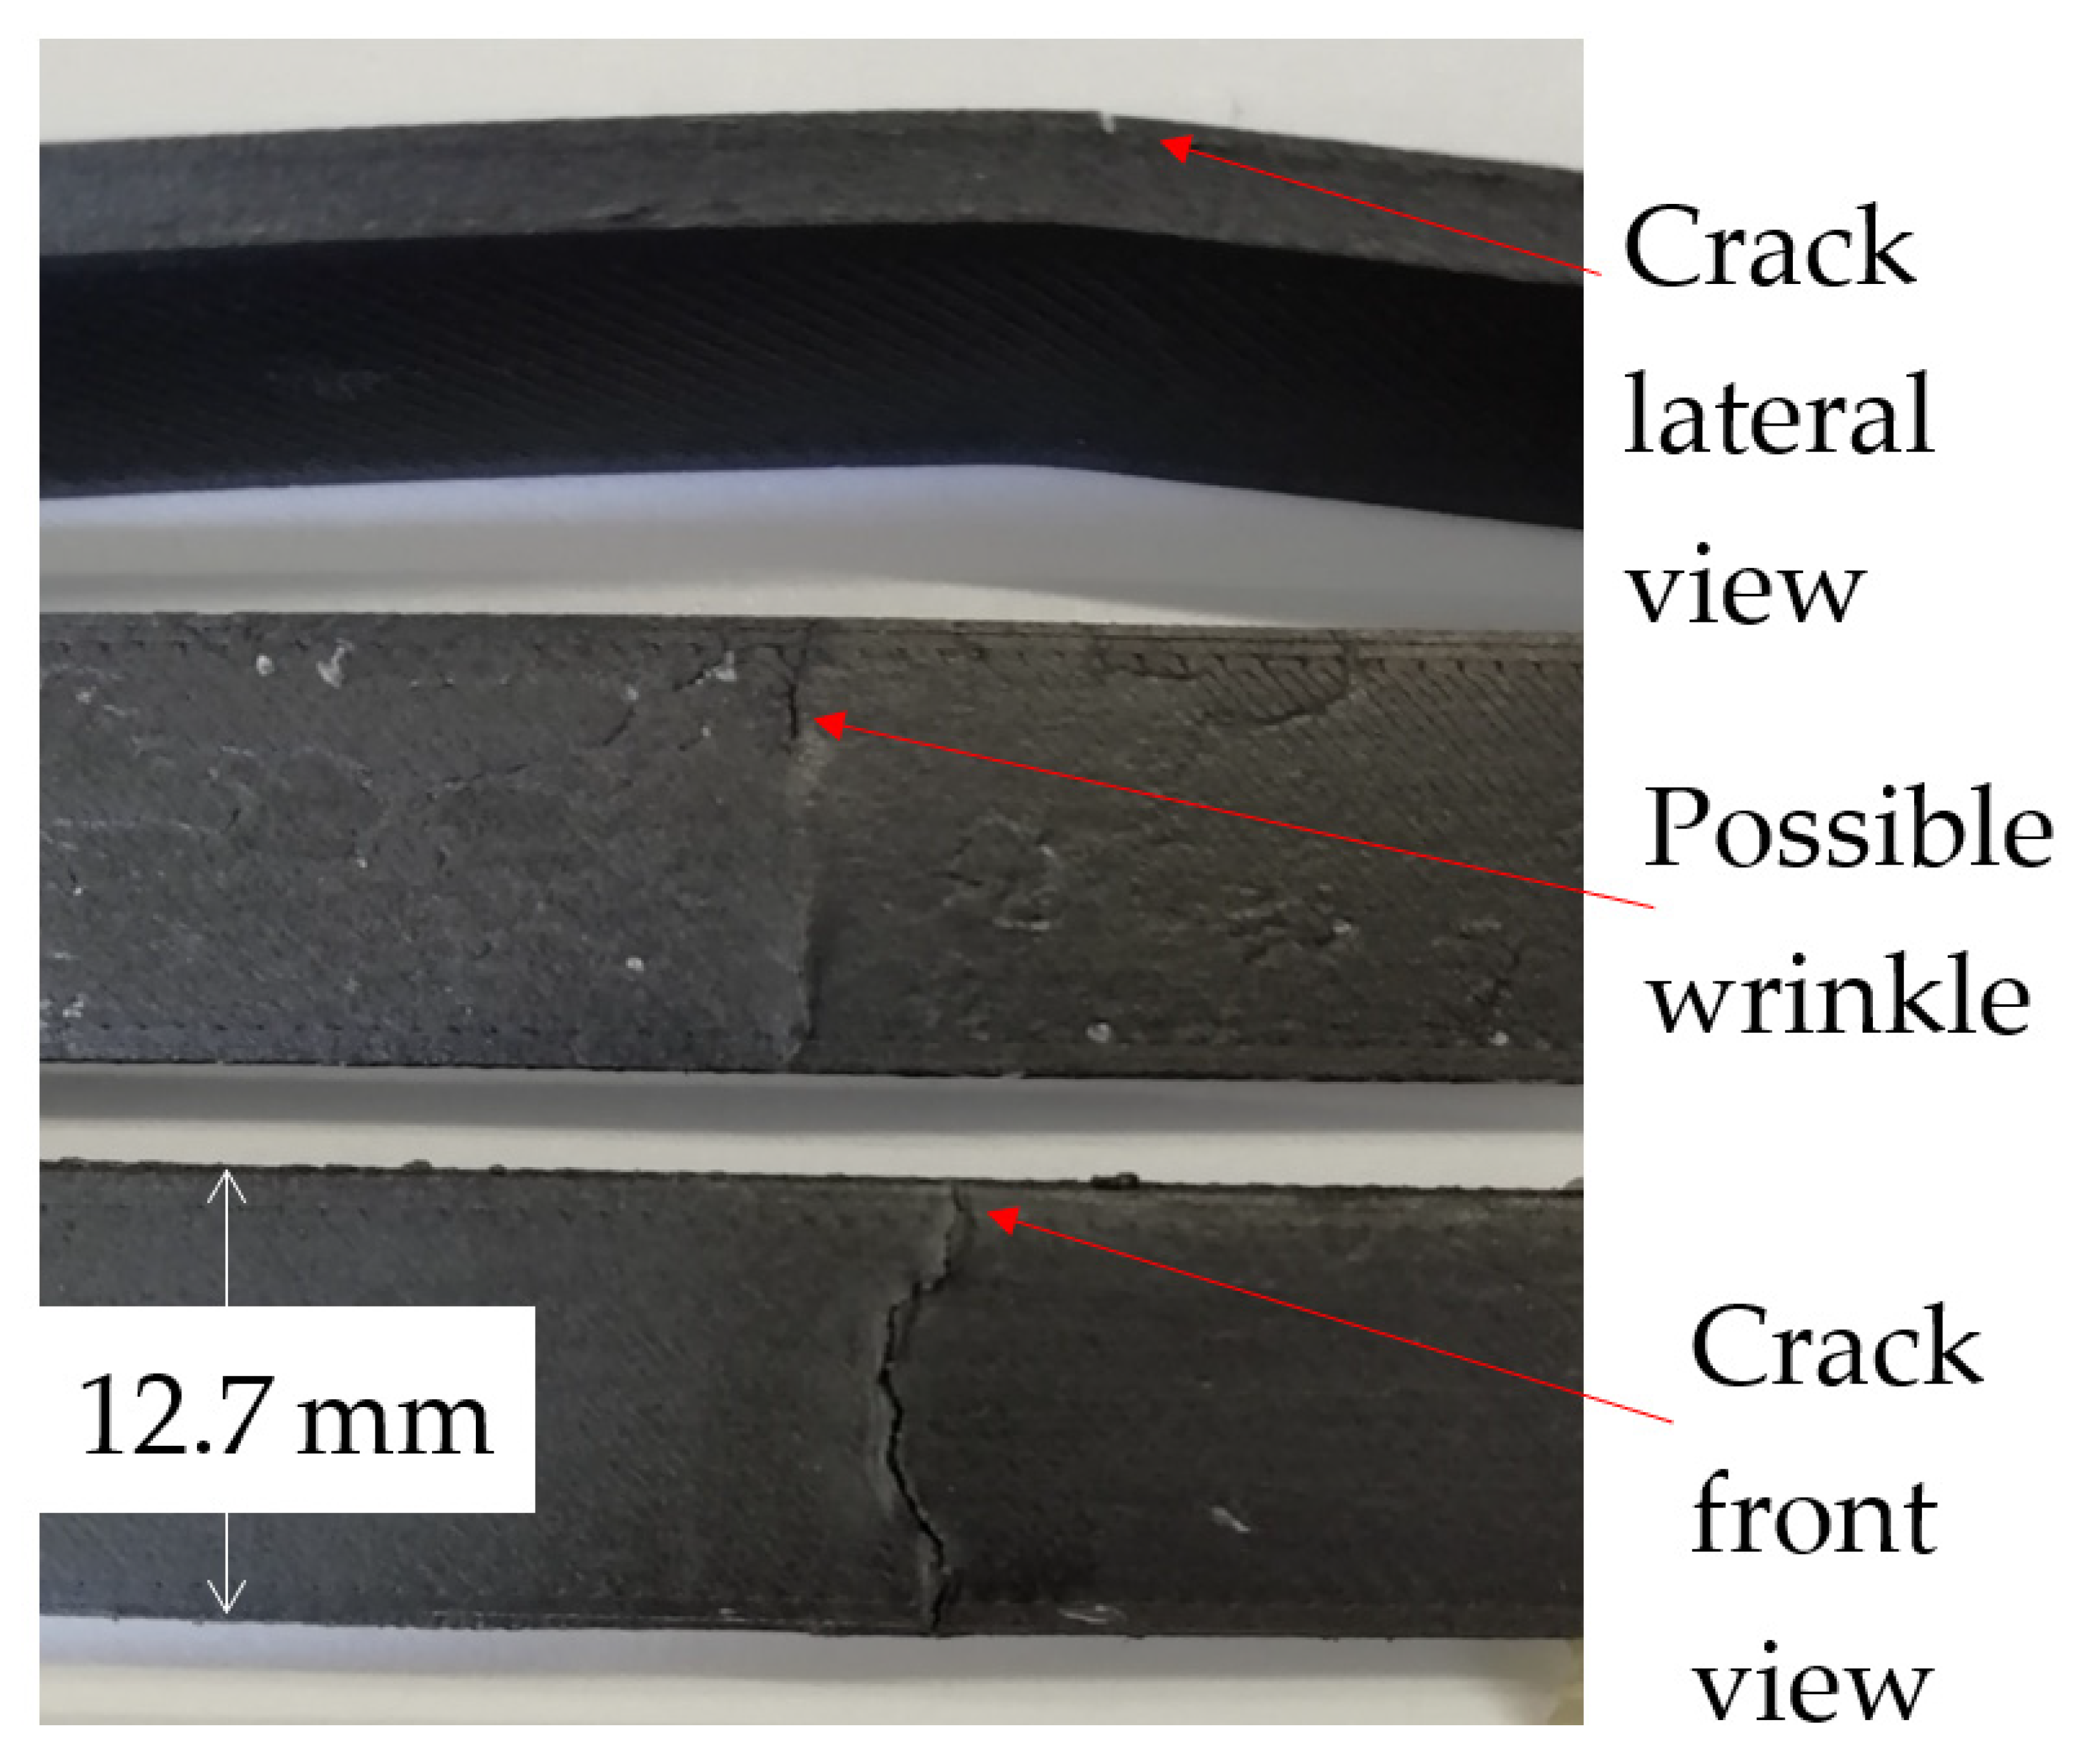
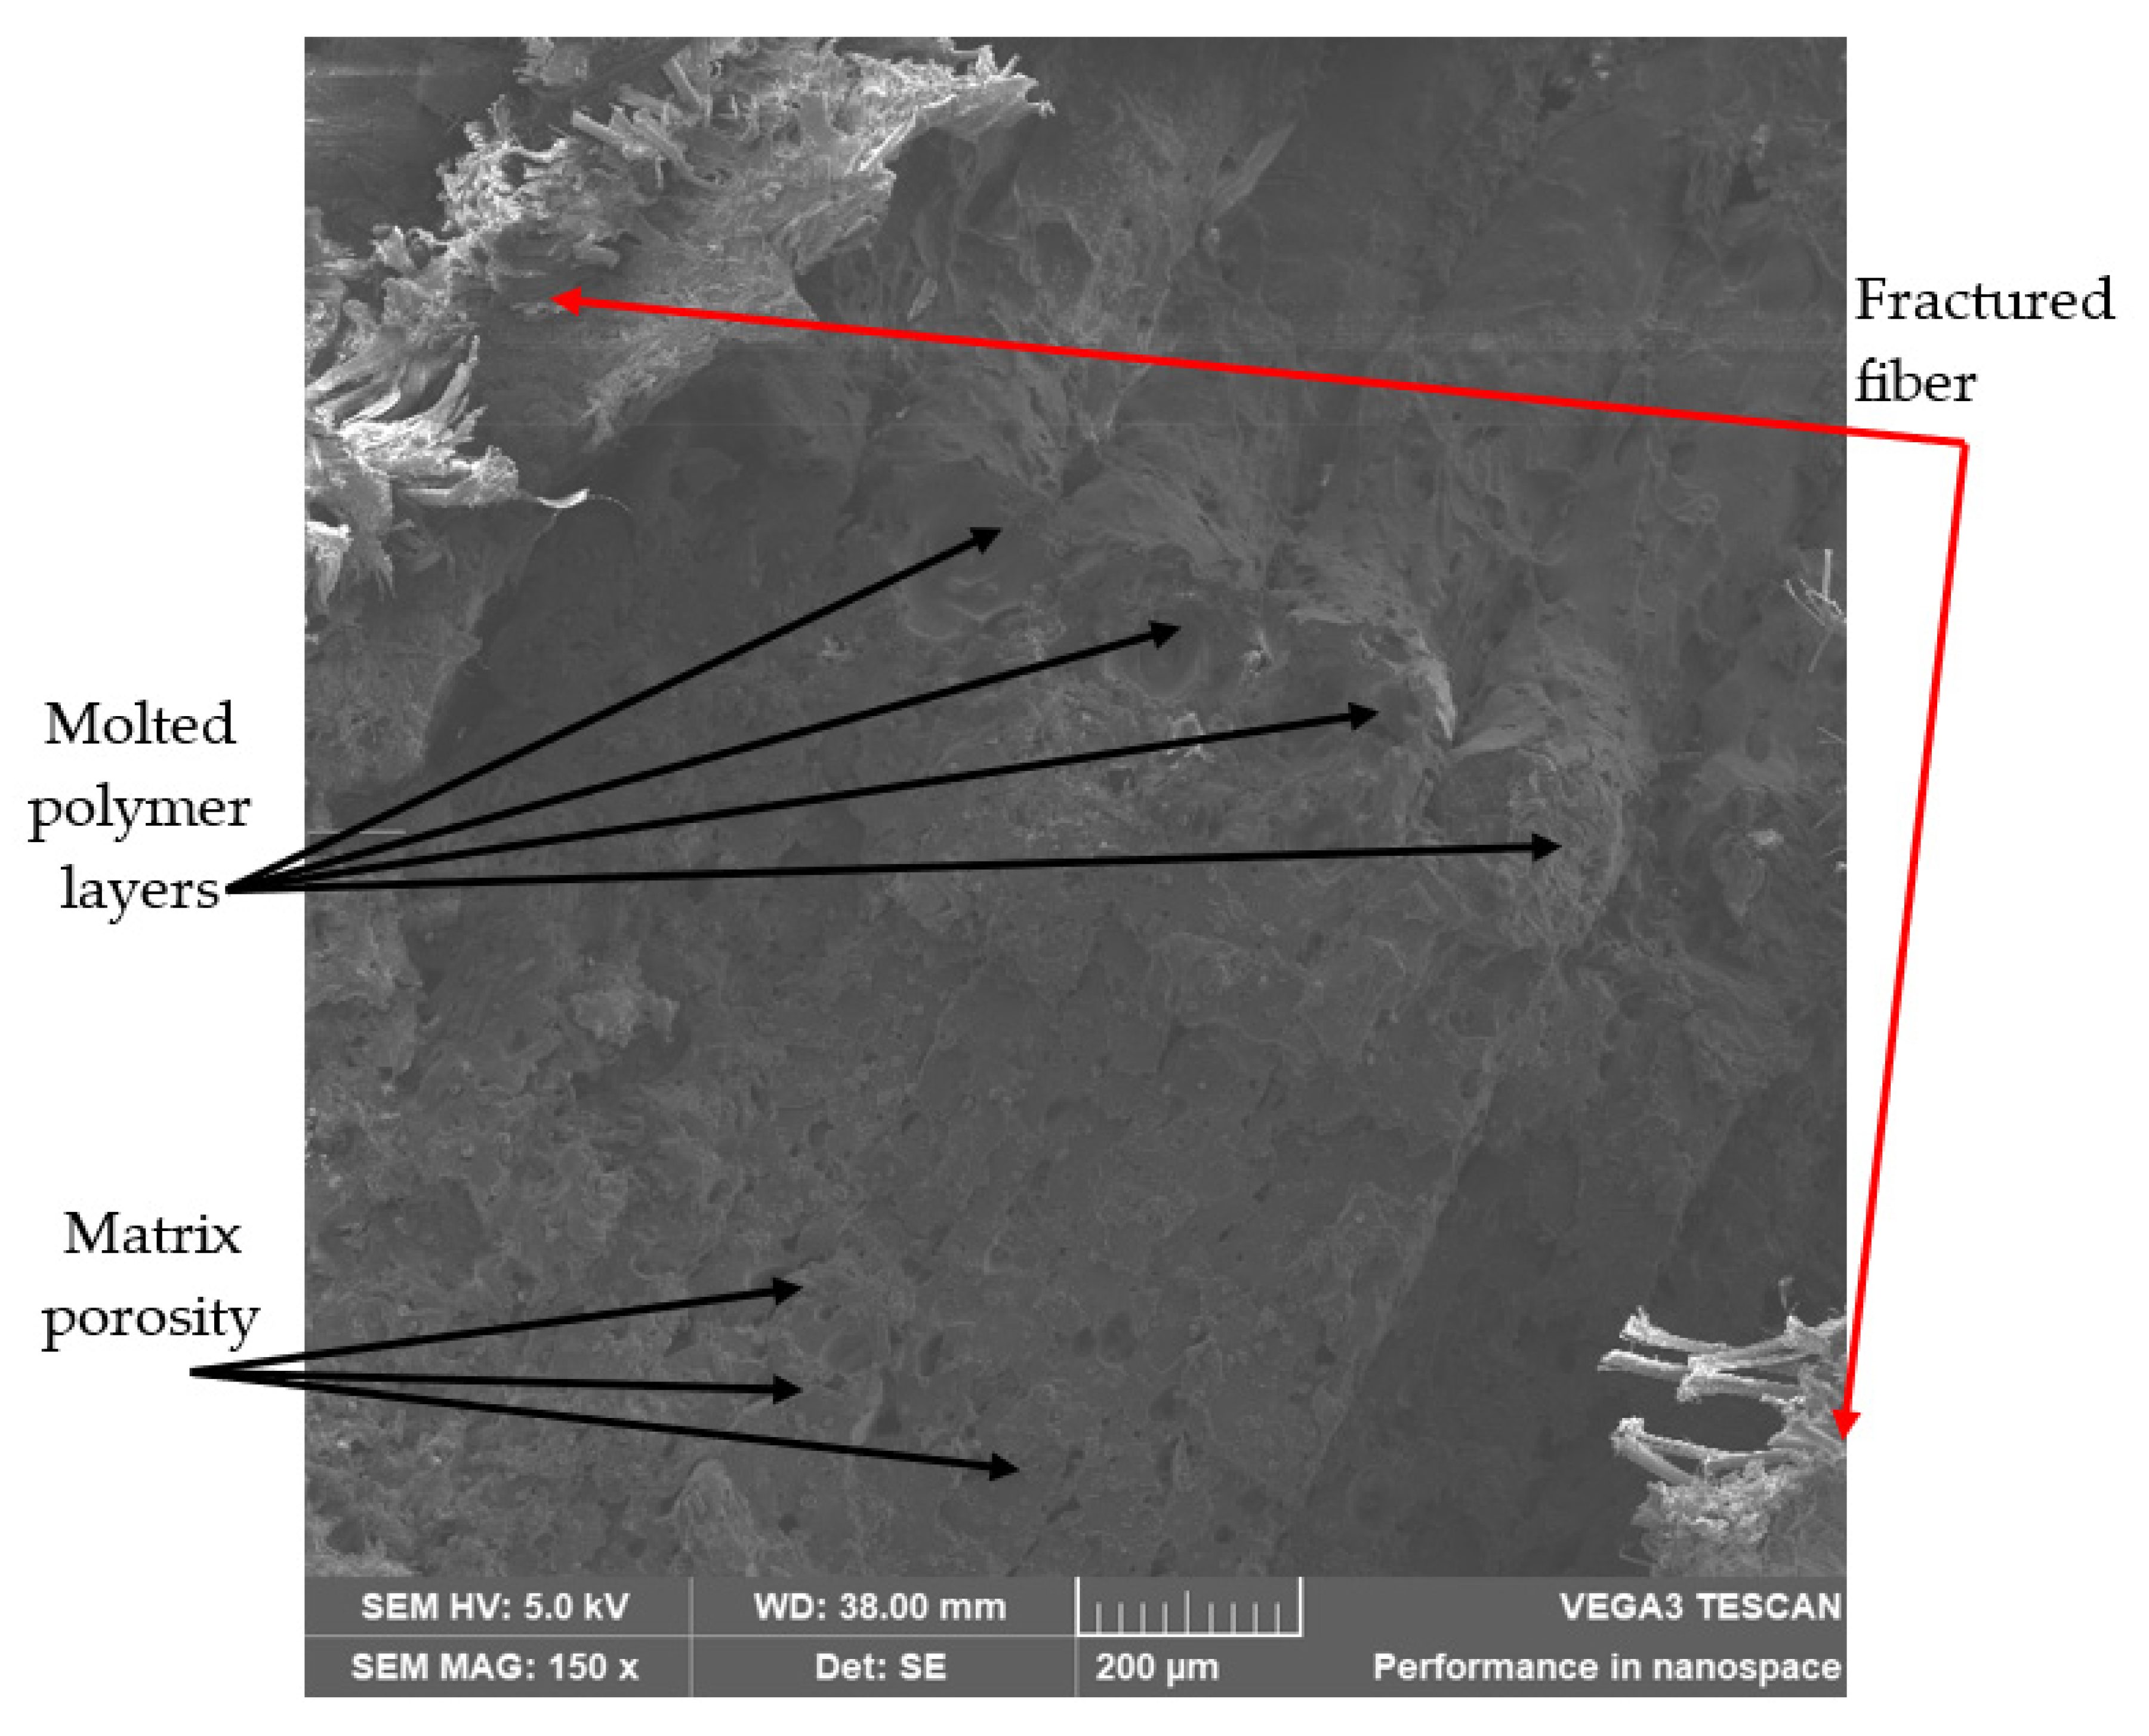
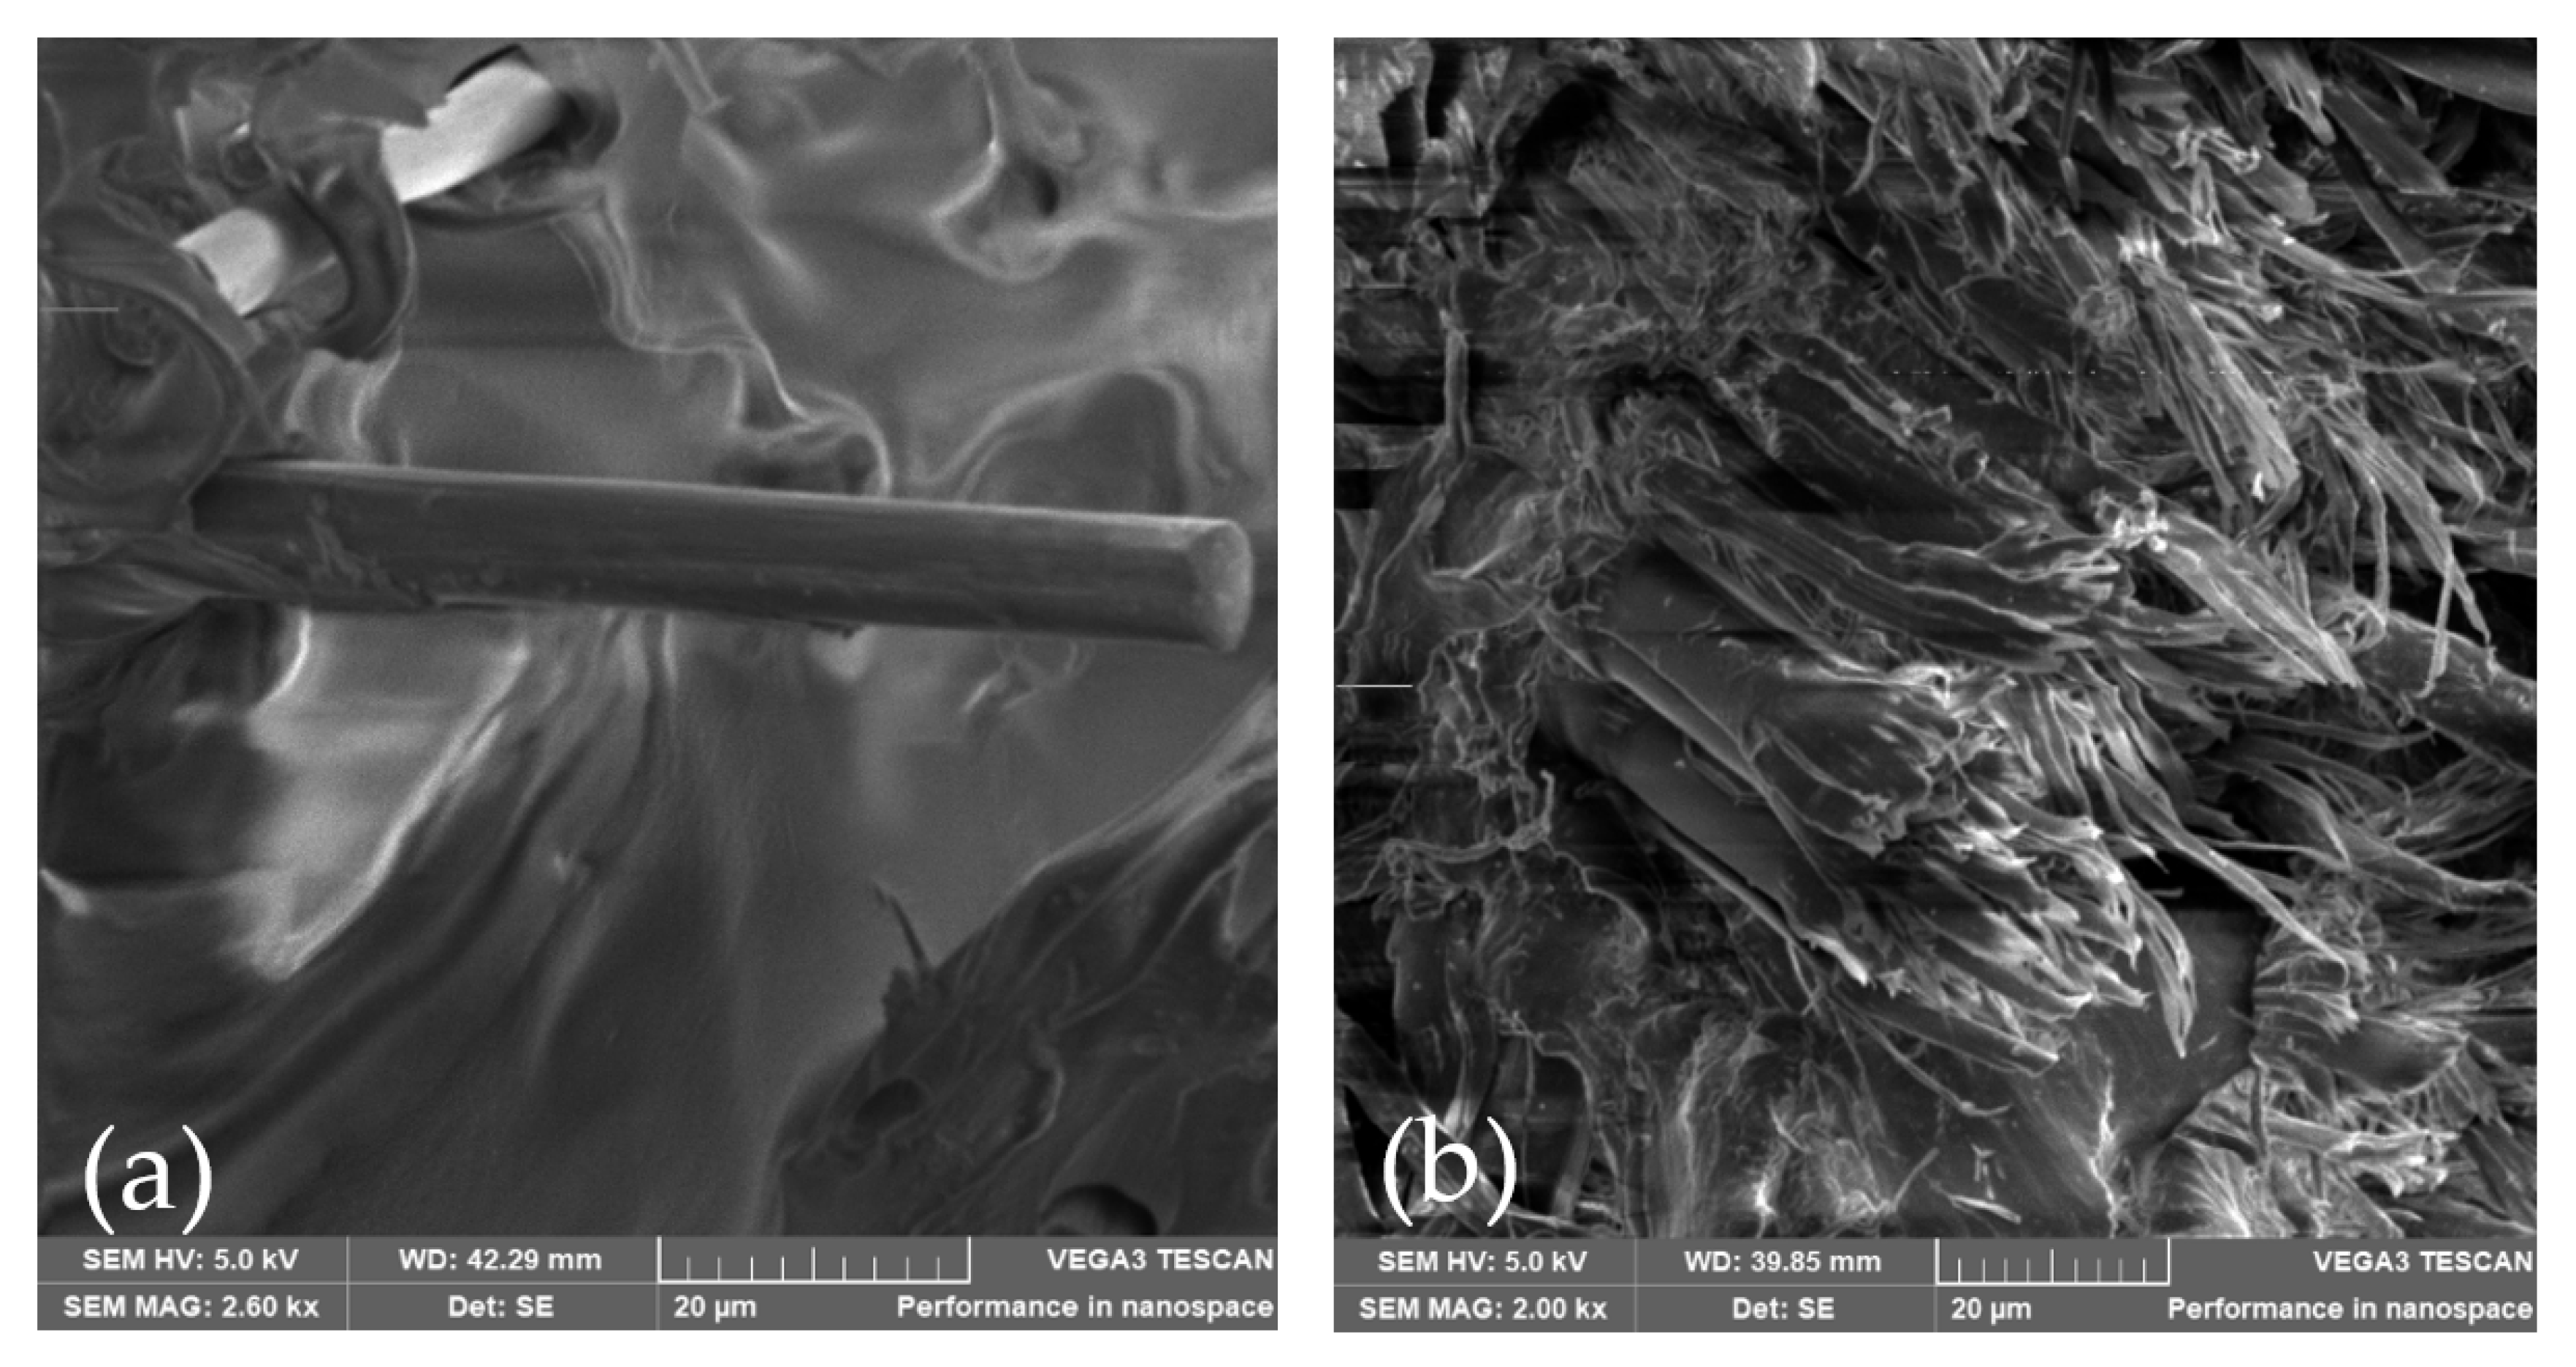
5.4. Failure Analysis
6. Conclusions
Author Contributions
Funding
Institutional Review Board Statement
Informed Consent Statement
Data Availability Statement
Acknowledgments
Conflicts of Interest
References
- Liu, J.; Gaynor, A.T.; Chen, S.; Kang, Z.; Suresh, K.; Takezawa, A.; Li, L.; Kato, J.; Tang, J.; Wang, C.C.L.; et al. Current and future trends in topology optimization for additive manufacturing. Struct. Multidiscip. Optim. 2018, 57, 2457–2483. [Google Scholar] [CrossRef]
- León, B.J.; Díaz-Rodríguez, J.G.; González-Estrada, O.A. Daño en partes de manufactura aditiva reforzadas por fibras continuas. Rev. UIS Ing. 2020, 19, 161–175. [Google Scholar] [CrossRef]
- Hrabe, N.; Gnäupel-Herold, T.; Quinn, T. Fatigue properties of a titanium alloy (Ti–6Al–4V) fabricated via electron beam melting (EBM): Effects of internal defects and residual stress. Int. J. Fatigue 2017, 94, 202–210. [Google Scholar] [CrossRef]
- Cano-Vicent, A.; Tambuwala, M.M.; Hassan, S.S.; Barh, D.; Aljabali, A.A.; Birkett, M.; Arjunan, A.; Serrano-Aroca, Á. Fused deposition modelling: Current status, methodology, applications and future prospects. Addit. Manuf. 2021, 47, 102378. [Google Scholar] [CrossRef]
- Gibson, I.; Rosen, D.; Stucker, B. Additive Manufacturing Technologies; Springer: New York, NY, USA, 2015. [Google Scholar] [CrossRef]
- Parrado-Agudelo, J.Z.; Narváez-Tovar, C. Mechanical characterization of polylactic acid, polycaprolactone and Lay-Fomm 40 parts manufactured by fused deposition modeling, as a function of the printing parameters. ITECKNE 2019, 16, 25–31. [Google Scholar] [CrossRef]
- Faust, J.L.; Kelly, P.G.; Jones, B.D.; Roy-Mayhew, J.D. Effects of Coefficient of Thermal Expansion and Moisture Absorption on the Dimensional Accuracy of Carbon-Reinforced 3D Printed Parts. Polymers 2021, 13, 3637. [Google Scholar] [CrossRef]
- Thomas, G.; Antoni, M.; Gozdz, S. Three Dimensional Printer with Composite Filament Fabrication. U.S. Patent No. 9,156,205, 13 October 2015. [Google Scholar]
- Díaz-Rodríguez, J.G.; Pertúz-Comas, A.D.; González-Estrada, O.A. Mechanical properties for long fibre reinforced fused deposition manufactured composites. Compos. Part B Eng. 2021, 211, 108657. [Google Scholar] [CrossRef]
- Martín, M.J.; Auñón, J.A.; Martín, F. Influence of Infill Pattern on Mechanical Behavior of Polymeric and Composites Specimens Manufactured Using Fused Filament Fabrication Technology. Polymers 2021, 13, 2934. [Google Scholar] [CrossRef]
- Castro, J.T.P.; Meggiolaro, M.A. Fatigue Design Techniques, 3rd ed.; CreateSpace: Scotts Valley, CA, USA, 2016. [Google Scholar]
- Santos, J.D.; Fernández, A.; Ripoll, L.; Blanco, N. Experimental Characterization and Analysis of the In-Plane Elastic Properties and Interlaminar Fracture Toughness of a 3D-Printed Continuous Carbon Fiber-Reinforced Composite. Polymers 2022, 14, 506. [Google Scholar] [CrossRef]
- Saleh, M.A.; Al Haron, M.H.; Saleh, A.A.; Farag, M. Fatigue behavior and life prediction of biodegradable composites of starch reinforced with date palm fibers. Int. J. Fatigue 2017, 103, 216–222. [Google Scholar] [CrossRef]
- Imeri, A.; Fidan, I.; Allen, M.; Wilson, D.A.; Canfield, S. Fatigue analysis of the fiber reinforced additively manufactured objects. Int. J. Adv. Manuf. Technol. 2018, 98, 2717–2724. [Google Scholar] [CrossRef]
- Pertuz, A.D.; Díaz-Cardona, S.; González-Estrada, O.A. Static and fatigue behaviour of continuous fibre reinforced thermoplastic composites manufactured by fused deposition modelling technique. Int. J. Fatigue 2020, 130, 105275. [Google Scholar] [CrossRef]
- González-Estrada, O.A.; Comas, A.D.P.; Rodríguez, J.G.D. Monotonic load datasets for additively manufactured thermoplastic reinforced composites. Data Brief 2020, 29, 105295. [Google Scholar] [CrossRef] [PubMed]
- Ekoi, E.J.; Dickson, A.N.; Dowling, D.P. Investigating the fatigue and mechanical behaviour of 3D printed woven and nonwoven continuous carbon fibre reinforced polymer (CFRP) composites. Compos. Part B Eng. 2021, 212, 108704. [Google Scholar] [CrossRef]
- Wang, K.; Xie, X.; Wang, J.; Zhao, A.; Peng, Y.; Rao, Y. Effects of infill characteristics and strain rate on the deformation and failure properties of additively manufactured polyamide-based composite structures. Results Phys. 2020, 18, 103346. [Google Scholar] [CrossRef]
- Bárnik, F.; Vaško, M.; Handrik, M.; Dorčiak, F.; Majko, J. Comparing mechanical properties of composites structures on Onyx base with different density and shape of fill. Transp. Res. Procedia 2019, 40, 616–622. [Google Scholar] [CrossRef]
- Kozior, T. Rheological Properties of Polyamide PA 2200 in SLS Technology. Teh. Vjesn.-Tech. Gaz. 2020, 27, 1092–1100. [Google Scholar] [CrossRef]
- González-Estrada, O.A.; Pertuz, A.; Mendez, J.E.Q. Evaluation of Tensile Properties and Damage of Continuous Fibre Reinforced 3D-Printed Parts. Key Eng. Mater. 2018, 774, 161–166. [Google Scholar] [CrossRef]
- Dutra, T.A.; Ferreira, R.T.L.; Resende, H.B.; Guimarães, A. Mechanical characterization and asymptotic homogenization of 3D-printed continuous carbon fiber-reinforced thermoplastic. J. Braz. Soc. Mech. Sci. Eng. 2019, 41, 133. [Google Scholar] [CrossRef]
- Bochnia, J.; Blasiak, M.; Kozior, T. A Comparative Study of the Mechanical Properties of FDM 3D Prints Made of PLA and Carbon Fiber-Reinforced PLA for Thin-Walled Applications. Materials 2021, 14, 7062. [Google Scholar] [CrossRef]
- Kabir, S.M.F.; Mathur, K.; Seyam, A.-F.M. A critical review on 3D printed continuous fiber-reinforced composites: History, mechanism, materials and properties. Compos. Struct. 2020, 232, 111476. [Google Scholar] [CrossRef]
- Wang, X.; Jiang, M.; Zhou, Z.W.; Gou, J.H.; Hui, D. 3D printing of polymer matrix composites: A review and prospective. Compos. Part B Eng. 2017, 110, 442–458. [Google Scholar] [CrossRef]
- Khosravani, M.R.; Berto, F.; Ayatollahi, M.R.; Reinicke, T. Fracture behavior of additively manufactured components: A review. Theor. Appl. Fract. Mech. 2020, 109, 102763. [Google Scholar] [CrossRef]
- Goh, G.D.; Yap, Y.L.; Agarwala, S.; Yeong, W.Y. Recent Progress in Additive Manufacturing of Fiber Reinforced Polymer Composite. Adv. Mater. Technol. 2018, 4, 1800271. [Google Scholar] [CrossRef]
- Ngo, T.; Khashani, A.; Imbalzano, G.; Nyugen, K.; Hui, D. Additive manufacturing (3D printing): A review of materials, methods, applications and challenges. Compos. Part B Eng. 2018, 143, 172–796. [Google Scholar] [CrossRef]
- Wickramasinghe, S.; Do, T.; Tran, P. FDM-Based 3D printing of polymer and associated composite: A review on mechanical properties, defects and treatments. Polymers 2020, 12, 1529. [Google Scholar] [CrossRef]
- Awaja, F.; Zhang, S.; Tripathi, M.; Nikiforov, A.; Pugno, N. Cracks, microcracks and fracture in polymer structures: Formation, detection, autonomic repair. Prog. Mater. Sci. 2016, 83, 536–573. [Google Scholar] [CrossRef]
- Araújo, H.; Leite, M.; Ribeiro, A.; Deus, A.; Reis, L.; Vaz, M.F. Investigating the contribution of geometry on the failure of cellular core structures obtained by additive manufacturing. Frat. Integrità Strutt. 2019, 13, 478–486. [Google Scholar] [CrossRef]
- Chacón, J.M.; Caminero, M.A.; García-Plaza, E.; Núñez, P.J. Additive manufacturing of PLA structures using fused deposition modelling: Effect of process parameters on mechanical properties and their optimal selection. Mater. Des. 2017, 124, 143–157. [Google Scholar] [CrossRef]
- REV 5.0—01/08/2021, Markforged Composites Mechanical Properties. Available online: http://static.markforged.com/downloads/composites-data-sheet.pdf (accessed on 1 August 2021).
- Melenka, G.W.; Cheung, B.K.O.; Schofield, J.S.; Dawson, M.R.; Carey, J.P. Evaluation and prediction of the tensile properties of continuous fiber-reinforced 3D printed structures. Compos. Struct. 2016, 153, 866–875. [Google Scholar] [CrossRef]
- Gibson, L.J.; Ashby, M.F. Cellular Solids. Structure and Properties, 2nd ed.; Cambridge University Press: Cambridge, UK, 2014. [Google Scholar] [CrossRef]
- Rodriguez, J.F.; Thomas, J.P.; Renaud, J.E. Characterization of the mesostructure of fused-deposition acrylonitrile-butadiene-styrene materials. Rapid Prototyp. J. 2000, 6, 175–186. [Google Scholar] [CrossRef]
- Al Abadi, H.; Thai, H.-T.; Paton-Cole, V.; Patel, V. Elastic properties of 3D printed fibre-reinforced structures. Compos. Struct. 2018, 193, 8–18. [Google Scholar] [CrossRef]
- Ma, H.; Bai, X.; Ran, Y.; Wei, X.; An, Z. Modeling the Effect of Stress Ratio, Loading Frequency and Fiber Orientation on the Fatigue Response of Composite Materials. Polymers 2022, 14, 2772. [Google Scholar] [CrossRef]
- Barbero, E.J. Finite Element Analysis of Composite Materials Using ANSYS, 2nd ed.; CRC Press: Boca Raton, FL, USA, 2013. [Google Scholar]
- Papon, E.A.; Haque, A. Tensile properties, void contents, dispersion and fracture behaviour of 3D printed carbon nanofiber reinforced composites. J. Reinf. Plast. Compos. 2018, 37, 381–395. [Google Scholar] [CrossRef]


| Material | E1 Tension [GPa] | σ1 Tension [MPa] | E1 Bending [GPa] | σ1 Bending [MPa] | Relative Density |
|---|---|---|---|---|---|
| Onyx | 2.4 | 40 | 3.0 | 71 | 1.1 |
| Standard | ASTM D638 | ASTM D638 | ASTM D790 | ASTM D790 | NA |
| Kevlar fiber | 27 | 610 | 26 | 240 | 1.2 |
| Standard | ASTM D3039 | ASTM D3039 | ASTM D790 | ASTM D790 | NA |
| Onyx® Matrix | |
|---|---|
| Layer height | 0.1 mm |
| Fill pattern type | Triangular |
| Matrix fill density | 28% |
| Number of layers | 4 |
| Number of walls | 2 |
| Continuous fiber | Kevlar |
| Region | Young Modulus, [MPa] | Poisson Modulus | Shear Modulus, [MPa] | ||||||
|---|---|---|---|---|---|---|---|---|---|
| E1 | E2 | E3 | v12 | v23 | v13 | G12 | G23 | G13 | |
| Onyx® (layers and wall) | 1260 | 957.3 | 957.3 | 0.315 | 0.239 | 0.315 | 201.5 | 354.5 | 201.5 |
| Kevlar | 24873 | 2344 | 2344 | 0.378 | 0.503 | 0.378 | 682.7 | 559 | 682.7 |
| Triangular filling | 132 | 132 | 397.5 | 0.333 | 0.116 | 0.116 | 49.7 | 147.2 | 147.2 |
| Onyx + Kevlar Simplified Model | |
|---|---|
| E1 (MPa) | 4487 |
| E2 (MPa) | 895 |
| E3 (MPa) | 1011.5 |
| v12 | 0.4535 |
| v23 | 0.3701 |
| v13 | 0.2566 |
| G12 (MPa) | 309 |
| G23 (MPa) | 287 |
| G13 (MPa) | 288 |
| Sample Group | Deflection (%) | Deflection, Y (mm) | σ (MPa) | Nf |
|---|---|---|---|---|
| 1 | 92.3 | 12 | 96.2 | 15 |
| 2 | 88.5 | 11.5 | 79.9 | 248 |
| 3 | 86.2 | 11.2 | 71.5 | 460 |
| 4 | 84.7 | 11.0 | 65.1 | 711 |
Publisher’s Note: MDPI stays neutral with regard to jurisdictional claims in published maps and institutional affiliations. |
© 2022 by the authors. Licensee MDPI, Basel, Switzerland. This article is an open access article distributed under the terms and conditions of the Creative Commons Attribution (CC BY) license (https://creativecommons.org/licenses/by/4.0/).
Share and Cite
Pertuz-Comas, A.D.; Díaz, J.G.; Meneses-Duran, O.J.; Niño-Álvarez, N.Y.; León-Becerra, J. Flexural Fatigue in a Polymer Matrix Composite Material Reinforced with Continuous Kevlar Fibers Fabricated by Additive Manufacturing. Polymers 2022, 14, 3586. https://0-doi-org.brum.beds.ac.uk/10.3390/polym14173586
Pertuz-Comas AD, Díaz JG, Meneses-Duran OJ, Niño-Álvarez NY, León-Becerra J. Flexural Fatigue in a Polymer Matrix Composite Material Reinforced with Continuous Kevlar Fibers Fabricated by Additive Manufacturing. Polymers. 2022; 14(17):3586. https://0-doi-org.brum.beds.ac.uk/10.3390/polym14173586
Chicago/Turabian StylePertuz-Comas, Alberto David, Jorge G. Díaz, Oscar Javier Meneses-Duran, Nixon Yesid Niño-Álvarez, and Juan León-Becerra. 2022. "Flexural Fatigue in a Polymer Matrix Composite Material Reinforced with Continuous Kevlar Fibers Fabricated by Additive Manufacturing" Polymers 14, no. 17: 3586. https://0-doi-org.brum.beds.ac.uk/10.3390/polym14173586