
Thermal, Mechanical, and Morphological Characterisations of Graphene Nanoplatelet/Graphene Oxide/High-Hard-Segment Polyurethane Nanocomposite: A Comparative Study
 , , and
Abstract
:1. Introduction
2. Experimental Method
2.1. Materials
2.2. Preparation of Graphene Nanoplatelets (GNP)
2.3. Preparation of Graphene Oxide (GO)
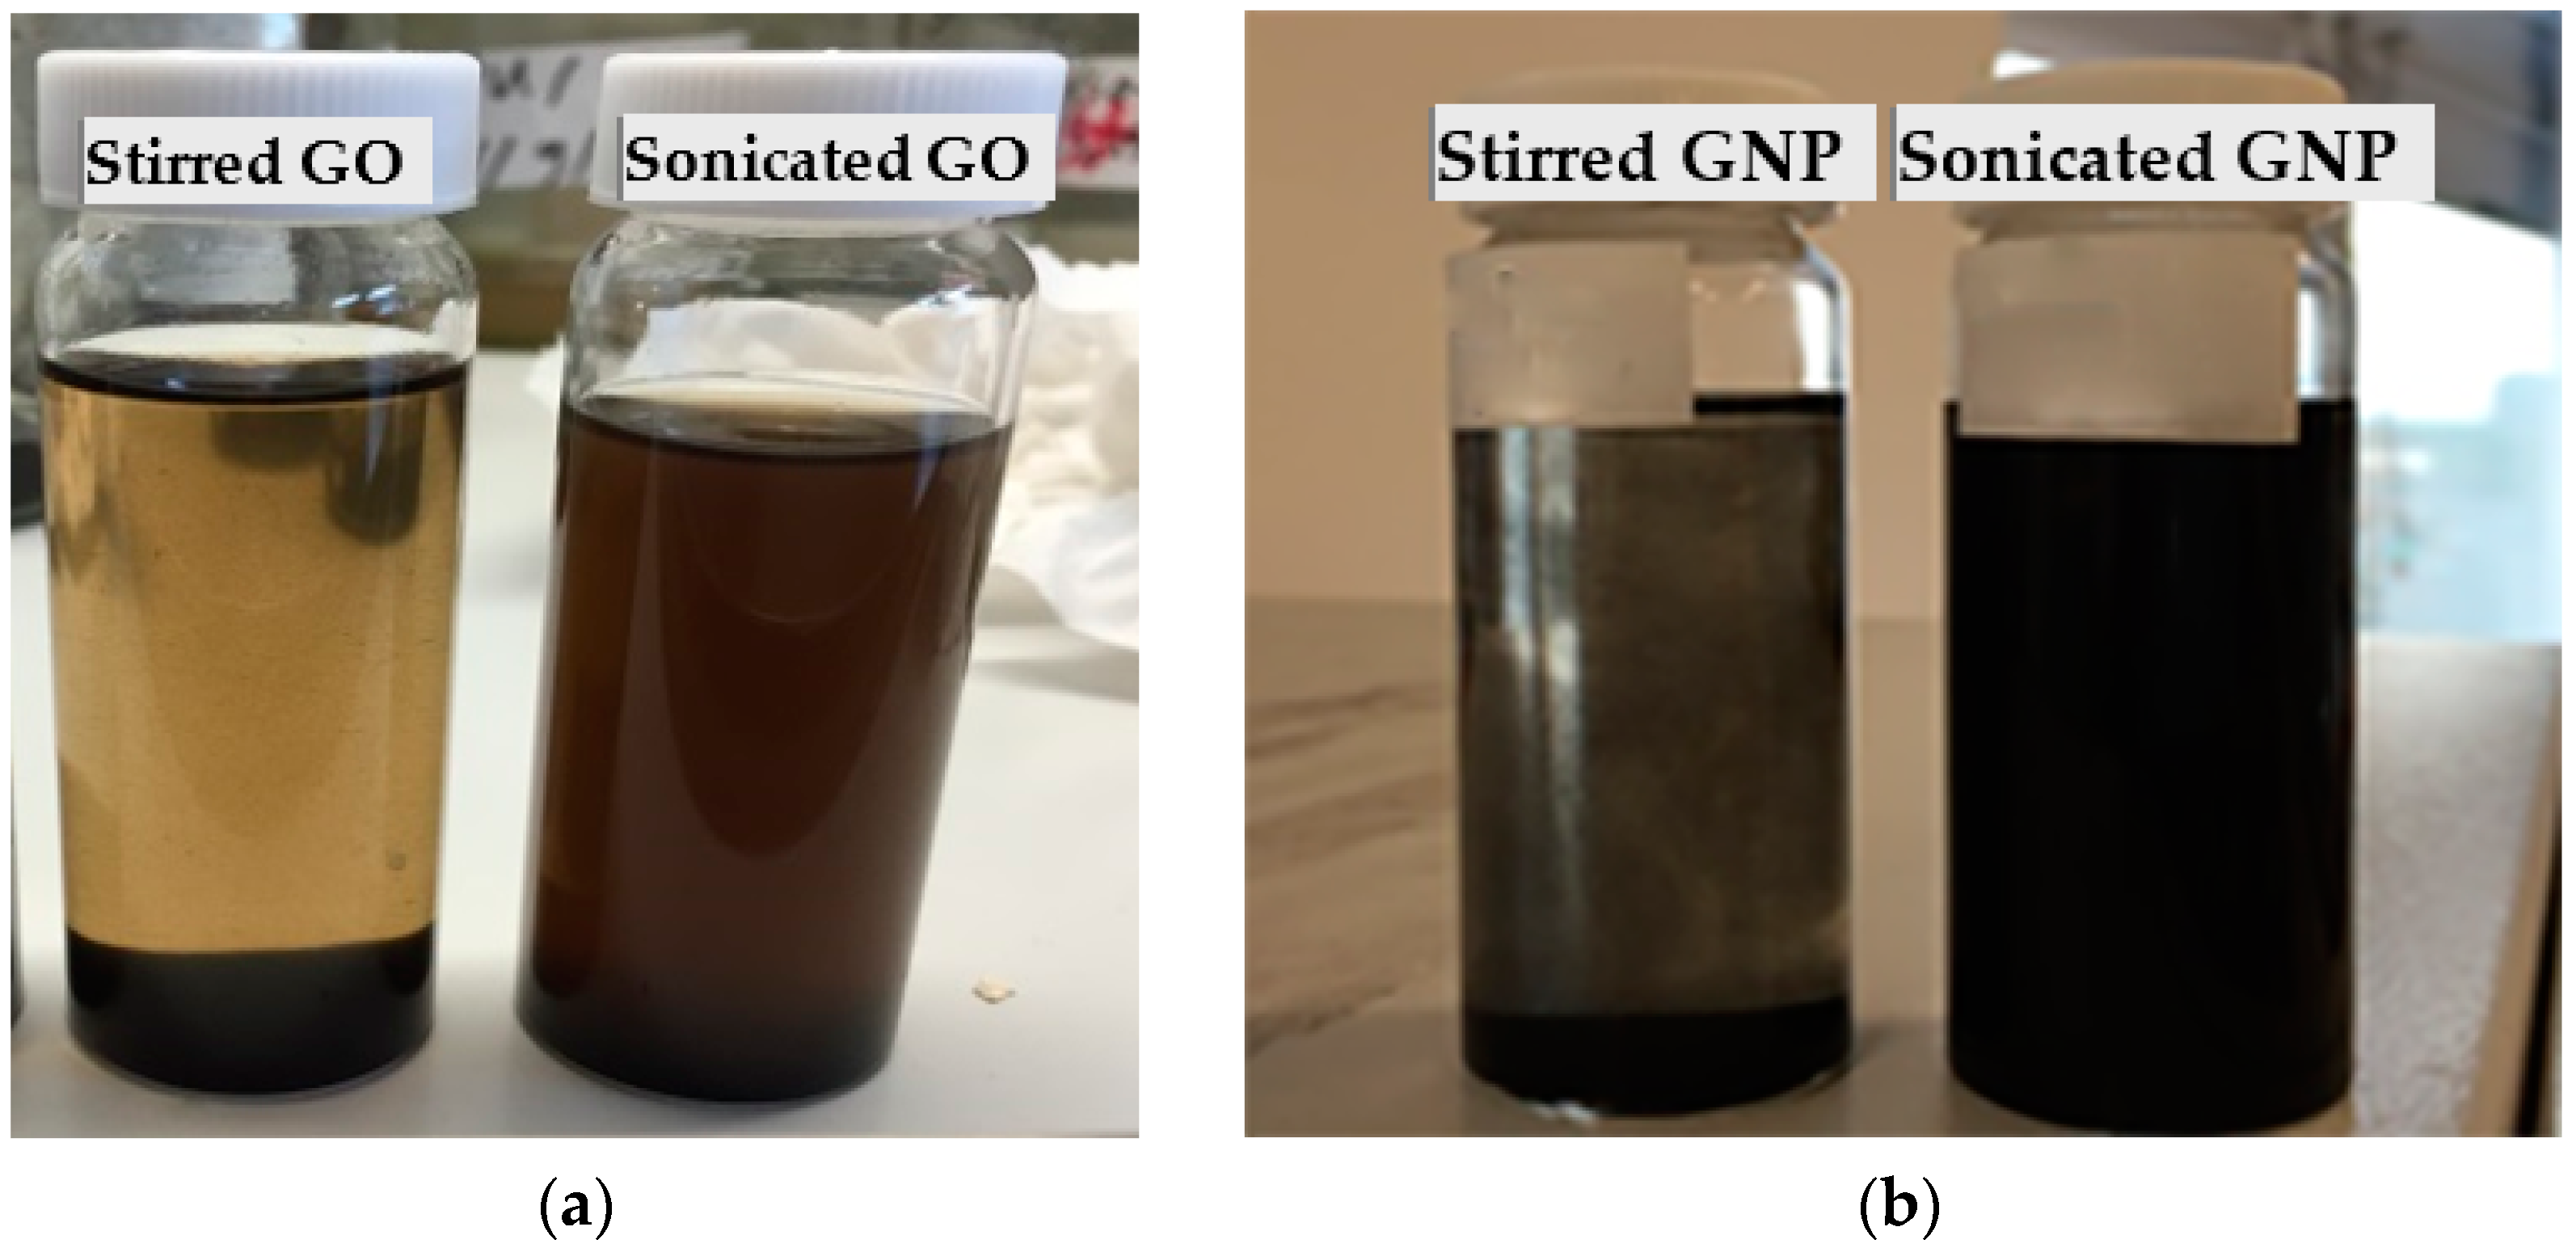
2.4. Dispersion Techniques
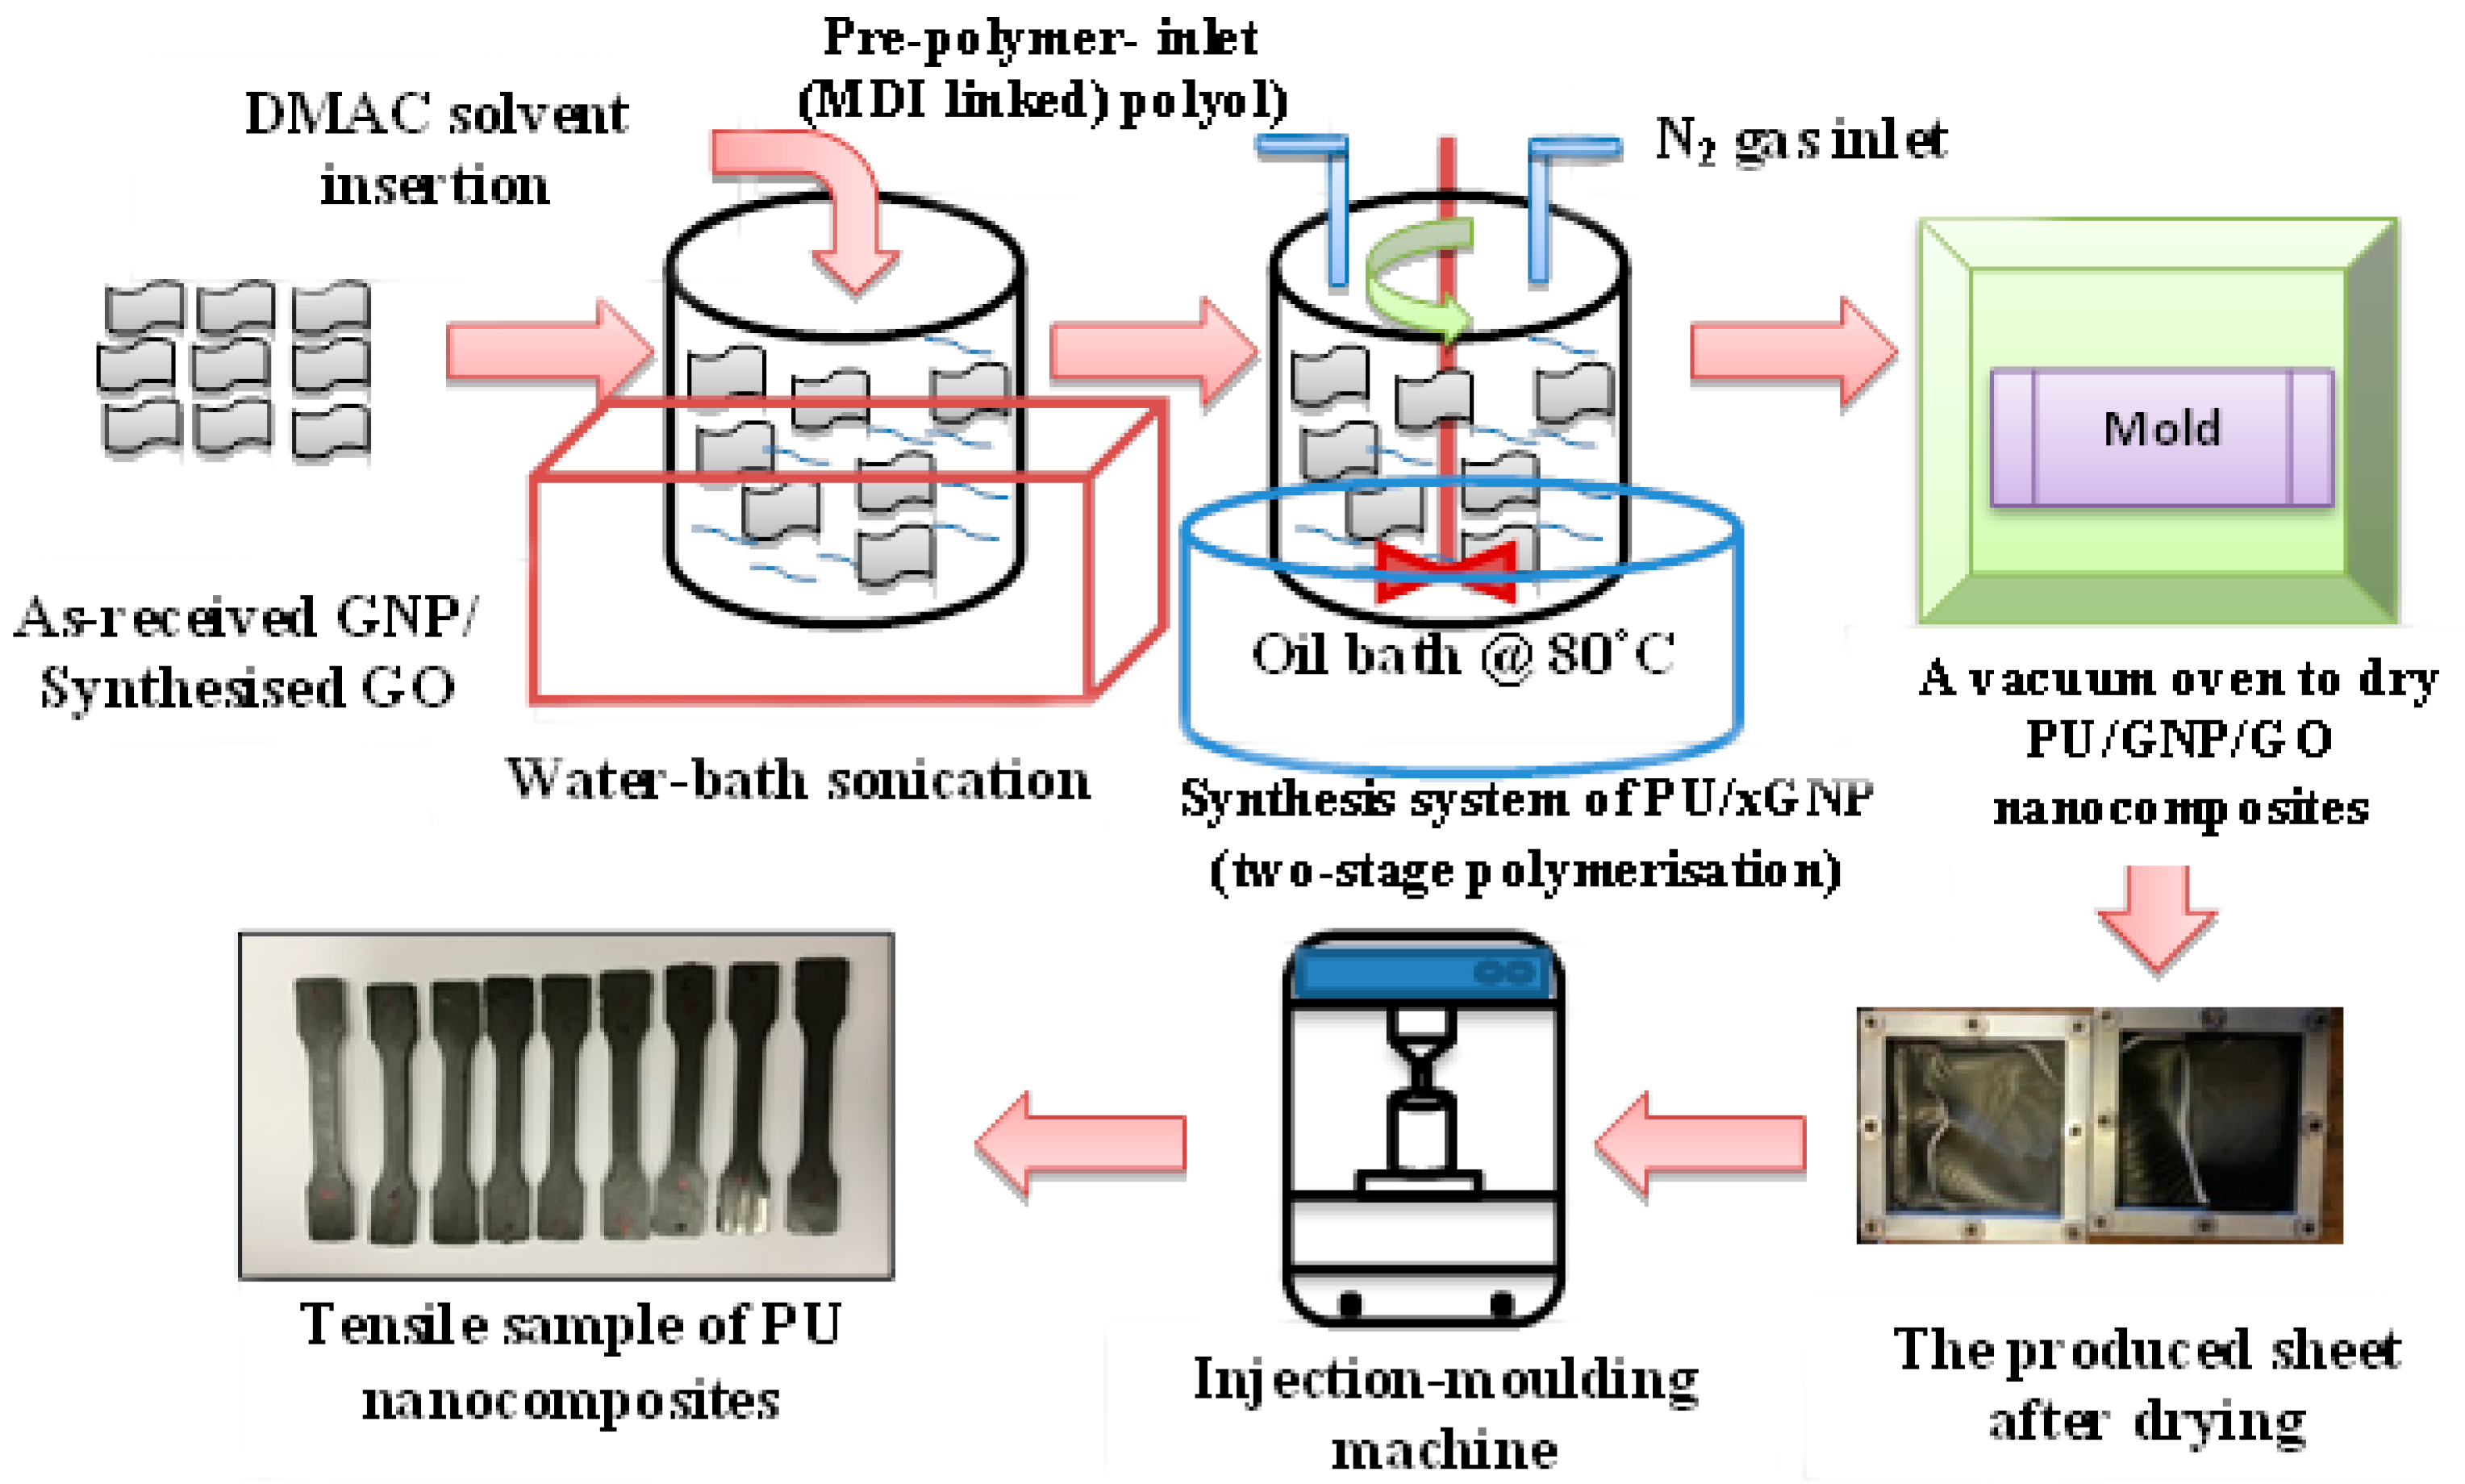
2.5. Preparation of PU/GNP and PU/GO Nanocomposites
2.6. Characterisation and Measurements
2.6.1. Thermogravimetric Analysis (TGA)
2.6.2. Differential Scanning Calorimetric Analysis (DSC)
2.6.3. X-ray Diffraction (XRD)
2.6.4. Small-Angle X-ray Scattering (SAXS)
2.6.5. Transmission Electron Microscopy (TEM)
2.6.6. Scanning Electron Microscopy (SEM)
2.6.7. Mechanical Test
3. Results and Discussion
3.1. Characterisation of Structure and Morphology of GNP/GO
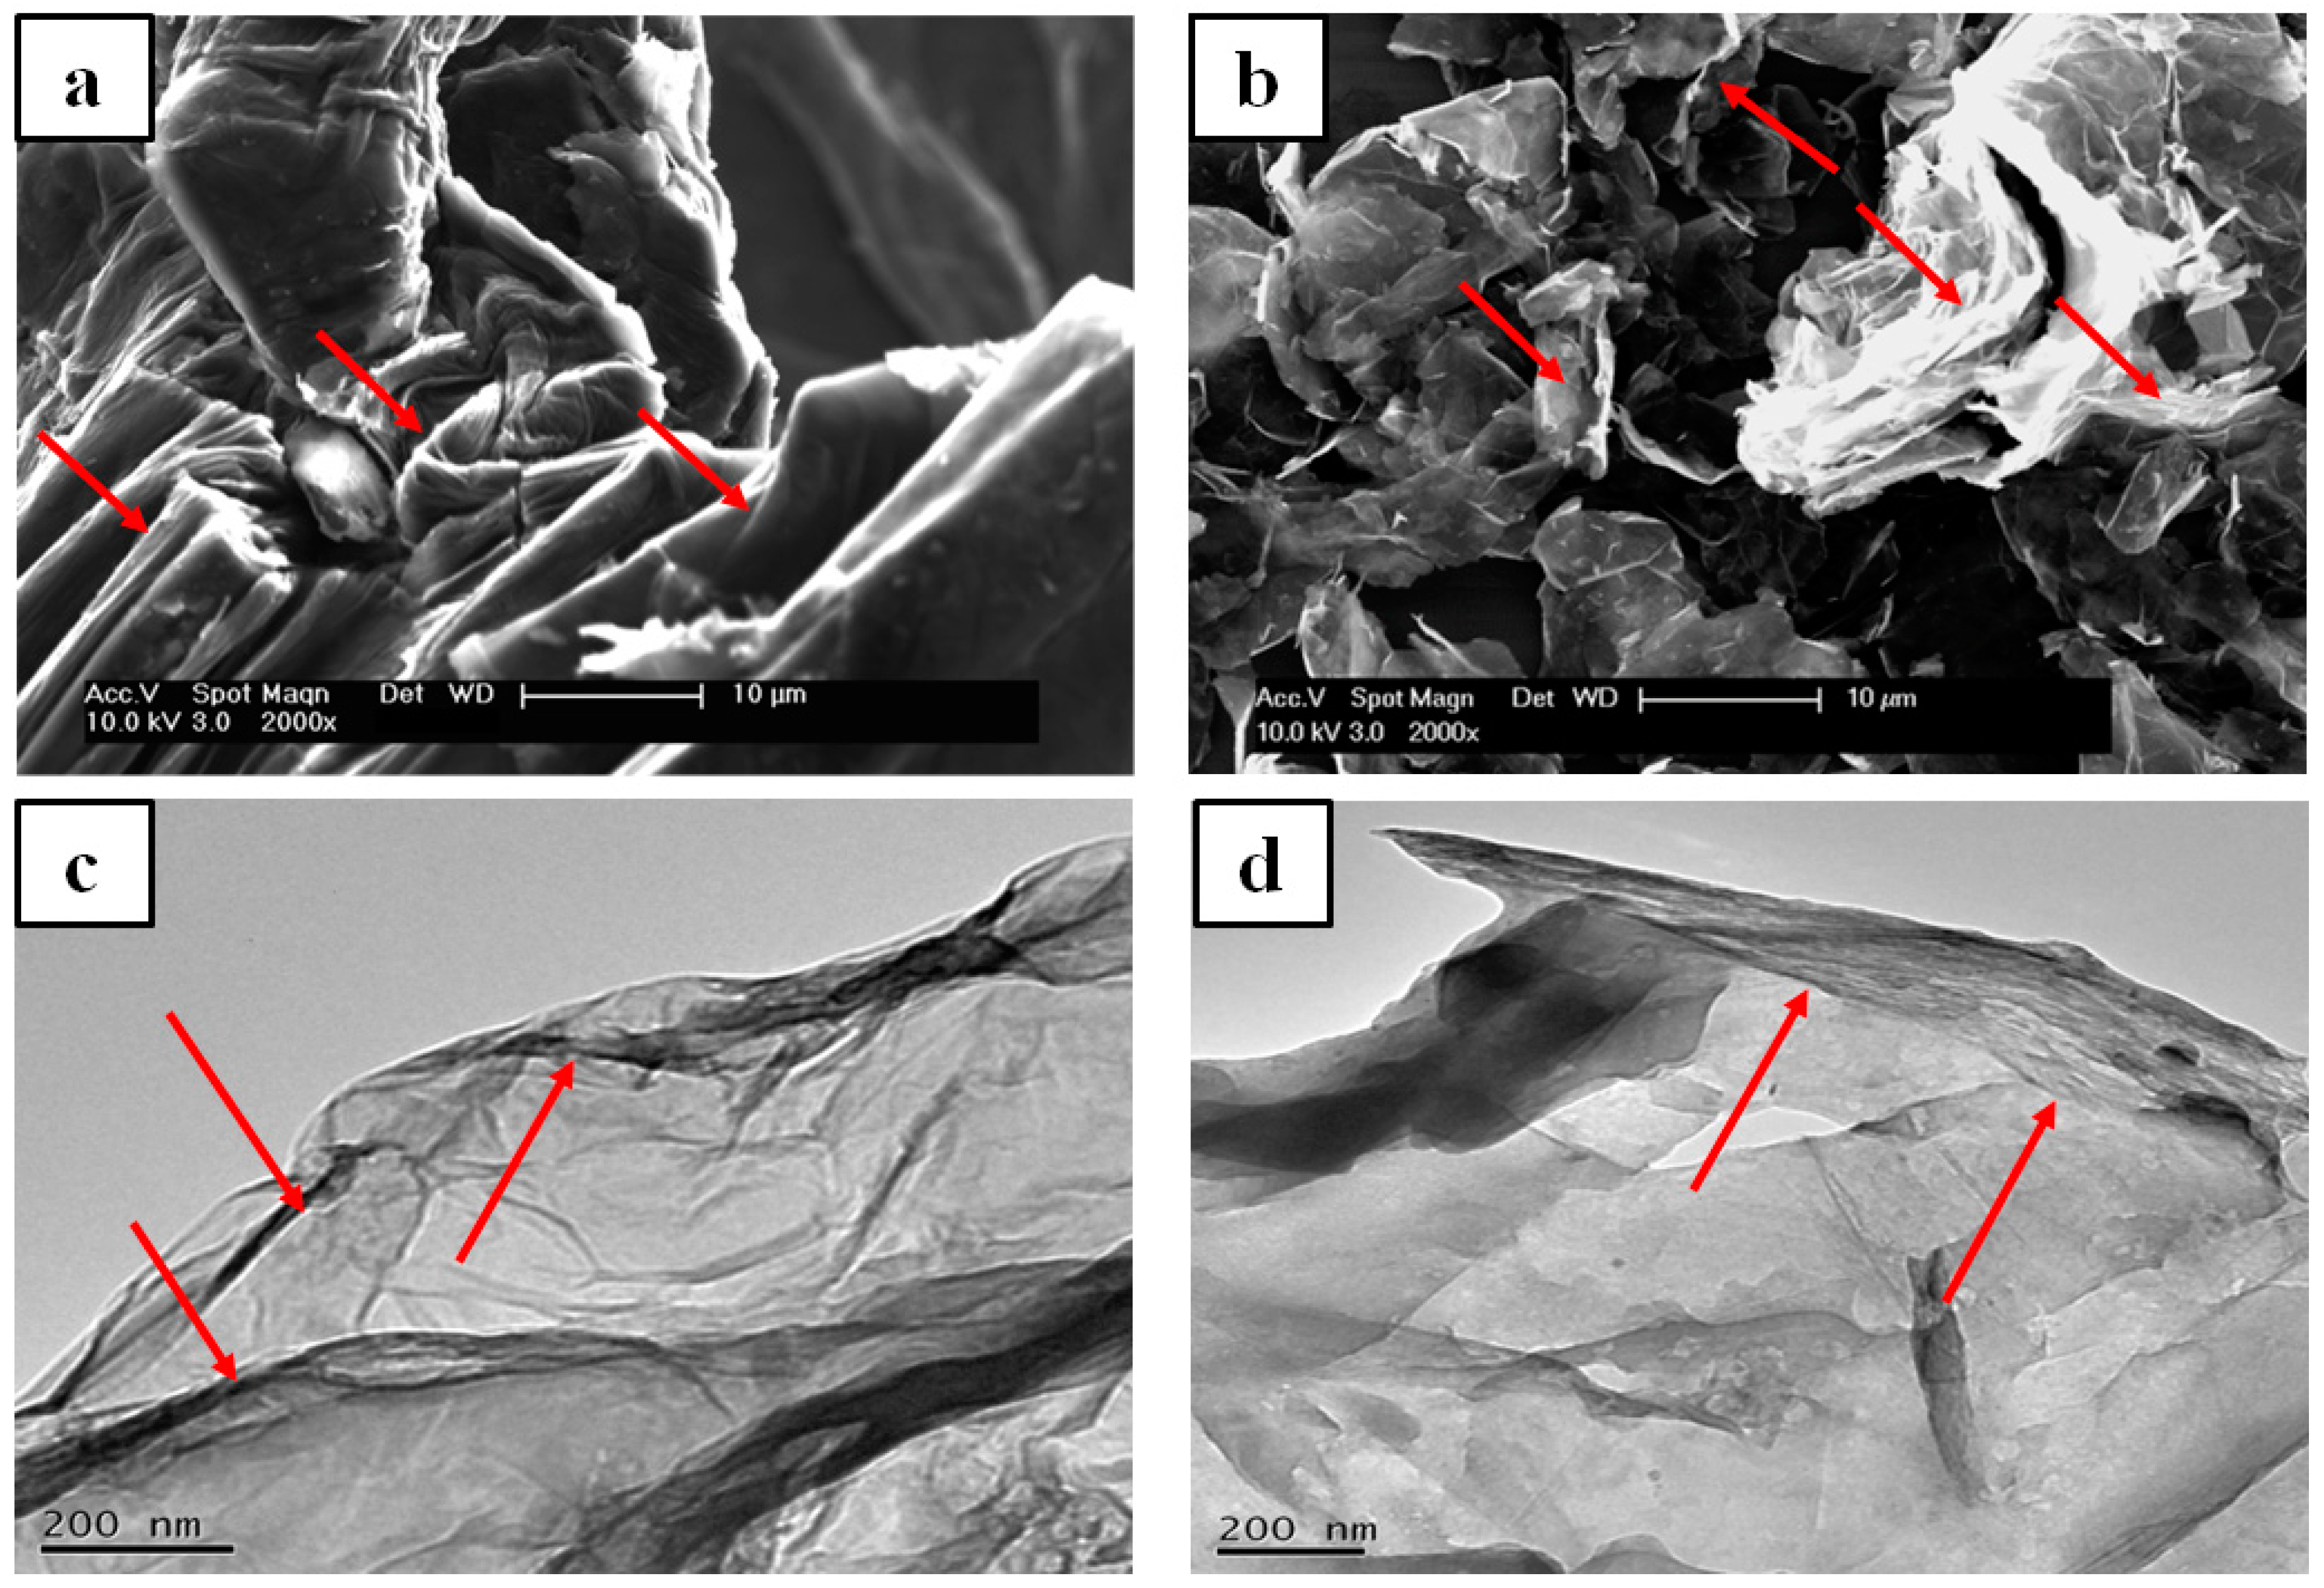
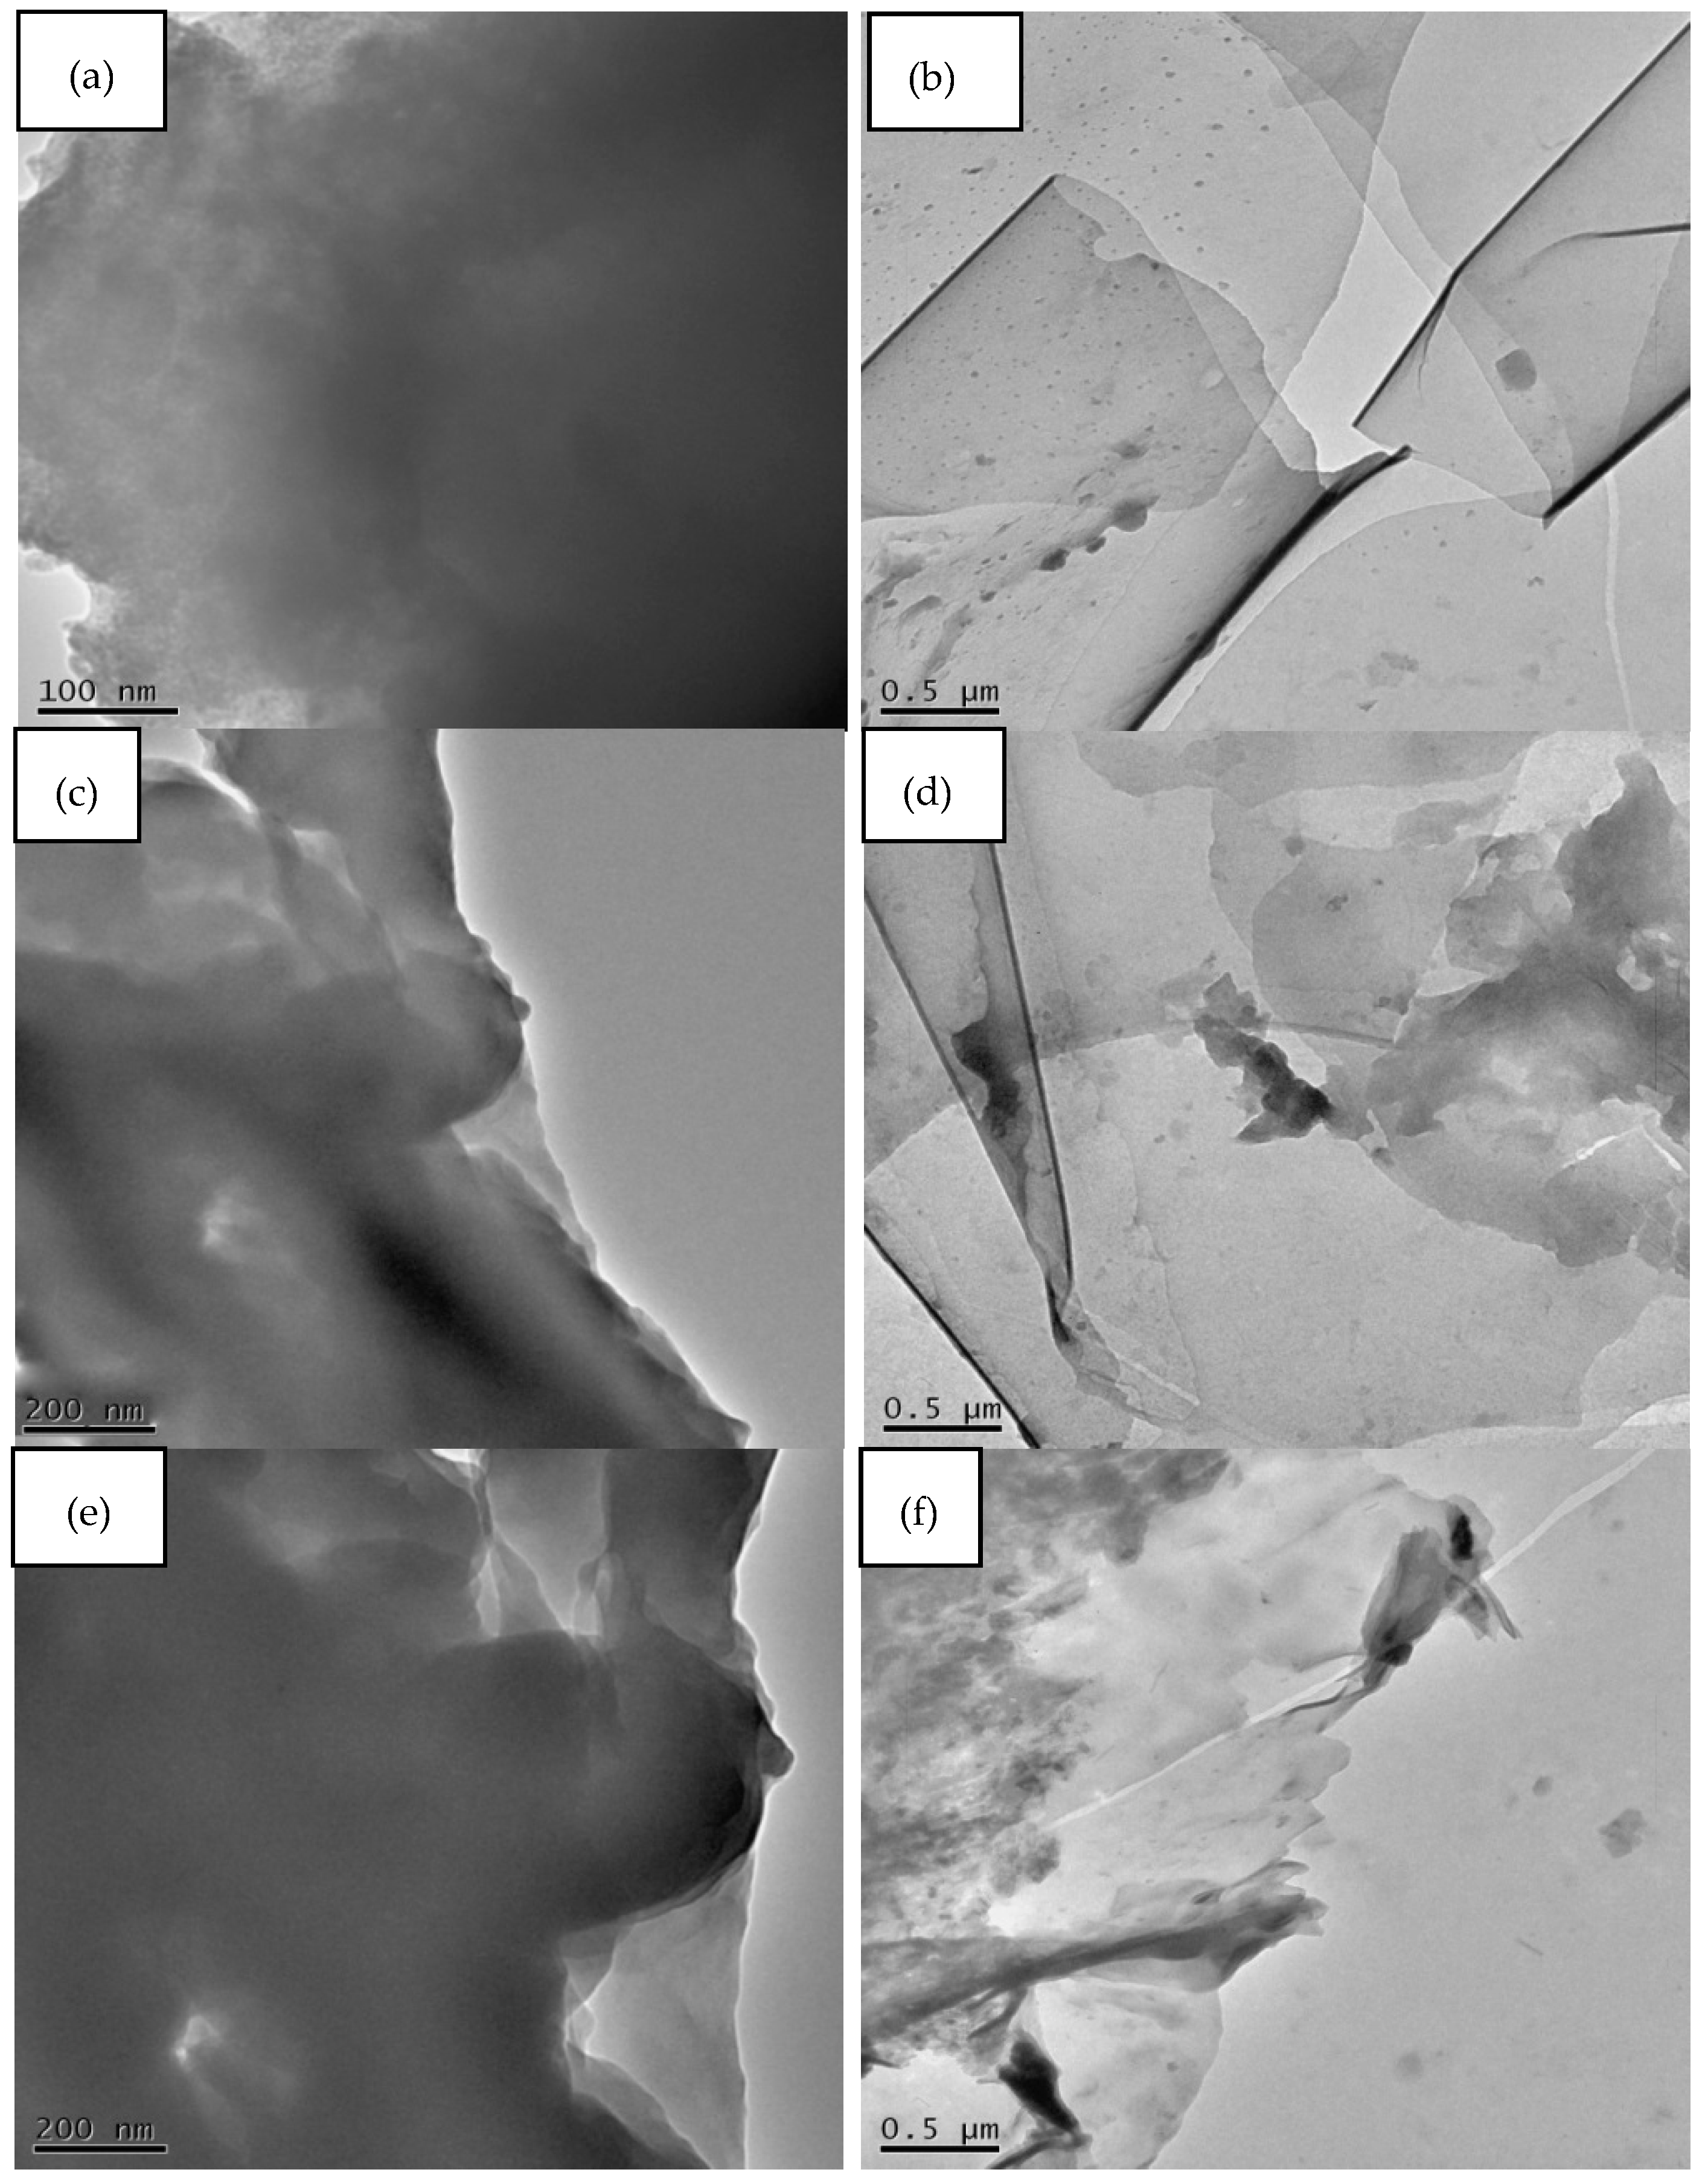
3.1.1. SEM and TEM Analysis
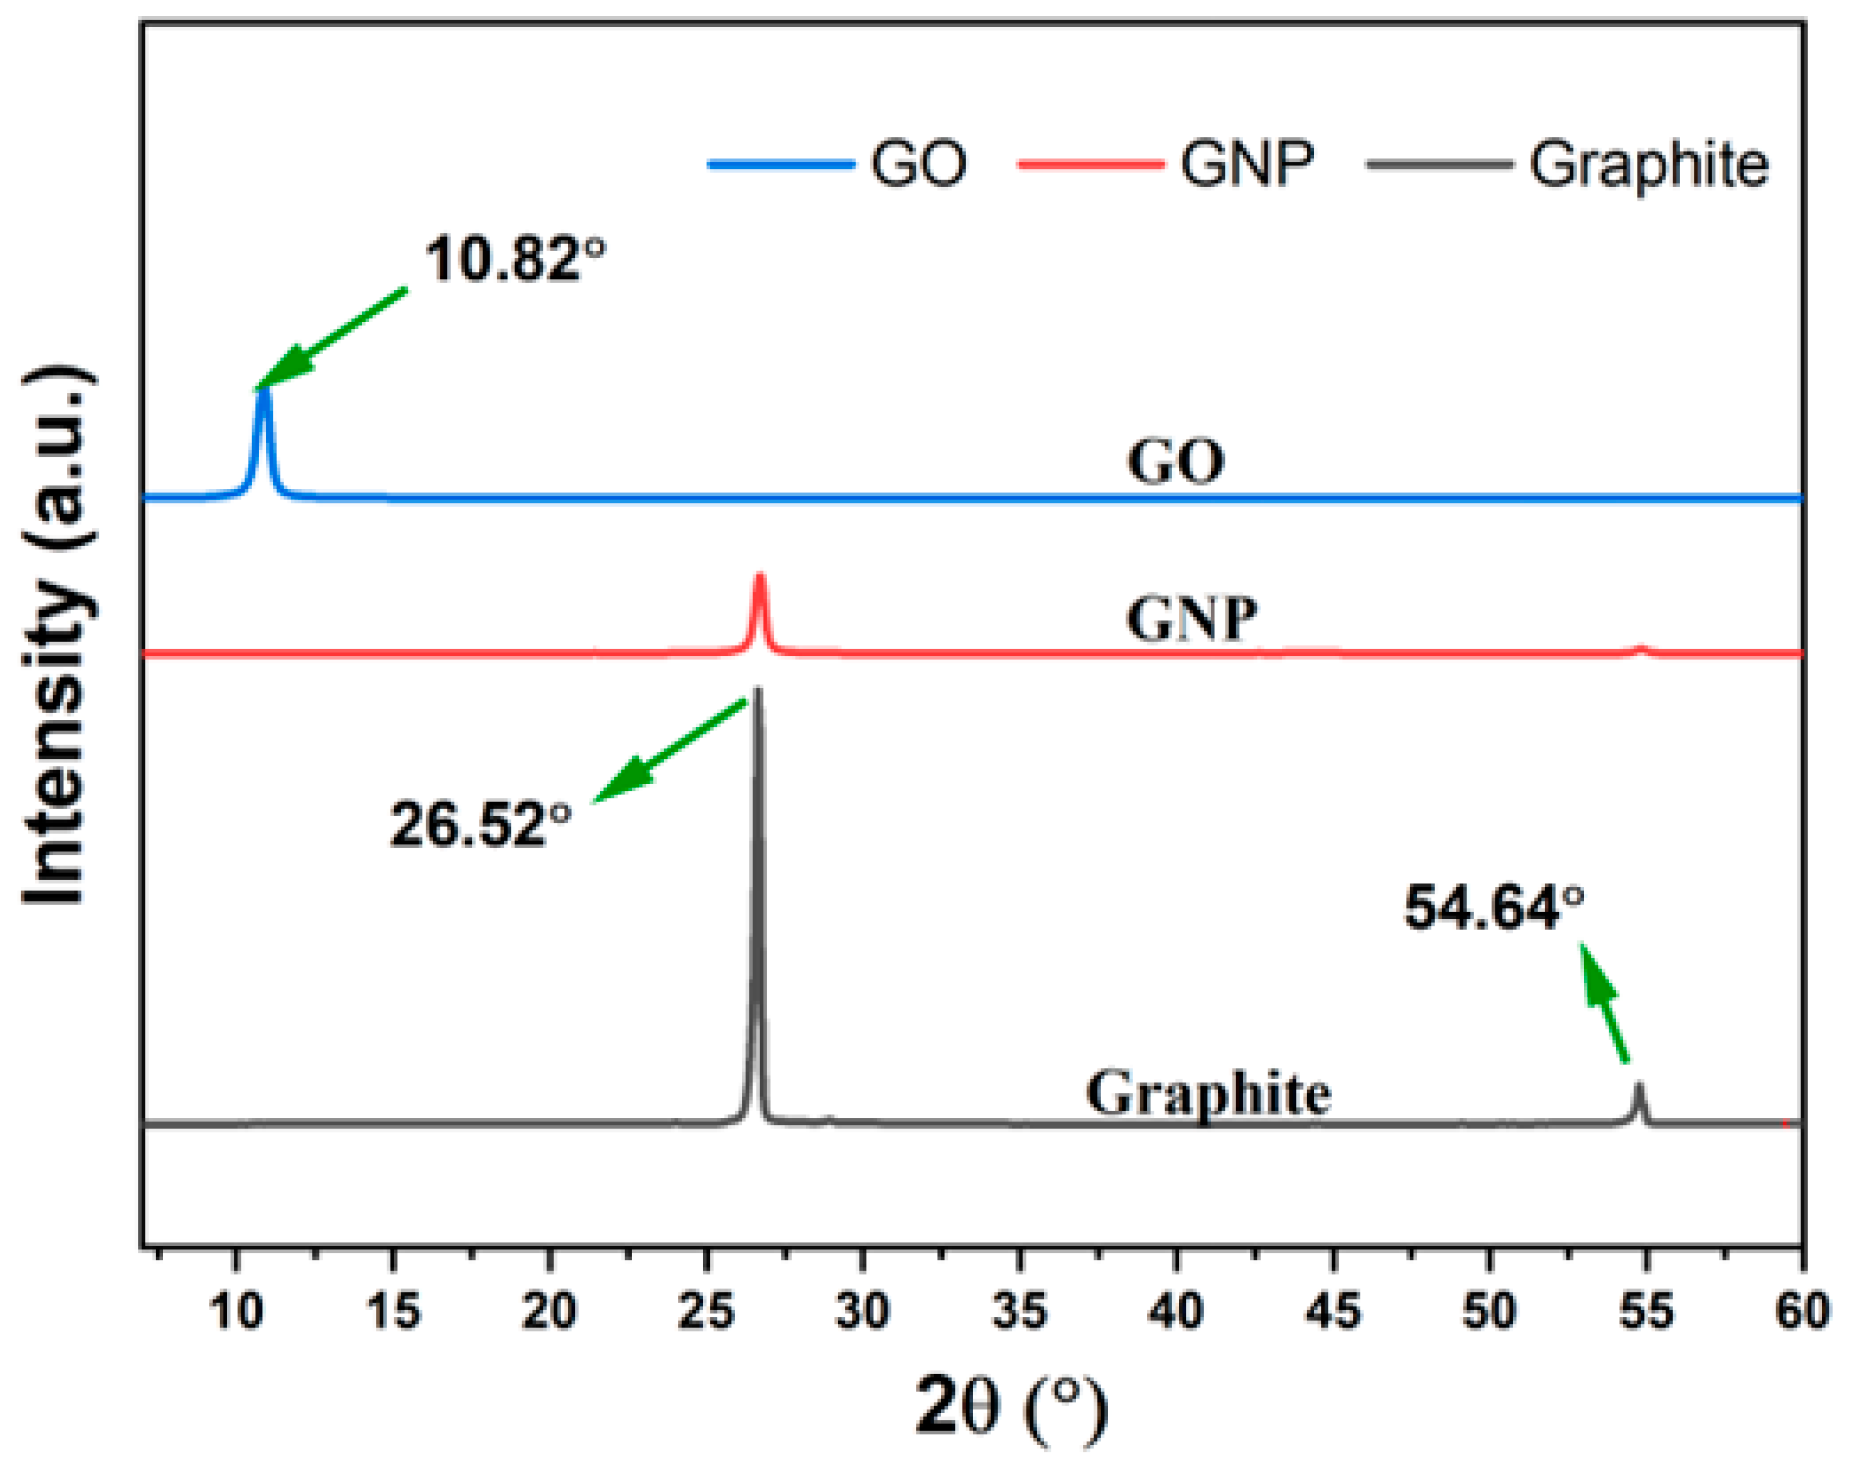
3.1.2. XRD Results
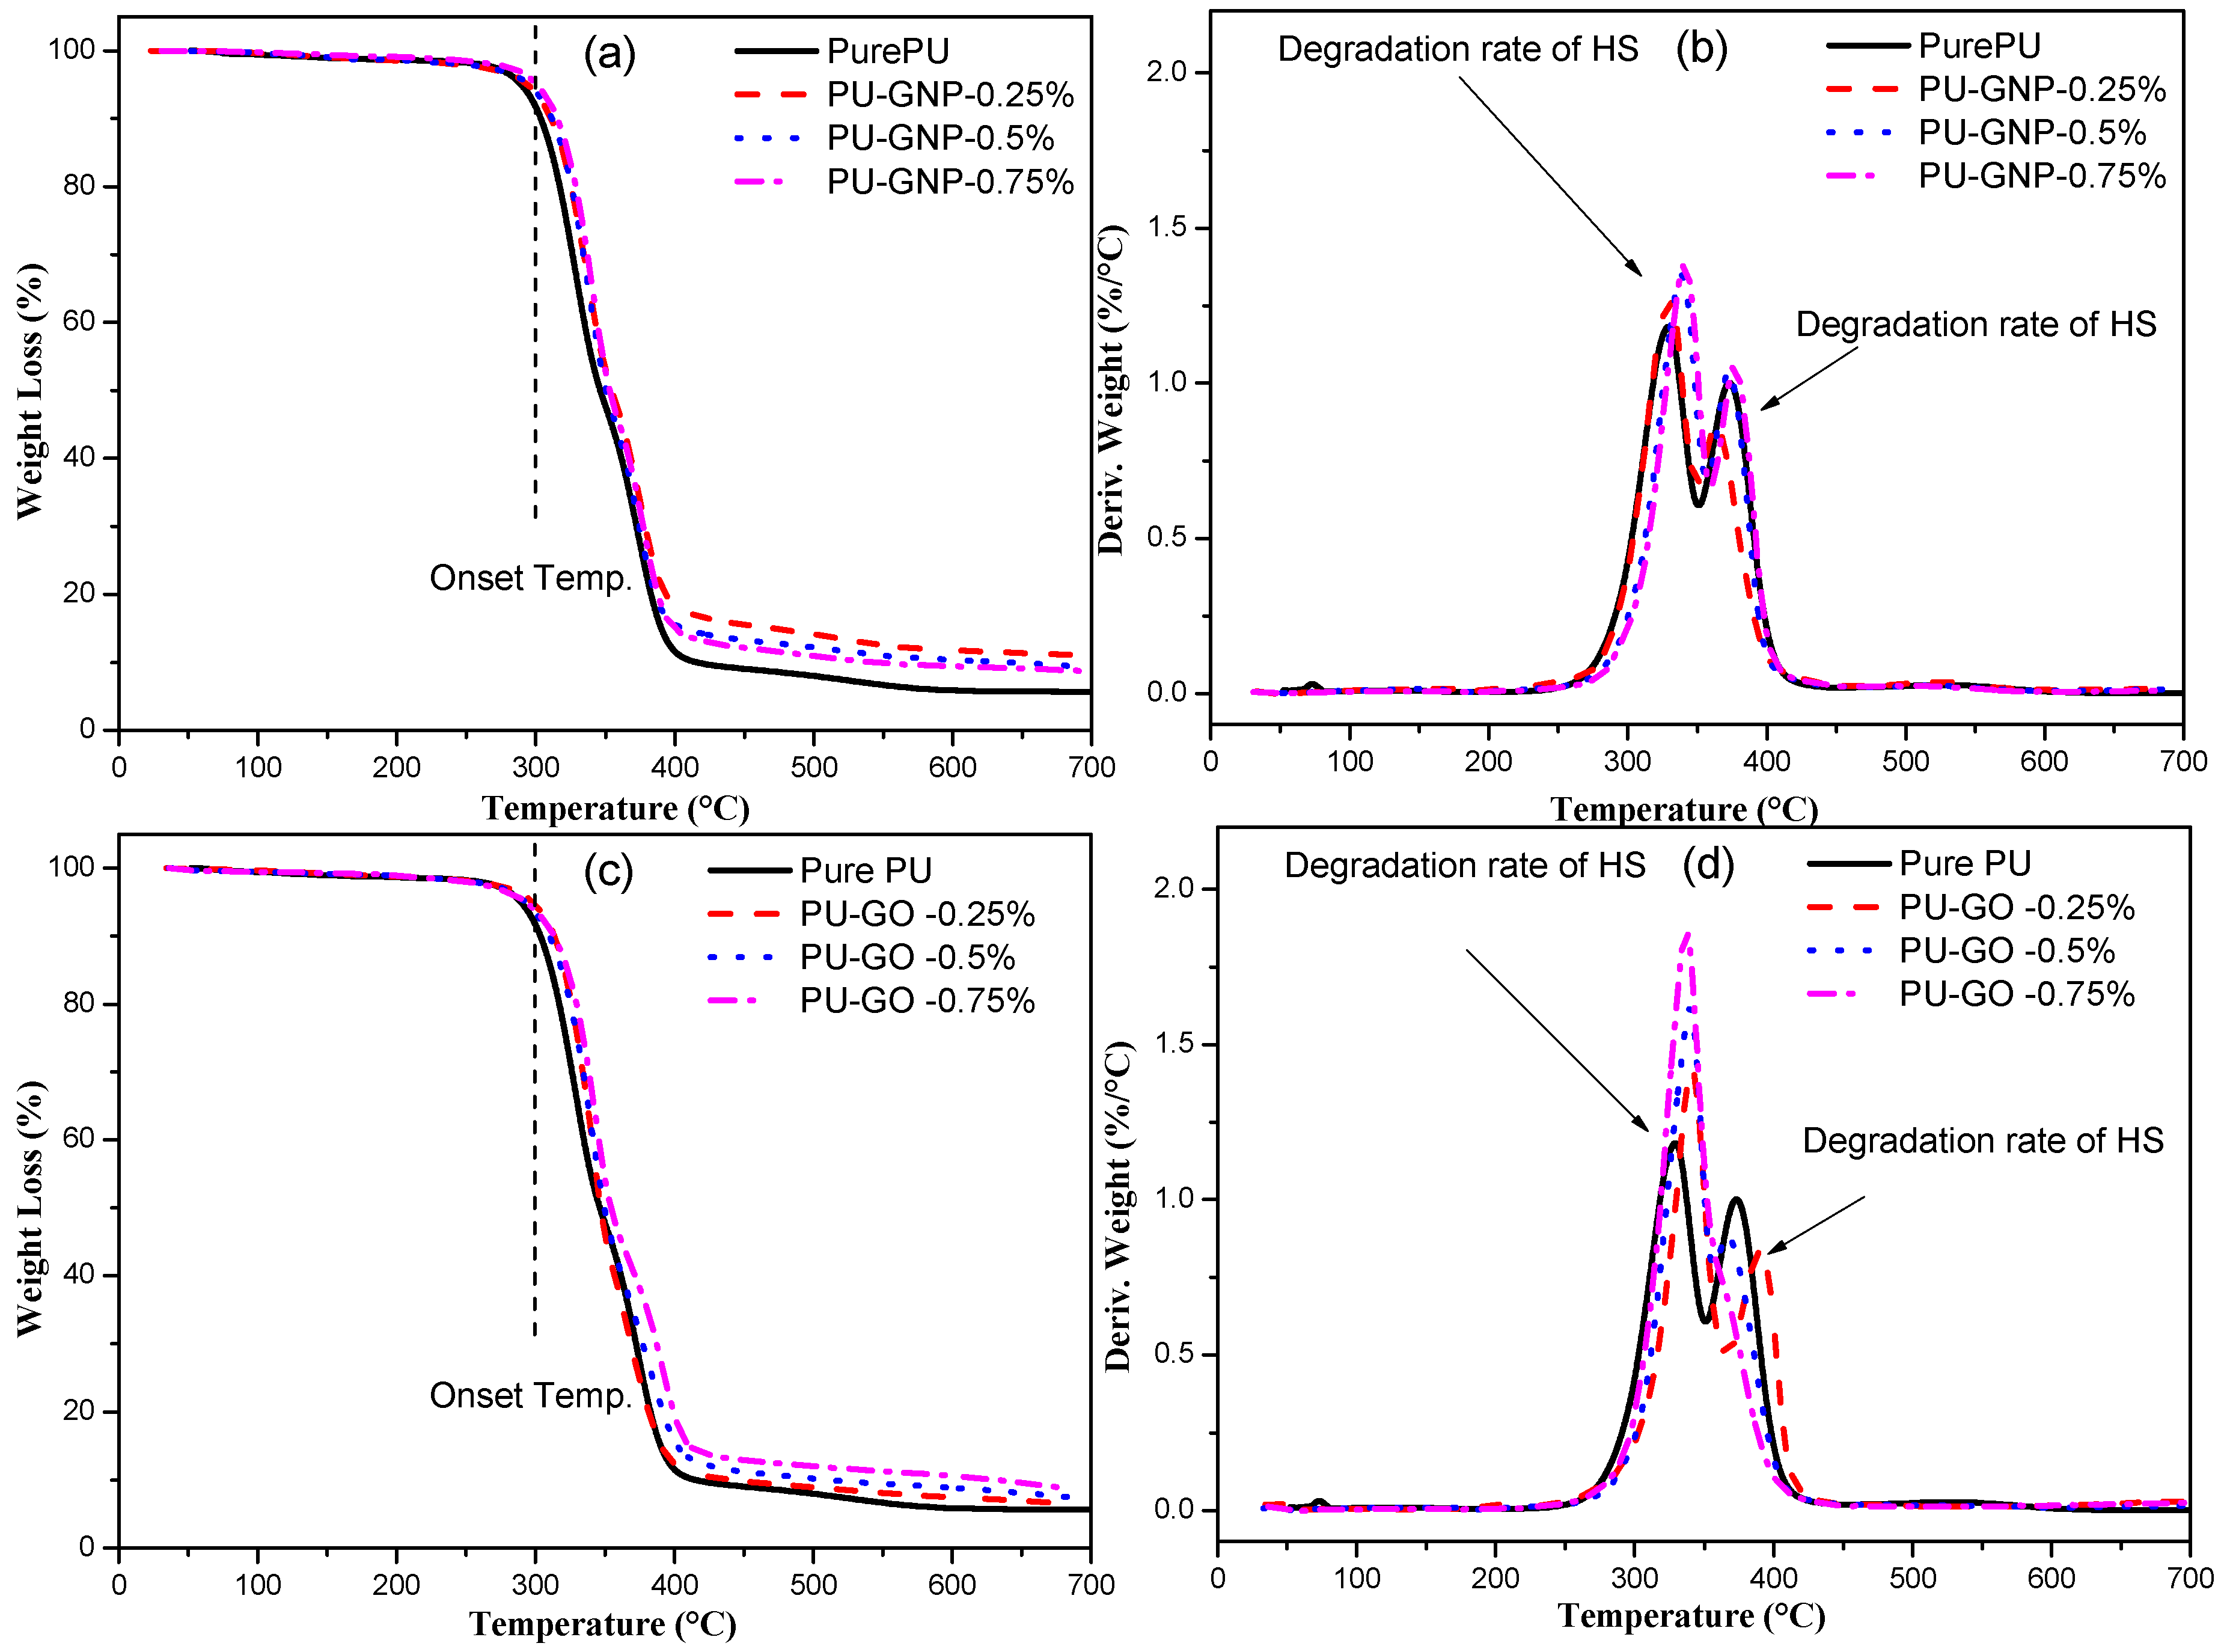
3.2. TGA Results
3.2.1. DSC Results
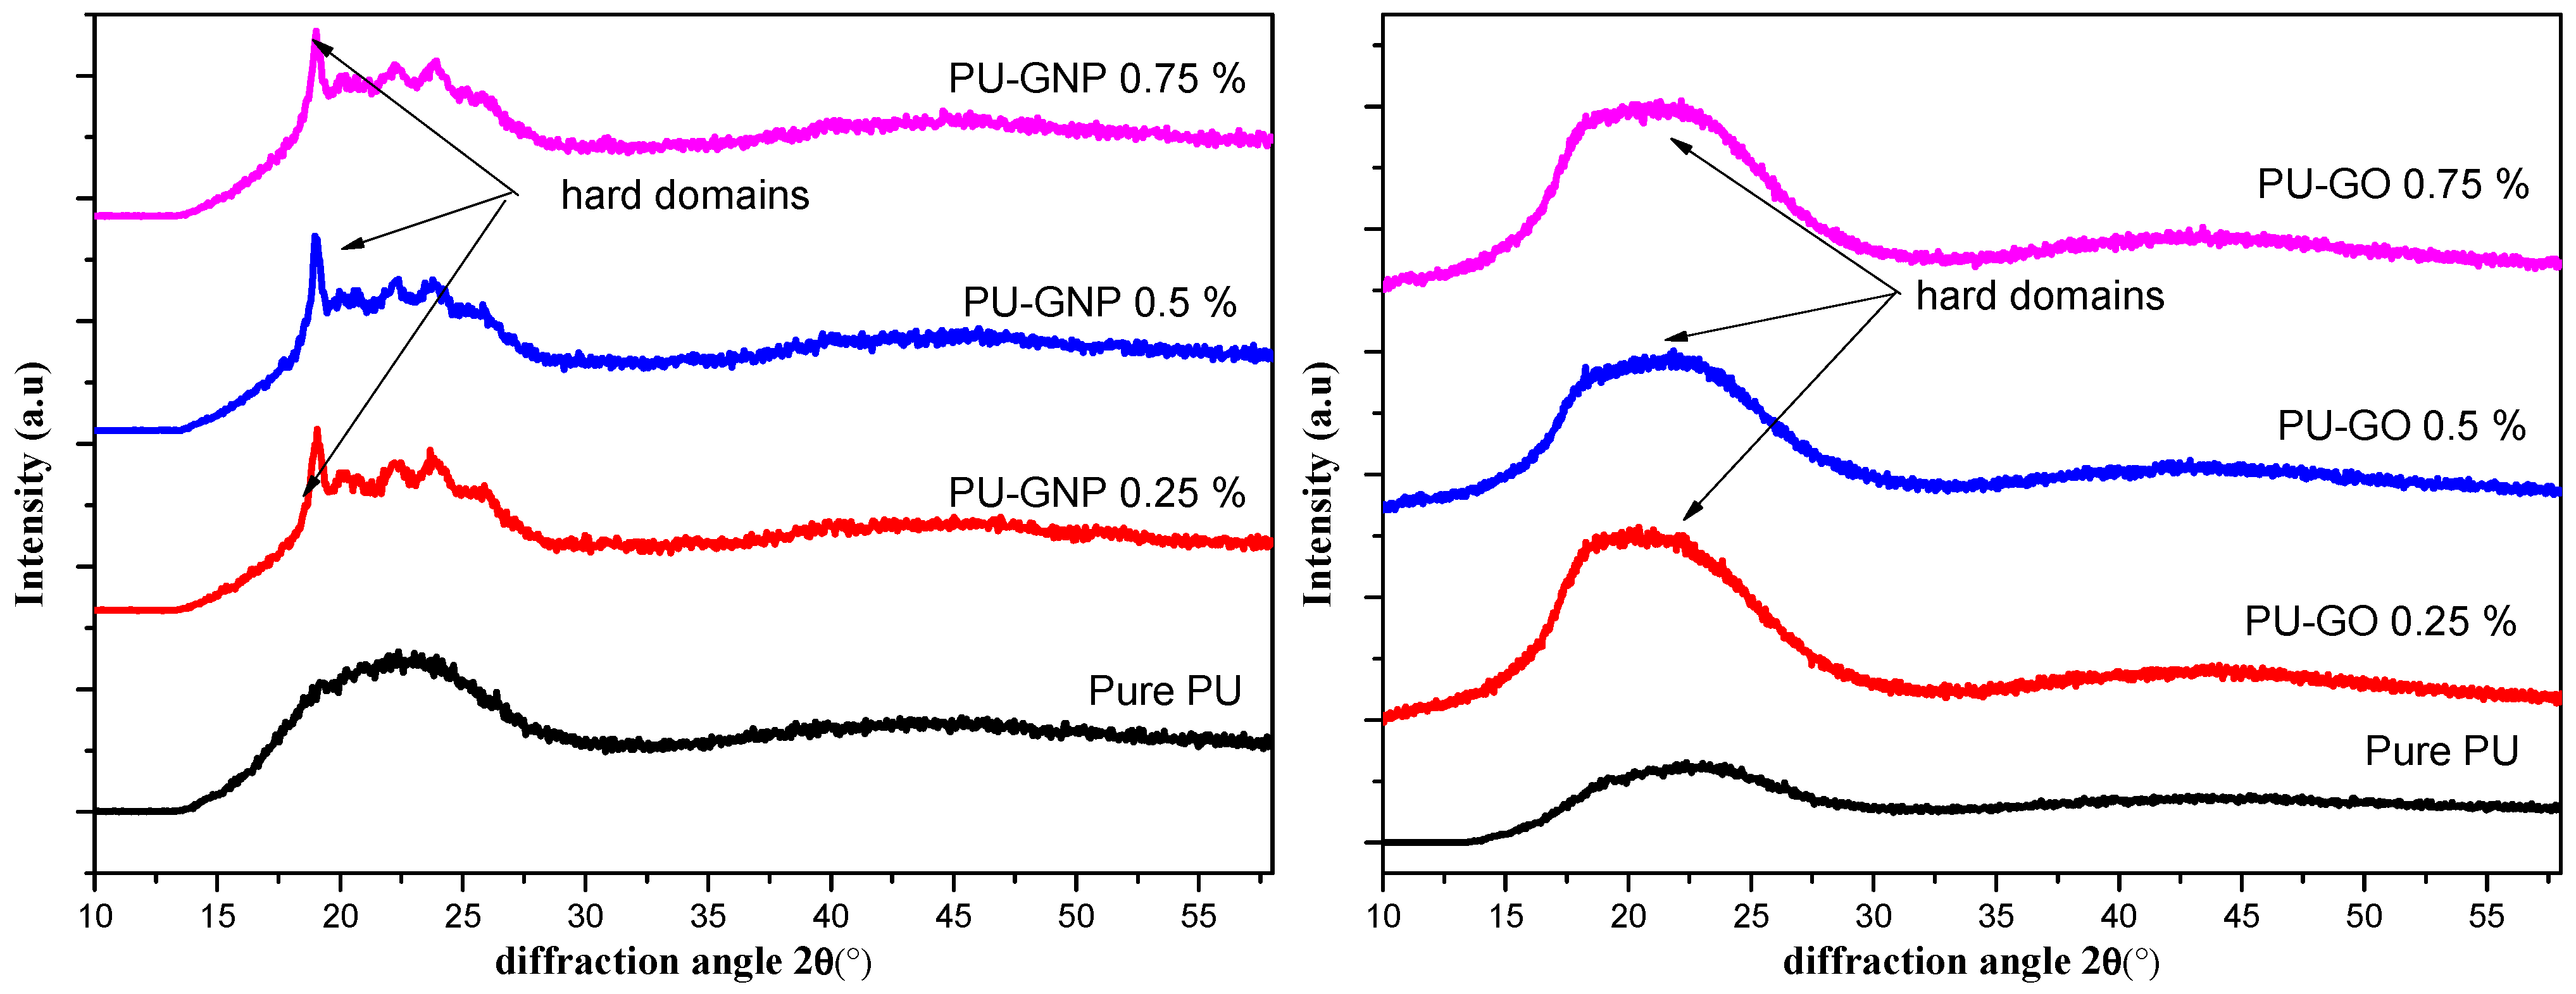
3.2.2. Wide-Angle X-ray Diffraction (WAXS) Results
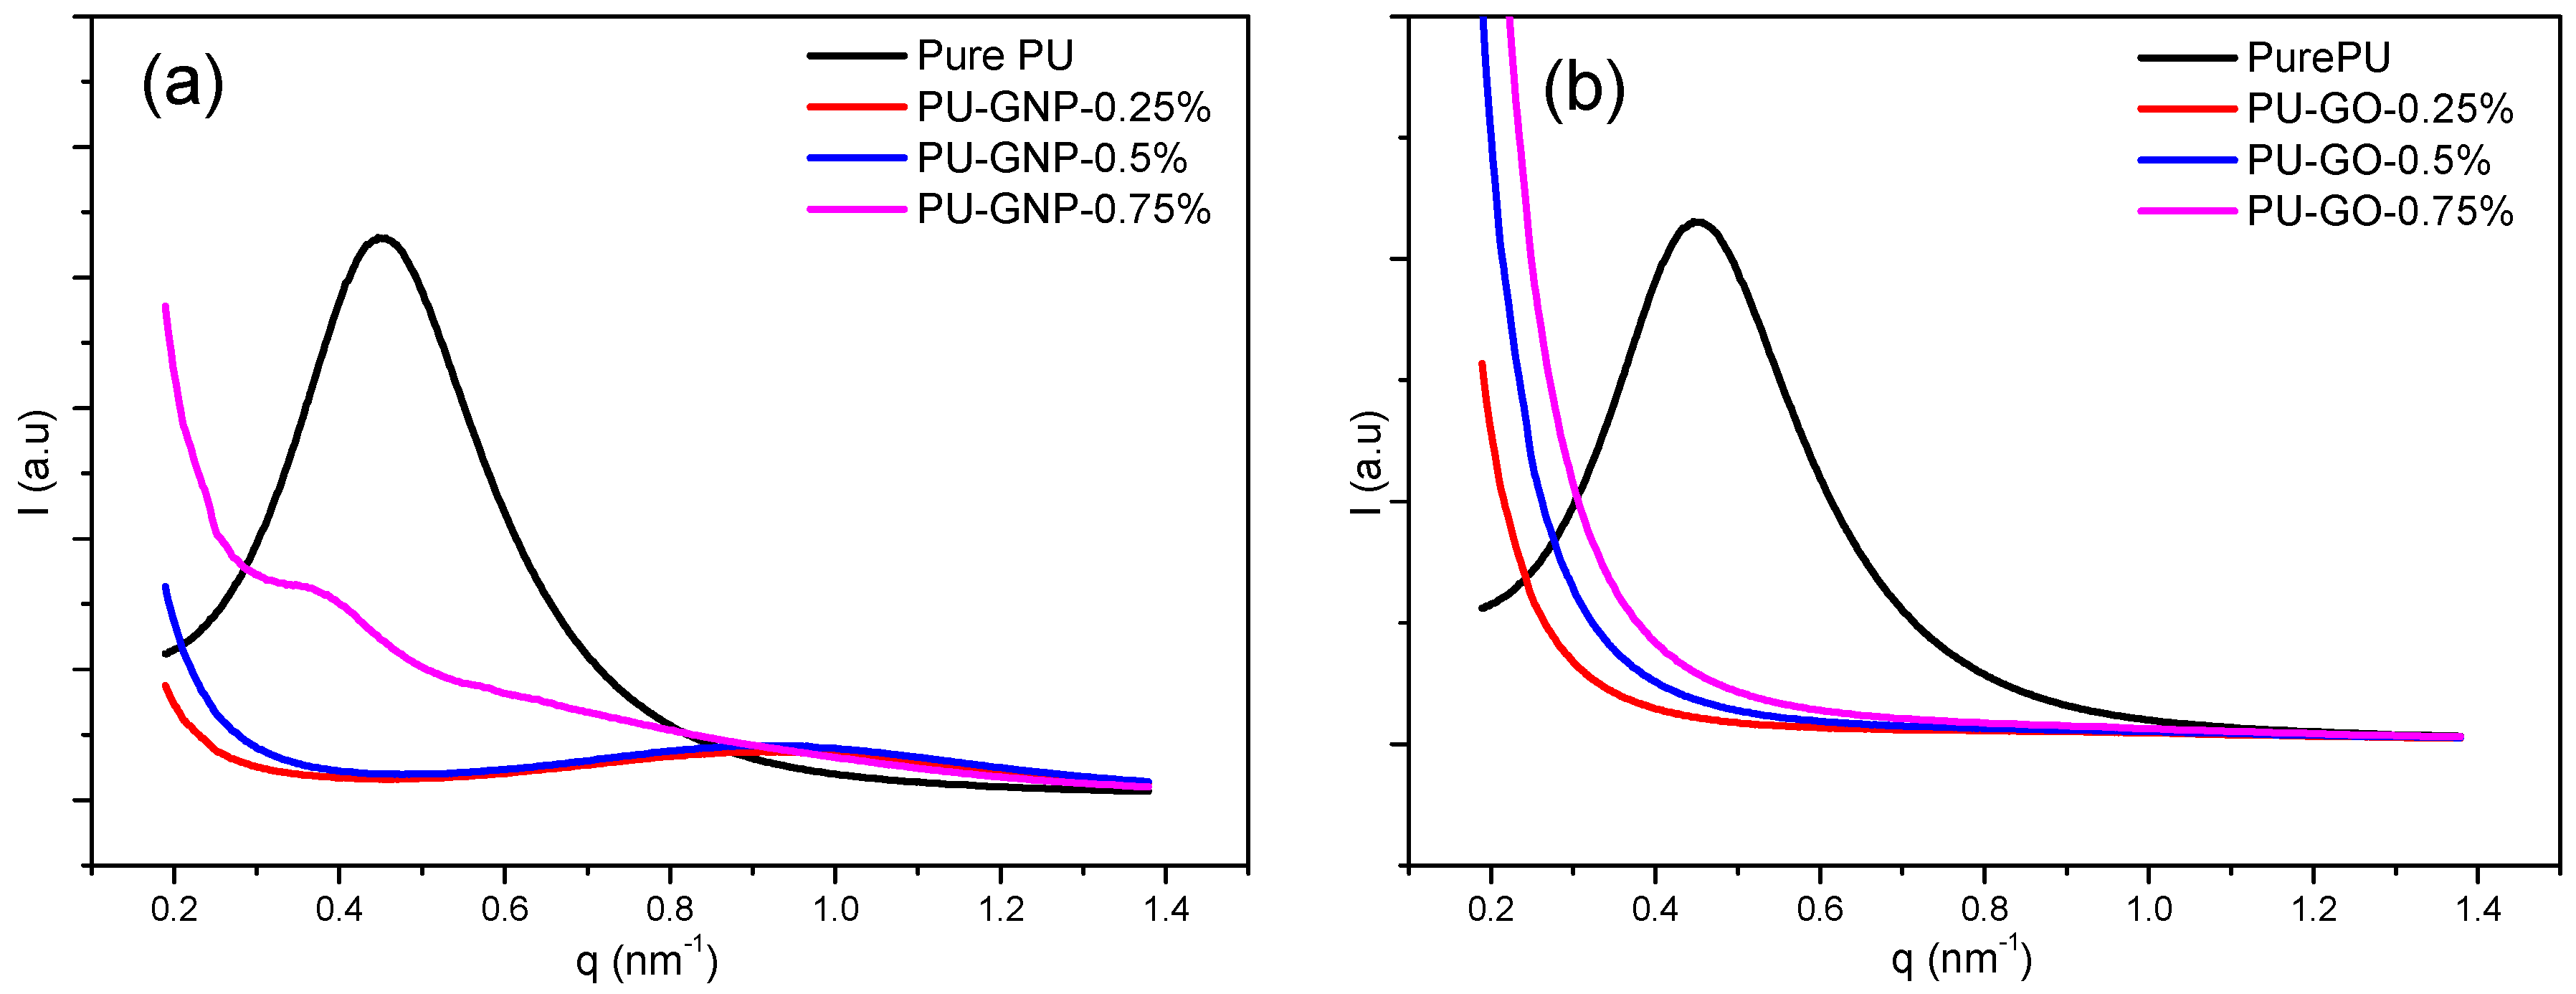
3.3. SAXS Results
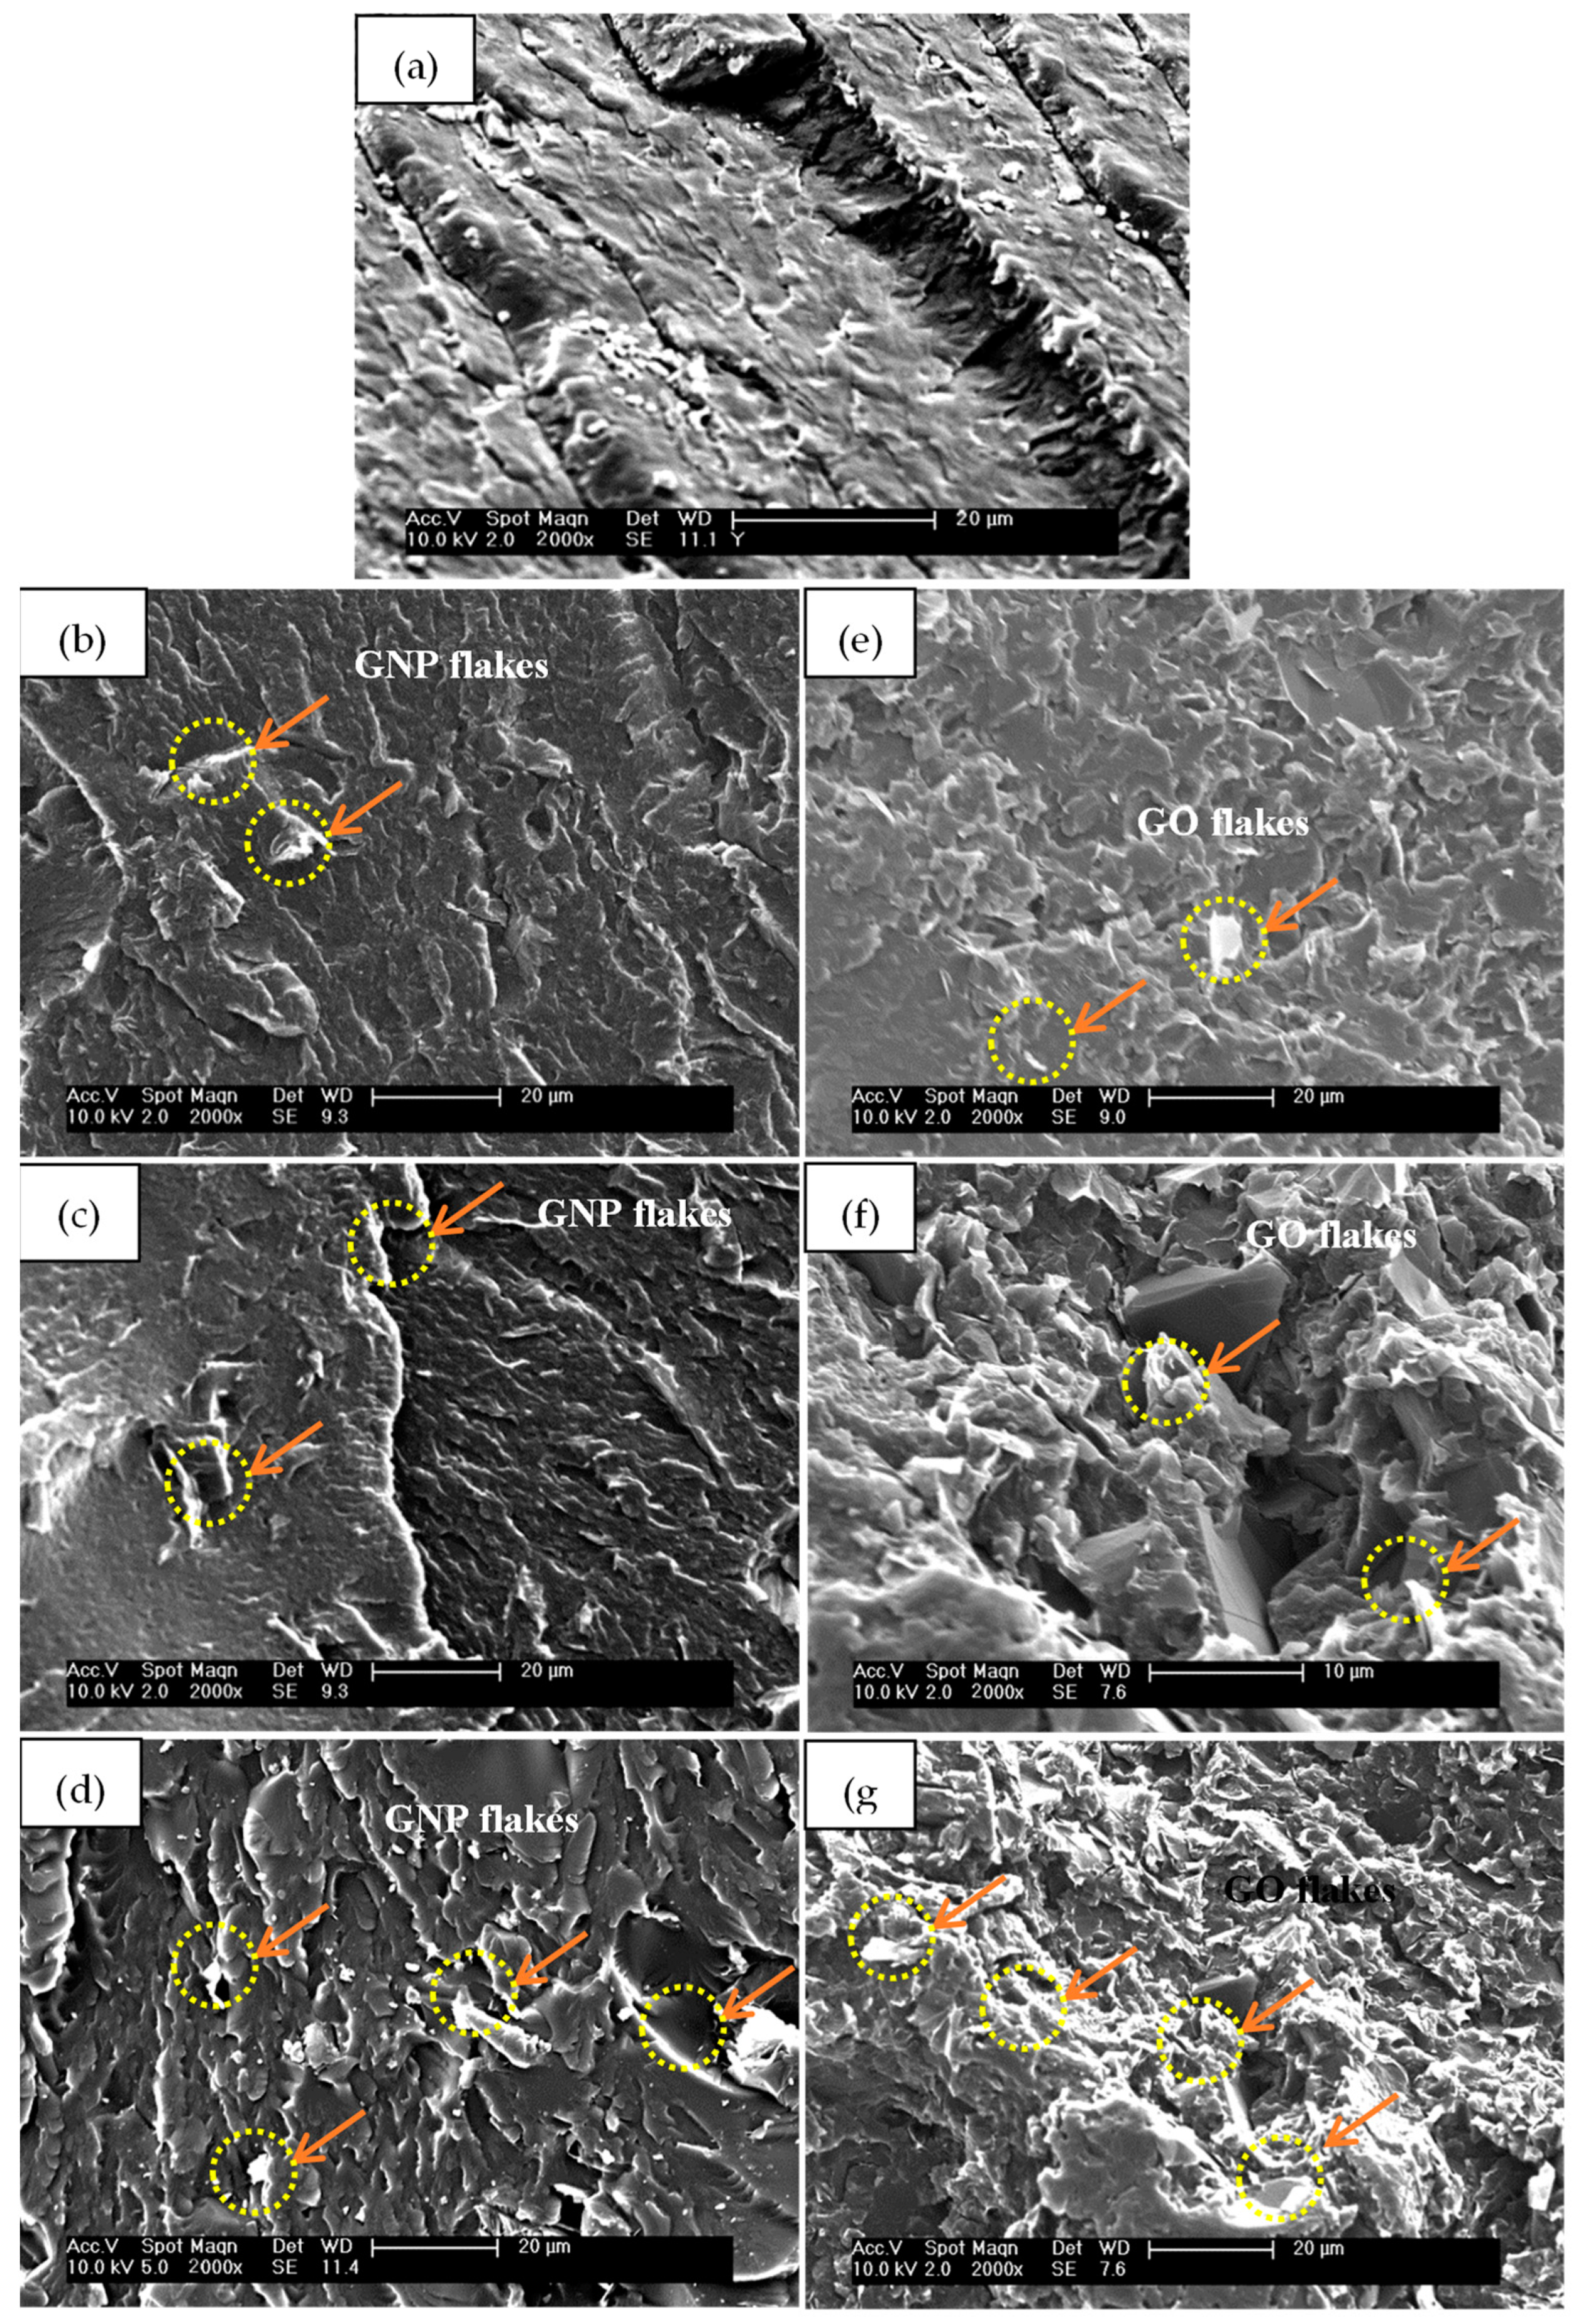
3.4. SEM Results
3.5. TEM Results
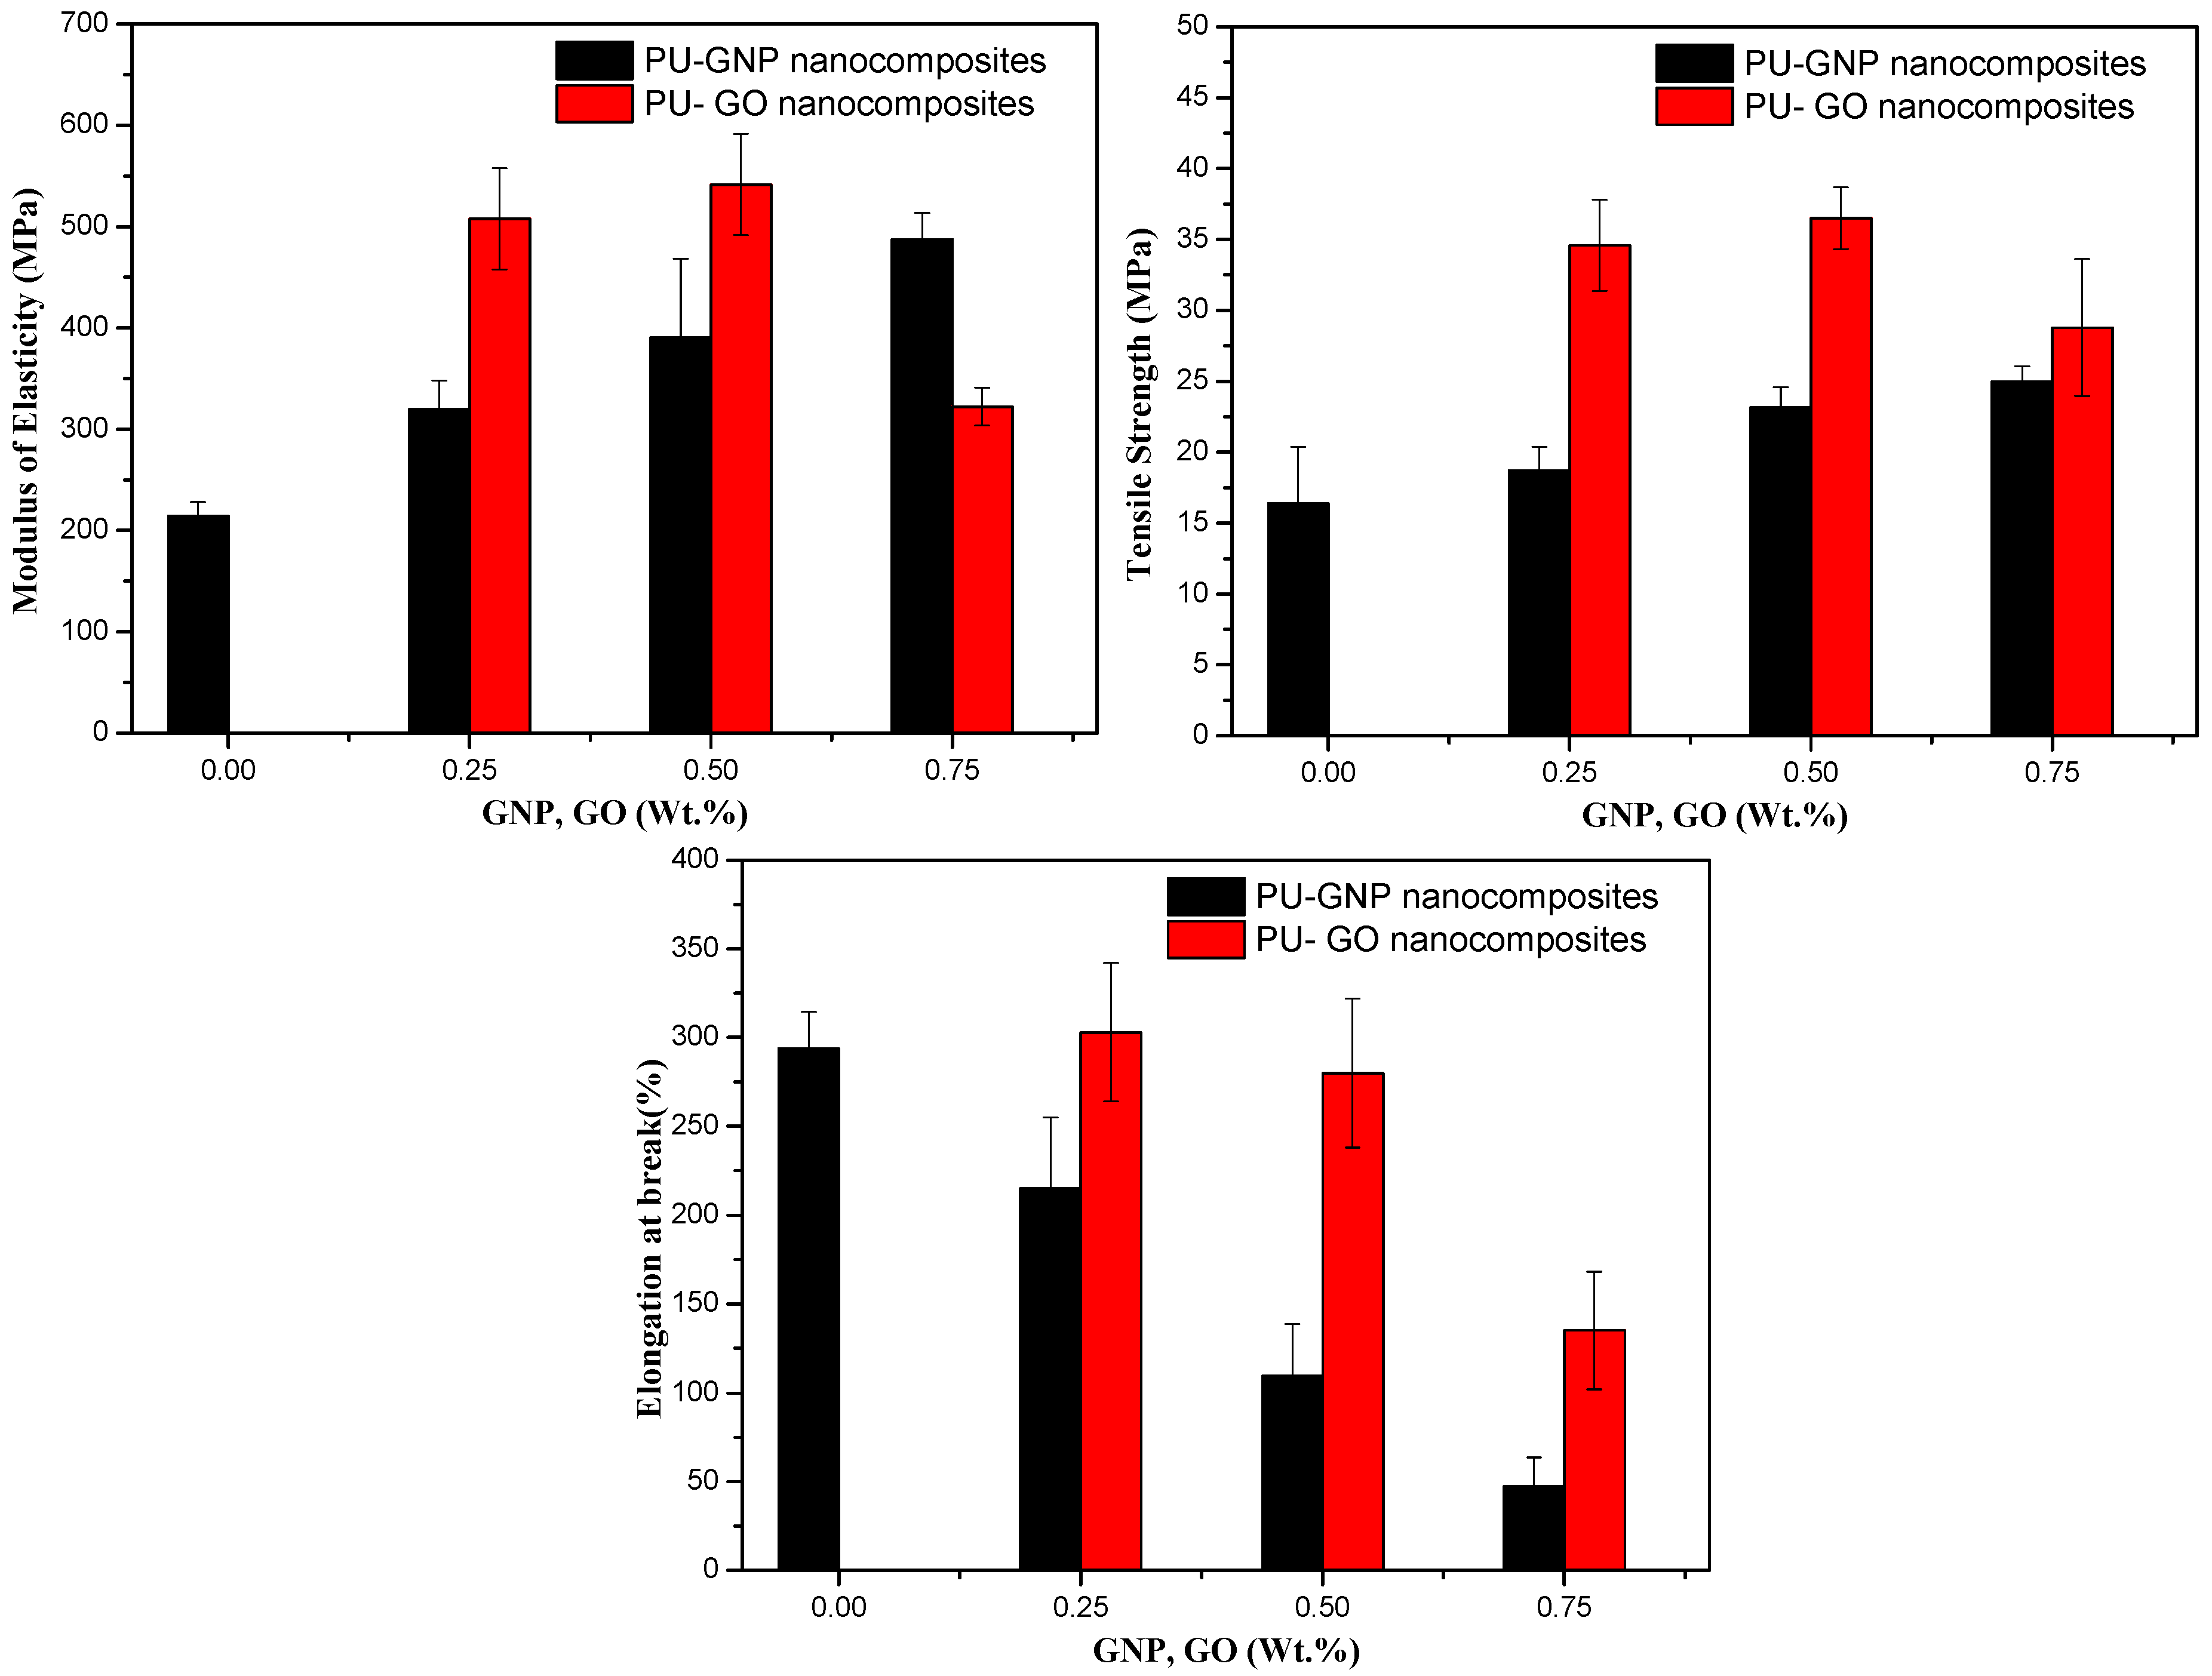
3.6. Mechanical Performance Results
4. Conclusions
Author Contributions
Funding
Institutional Review Board Statement
Informed Consent Statement
Data Availability Statement
Acknowledgments
Conflicts of Interest
References
- Valentini, M.; Piana, F.; Pionteck, J.; Lamastra, F.R.; Nanni, F. Electromagnetic properties and performance of exfoliated graphite (EG)–Thermoplastic polyurethane (TPU) nanocomposites at microwaves. Compos. Sci. Technol. 2015, 114, 26–33. [Google Scholar] [CrossRef]
- Yadav, S.K.; Cho, J.W. Functionalized graphene nanoplatelets for enhanced mechanical and thermal properties of polyurethane nanocomposites. Appl. Surf. Sci. 2013, 266, 360–367. [Google Scholar] [CrossRef]
- Huang, A.; Wang, H.; Ellingham, T.; Peng, X.; Turng, L.-S. An improved technique for dispersion of natural graphite particles in thermoplastic polyurethane by sub-critical gas-assisted processing. Compos. Sci. Technol. 2019, 182, 107783. [Google Scholar] [CrossRef]
- Li, L.; Xu, L.; Ding, W.; Lu, H.; Zhang, C.; Liu, T. Molecular-engineered hybrid carbon nanofillers for thermoplastic polyurethane nanocomposites with high mechanical strength and toughness. Compos. Part B Eng. 2019, 177, 107381. [Google Scholar] [CrossRef]
- Amir Rostam, M.I.M. High-performance thermoplastic polyurethane nanocomposites induced by hybrid application of functionalized graphene and carbon nanotubes. J. Appl. Polym. Sci. 2019, 137, 48520. [Google Scholar] [CrossRef]
- Abrisham, M.; Panahi-Sarmad, M.; Mir Mohamad Sadeghi, G.; Arjmand, M.; Dehghan, P.; Amirkiai, A. Microstructural design for enhanced mechanical property and shape memory behavior of polyurethane nanocomposites: Role of carbon nanotube, montmorillonite, and their hybrid fillers. Polym. Test. 2020, 89, 106642. [Google Scholar] [CrossRef]
- Pokharel, P.; Pant, B.; Pokhrel, K.; Pant, H.R.; Lim, J.-G.; Lee, D.S.; Kim, H.-Y.; Choi, S. Effects of functional groups on the graphene sheet for improving the thermomechanical properties of polyurethane nanocomposites. Compos. Part B Eng. 2015, 78, 192–201. [Google Scholar] [CrossRef]
- Chen, J.; Liu, B.; Gao, X.; Xu, D. A review of the interfacial characteristics of polymer nanocomposites containing carbon nanotubes. RSC Adv. 2018, 8, 28048–28085. [Google Scholar] [CrossRef] [PubMed] [Green Version]
- Prisacariu, C. Polyurethane Elastomers: From Morphology to Mechanical Aspects; Springer: Vienna, Austria; New York, NY, USA, 2011. [Google Scholar]
- Al-obad, Z.K.M. Designing PU Resins for Fibre Composite Applications. Ph.D. Thesis, University of Manchester, Manchester, UK, 2017. [Google Scholar]
- Naji, H.Z.N. Fabricating of Multiscale Composite Materials Based on TPU Reinforced by Carbon Fibre and Graphene Nanoplatelets (GNPs). Ph.D. Thesis, University of Manchester, Manchester, UK, 2019. [Google Scholar]
- Albozahid, M.A.M.A. Design of Novel High Modulus TPUs for NanoComposite Applications. Ph.D. Thesis, University of Manchester, Manchester, UK, 2018. [Google Scholar]
- Adak, B.; Butola, B.S.; Joshi, M. Effect of organoclay-type and clay-polyurethane interaction chemistry for tuning the morphology, gas barrier and mechanical properties of clay/polyurethane nanocomposites. Appl. Clay Sci. 2018, 161, 343–353. [Google Scholar] [CrossRef]
- Albozahid, M.; Naji, H.Z.; Alobad, Z.K.; Saiani, A. Enhanced mechanical, crystallisation and thermal properties of graphene flake-filled polyurethane nanocomposites: The impact of thermal treatment on the resulting microphase-separated structure. J. Polym. Res. 2021, 28, 302. [Google Scholar] [CrossRef]
- Kim, H.J.; Han, J.; Son, Y. Effect of a Monomer Composition on the Mechanical Properties and Glass Transition Temperature of a Waterborne Polyurethane/Graphene Oxide and Waterborne Polyurethane/MWCNT Nanocomposite. Polymers 2020, 12, 2013. [Google Scholar] [CrossRef]
- Amirkhosravi, M.; Yue, L.; Ju, T.; Manas-Zloczower, I. Designing thermal annealing to control mechanical performance of thermoplastic polyurethane elastomers. Polymer 2021, 214, 123254. [Google Scholar] [CrossRef]
- Tayfun, U.; Kanbur, Y.; Abacı, U.; Güney, H.Y.; Bayramlı, E. Mechanical, electrical, and melt flow properties of polyurethane elastomer/surface-modified carbon nanotube composites. J. Compos. Mater. 2016, 51, 1987–1996. [Google Scholar] [CrossRef]
- Bera, M.; Maji, P.K. Effect of structural disparity of graphene-based materials on thermo-mechanical and surface properties of thermoplastic polyurethane nanocomposites. Polymer 2017, 119, 118–133. [Google Scholar] [CrossRef]
- Stankovich, S.; Dikin, D.A.; Dommett, G.H.; Kohlhaas, K.M.; Zimney, E.J.; Stach, E.A.; Piner, R.D.; Nguyen, S.T.; Ruoff, R.S. Graphene-based composite materials. Nature 2006, 442, 282–286. [Google Scholar] [CrossRef]
- Wychowaniec, J.K.; Iliut, M.; Borek, B.; Muryn, C.; Mykhaylyk, O.O.; Edmondson, S.; Vijayaraghavan, A. Elastic flow instabilities and macroscopic textures in graphene oxide lyotropic liquid crystals. NPJ 2D Mater. Appl. 2021, 5, 11. [Google Scholar] [CrossRef]
- Albozahid, M.; Habeeb, S.A.; Ismael Alhilo, N.A.; Saiani, A. The impact of graphene nanofiller loading on the morphology and rheology behaviour of highly rigid polyurethane copolymer. Mater. Res. Express 2020, 7, 125304. [Google Scholar] [CrossRef]
- Tang, X.-Z.; Mu, C.; Zhu, W.; Yan, X.; Hu, X.; Yang, J. Flexible polyurethane composites prepared by incorporation of polyethylenimine-modified slightly reduced graphene oxide. Carbon 2016, 98, 432–440. [Google Scholar] [CrossRef]
- Henning Döscher, T.S.; Neef, C.; Thielmann, A.; Reiss, T. Graphene Roadmap Briefs (No. 2): Industrialization status and prospects 2020. 2D Mater. 2021, 8. [Google Scholar] [CrossRef]
- Sang, G.; Dong, J.; He, X.; Jiang, J.; Li, J.; Xu, P.; Ding, Y. Electromagnetic interference shielding performance of polyurethane composites: A comparative study of GNs-IL/Fe3O4 and MWCNTs-IL/Fe3O4 hybrid fillers. Compos. Part B Eng. 2019, 164, 467–475. [Google Scholar] [CrossRef]
- Yin, C.; Du, Z.; Wen, S.; Wang, J. High performance of reduced sulfonated graphite oxide nanoplatelets/polyurethane composites. Mater. Lett. 2016, 168, 20–23. [Google Scholar] [CrossRef]
- Pokharel, P.; Lee, D.S. High performance polyurethane nanocomposite films prepared from a masterbatch of graphene oxide in polyether polyol. Chem. Eng. J. 2014, 253, 356–365. [Google Scholar] [CrossRef]
- Lee, S.H.; Oh, C.R.; Lee, D.S. Large Improvement in the Mechanical Properties of Polyurethane Nanocomposites Based on a Highly Concentrated Graphite Nanoplate/Polyol Masterbatch. Nanomaterials 2019, 9, 389. [Google Scholar] [CrossRef] [Green Version]
- Potts, J.R.; Dreyer, D.R.; Bielawski, C.W.; Ruoff, R.S. Graphene-based polymer nanocomposites. Polymer 2011, 52, 5–25. [Google Scholar] [CrossRef] [Green Version]
- Chandrasekaran, S.; Seidel, C.; Schulte, K. Preparation and characterization of graphite nano-platelet (GNP)/epoxy nano-composite: Mechanical, electrical and thermal properties. Eur. Polym. J. 2013, 49, 3878–3888. [Google Scholar] [CrossRef]
- Hoepfner, J.C.; Loos, M.R.; Pezzin, S.H. Evaluation of thermomechanical properties of polyvinyl butyral nanocomposites reinforced with graphene nanoplatelets synthesized by in situ polymerization. J. Appl. Polym. Sci. 2018, 135, 46157. [Google Scholar] [CrossRef]
- Jayadurga Iyer Ganapathi, D.M.K.; Frank, T. Fisher. Effect of multistage sonication on dispersive mixing of polymer nanocomposites characterized via shear-induced crystallization behavior. J. Appl. Polym. Sci 2017, 134, 44681. [Google Scholar] [CrossRef]
- Khoshsefat, M.; Ahmadjo, S.; Mortazavi, S.M.M.; Zohuri, G.H. Reinforcement effects of nanocarbons on catalyst behaviour and polyethylene properties through in situ polymerization. RSC Adv. 2016, 6, 88625–88632. [Google Scholar] [CrossRef]
- Bernard, C.; Goodwin, D.G., Jr.; Gu, X.; Celina, M.; Nyden, M.; Jacobs, D.; Sung, L.; Nguyen, T. Graphene oxide/waterborne polyurethane nanocoatings: Effects of graphene oxide content on performance properties. J. Coat. Technol. Res. 2020, 17, 255–269. [Google Scholar] [CrossRef]
- Liu, S.; Tian, M.; Yan, B.; Yao, Y.; Zhang, L.; Nishi, T.; Ning, N. High performance dielectric elastomers by partially reduced graphene oxide and disruption of hydrogen bonding of polyurethanes. Polymer 2015, 56, 375–384. [Google Scholar] [CrossRef]
- Song, H.W.M.; Yanfei, W.; Yadong, Z.; Ahmad, U.; Zhanhu, G. Waterborne Polyurethane/Graphene Oxide Nanocomposites with Enhanced Properties. Sci. Adv. Mater. 2017, 9, 705–714. [Google Scholar] [CrossRef]
- Luan, Y.; Gao, F.; Li, Y.; Yang, J.; Hu, Y.; Guo, Z.; Wang, Z.; Zhou, A. Healing mechanisms induced by synergy of Graphene-CNTs and microwave focusing effect for the thermoplastic polyurethane composites. Compos. Part A Appl. Sci. Manuf. 2018, 106, 34–41. [Google Scholar] [CrossRef]
- Jun, Y.-s.; Habibpour, S.; Hamidinejad, M.; Park, M.G.; Ahn, W.; Yu, A.; Park, C.B. Enhanced electrical and mechanical properties of graphene nano-ribbon/thermoplastic polyurethane composites. Carbon 2021, 174, 305–316. [Google Scholar] [CrossRef]
- Lawal, A.T. Graphene-based nano composites and their applications. A review. Biosens. Bioelectron. 2019, 141, 111384. [Google Scholar] [CrossRef] [PubMed]
- Rourke, J.P.; Pandey, P.A.; Moore, J.J.; Bates, M.; Kinloch, I.A.; Young, R.J.; Wilson, N.R. The Real Graphene Oxide Revealed: Stripping the Oxidative Debris from the Graphene-Like Sheets; Wiley-VCH: Weinheim, Germany, 2011. [Google Scholar]
- Muayad Albozahid, H.N.; Alobad, Z.; Saiani, A. Effect of Dispersion Methods on The Performance of Novel Rigid Copolymer Polyurethane Nanocomposites Based on Graphene Nanofillers. Polym.-Plast. Technol. Mater. 2021, 60, 16. [Google Scholar] [CrossRef]
- Cho, E.-C.; Huang, J.-H.; Li, C.-P.; Chang-Jian, C.-W.; Lee, K.-C.; Hsiao, Y.-S.; Huang, J.-H. Graphene-based thermoplastic composites and their application for LED thermal management. Carbon 2016, 102, 66–73. [Google Scholar] [CrossRef]
- McAllister, M.J.; Li, J.; Adamson, D.H.; Schniepp, H.C.; Abdala, A.A.; Liu, J.; Herrera-Alonso, M.; Milius, D.L.; Car, R.; Prud’homme, R.K.; et al. Single Sheet Functionalized Graphene by Oxidation and Thermal Expansion of Graphite. Chem. Mater 2007, 19, 4396–4404. [Google Scholar] [CrossRef]
- Pashupati Pokharel, H.B.; Lim, J.; Lee, K.Y.; Choi, S. Effects of titanate treatment on morphology and mechanical properties of graphene nanoplatelets/high density polyethylene nanocomposites. J. Appl. Polym. Sci. 2015, 132, 42073. [Google Scholar] [CrossRef]
- Lin, J.; Zhang, H.; Tang, M.; Tu, W.; Zhang, X. Improved Thermal Property of a Multilayered Graphite Nanoplatelets Filled Silicone Resin Composite. J. Mater. Eng. Perform. 2014, 24, 920–929. [Google Scholar] [CrossRef]
- Li, Y.C.; Tjong, S.C.; Li, R.K.Y. Electrical conductivity and dielectric response of poly(vinylidene fluoride)–graphite nanoplatelet composites. Synth. Met. 2010, 160, 1912–1919. [Google Scholar] [CrossRef]
- Siburian, R.; Sari, D.R.; Gultom, J.; Sihotang, H.; Raja, S.L.; Gultom, J.; Supeno, M. Performance of graphite and graphene as electrodes in primary cell battery. J. Phys. Conf. Ser. 2018, 1116, 042034. [Google Scholar] [CrossRef]
- Mohd Zaid, N.A.; Idris, N.H. Enhanced Capacitance of Hybrid Layered Graphene/Nickel Nanocomposite for Supercapacitors. Sci. Rep. 2016, 6, 32082. [Google Scholar] [CrossRef] [PubMed] [Green Version]
- Filip, D.; Macocinschi, D.; Vlad, S. Thermogravimetric study for polyurethane materials for biomedical applications. Compos. Part B Eng. 2011, 42, 1474–1479. [Google Scholar] [CrossRef]
- Alobad, Z.K.; Albozahid, M.; Naji, H.Z.; Alraheem, H.S.; Saiani, A. Influence of hard segments content on thermal, morphological and mechanical properties of homo and co-polyurethanes: A comparative study. Arch. Mater. Sci. Eng. 2021, 1, 5–16. [Google Scholar] [CrossRef]
- Mahapatra, S.S.; Yadav, S.K.; Yoo, H.J.; Ramasamy, M.S.; Cho, J.W. Tailored and strong electro-responsive shape memory actuation in carbon nanotube-reinforced hyperbranched polyurethane composites. Sens. Actuators B Chem. 2014, 193, 384–390. [Google Scholar] [CrossRef]
- Valentini, L.; Cardinali, M.; Kenny, J. Hot press transferring of graphene nanoplatelets on polyurethane block copolymers film for electroactive shape memory devices. J. Polym. Sci. Part B Polym. Phys. 2014, 52, 1100–1106. [Google Scholar] [CrossRef]
- Tounici, A.; Martín-Martínez, J.M. Addition of small amounts of graphene oxide in the polyol during the synthesis of waterborne polyurethane urea adhesives for improving their adhesion properties. Int. J. Adhes. Adhes. 2021, 104, 102725. [Google Scholar] [CrossRef]
- Anandhan, S.; Lee, H.S. Influence of organically modified clay mineral on domain structure and properties of segmented thermoplastic polyurethane elastomer. J. Elastomers Plast. 2012, 46, 217–232. [Google Scholar] [CrossRef]
- Habibpour, S.; Um, J.G.; Jun, Y.-S.; Bhargava, P.; Park, C.B.; Yu, A. Structural Impact of Graphene Nanoribbon on Mechanical Properties and Anti-corrosion Performance of Polyurethane Nanocomposites. Chem. Eng. J. 2021, 405, 126858. [Google Scholar] [CrossRef]
- Harb, S.V.; Pulcinelli, S.H.; Santilli, C.V.; Knowles, K.M.; Hammer, P. A Comparative Study on Graphene Oxide and Carbon Nanotube Reinforcement of PMMA-Siloxane-Silica Anticorrosive Coatings. ACS Appl. Mater. Interfaces 2016, 8, 16339–16350. [Google Scholar] [CrossRef]
- Pandey, S.; Jana, K.K.; Aswal, V.K.; Rana, D.; Maiti, P. Effect of nanoparticle on the mechanical and gas barrier properties of thermoplastic polyurethane. Appl. Clay Sci. 2017, 146, 468–474. [Google Scholar] [CrossRef]
- Muayad Albozahid, H.Z.N.; Alobad, Z.K.; Wychowaniec, J.K.; Saiani, A. Synthesis and Characterisation of Hard Copolymer Polyurethane/Functionalised Graphene Nanocomposites: Investigation of Morphology, Thermal Stability and Rheological Properties. J. Appl. Polym. Sci. 2022. [Google Scholar] [CrossRef]
- Bian, J.; Lin, H.L.; He, F.X.; Wei, X.W.; Chang, I.T.; Sancaktar, E. Fabrication of microwave exfoliated graphite oxide reinforced thermoplastic polyurethane nanocomposites: Effects of filler on morphology, mechanical, thermal and conductive properties. Compos. Part A Appl. Sci. Manuf. 2013, 47, 72–82. [Google Scholar] [CrossRef]
- Lei, H.; Liu, Z.; He, C.; Zhang, S.-C.; Liu, Y.-Q.; Hua, C.-J.; Li, X.-M.; Li, F.; Chen, C.-M.; Cai, R. Graphene enhanced low-density polyethylene by pretreatment and melt compounding. RSC Adv. 2016, 6, 101492–101500. [Google Scholar] [CrossRef]
- Nguyen, D.A.; Lee, Y.R.; Raghu, A.V.; Jeong, H.M.; Shin, C.M.; Kim, B.K. Morphological and physical properties of a thermoplastic polyurethane reinforced with functionalized graphene sheet. Polym. Int. 2009, 58, 412–417. [Google Scholar] [CrossRef]
- Albozahid, M.; Naji, H.Z.; Alobad, Z.K.; Saiani, A. Effect of OMMT reinforcement on morphology and rheology properties of polyurethane copolymer nanocomposites. J. Elastomers Plast. 2021. [Google Scholar] [CrossRef]
- Roy, S.; Srivastava, S.K.; Pionteck, J.; Mittal, V. Mechanically and Thermally Enhanced Multiwalled Carbon Nanotube-Graphene Hybrid filled Thermoplastic Polyurethane Nanocomposites. Macromol. Mater. Eng. 2015, 300, 346–357. [Google Scholar] [CrossRef]
- Lee, M.; Koo, J.; Ki, H.; Lee, K.H.; Min, B.H.; Lee, Y.C.; Kim, J.H. Phase separation and electrical conductivity of nanocomposites made of ether-/ester-based polyurethane blends and carbon nanotubes. Macromol. Res. 2017, 25, 231–242. [Google Scholar] [CrossRef]
- Raftopoulos, K.N.; Janowski, B.; Apekis, L.; Pielichowski, K.; Pissis, P. Molecular mobility and crystallinity in polytetramethylene ether glycol in the bulk and as soft component in polyurethanes. Eur. Polym. J. 2011, 47, 2120–2133. [Google Scholar] [CrossRef]
- Chung, Y.-C.; Khiem, N.D.; Chun, B.C. Characterization of a polyurethane copolymer covalently linked to graphite and the influence of graphite on electric conductivity. J. Compos. Mater. 2014, 49, 1689–1703. [Google Scholar] [CrossRef]
- Thakur, S.; Karak, N. Ultratough, Ductile, Castor Oil-Based, Hyperbranched, Polyurethane Nanocomposite Using Functionalized Reduced Graphene Oxide. ACS Sustain. Chem. Eng. 2014, 2, 1195–1202. [Google Scholar] [CrossRef]
- Jofre-Reche, J.A.; García-Pacios, V.; Costa, V.; Colera, M.; Martín-Martínez, J.M. Role of the interactions between carbonate groups on the phase separation and properties of waterborne polyurethane dispersions prepared with copolymers of polycarbonate diol. Prog. Org. Coat. 2015, 88, 199–211. [Google Scholar] [CrossRef]
- Idumah, C.I.; Hassan, A. Hibiscus Cannabinus Fiber/PP based Nano-Biocomposites Reinforced with Graphene Nanoplatelets. J. Nat. Fibers 2017, 14, 691–706. [Google Scholar] [CrossRef]
- Yang, D.; Xu, H.; Yu, W.; Wang, J.; Gong, X. Dielectric properties and thermal conductivity of graphene nanoplatelet filled poly(vinylidene fluoride) (PVDF)/poly(methyl methacrylate) (PMMA) blend. J. Mater. Sci. Mater. Electron. 2017, 28, 13006–13012. [Google Scholar] [CrossRef]
- Thakur, S.; Karak, N. One-step approach to prepare magnetic iron oxide/reduced graphene oxide nanohybrid for efficient organic and inorganic pollutants removal. Mater. Chem. Phys. 2014, 144, 425–432. [Google Scholar] [CrossRef]
- Albozahid, M.; Naji, H.Z.; Alobad, Z.K.; Saiani, A. TPU nanocomposites tailored by graphene nanoplatelets: The investigation of dispersion approaches and annealing treatment on thermal and mechanical properties. Polym. Bull. 2021, 79, 8269–8307. [Google Scholar] [CrossRef]
- Strankowski, M. Effect of Variation of Hard Segment Content and Graphene-Based Nanofiller Concentration on Morphological, Thermal, and Mechanical Properties of Polyurethane Nanocomposites. Int. J. Polym. Sci. 2018, 2018, 1090753. [Google Scholar] [CrossRef]
- Pokharel, P.; Lee, S.H.; Lee, D.S. Thermal, Mechanical, and Electrical Properties of Graphene Nanoplatelet/Graphene Oxide/Polyurethane Hybrid Nanocomposite. J. Nanosci. Nanotechnol. 2015, 15, 211–214. [Google Scholar] [CrossRef]
- Saiani, A.; Rochas, C.; Eeckhaut, G.; Daunch, W.A.; Leenslag, J.W.; Higgins, J.S. Origin of Multiple Melting Endotherms in a High Hard Block Content Polyurethane. 2. Structural Investigation. Macromolecules 2004, 37, 1411–1421. [Google Scholar] [CrossRef]
- Saiani, A.; Novak, A.; Rodier, L.; Eeckhaut, G.; Leenslag, J.-W.; Higgins, J.S. Origin of Multiple Melting Endotherms in a High Hard Block Content Polyurethane: Effect of Annealing Temperature. Macromolecules 2007, 40, 7252–7262. [Google Scholar] [CrossRef]
- Kong, Z.; Tian, Q.; Zhang, R.; Yin, J.; Shi, L.; Ying, W.B.; Hu, H.; Yao, C.; Wang, K.; Zhu, J. Reexamination of the microphase separation in MDI and PTMG based polyurethane: Fast and continuous association/dissociation processes of hydrogen bonding. Polymer 2019, 185, 121943. [Google Scholar] [CrossRef]
- Hosseini-Sianaki, T.; Nazockdast, H.; Salehnia, B.; Nazockdast, E. Microphase separation and hard domain assembly in thermoplastic polyurethane/multiwalled carbon nanotube nanocomposites. Polym. Eng. Sci. 2015, 55, 2163–2173. [Google Scholar] [CrossRef]
- Skosana, S.J.; Khoathane, C.; Malwela, T. Enhancing the adhesion strength of polyurethane coatings by dispersing layered silicates via sonication and high-shear mixing method. Polym. Bull. 2020, 78, 203–221. [Google Scholar] [CrossRef]
- Tarasov, A.E.; Anokhin, D.V.; Propad, Y.V.; Bersenev, E.A.; Razorenov, S.V.; Garkushin, G.V.; Badamshina, E.R. Synergetic effect of fullerene and graphene oxide nanoparticles on mechanical characteristics of cross-linked polyurethanes under static and dynamic loading. J. Compos. Mater. 2019, 53, 3797–3805. [Google Scholar] [CrossRef]
- Muayad Albozahid, H.Z.N.; Alobad, Z.K.; Saiani, A. Study on the effect of tailoring the hard copolymer polyurethane on the thermal, mechanical and electrical properties of hard copolymer polyurethane/multi-walled carbon nanotubes nanocomposites. J. Compos. Mater. 2022, 56, 1467–1480. [Google Scholar] [CrossRef]
- Cai, D.; Jin, J.; Yusoh, K.; Rafiq, R.; Song, M. High performance polyurethane/functionalized graphene nanocomposites with improved mechanical and thermal properties. Compos. Sci. Technol. 2012, 72, 702–707. [Google Scholar] [CrossRef]
- Lin, J.; Zhang, P.; Zheng, C.; Wu, X.; Mao, T.; Zhu, M.; Wang, H.; Feng, D.; Qian, S.; Cai, X. Reduced silanized graphene oxide/epoxy-polyurethane composites with enhanced thermal and mechanical properties. Appl. Surf. Sci. 2014, 316, 114–123. [Google Scholar] [CrossRef]
- Lee, Y.R.; Raghu, A.V.; Jeong, H.M.; Kim, B.K. Properties of Waterborne Polyurethane/Functionalized Graphene Sheet Nanocomposites Prepared by an in situ Method. Macromol. Chem. Phys. 2009, 210, 1247–1254. [Google Scholar] [CrossRef]
- Chieng, B.; Ibrahim, N.; Yunus, W.; Hussein, M.; Then, Y.; Loo, Y. Effects of Graphene Nanoplatelets and Reduced Graphene Oxide on Poly(lactic acid) and Plasticized Poly(lactic acid): A Comparative Study. Polymers 2014, 6, 2232–2246. [Google Scholar] [CrossRef] [Green Version]
- Liu, Y.; Zhang, Y.; Duan, L.; Zhang, W.; Su, M.; Sun, Z.; He, P. Polystyrene/graphene oxide nanocomposites synthesized via Pickering polymerization. Prog. Org. Coat. 2016, 99, 23–31. [Google Scholar] [CrossRef]
- Albozahid, M.; Naji, H.; Alobad, Z.; Saiani, A. The effect of OMMT reinforcement and annealing treatment on mechanical and thermal properties of Polyurethane Copolymer nanocomposites. J. Elastomers Plast. 2021, 54, 477–493. [Google Scholar] [CrossRef]
- Pokharel, P.; Choi, S.; Lee, D.S. The effect of hard segment length on the thermal and mechanical properties of polyurethane/graphene oxide nanocomposites. Compos. Part A Appl. Sci. Manuf. 2015, 69, 168–177. [Google Scholar] [CrossRef]
- Wang, Z.; Li, S.; Wu, Z. The fabrication and properties of a graphite nanosheet/polystyrene composite based on graphite nanosheets treated with supercritical water. Compos. Sci. Technol. 2015, 112, 50–57. [Google Scholar] [CrossRef]
- Lan, Y.; Liu, H.; Cao, X.; Zhao, S.; Dai, K.; Yan, X.; Zheng, G.; Liu, C.; Shen, C.; Guo, Z. Electrically conductive thermoplastic polyurethane/polypropylene nanocomposites with selectively distributed graphene. Polymer 2016, 97, 11–19. [Google Scholar] [CrossRef]
- Li, J.W.; Tsen, W.C.; Tsou, C.H.; Suen, M.C.; Chiu, C.W. Synthetic Environmentally Friendly Castor Oil Based-Polyurethane with Carbon Black as a Microphase Separation Promoter. Polymers 2019, 11, 1333. [Google Scholar] [CrossRef] [Green Version]
- Lei, L.; Xia, Z.; Zhang, L.; Zhang, Y.; Zhong, L. Preparation and properties of amino-functional reduced graphene oxide/waterborne polyurethane hybrid emulsions. Prog. Org. Coat. 2016, 97, 19–27. [Google Scholar] [CrossRef]
- Jiang, S.; Li, Q.; Wang, J.; He, Z.; Zhao, Y.; Kang, M. Multiscale graphene oxide–carbon fiber reinforcements for advanced polyurethane composites. Compos. Part A Appl. Sci. Manuf. 2016, 87, 1–9. [Google Scholar] [CrossRef]


| TGA | DTG | |||||||||||
|---|---|---|---|---|---|---|---|---|---|---|---|---|
| T Onset ± SD | Residual Mass (%)@600 °C ± SD | 1st Step (HS Degradation) | 2nd Step (SS Degradation) | |||||||||
| GNP | GO | GNP | GO | Tmax (°C) ± SD | Dev. Mass (%/°C) ± SD | Tmax (°C) ± SD | Dev. Mass (%/°C) ± SD | |||||
| GNP | GO | GNP | GO | GNP | GO | GNP | GO | |||||
| Neat PU | 297.76 ± 1.10 | 297.76 ± 1.10 | 8.50 ± 2.88 | 8.50 ± 2.88 | 333.70 ± 1.34 | 333.70 ± 1.34 | 1.16 ± 0.13 | 1.16 ± 0.10 | 369.00 ± 2.45 | 369.00 ± 2.45 | 0.83 ± 0.11 | 0.83 ± 0.11 |
| PU + 0.25 (wt.%) | 308.7 ± 3.73 | 307.67 ± 3.80 | 10.11 ± 0.03 | 6.76 ± 1.30 | 334.80 ± 2.51 | 342.14 ± 1.80 | 1.24 ± 0.03 | 1.50 ± 0.05 | 368.20 ± 4.01 | 380.80 ± 1.40 | 0.92 ± 0.09 | 0.95 ± 0.02 |
| PU + 0.5 (wt.%) | 309.20 ± 4.34 | 308.90 ± 1.50 | 10.5 ± 1.13 | 7.79 ± 0.87 | 338.67 ± 1.40 | 343.57 ± 2.40 | 1.38 ± 0.11 | 1.8.80 ± 0.10 | 372.86 ± 3.30 | 382.88 ± 2.70 | 0.99 ± 0.03 | 1.1 ± 0.65 |
| PU + 0.75 (wt.%) | 314.56 ± 0.55 | 315.46 ± 2.30 | 9.62 ± 1.62 | 10.50 ± 0.27 | 341.47 ± 2.02 | 343.6 ± 2.70 | 1.41 ± 0.12 | 1.34 ± 2.8 | 375.80 ± 2.02 | 392.45 ± 2.49 | 1.02 ± 0.05 | 1.30 ± 0.77 |
| First Heating | First Cooling | Second Heating | ||||||||||
|---|---|---|---|---|---|---|---|---|---|---|---|---|
| GNP | GO | GNP | GO | GNP | GO | |||||||
| Tm ± SD | ΔHm ± SD | Tm ± SD | ΔHm ± SD | Tc ± SD | ΔHc ± SD | Tc ± SD | ΔHc ± SD | Tm ± SD | ΔHm ± SD | Tm ± SD | ΔHm ± SD | |
| Pure PU (65% HS) | 171.60 ± 1.85 | 25.44 ± 1.39 | - | - | 118.31 ± 1.54 | 27.49 ± 0.09 | - | - | 174.29 ± 1.62 | 26.11 ± 0.07 | - | - |
| PU + 0.25 (wt.%) | 172.3 ± 0.60 | 26.39 ± 2.2 | 183.78 ± 2.77 | 27.59 ± 2.02 | 121.01 ± 1.40 | 28.195 ± 1.60 | 175.53 ± 2.60 | 23.07 ± 1.00 | 177.43 ± 0.60 | 25.06 ± 2. 70 | 176.71 ± 3.10 | - |
| PU + 0. 50 (wt.%) | 172.60 ± 1.65 | 27.13 ± 1.34 | 183.73 ± 0.00 | 29.67 ± 1.33 | 120.20 ± 1.30 | 30.89 ± 0.67 | 176.62 ±1.90 | 25.61 ± 1.50 | 175.62 ± 0.67 | 26.13 ± 1.40 | 178.94 ± 2.00 | - |
| PU + 0.75 (wt.%) | 174.34 ± 1.00 | 26.80 ± 1.20 | 183.21 ± 3.05 | 29.13 ± 0.90 | 120.70 ± 2.70 | 33.10 ± 1.30 | 177.61 ± 0.00 | 29.87 ± 0.60 | 176.90 ± 0.90 | 26.78 ± 0.60 | 179.55 ± 2.60 | - |
Publisher’s Note: MDPI stays neutral with regard to jurisdictional claims in published maps and institutional affiliations. |
© 2022 by the authors. Licensee MDPI, Basel, Switzerland. This article is an open access article distributed under the terms and conditions of the Creative Commons Attribution (CC BY) license (https://creativecommons.org/licenses/by/4.0/).
Share and Cite
Albozahid, M.; Naji, H.Z.; Alobad, Z.K.; Wychowaniec, J.K.; Saiani, A. Thermal, Mechanical, and Morphological Characterisations of Graphene Nanoplatelet/Graphene Oxide/High-Hard-Segment Polyurethane Nanocomposite: A Comparative Study. Polymers 2022, 14, 4224. https://0-doi-org.brum.beds.ac.uk/10.3390/polym14194224
Albozahid M, Naji HZ, Alobad ZK, Wychowaniec JK, Saiani A. Thermal, Mechanical, and Morphological Characterisations of Graphene Nanoplatelet/Graphene Oxide/High-Hard-Segment Polyurethane Nanocomposite: A Comparative Study. Polymers. 2022; 14(19):4224. https://0-doi-org.brum.beds.ac.uk/10.3390/polym14194224
Chicago/Turabian StyleAlbozahid, Muayad, Haneen Zuhair Naji, Zoalfokkar Kareem Alobad, Jacek K. Wychowaniec, and Alberto Saiani. 2022. "Thermal, Mechanical, and Morphological Characterisations of Graphene Nanoplatelet/Graphene Oxide/High-Hard-Segment Polyurethane Nanocomposite: A Comparative Study" Polymers 14, no. 19: 4224. https://0-doi-org.brum.beds.ac.uk/10.3390/polym14194224