
On the Resin Transfer Molding (RTM) Infiltration of Fiber-Reinforced Composites Made by Tailored Fiber Placement
 , , , , and
Abstract
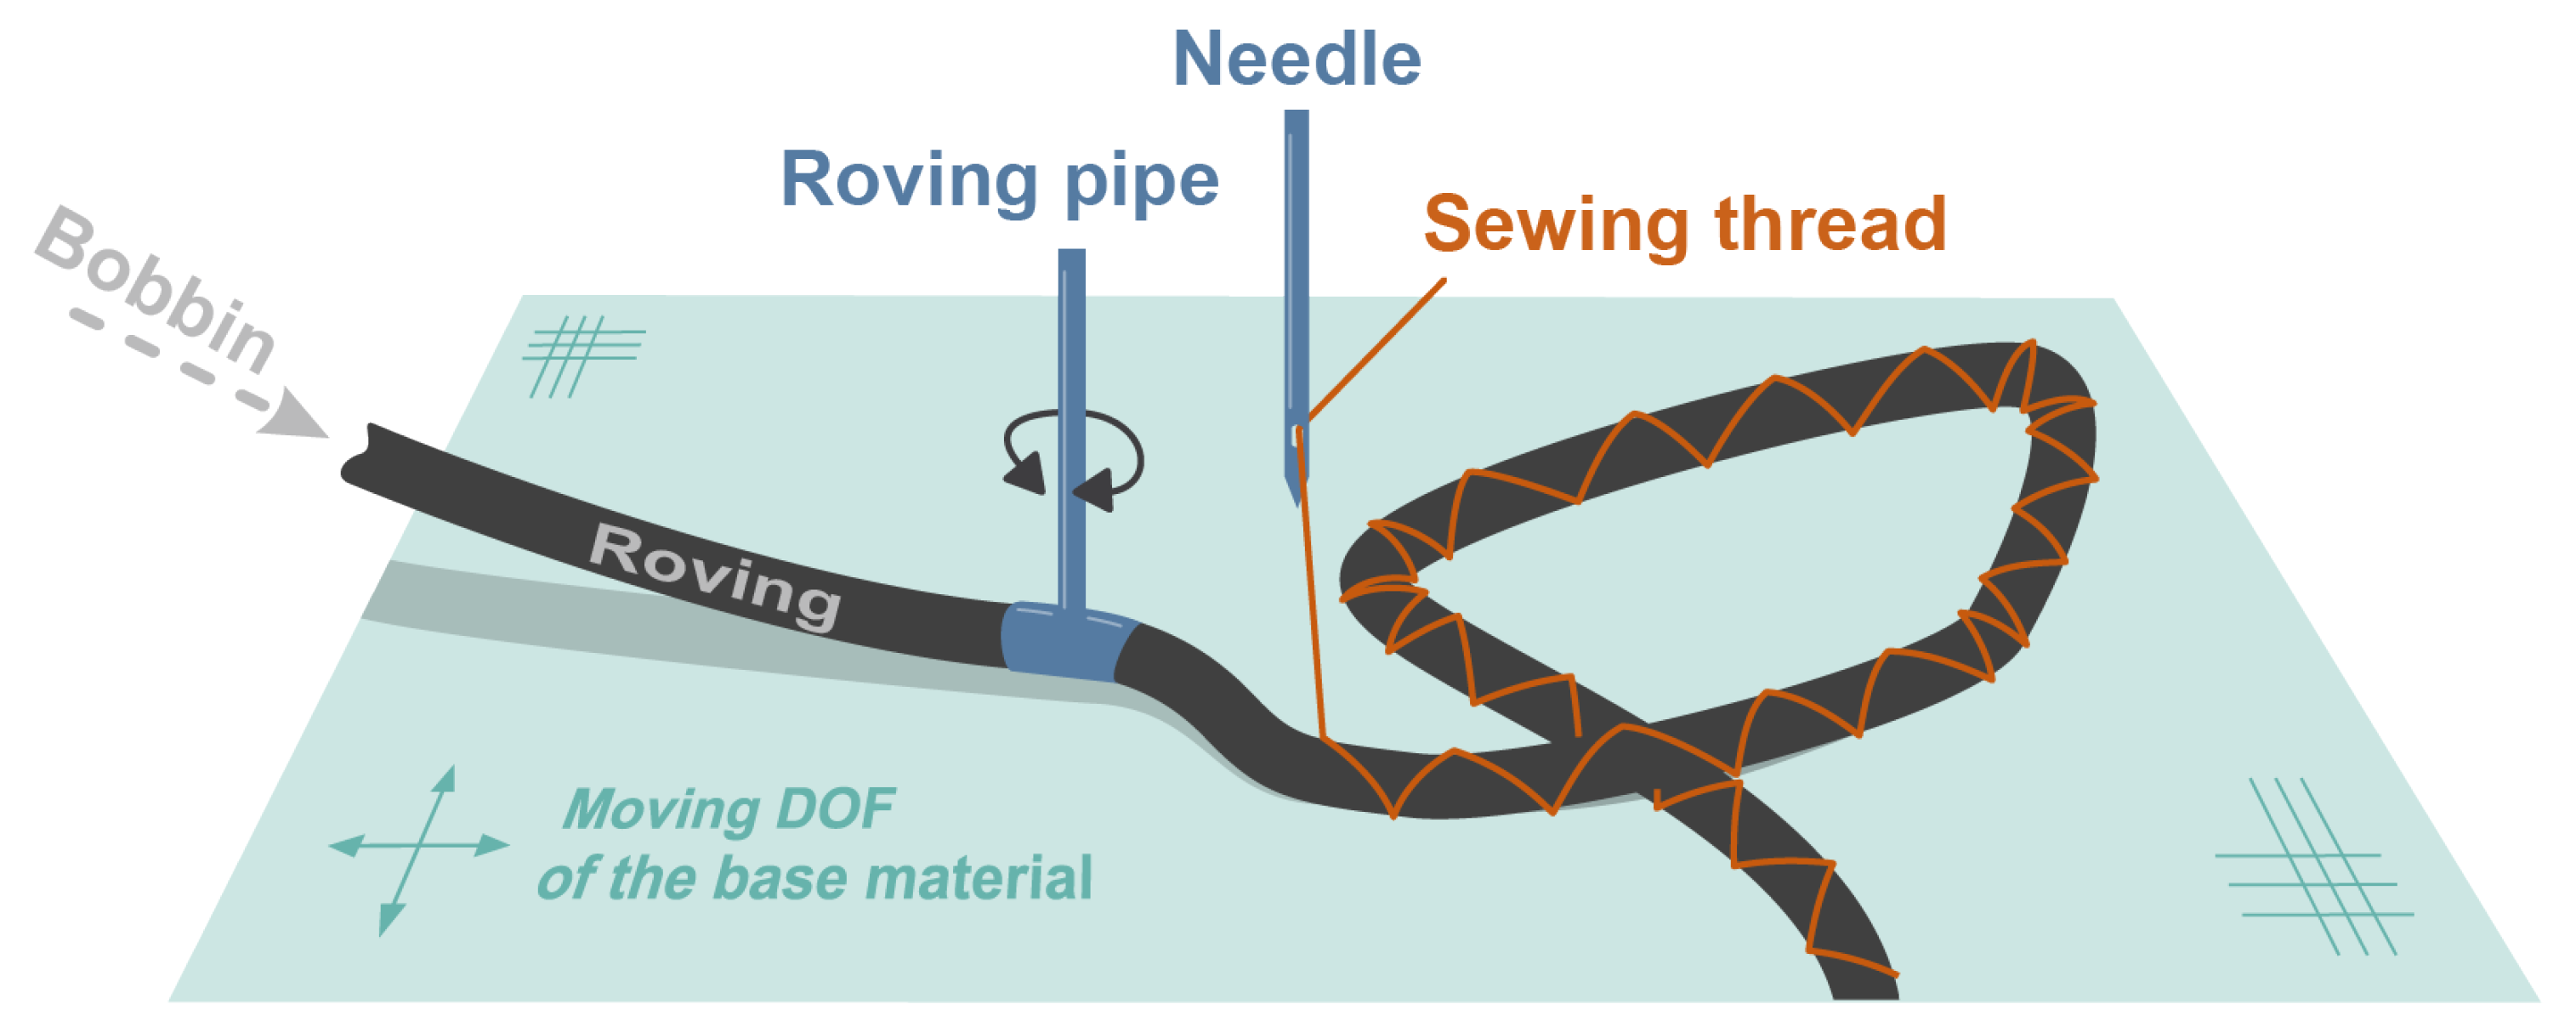
:1. Introduction
2. Experimental Evaluation
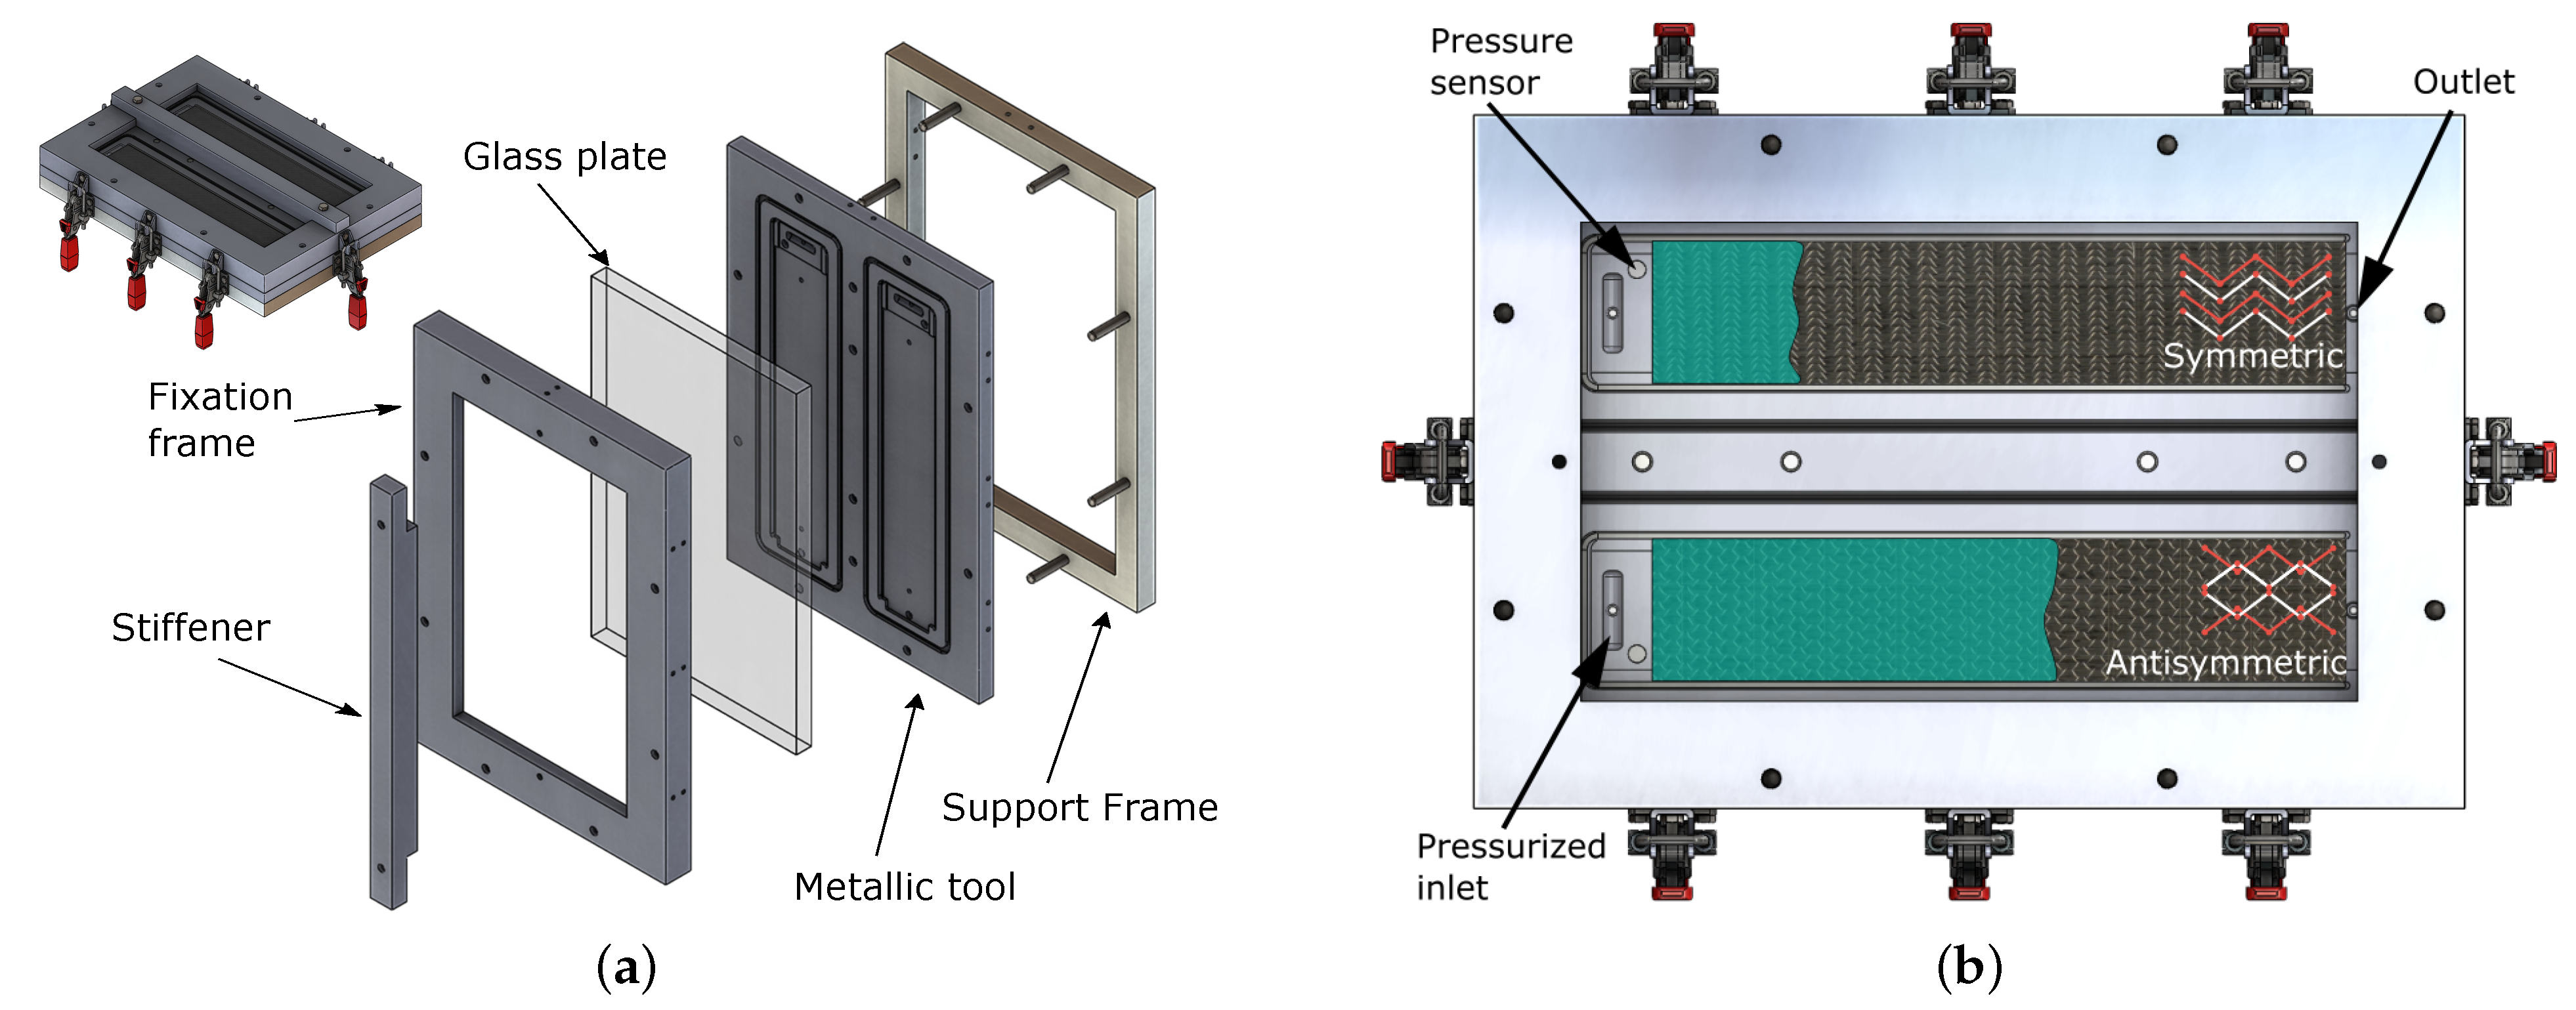
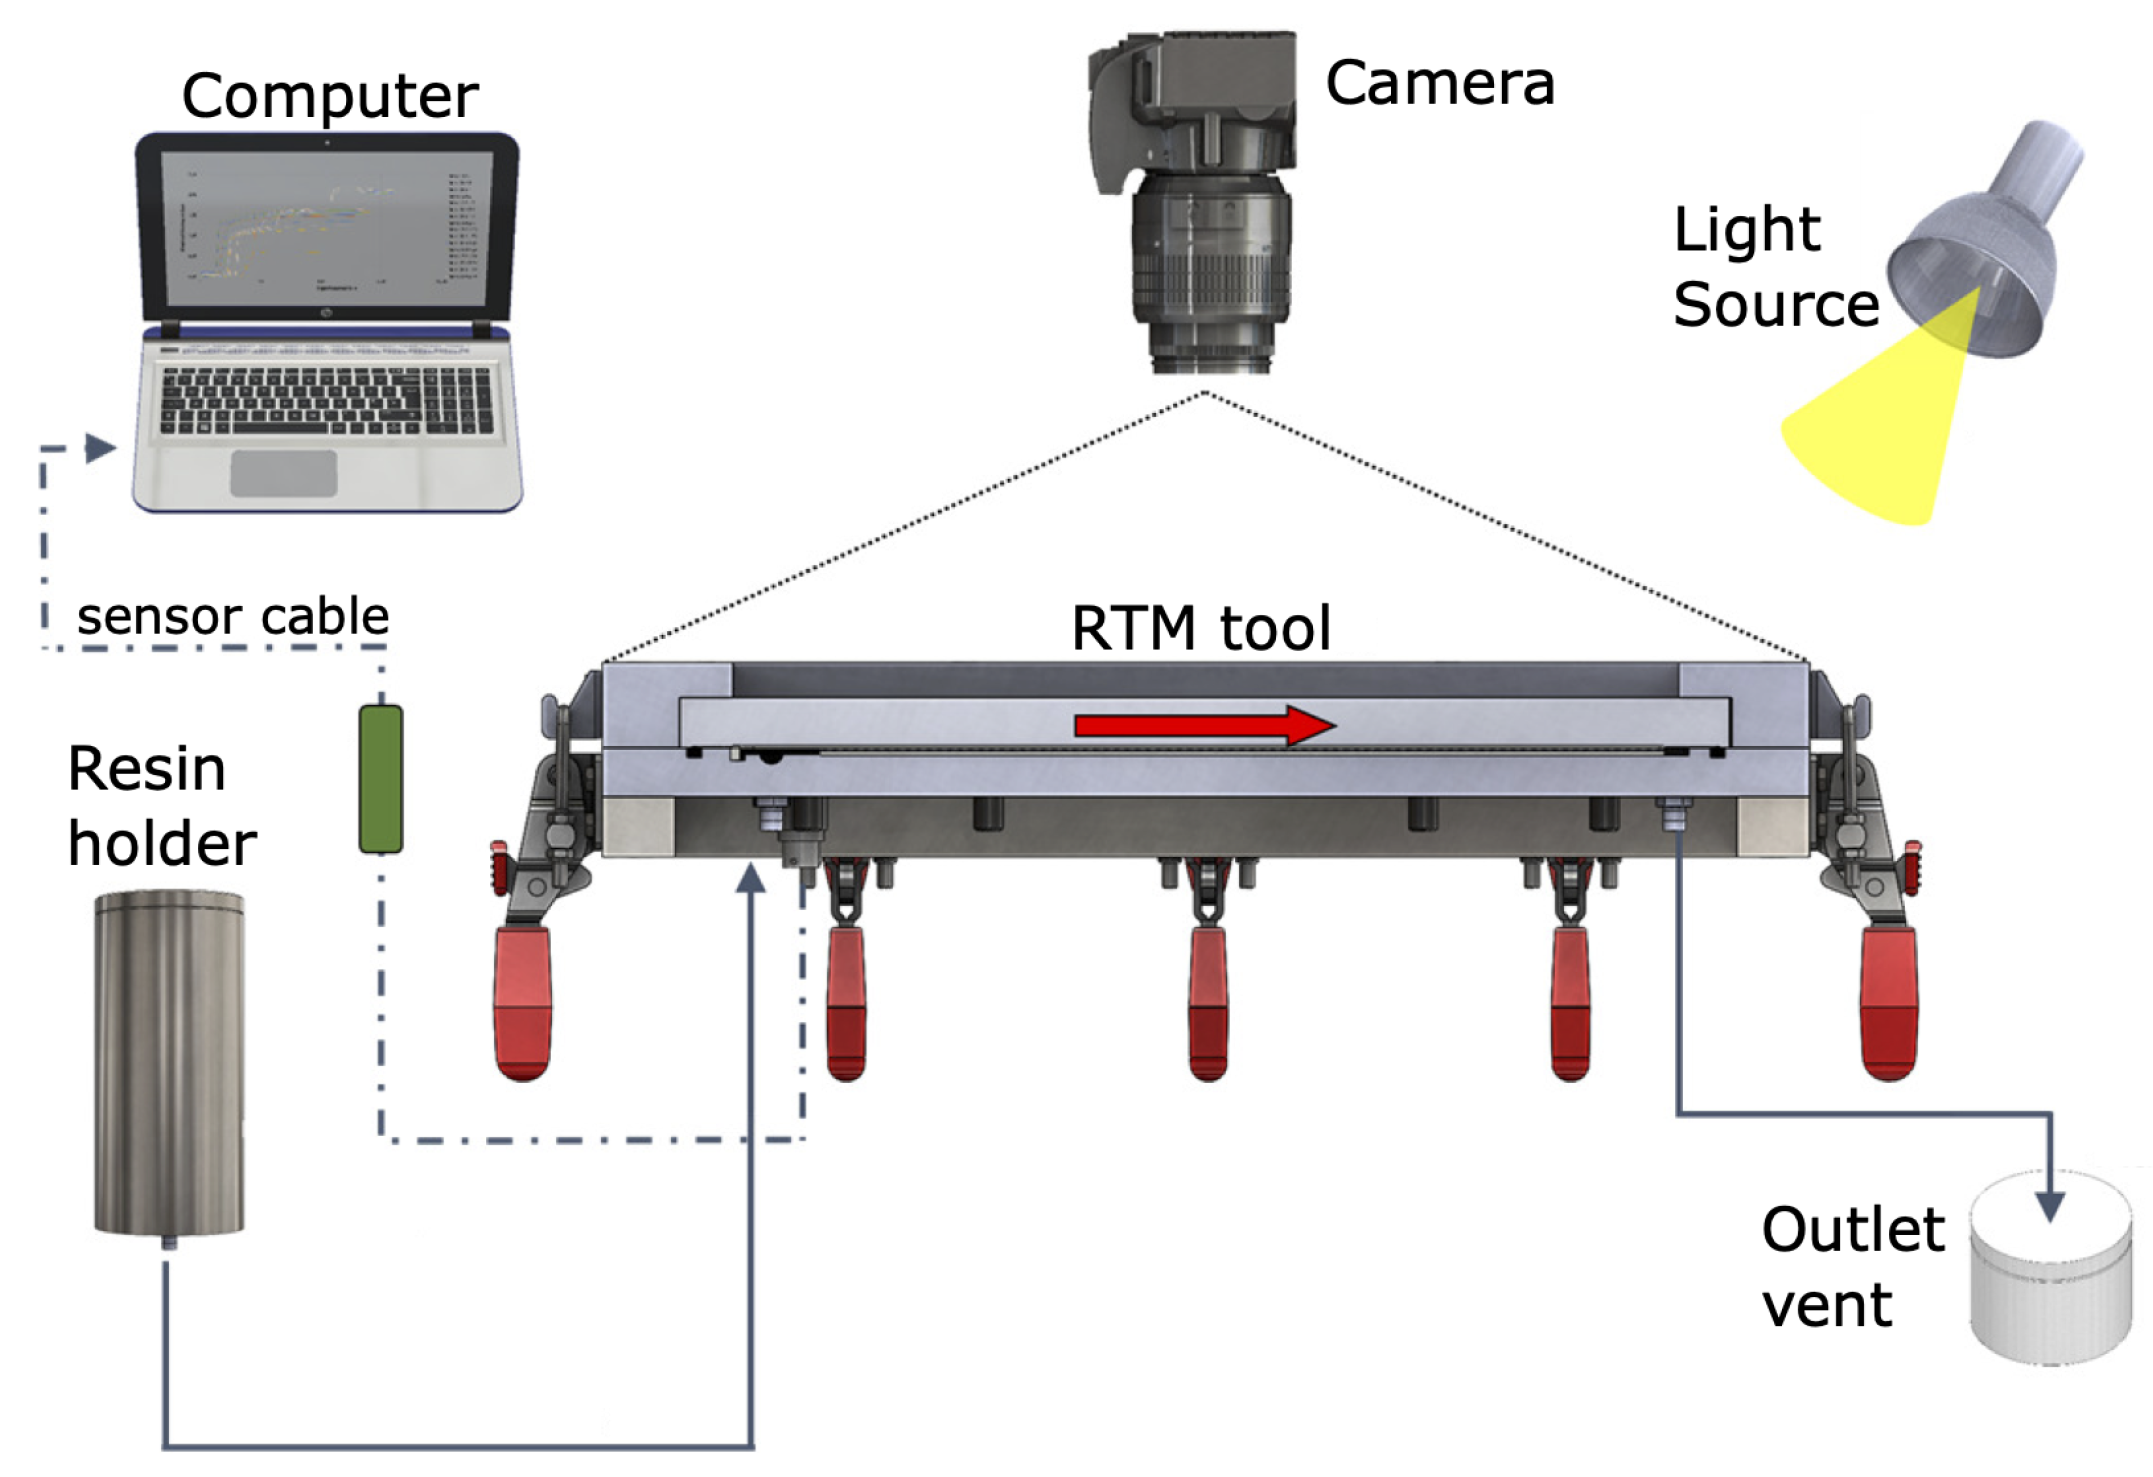
2.1. RTM Tool and Measuring System
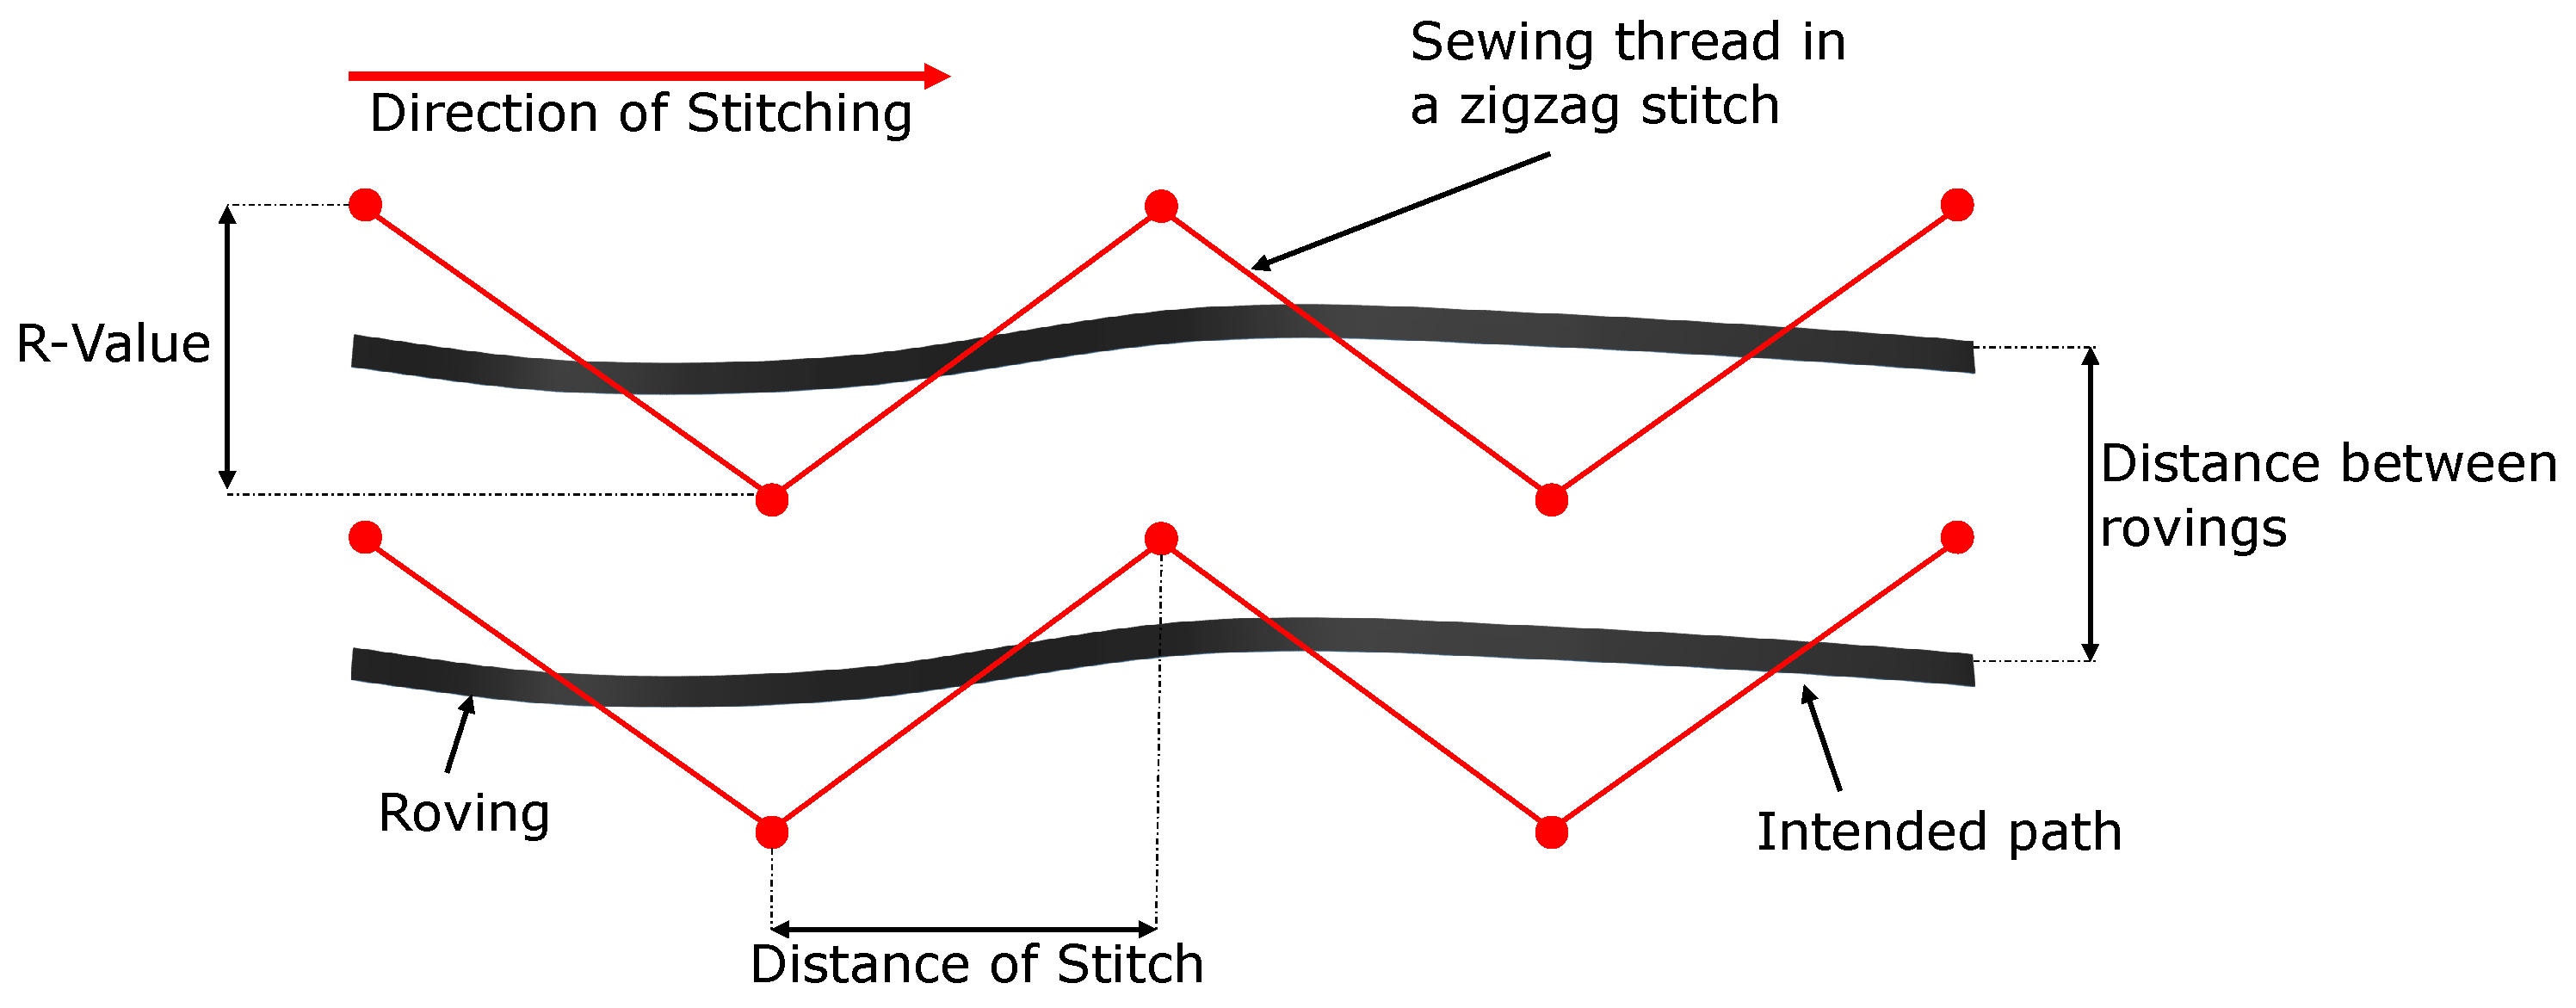
2.2. Specimen Properties and Tests
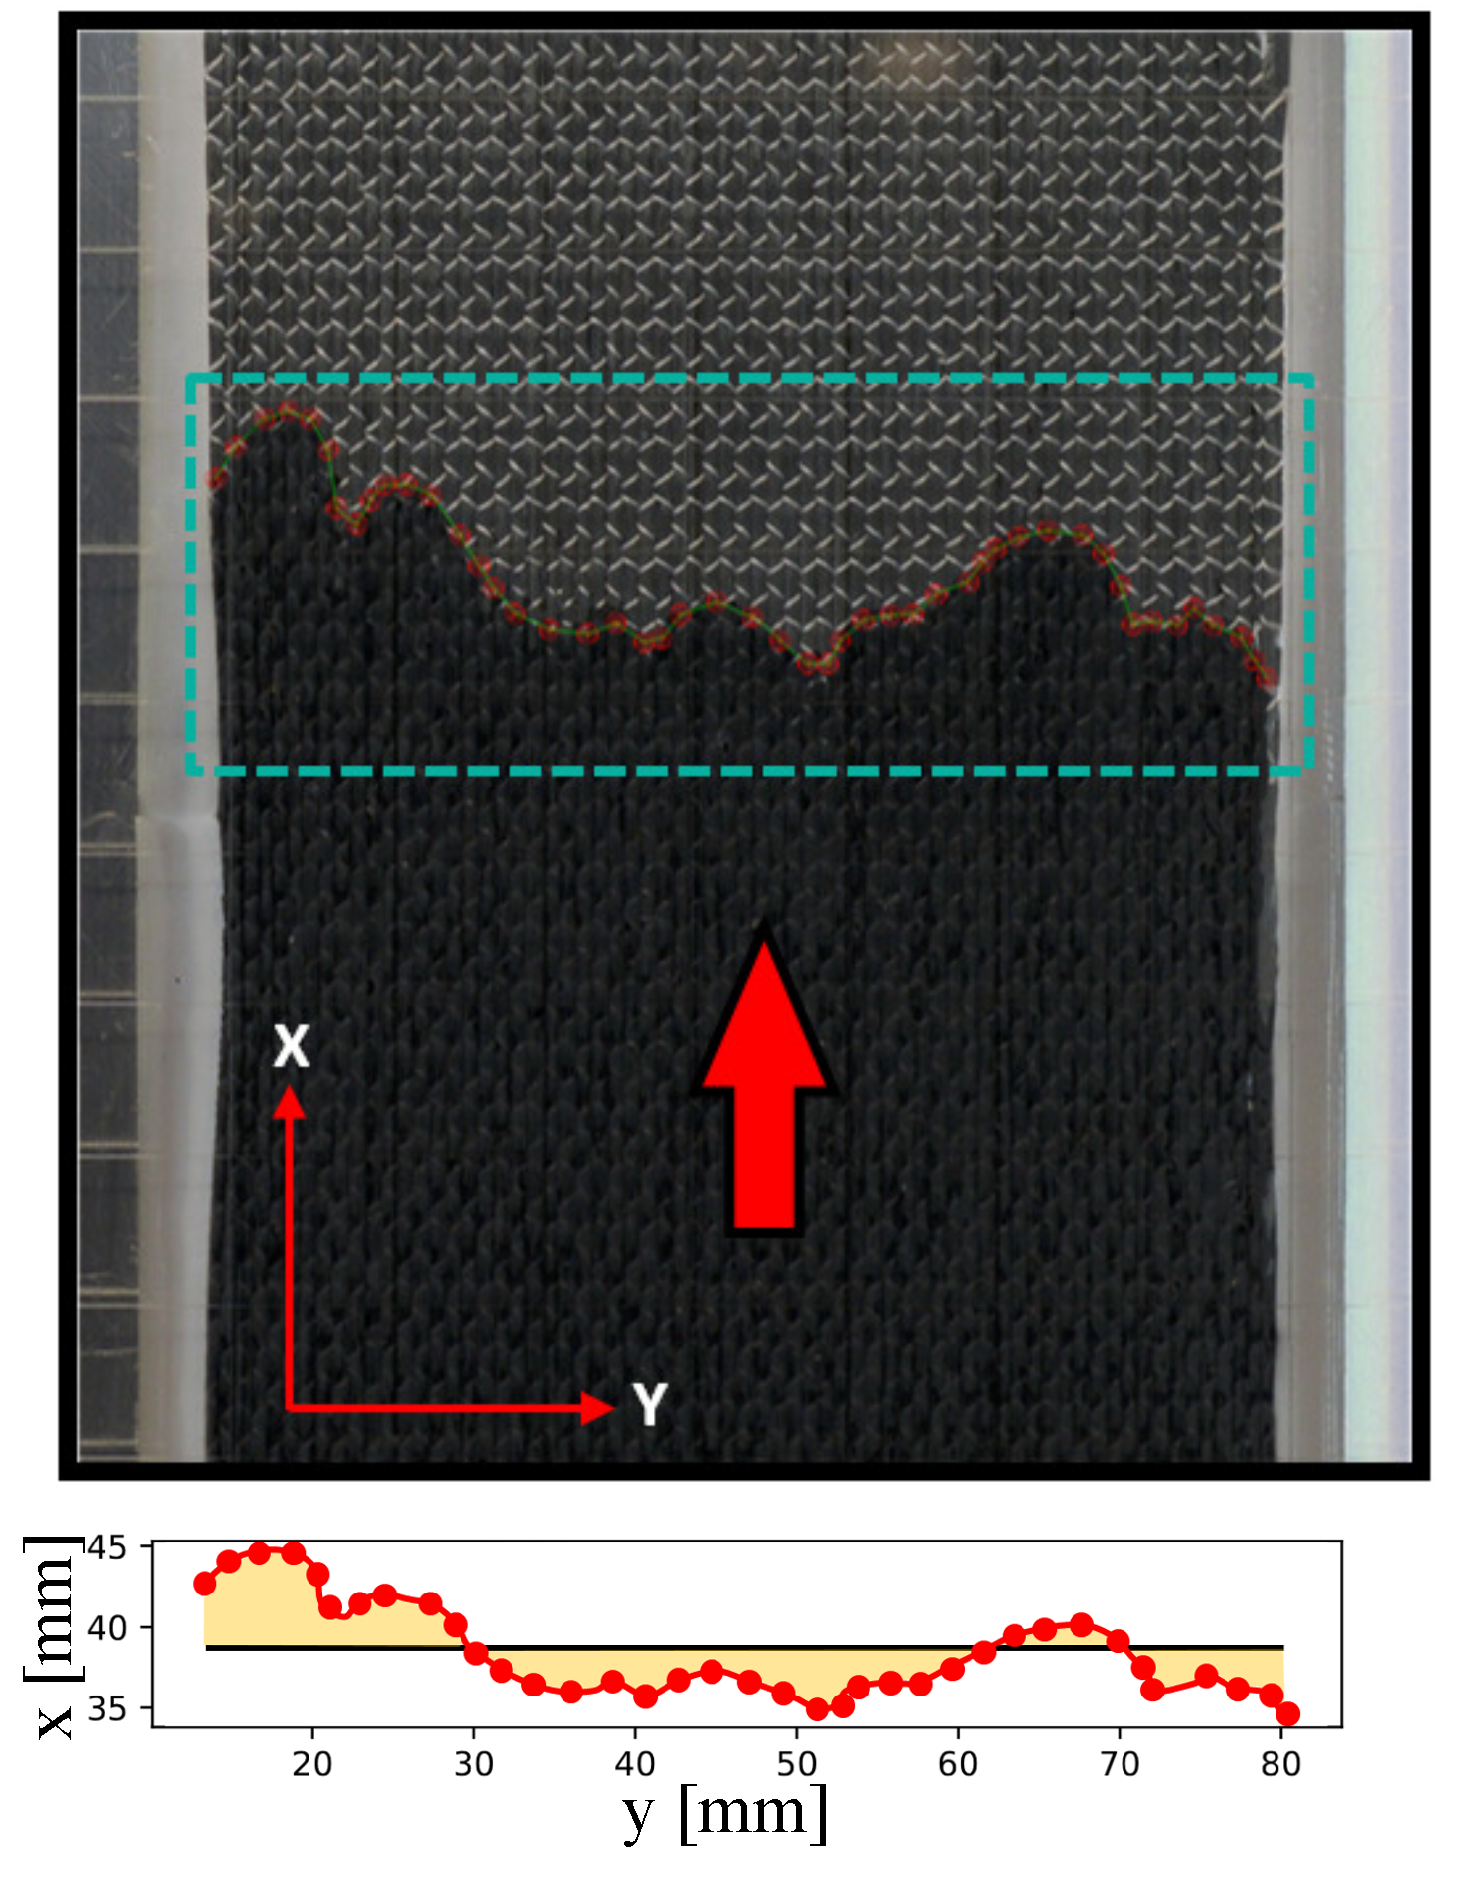
3. Permeability Definition
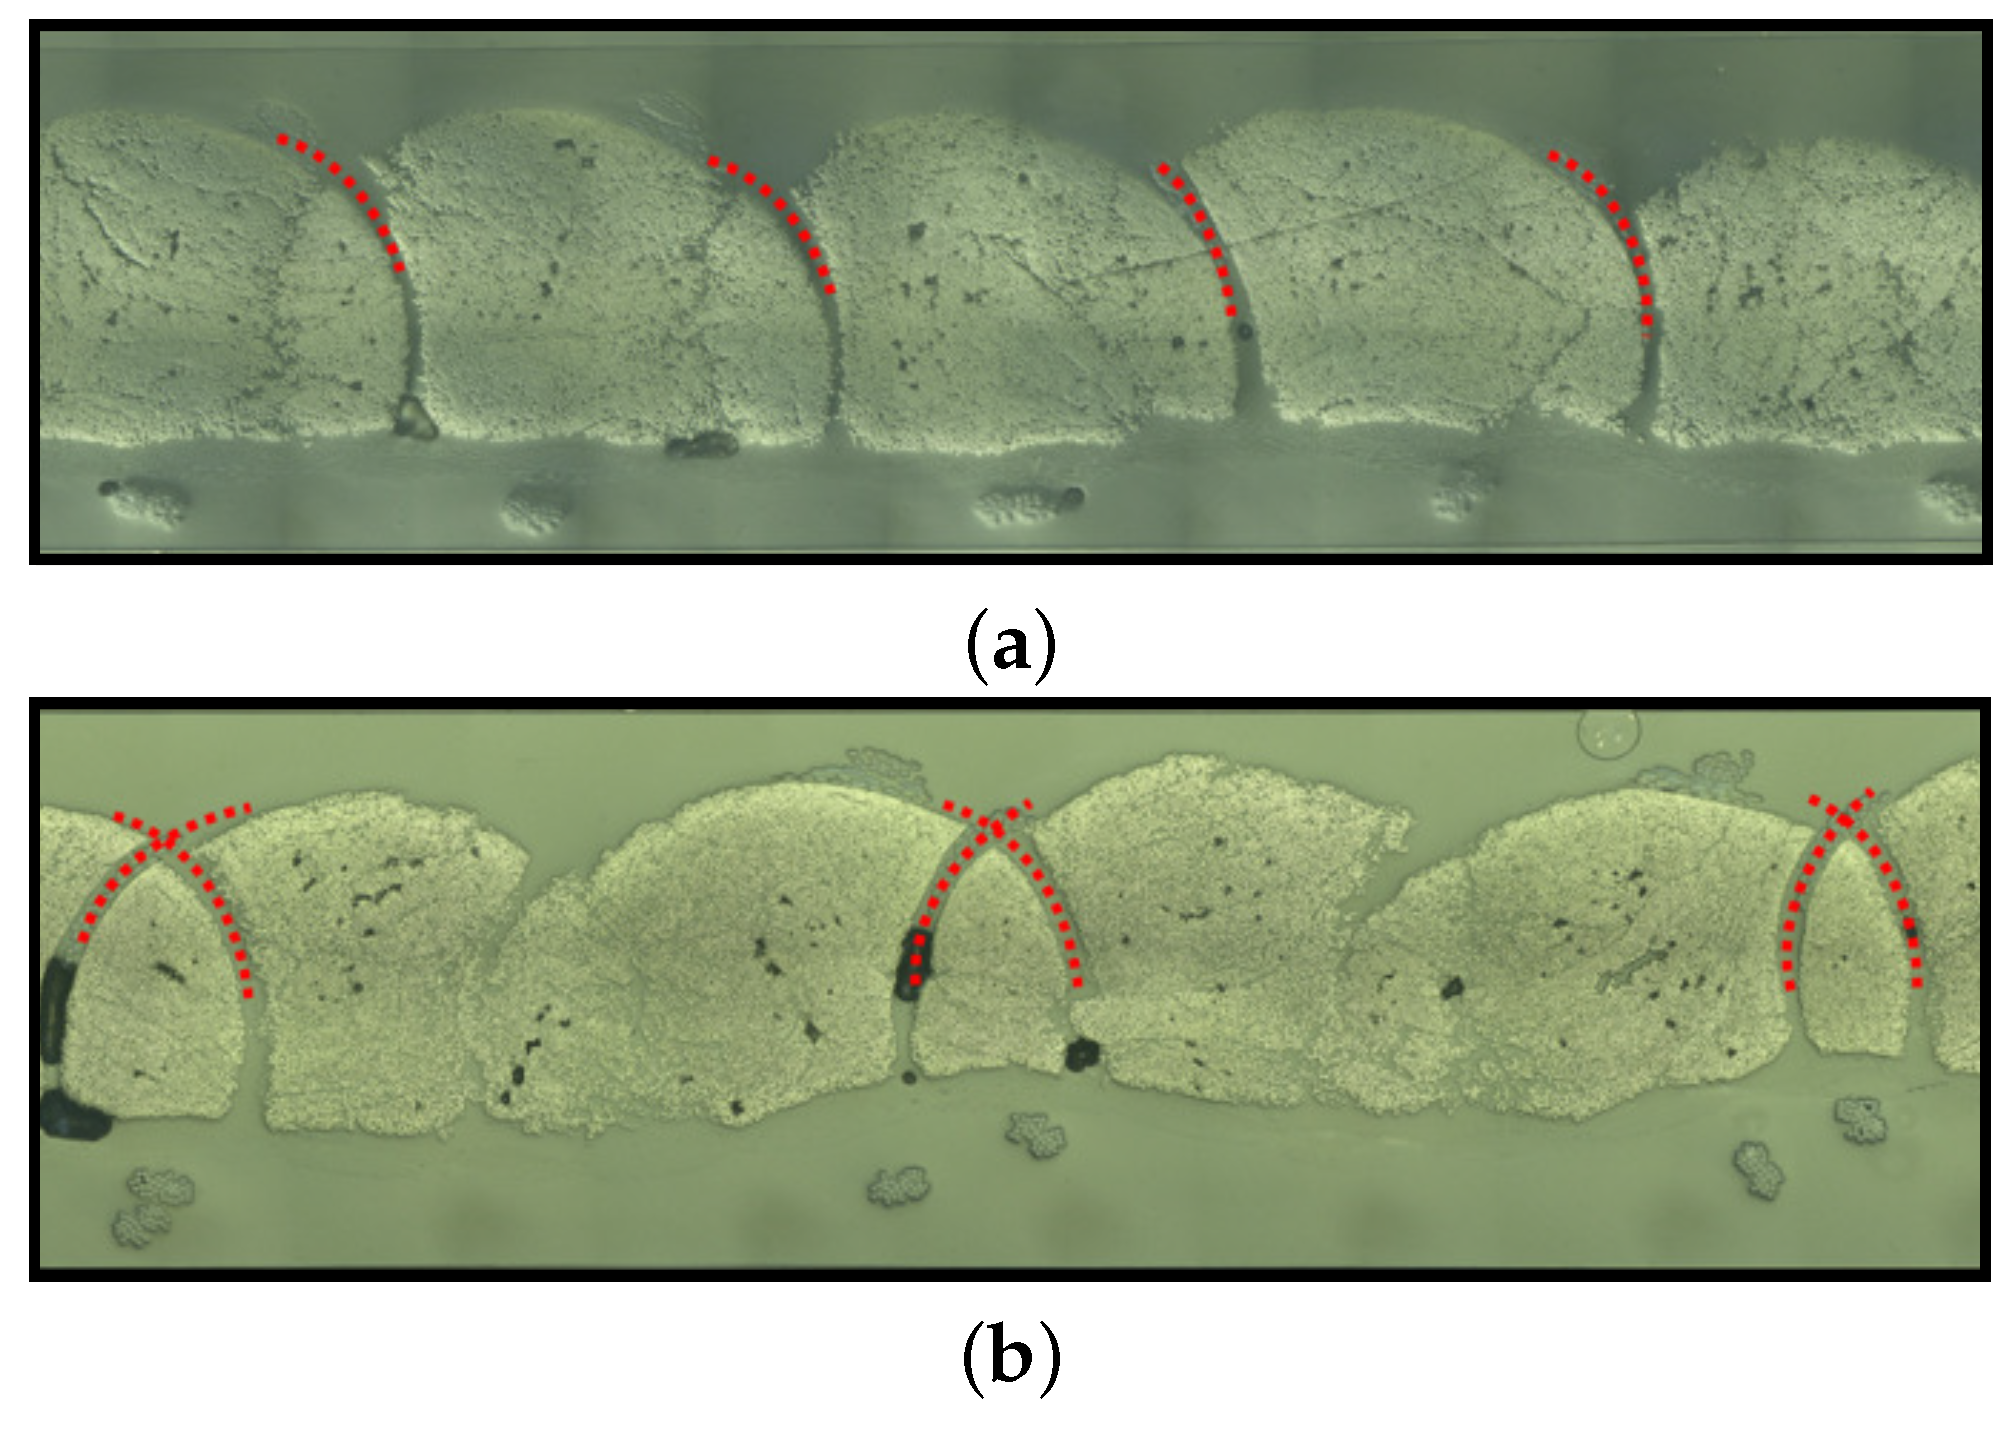
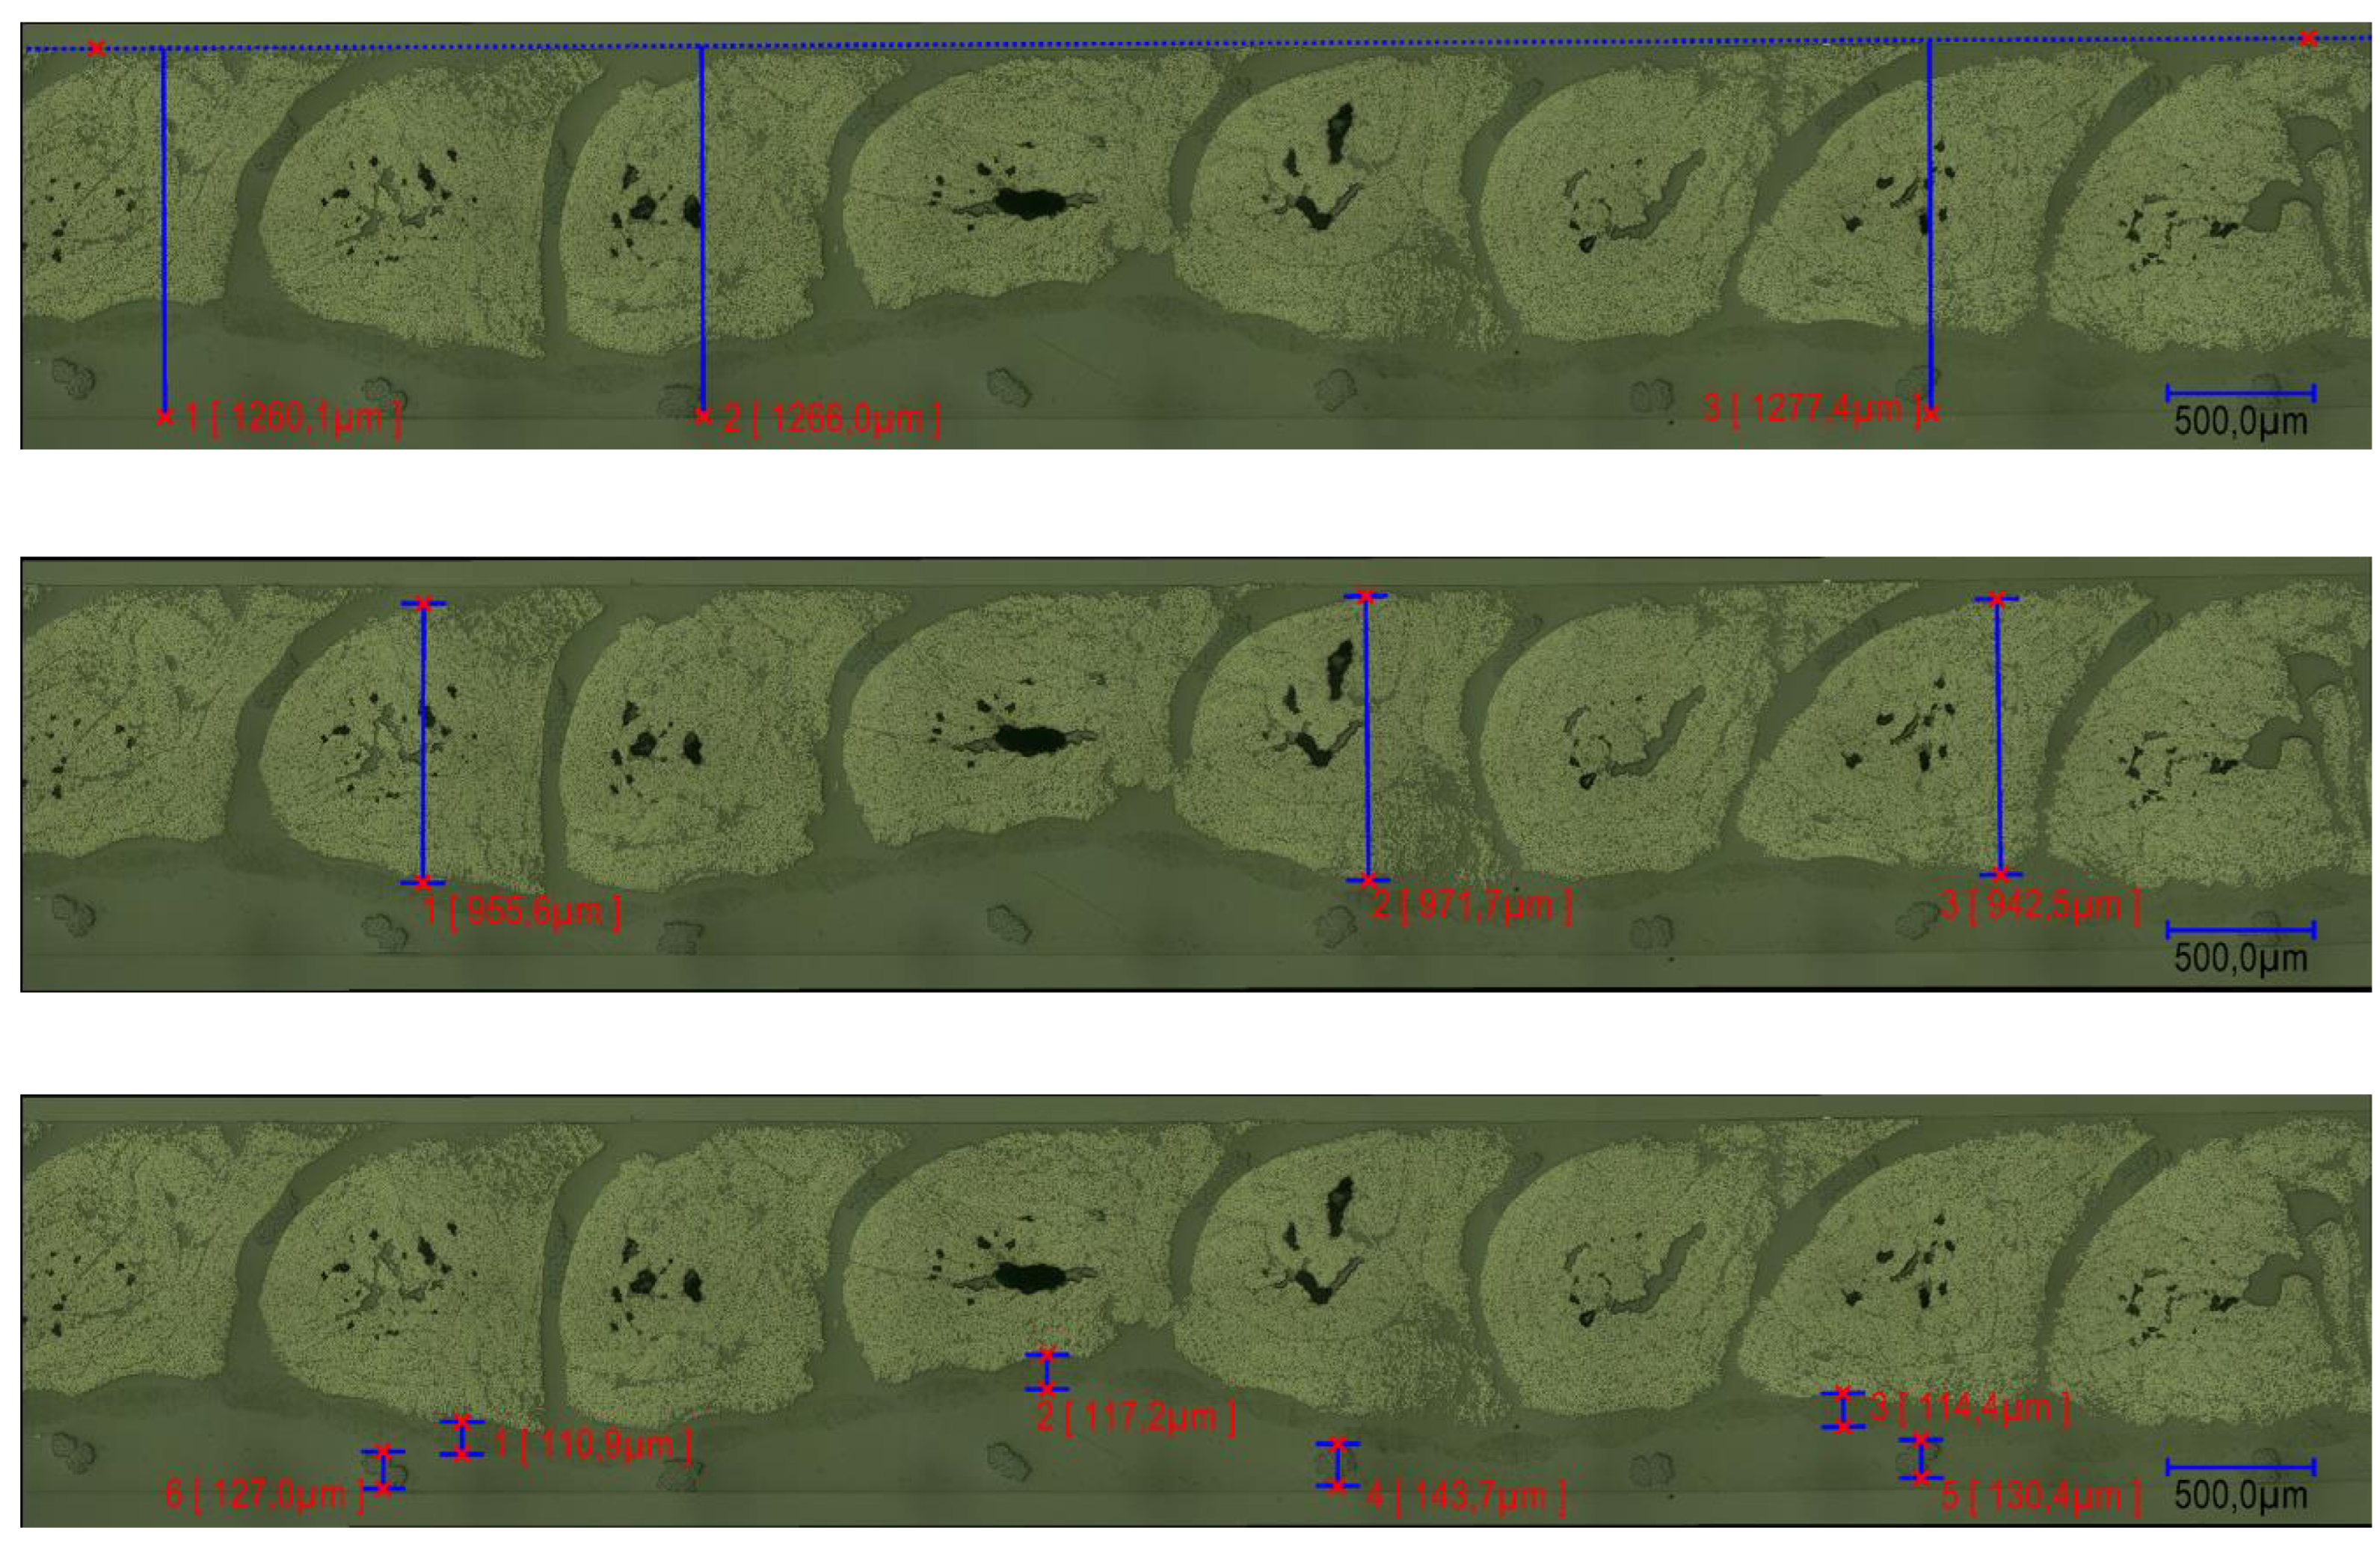
4. Microsection Analysis
5. Results and Discussion
5.1. Thickness Variations Due to the Experimental Tool
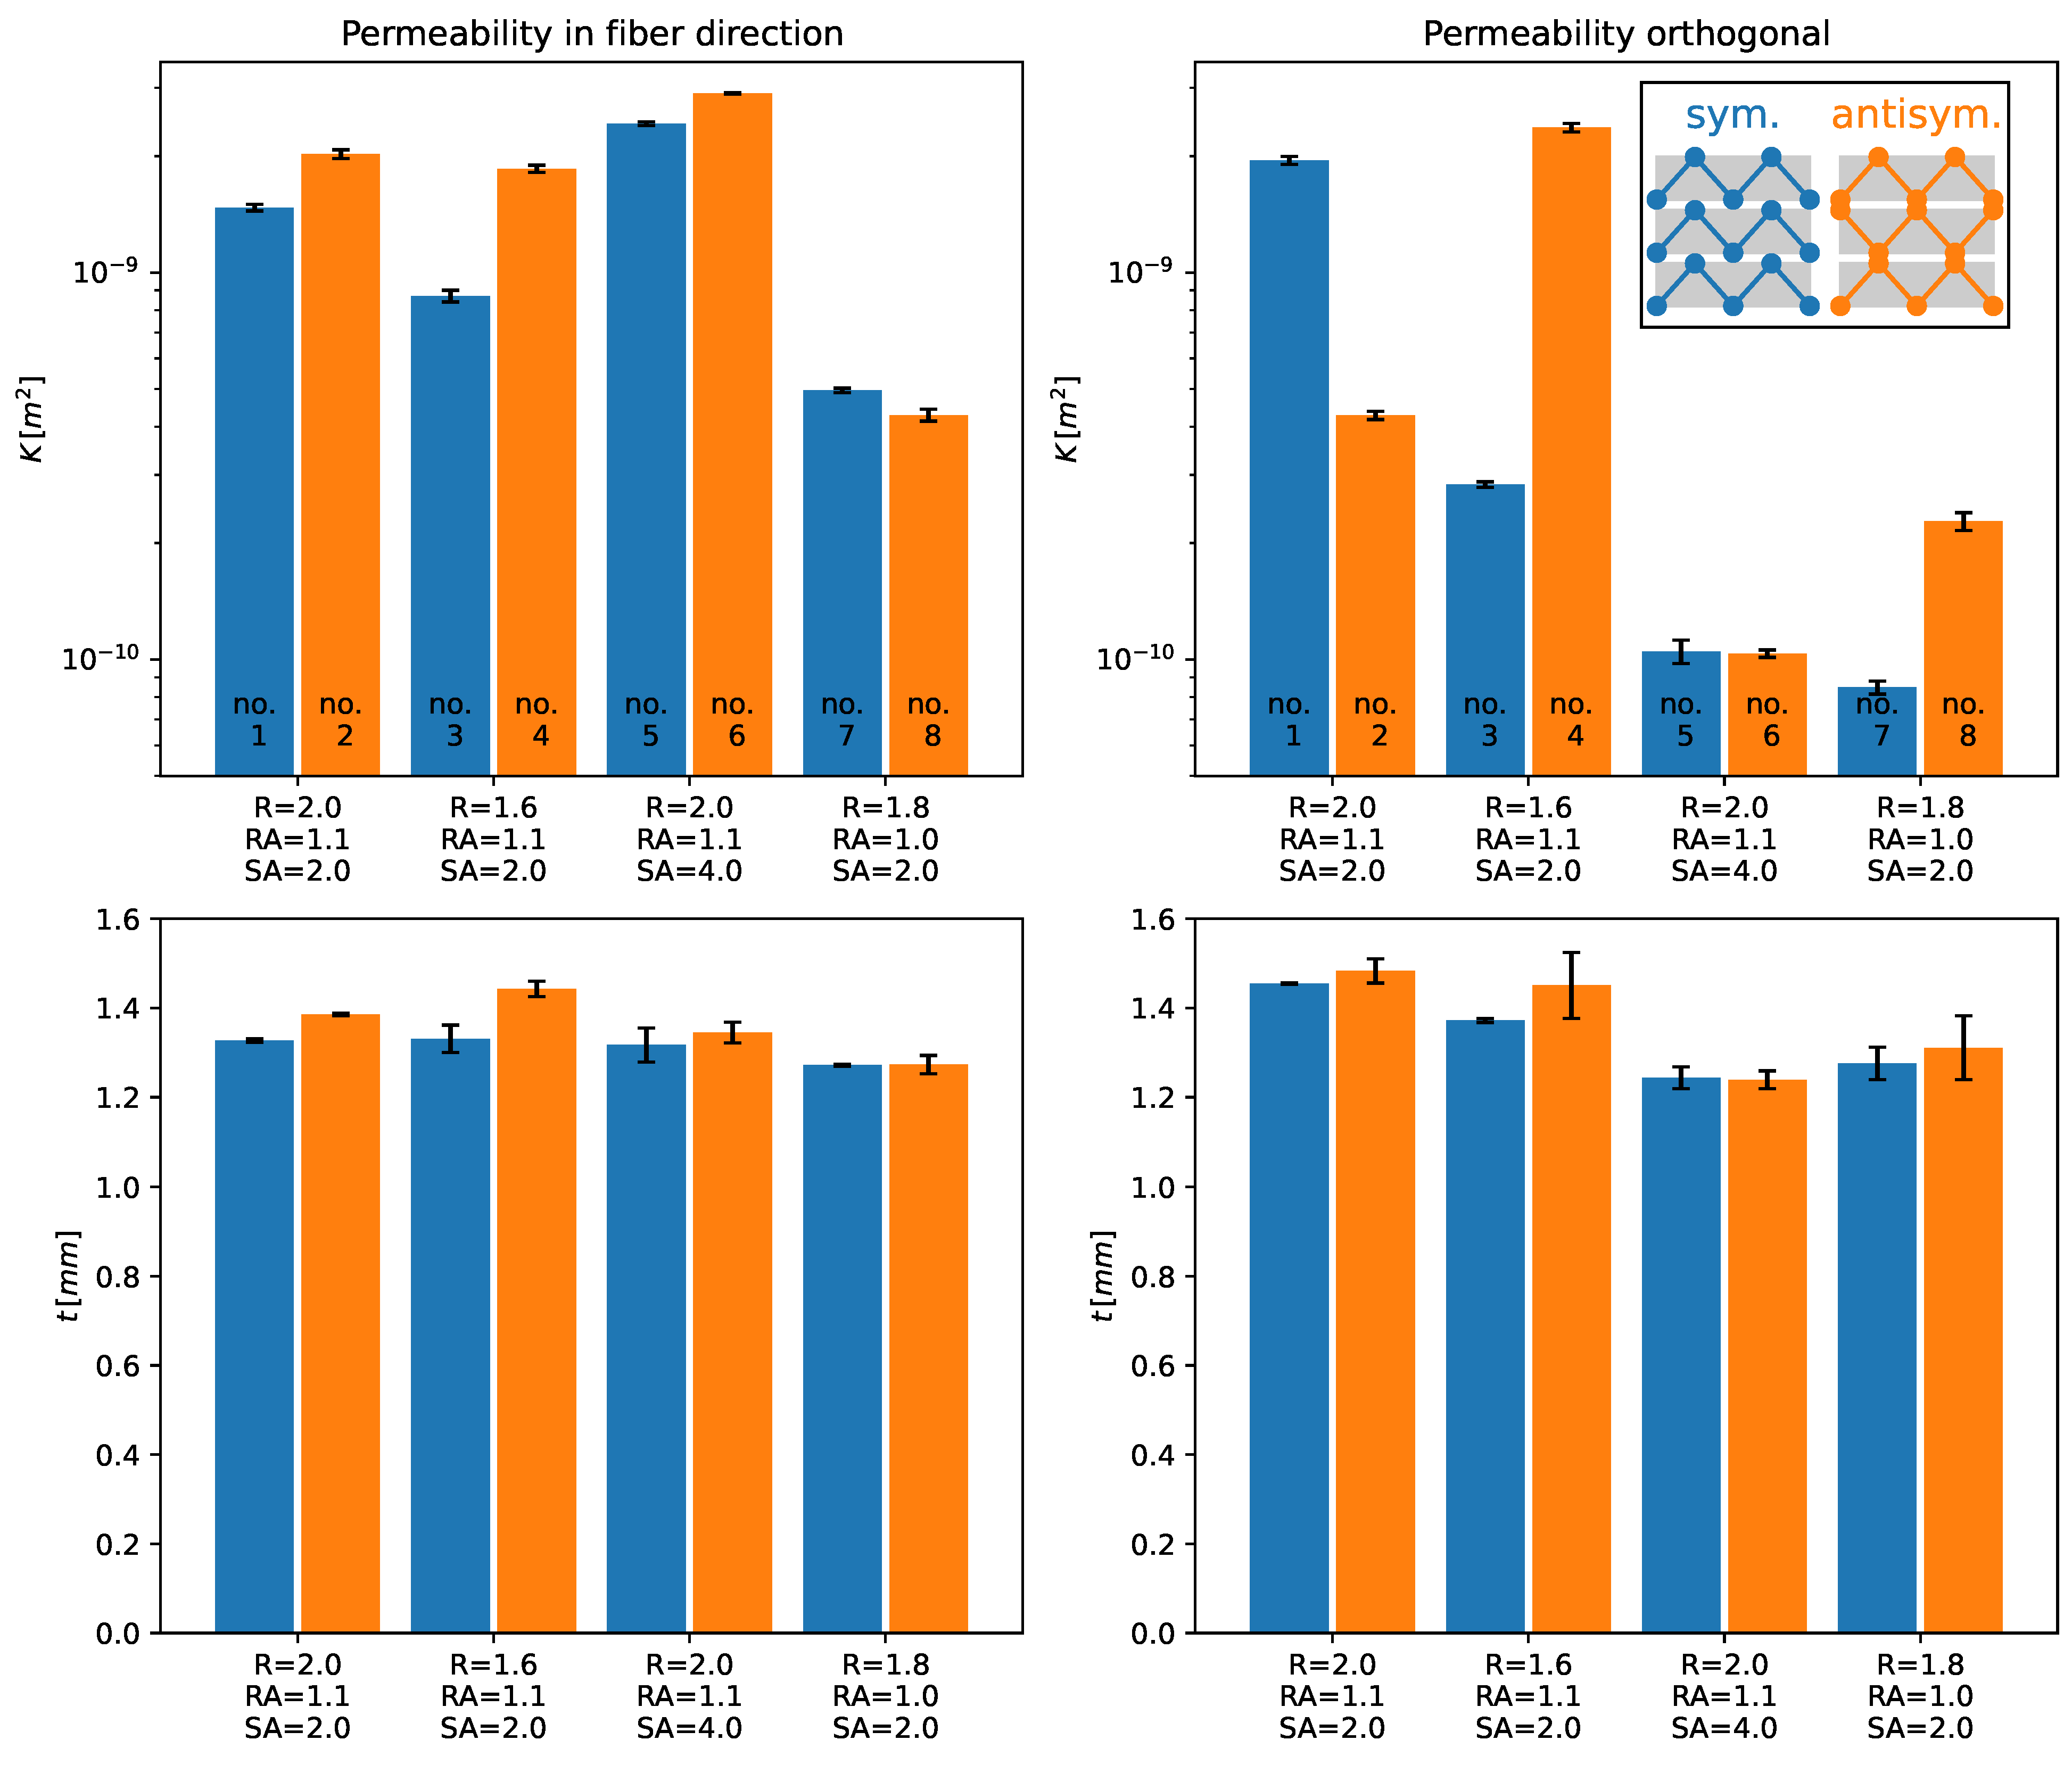
5.2. Permeability of TFP Preforms
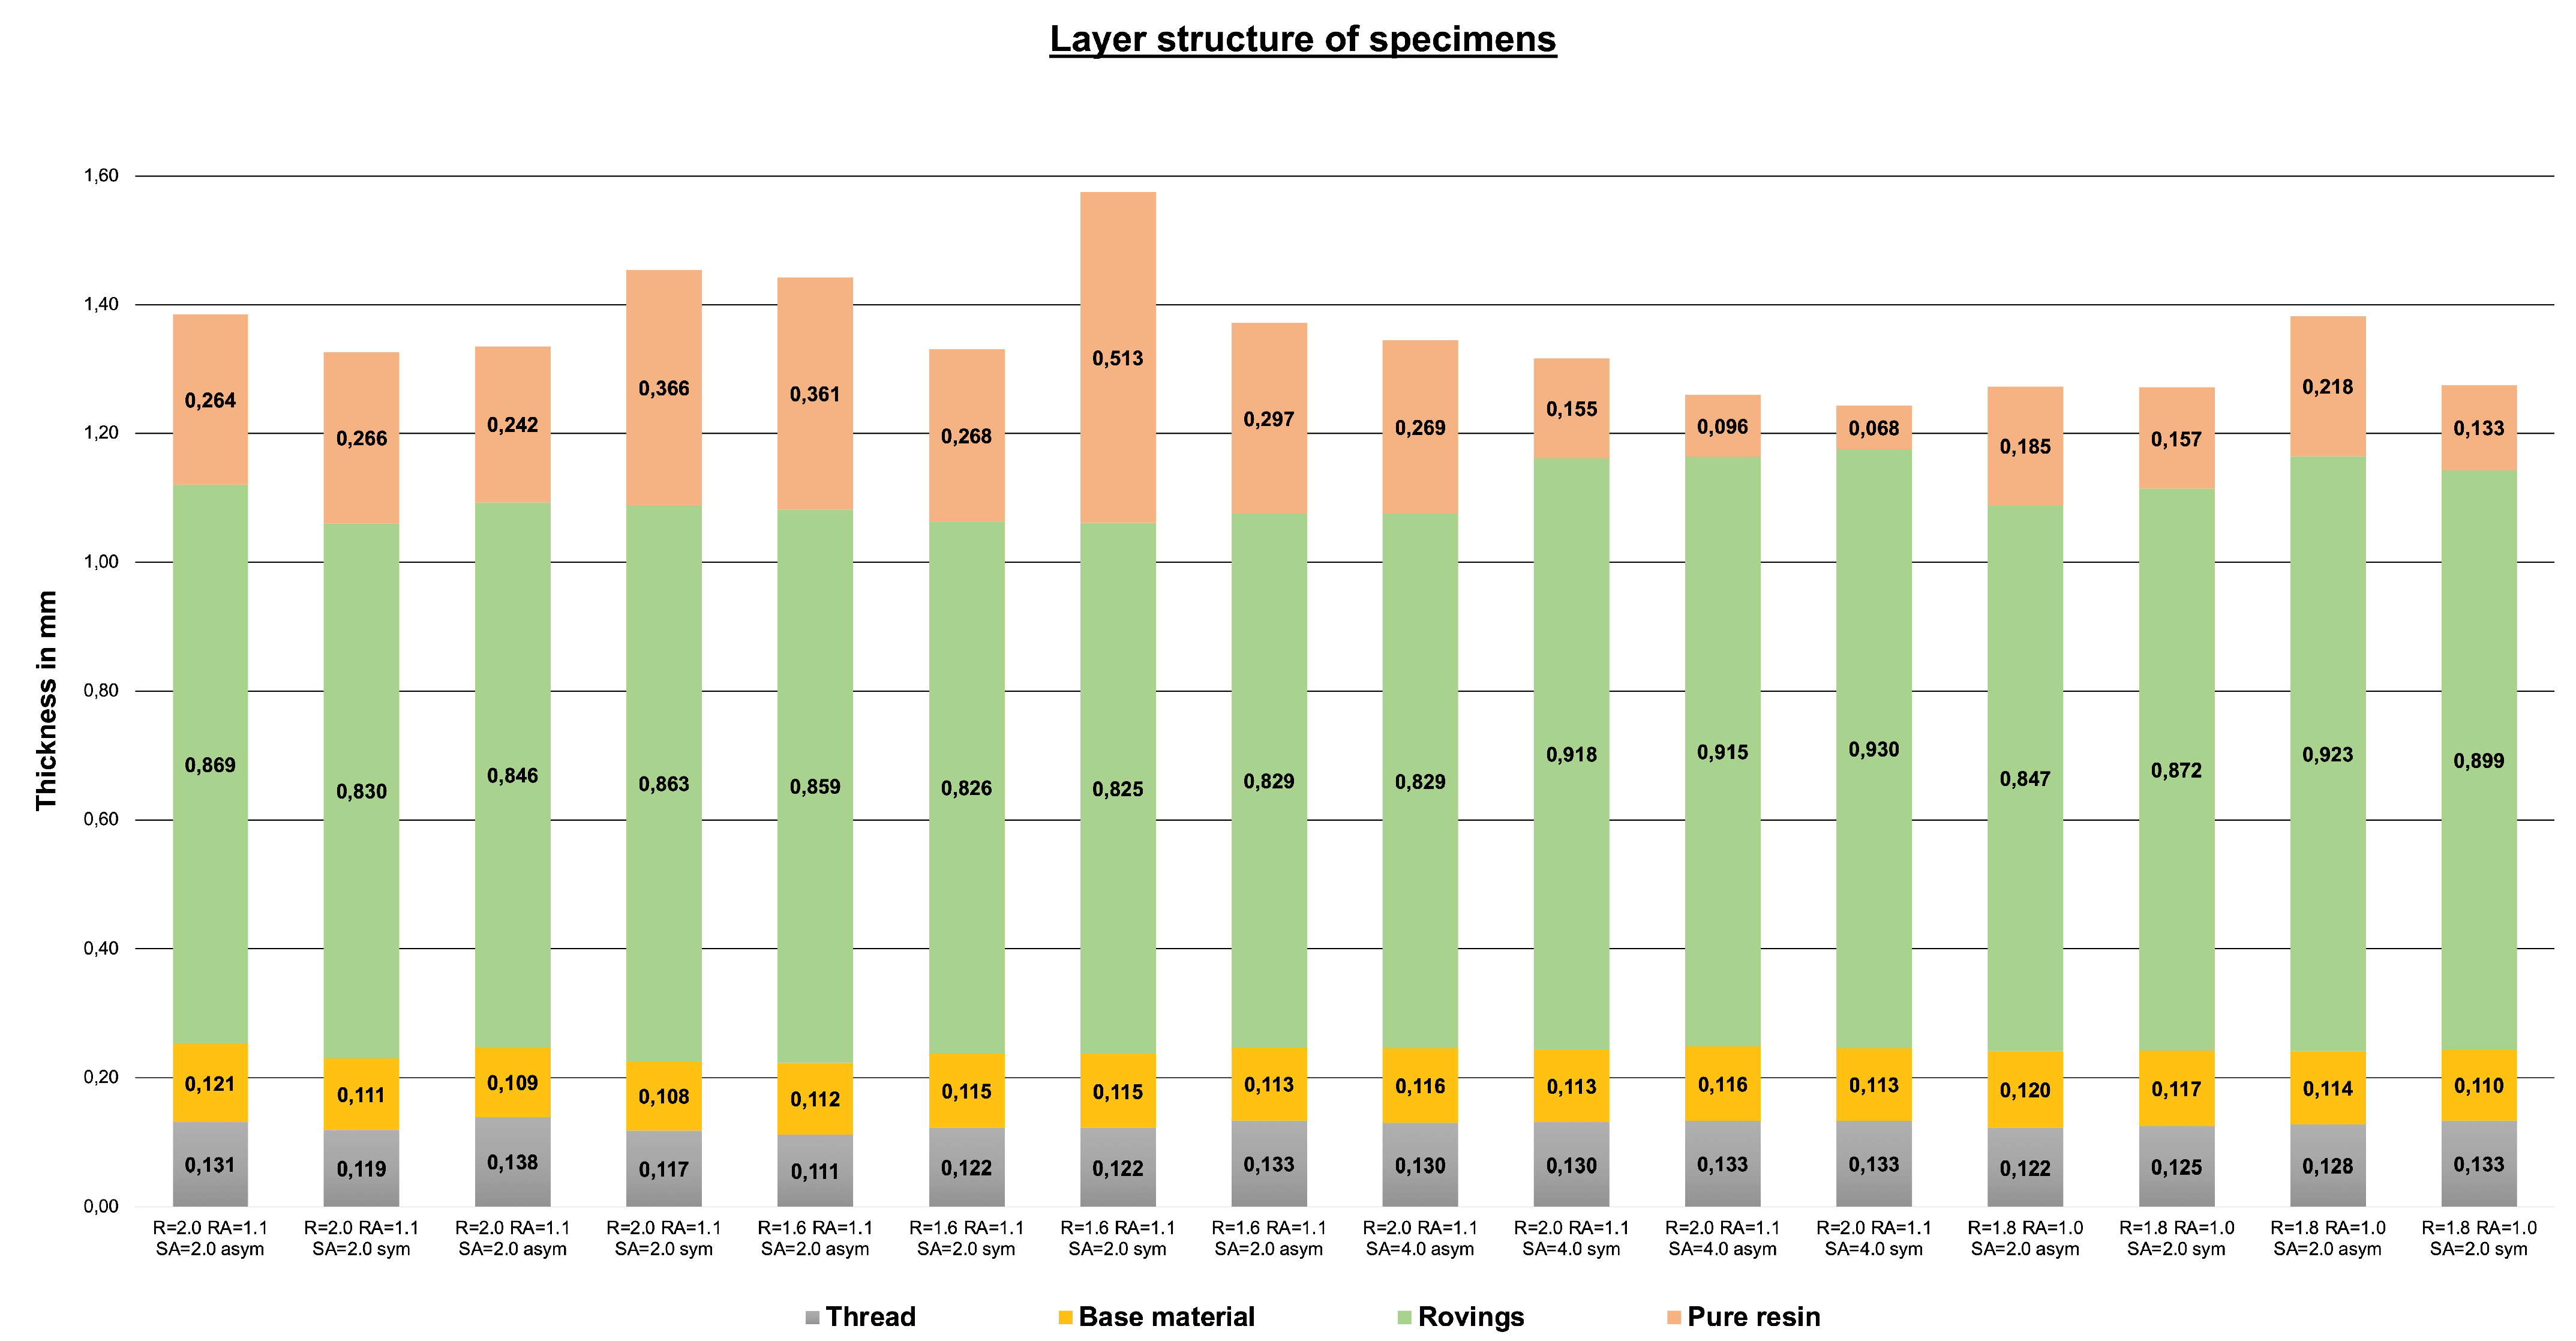
5.3. Thickness Distribution of the Specimens
6. Conclusions
Author Contributions
Funding
Data Availability Statement
Acknowledgments
Conflicts of Interest
References
- Lionetto, F.; Moscatello, A.; Totaro, G.; Raffone, M.; Maffezzoli, A. Experimental and Numerical Study of Vacuum Resin Infusion of Stiffened Carbon Fiber Reinforced Panels. Materials 2020, 13, 4800. [Google Scholar] [CrossRef] [PubMed]
- Genna, S.; Papa, I.; Lopresto, V.; Tagliaferri, V. Mechanical characterisation of CFRP laminates with recycled carbon fiber obtained by resin infusion under Flexible Tooling (RIFT) technology. Compos. Sci. Technol. 2020, 199, 108328. [Google Scholar] [CrossRef]
- Bittrich, L.; Spickenheuer, A.; Almeida, J.H.S., Jr.; Müller, S.; Kroll, L.; Heinrich, G. Optimizing Variable-Axial Fiber-Reinforced Composite Laminates: The Direct Fiber Path Optimization Concept. Math. Probl. Eng. 2019, 2019, 8260563. [Google Scholar] [CrossRef]
- Crothers, P.J.; Drechsler, K.; Feltin, D.; Herszberg, I.; Kruckenberg, T. Tailored fibre placement to minimise stress concentrations. Compos. Part Appl. Sci. Manuf. 1997, 28, 619–625. [Google Scholar] [CrossRef]
- Gliesche, K.; Hüber, T.; Orawetz, H. Application of the tailored fibre placement (TFP) process for a local reinforcement on an ‘‘open-hole’’ tension plate from carbon/epoxy laminates. Compos. Sci. Technol. 2003, 63, 81–88. [Google Scholar] [CrossRef]
- Spickenheuer, A.; Schulz, M.; Gliesche, K.; Heinrich, G. Using tailored fibre placement technology for stress adapted design of composite structures. Plast. Rubber Compos. 2008, 37, 227–232. [Google Scholar] [CrossRef]
- Mattheij, P.; Gliesche, K.; Feltin, D. Tailored Fiber Placement-Mechanical Properties and Applications. J. Reinf. Plast. Compos. 1998, 17, 774–786. [Google Scholar] [CrossRef]
- Uhlig, K.; Bittrich, L.; Spickenheuer, A.; Almeida, J.H.S., Jr. Waviness and fiber volume content analysis in continuous carbon fiber reinforced plastics made by Tailored Fiber Placement. Compos. Struct. 2019, 222, 110910. [Google Scholar] [CrossRef]
- Fratta, C.; Klunker, F.; Ermanni, P. A methodology for flow-front estimation in LCM processes based on pressure sensors. Compos. Part 2013, 47, 1–11. [Google Scholar] [CrossRef]
- Pillai, K.M. Modeling the Unsaturated Flow in Liquid Composite Molding Processes: A Review and Some Thoughts. J. Compos. Mater. 2004, 38, 2097–2118. [Google Scholar] [CrossRef]
- Michaud, V. A Review of Non-saturated Resin Flow in Liquid Composite Moulding processes. Transp. Porous Media 2016, 115, 581–601. [Google Scholar] [CrossRef]
- Arbter, R.; Beraud, J.M.; Binetruy, C.; Bizet, L.; Bréard, J.; Comas-Cardona, S.; Demaria, C.; Endruweit, A.; Ermanni, P.; Gommer, F.; et al. Experimental determination of the permeability of textiles: A benchmark exercise. Compos. Part Appl. Sci. Manuf. 2011, 42, 1157–1168. [Google Scholar] [CrossRef]
- Seuffert, J.; Bittrich, L.; Oliveira, L.C.; Spickenheuer, A.; Kärger, L. Micro-Scale Permeability Characterization of Carbon Fiber Composites Using Micrograph Volume Elements. Front. Mater. 2021, 8, 745084. [Google Scholar] [CrossRef]
- Hancioglu, M.; Sozer, E.M.; Advani, S.G. Comparison of in-plane resin transfer molding and vacuum-assisted resin transfer molding ‘effective’ permeabilities based on mold filling experiments and simulations. J. Reinf. Plast. Compos. 2019, 39, 31–44. [Google Scholar] [CrossRef]
- Binétruy, C.; Hilaire, B.; Pabiot, J. The interactions between flows occurring inside and outside fabric tows during RTM. Compos. Sci. Technol. 1997, 57, 587–597. [Google Scholar] [CrossRef]
- Carlone, P.; Rubino, F.; Paradiso, V.; Tucci, F. Multi-scale modeling and online monitoring of resin flow through dual-scale textiles in liquid composite molding processes. Int. J. Adv. Manuf. Technol. 2018, 96, 2215–2230. [Google Scholar] [CrossRef]
- Darcy, H. Les Fontaines Publiques de la Ville de Dijon; Victor Dalmont: Paris, France, 1856. [Google Scholar]
- Rubino, F.; Tucci, F.; Esperto, V.; Carlone, P. Filling Time Reduction in Liquid Composite Molding Processes. J. Compos. Sci. 2022, 6, 222. [Google Scholar] [CrossRef]
- Kuentzer, N.; Simacek, P.; Advani, S.G.; Walsh, S. Permeability characterization of dual scale fibrous porous media. Compos. Part Appl. Sci. Manuf. 2006, 37, 2057–2068. [Google Scholar] [CrossRef]
- Rubino, F.; Carlone, P. A Semi-Analytical Model to Predict Infusion Time and Reinforcement Thickness in VARTM and SCRIMP Processes. Polymers 2019, 11, 20. [Google Scholar] [CrossRef] [Green Version]
- Rimmel, O.; May, D.; Mitschang, P. Impact of Stitching on Permeability and Mechanical Properties of Preforms Manufactured by Dry Fiber Placement. Polym. Compos. 2019, 40, 1631–1642. [Google Scholar] [CrossRef]
- R&G Faserverbundwerkstoffe GmbH. Technical Data Epoxy Resin L20—Hardener EPH161; R&G Faserverbundwerkstoffe GmbH: Waldenbuch, Germany, 2022. [Google Scholar]
- Bradski, G. The OpenCV Library. Dr. Dobb’s J. Softw. Tools 2000, 120, 122–125. [Google Scholar]


| Experiment Number | Stitching Type | Direction of Flow | Cavity | Distance (mm) | R-Value (mm) | Stitch dmin (mm) | Vf (%) |
|---|---|---|---|---|---|---|---|
| 01 | symm. | Fiber | 1 | 1.10 | 2.00 | 2.00 | 50 |
| asymm. | Fiber | 2 | 1.10 | 2.00 | 2.00 | 50 | |
| 02 | symm. | Perpendicular | 1 | 1.10 | 2.00 | 2.00 | 50 |
| asymm. | Perpendicular | 2 | 1.10 | 2.00 | 2.00 | 50 | |
| 03 | symm. | Fiber | 1 | 1.10 | 1.60 | 2.00 | 50 |
| asymm. | Fiber | 2 | 1.10 | 1.60 | 2.00 | 50 | |
| 04 | symm. | Perpendicular | 1 | 1.10 | 1.60 | 2.00 | 50 |
| asymm. | Perpendicular | 2 | 1.10 | 1.60 | 2.00 | 50 | |
| 05 | symm. | Fiber | 2 | 1.10 | 2.00 | 4.00 | 50 |
| asymm. | Fiber | 1 | 1.10 | 2.00 | 4.00 | 50 | |
| 06 | symm. | Perpendicular | 1 | 1.10 | 2.00 | 4.00 | 50 |
| asymm. | Perpendicular | 2 | 1.10 | 2.00 | 4.00 | 50 | |
| 07 | symm. | Fiber | 1 | 1.00 | 1.80 | 2.00 | 55 |
| asymm. | Fiber | 2 | 1.00 | 1.80 | 2.00 | 55 | |
| 08 | symm. | Perpendicular | 1 | 1.00 | 1.80 | 2.00 | 55 |
| asymm. | Perpendicular | 2 | 1.00 | 1.80 | 2.00 | 55 |
Publisher’s Note: MDPI stays neutral with regard to jurisdictional claims in published maps and institutional affiliations. |
© 2022 by the authors. Licensee MDPI, Basel, Switzerland. This article is an open access article distributed under the terms and conditions of the Creative Commons Attribution (CC BY) license (https://creativecommons.org/licenses/by/4.0/).
Share and Cite
Bittrich, L.; Seuffert, J.; Dietrich, S.; Uhlig, K.; Lisboa, T.d.V.; Kärger, L.; Spickenheuer, A. On the Resin Transfer Molding (RTM) Infiltration of Fiber-Reinforced Composites Made by Tailored Fiber Placement. Polymers 2022, 14, 4873. https://0-doi-org.brum.beds.ac.uk/10.3390/polym14224873
Bittrich L, Seuffert J, Dietrich S, Uhlig K, Lisboa TdV, Kärger L, Spickenheuer A. On the Resin Transfer Molding (RTM) Infiltration of Fiber-Reinforced Composites Made by Tailored Fiber Placement. Polymers. 2022; 14(22):4873. https://0-doi-org.brum.beds.ac.uk/10.3390/polym14224873
Chicago/Turabian StyleBittrich, Lars, Julian Seuffert, Sarah Dietrich, Kai Uhlig, Tales de Vargas Lisboa, Luise Kärger, and Axel Spickenheuer. 2022. "On the Resin Transfer Molding (RTM) Infiltration of Fiber-Reinforced Composites Made by Tailored Fiber Placement" Polymers 14, no. 22: 4873. https://0-doi-org.brum.beds.ac.uk/10.3390/polym14224873