
Integrating Taguchi Method and Gray Relational Analysis for Auto Locks by Using Multiobjective Design in Computer-Aided Engineering


Abstract
:1. Introduction
2. Experimental
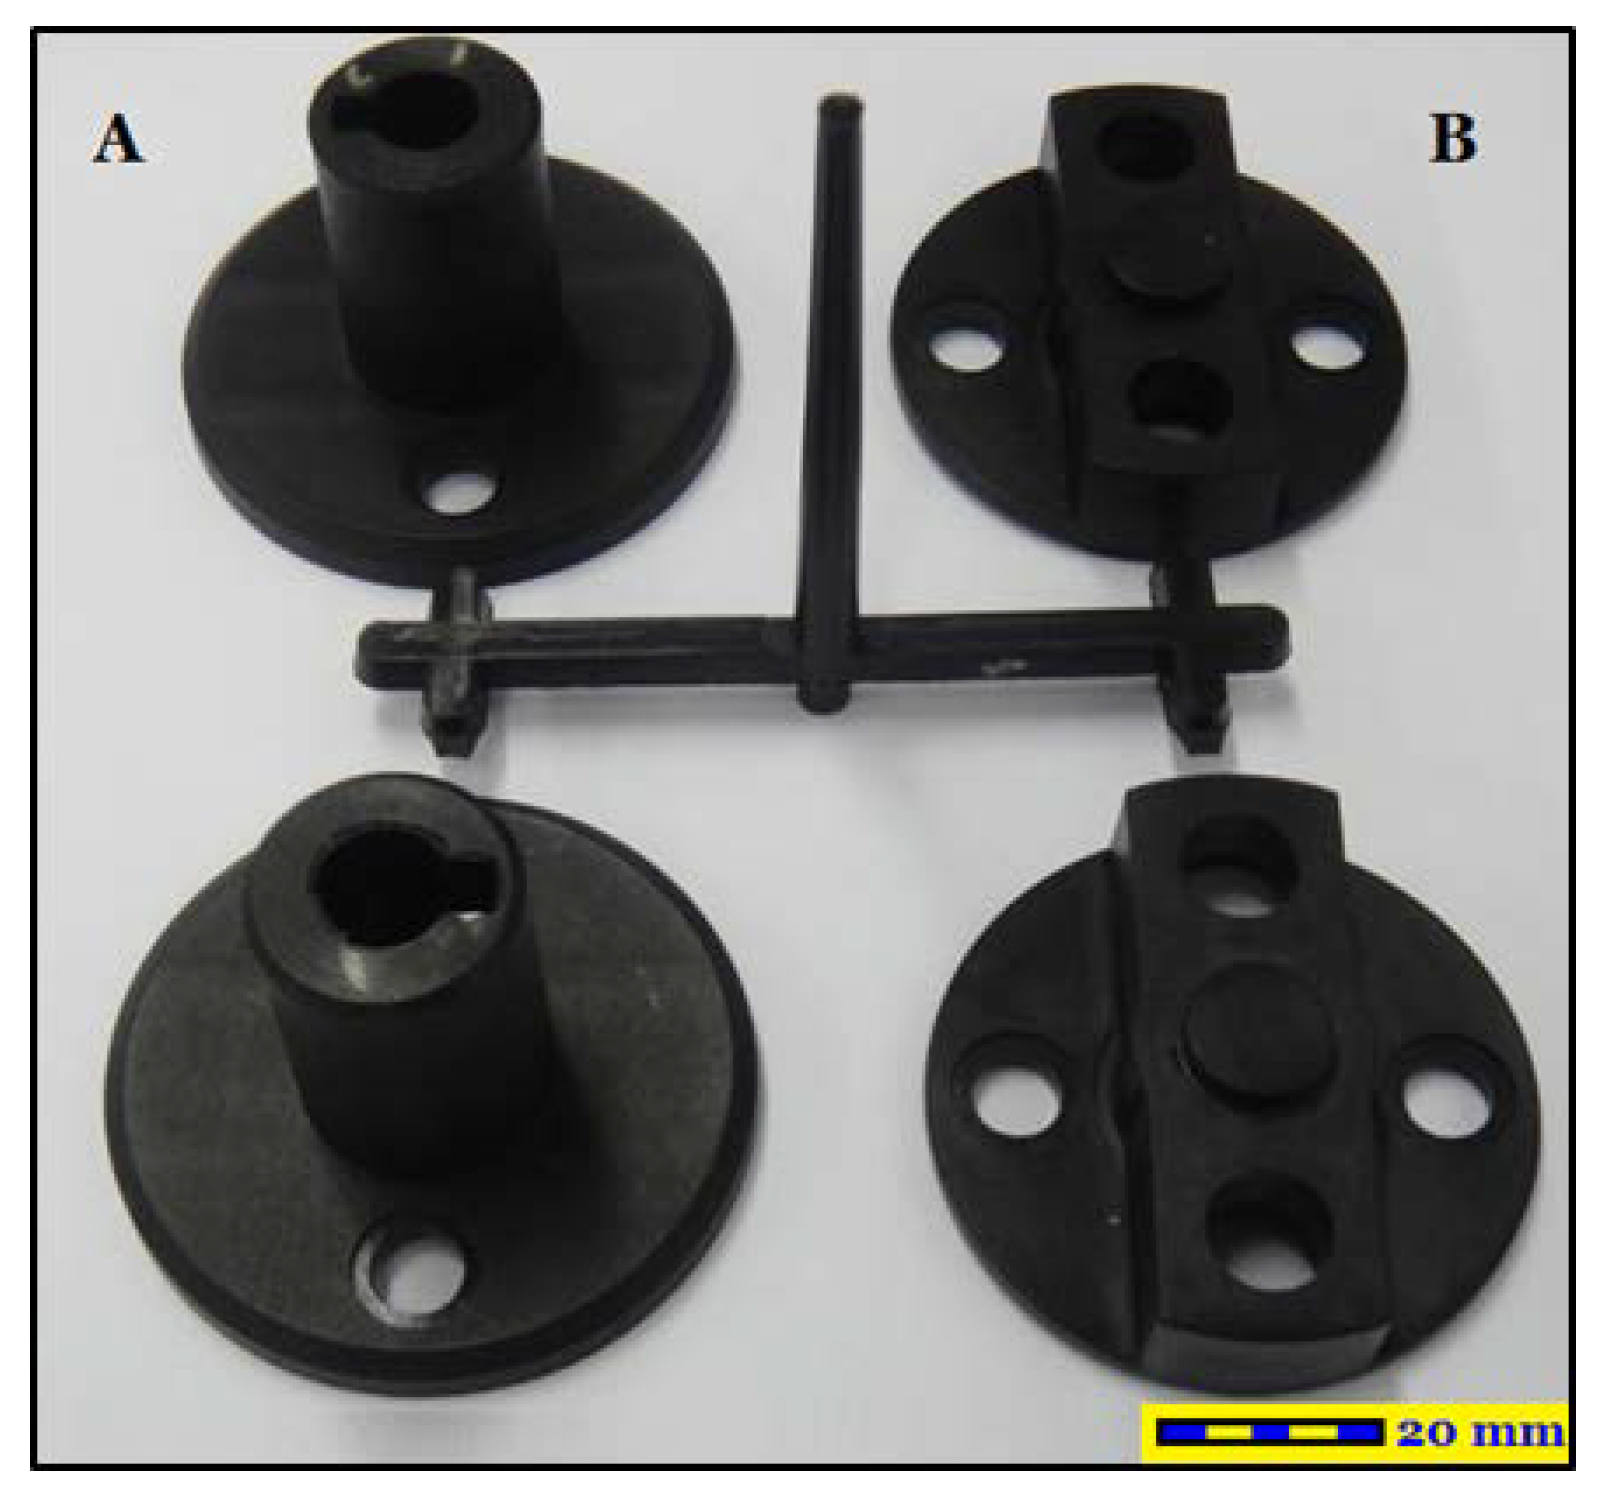
2.1. Construction of Auto Lock Spare Parts
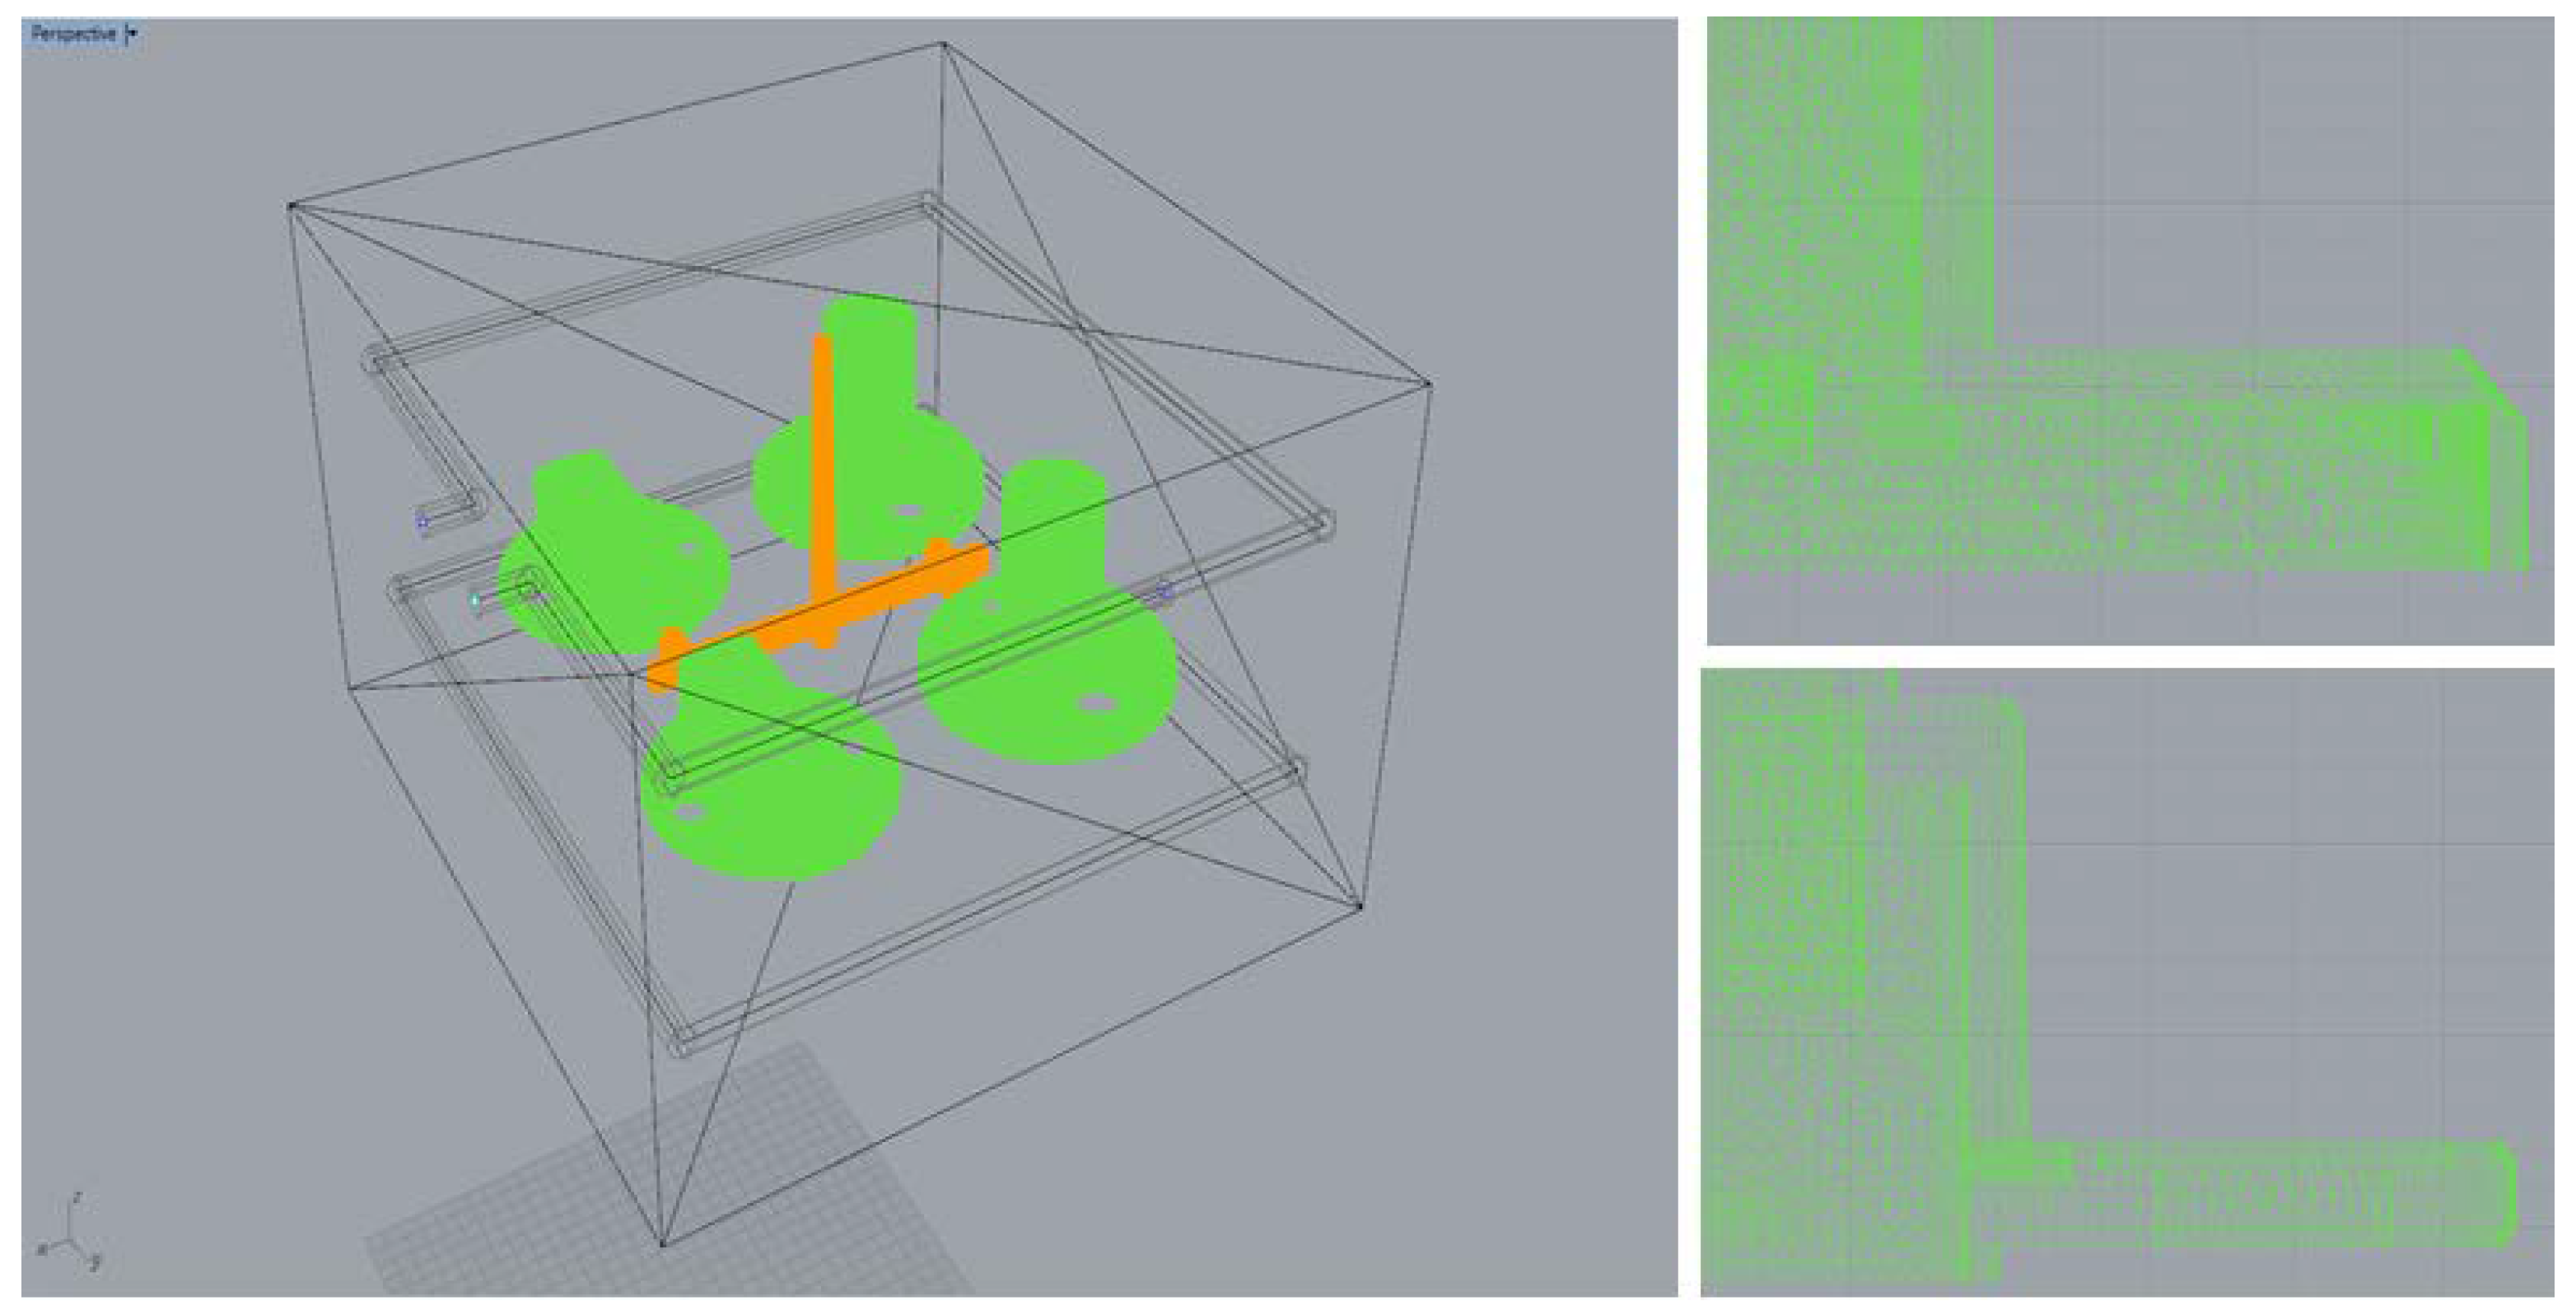
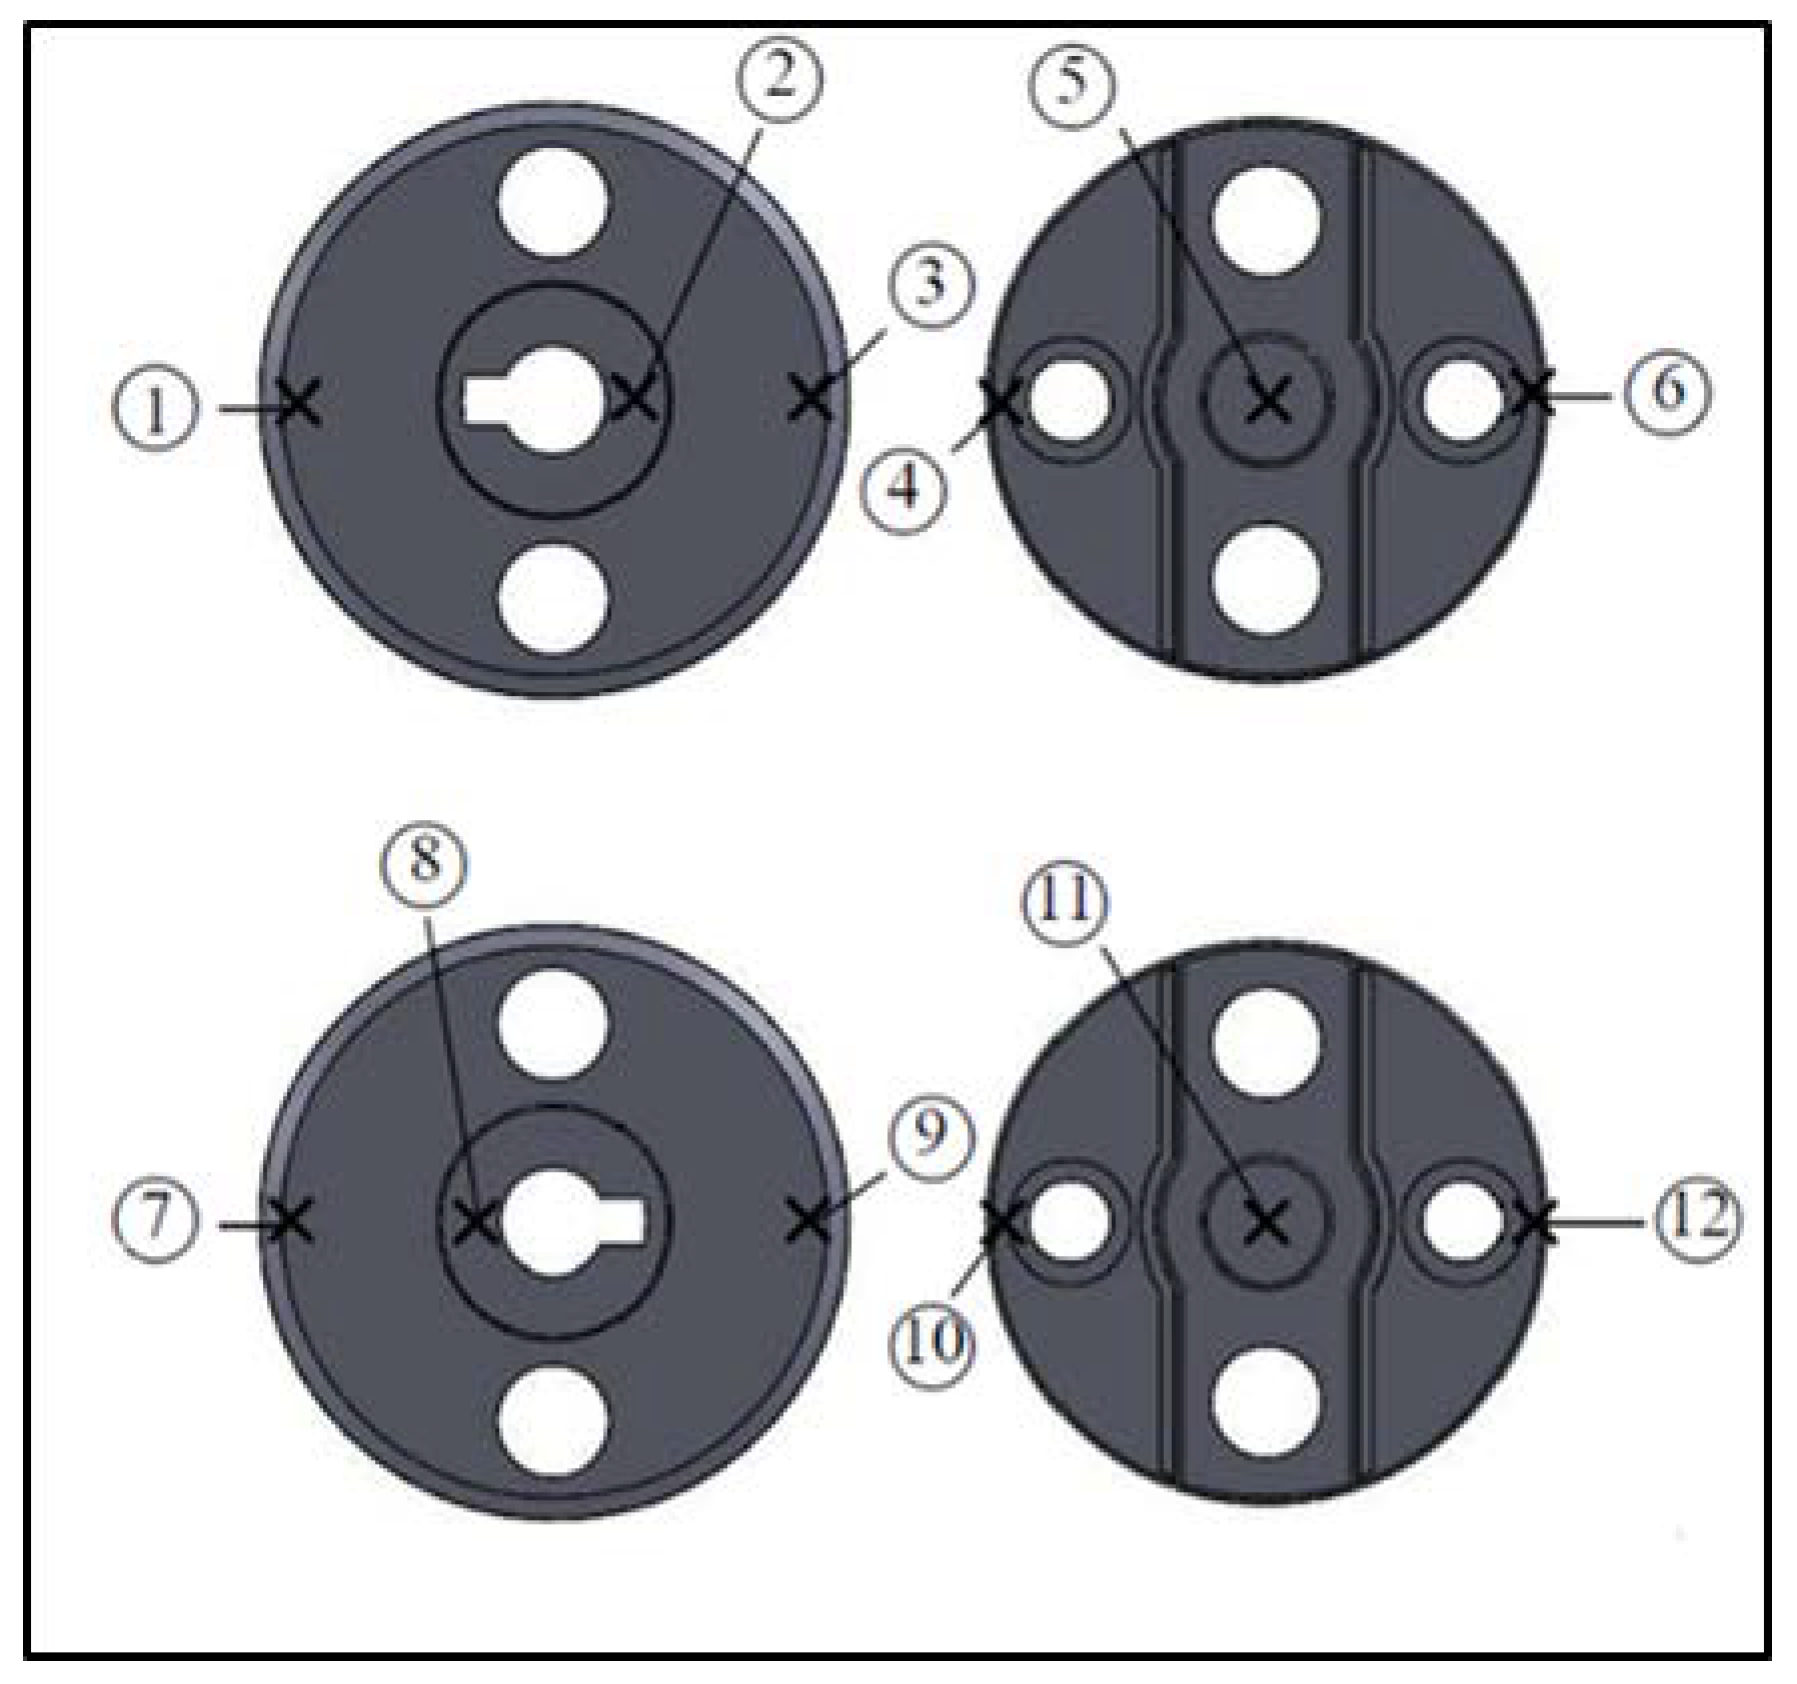
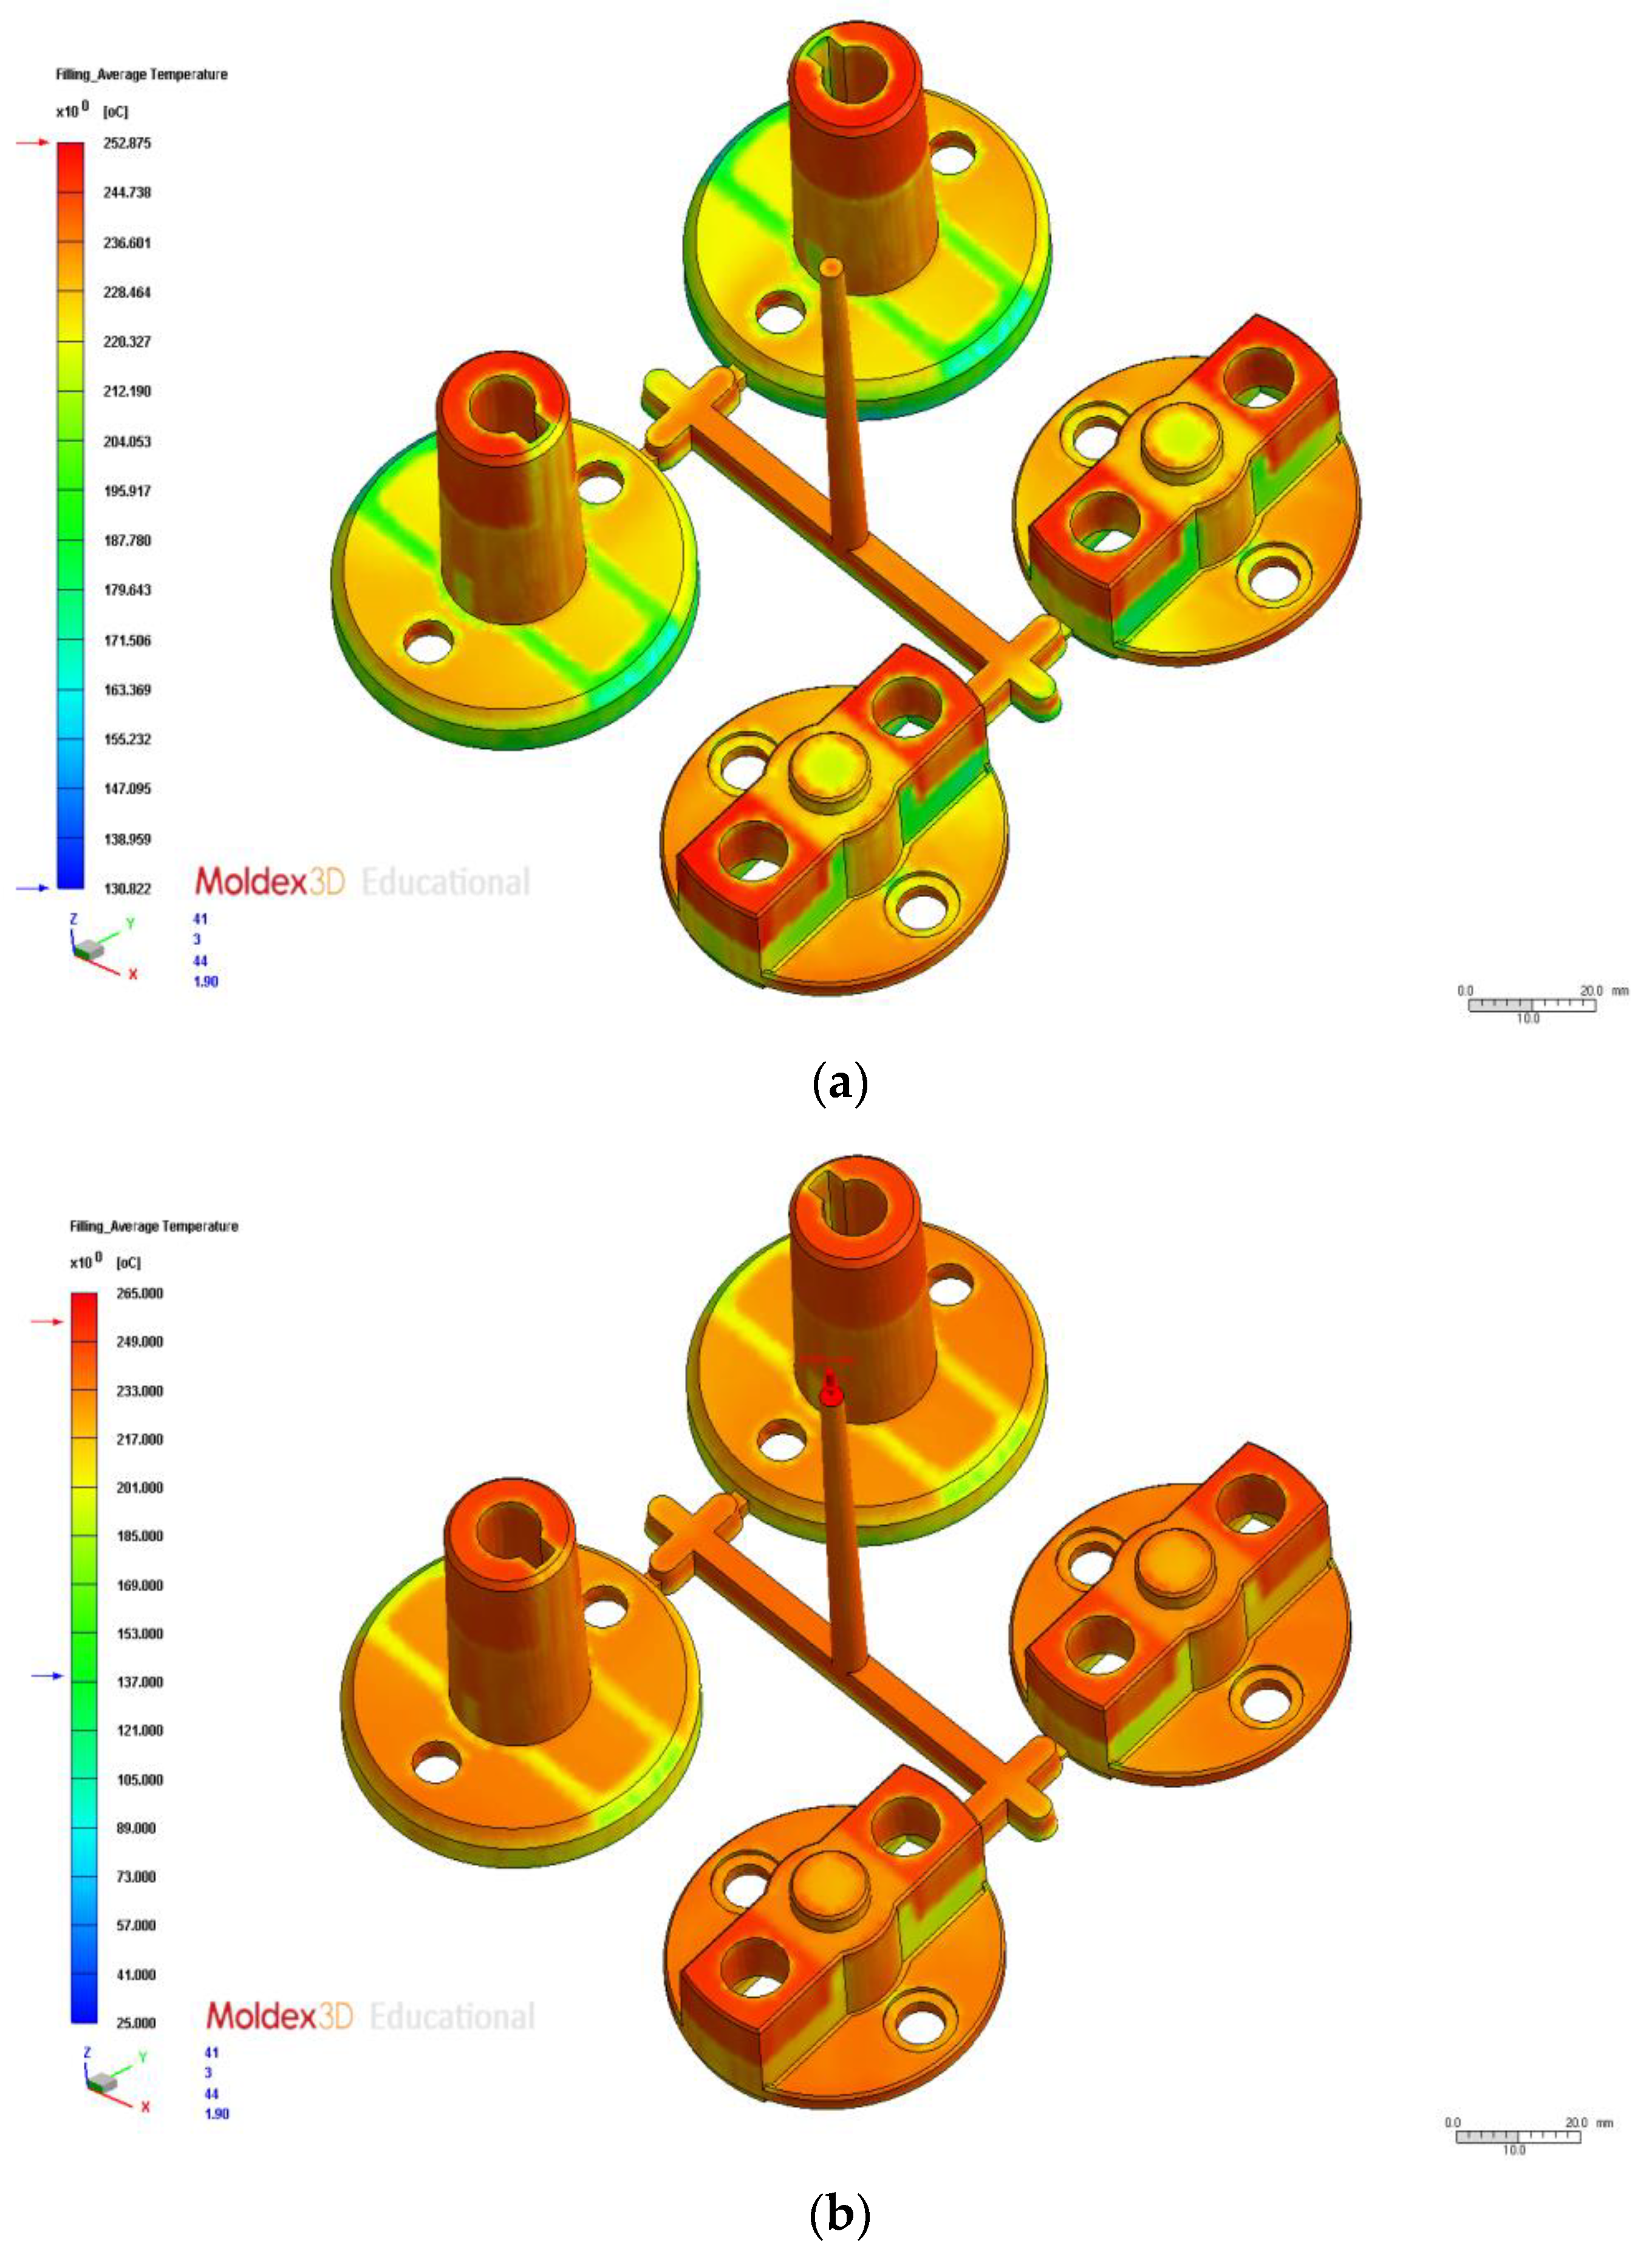
2.2. Simulation and Analysis of Original Process Parameters and Comparison of Plastic Products
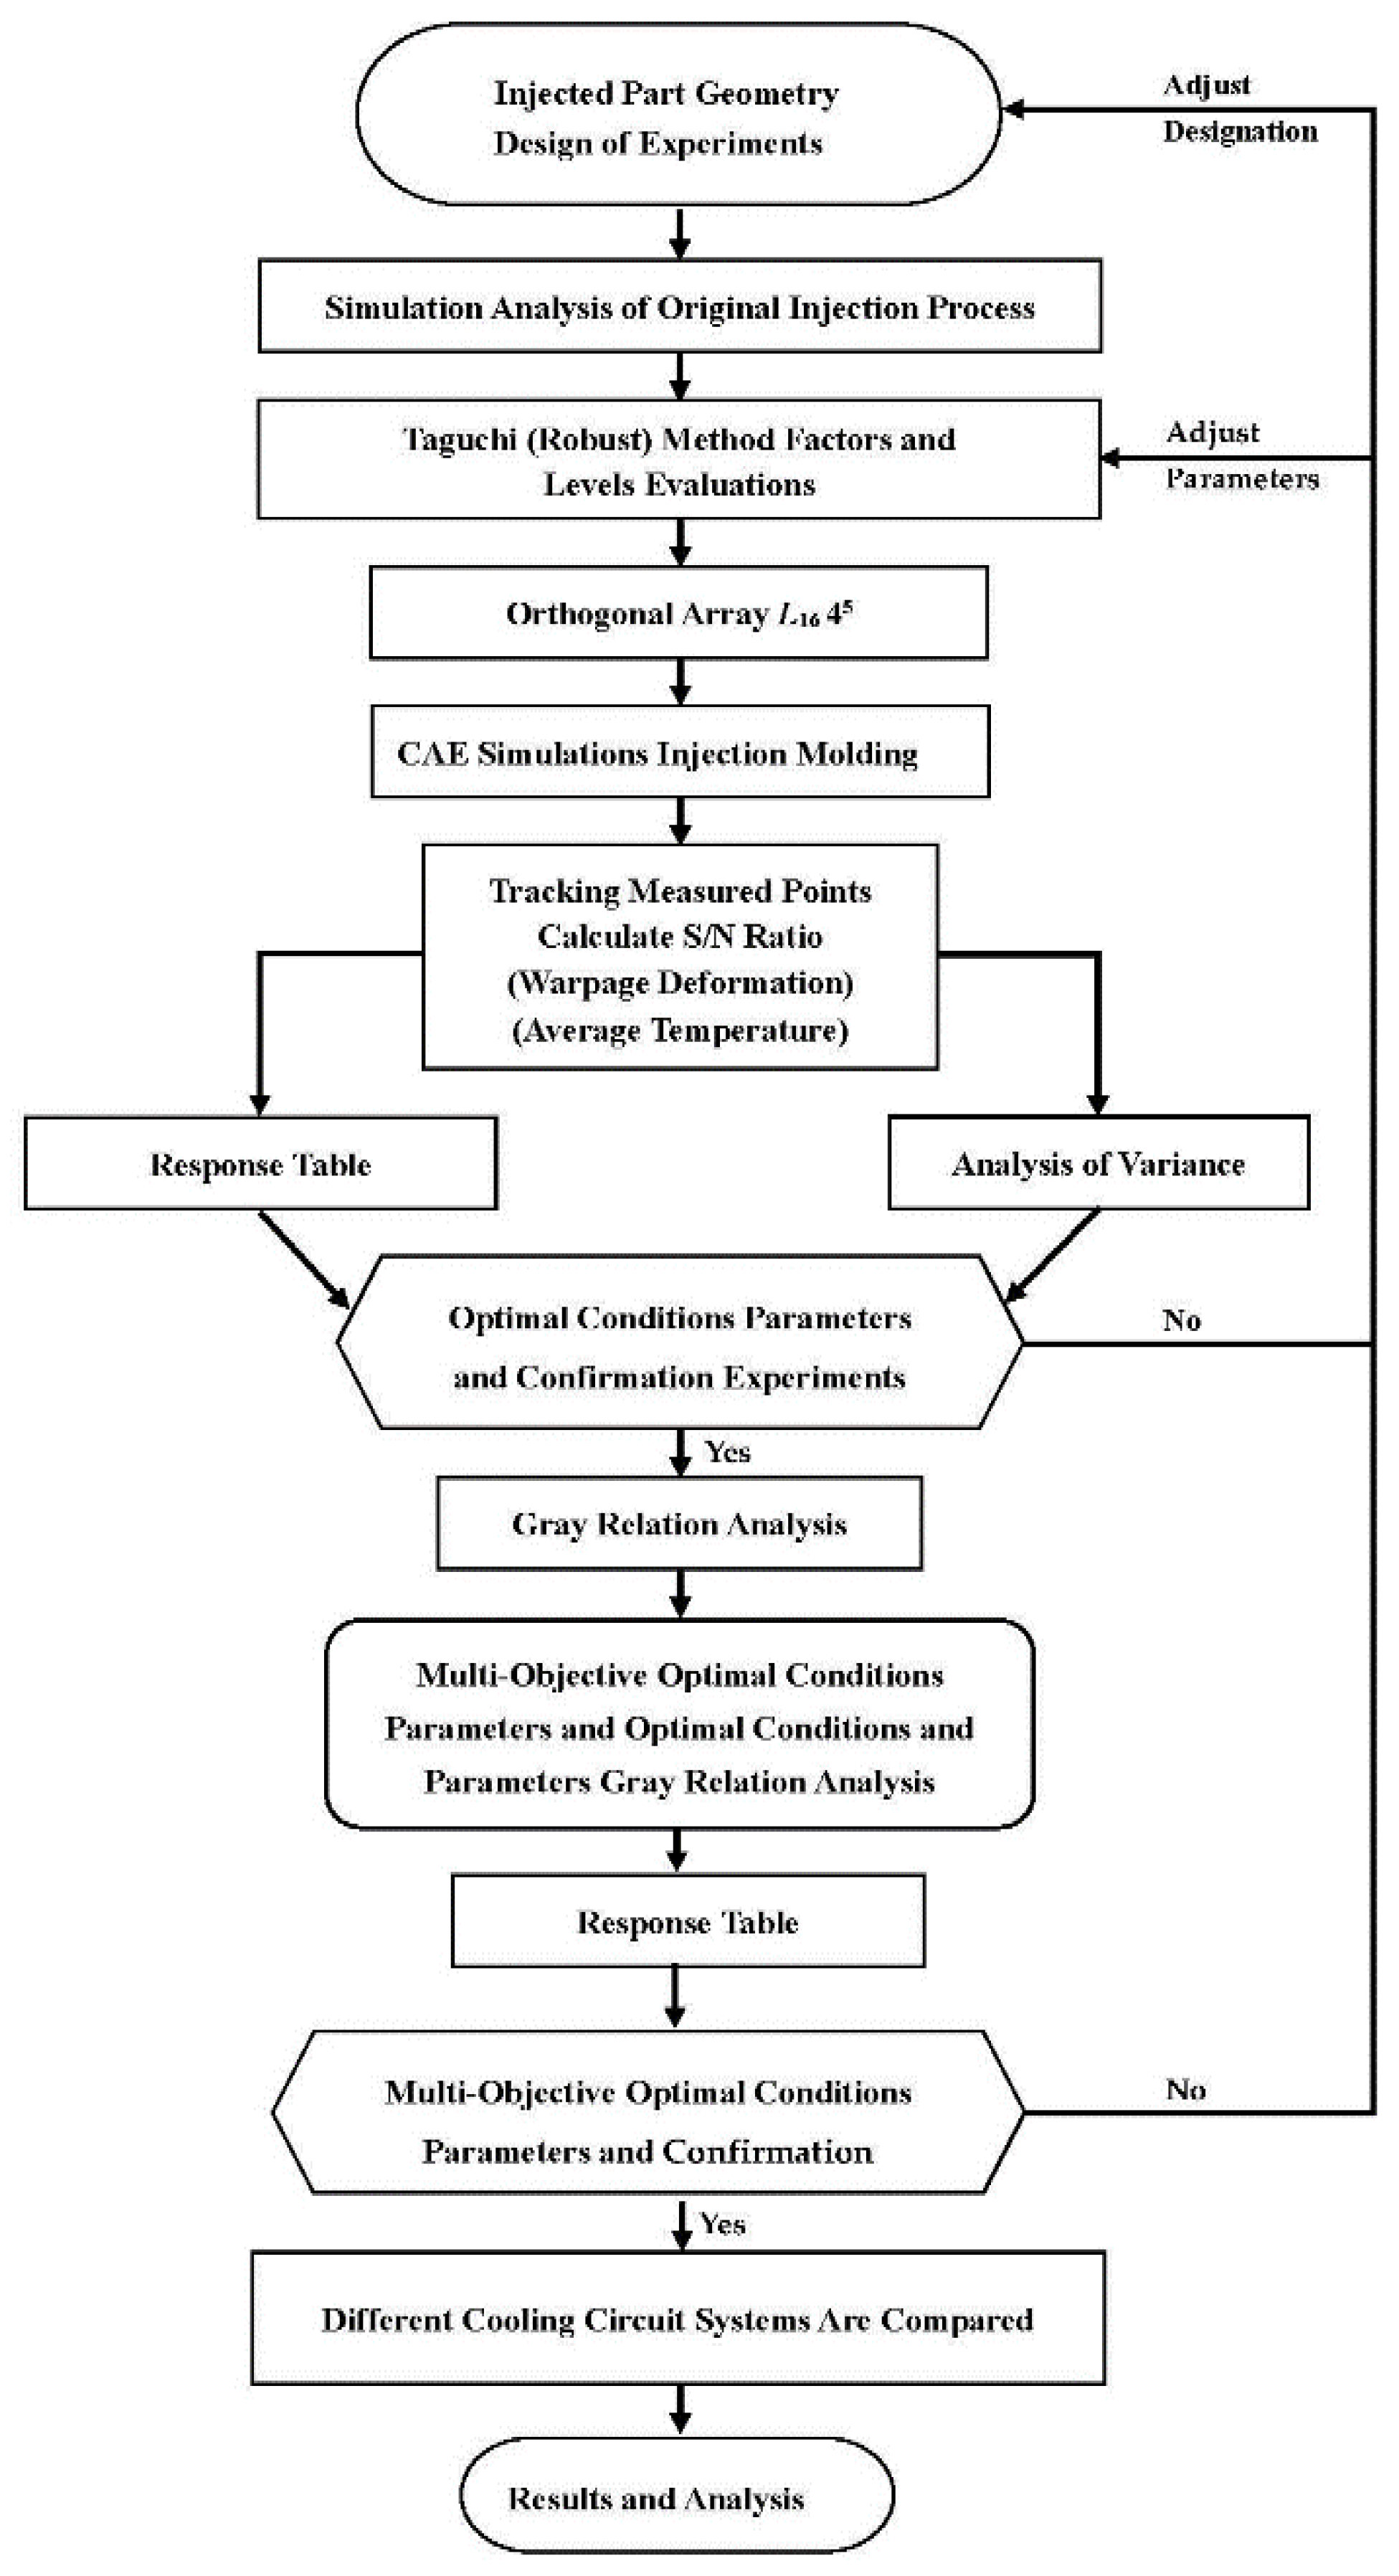
2.3. Taguchi Robust Design Process and Gray Relational Analysis
2.4. Taguchi Robust Design Process
2.5. Taguchi Gray Relational Analysis Method
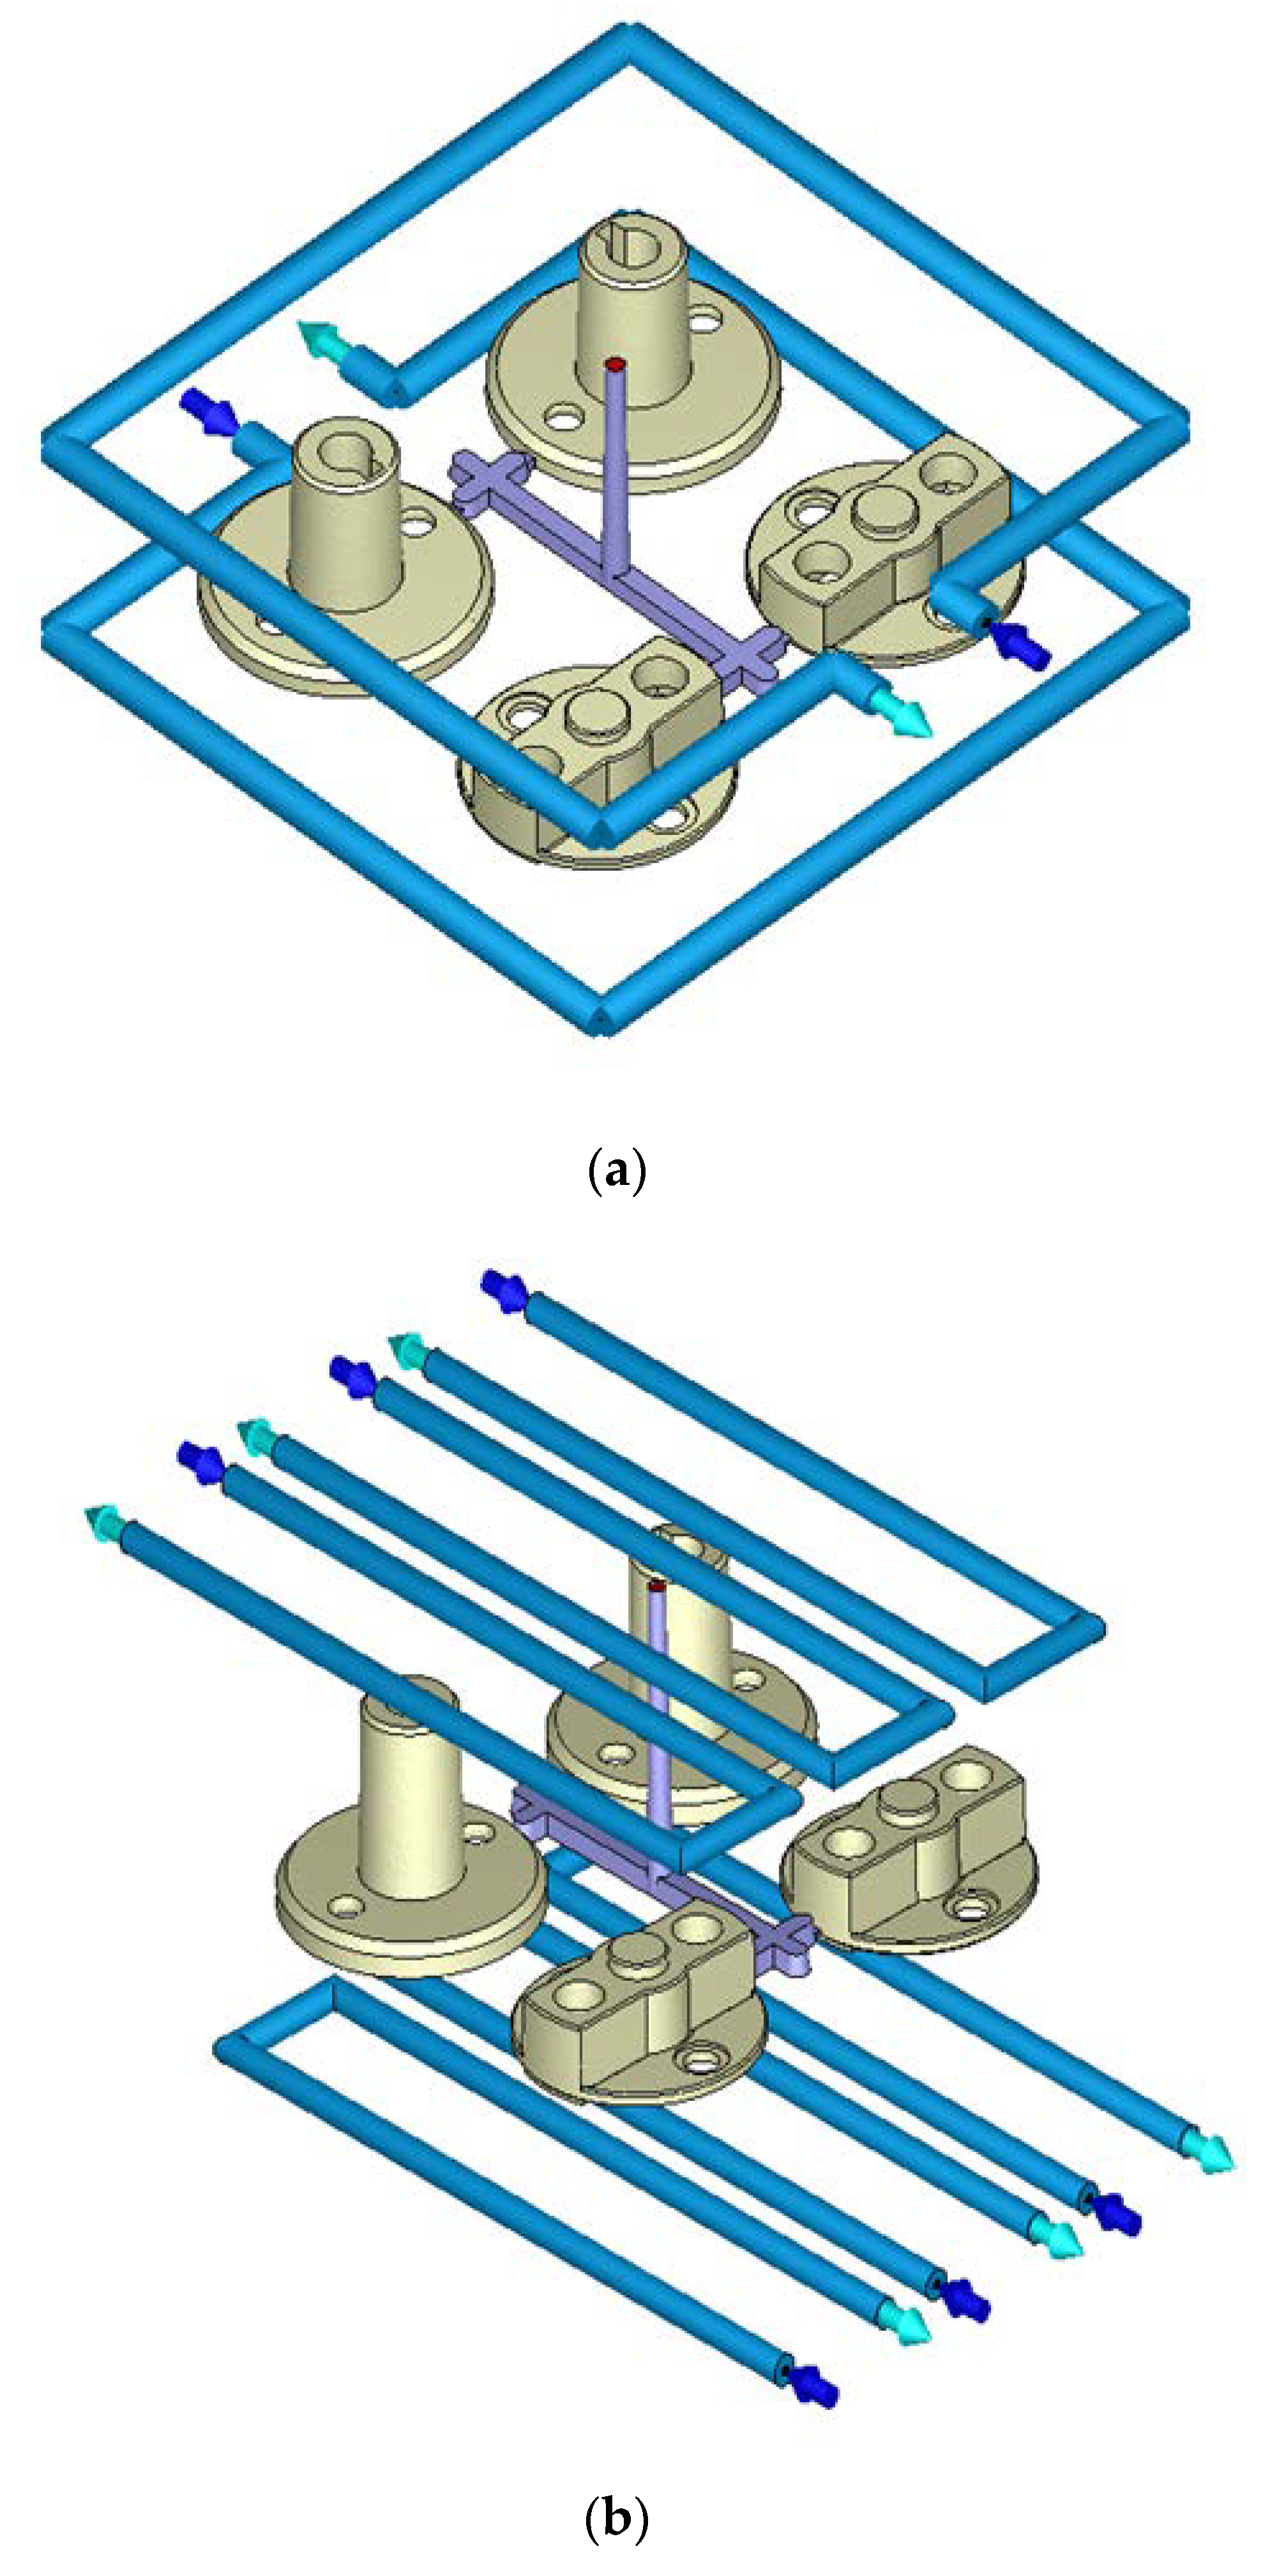
2.6. Comparison and Analysis of Different Cooling Channel Systems
3. Experimental Results
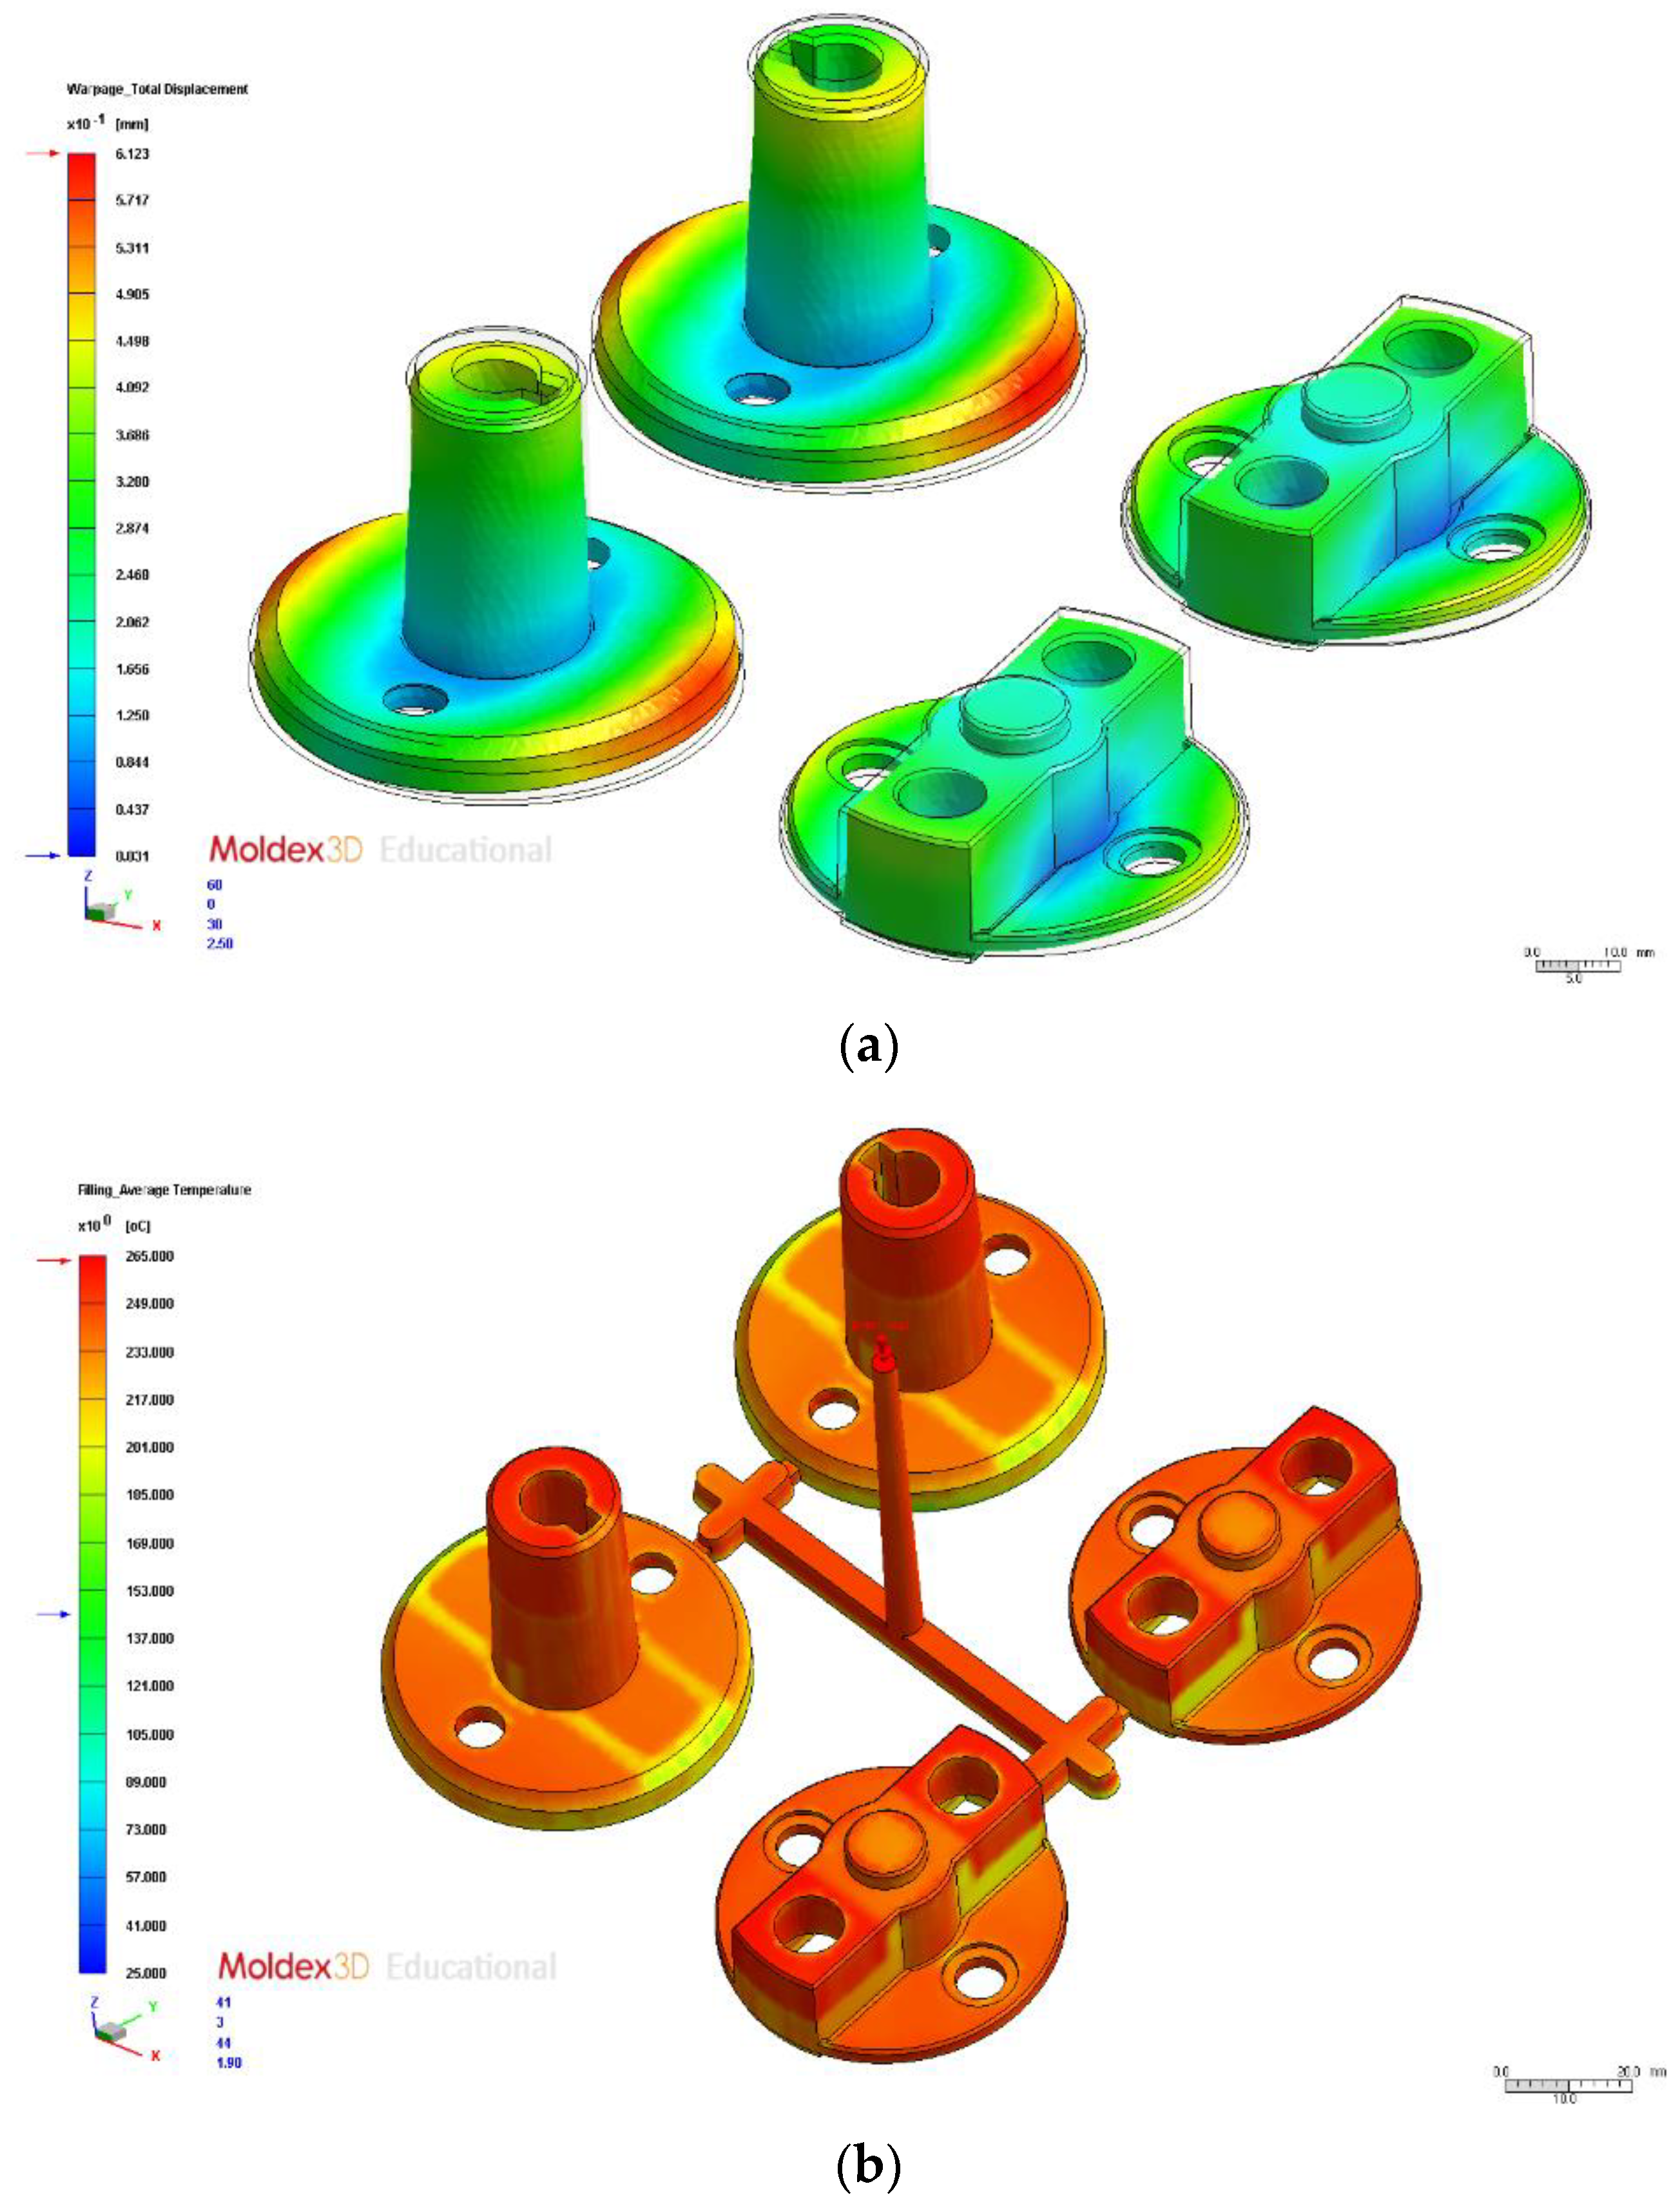
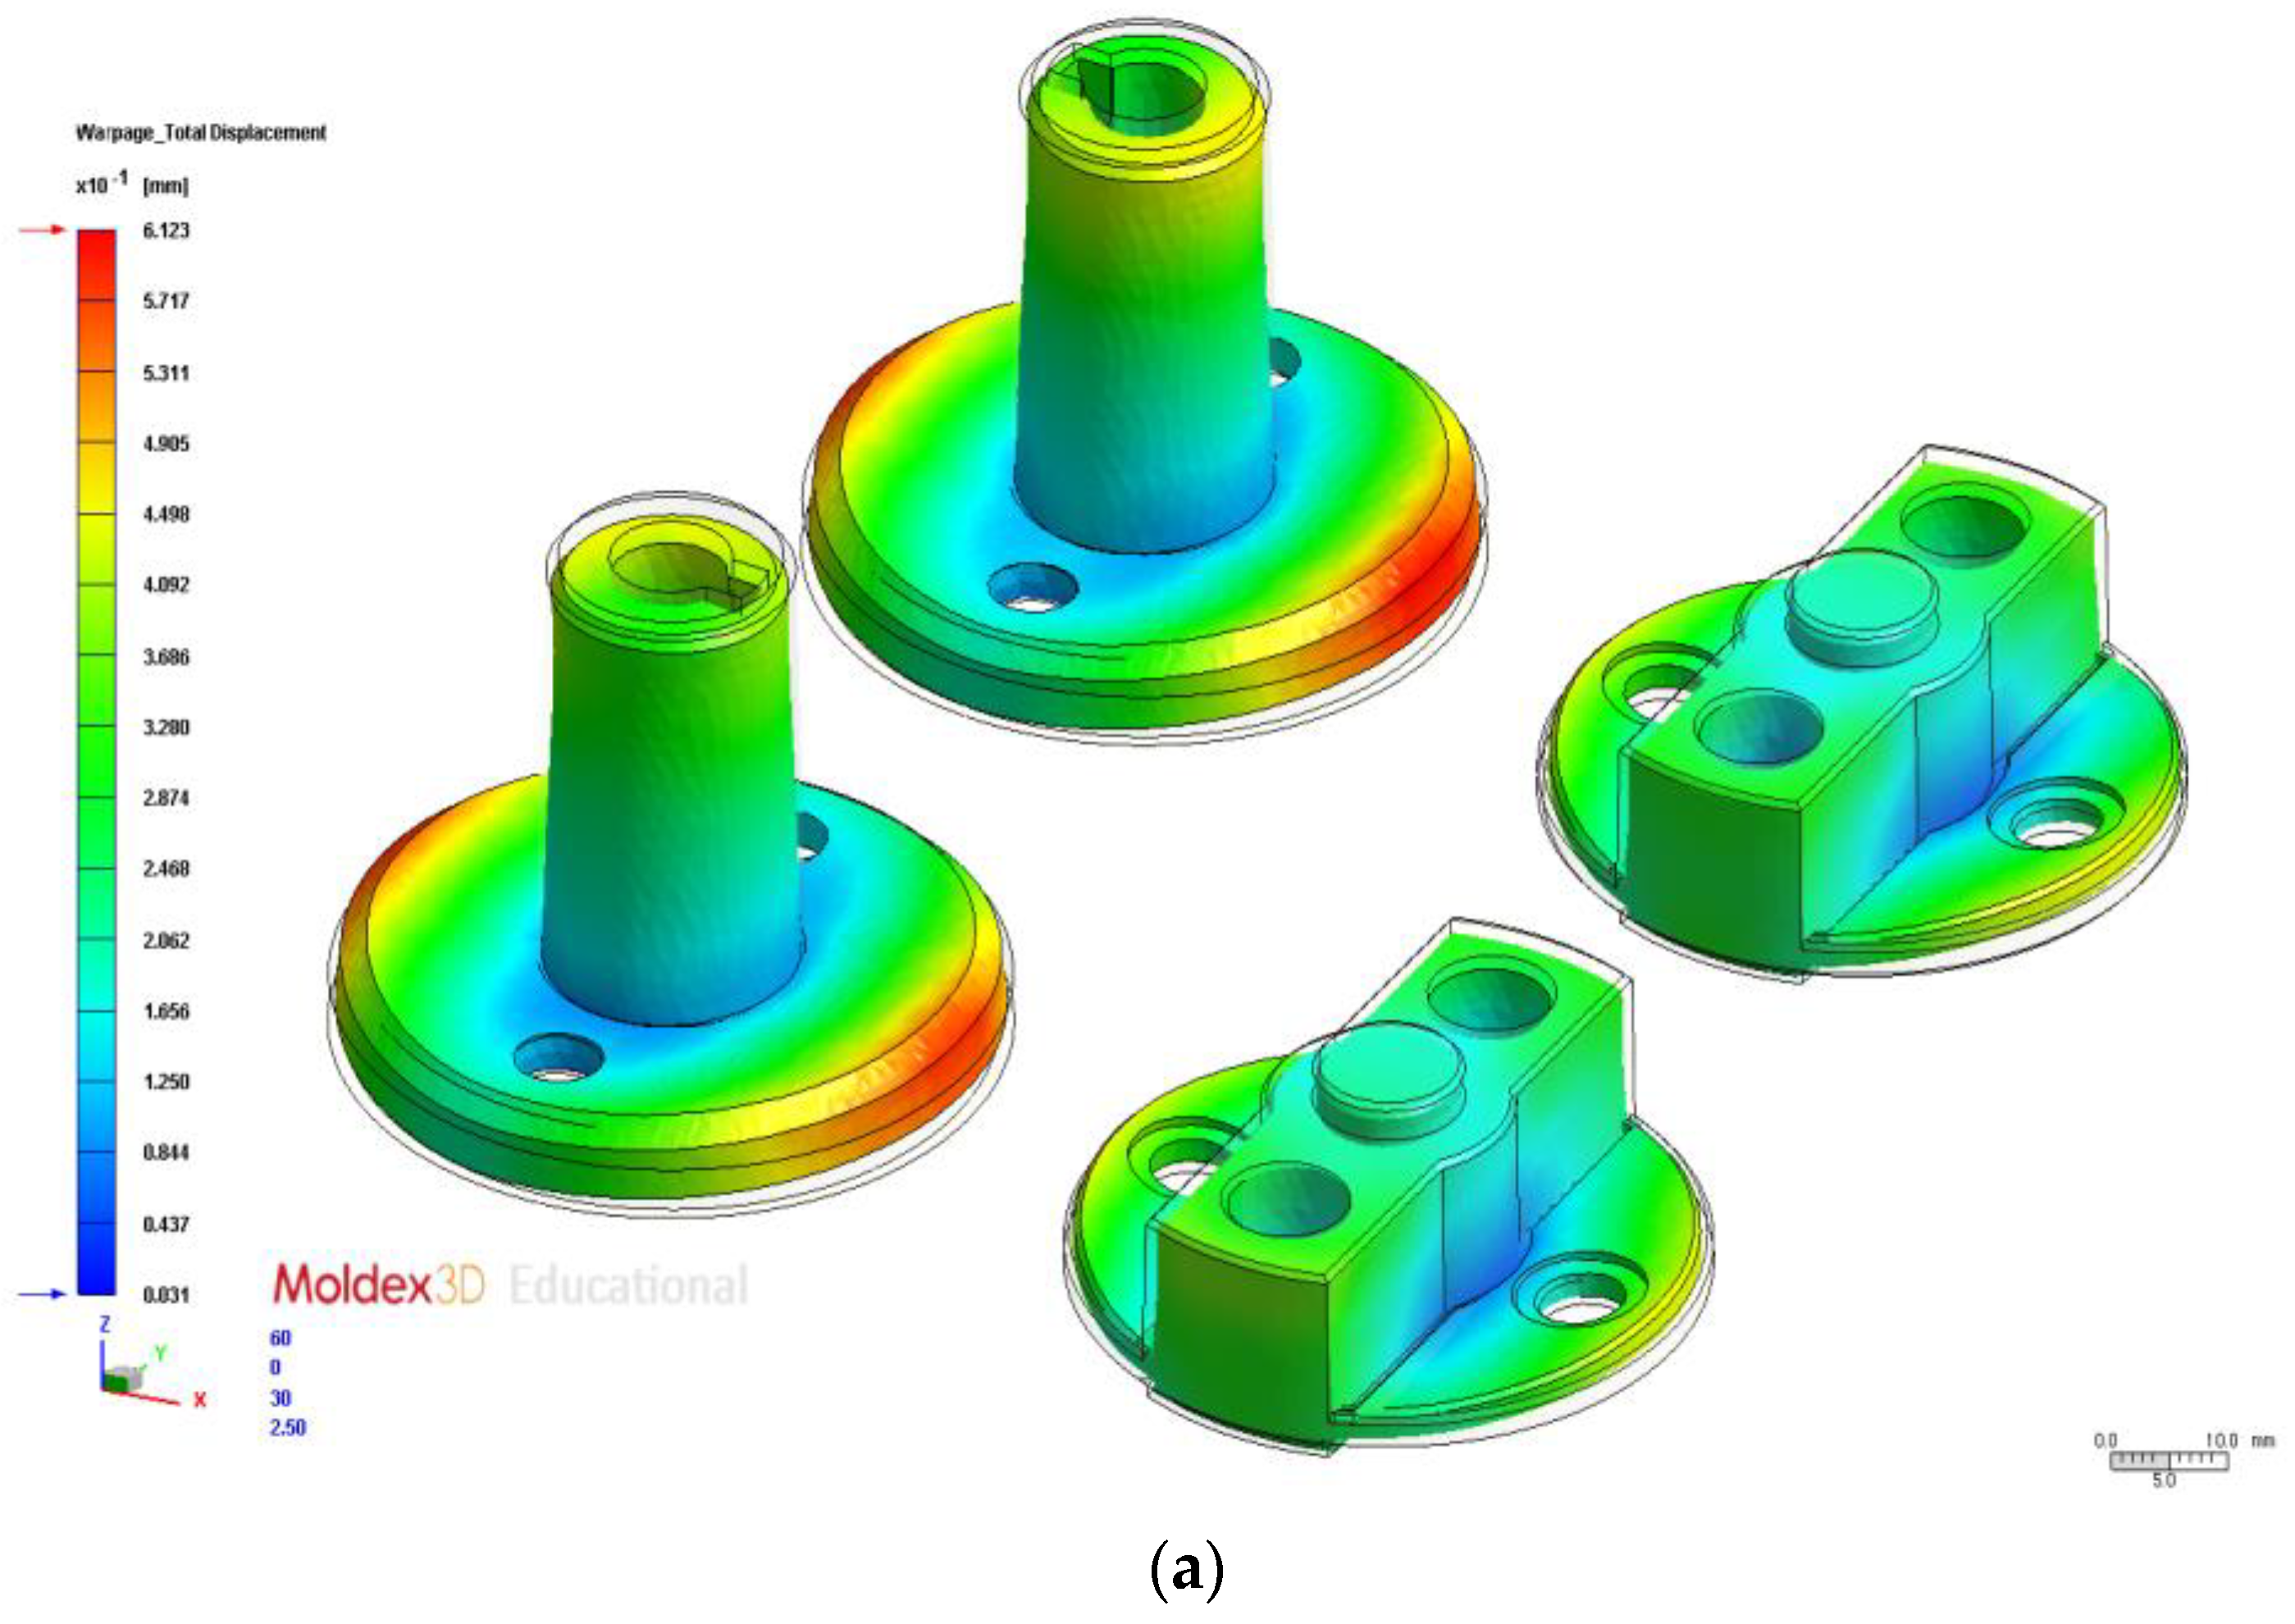
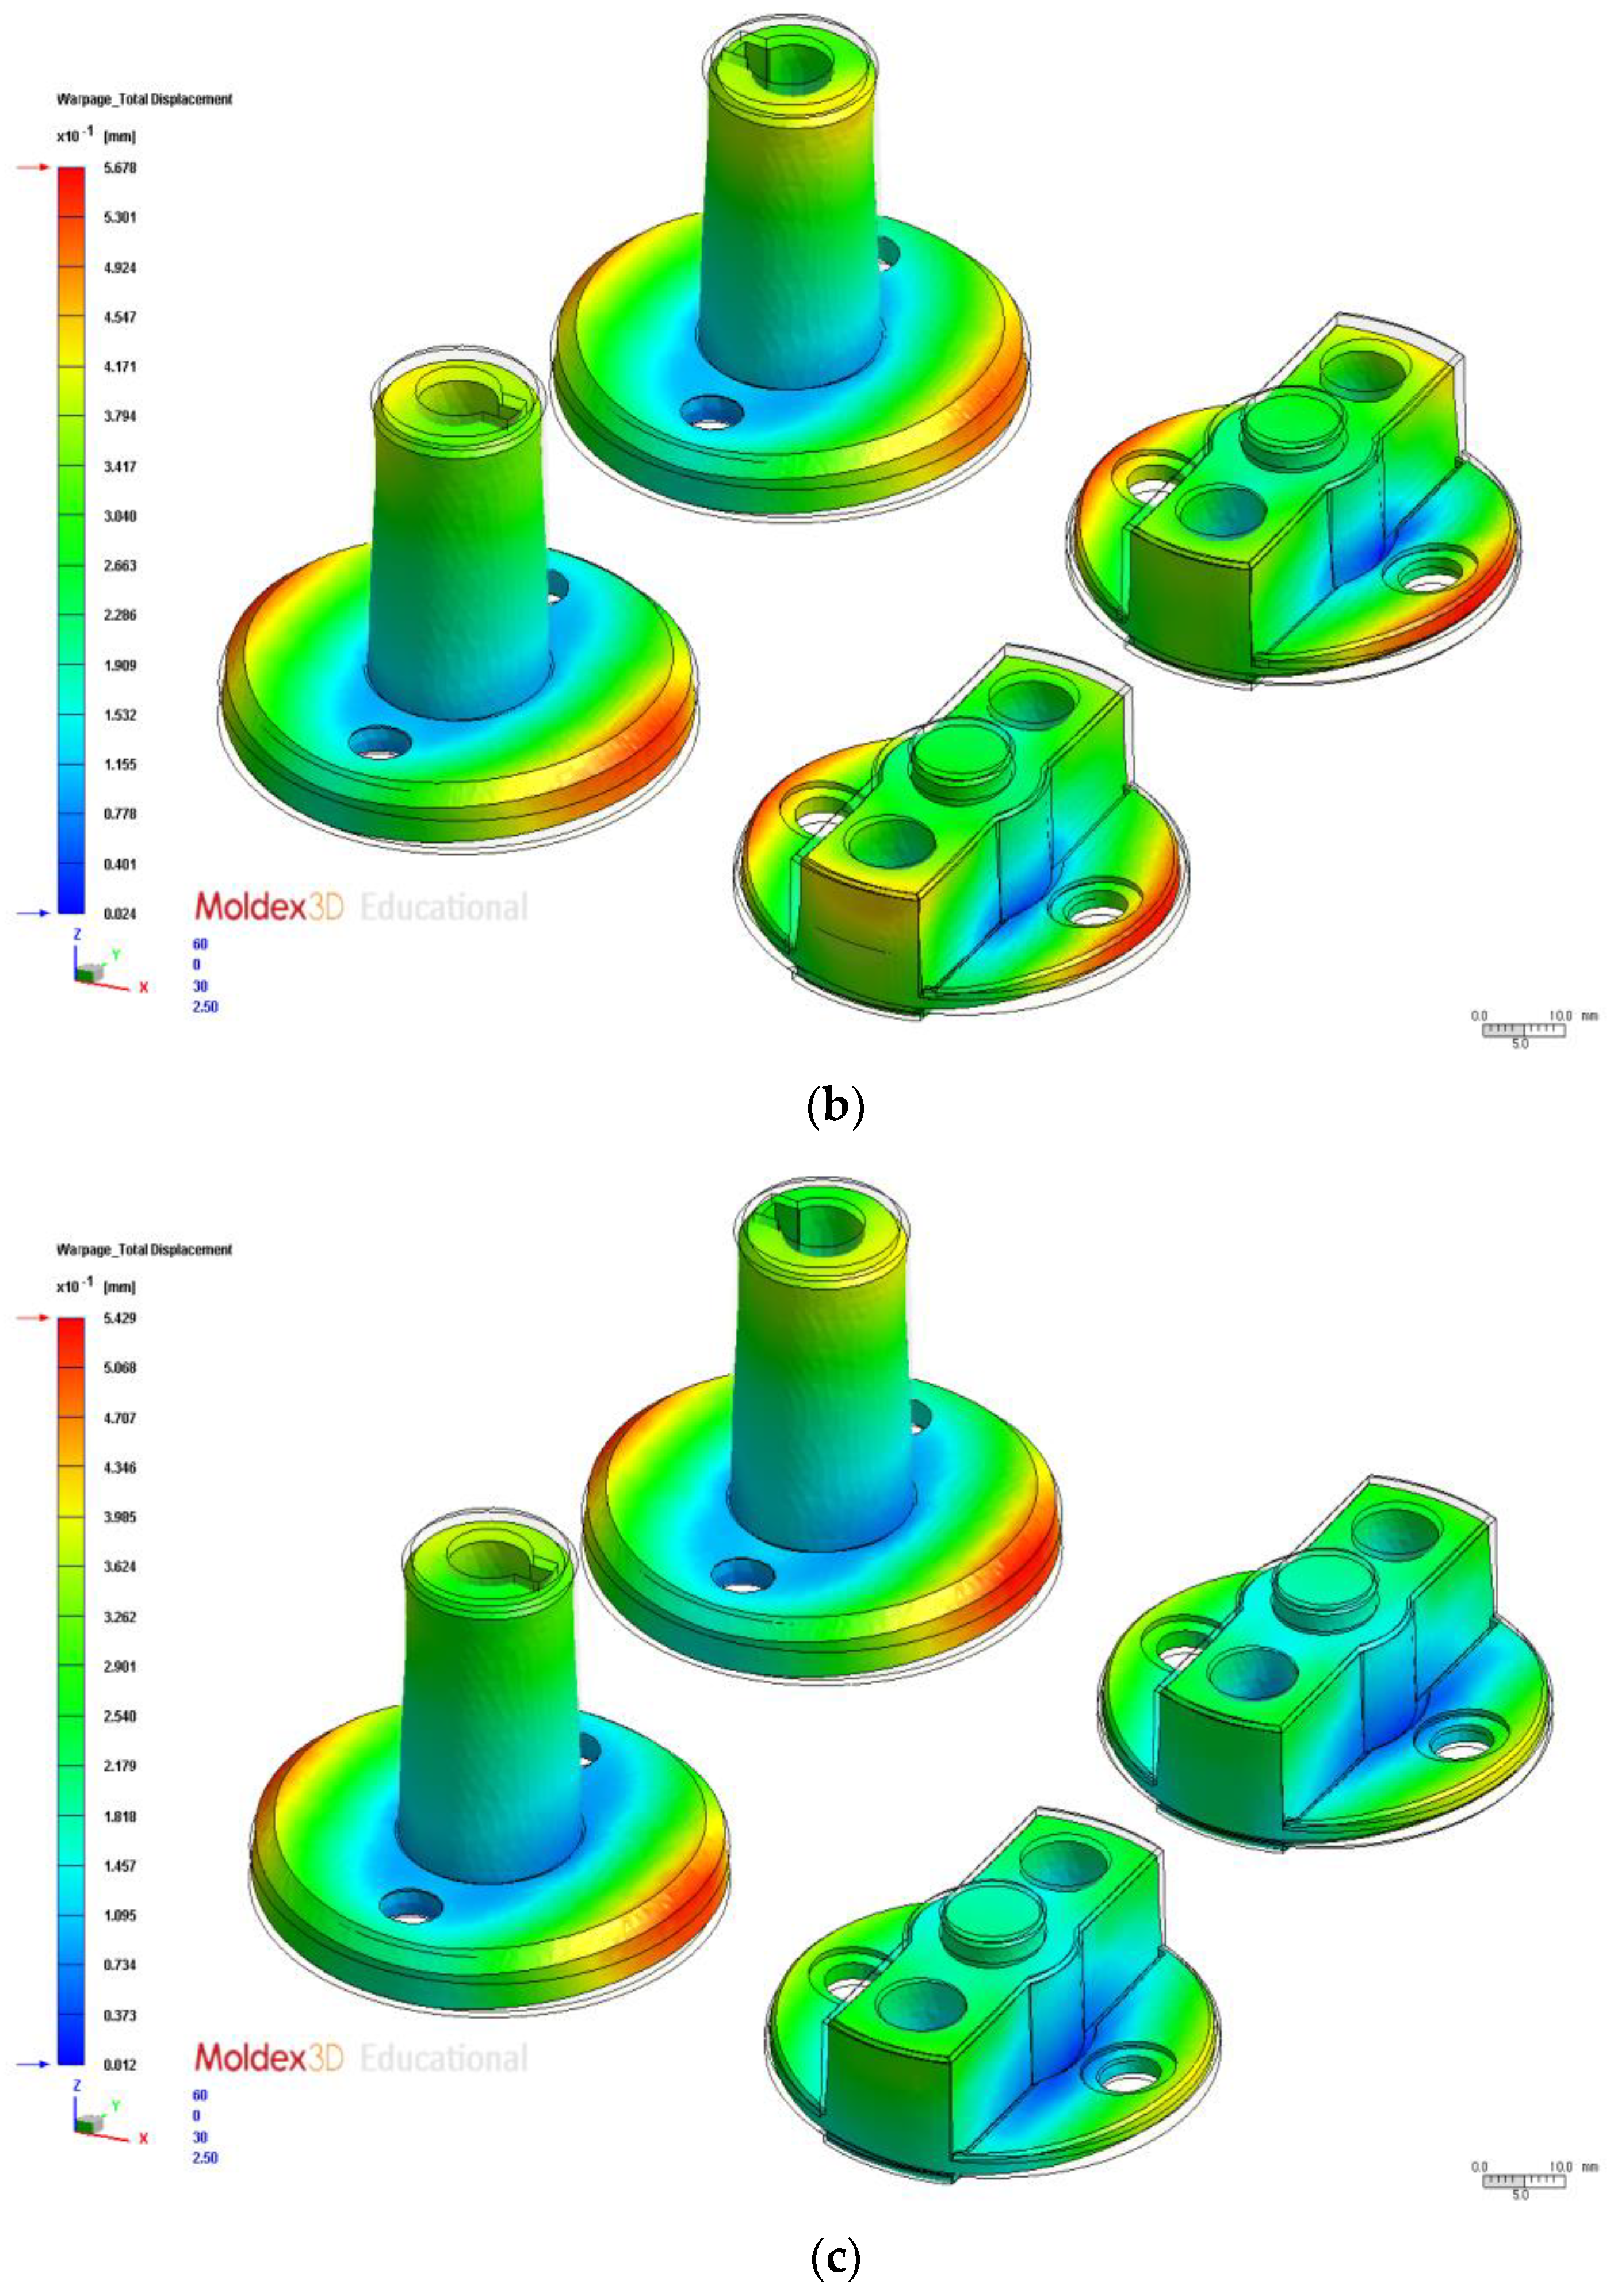
3.1. Optimal Process Parameters for Total Warpage Deformation Volume
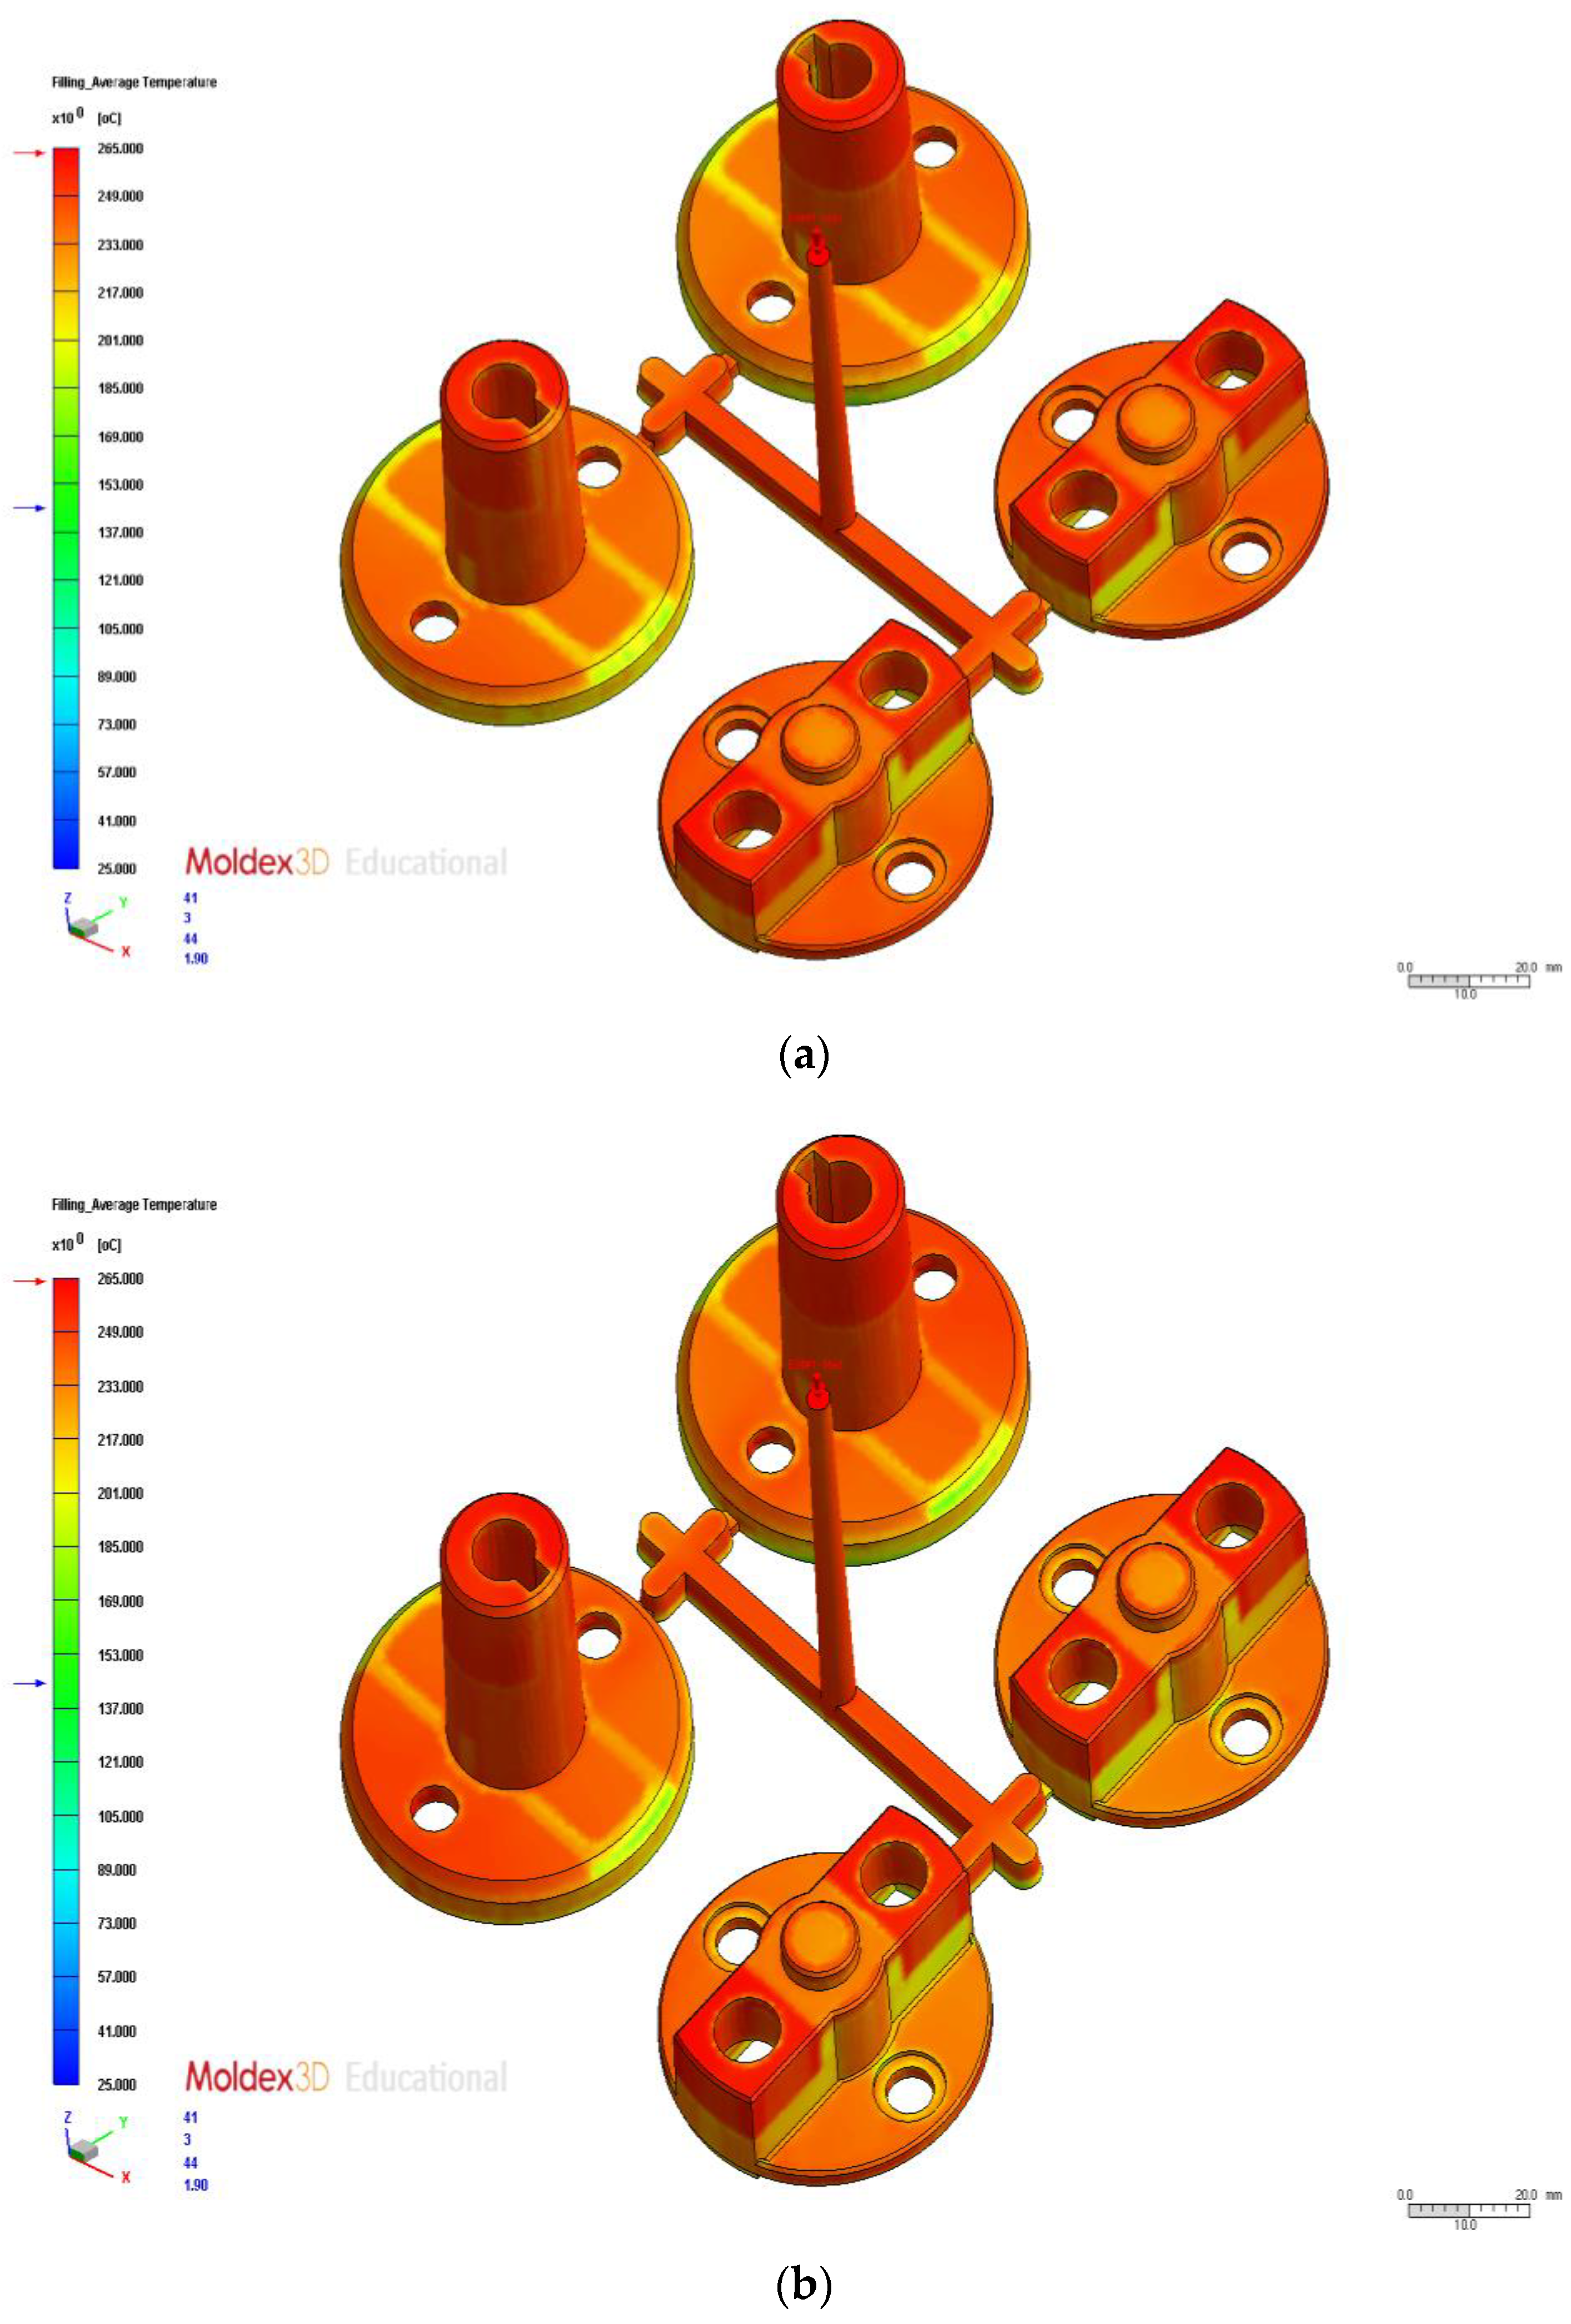
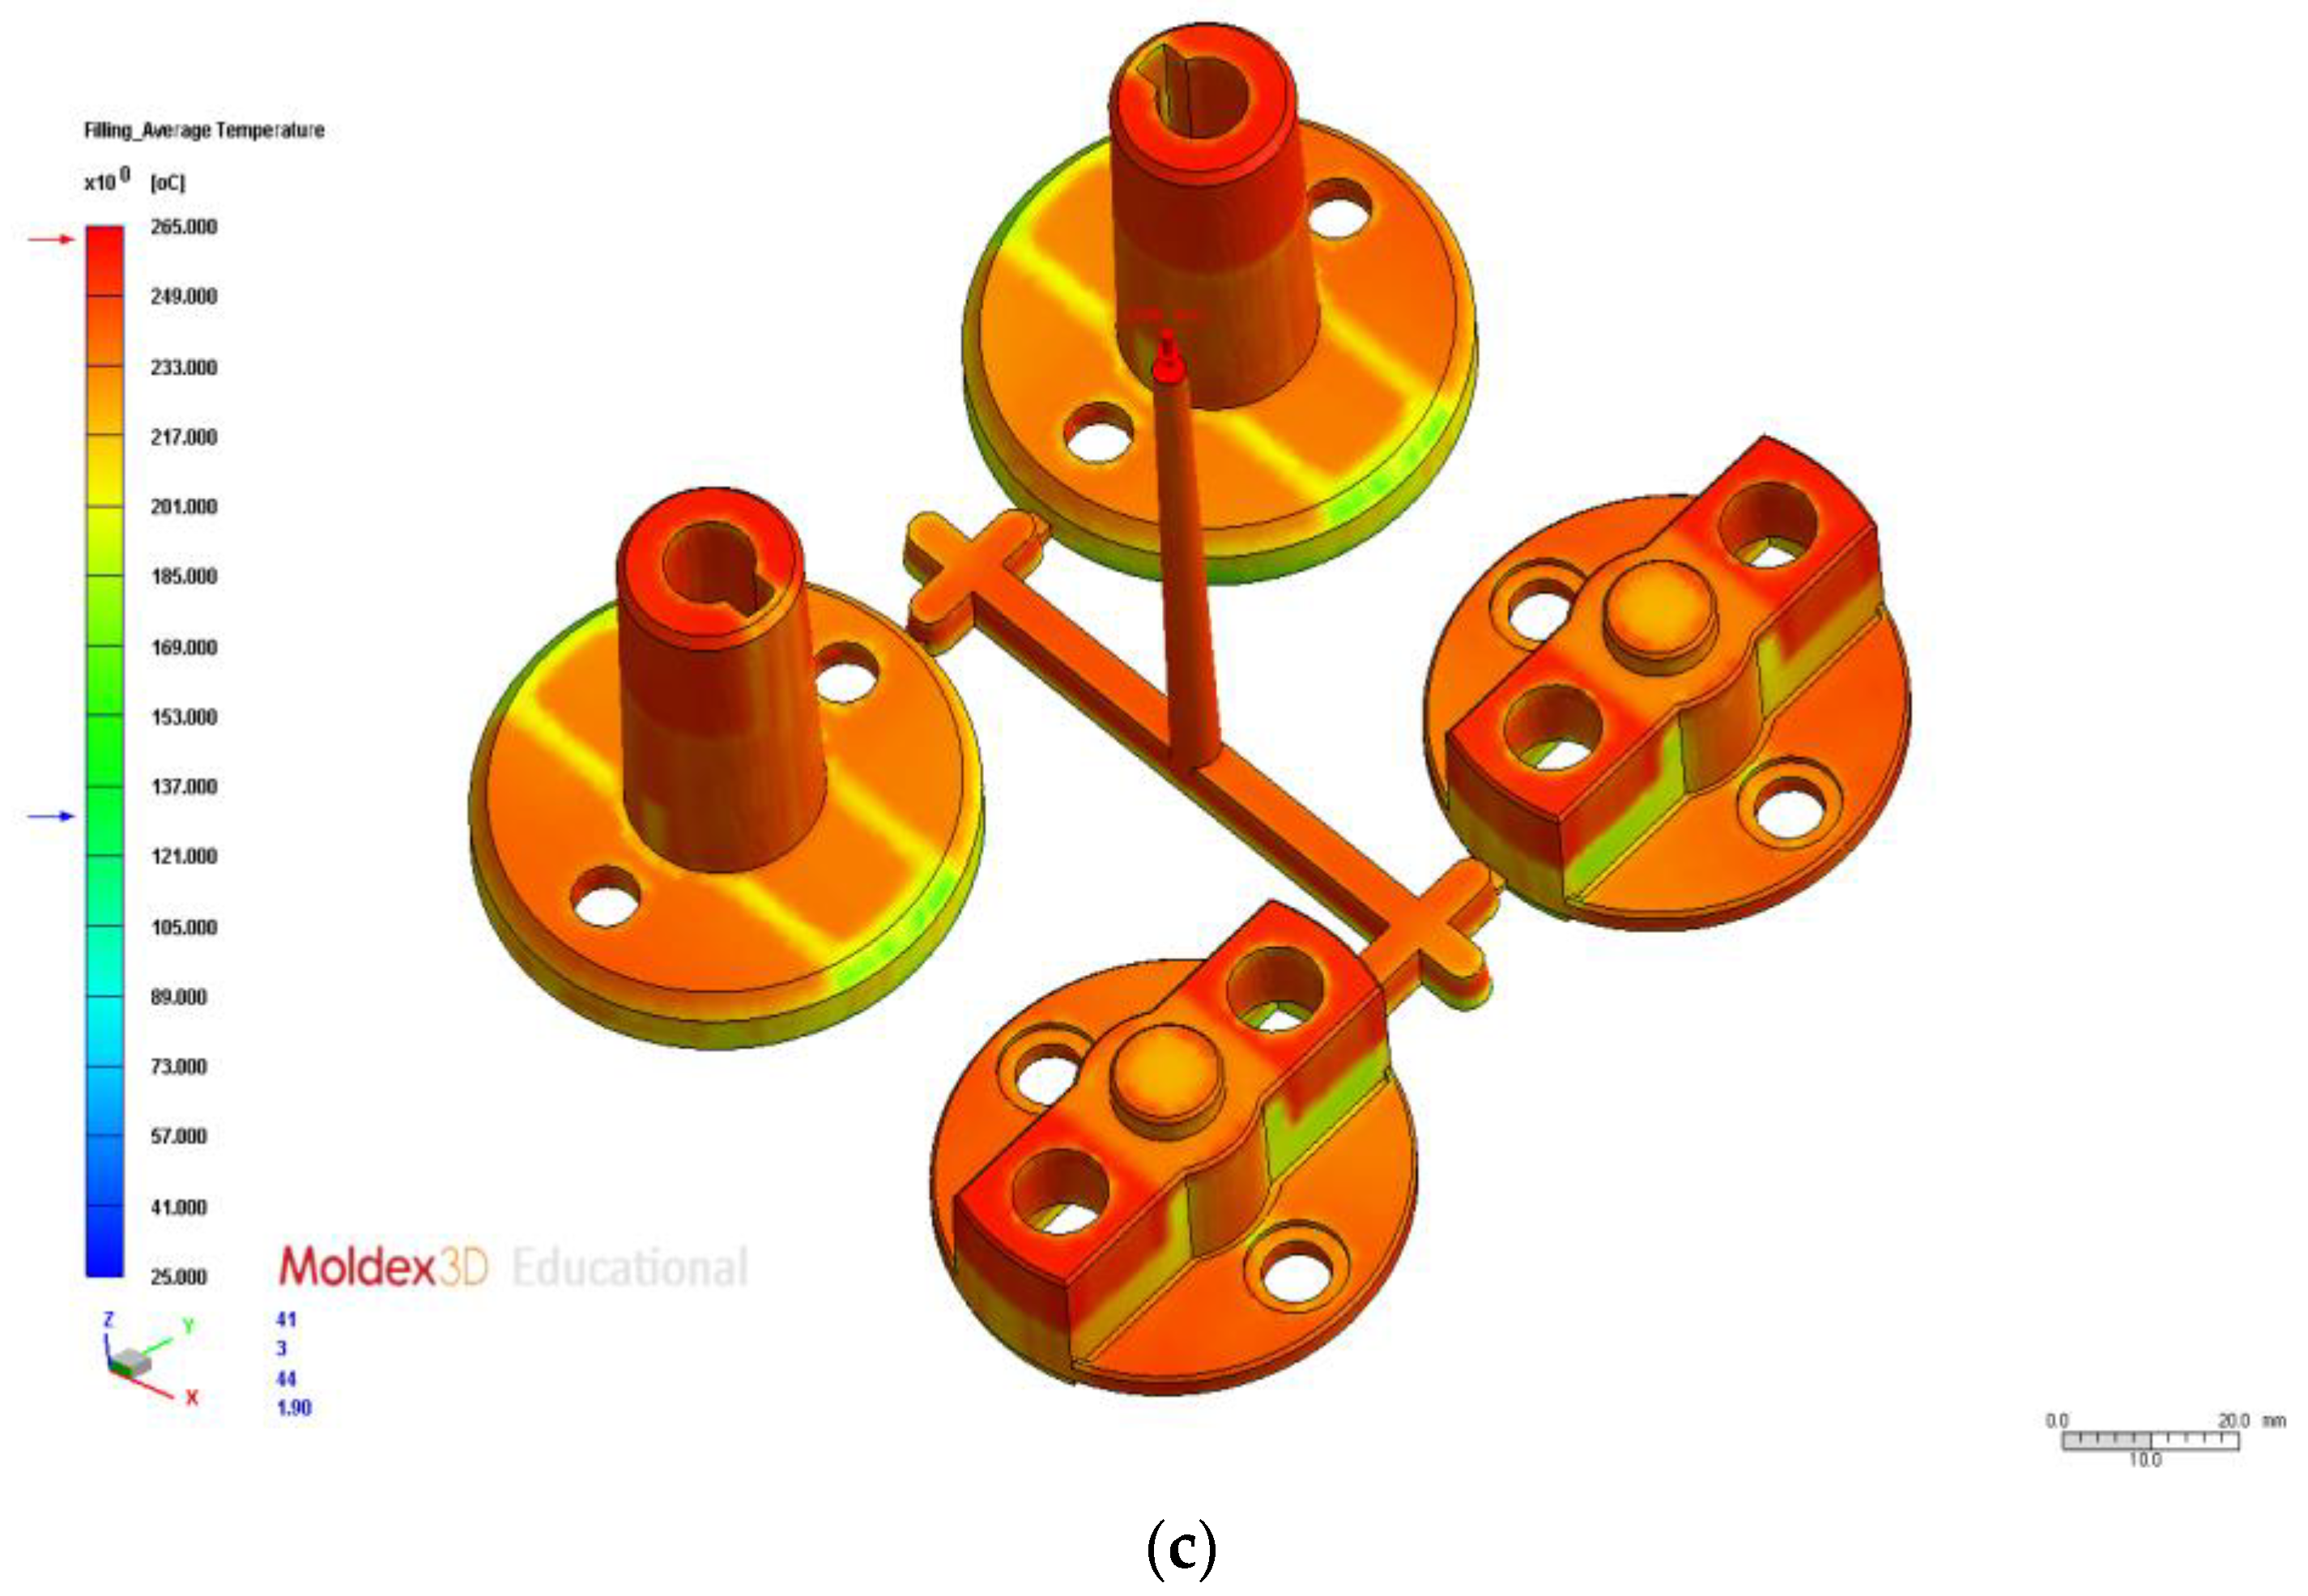
3.2. Optimal Process Parameters for Average Temperature Difference
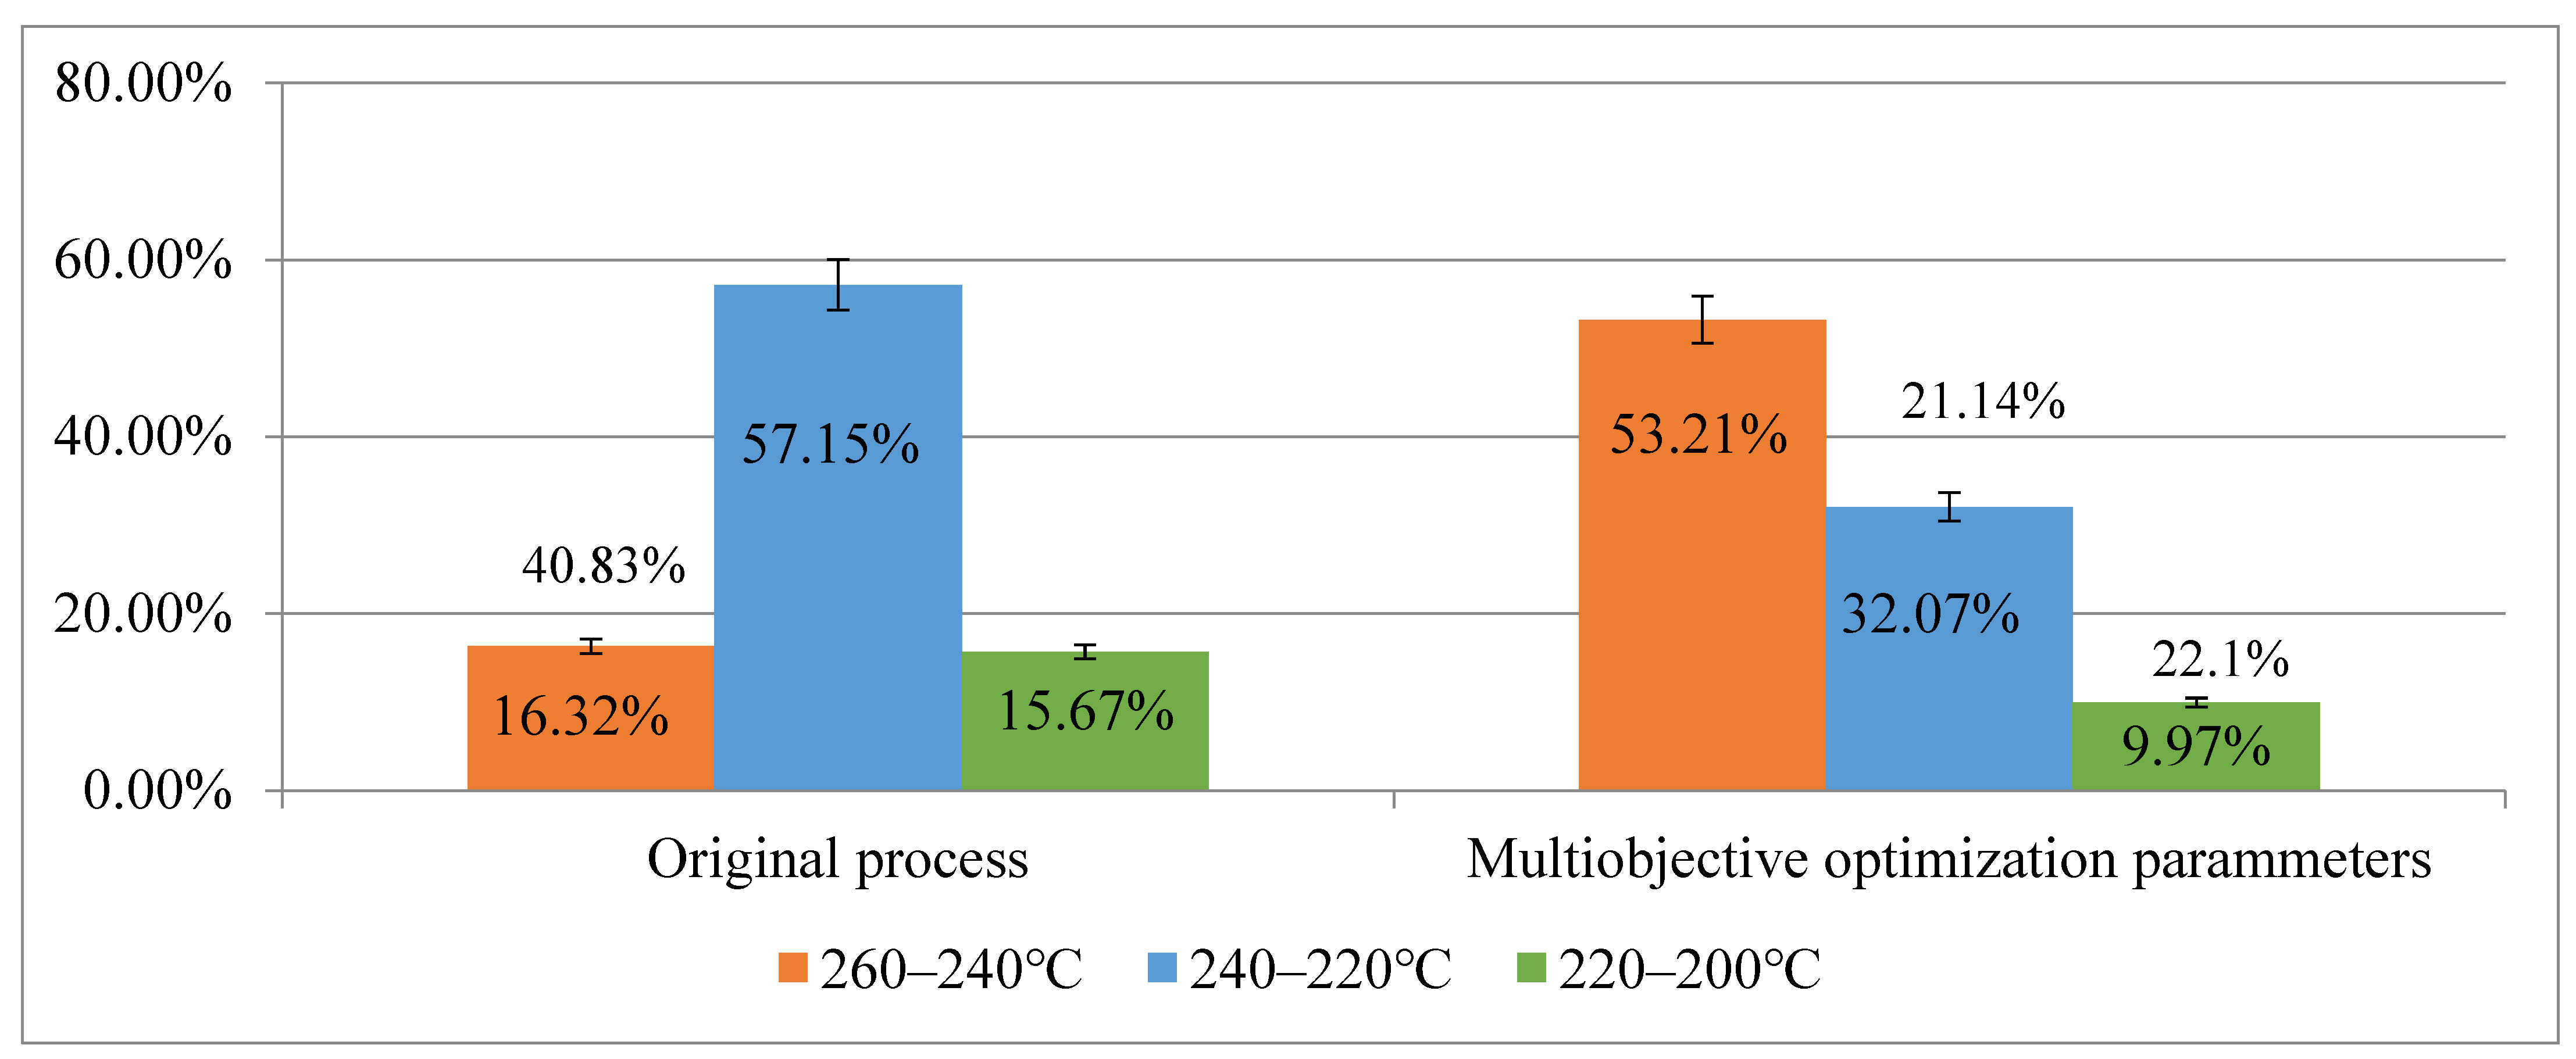
3.3. Multiobjective Optimization Parameters
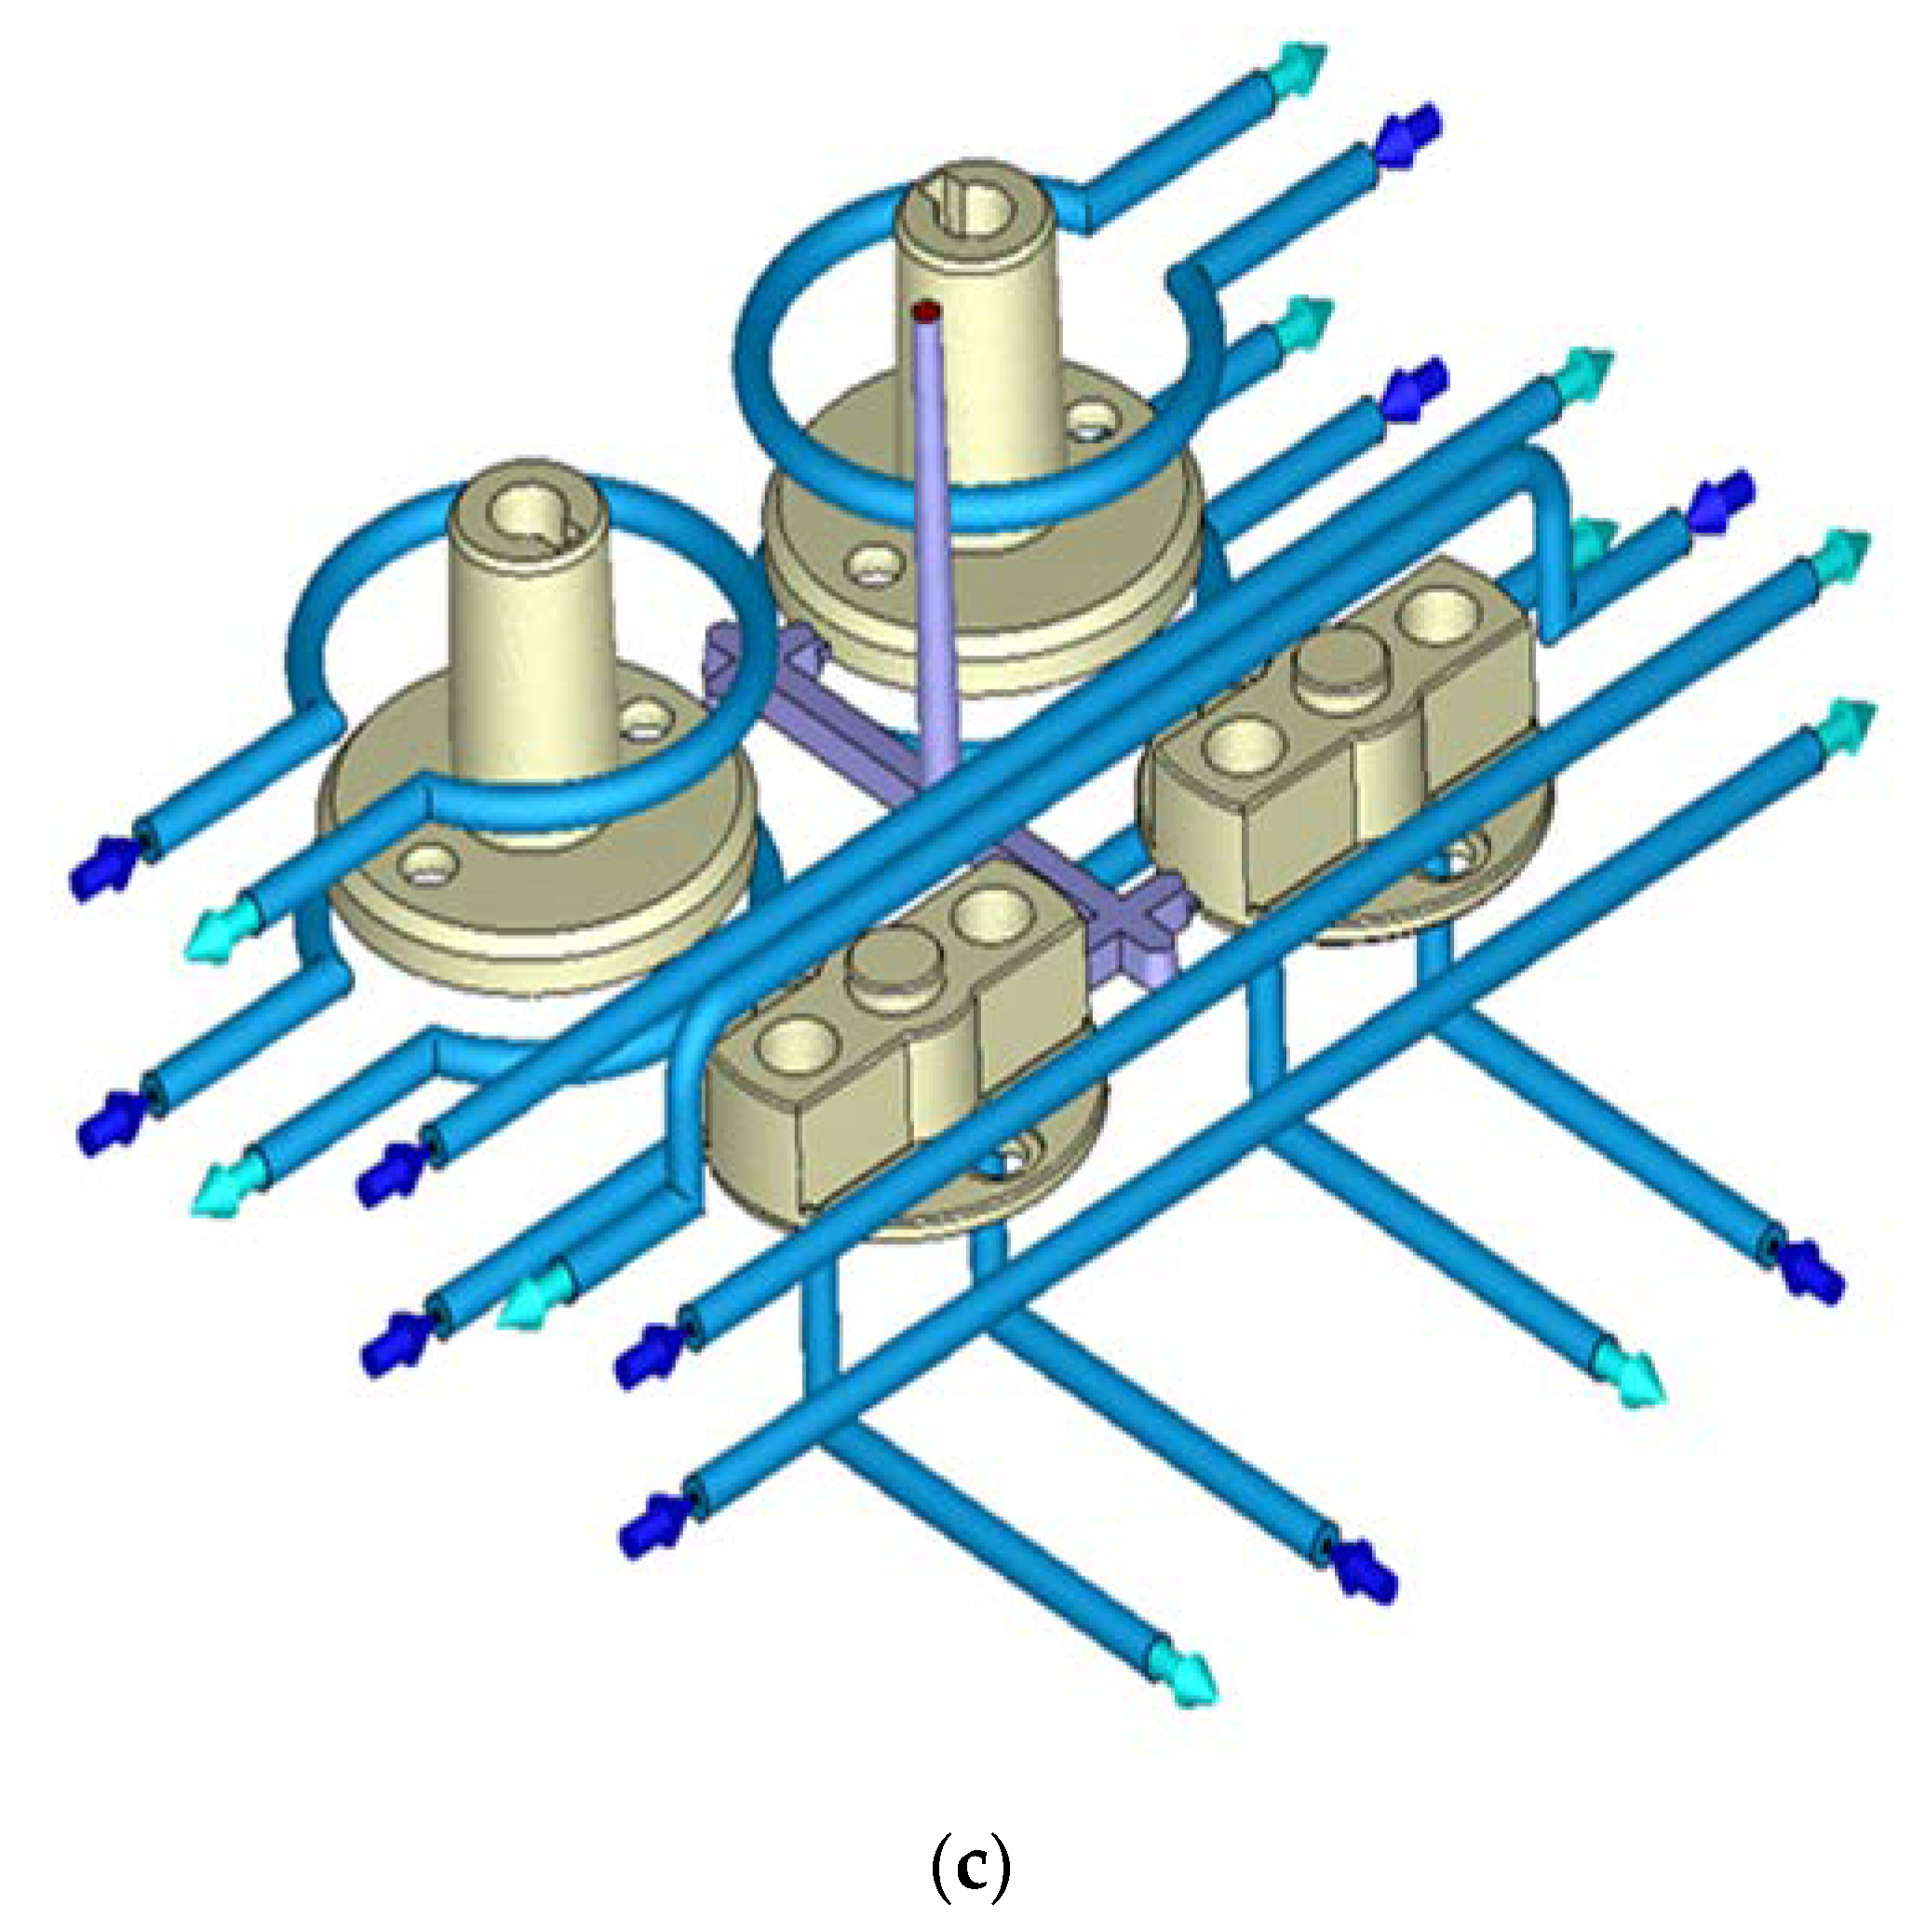
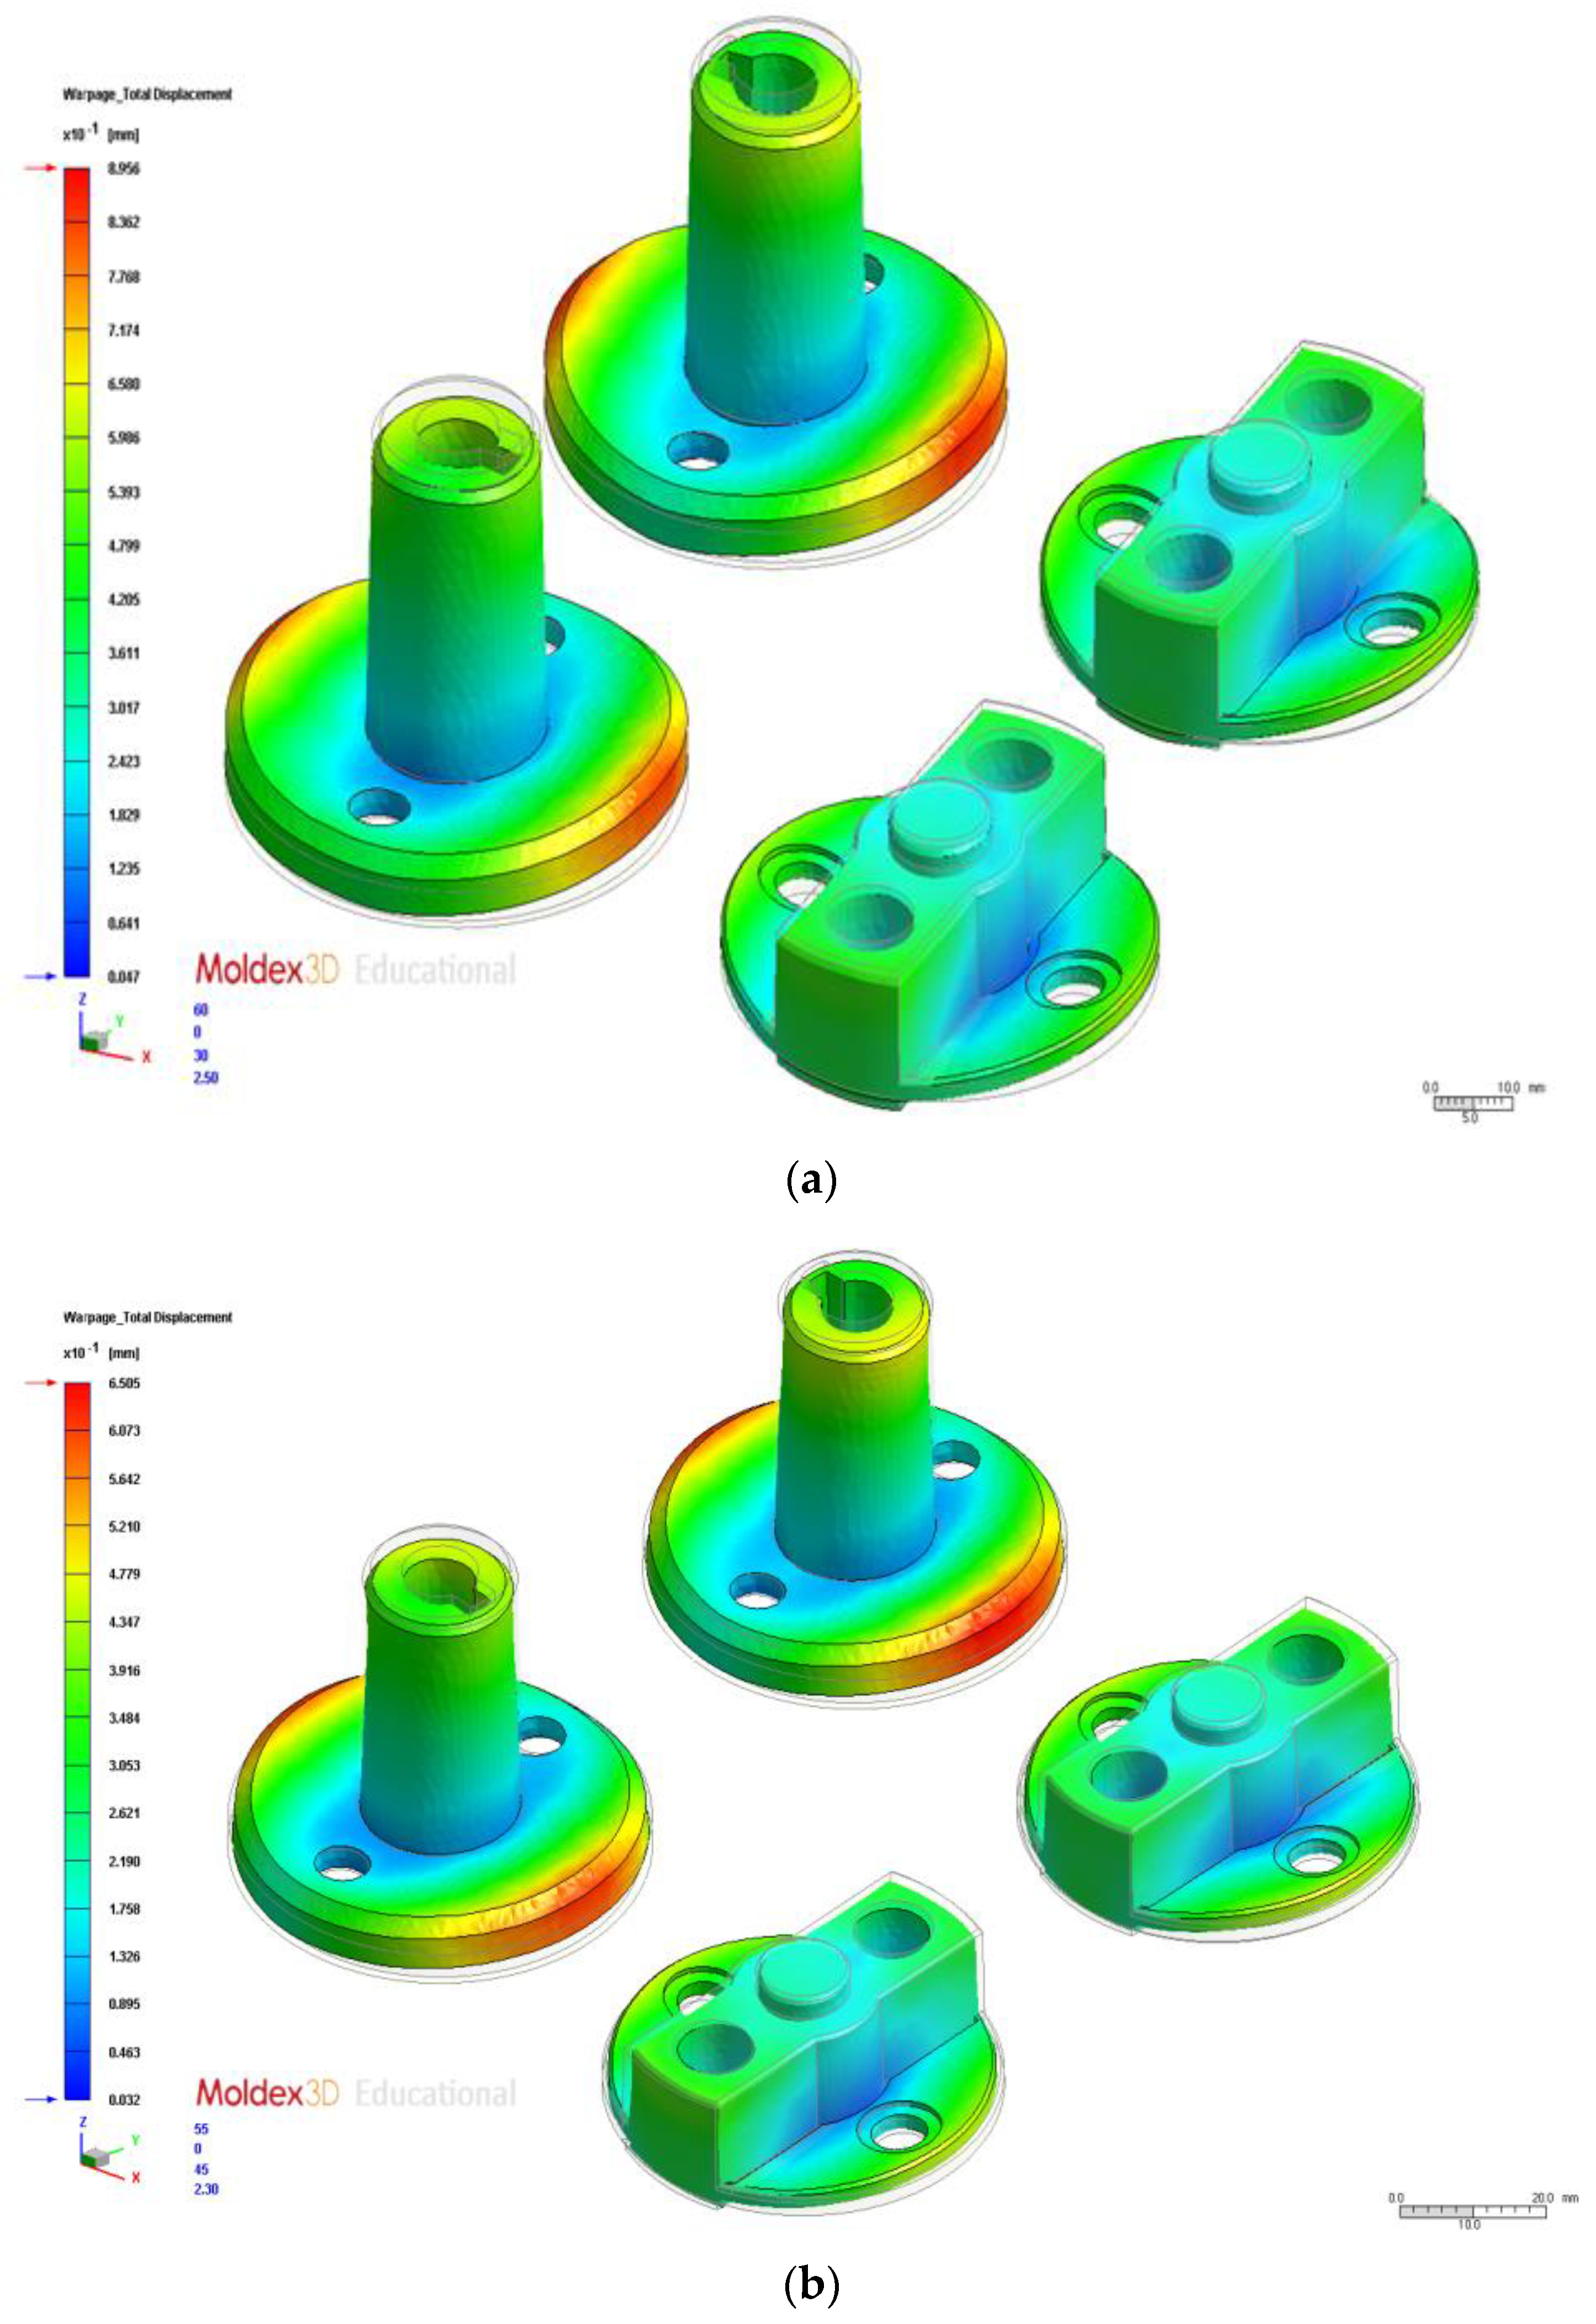
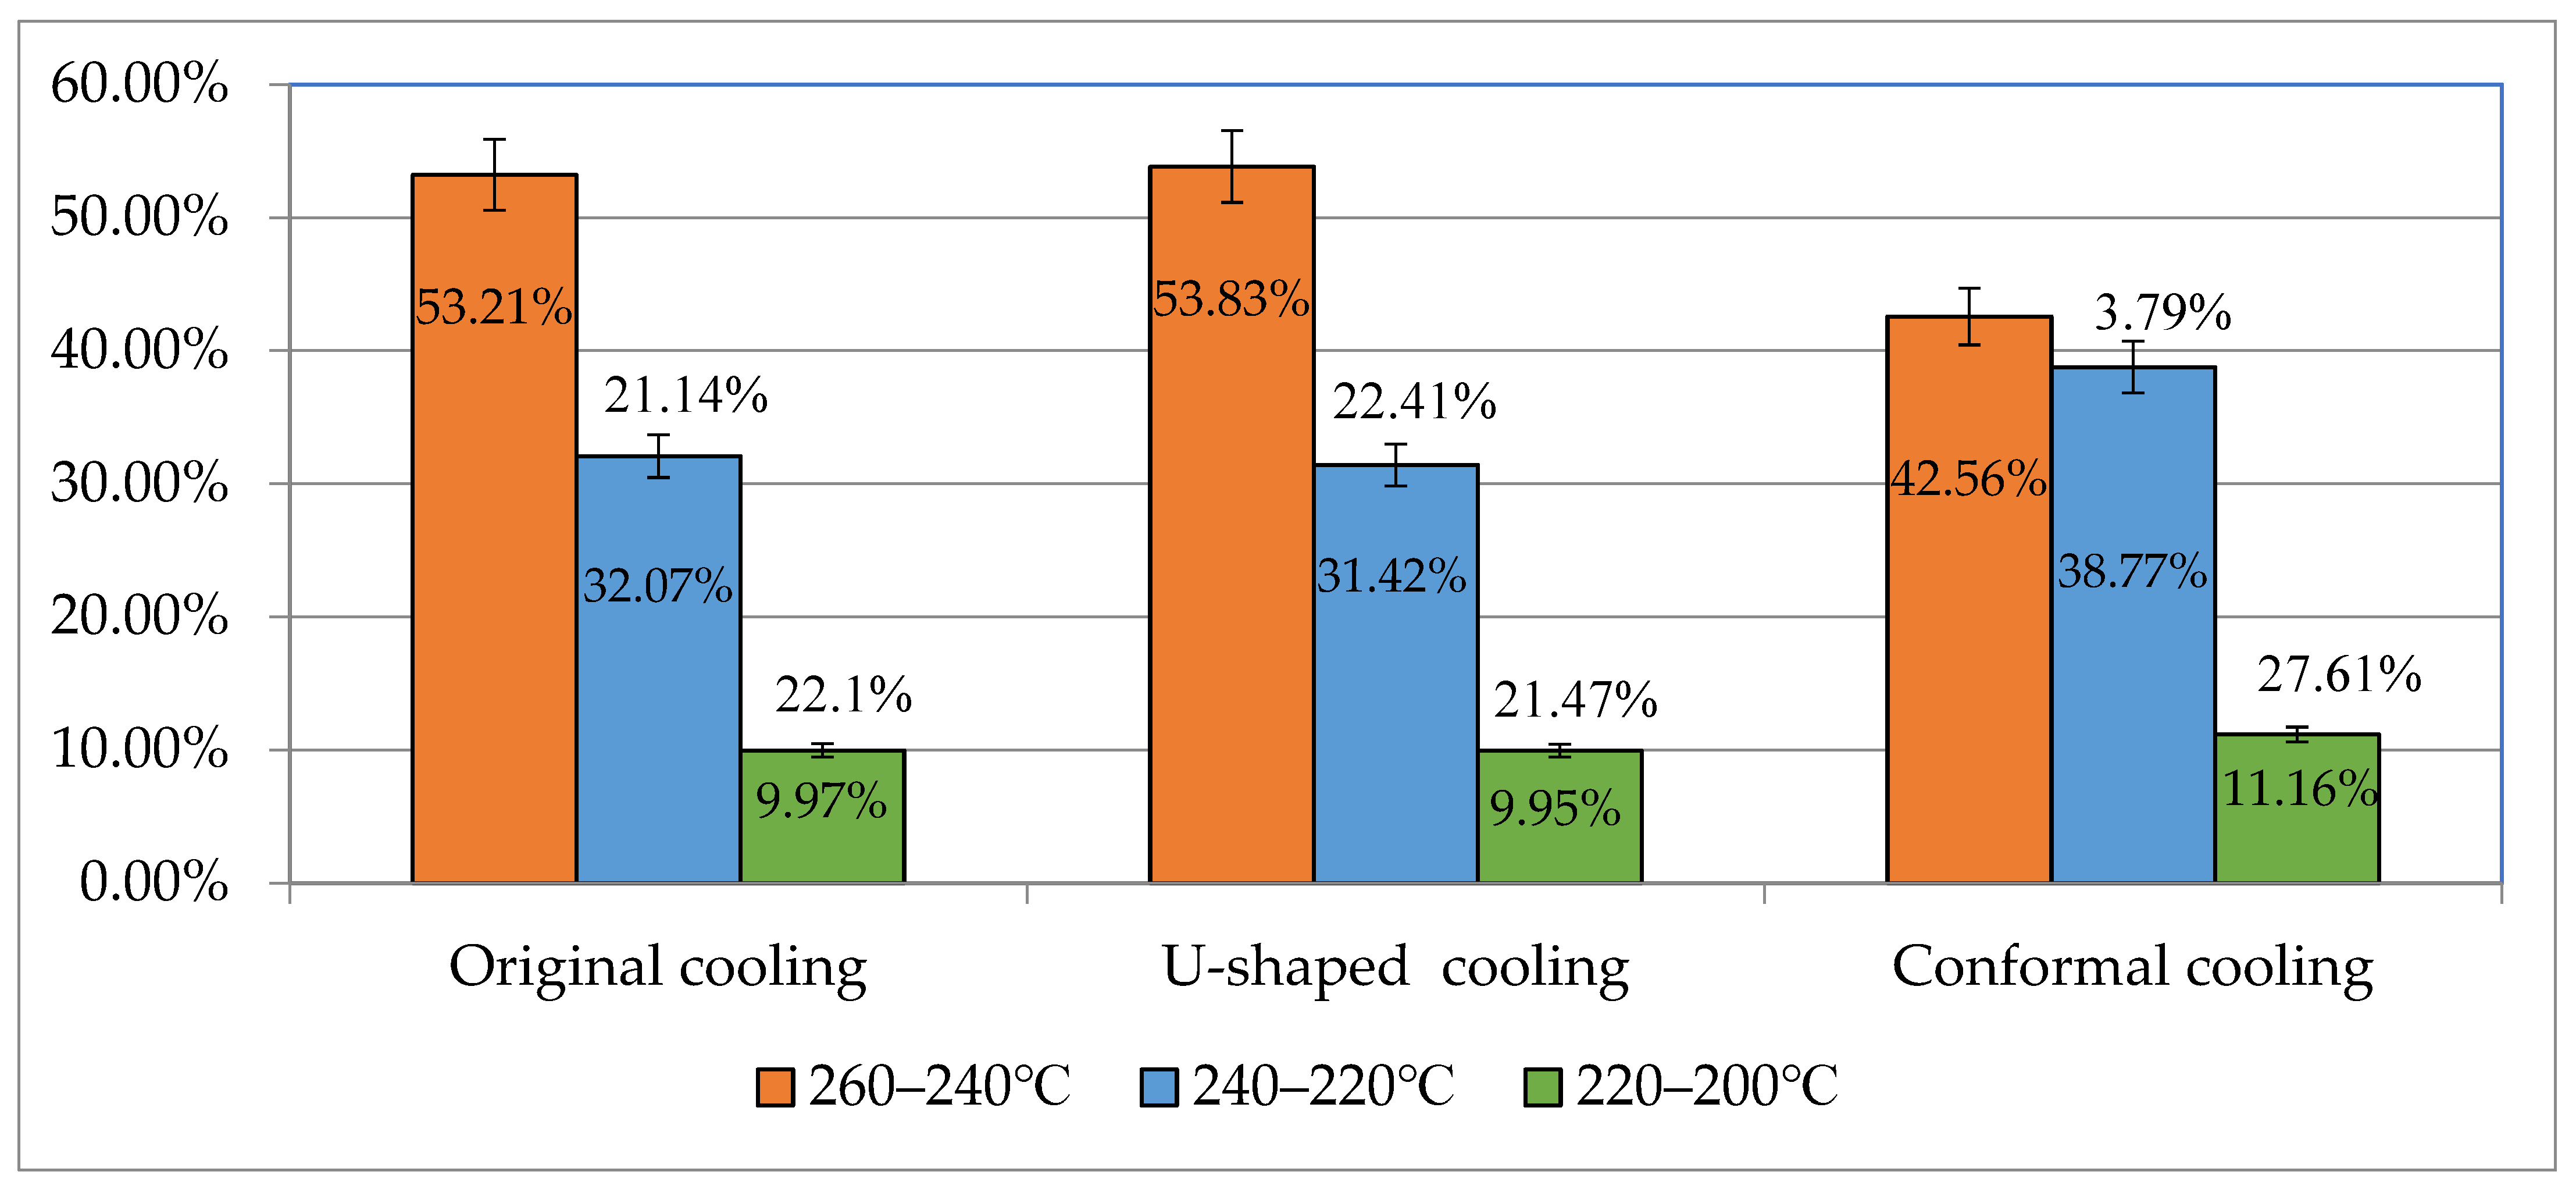
3.4. Analysis and Comparison of Different Cooling Channel System Designs
4. Conclusions
- The results of the Taguchi robust design tests combined with the optimization analyses indicated that the optimal parameter combination for warpage was A1B2C2D1E4, where A1 is injection time (0.6 s), B2 is material temperature (255 °C), C2 is mold temperature (75 °C), D1 is injection pressure (120 MPa), and E4 is holding pressure (145 MPa). The warpage was 0.61 mm; this was 0.29 mm less than that obtained using the original process parameters. The optimal parameter combination also enhanced the quality characteristics by 32.22%;
- The results of the Taguchi robust design tests combined with the optimization analyses revealed that the optimal parameter combination for average temperature difference was A1B1C1D2E1, where A1 is injection time (0.6 s), B1 is material temperature (250 °C), C1 is mold temperature (65 °C), D2 is injection pressure (125 MPa), and E1 is holding pressure (130 MPa). The average temperature difference was 7.59 °C; this was 66.84 °C less than that obtained using the original process parameters. The optimal parameter combination also enhanced the quality characteristics by 47.40%;
- Regarding the multiobjective optimization parameters obtained using the Taguchi gray relational analysis method, we adopted the smaller-the-better quality characteristics of the warpage and average temperature difference. The test results indicated that the multiobjective optimization parameter combination was A1B2C1D1E4, where A1 is injection time (0.6 s), B2 is material temperature (260 °C), C1 is mold temperature (65 °C), D1 is injection pressure (120 MPa), and E4 is holding pressure (140 MPa). The total warpage deformation volume was 0.62 mm, and the average temperature difference was 10.16 °C. Compared with the original parameter combination, the warpage deformation of the optimal parameter combination was 0.28 mm smaller, and the average temperature of the optimal parameter combination was 4.27 °C lower. To account for the multiobjective quality characteristics, we compared the results with the two single-objective optimal quality characteristics. We noted a 1.6% loss in warpage quality and a 5.2% loss in average temperature difference quality;
- The results revealed that the warpage in the conformal cooling system was lower than the warpage in the other two systems. The conformal cooling system also improved the average temperature difference. The warpage was 0.54 mm, and the average temperature difference was 5.87 °C. These values are smaller than those of the original cooling system; specifically, the warpage and average temperature difference were reduced by 11.47% and 43.11%, respectively.
Author Contributions
Funding
Institutional Review Board Statement
Informed Consent Statement
Data Availability Statement
Conflicts of Interest
References
- Wang, X.; Li, H.; Gu, J.; Li, Z.; Ruan, S.; Shen, C.; Wang, M. Pressure Analysis of Dy-namic Injection Molding and Process Parameter Optimization for Reducing Warpage of Injection Molded Products. Polymers 2017, 9, 85. [Google Scholar] [CrossRef] [Green Version]
- Abdul Azam, F.A.; Razak, Z.; Md Radzi, M.K.F.; Muhamad, N.; Che Haron, C.H.; Sulong, A.B. Influence of Multiwalled Carbon Nanotubes on the Rheological Behavior and Physical Properties of Kenaf Fiber-Reinforced Polypropylene Composites. Polymers 2020, 12, 2083. [Google Scholar] [CrossRef] [PubMed]
- Rosa, J.L.; Robin, A.; Silva, M.B.; Baldan, C.A.; Peres, M.P. Electrodeposition of copper on titanium wires: Taguchi Experimental Design approach. J. Mater. Processing Technol. 2009, 209, 1181–1188. [Google Scholar] [CrossRef]
- Gu, F.; Hall, P.; Miles, N.J.; Ding, Q.; Wu, T. Improvement of mechanical properties of recycled plastic blends via optimizing processing parameters using the Taguchi method and principal component analysis. Mater. Des. 2014, 62, 189–198. [Google Scholar] [CrossRef]
- Wang, Y.; Kim, J.; Song, J. Optimization of plastic injection molding process parameters for manufacturing a brake booster valve body. Mater. Des. 2014, 56, 313–317. [Google Scholar] [CrossRef]
- Marins, N.H.; de Mello, F.B.; Silva, R.M.E.; Ogliari, F.A. Statistical Approach to analyze the warpage, shrinkage and mechanical Strengthof injection molded parts. Int. Polym. Processing 2016, 31, 376–384. [Google Scholar] [CrossRef]
- Chen, D.-C.; Huang, C.-K. Study of Injection Molding Warpage Using Analytic Hierarchy Process and Taguchi Method. Adv. Technol. Innov. 2016, 1, 46–49. [Google Scholar]
- Chang, C.L.; Lo, S.L.; Yu, S.L. Applying fuzzy theory and genetic algorithm to interpolate precipitation. J. Hydrol. 2005, 314, 92–104. [Google Scholar] [CrossRef]
- Lin, C.M.; Chen, Y.-W. Grey optimization of injection molding processing of plastic optical lens based on joint consideration of aberration and birefringence effects. J. Mater. Processing Technol. Microsyst. Technol. 2019, 25, 621–631. [Google Scholar] [CrossRef]
- Sreedharan, J.; Jeevanantham, A.K.; Rajeshkannan, A. Multi-objective optimization for multi-stage sequential plastic injection molding with plating process using RSM and PCA-based weighted-GRA. Proc. Inst. Mech. Eng. Part C J. Mech. Eng. Sci. 2020, 234, 1014–1030. [Google Scholar] [CrossRef]
- Ahn, D.G. Applications of laser assisted metal rapid tooling process to manufacture of molding and forming tools—State of the art. Int. J. Precis. Eng. Manuf. 2011, 12, 925–938. [Google Scholar] [CrossRef]
- Jauregui-Becker, J.M.; Tosello, G.; van Houten, F.J.A.M.; Hansen, H.N. Performance evaluation of a software engineering tool for automated design of cooling systems in injection moulding. Procedia CIRP 2013, 7, 270–275. [Google Scholar] [CrossRef] [Green Version]
- Wang, G.L.; Zhao, G.Q.; Wang, X.X. Heating/cooling channels design for an automotive interior part and its evaluation in rapid heat cycle molding. Mater. Des. 2014, 59, 310–322. [Google Scholar] [CrossRef]
- Okada, A.; Usuki, A. Twenty years of polymer-clay nanocomposites. Macromol. Mater. Eng. 2006, 291, 1449–1476. [Google Scholar] [CrossRef]
- Ryu, Y.; Sohn, J.S.; Yun, C.S.; Cha, S.W. Shrinkage and Warpage Minimization of Glass-Fiber-Reinforced Polyamide 6 Parts by Microcellular Foam Injection Molding. Polymers 2020, 12, 889. [Google Scholar] [CrossRef]
- Chen, H.W.; Lin, M.F. Characterization, Biocompatibility, and Optimization of Electrospun SF/PCL/CS Com-posite Nanofibers. Polymers 2020, 12, 1439. [Google Scholar] [CrossRef]
- Lin, C.M.; Hung, Y.T.; Tan, C.M. Hybrid Taguchi–Gray Relation Analysis Method for Design of Metal Powder Injection-Molded Artificial Knee Joints with Optimal Powder Concentration and Volume Shrinkage. Polymers 2021, 13, 865. [Google Scholar] [CrossRef]
- Neseli, S. Optimization of process parameters with minimum thrust force and torque in drilling operation Using Taguchi method. Adv. Mech. Eng. 2014, 6, 1–10. [Google Scholar] [CrossRef] [Green Version]
- Huang, W.-T.; Liu, W.-S.; Tsai, J.-T.; Chou, J.-H. Multiple quality characteristics of nanofluid/ultrasonic atomization minimum quality lubrication for grinding hardened Mold steel. IEEE Trans. Autom. Sci. Eng. 2018, 15, 1065–1077. [Google Scholar] [CrossRef]
- Lin, Z.C.; Chou, M.H. Design of the Cooling Channels in non rectangular Plastic Flat Injection Mold. J. Manuf. Syst. 2002, 21, 167–186. [Google Scholar] [CrossRef]
- Feng, S.; Kamat, A.M.; Pei, Y. Design and fabrication of conformal cooling channels in molds: Review and progress updates. Int. J. Heat Mass Transf. 2021, 171, 1–28. [Google Scholar] [CrossRef]
- Huang, W.-T.; Tsai, C.-L.; Ho, W.-H.; Chou, J.-H. Application of Intelligent Modeling Method to Optimize the Multiple Quality Characteristics of the Injection Molding Process of Automobile Lock Parts. Polymers 2021, 13, 2515. [Google Scholar] [CrossRef] [PubMed]
- Lin, C.M.; Wu, J.J.; Tan, C.M. Processing Optimization for Metal Injection Molding of Orthodontic Braces Considering Powder Concentration Distribution of Feedstock. Polymers 2020, 12, 2635. [Google Scholar] [CrossRef] [PubMed]
- Torres-Alba, A.; Mercado-Colmenero, J.M.; Diaz-Perete, D.; Martin-Doñate, C. A New Conformal Cooling Design Procedure for Injection Molding Based on Temperature Clusters and Multidimensional Discrete Models. Polymers 2020, 12, 154. [Google Scholar] [CrossRef] [Green Version]


| Mechanical Properties | PA66 |
|---|---|
| Density | 1.14 (g/cc) |
| Poisson’s ratio | 0.3 |
| Modulus E | 2 × 10¹⁰ (dyne/cm2) |
| CLTE | 7.5 × 10⁻⁵ (1/K) |
| Fiber Weight Percentage | 33 (%) |
| Percentage | 275–305 °C |
| Melt Temperature | 1.14 (g/cc) |
| Factors | Level |
|---|---|
| A. Injection Time (s) | 1 |
| B. Material Temp. (°C) | 245 |
| C. Mold Temp.(°C) | 65 |
| D. Injection Press. (MPa) | 120 |
| E. Packing Press. (MPa) | 130 |
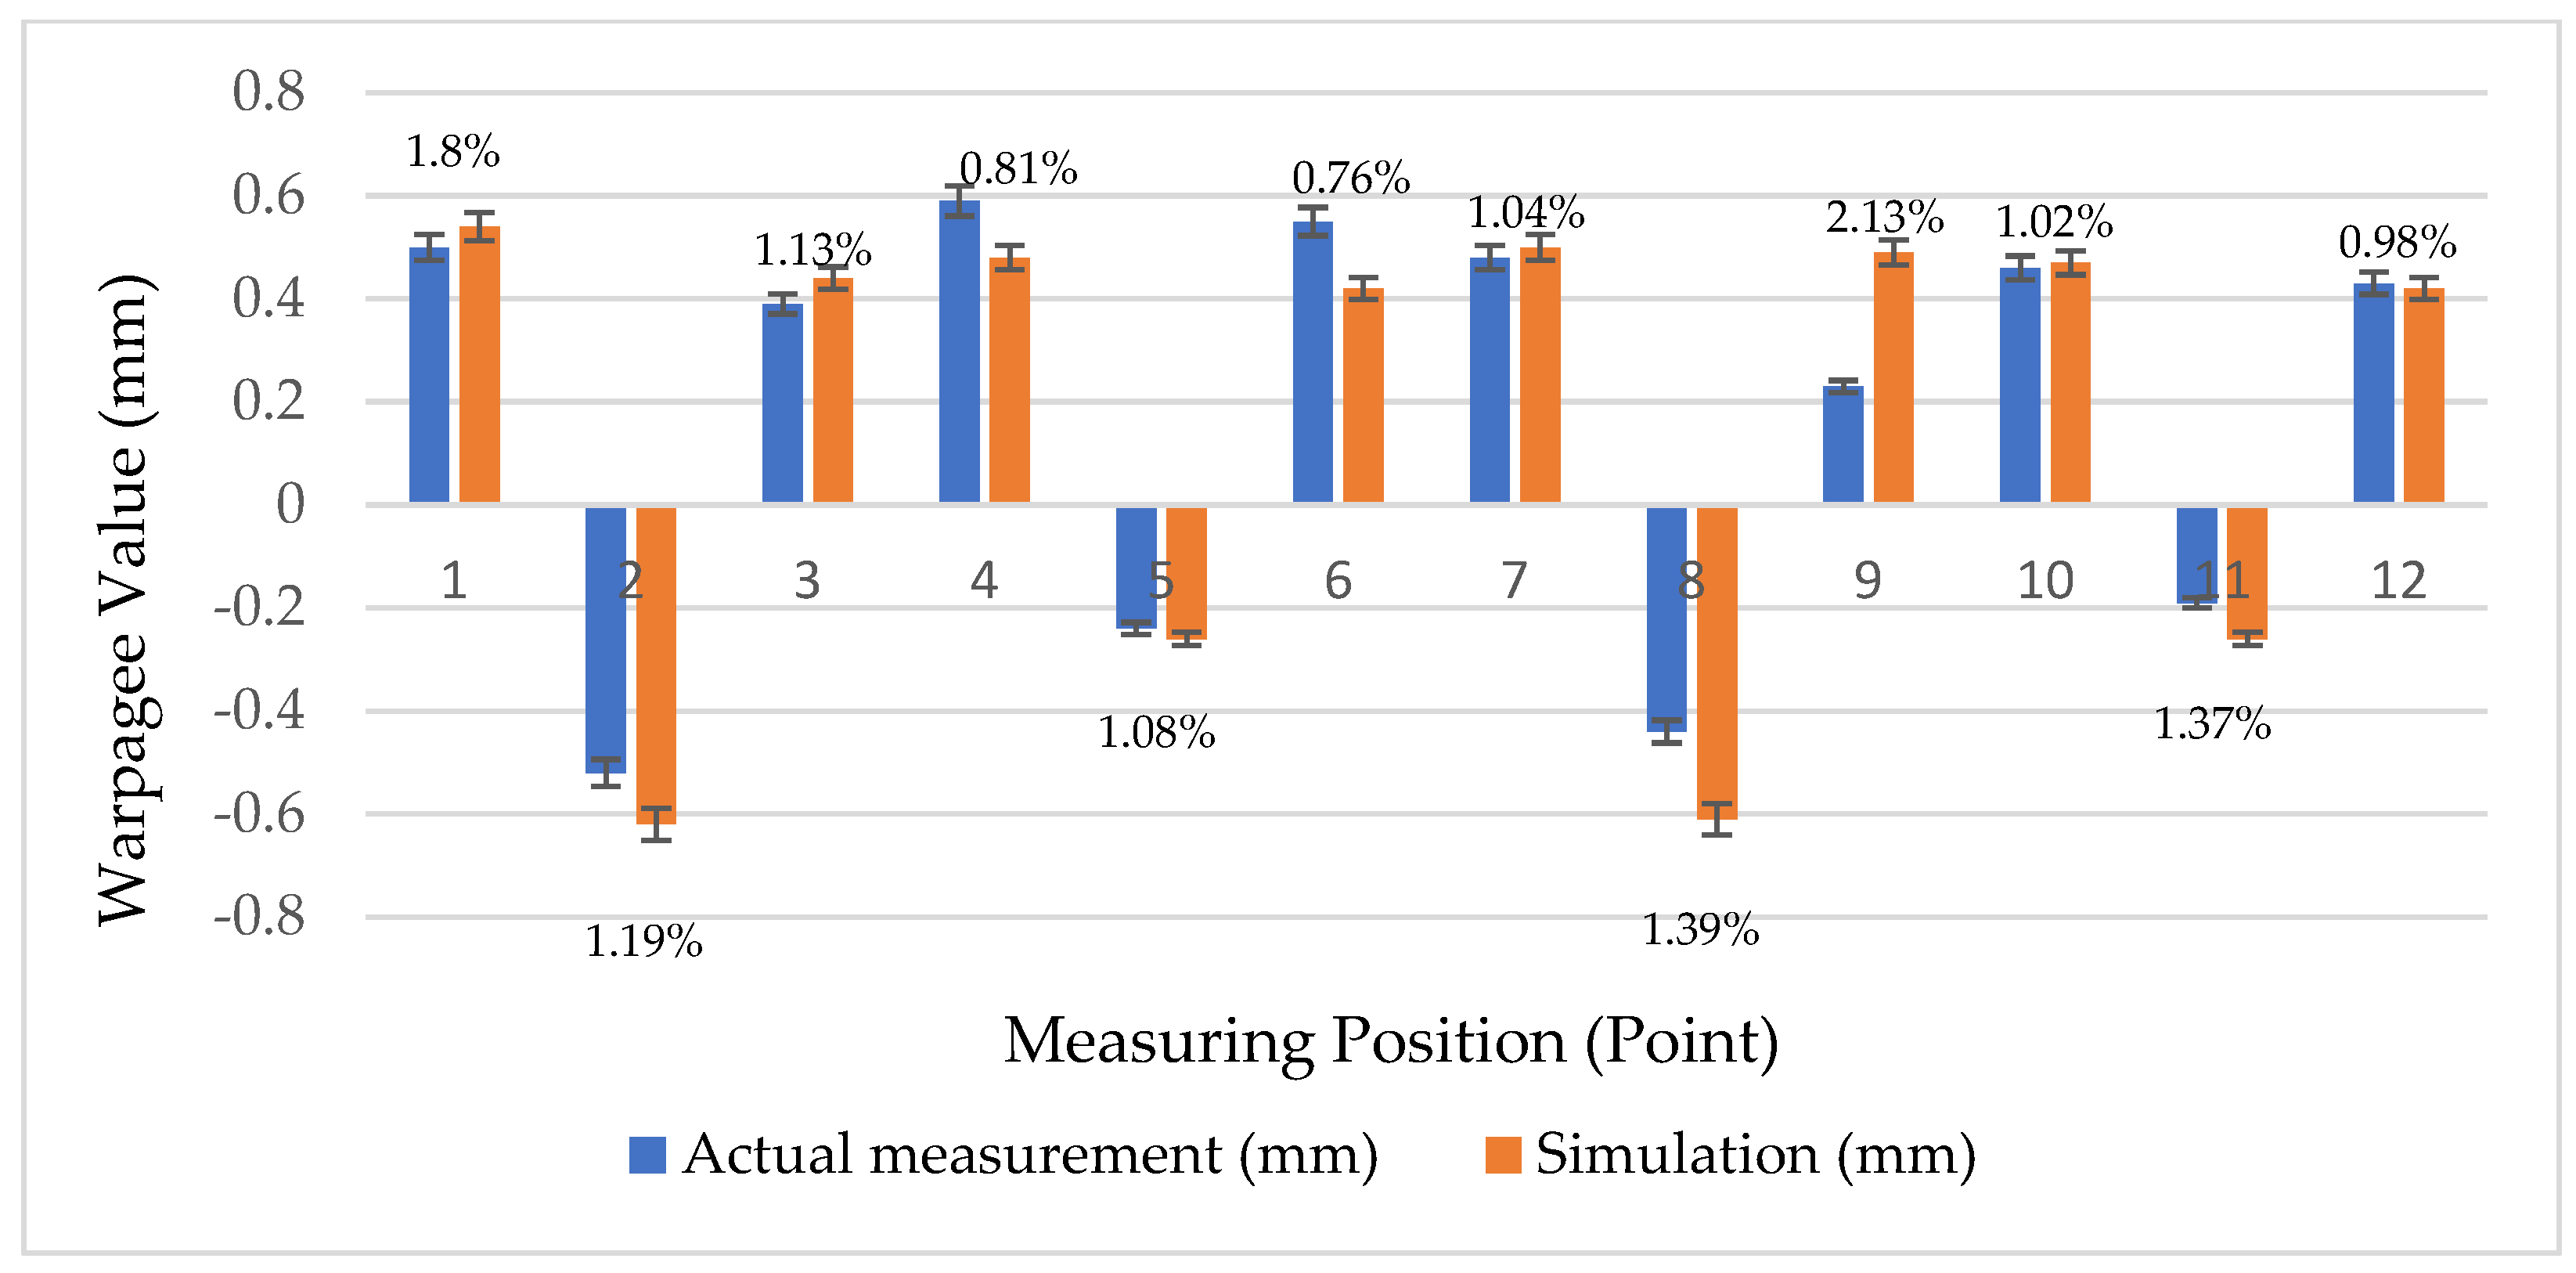
| Point | Actual Measurement (mm) | Simulation (mm) | Error (%) |
|---|---|---|---|
| 1 | 0.50 | 0.54 | 1.08 |
| 2 | −0.52 | −0.62 | 1.19 |
| 3 | 0.39 | 0.44 | 1.13 |
| 4 | 0.59 | 0.48 | 0.81 |
| 5 | −0.24 | −0.26 | 1.08 |
| 6 | 0.55 | 0.42 | 0.76 |
| 7 | 0.48 | 0.50 | 1.04 |
| 8 | −0.44 | −0.61 | 1.34 |
| 9 | 0.23 | 0.49 | 2.13 |
| 10 | 0.46 | 0.47 | 1.02 |
| 11 | −0.19 | −0.26 | 1.37 |
| 12 | 0.43 | 0.42 | 0.98 |
| AVG | 1.16 |
| Control Factors | Level | |||
|---|---|---|---|---|
| 1 | 2 | 3 | 4 | |
| A. Injection Time (s) | 0.6 | 0.8 | 1.0 | 1.2 |
| B. Material Temp. (°C) | 245 | 255 | 265 | 275 |
| C. Mold Temp.(°C) | 65 | 75 | 85 | 95 |
| D. Injection Press. (MPa) | 120 | 125 | 130 | 135 |
| E. Packing Press. (MPa) | 130 | 135 | 140 | 145 |
| Type | Number of Water Inlets | Number of Water Outlet | Reynolds Number | Cooling Liquid | Inlet Water Temperature |
|---|---|---|---|---|---|
| Original Cooling | 2 | 2 | 6570 | Oil | 65 °C |
| U-shaped Cooling | 6 | 6 | 6570 | Oil | 65 °C |
| Conformal Cooling | 11 | 11 | 6570 | Oil | 65 °C |
| No. | Warpage (mm) | S/N |
|---|---|---|
| 1 | 0.69 | 3.27 |
| 2 | 0.65 | 3.80 |
| 3 | 0.64 | 3.82 |
| 4 | 0.65 | 3.72 |
| 5 | 0.63 | 4.00 |
| 6 | 0.64 | 3.83 |
| 7 | 0.67 | 3.48 |
| 8 | 0.73 | 2.79 |
| 9 | 0.71 | 2.92 |
| 10 | 0.71 | 3.01 |
| 11 | 0.63 | 3.95 |
| 12 | 0.69 | 3.25 |
| 13 | 0.74 | 2.70 |
| 14 | 0.62 | 4.08 |
| 15 | 0.70 | 3.09 |
| 16 | 0.71 | 3.02 |
| Factor | A | B | C | D | E |
|---|---|---|---|---|---|
| Level 1 | 3.65 | 3.22 | 3.52 | 3.51 | 3.04 |
| Level 2 | 3.53 | 3.68 | 3.54 | 3.31 | 3.30 |
| Level 3 | 3.28 | 3.59 | 3.40 | 3.46 | 3.40 |
| Level 4 | 3.22 | 3.20 | 3.23 | 3.39 | 3.94 |
| Effect | 0.43 | 0.49 | 0.31 | 0.21 | 0.90 |
| Rank | 3 | 2 | 4 | 5 | 1 |
| Optimal parameters | A1 | B2 | C2 | D1 | E4 |
| No. | Factor | Warpage (mm) |
|---|---|---|
| Original Process Parameters | 0.90 | |
| Orthogonal Array Worst (No.13) | A4B1C4D3E2 | 0.74 |
| Orthogonal Array Best (No.14) | A4B2C3D4E1 | 0.62 |
| Optimization | A1B2C2D1E4 | 0.61 |
| Factor | DOF | Seq SS | MS | Contribution |
|---|---|---|---|---|
| A | 3 | 0.49 | 0.16 | 14.92(%) |
| B | 3 | 0.75 | 0.25 | 22.68(%) |
| C | 3 | 0.24 | 0.08 | 7.31(%) |
| D | Pooled | |||
| E | 3 | 1.17 | 0.57 | 51.96(%) |
| Error | 3 | 0.10 | 0.03 | 3.13(%) |
| Total | 15 | 3.29 | 100(%) |
| No. | Average Temperature Difference (°C) | S/N |
|---|---|---|
| 1 | 9.19 | −19.27 |
| 2 | 11.28 | −21.05 |
| 3 | 14.36 | −23.14 |
| 4 | 16.74 | −24.48 |
| 5 | 11.73 | −21.39 |
| 6 | 14.12 | −22.99 |
| 7 | 21.35 | −26.59 |
| 8 | 12.33 | −21.82 |
| 9 | 15.41 | −23.75 |
| 10 | 16.66 | −24.43 |
| 11 | 10.27 | −20.23 |
| 12 | 11.42 | −21.15 |
| 13 | 14.04 | −22.95 |
| 14 | 14.00 | −22.92 |
| 15 | 13.29 | −22.47 |
| 16 | 11.52 | −21.23 |
| Factor | A | B | C | D | E |
|---|---|---|---|---|---|
| Level 1 | −21.98 | −21.84 | −20.93 | −22.48 | −22.00 |
| Level 2 | −23.2 | −22.85 | −21.51 | −21.51 | −23.15 |
| Level 3 | −22.39 | −23.11 | −22.91 | −22.55 | −22.56 |
| Level 4 | −22.39 | −23.17 | −24.61 | −23.42 | −22.25 |
| Effect | 1.21 | 1.27 | 3.68 | 1.91 | 1.16 |
| Rank | 4 | 3 | 1 | 2 | 5 |
| Optimal parameters | A1 | B1 | C1 | D2 | E1 |
| No. | Factor | Average Temperature Difference (°C) |
|---|---|---|
| Original process parameters | 14.43 | |
| Orthogonal Array Worst (No.7) | A2B3C4D2E1 | 21.35 |
| Orthogonal Array Best (No.1) | A1B1C1D1E1 | 9.19 |
| Optimization | A1B1C1D2E1 | 7.59 |
| Factor | DOF | Seq SS | MS | Contribution |
|---|---|---|---|---|
| A | 3 | 3.10 | 1.03 | 6.23(%) |
| B | 3 | 4.15 | 1.38 | 8.34(%) |
| C | 3 | 32.21 | 10.74 | 64.70(%) |
| D | 3 | 7.35 | 2.45 | 14.75(%) |
| E | Pooled | |||
| Error | 3 | 2.98 | 0.99 | 5.98(%) |
| Total | 15 | 49.79 | 100(%) |
| No. | Warpage S/N Ratio | Average Temperature Difference S/N Ratio |
|---|---|---|
| 1 | 1.00 | 0.70 |
| 2 | 0.86 | 0.87 |
| 3 | 0.73 | 0.88 |
| 4 | 0.67 | 0.84 |
| 5 | 0.83 | 0.96 |
| 6 | 0.74 | 0.89 |
| 7 | 0.59 | 0.77 |
| 8 | 0.80 | 0.61 |
| 9 | 0.70 | 0.63 |
| 10 | 0.68 | 0.65 |
| 11 | 0.91 | 0.93 |
| 12 | 0.85 | 0.71 |
| 13 | 0.74 | 0.59 |
| 14 | 0.75 | 1.00 |
| 15 | 0.77 | 0.67 |
| 16 | 0.84 | 0.66 |
| NO. | Gray Relation | Rank |
|---|---|---|
| 1 | 0.85 | 5 |
| 2 | 0.86 | 4 |
| 3 | 0.81 | 7 |
| 4 | 0.76 | 9 |
| 5 | 0.90 | 2 |
| 6 | 0.82 | 6 |
| 7 | 0.68 | 13 |
| 8 | 0.71 | 12 |
| 9 | 0.67 | 14 |
| 10 | 0.66 | 16 |
| 11 | 0.93 | 1 |
| 12 | 0.78 | 8 |
| 13 | 0.67 | 15 |
| 14 | 0.87 | 3 |
| 15 | 0.72 | 11 |
| 16 | 0.75 | 10 |
| Factor | A | B | C | D | E |
|---|---|---|---|---|---|
| Level 1 | 0.82 | 0.77 | 0.86 | 0.80 | 0.73 |
| Level 2 | 0.77 | 0.80 | 0.81 | 0.79 | 0.74 |
| Level 3 | 0.76 | 0.77 | 0.76 | 0.78 | 0.77 |
| Level 4 | 0.75 | 0.75 | 0.69 | 0.74 | 0.86 |
| Effect | 0.07 | 0.05 | 0.17 | 0.06 | 0.12 |
| Rank | 3 | 5 | 1 | 4 | 2 |
| Optimal parameters | A1 | B2 | C1 | D1 | E4 |
| No. | Factor | Warpage (mm) | Average Temperature Difference (°C) |
|---|---|---|---|
| Original Process Parameters | 0.90 | 14.43 | |
| Warpage Optimization | A1B2C2D1E4 | 0.61 | |
| Average Temperature Difference Optimization | A1B1C1D2E1 | 7.59 | |
| Multi-Objective Optimization | A1B2C1D1E4 | 0.62 | 10.16 |
| Warpage | Original Cooling | U-Shaped Cooling | Conformal Cooling |
|---|---|---|---|
| Total Warpage (mm) | 0.61 | 0.57 | 0.54 |
| X-Axis Warpage (mm) | −0.33~0.33 | −0.29~0.29 | −0.23~0.24 |
| Y-Axis Warpage (mm) | −0.34~0.34 | −0.41~0.42 | −0.29~0.29 |
| Z-Axis Warpage (mm) | −0.45~0.58 | −0.43~0.54 | −0.38~0.52 |
Publisher’s Note: MDPI stays neutral with regard to jurisdictional claims in published maps and institutional affiliations. |
© 2022 by the authors. Licensee MDPI, Basel, Switzerland. This article is an open access article distributed under the terms and conditions of the Creative Commons Attribution (CC BY) license (https://creativecommons.org/licenses/by/4.0/).
Share and Cite
Huang, W.-T.; Tasi, Z.-Y.; Ho, W.-H.; Chou, J.-H. Integrating Taguchi Method and Gray Relational Analysis for Auto Locks by Using Multiobjective Design in Computer-Aided Engineering. Polymers 2022, 14, 644. https://0-doi-org.brum.beds.ac.uk/10.3390/polym14030644
Huang W-T, Tasi Z-Y, Ho W-H, Chou J-H. Integrating Taguchi Method and Gray Relational Analysis for Auto Locks by Using Multiobjective Design in Computer-Aided Engineering. Polymers. 2022; 14(3):644. https://0-doi-org.brum.beds.ac.uk/10.3390/polym14030644
Chicago/Turabian StyleHuang, Wei-Tai, Zi-Yun Tasi, Wen-Hsien Ho, and Jyh-Horng Chou. 2022. "Integrating Taguchi Method and Gray Relational Analysis for Auto Locks by Using Multiobjective Design in Computer-Aided Engineering" Polymers 14, no. 3: 644. https://0-doi-org.brum.beds.ac.uk/10.3390/polym14030644