
Utilizing Biomass-Based Graphene Oxide–Polyaniline–Ag Electrodes in Microbial Fuel Cells to Boost Energy Generation and Heavy Metal Removal

 , , , ,
  ,
,
Abstract
:1. Introduction
2. Method and Materials
2.1. Chemical Reagents
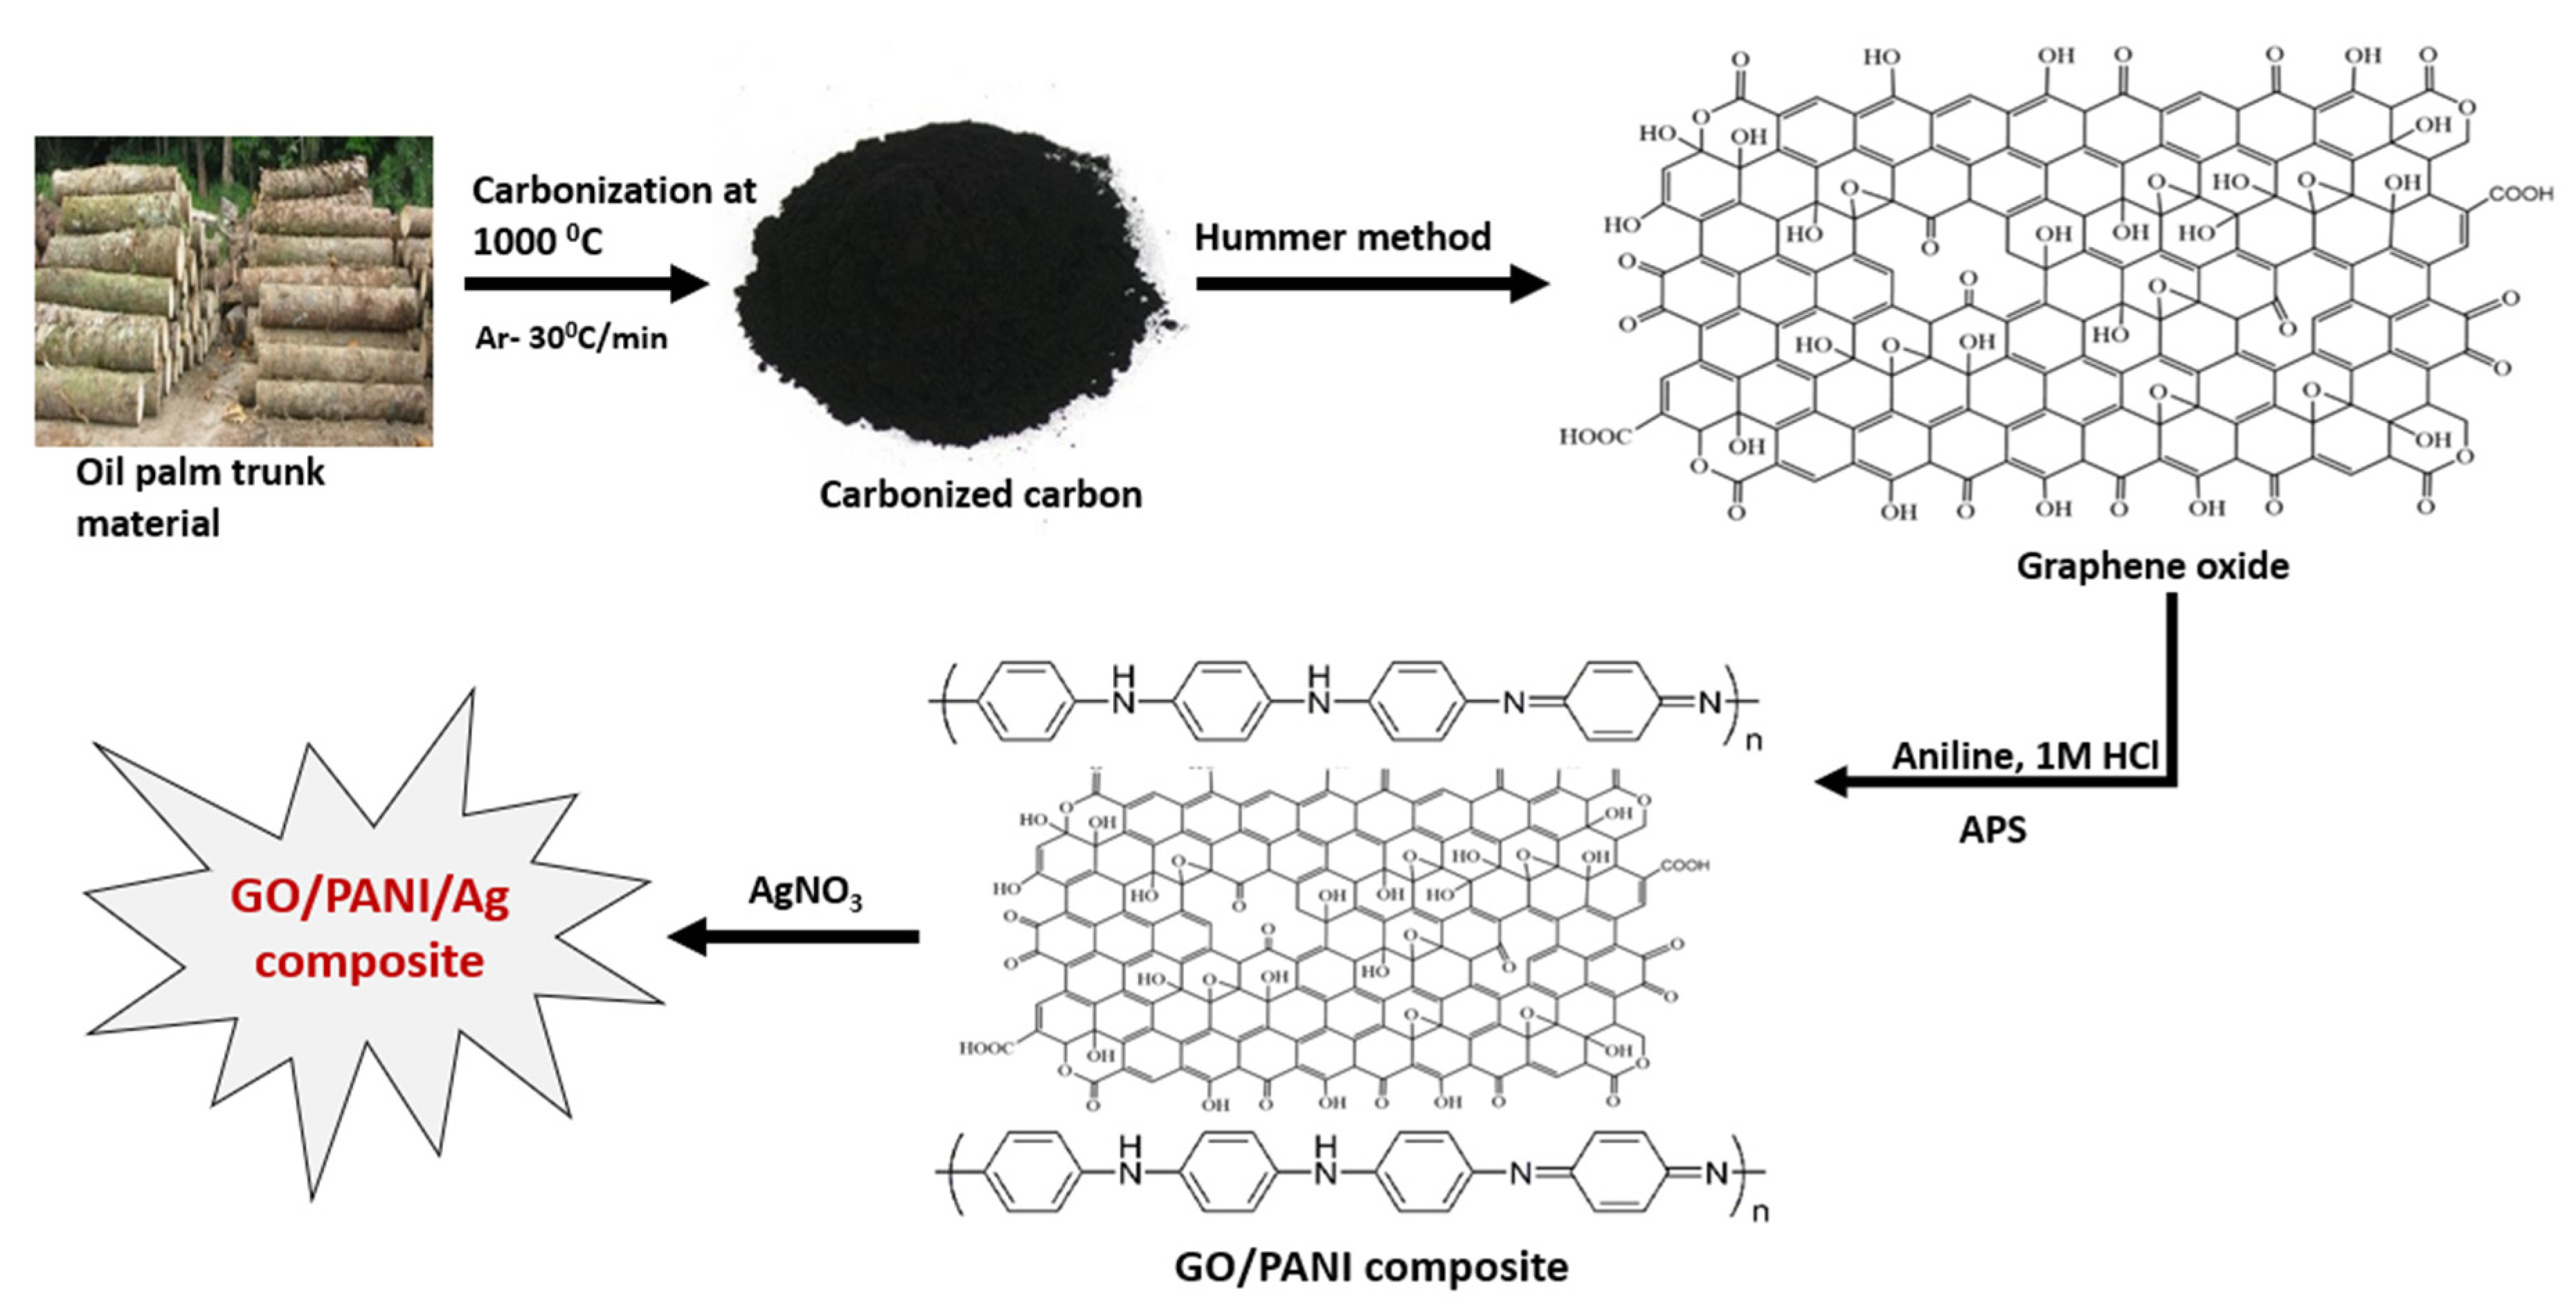
2.2. Preparation of Carbonized Carbon and Synthesis of GO
2.3. Preparation of GO–PANI–Ag Composite
2.4. Material Characterization
2.5. Fabrication of the Anode Electrode
2.6. Operation of MFCs
2.6.1. Inoculation Source
2.6.2. Configuration and Operation of MFCs
2.7. Electrochemical Tests
2.8. Removal Efficiency and Anode Morphology
2.9. Bacterial Identification from Anode Surface
2.10. Different Parameter Optimization
3. Results and Discussion
3.1. Material Characterizations
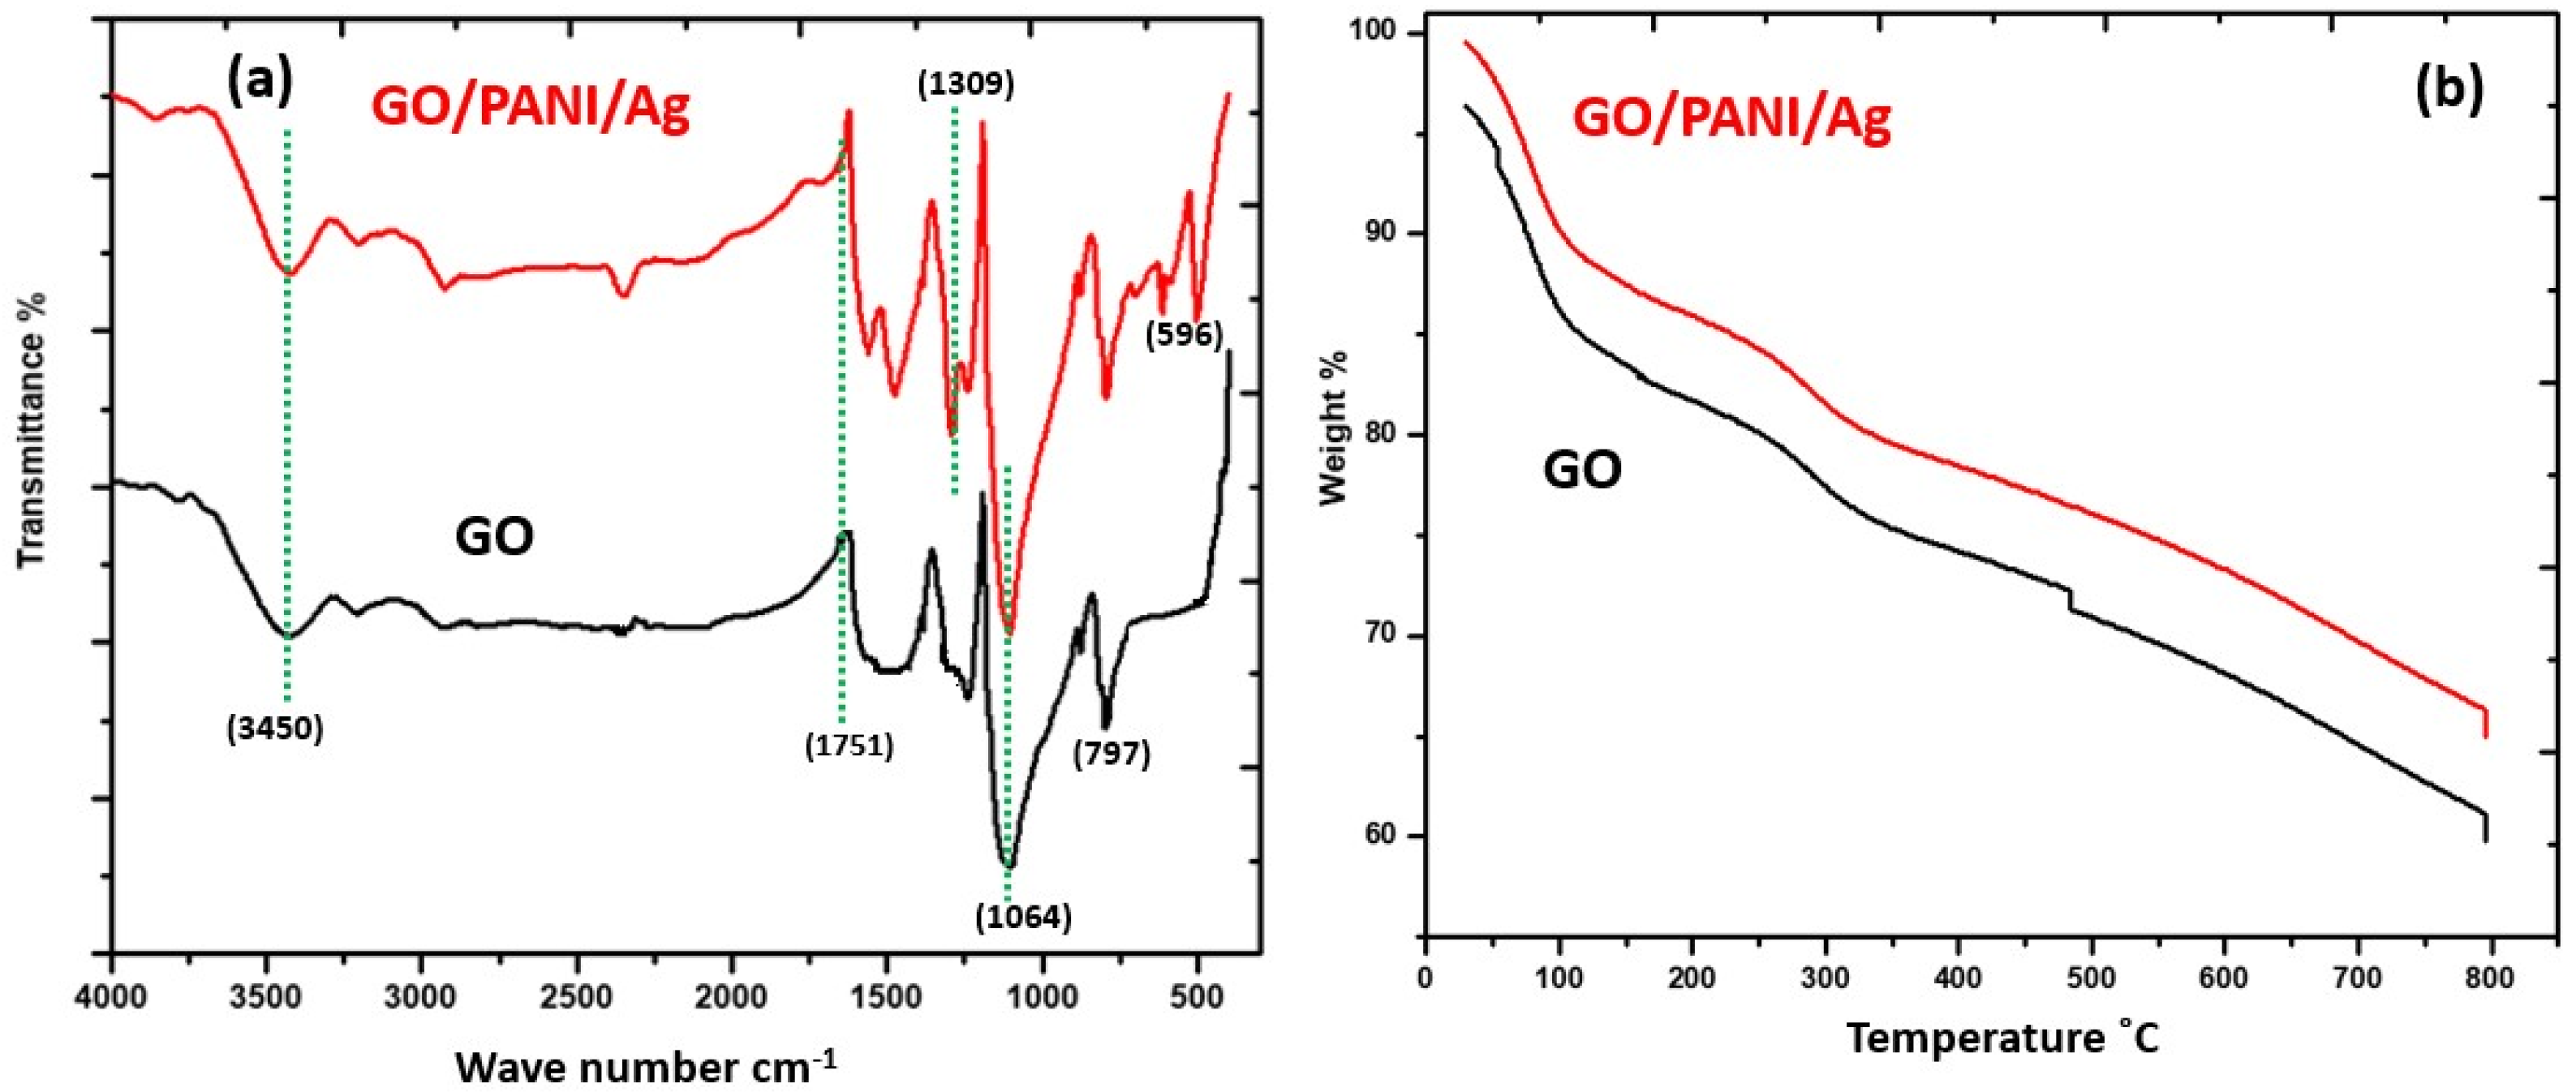
3.1.1. FTIR Analysis
3.1.2. TGA Analysis
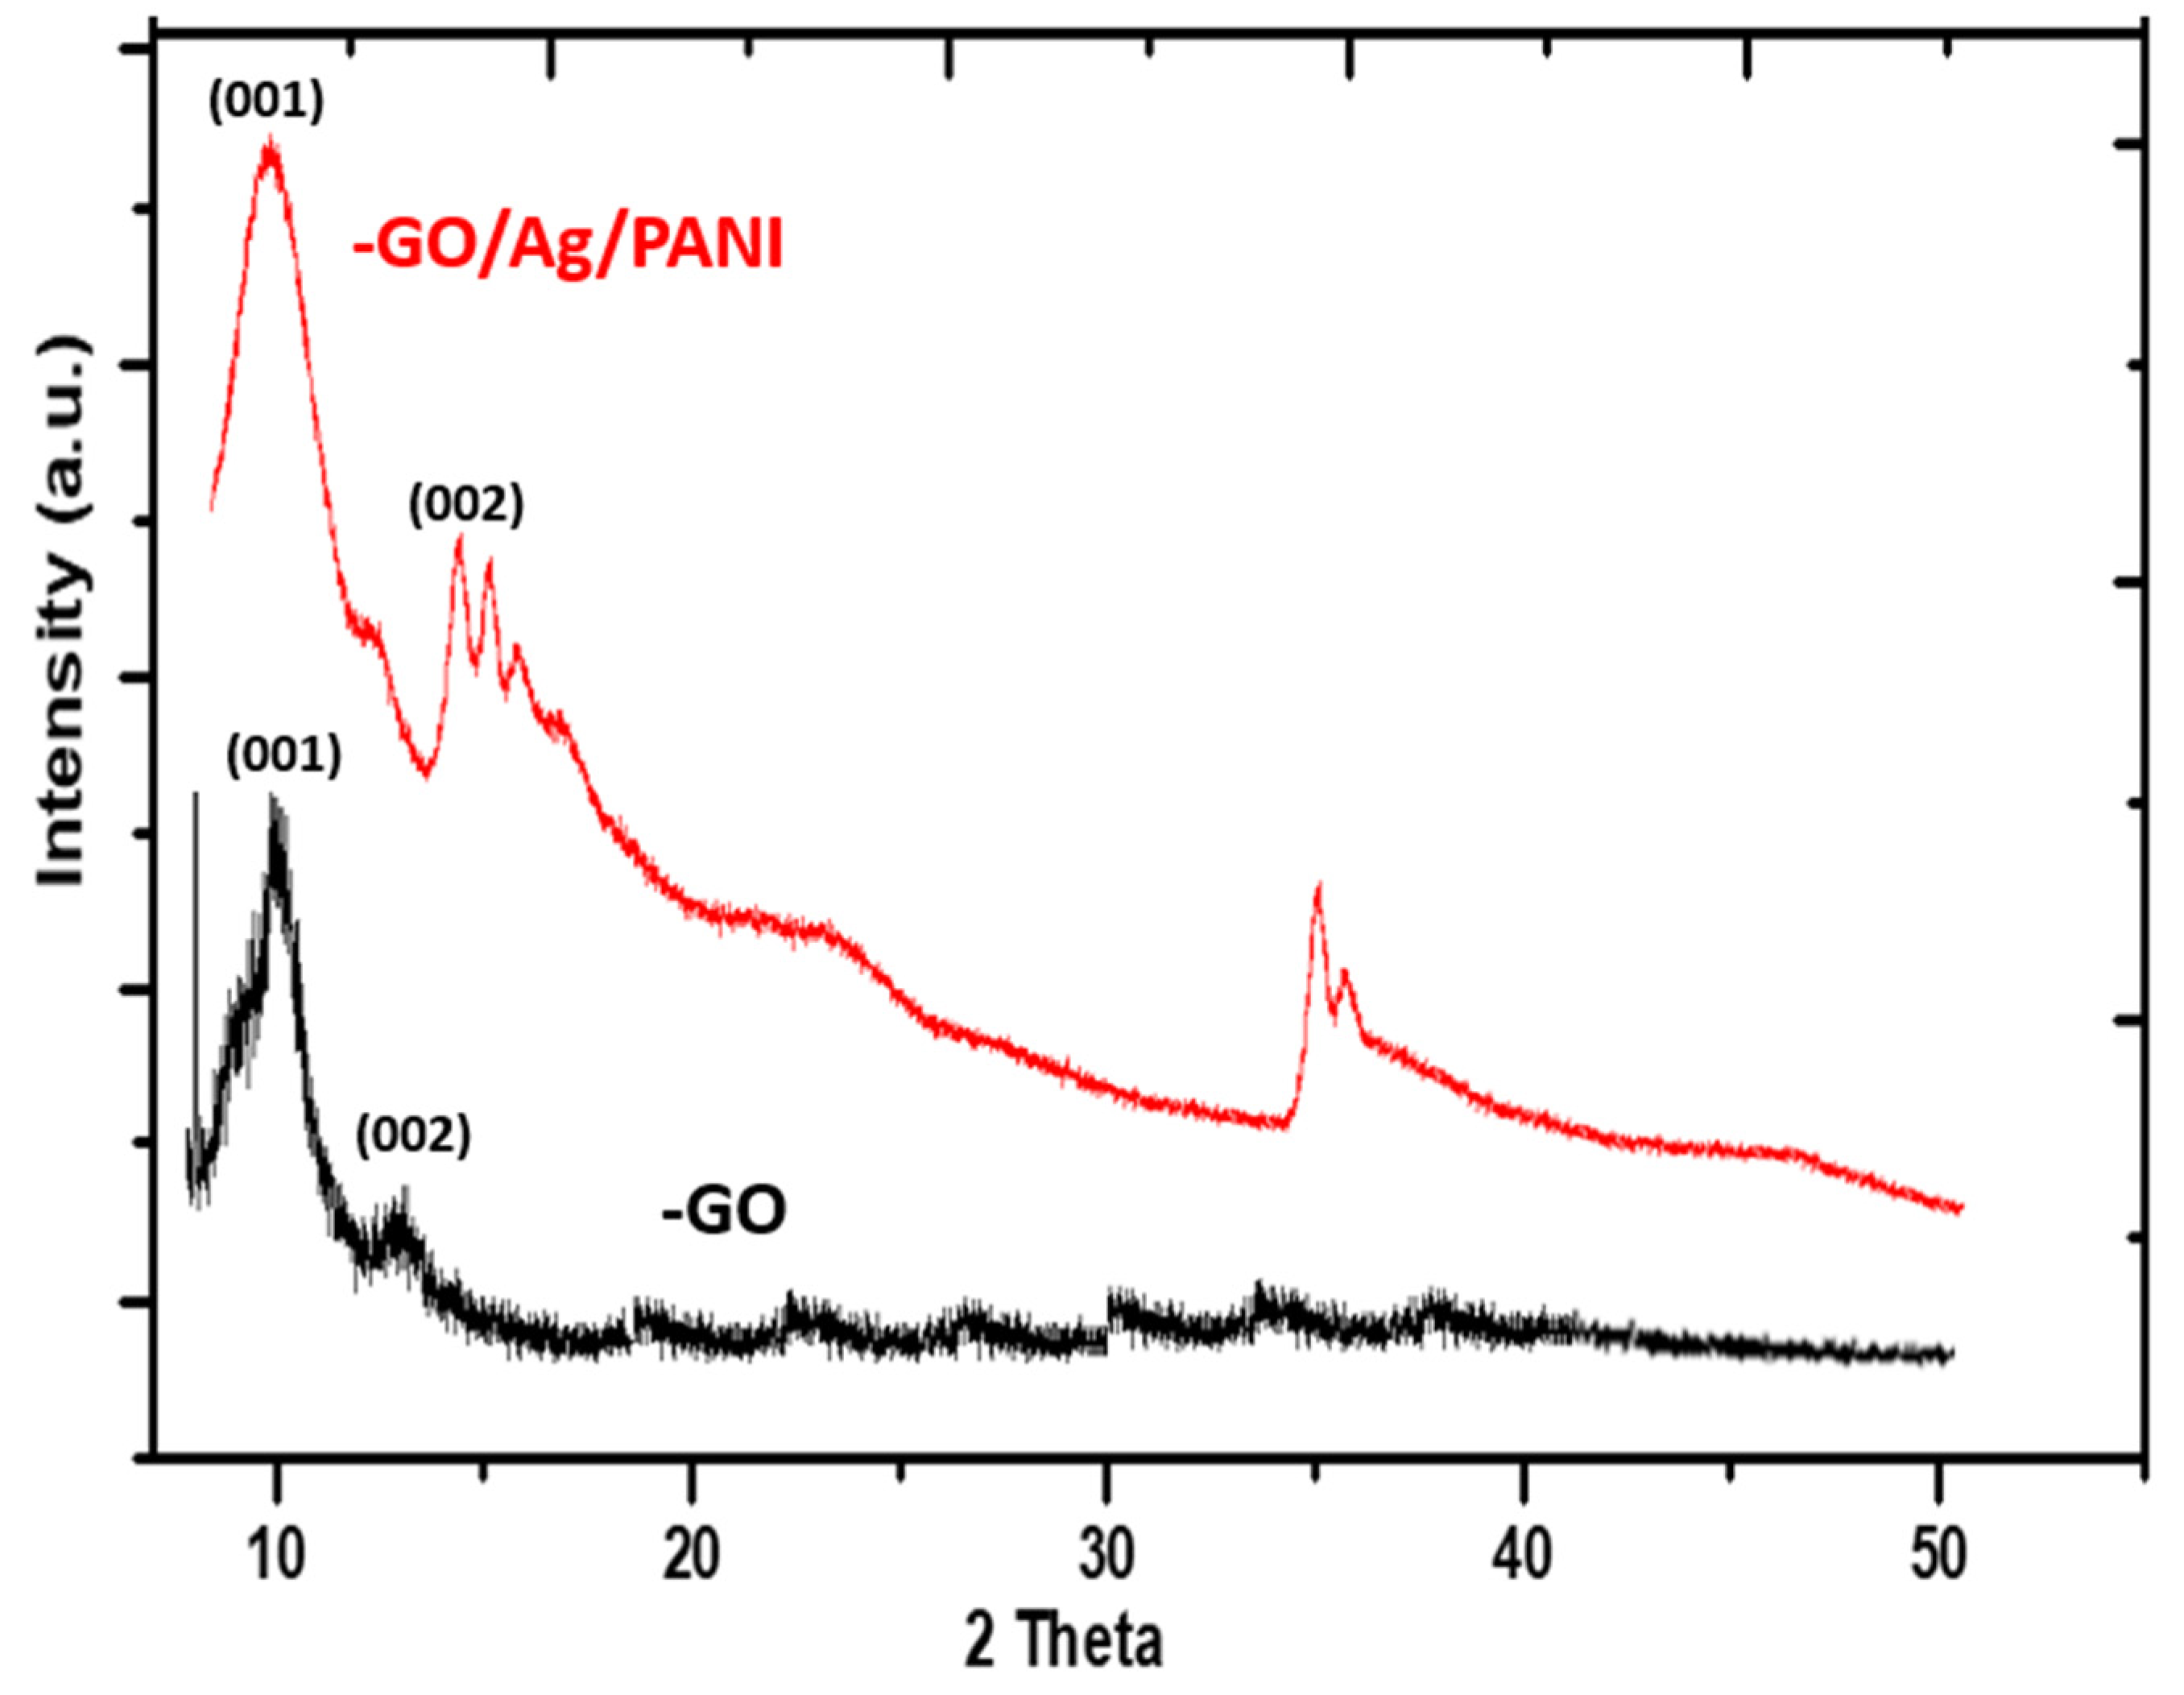
3.1.3. XRD Analysis
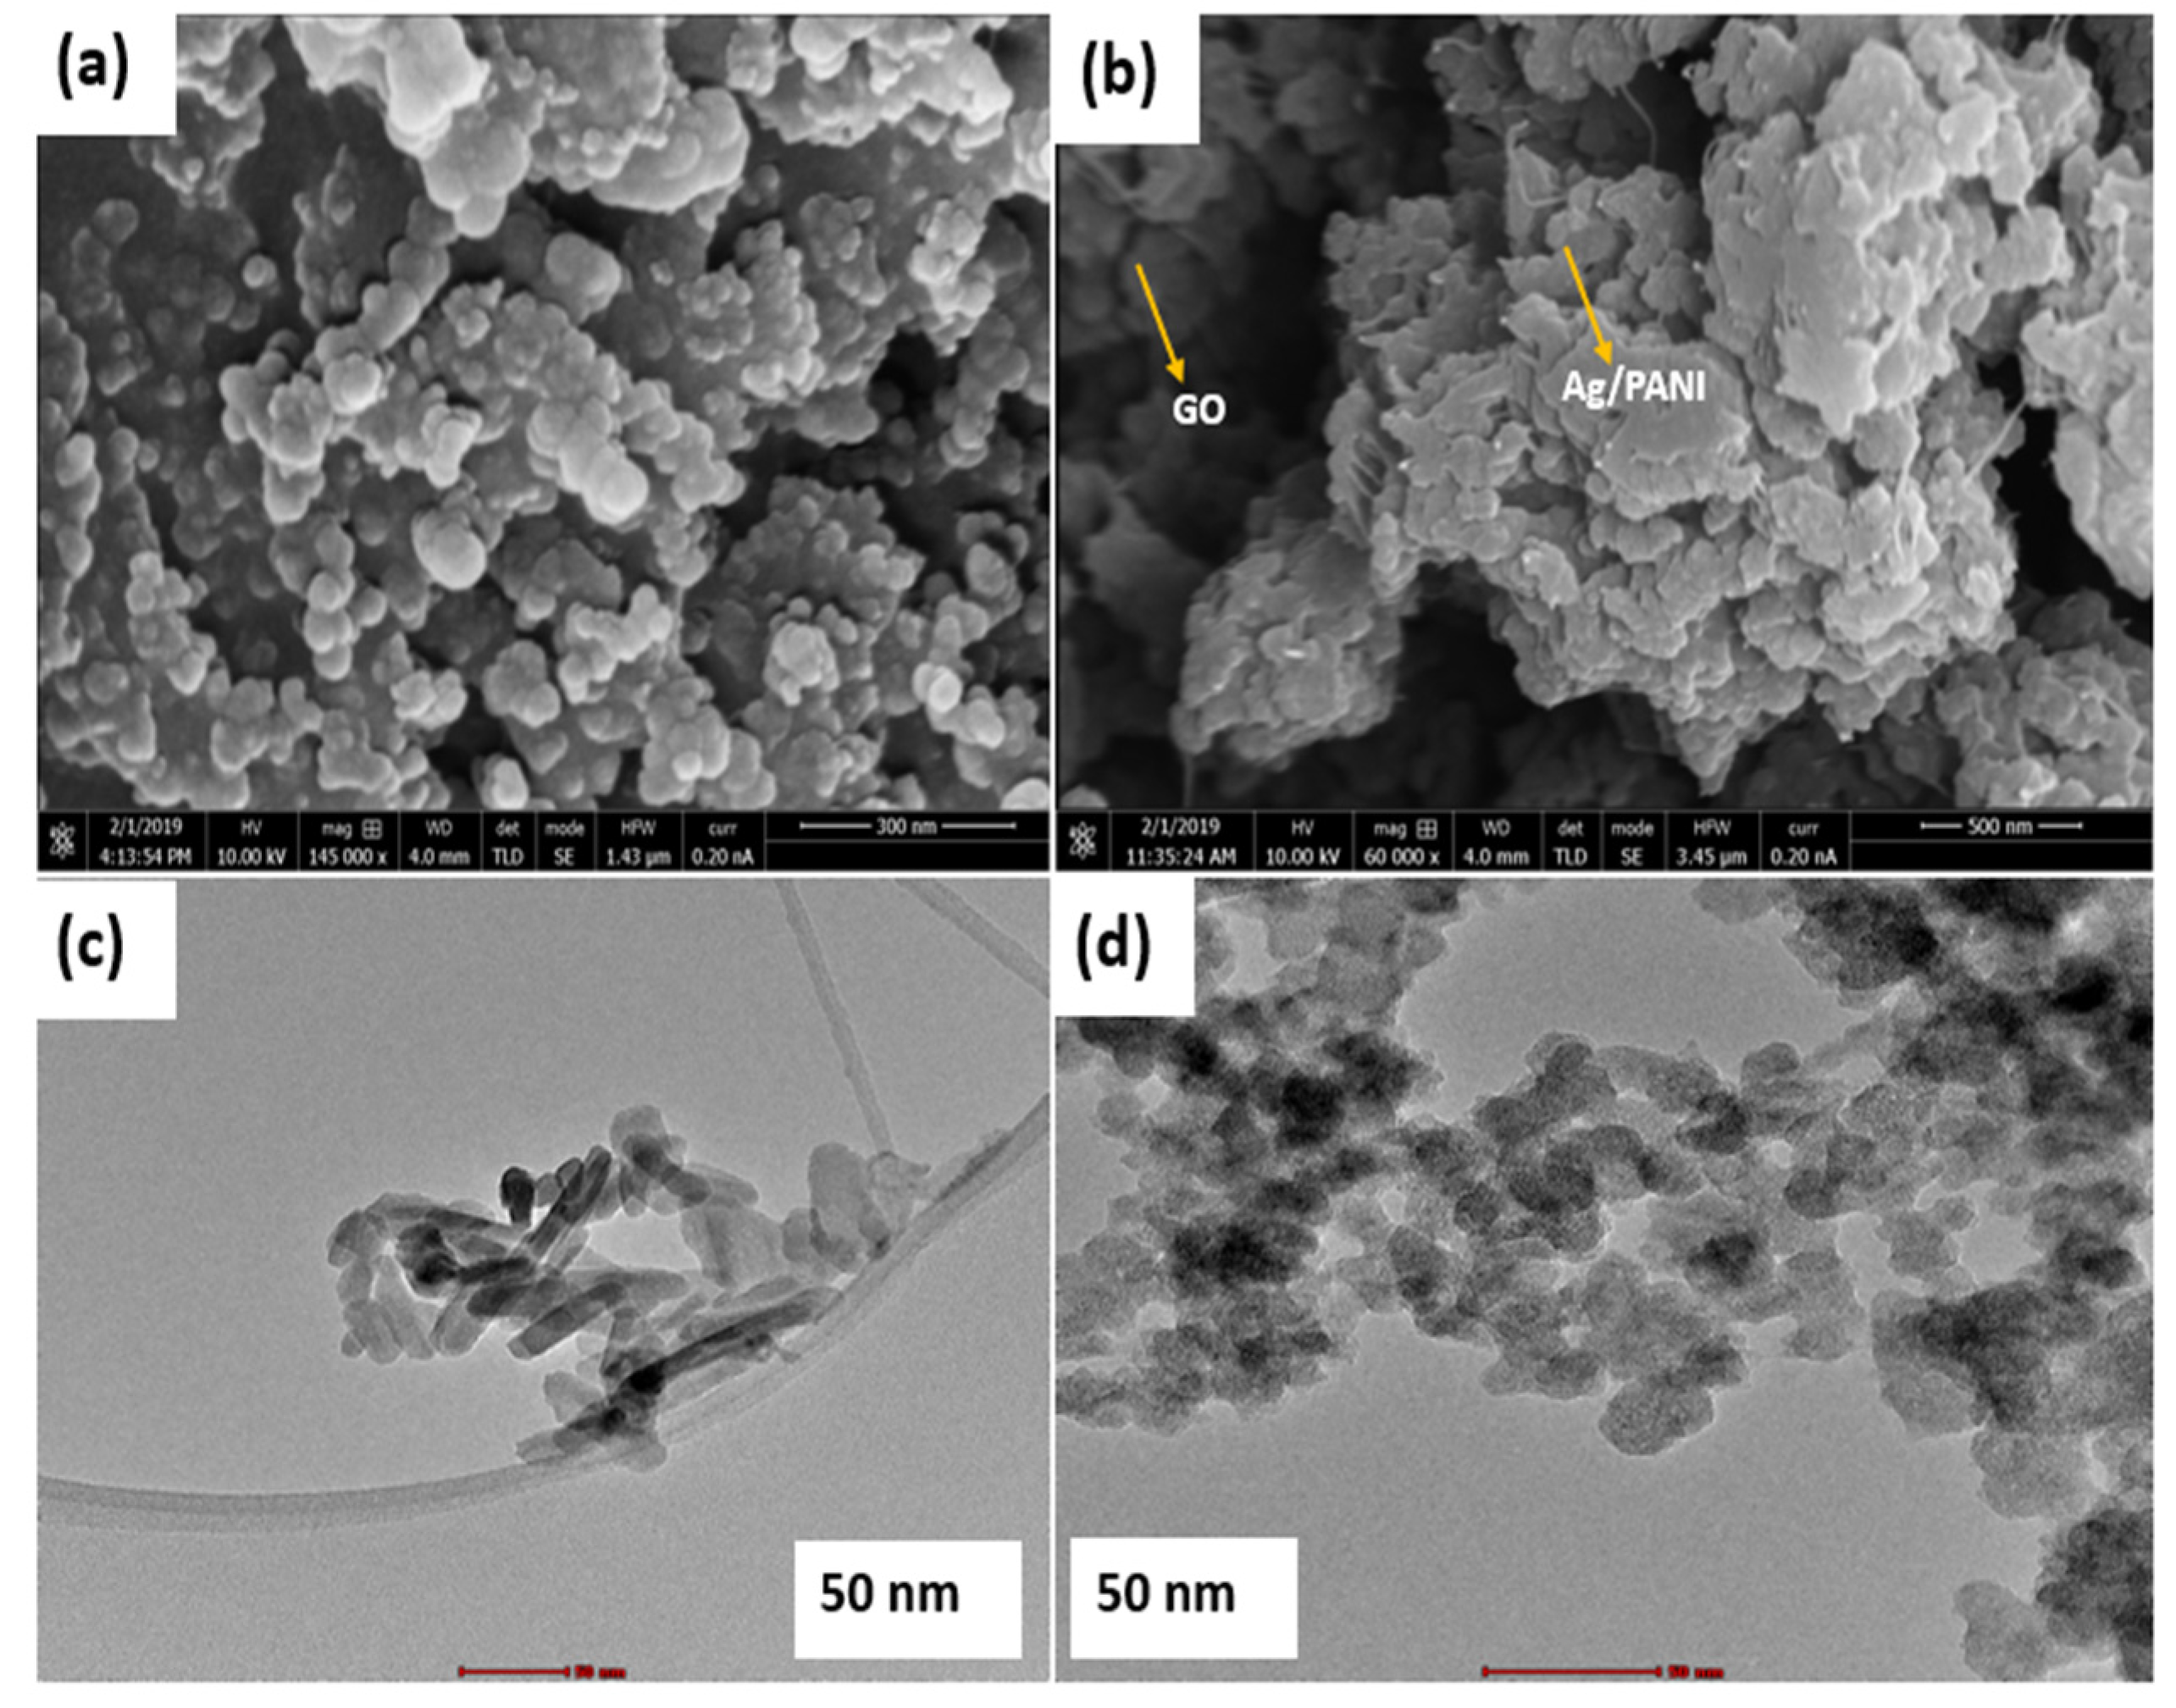
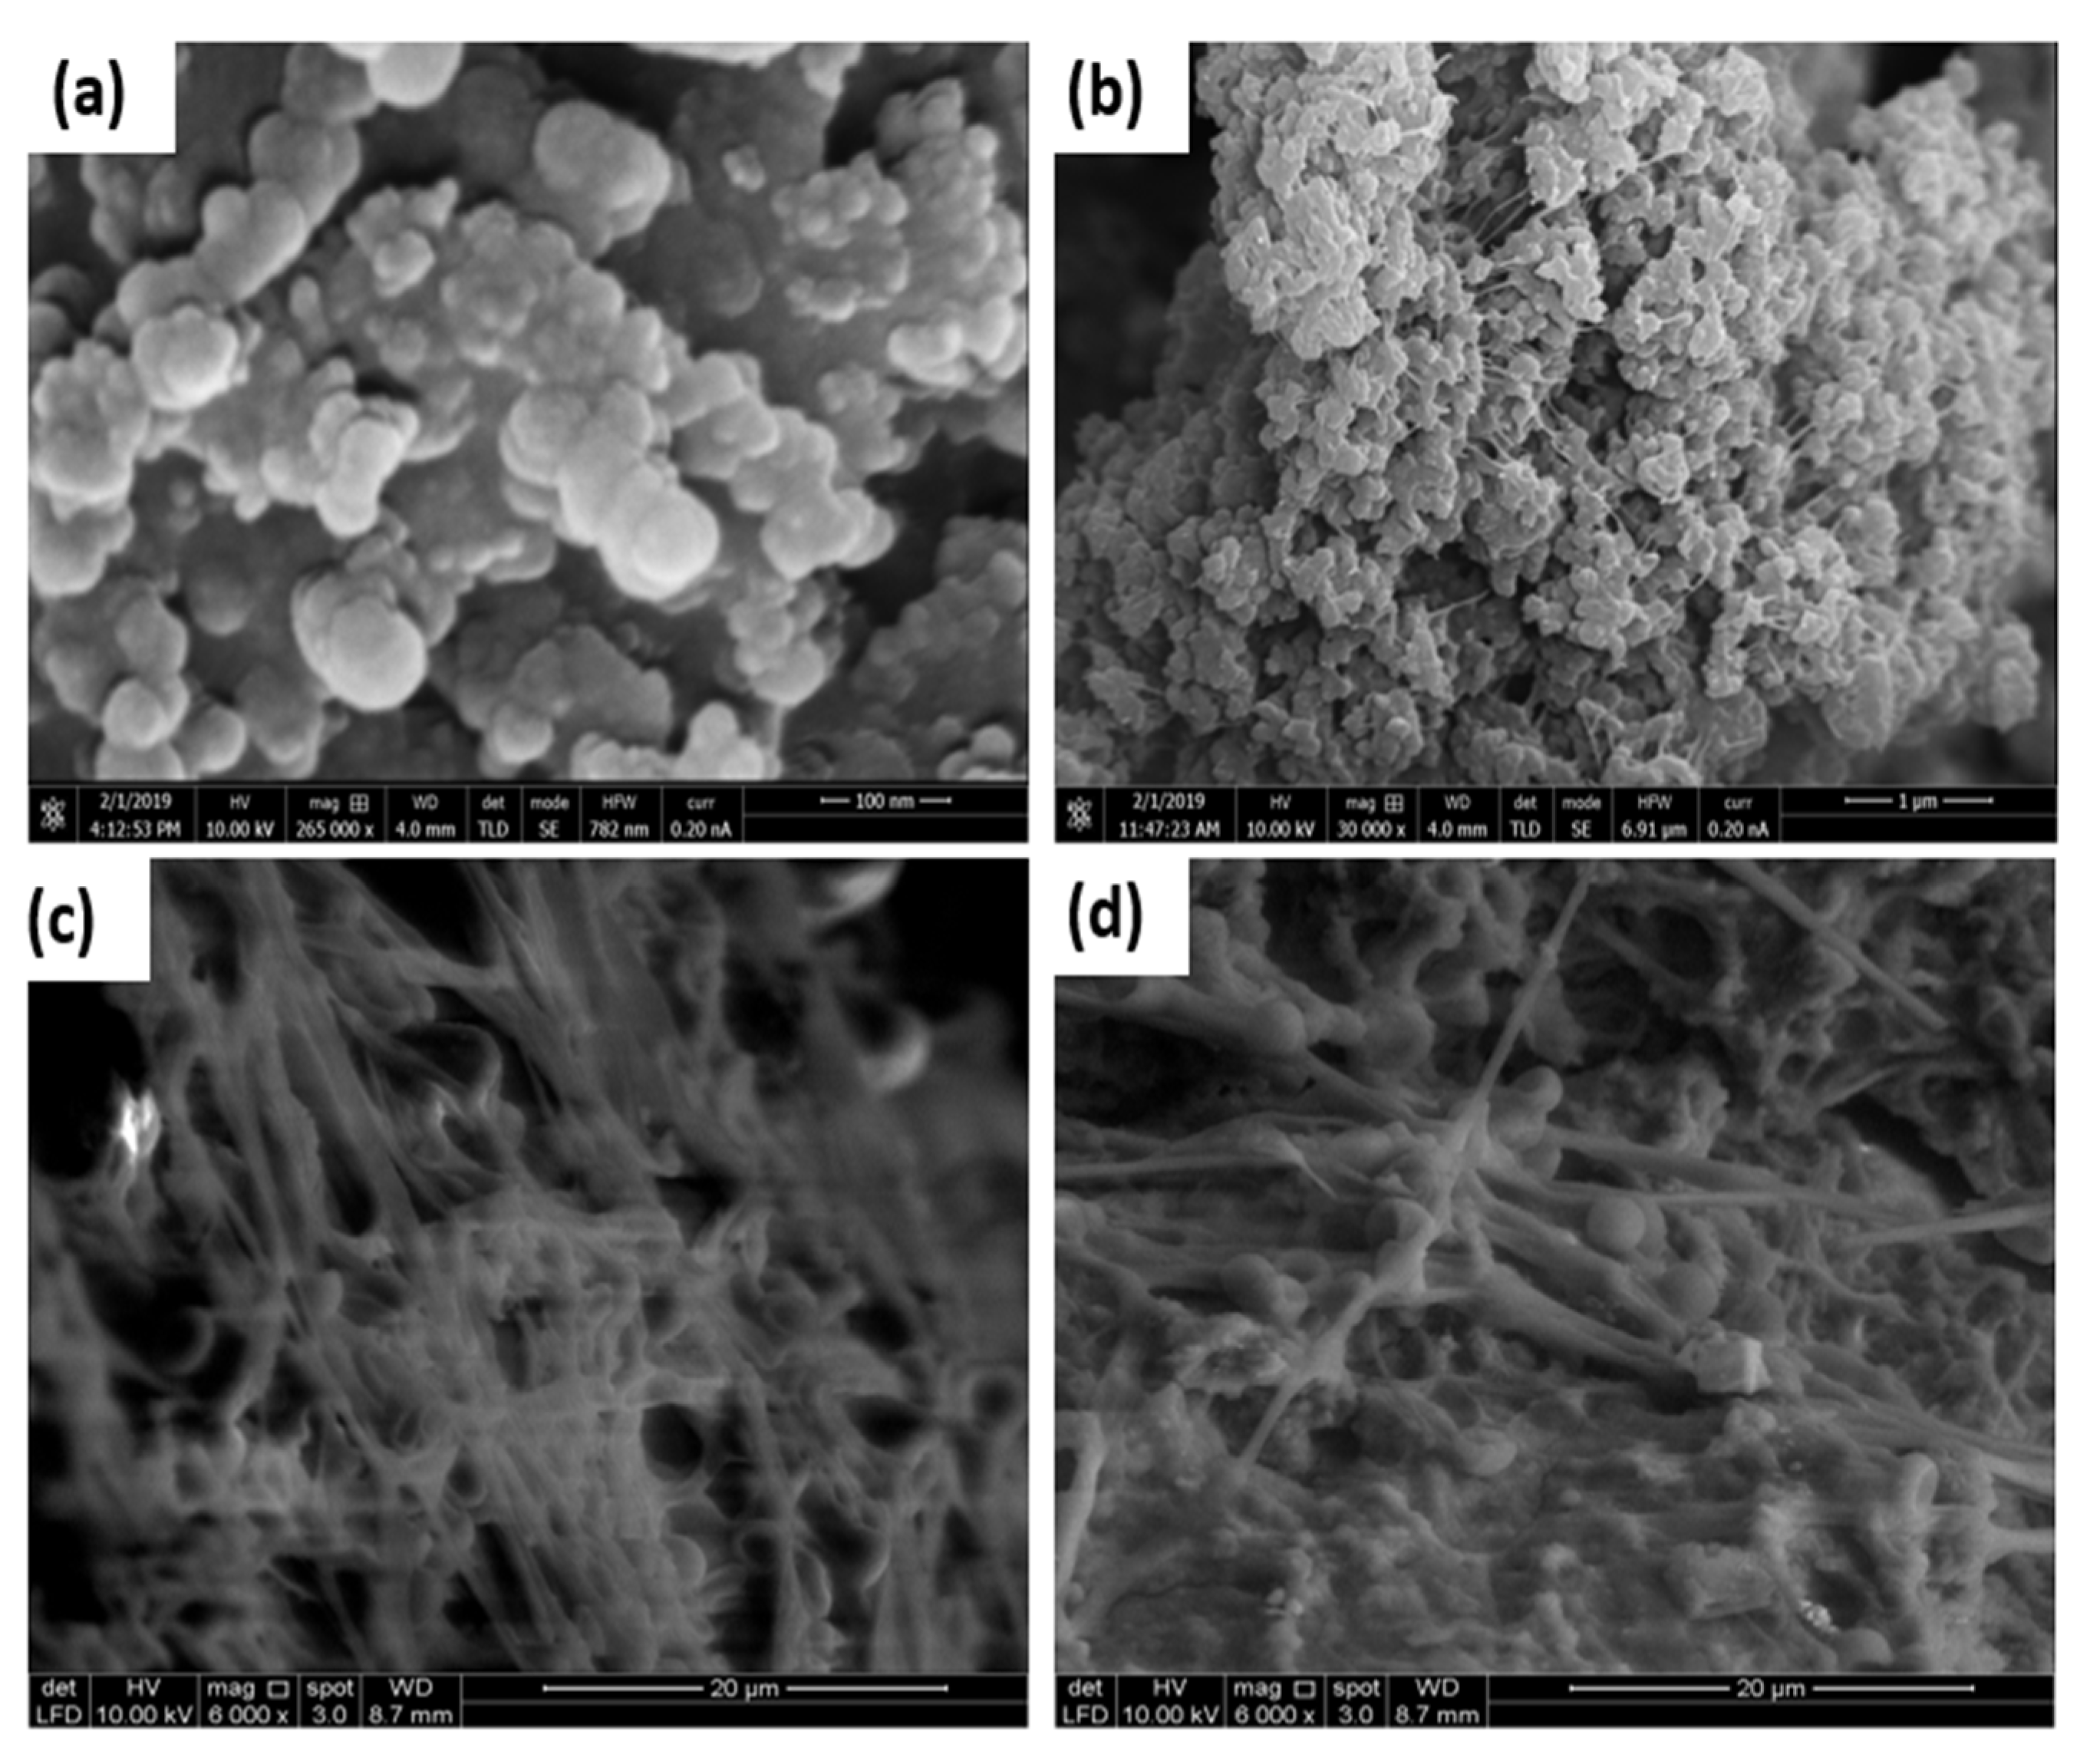
3.1.4. SEM and TEM Analysis
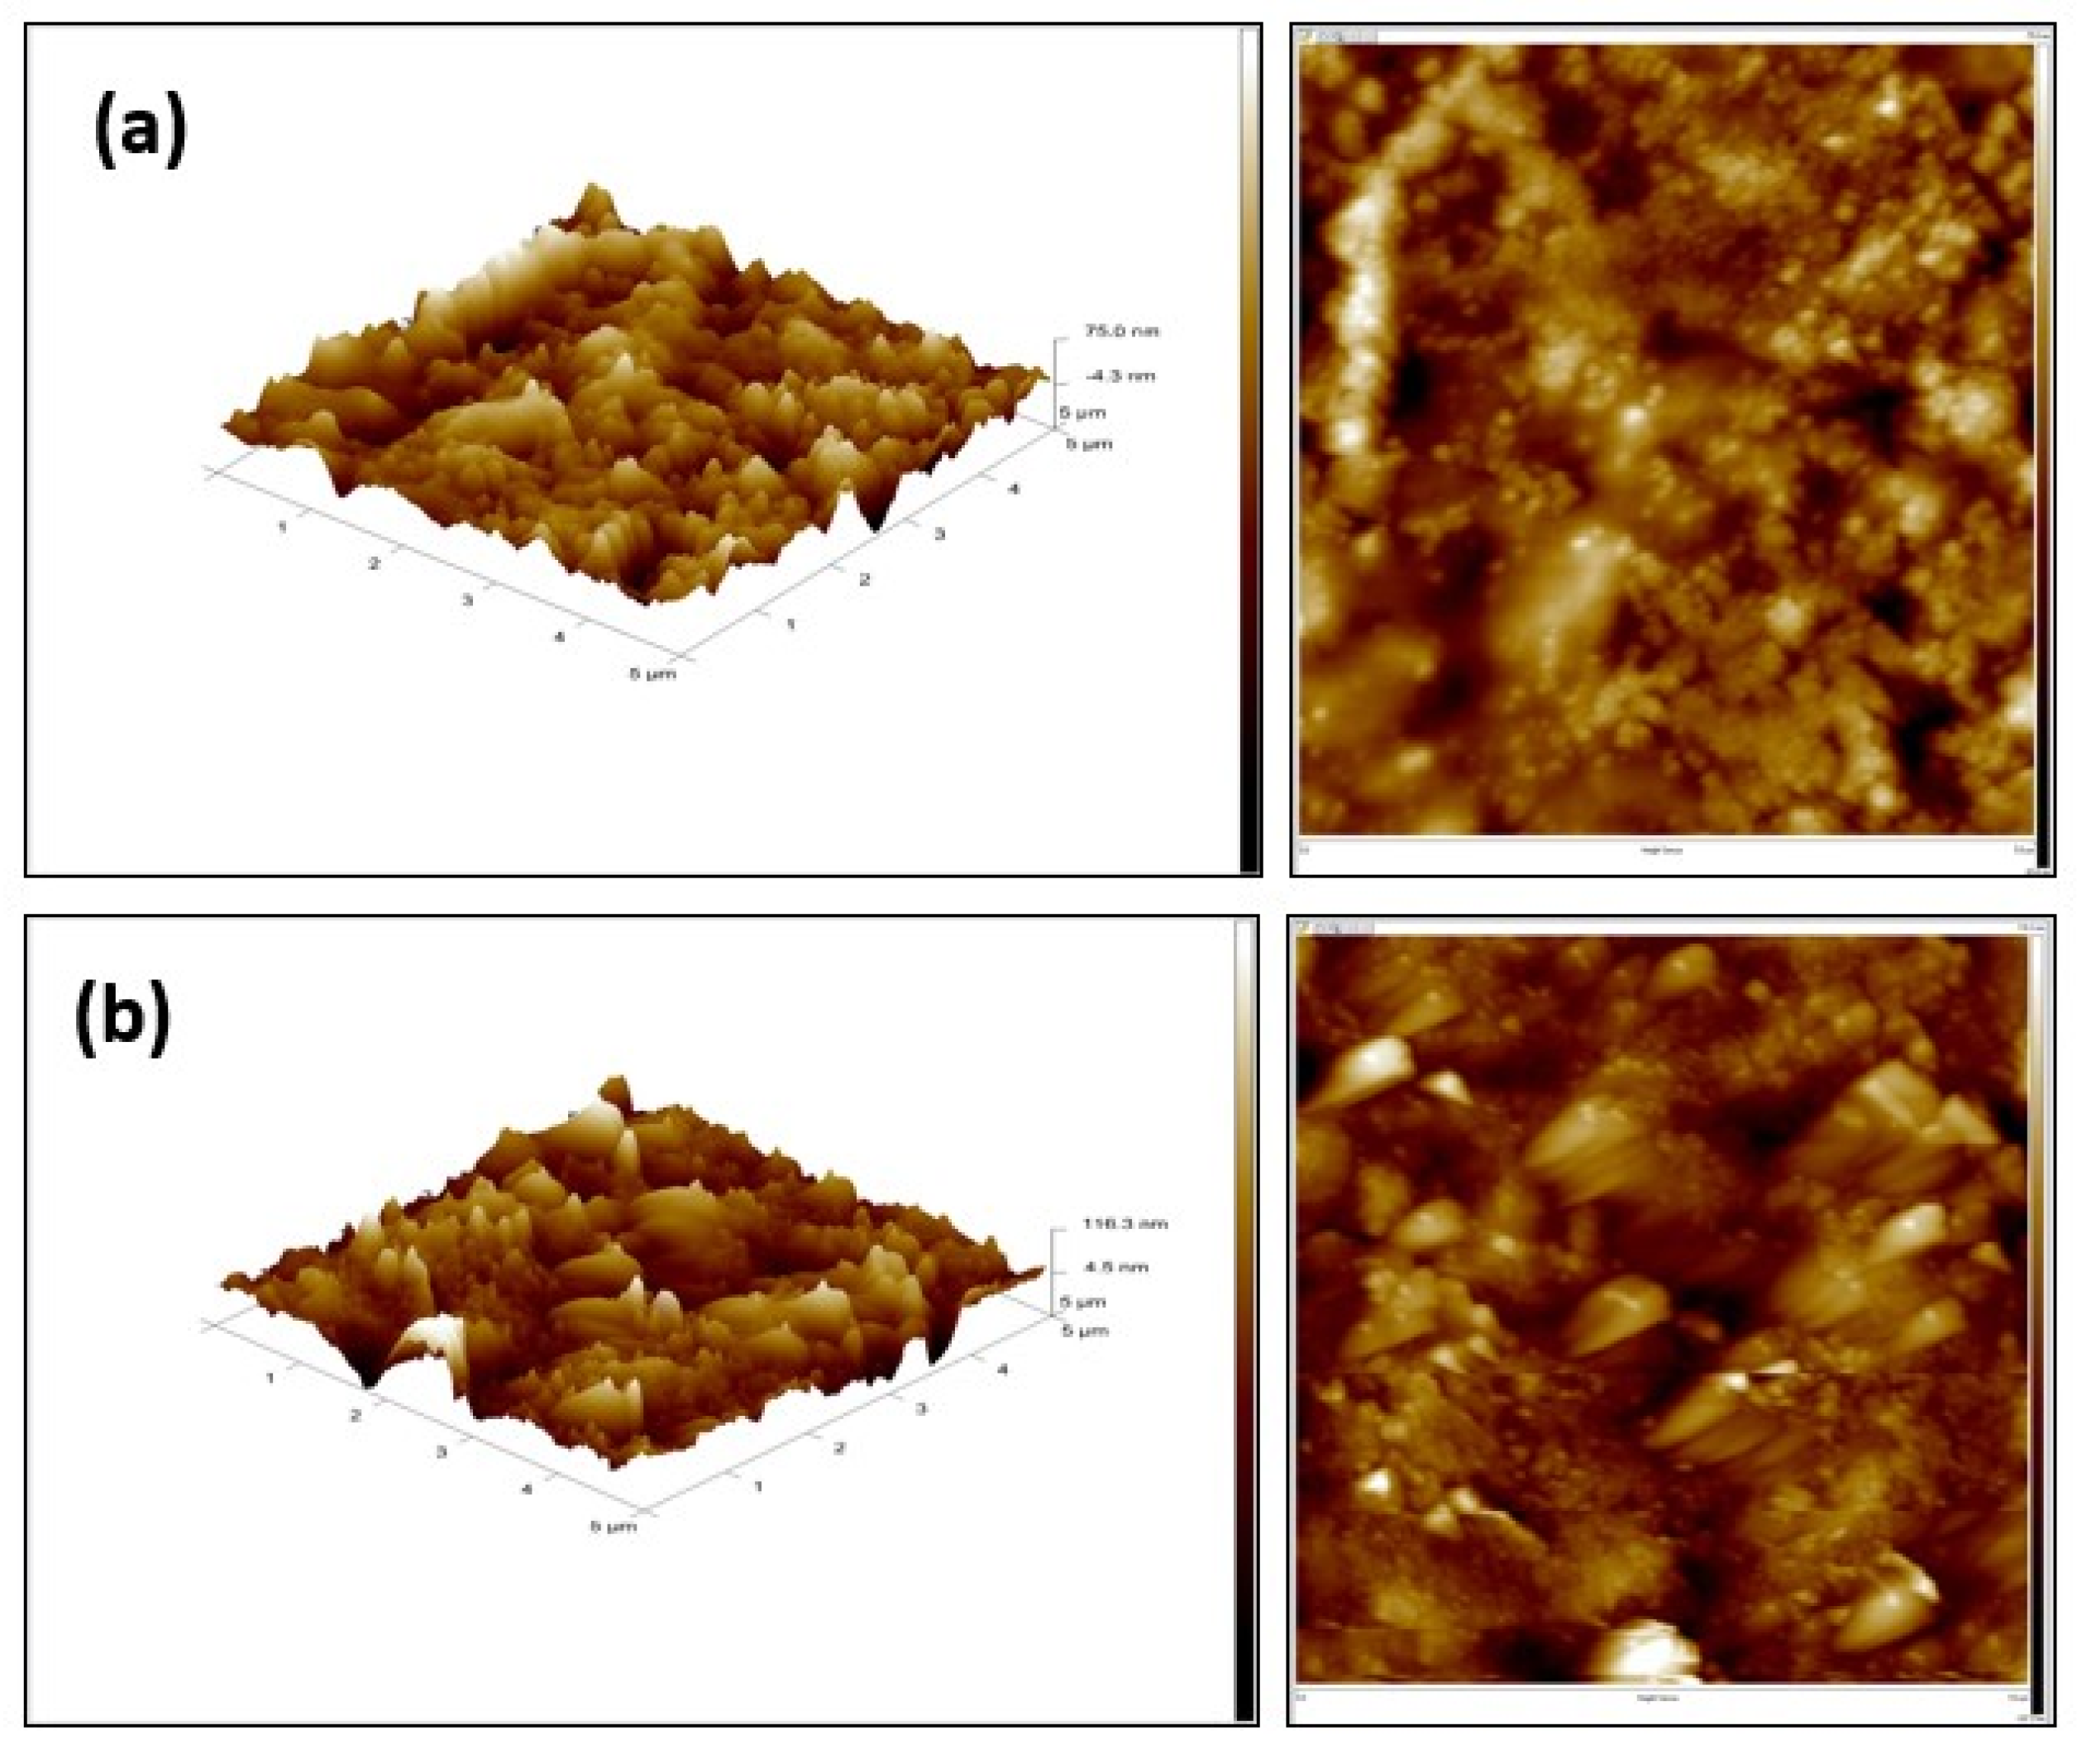
3.1.5. AFM Analysis
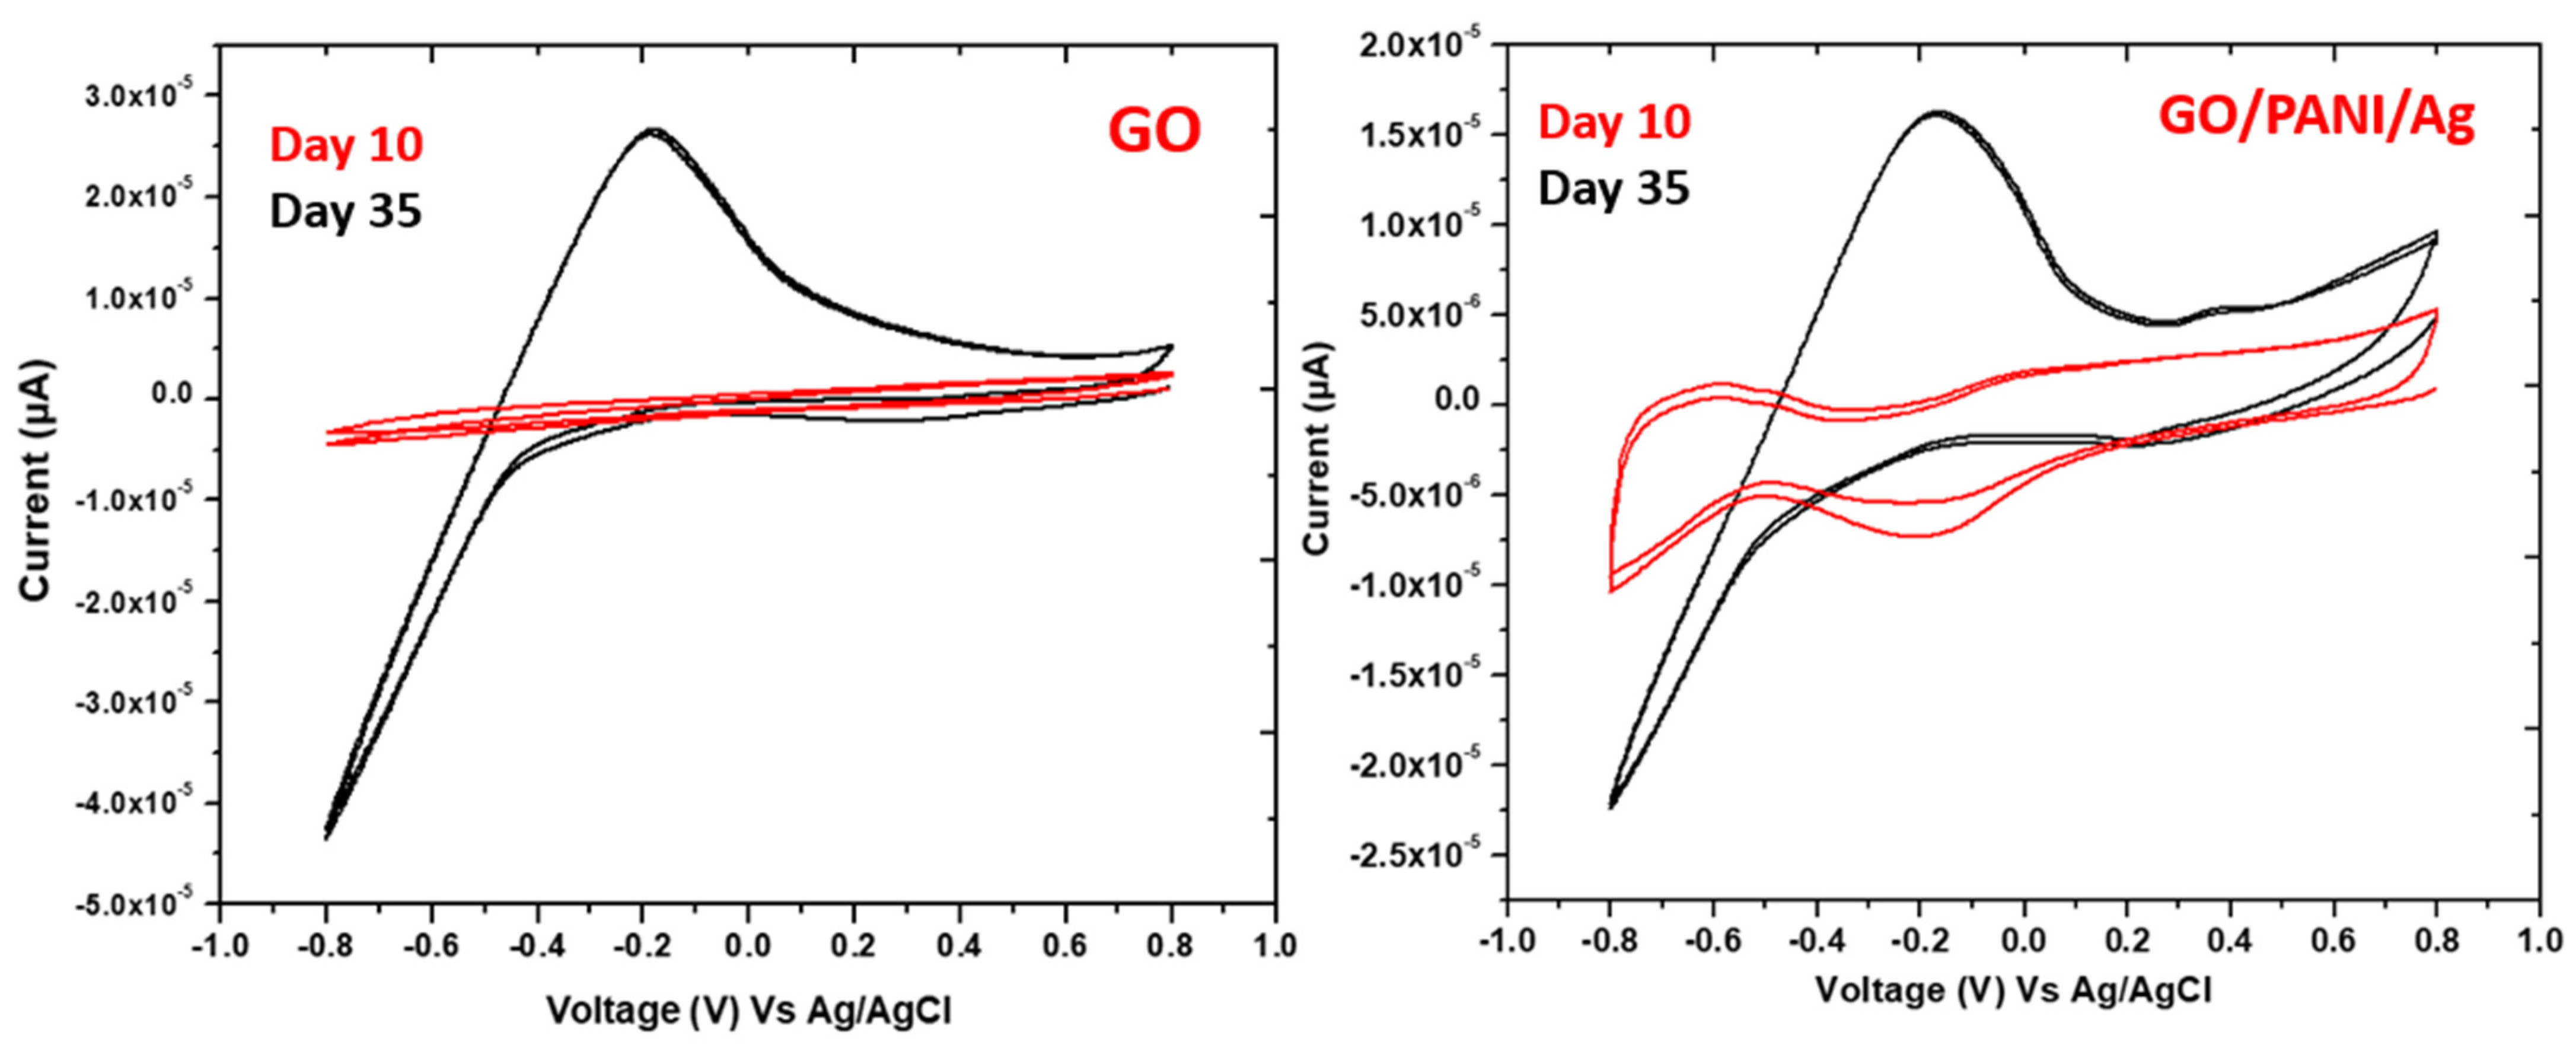
3.2. Electrochemical Trials Using the Fabricated Electrodes
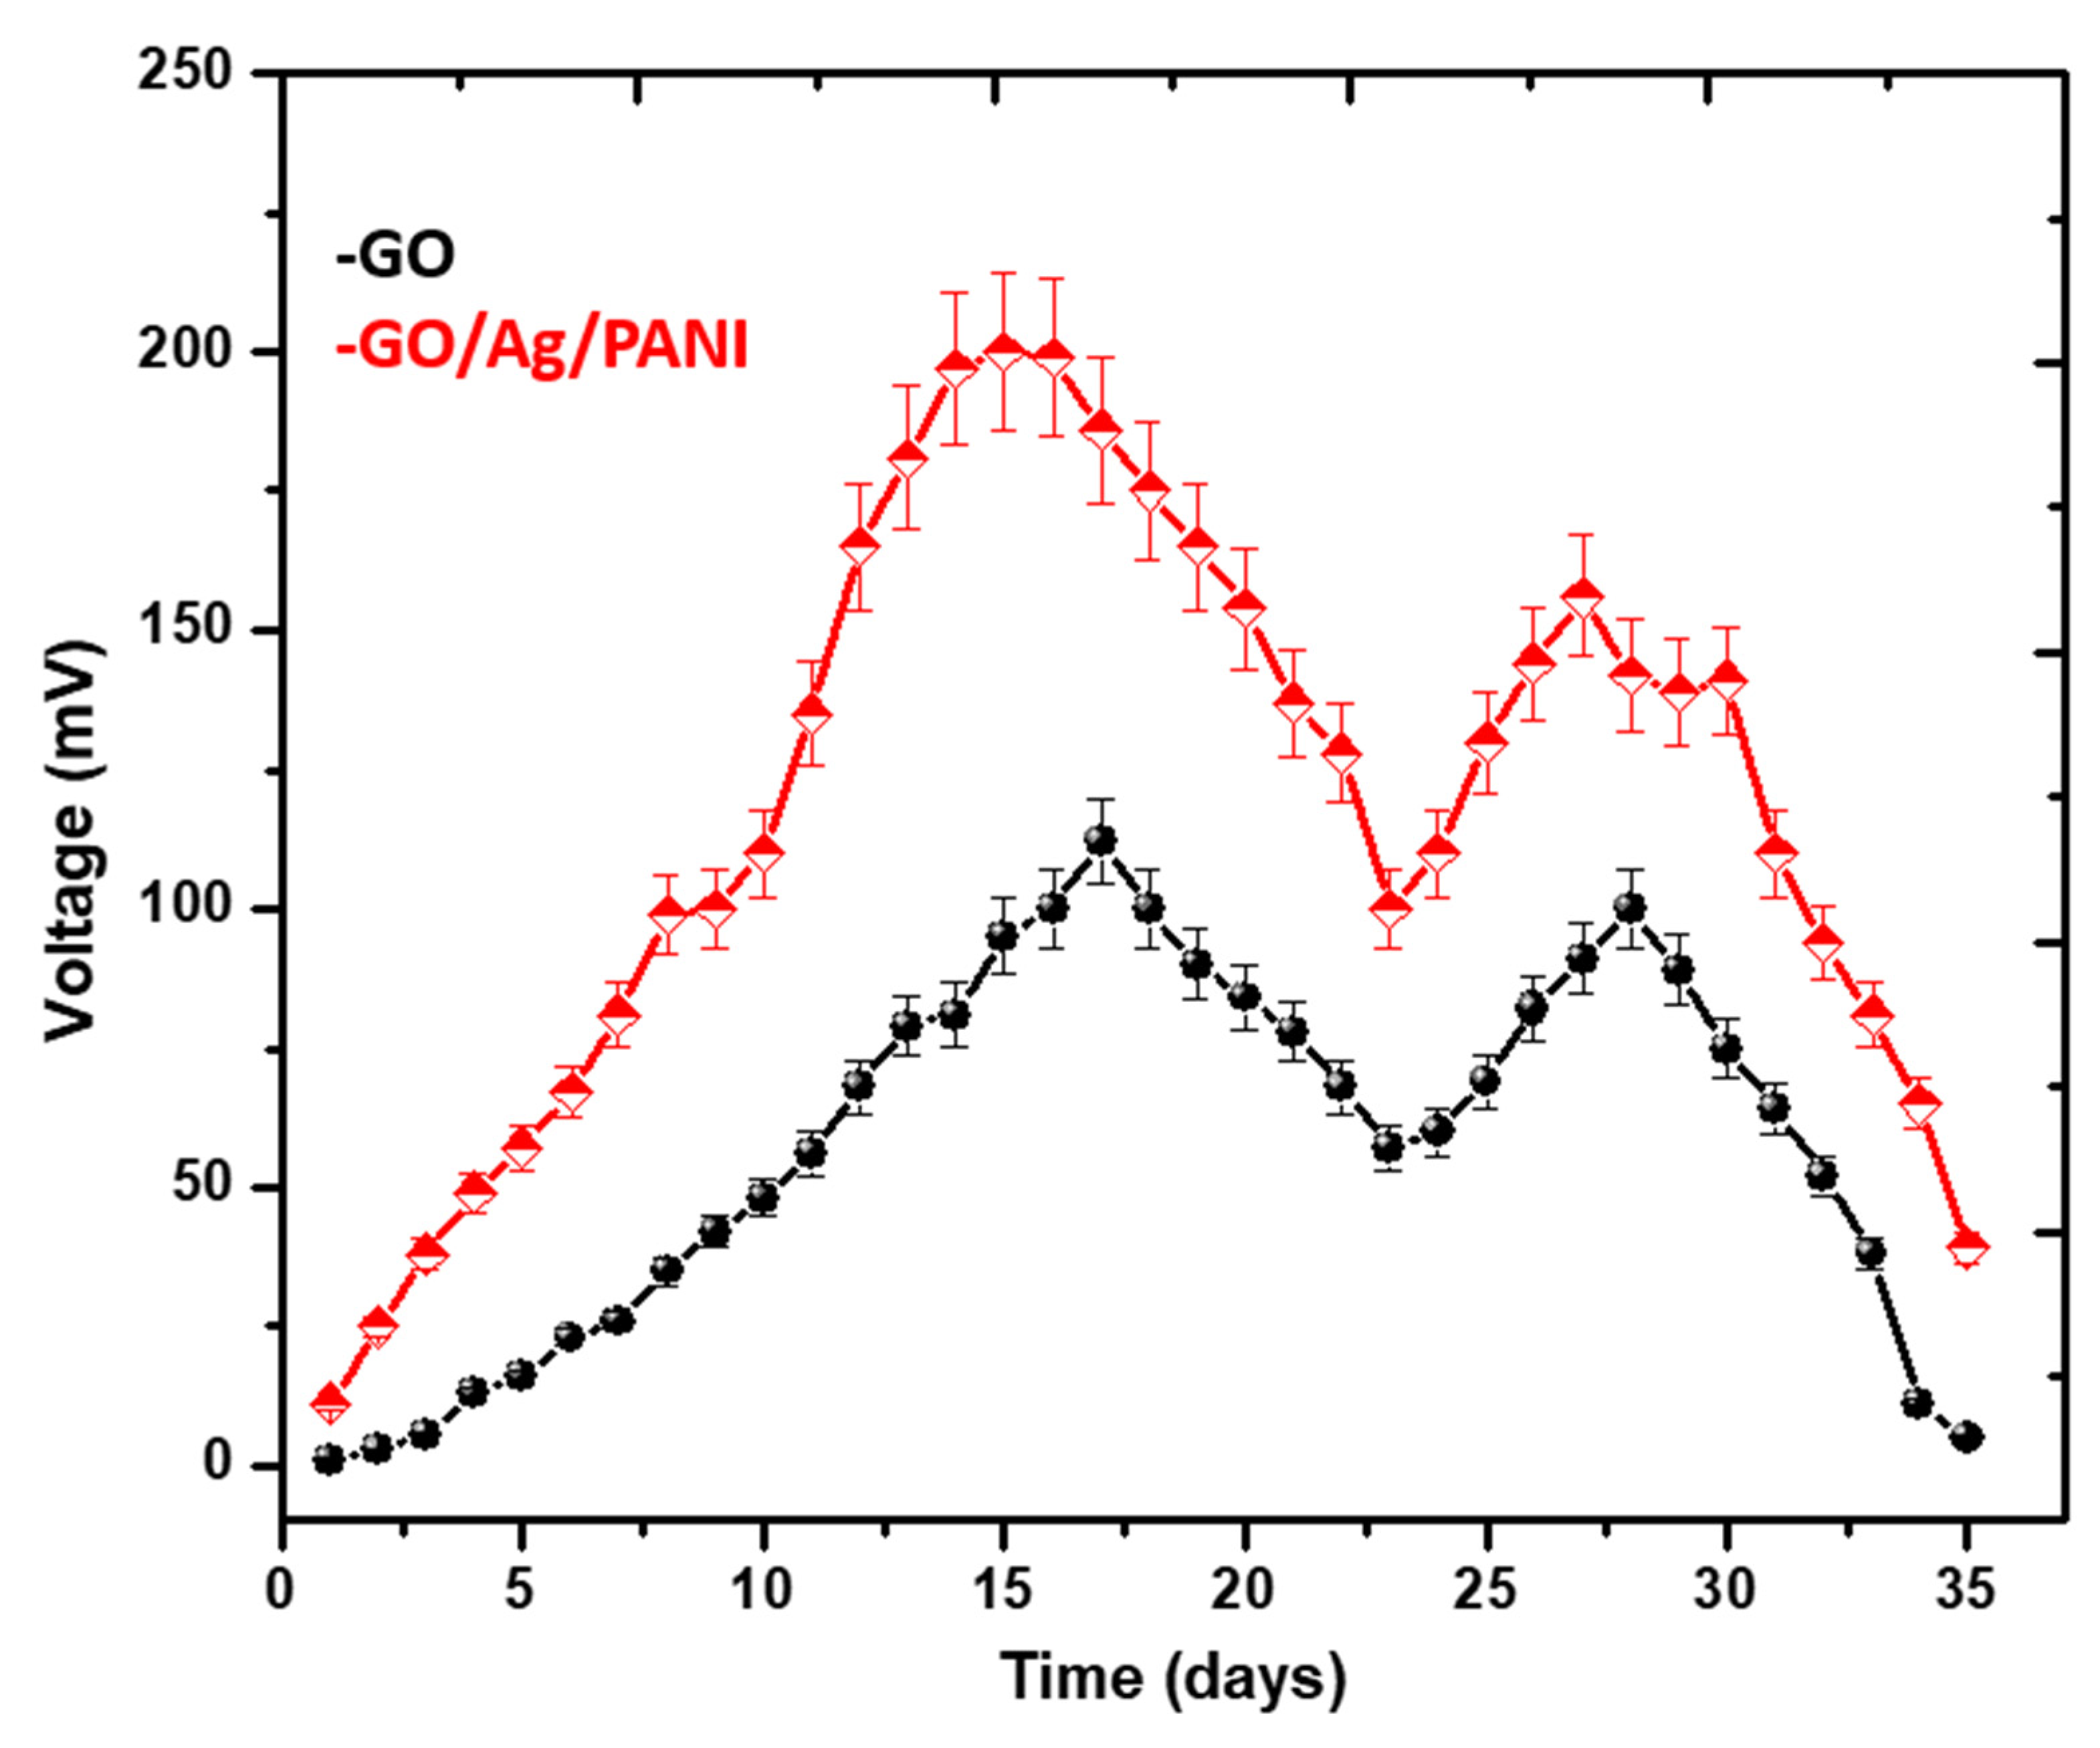
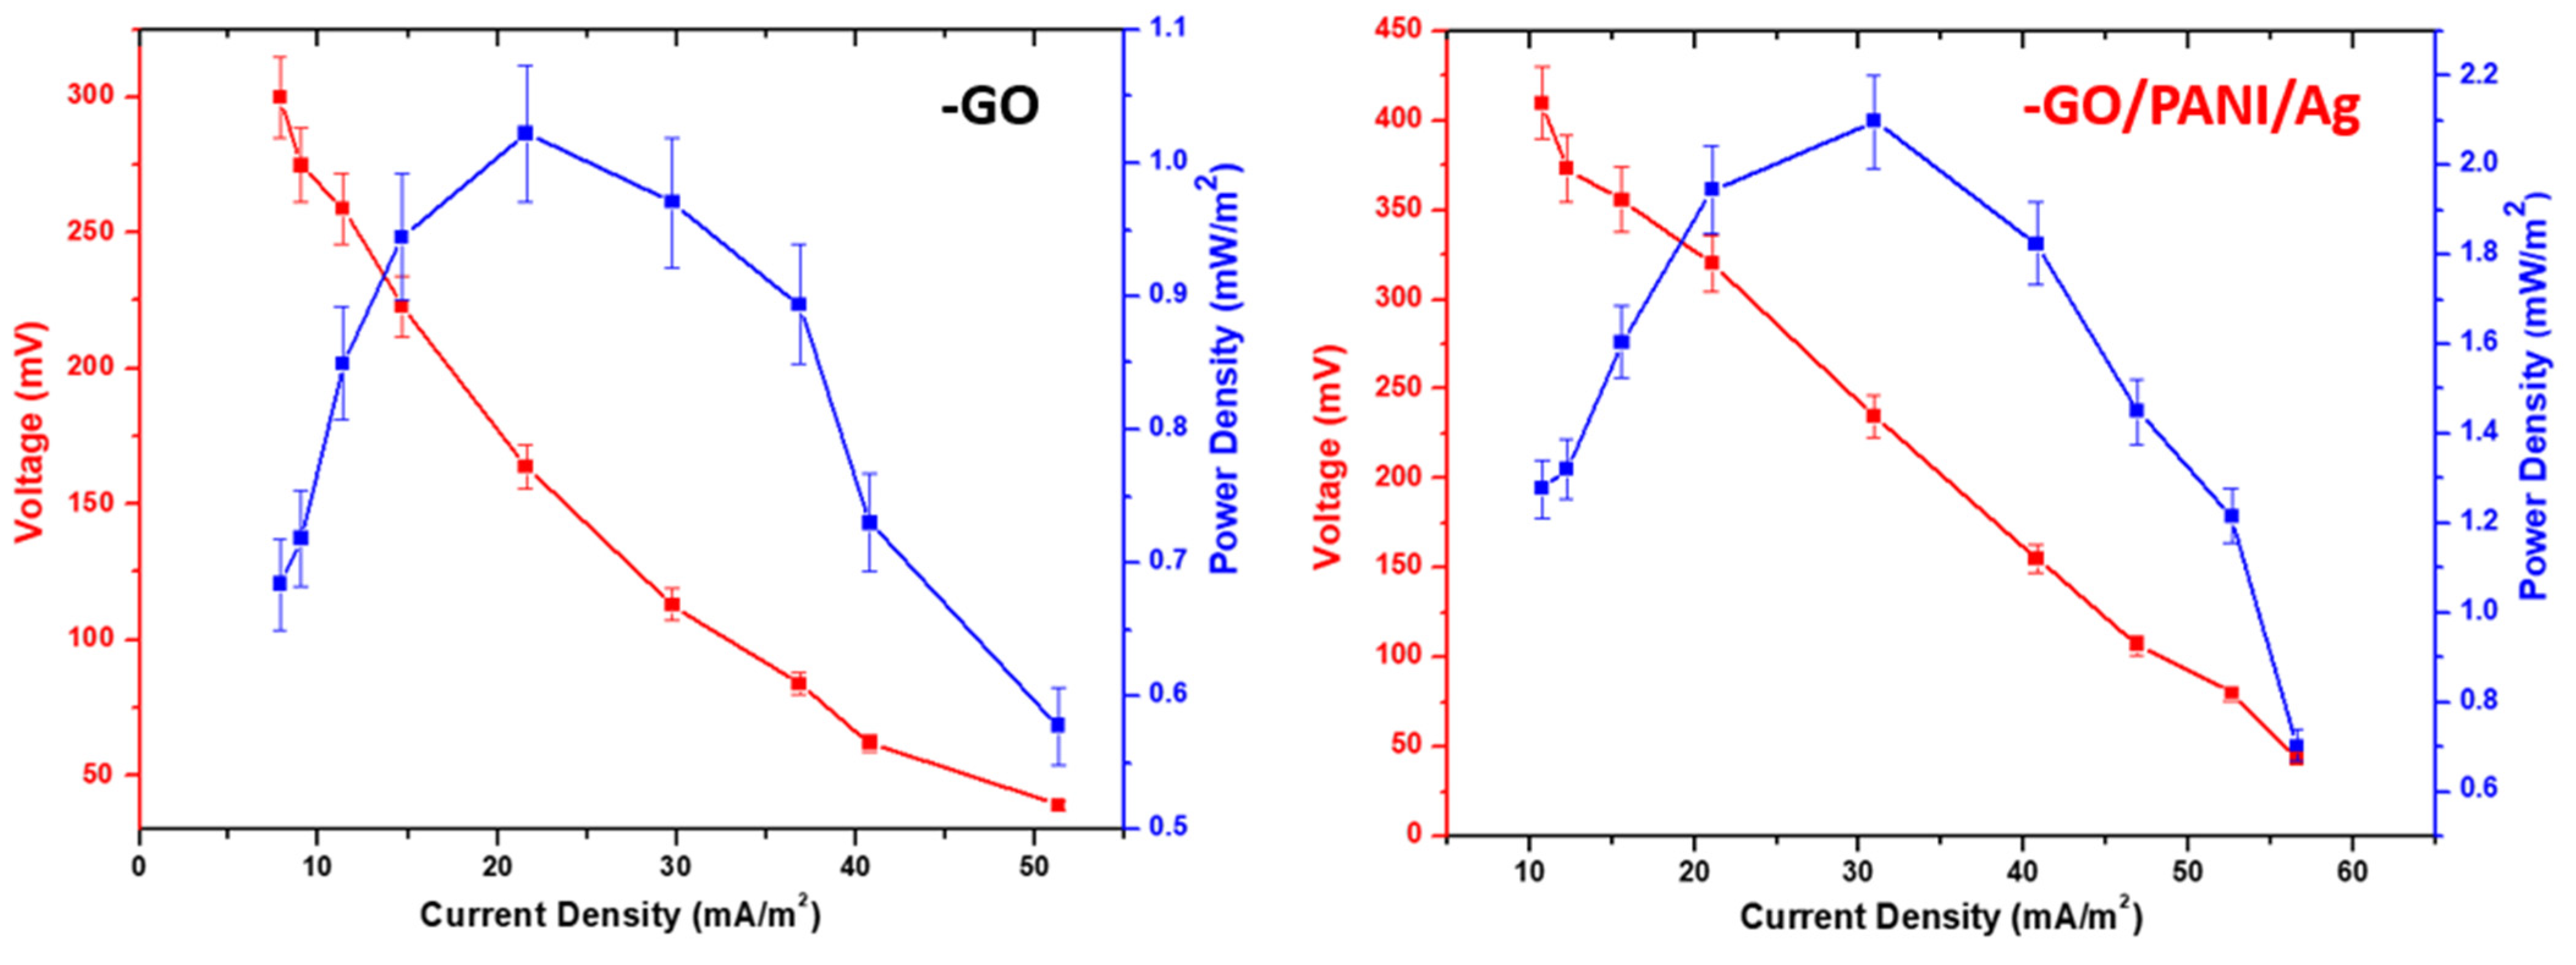
Power Generation and Polarization
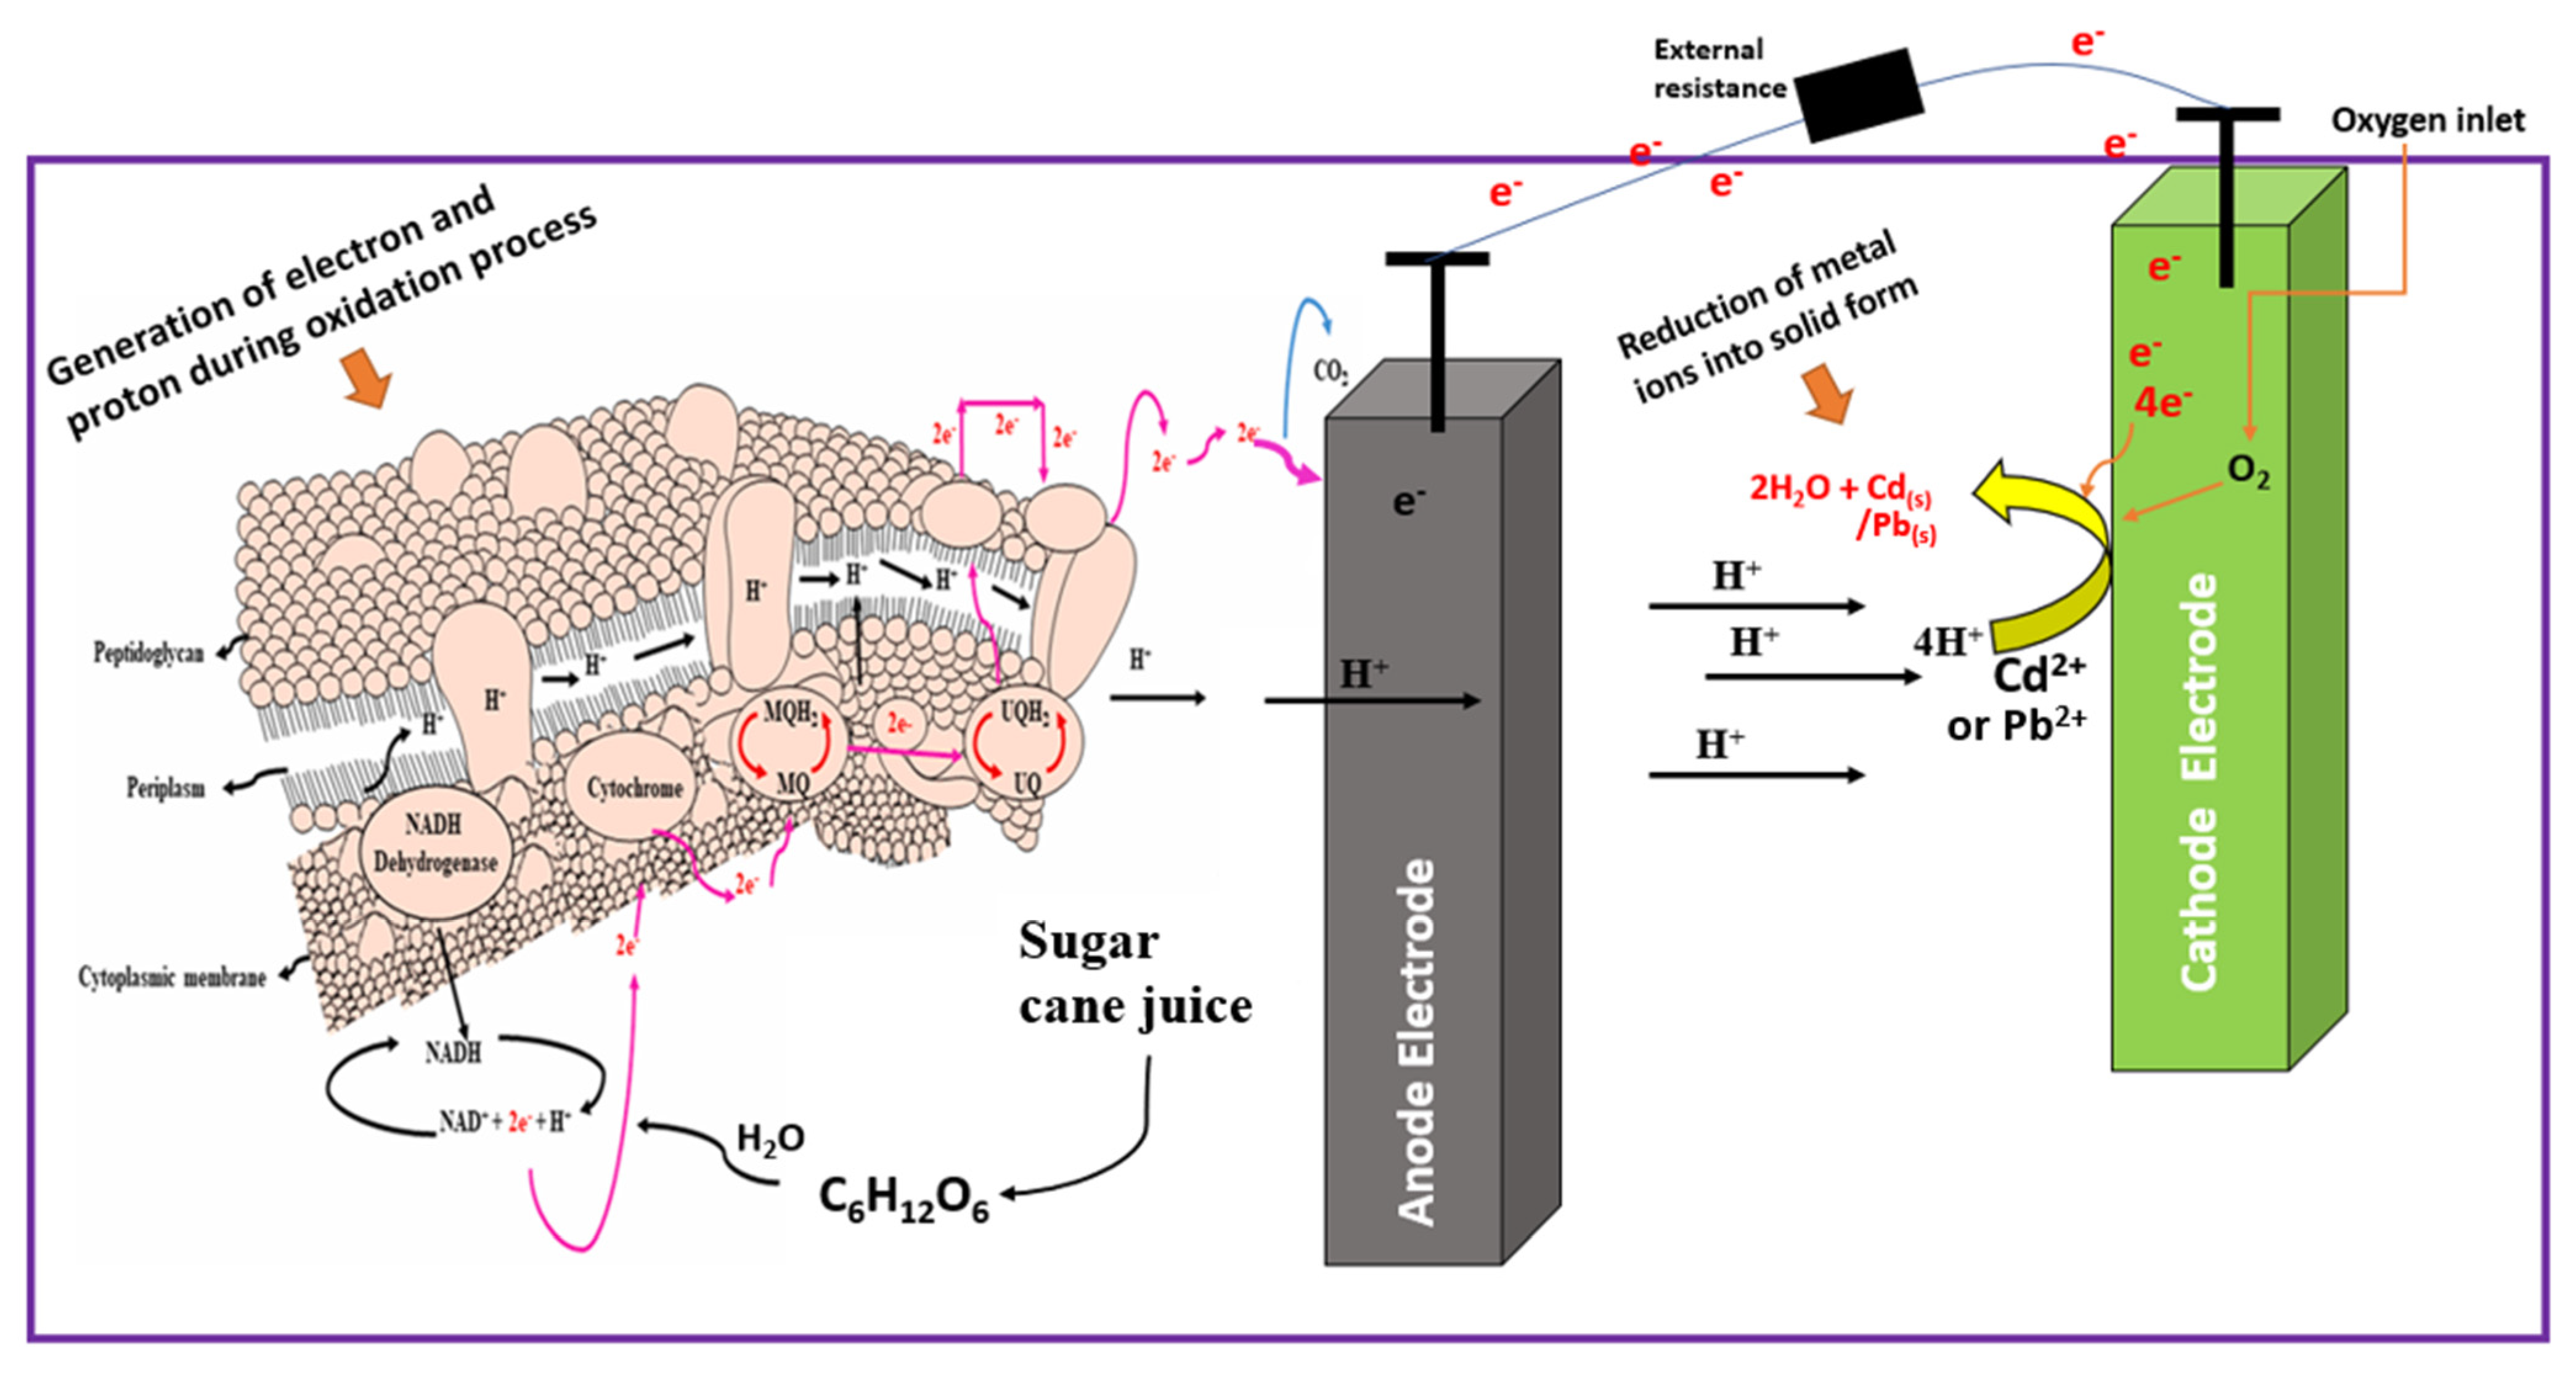
3.3. Removal of Pb (II) and Cd (II)
- -
- Conversion of Cd2+ to Cd(s)Cd2+ + 2e− Cd(s)2Cd2+ + 2H2O 2CdO + 4H+CdO + 2e− + 2H+ Cd(s) + H2O
- -
- Conversion of Pb2+ to Pb(s)Pb2+ + 2e− Pb(s)2Pb2+ + 2H2O 2PbO + 4H+PbO + 2e− + 2H+ Pb(s) + H2O
Characterization of Biofilm and Identification of Bacteria
3.4. Parameter Optimization
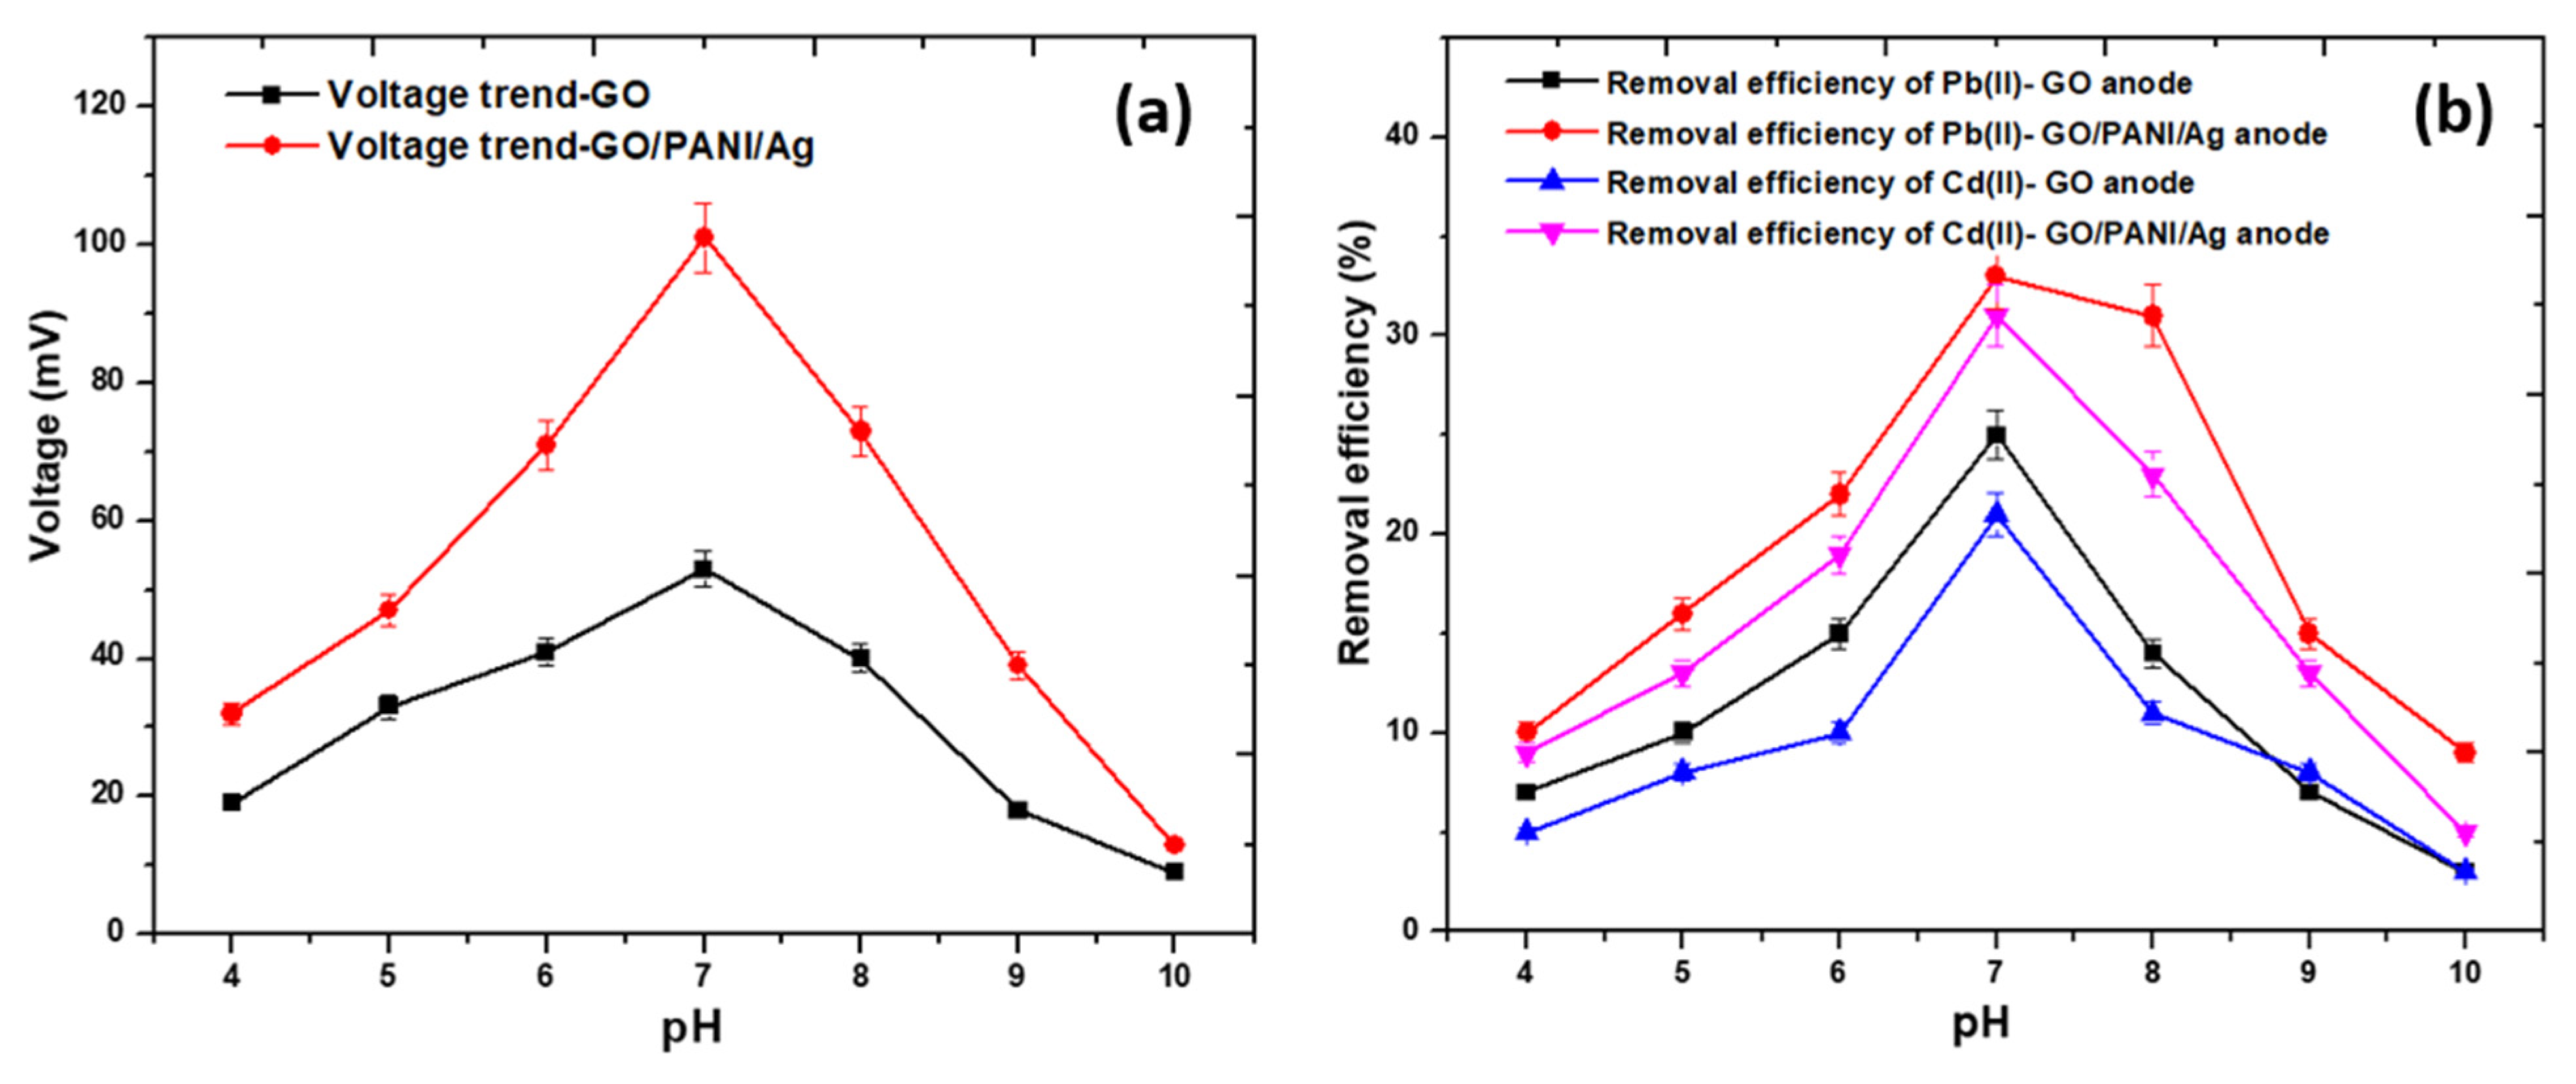
3.4.1. Effect of pH on the Operation of MFCs
3.4.2. Assessment of Organic Substrates in the Performance of MFCs
4. Concluding Remarks and Recommendations for Future Research
Author Contributions
Funding
Institutional Review Board Statement
Informed Consent Statement
Data Availability Statement
Conflicts of Interest
References
- Zhang, L.; Wang, J.; Fu, G.; Zhang, Z. Simultaneous electricity generation and nitrogen and carbon removal in single-chamber microbial fuel cell for high-salinity wastewater treatment. J. Clean. Prod. 2020, 276, 123203. [Google Scholar] [CrossRef]
- Yaqoob, A.A.; Khatoon, A.; Mohd Setapar, S.H.; Umar, K.; Parveen, T.; Mohamad Ibrahim, M.N.; Ahmad, A.; Rafatullah, M. Outlook on the Role of Microbial Fuel Cells in Remediation of Environmental Pollutants with Electricity Generation. Catalysts 2020, 10, 819. [Google Scholar] [CrossRef]
- Logan, B.E.; Hamelers, B.; Rozendal, R.; Schröder, U.; Keller, J.; Freguia, S.; Aelterman, P.; Verstraete, W.; Rabaey, K. Microbial fuel cells: Methodology and technology. Environ. Sci. Technol. 2006, 40, 5181–5192. [Google Scholar] [CrossRef] [PubMed]
- Logan, B.E.; Rabaey, K. Conversion of wastes into bioelectricity and chemicals by using microbial electrochemical technologies. Science 2012, 337, 686–690. [Google Scholar] [CrossRef] [PubMed] [Green Version]
- Logan, B.E. Exoelectrogenic bacteria that power microbial fuel cells. Nat. Rev. Genet. 2009, 7, 375–381. [Google Scholar] [CrossRef] [PubMed]
- Asim, A.Y.; Mohamad, N.; Khalid, U.; Tabassum, P.; Akil, A.; Lokhat, D.; Siti, H. A glimpse into the microbial fuel cells for wastewater treatment with energy generation. Desalination Water Treat. 2021, 214, 379–389. [Google Scholar]
- Sun, C.; Zhang, H. Review of the Development of First-Generation Redox Flow Batteries: Iron-Chromium System. ChemSusChem 2022, 15, e202101798. [Google Scholar] [CrossRef]
- Li, M.; Lu, J.; Chen, Z.; Amine, K. 30 years of lithium-ion batteries. Adv. Mater. 2018, 30, 1800561. [Google Scholar] [CrossRef] [Green Version]
- Balat, M. Microbial Fuel Cells as an Alternative Energy Option. Energy Sources Part A Recovery Util. Environ. Eff. 2009, 32, 26–35. [Google Scholar] [CrossRef]
- Rahimnejad, M.; Adhami, A.; Darvari, S.; Zirehpour, A.; Oh, S.-E. Microbial fuel cell as new technology for bioelectricity generation: A review. Alex. Eng. J. 2015, 54, 745–756. [Google Scholar] [CrossRef] [Green Version]
- Palanisamy, G.; Jung, H.-Y.; Sadhasivam, T.; Kurkuri, M.D.; Kim, S.C.; Roh, S.-H. A comprehensive review on microbial fuel cell technologies: Processes, utilization, and advanced developments in electrodes and membranes. J. Clean. Prod. 2019, 221, 598–621. [Google Scholar] [CrossRef]
- Tang, C.; Zhao, Y.; Kang, C.; Yang, Y.; Morgan, D.; Xu, L. Towards concurrent pollutants removal and high energy harvesting in a pilot-scale CW-MFC: Insight into the cathode conditions and electrodes connection. Chem. Eng. J. 2019, 373, 150–160. [Google Scholar] [CrossRef]
- Tavakolian, M.; Taleghani, H.G.; Khorshidian, M. New design of benthic microbial fuel cell for bioelectricity generation: Comparative study. Int. J. Hydrogen Energy 2020, 45, 23533–23542. [Google Scholar] [CrossRef]
- Sun, C.; Zhang, H. Investigation of Nafion series membranes on the performance of iron-chromium redox flow battery. Int. J. Energy Res. 2019, 43, 8739–8752. [Google Scholar] [CrossRef]
- Yaqoob, A.A.; Mohamad Ibrahim, M.N.; Rafatullah, M.; Chua, Y.S.; Ahmad, A.; Umar, K. Recent Advances in Anodes for Microbial Fuel Cells: An Overview. Materials 2020, 13, 2078. [Google Scholar] [CrossRef] [PubMed]
- Ibrahim, M.N.M.; Guerrero-Barajas, C. Modern trend of anodes in microbial fuel cells (MFCs): An overview. Environ. Technol. Innov. 2021, 23, 101579. [Google Scholar]
- Oguzie, E.E.; Oguzie, K.L.; Akalezi, C.; Udeze, I.O.; Ogbulie, J.N.; Njoku, V.O. Natural Products for Materials Protection: Corrosion and Microbial Growth Inhibition Using Capsicum frutescens Biomass Extracts. ACS Sustain. Chem. Eng. 2013, 1, 214–225. [Google Scholar] [CrossRef]
- Yaqoob, A.A.; Ibrahim, M.N.M.; Rodríguez-Couto, S. Development and modification of materials to build cost-effective anodes for microbial fuel cells (MFCs): An overview. Biochem. Eng. J. 2020, 164, 107779. [Google Scholar] [CrossRef]
- Jastrzębska, A.M.; Kurtycz, P.; Olszyna, A.R. Recent advances in graphene family materials toxicity investigations. J. Nanoparticle Res. 2012, 14, 1320. [Google Scholar] [CrossRef] [Green Version]
- Yaqoob, A.A.; Ibrahim, M.N.M.; Yaakop, A.S.; Umar, K.; Ahmad, A. Modified graphene oxide anode: A bioinspired waste material for bioremediation of Pb2+ with energy generation through microbial fuel cells. Chem. Eng. J. 2021, 417, 128052. [Google Scholar] [CrossRef]
- Kirubaharan, C.J.; Yoo, D.J.; Kim, A.R. Graphene/poly (3, 4-ethylenedioxythiophene)/Fe3O4 nanocomposite—An efficient oxygen reduction catalyst for the continuous electricity production from wastewater treatment microbial fuel cells. Int. J. Hydrog. Energy 2016, 41, 13208–13219. [Google Scholar]
- Gnana kumar, G.G.; Kirubaharan, C.J.; Udhayakumar, S.; Karthikeyan, C.; Nahm, K.S. Conductive polymer/graphene supported platinum nanoparticles as anode catalysts for the extended power generation of microbial fuel cells. Ind. Eng. Chem. Res. 2014, 53, 16883–16893. [Google Scholar] [CrossRef]
- Thambidurai, S.; Pandiselvi, K. Polyaniline/Natural Polymer Composites and Nanocomposites. In Polyaniline Blends, Composites, and Nanocomposites; Elsevier: Amsterdam, The Netherlands, 2018; pp. 235–256. [Google Scholar]
- Yaqoob, A.A.; Ibrahim, M.N.M.; Ahmad, A.; Khatoon, A.; Setapar, S.H.M. Polyaniline-Based Materials for Supercapacitors. Handb. Supercapacit. Mater. Synth. Charact. Appl. 2021, 113–130. [Google Scholar] [CrossRef]
- Yong, Y.-C.; Dong, X.-C.; Chan-Park, M.B.; Song, H.; Chen, P. Macroporous and Monolithic Anode Based on Polyaniline Hybridized Three-Dimensional Graphene for High-Performance Microbial Fuel Cells. ACS Nano 2012, 6, 2394–2400. [Google Scholar] [CrossRef]
- Zhao, C.; Gai, P.; Liu, C.; Wang, X.; Xu, H.; Zhang, J.; Zhu, J.-J. Polyaniline networks grown on graphene nanoribbons-coated carbon paper with a synergistic effect for high-performance microbial fuel cells. J. Mater. Chem. A 2013, 1, 12587–12594. [Google Scholar] [CrossRef]
- Ibrahim, M.N.M.; Umar, K.; Bhawani, S.A.; Khan, A.; Asiri, A.M.; Khan, M.R.; Azam, M.; AlAmmari, A.M.; Yaqoob, A.A. Cellulose Derived Graphene/Polyaniline Nanocomposite Anode for Energy Generation and Bioremediation of Toxic Metals via Benthic Microbial Fuel Cells. Polymers 2020, 13, 135. [Google Scholar]
- Akman, D.; Cirik, K.; Ozdemir, S.; Ozkaya, B.; Cinar, O. Bioelectricity generation in continuously-fed microbial fuel cell: Effects of anode electrode material and hydraulic retention time. Bioresour. Technol. 2013, 149, 459–464. [Google Scholar] [CrossRef]
- Prakash, O.; Mungray, A.; Chongdar, S.; Kailasa, S.K.; Mungray, A.K. Performance of polypyrrole coated metal oxide composite electrodes for benthic microbial fuel cell (BMFC). J. Environ. Chem. Eng. 2018, 8, 102757. [Google Scholar] [CrossRef]
- Yaqoob, A.A.; Ibrahim, M.N.M.; Rodríguez-Couto, S.; Ahmad, A. Preparation, characterization, and application of modified carbonized lignin as an anode for sustainable microbial fuel cell. Process Saf. Environ. Prot. 2021, 155, 49–60. [Google Scholar] [CrossRef]
- Sekeri, S.H.; Ibrahim, M.N.M.; Umar, K.; Yaqoob, A.A.; Azmi, M.N.; Hussin, M.H.; Othman, M.B.H.; Malik, M.F.I.A. Preparation and characterization of nanosized lignin from oil palm (Elaeis guineensis) biomass as a novel emulsifying agent. Int. J. Biol. Macromol. 2020, 164, 3114–3124. [Google Scholar] [CrossRef]
- Shahriary, L.; Athawale, A.A. Graphene oxide synthesized by using modified hummers approach. Int. J. Renew Energy Environ. Eng. 2014, 2, 58–63. [Google Scholar]
- Parveen, N.; Mahato, N.; Ansari, M.O.; Cho, M.H. Enhanced electrochemical behavior and hydrophobicity of crystalline polyaniline@ graphene nanocomposite synthesized at elevated temperature. Compos. Part B Eng. 2016, 87, 281–290. [Google Scholar] [CrossRef]
- Kim, J.; Park, S.-J.; Kim, S. Capacitance behaviors of Polyaniline/Graphene Nanosheet Composites Prepared by Aniline Chemical Polymerization. Carbon Lett. 2013, 14, 51–54. [Google Scholar] [CrossRef] [Green Version]
- Moghadam, M.H.M.; Sabury, S.; Gudarzi, M.M.; Sharif, F. Graphene oxide-induced polymerization and crystallization to produce highly conductive polyaniline/graphene oxide composite. J. Polym. Sci. Part A Polym. Chem. 2014, 52, 1545–1554. [Google Scholar] [CrossRef]
- Eltayeb, N.E.; Khan, A. Preparation and properties of newly synthesized Polyaniline@ Graphene oxide/Ag nanocomposite for highly selective sensor application. J. Mater. Res. Technol. 2020, 9, 10459–10467. [Google Scholar] [CrossRef]
- Husin, M.R.; Arsad, A.; Suradi, S.S.; Alothman, O.; Ngadi, N.; Kamaruddin, M.J. Fourier transforms infrared spectroscopy and X-ray diffraction investigation of recycled polypropylene/polyaniline blends. Chem. Eng. Trans. 2017, 56, 1015–1020. [Google Scholar]
- Yan, J.; Wei, T.; Shao, B.; Fan, Z.; Qian, W.; Zhang, M.; Wei, F. Preparation of a graphene nanosheet/polyaniline composite with high specific capacitance. Carbon 2010, 48, 487–493. [Google Scholar] [CrossRef]
- Zhong, L.; Yun, K. Graphene oxide-modified ZnO particles: Synthesis, characterization, and antibacterial properties. Int. J. Nanomed. 2015, 10, 79. [Google Scholar]
- Wang, Y.; Zhang, S.M.; Deng, Y. Flexible low-grade energy utilization devices based on high-performance thermoelectric polyaniline/tellurium nanorod hybrid films. J. Mater. Chem. A 2016, 4, 3554–3559. [Google Scholar] [CrossRef]
- Liu, L.; Chou, T.-Y.; Lee, C.-Y.; Lee, D.-J.; Su, A.; Lai, J.-Y. Performance of freshwater sediment microbial fuel cells: Consistency. Int. J. Hydrogen Energy 2015, 41, 4504–4508. [Google Scholar] [CrossRef]
- Huang, L.; Chai, X.; Quan, X.; Logan, B.E.; Chen, G. Reductive dechlorination and mineralization of pentachlorophenol in biocathode microbial fuel cells. Bioresour. Technol. 2012, 111, 167–174. [Google Scholar] [CrossRef] [PubMed]
- Fadzli, F.S.; Bhawani, S.A.; Mohammad, R.E.A. Microbial Fuel Cell: Recent Developments in Organic Substrate Use and Bacterial Electrode Interaction. J. Chem. 2021, 2021, 4570388. [Google Scholar] [CrossRef]
- Yaqoob, S.B.; Bhawani, S.A.; Abdulrahman, R.M.I. Utilization of Mangifera indica as Substrate to Bioremediate the Toxic Metals and Generate the Bioenergy through a Single-Chamber Microbial Fuel Cell. J. Chem. 2021, 2021, 8552701. [Google Scholar] [CrossRef]
- Daud, N.N.M.; Ahmad, A.; Yaqoob, A.A.; Ibrahim, M.N.M. Application of rotten rice as a substrate for bacterial species to generate energy and the removal of toxic metals from wastewater through microbial fuel cells. Environ. Sci. Pollut. Res. 2021, 28, 62816–62827. [Google Scholar] [CrossRef] [PubMed]
- Sajana, T.; Ghangrekar, M.; Mitra, A. Application of sediment microbial fuel cell for in situ reclamation of aquaculture pond water quality. Aquac. Eng. 2013, 57, 101–107. [Google Scholar] [CrossRef]
- Sajana, T.; Ghangrekar, M.; Mitra, A. Effect of presence of cellulose in the freshwater sediment on the performance of sediment microbial fuel cell. Bioresour. Technol. 2014, 155, 84–90. [Google Scholar] [CrossRef] [PubMed]
- Fadzli, F.S.; Rashid, M.; Yaqoob, A.A.; Ibrahim, M.N.M. Electricity generation and heavy metal remediation by utilizing yam (Dioscorea alata) waste in benthic microbial fuel cells (BMFCs). Biochem. Eng. J. 2021, 172, 108067. [Google Scholar] [CrossRef]
- Xu, P.; Xiao, E.-R.; Xu, D.; Zhou, Y.; He, F.; Liu, B.-Y.; Zeng, L.; Wu, Z.-B. Internal nitrogen removal from sediments by the hybrid system of microbial fuel cells and submerged aquatic plants. PLoS ONE 2017, 12, e0172757. [Google Scholar] [CrossRef]
- Yaqoob, A.A.; Ahmad, H.; Parveen, T.; Ahmad, A.; Oves, M.; Ismail, I.M.I.; Qari, H.A.; Umar, K.; Ibrahim, M.N.M. Recent Advances in Metal Decorated Nanomaterials and Their Various Biological Applications: A Review. Front. Chem. 2020, 8, 341. [Google Scholar] [CrossRef]
- Singh, S.; Songera, D.S. A review on microbial fuel cell using organic waste as feed. CIBTech J. Biotechnol. 2012, 2, 17–27. [Google Scholar]
- Yaqoob, A.A.; Ibrahim, M.N.M.; Umar, K. Biomass-derived composite anode electrode: Synthesis, characterizations, and application in microbial fuel cells (MFCs). J. Environ. Chem. Eng. 2021, 9, 106111. [Google Scholar] [CrossRef]
- Yaqoob, A.A.; Guerrero–Barajas, C.; Ibrahim, M.N.M.; Umar, K.; Yaakop, A.S. Local fruit wastes driven benthic microbial fuel cell: A sustainable approach to toxic metal removal and bioelectricity generation. Environ. Sci. Pollut. Res. 2022, 1–16. [Google Scholar] [CrossRef] [PubMed]
- Yaqoob, A.A.; Ibrahim, M.N.M.; Yaakop, A.S.; Ahmad, A. Application of microbial fuel cells energized by oil palm trunk sap (OPTS) to remove the toxic metal from synthetic wastewater with generation of electricity. Appl. Nanosci. 2021, 11, 1949–1961. [Google Scholar] [CrossRef]
- Umar, M.F.; Rafatullah, M.; Abbas, S.Z.; Ibrahim, M.N.M.; Ismail, N. Bioelectricity production and xylene biodegradation through double chamber benthic microbial fuel cells fed with sugarcane waste as a substrate. J. Hazard. Mater. 2021, 419, 126469. [Google Scholar] [CrossRef] [PubMed]
- Di Martino, P. Extracellular polymeric substances, a key element in understanding biofilm phenotype. AIMS Microbiol. 2018, 4, 274–288. [Google Scholar] [CrossRef]
- Kumar, M.A.; Anandapandian, K.T.K.; Parthiban, K. Production and characterization of exopolysaccharides (EPS) from biofilm forming marine bacterium. Braz. Arch. Biol. Technol. 2011, 54, 259–265. [Google Scholar] [CrossRef] [Green Version]
- Sturm, G.; Brunner, S.; Suvorova, E.; Dempwolff, F.; Reiner, J.; Graumann, P.; Bernier-Latmani, R.; Majzlan, J.; Gescher, J. Chromate Resistance Mechanisms in Leucobacter chromiiresistens. Appl. Environ. Microbiol. 2018, 84, e02208–e02218. [Google Scholar] [CrossRef] [Green Version]
- Bazzi, W.; Abou Fayad, A.G.; Nasser, A.; Haraoui, L.-P.; Dewachi, O.; Abou-Sitta, G.; Nguyen, V.-K.; Abara, A.; Karah, N.; Landecker, H. Heavy Metal Toxicity in Armed Conflicts Potentiates AMR in A. baumannii by Selecting for Antibiotic and Heavy Metal Co-resistance Mechanisms. Front. Microbiol. 2020, 11, 68. [Google Scholar] [CrossRef]
- Yuan, Y.; Zhao, B.; Zhou, S.; Zhong, S.; Zhuang, L. Electrocatalytic activity of anodic biofilm responses to pH changes in microbial fuel cells. Bioresour. Technol. 2011, 102, 6887–6891. [Google Scholar] [CrossRef]
- Sharma, Y.; Li, B. The variation of power generation with organic substrates in single-chamber microbial fuel cells (SCMFCs). Bioresour. Technol. 2010, 101, 1844–1850. [Google Scholar] [CrossRef]
- Salvin, P.; Ondel, O.; Roos, C.; Robert, F. Energy harvest with mangrove benthic microbial fuel cells. Int. J. Energy Res. 2015, 39, 543–556. [Google Scholar] [CrossRef]
- Yamada, H.; Tanaka, R.; Sulaiman, O.; Hashim, R.; Hamid, Z.; Yahya, M.; Kosugi, A.; Arai, T.; Murata, Y.; Nirasawa, S. Old oil palm trunk: A promising source of sugars for bioethanol production. Biomass Bioenergy 2010, 34, 1608–1613. [Google Scholar] [CrossRef]


| Physicochemical Properties | Wastewater before Metal Treatment | Wastewater after Metal Treatment |
|---|---|---|
| pH | 6.96 | 6.44 |
| Odor | Unpleasant smell | Unpleasant smell |
| Temperature | 26 ± 2 °C | 26 ± 2 °C |
| Color | Dark yellowish | Dark yellowish |
| Electrical conductivity | 65 μS/cm | 80 μS/cm |
| Pb (II) | 0 ppm | 100 ppm |
| Cd (II) | 0 ppm | 100 ppm |
| Electrodes | Supplemented Metals | Inoculation Source | Initial Concentration (ppm) | Operational Time (Days) | Remediation Efficiency (%) | |
|---|---|---|---|---|---|---|
| Fabricated Anode | Cathode | |||||
| GO | Graphite rod | Pb (II) | Synthetic wastewater | 100 | 0 | 0 |
| 5 | 15.20 | |||||
| 10 | 24.01 | |||||
| 15 | 34.50 | |||||
| 20 | 44.00 | |||||
| 25 | 51.00 | |||||
| 30 | 55.00 | |||||
| 35 | 57.52 | |||||
| GO/PANI/Ag | Graphite rod | 0 | 0 | |||
| 5 | 15.30 | |||||
| 10 | 31.45 | |||||
| 15 | 43.90 | |||||
| 20 | 56.88 | |||||
| 25 | 69.00 | |||||
| 30 | 76.32 | |||||
| 35 | 78.10 | |||||
| GO | Graphite rod | Cd (II) | Synthetic wastewater | 100 | 0 | 0 |
| 5 | 9 | |||||
| 10 | 19.00 | |||||
| 15 | 32.10 | |||||
| 20 | 46.51 | |||||
| 25 | 59.32 | |||||
| 30 | 61.00 | |||||
| 35 | 64.00 | |||||
| GO/PANI/Ag | Graphite rod | 0 | 0 | |||
| 5 | 20.30 | |||||
| 10 | 32.90 | |||||
| 15 | 49.40 | |||||
| 20 | 63.50 | |||||
| 25 | 74.13 | |||||
| 30 | 76.90 | |||||
| 35 | 80.25 | |||||
| Accession Number1 (6S rRNA Gene) | Bacterial Species | Query Cover (%) | Identity (%) |
|---|---|---|---|
| GO-anode biofilm bacterial species | |||
| NR_042288.1 | Leucobacter aridicollis strain L-9 | 98 | 97.8 |
| NR_114929.1 | Leucobacter komagatae strain IFO 15245 | 97 | 96.70 |
| NR_024674.1 | Leucobacter albus strain IAM 14851 | 96 | 94.70 |
| NR_044932.1 | Microbacterium arabinogalactanolyticum strain DSM 8611 | 96 | 94.81 |
| NR_108849.1 | Pseudarthrobacter siccitolerans strain 4J27 | 96 | 90.71 |
| NR_145906.1 | Leucobacter zeae strain CC-MF41 | 96 | 90.58 |
| NR_074608.1 | Glutamicibacter arilaitensis Re117 | 96 | 90.45 |
| NR_104498.1 | Citricoccus parietis strain 02-Je-010 | 95 | 91.80 |
| GO/PANI/Ag anode biofilm bacterial species | |||
| NR_042414.1 | Leucobacter iarius strain 40 | 96 | 98 |
| NR_112021.1 | Leucobacter komagatae strain IFO 15245 | 96 | 97.8 |
| NR_116649.1 | Micrococcus terreus strain V3M1 | 93.17 | 96 |
| NR_117546.1 | Citricoccus nitrophenolicus strain PNP1 | 96 | 92 |
| NR_042425.1 | Leucobacter luti strain RF6 | 96 | 92.45 |
| NR_024783.1 | Arthrobacter russicus strain A1-3 | 96 | 90.81 |
| NR_074770.2 | Pseudarthrobacter phenanthrenivorans Sphe3 | 96 | 90.70 |
| NR_104839.1 | Curtobacterium oceanosedimentum strain ATCC 31317 | 96 | 91.61 |
| NR_026159.1 | Rathayibacter rathayi strain DSM 7485 | 96 | 92.52 |
| NR_133713.1 | Canibacter oris strain DSM 27064 | 96 | 92.21 |
| Anode Electrode | Organic Substrate | Voltage (mV) | Measurement Duration (Days) | Removal Efficiency (%) of Pb(II) | Removal Efficiency (%) of Cd (II) |
|---|---|---|---|---|---|
| GO | Sugar cane juice | 48 | 10 | 24.01 | 19.00 |
| GO/PANI/Ag composite | Sugar cane juice | 100 | 10 | 31.45 | 32.90 |
| GO | Glucose | 45 | 10 | 18.50 | 12.10 |
| GO/PANI/Ag composite | Glucose | 85 | 10 | 24.00 | 29.25 |
| GO | Oil palm trunk sap | 55 | 10 | 26.00 | 25.50 |
| GO/PANI/Ag composite | Oil palm trunk sap | 115 | 10 | 33.85 | 36.40 |
Publisher’s Note: MDPI stays neutral with regard to jurisdictional claims in published maps and institutional affiliations. |
© 2022 by the authors. Licensee MDPI, Basel, Switzerland. This article is an open access article distributed under the terms and conditions of the Creative Commons Attribution (CC BY) license (https://creativecommons.org/licenses/by/4.0/).
Share and Cite
Yaqoob, A.A.; Serrà, A.; Bhawani, S.A.; Ibrahim, M.N.M.; Khan, A.; Alorfi, H.S.; Asiri, A.M.; Hussein, M.A.; Khan, I.; Umar, K. Utilizing Biomass-Based Graphene Oxide–Polyaniline–Ag Electrodes in Microbial Fuel Cells to Boost Energy Generation and Heavy Metal Removal. Polymers 2022, 14, 845. https://0-doi-org.brum.beds.ac.uk/10.3390/polym14040845
Yaqoob AA, Serrà A, Bhawani SA, Ibrahim MNM, Khan A, Alorfi HS, Asiri AM, Hussein MA, Khan I, Umar K. Utilizing Biomass-Based Graphene Oxide–Polyaniline–Ag Electrodes in Microbial Fuel Cells to Boost Energy Generation and Heavy Metal Removal. Polymers. 2022; 14(4):845. https://0-doi-org.brum.beds.ac.uk/10.3390/polym14040845
Chicago/Turabian StyleYaqoob, Asim Ali, Albert Serrà, Showkat Ahmad Bhawani, Mohamad Nasir Mohamad Ibrahim, Anish Khan, Hajer S. Alorfi, Abdullah M. Asiri, Mahmoud Ali Hussein, Imran Khan, and Khalid Umar. 2022. "Utilizing Biomass-Based Graphene Oxide–Polyaniline–Ag Electrodes in Microbial Fuel Cells to Boost Energy Generation and Heavy Metal Removal" Polymers 14, no. 4: 845. https://0-doi-org.brum.beds.ac.uk/10.3390/polym14040845