
Ensemble Tree-Based Approach towards Flexural Strength Prediction of FRP Reinforced Concrete Beams

 , , , and
Abstract
:1. Introduction
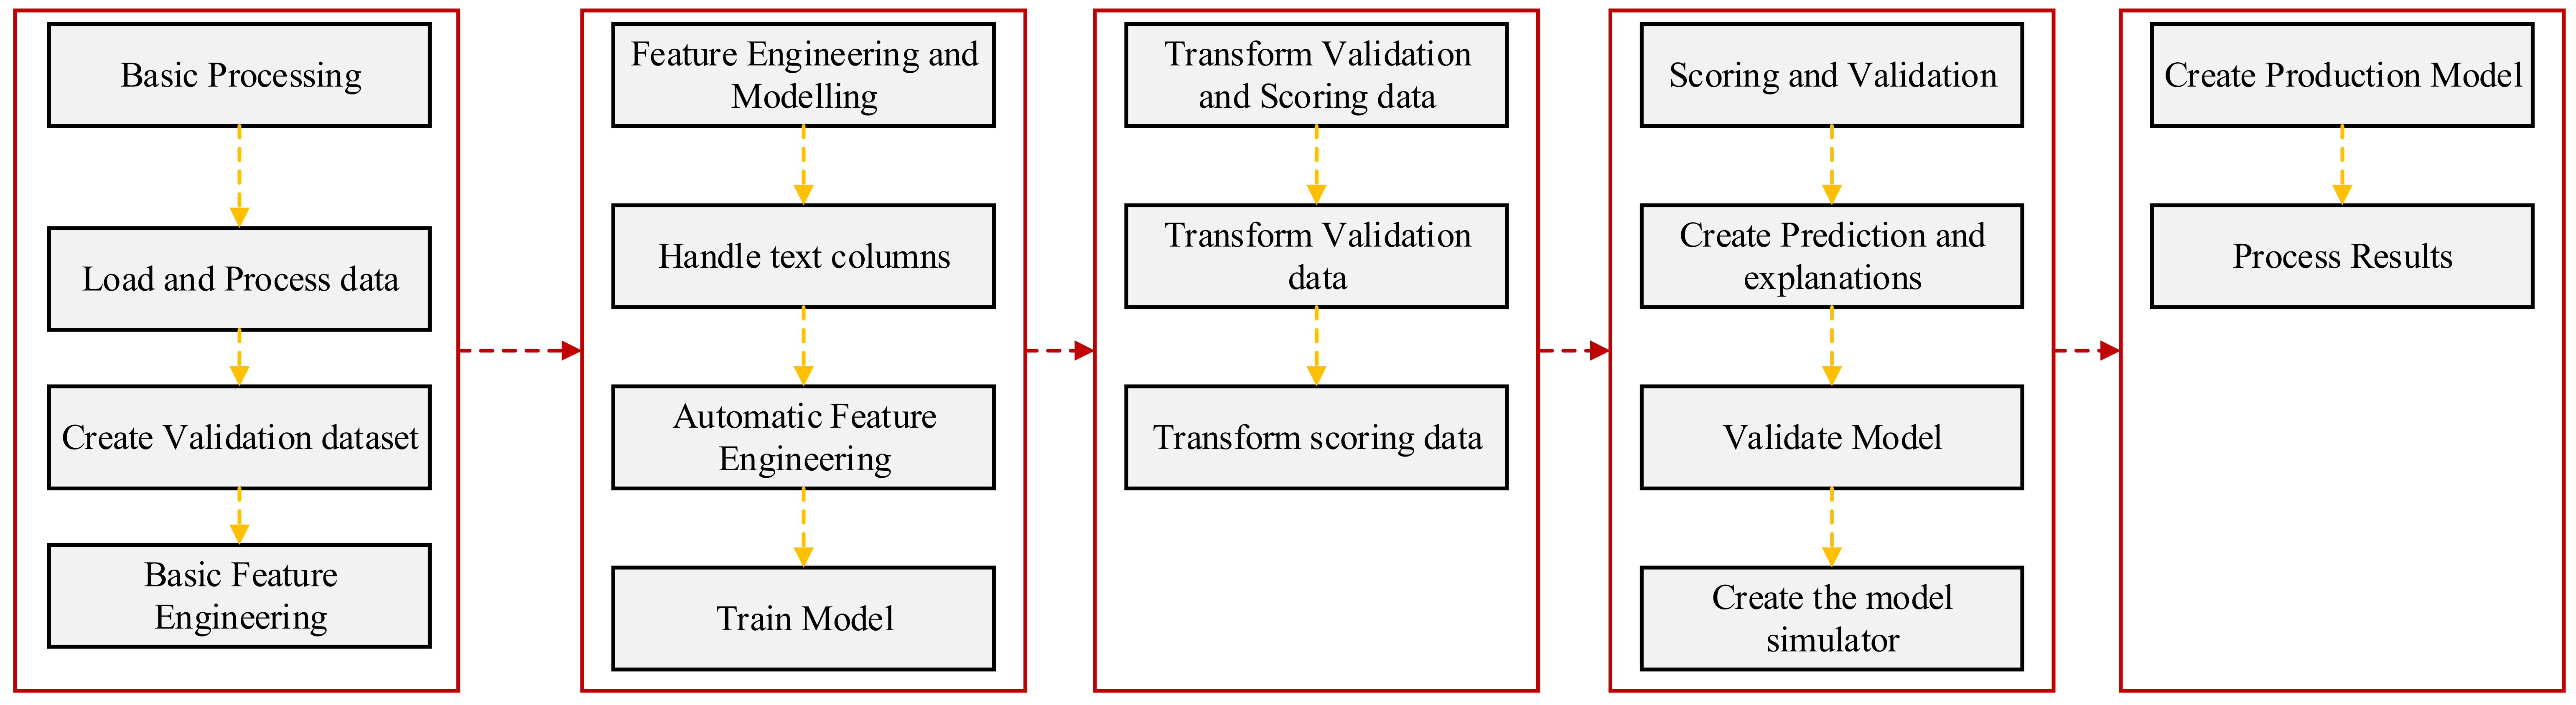
2. Methodolgy
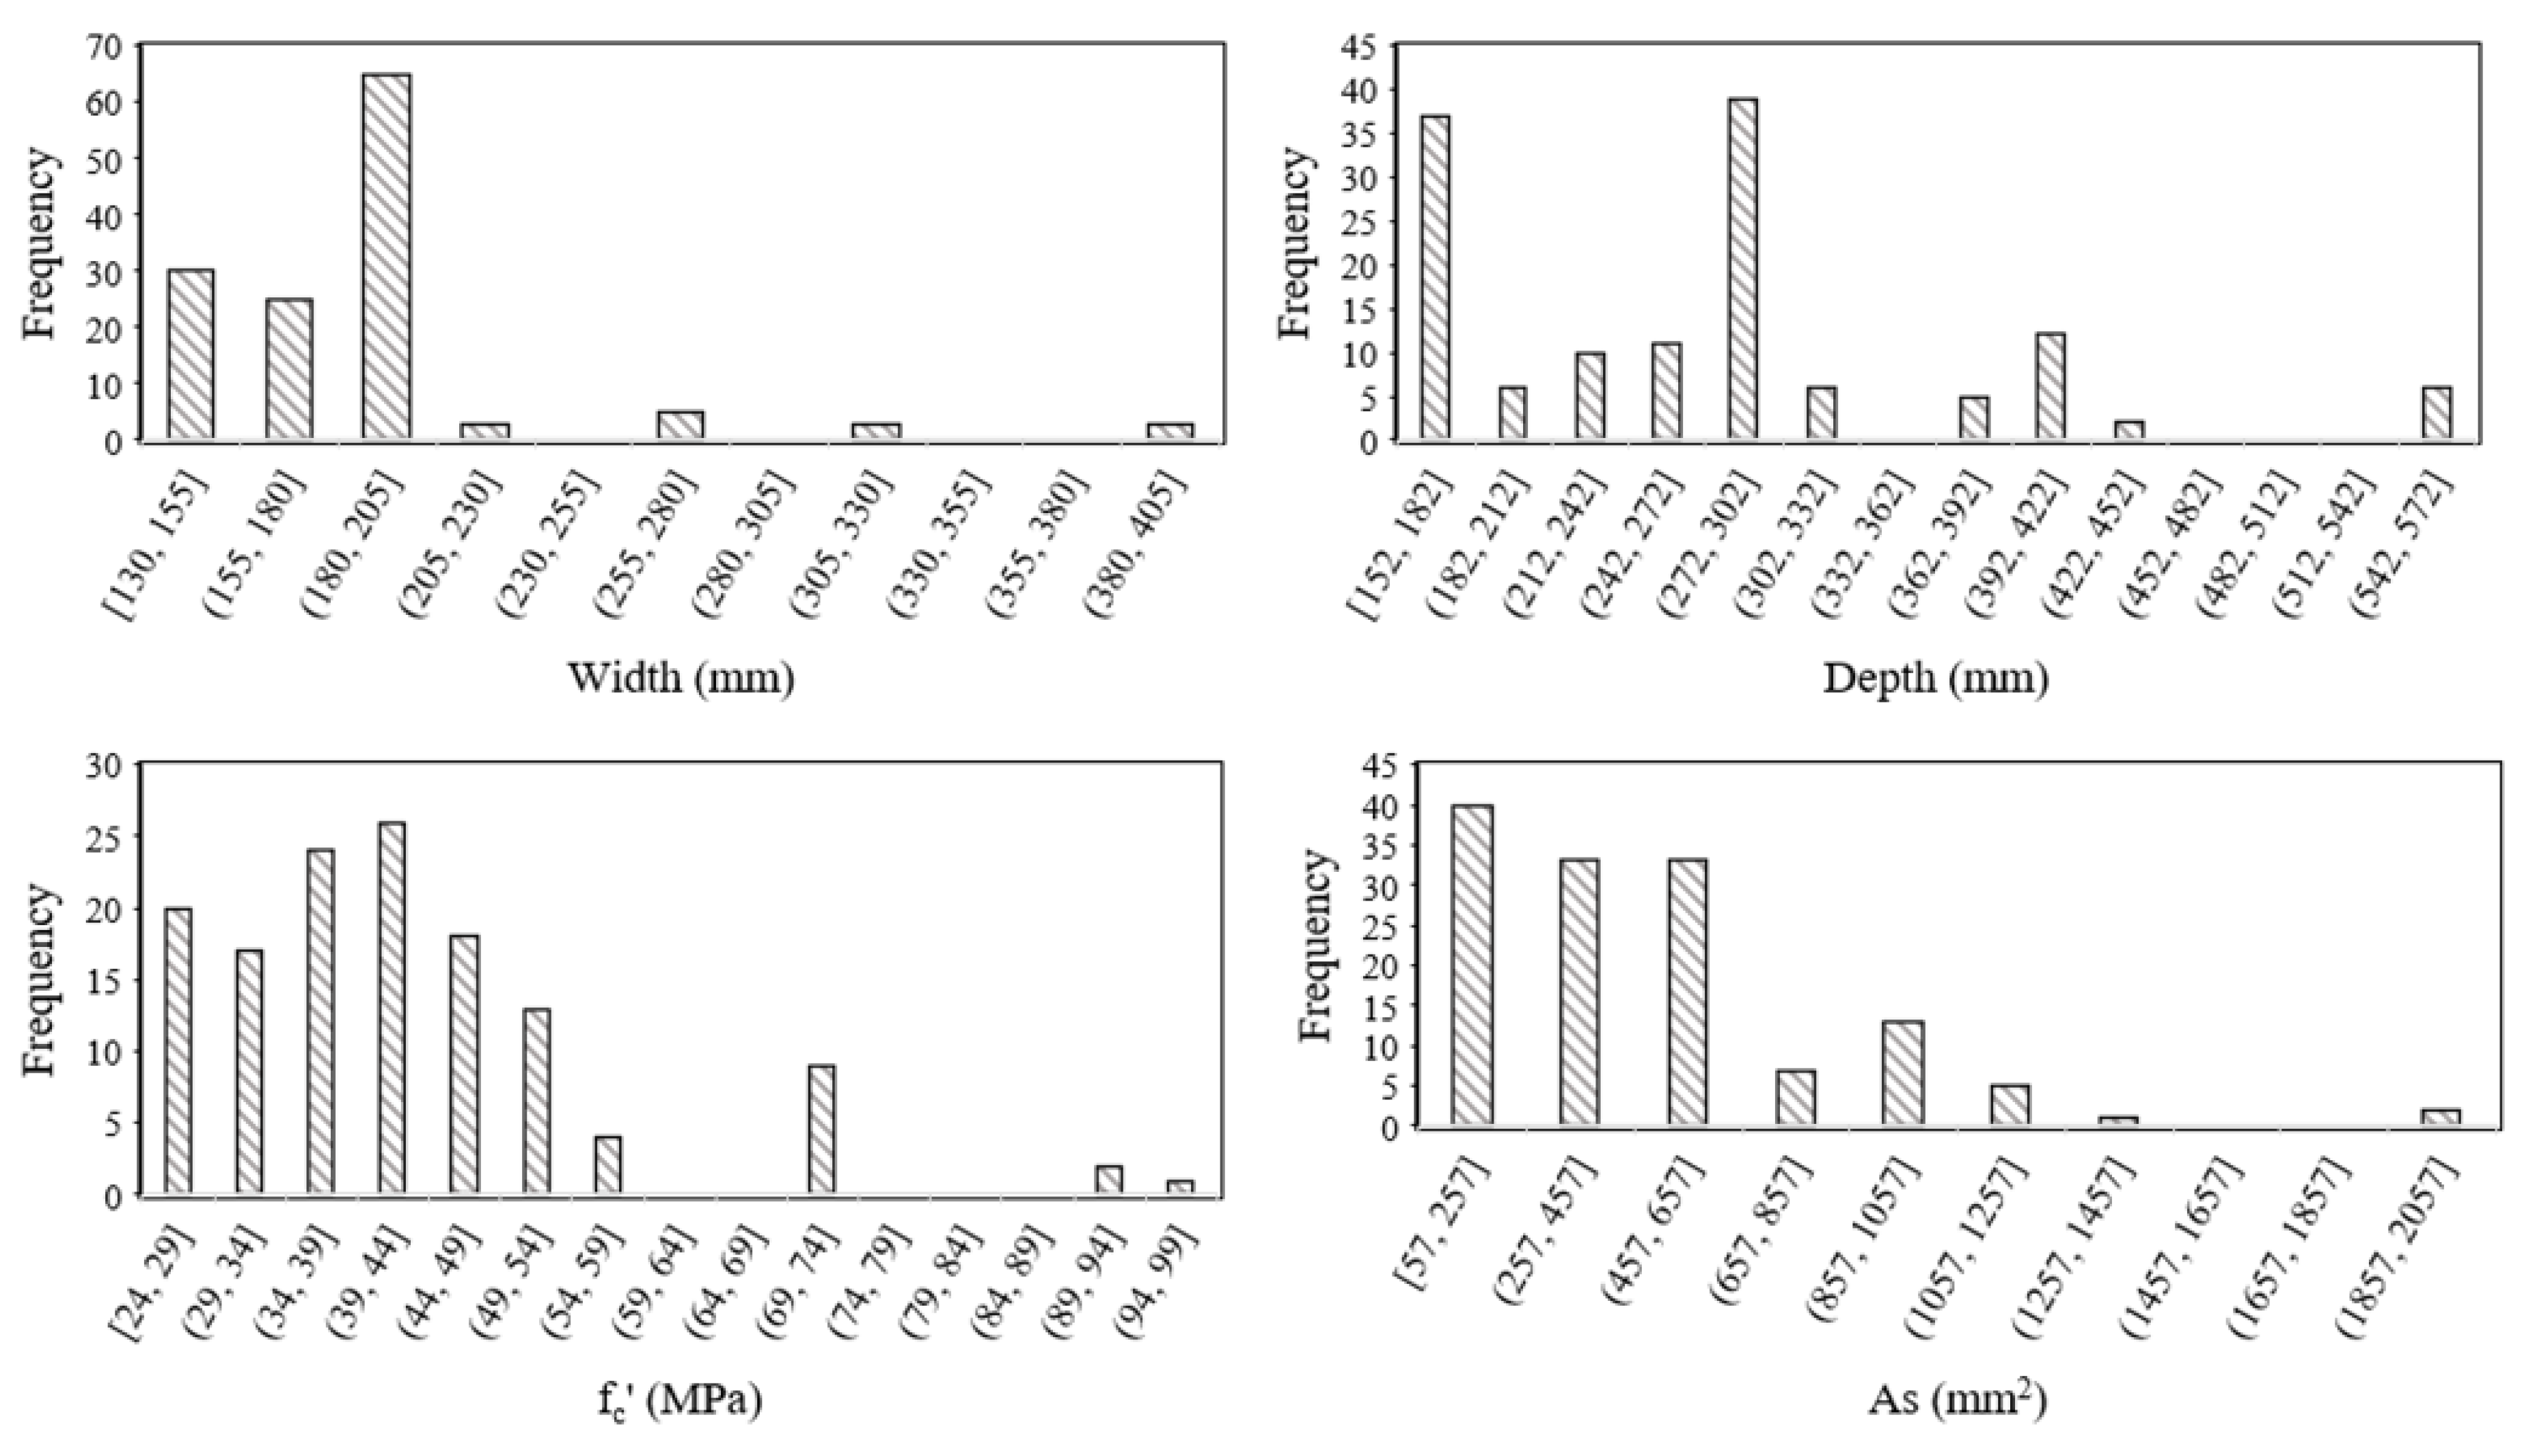
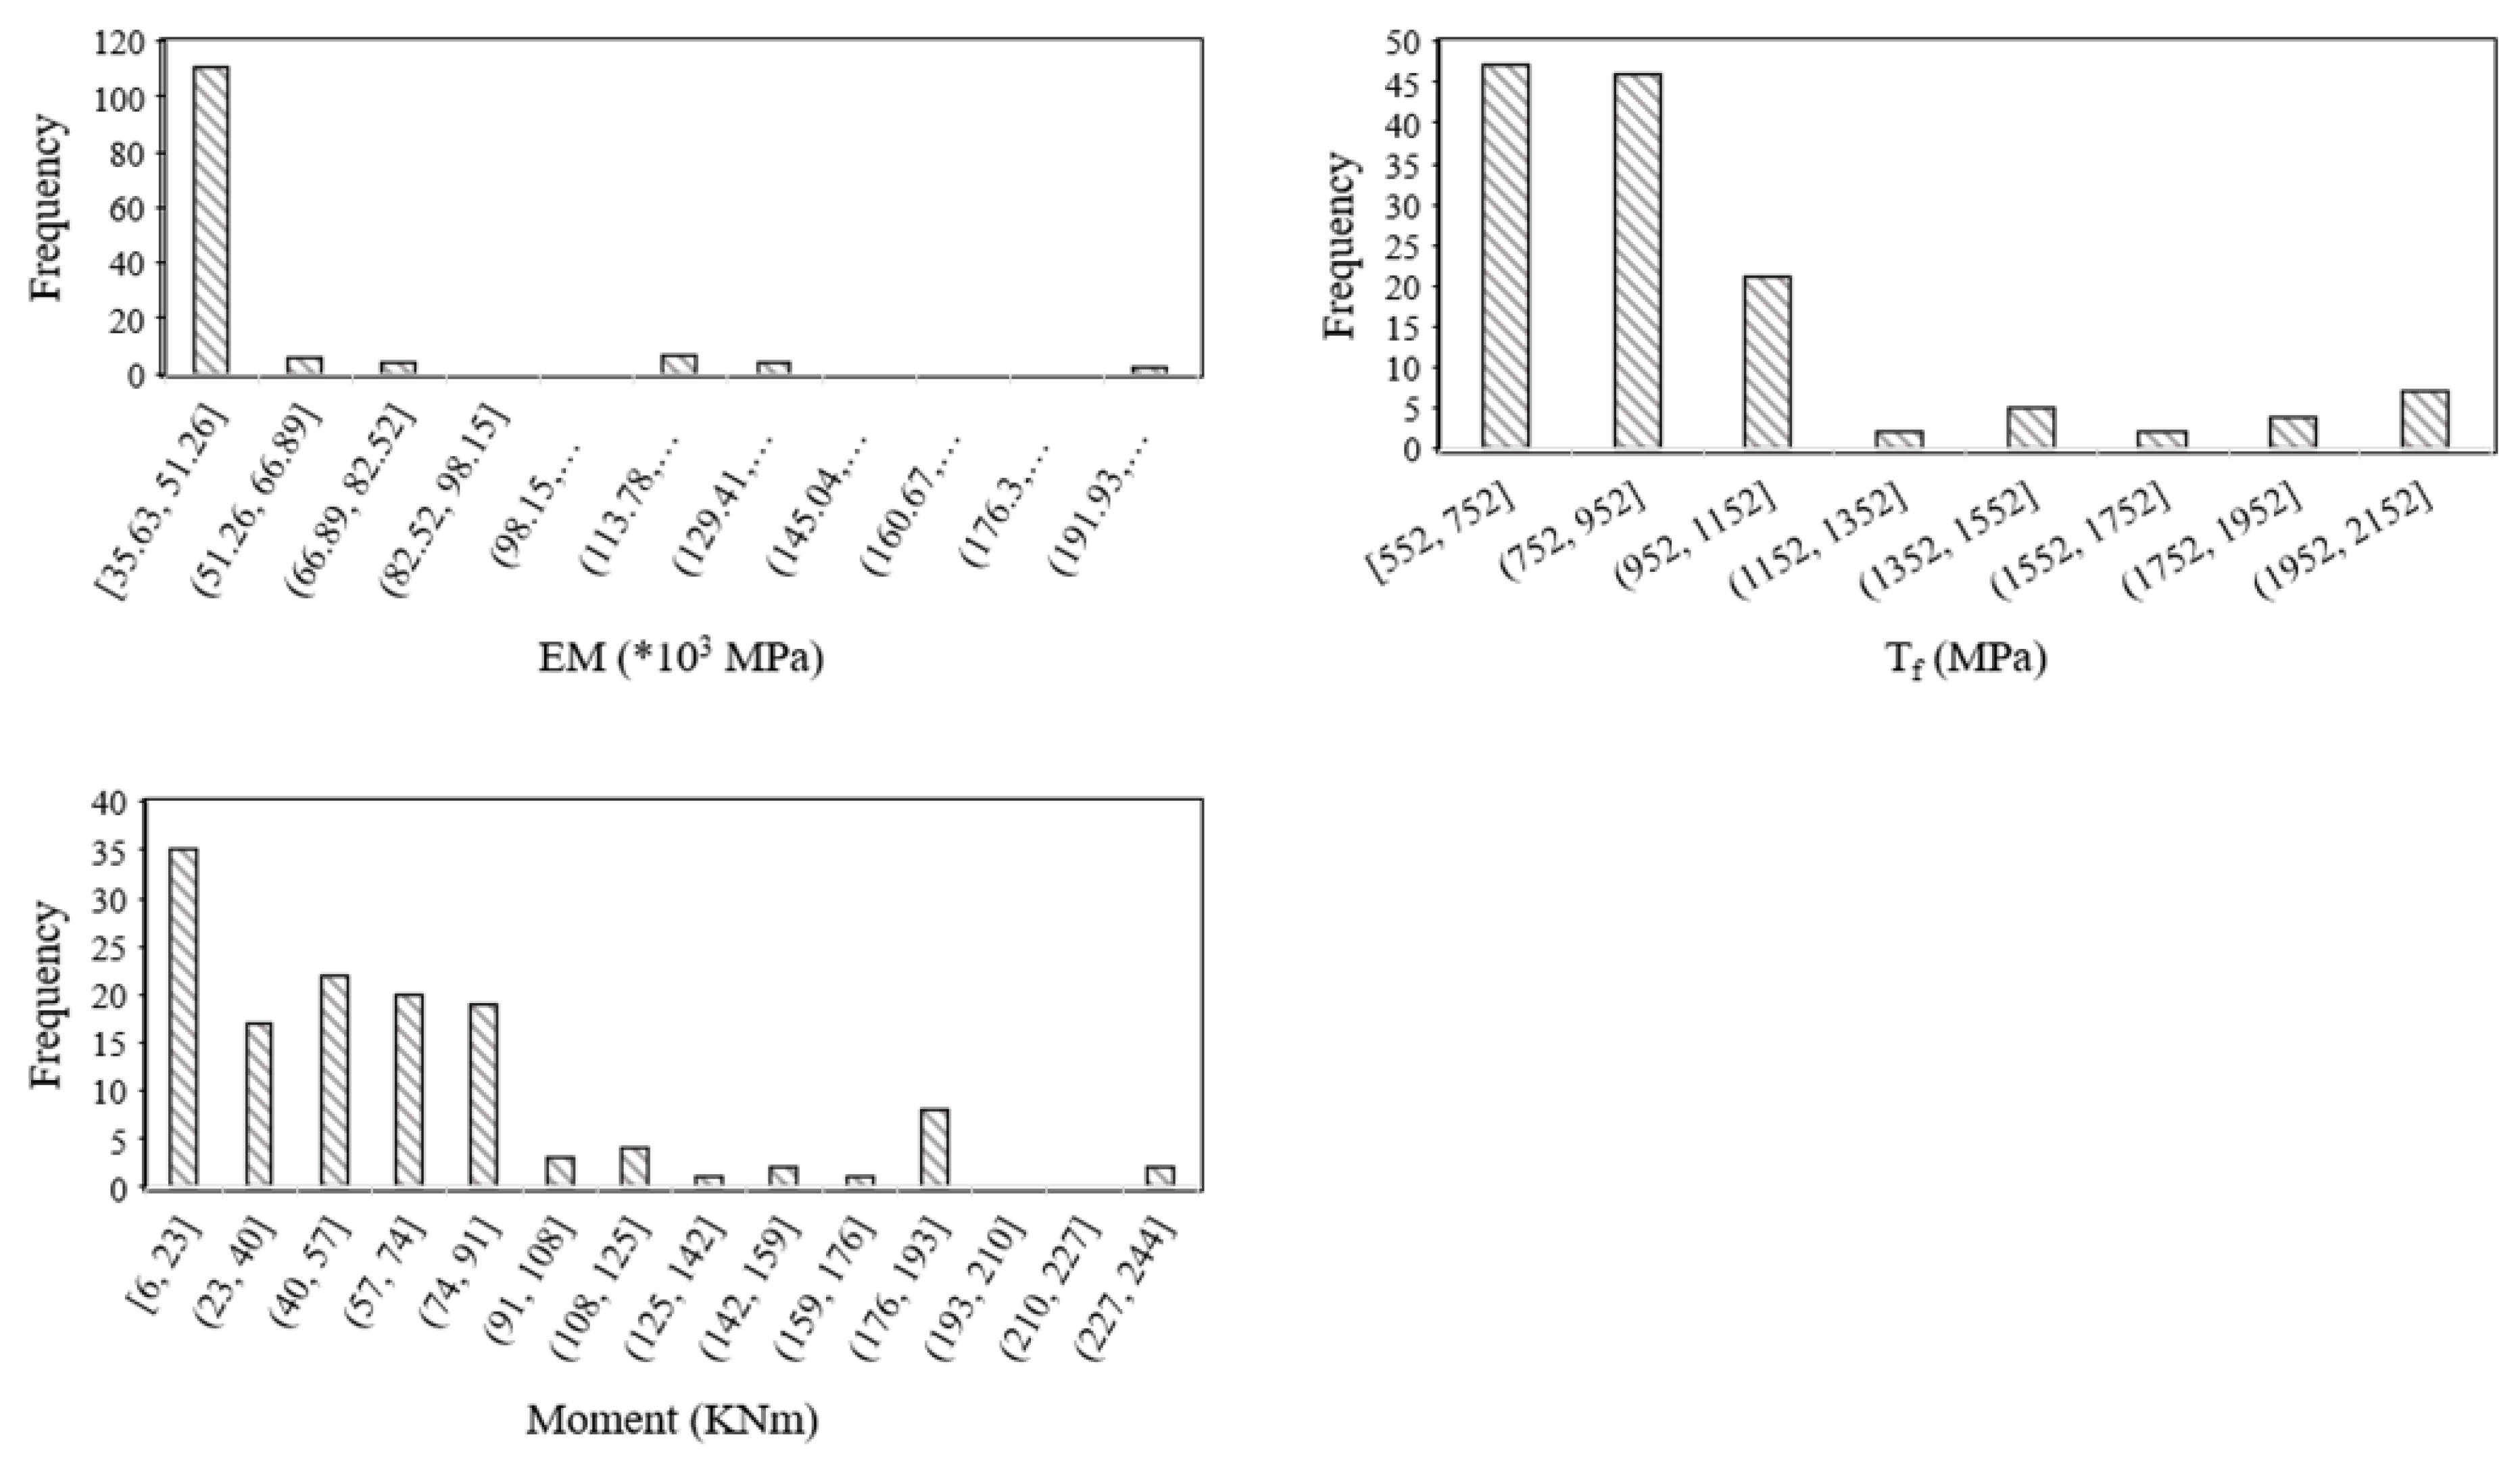
2.1. Experimental Database
2.2. Machine Learning Approaches
2.2.1. Decision Tree
2.2.2. Gradient Boosting Tree
2.2.3. Development of the Model and Hyper-Parameters Tuning
2.2.4. Evaluation Criteria
3. Results and Discussions
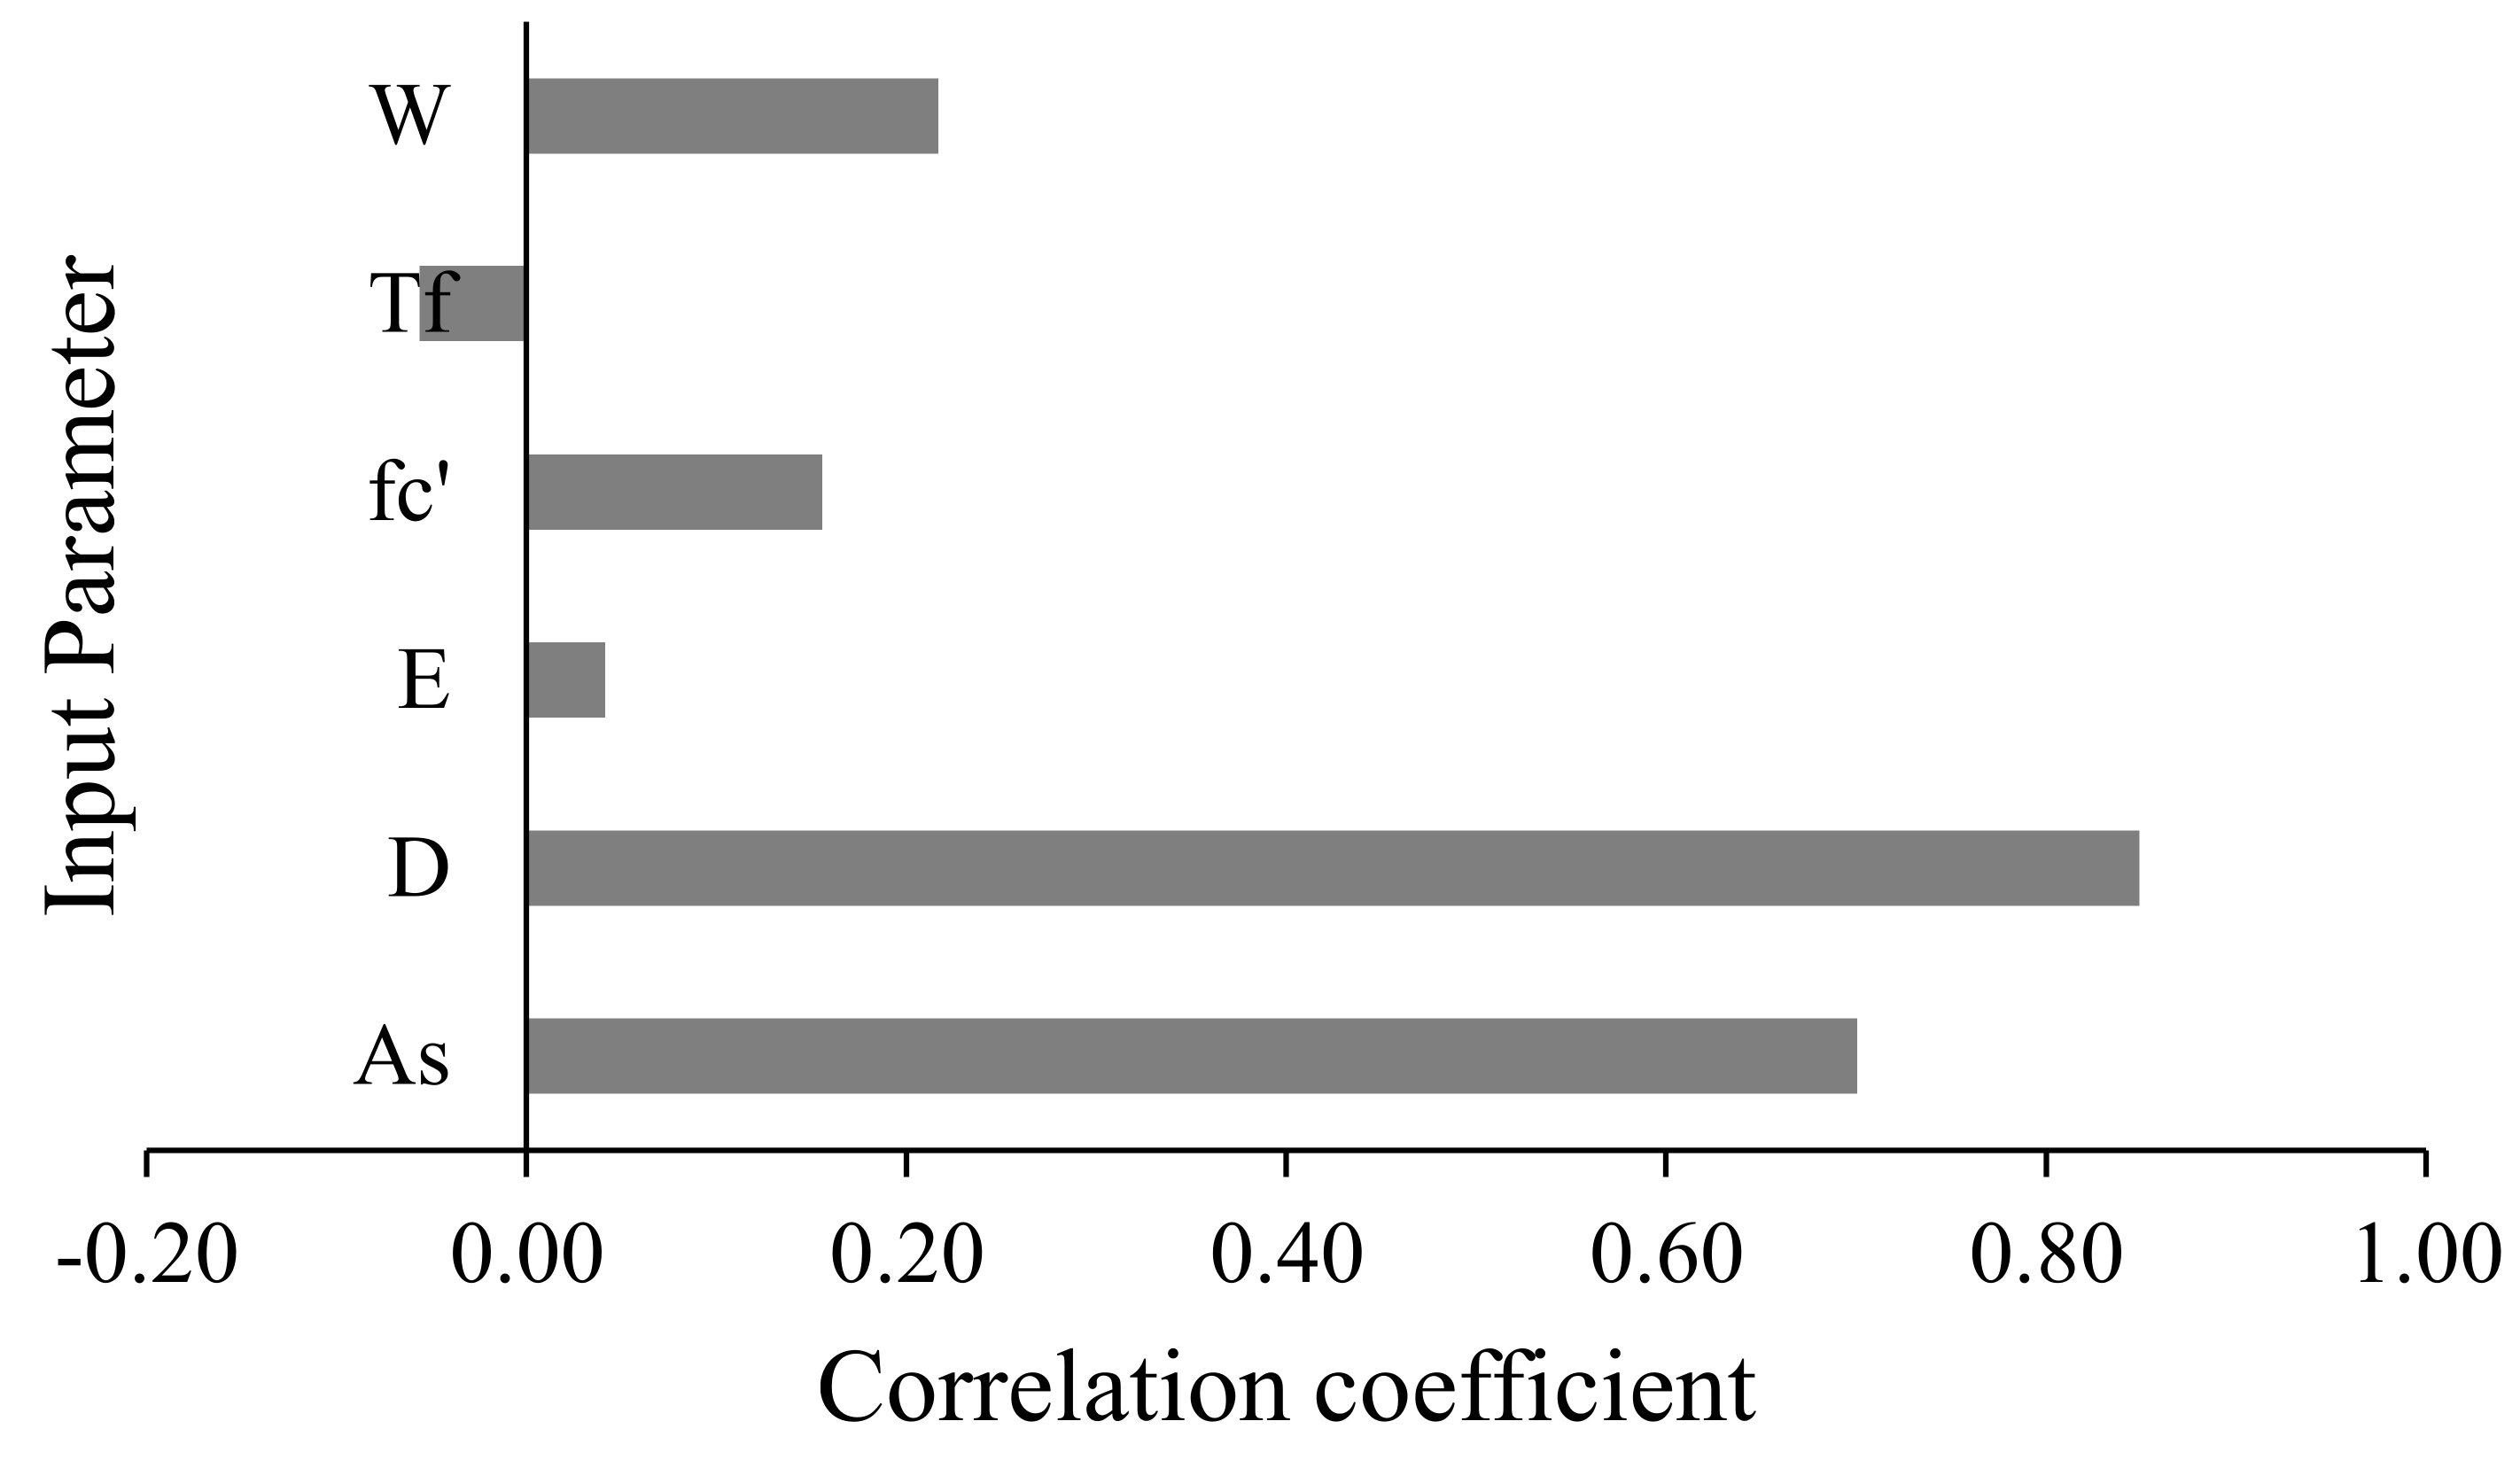
3.1. Pearson’s Linear Correlations
3.2. Prediction Performance of the Developed Models
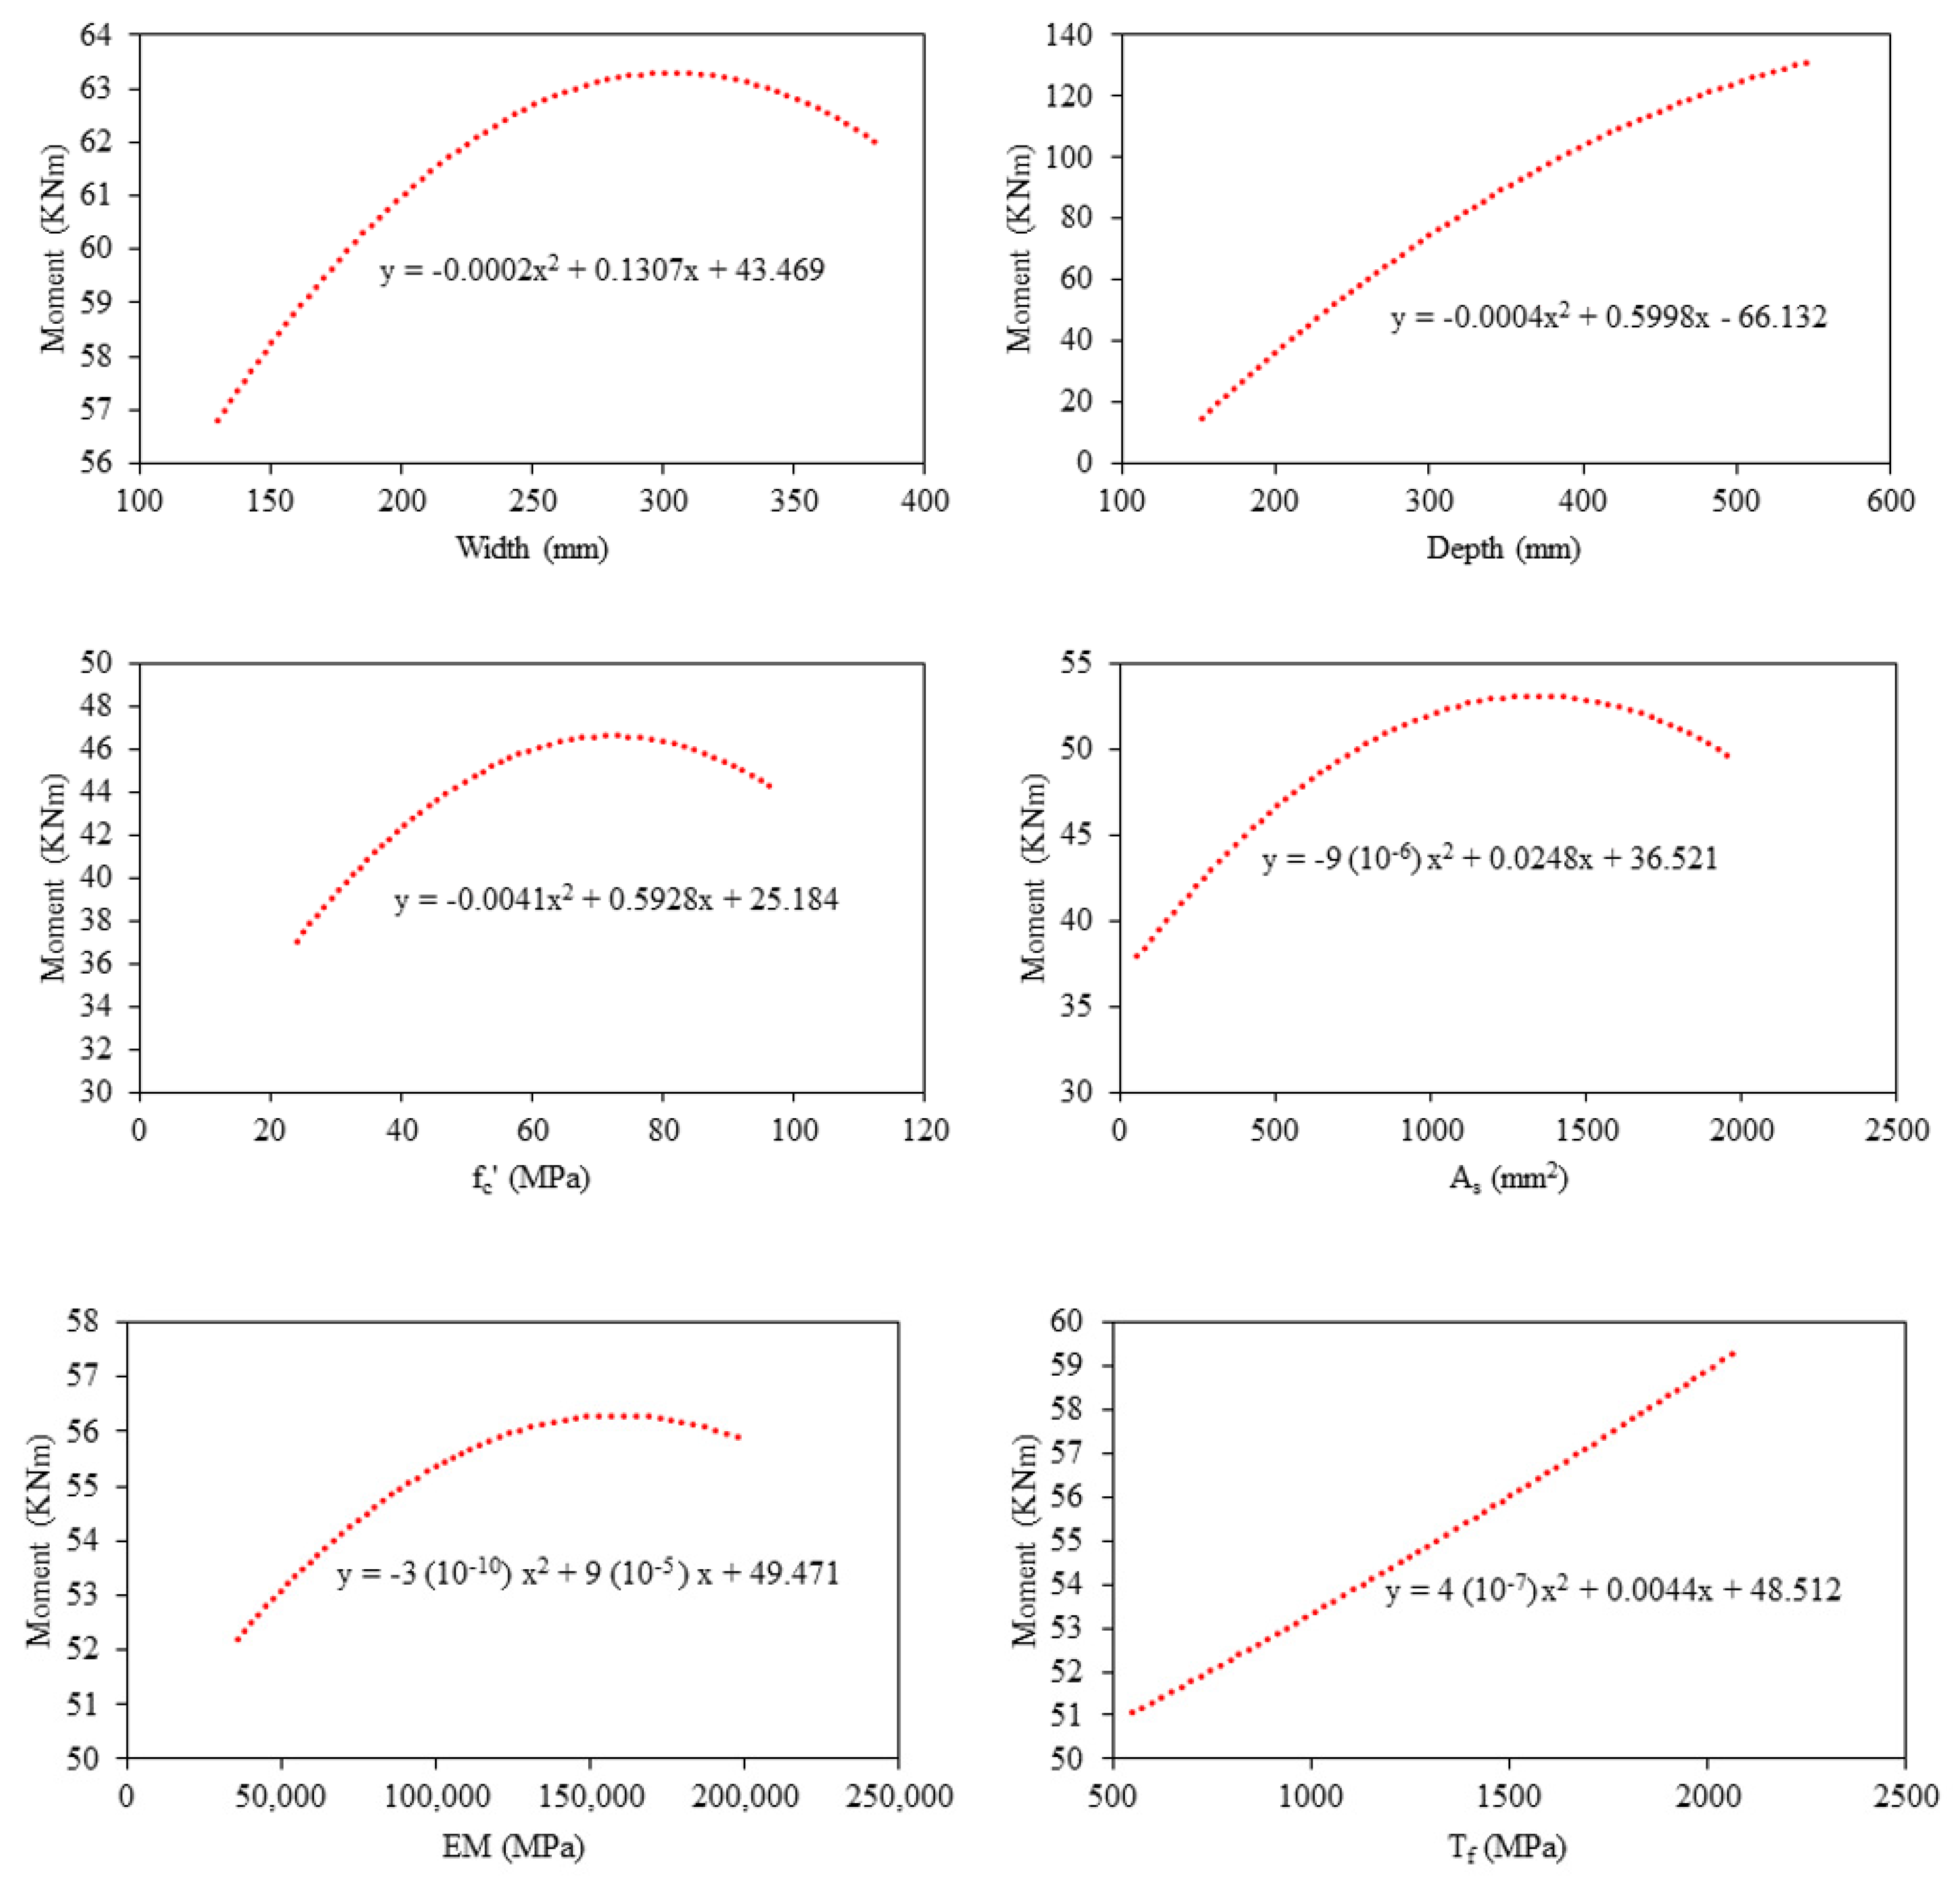
3.3. Second Level Validation of the Models (Parametric and Sensitivity Analysis)
3.4. Comparison with Previously Developed Models and ACI
4. Conclusions
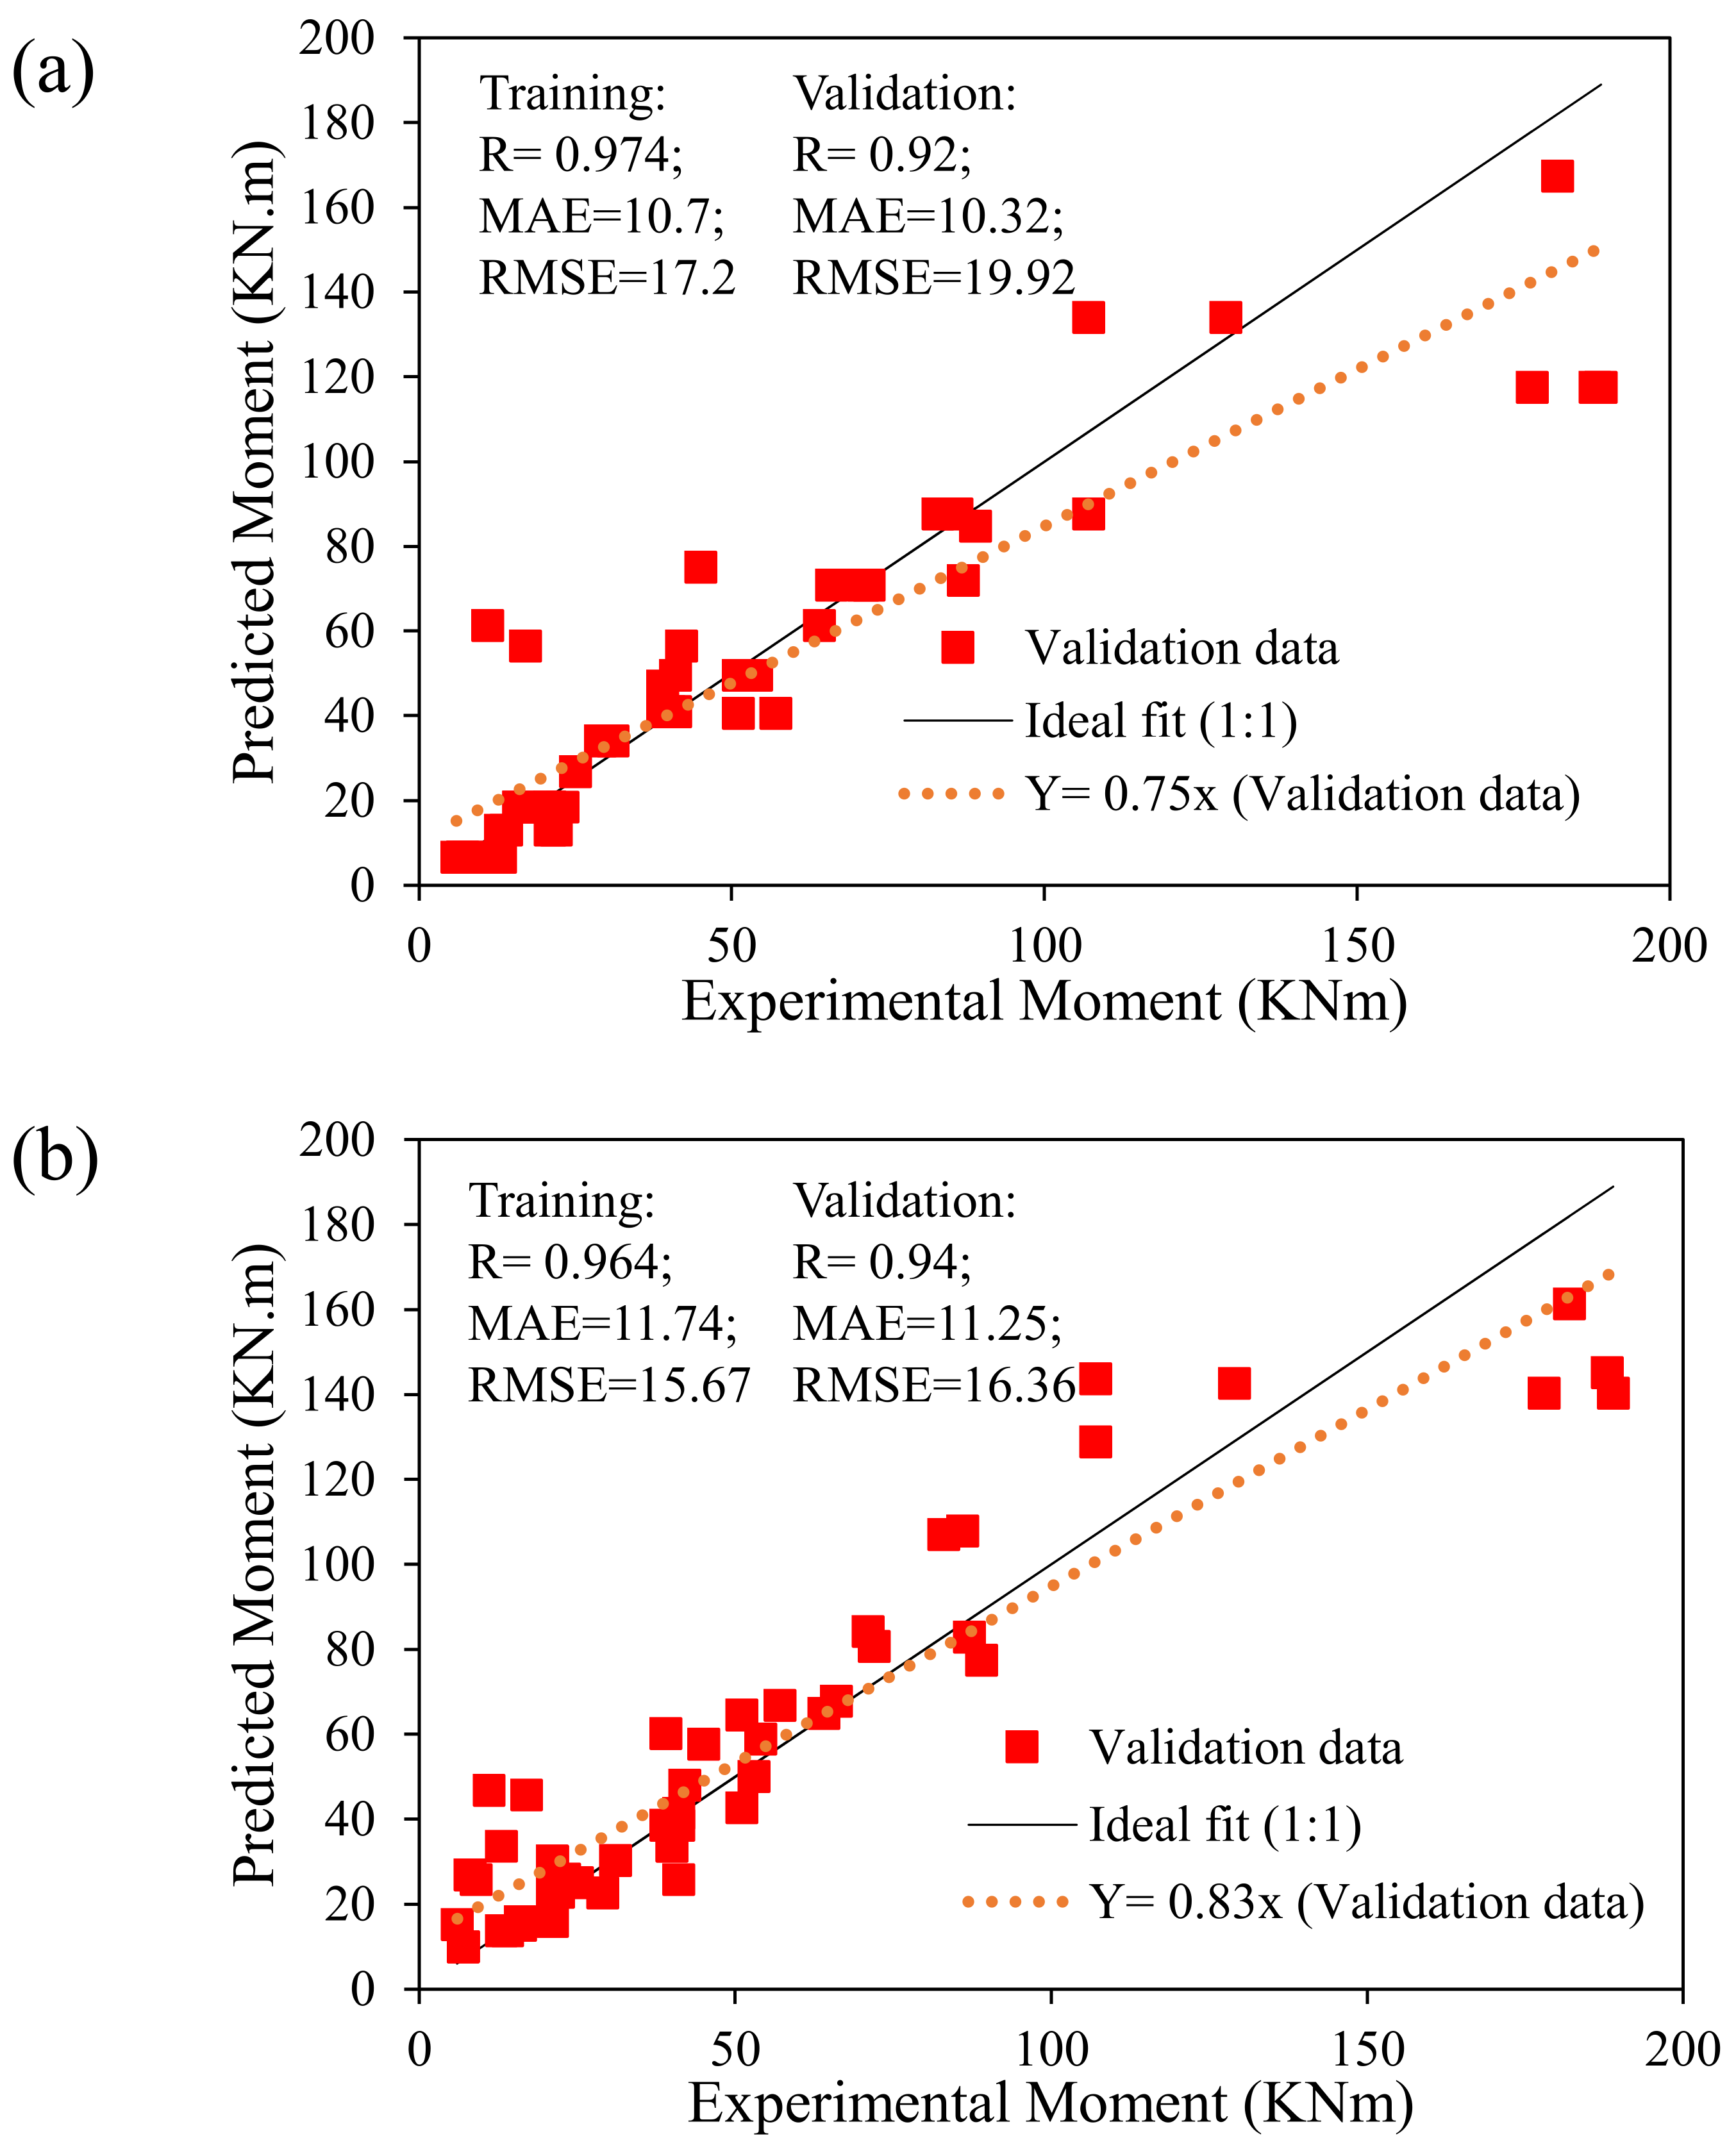
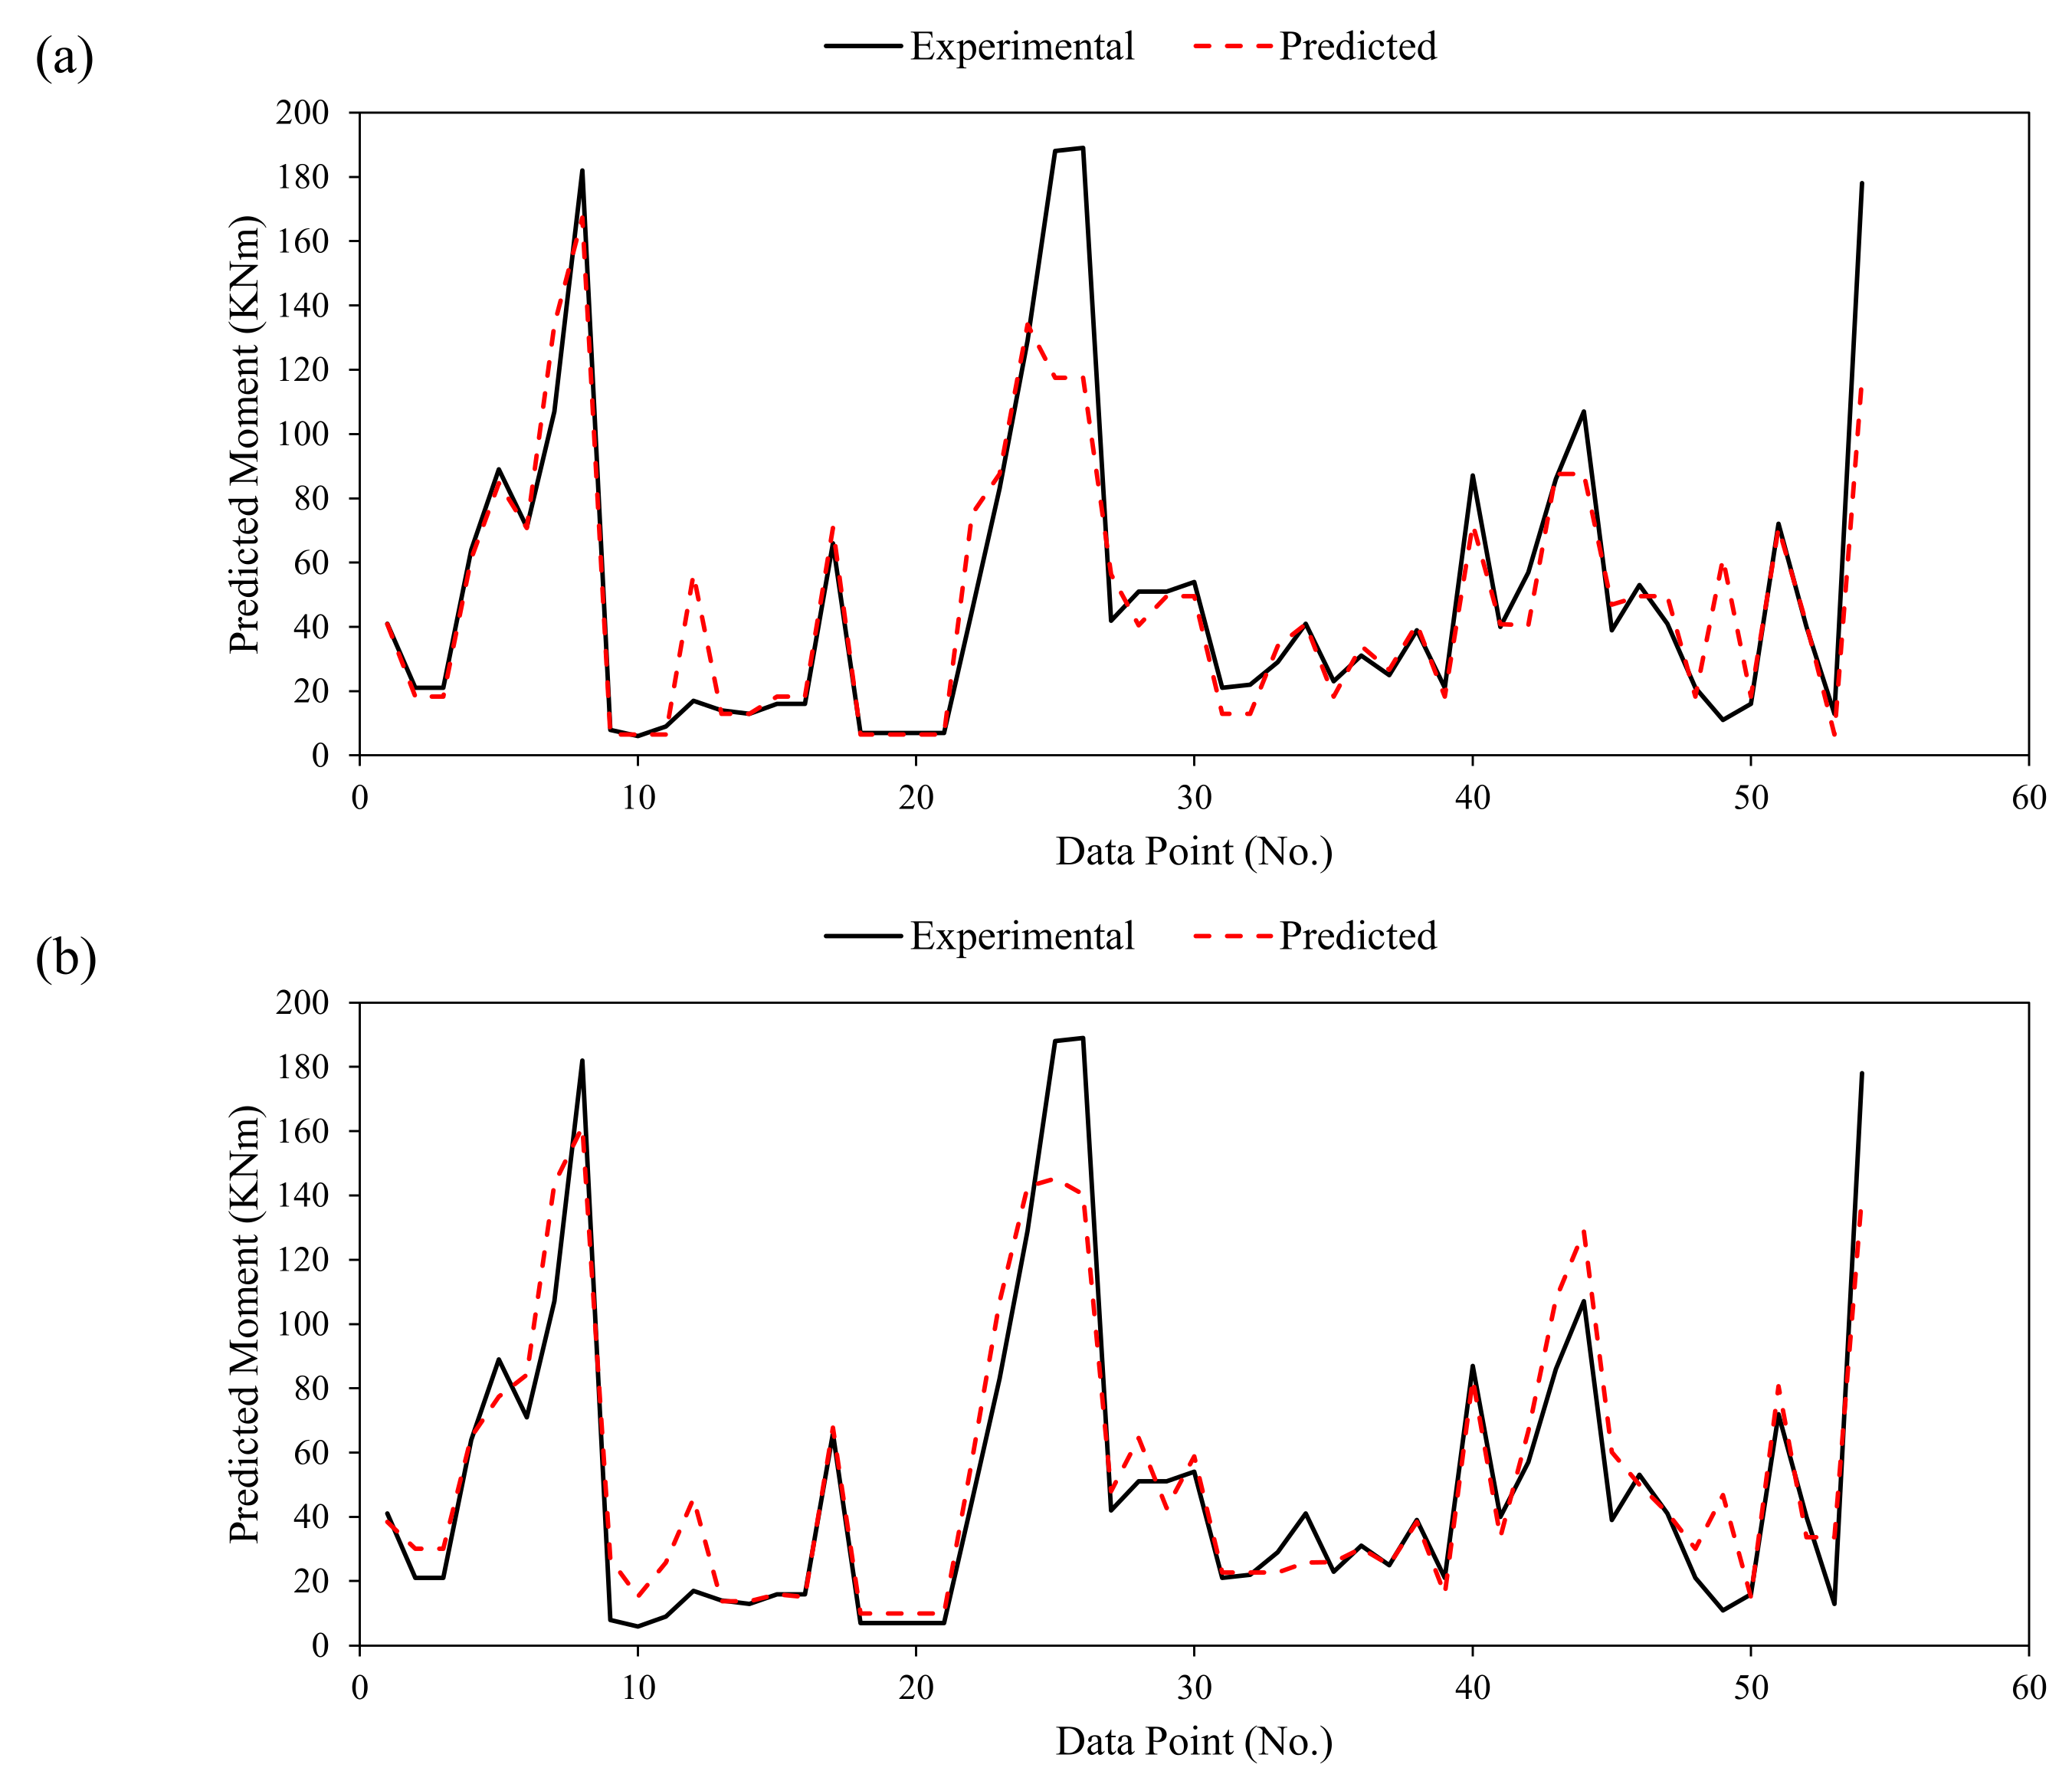
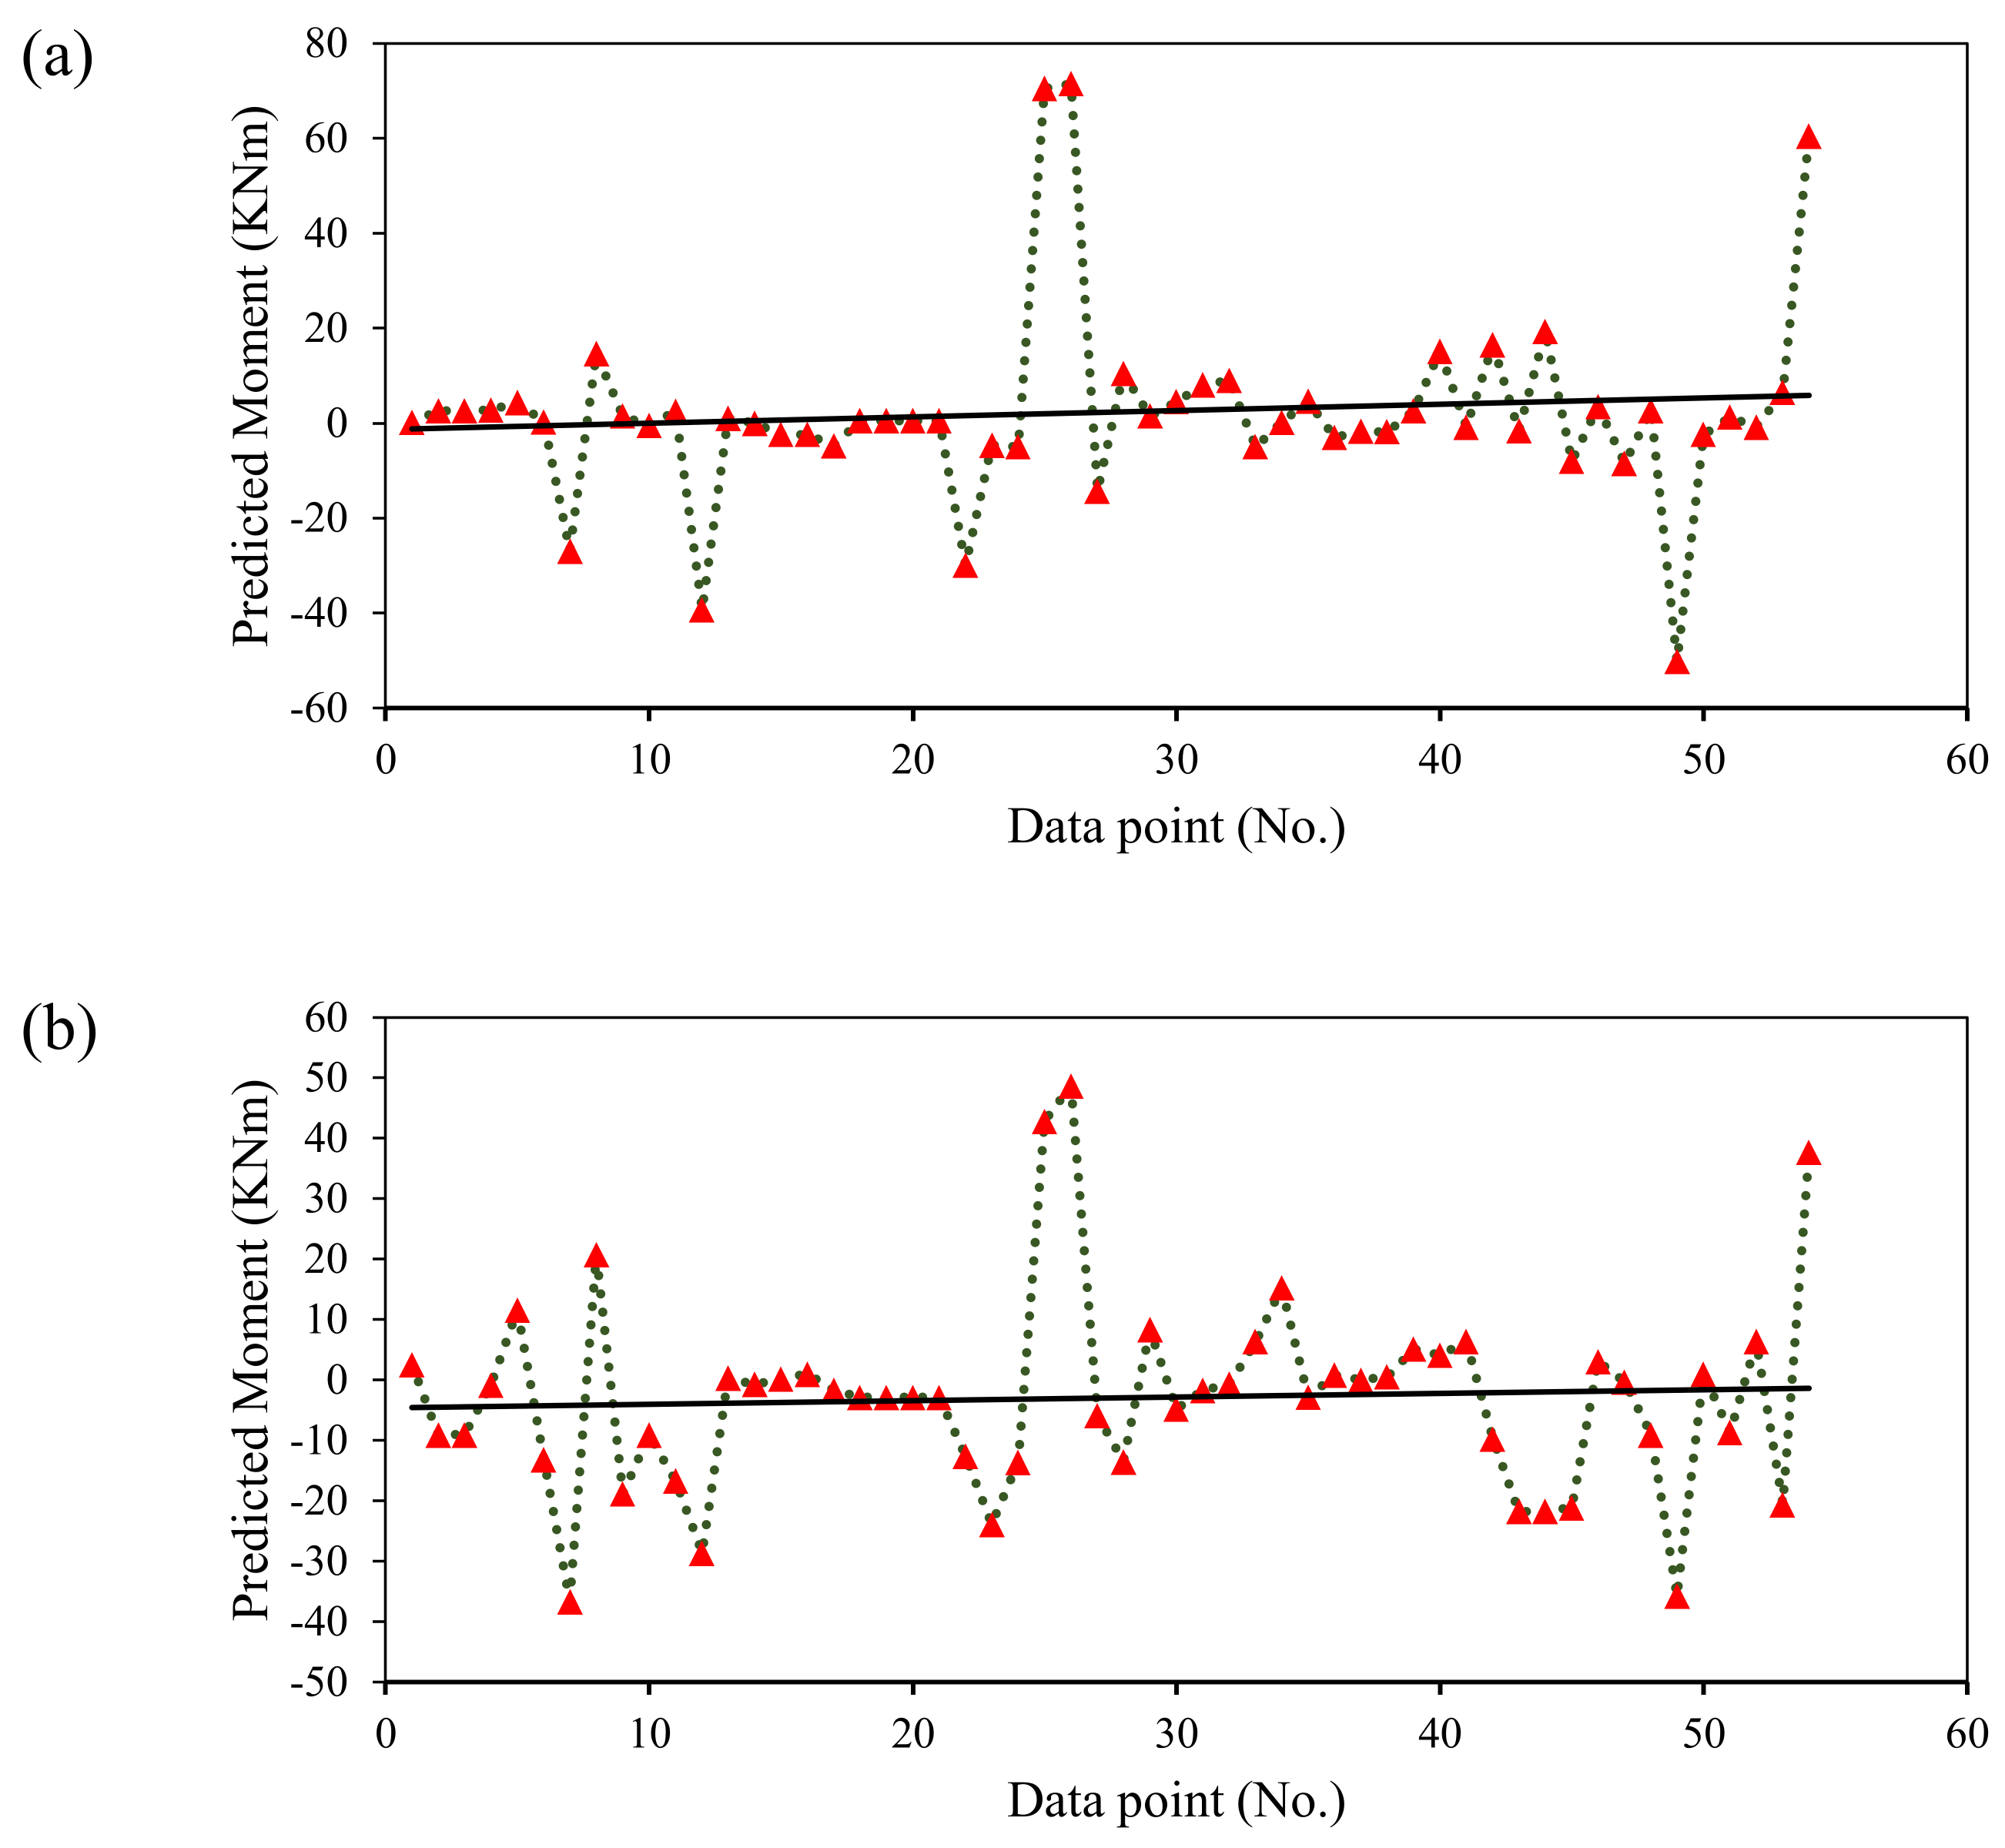
- The value of the correlation coefficient (R) for DT and GBT models were significantly higher than 0.8 (0.974 and 0.964 for the training stage and 0.92 and 0.94 for the validation stage, respectively), reflecting a solid agreement of input attributes in predicting flexural strength. Error evaluation such as MAE (10.32 kN-m) showed lower values in the validation phase in the case of DT models, whereas lower RMSE (16.36 kN-m) in the GBT model was observed. The performance of both the models were comparable; however, based on the comparison of the slope of validation data recorded as 0.83 (more closer to 1) for GBT models against 0.75 for the DT model and higher R for the validation phase, the GBT model can be considered more accurate and robust.
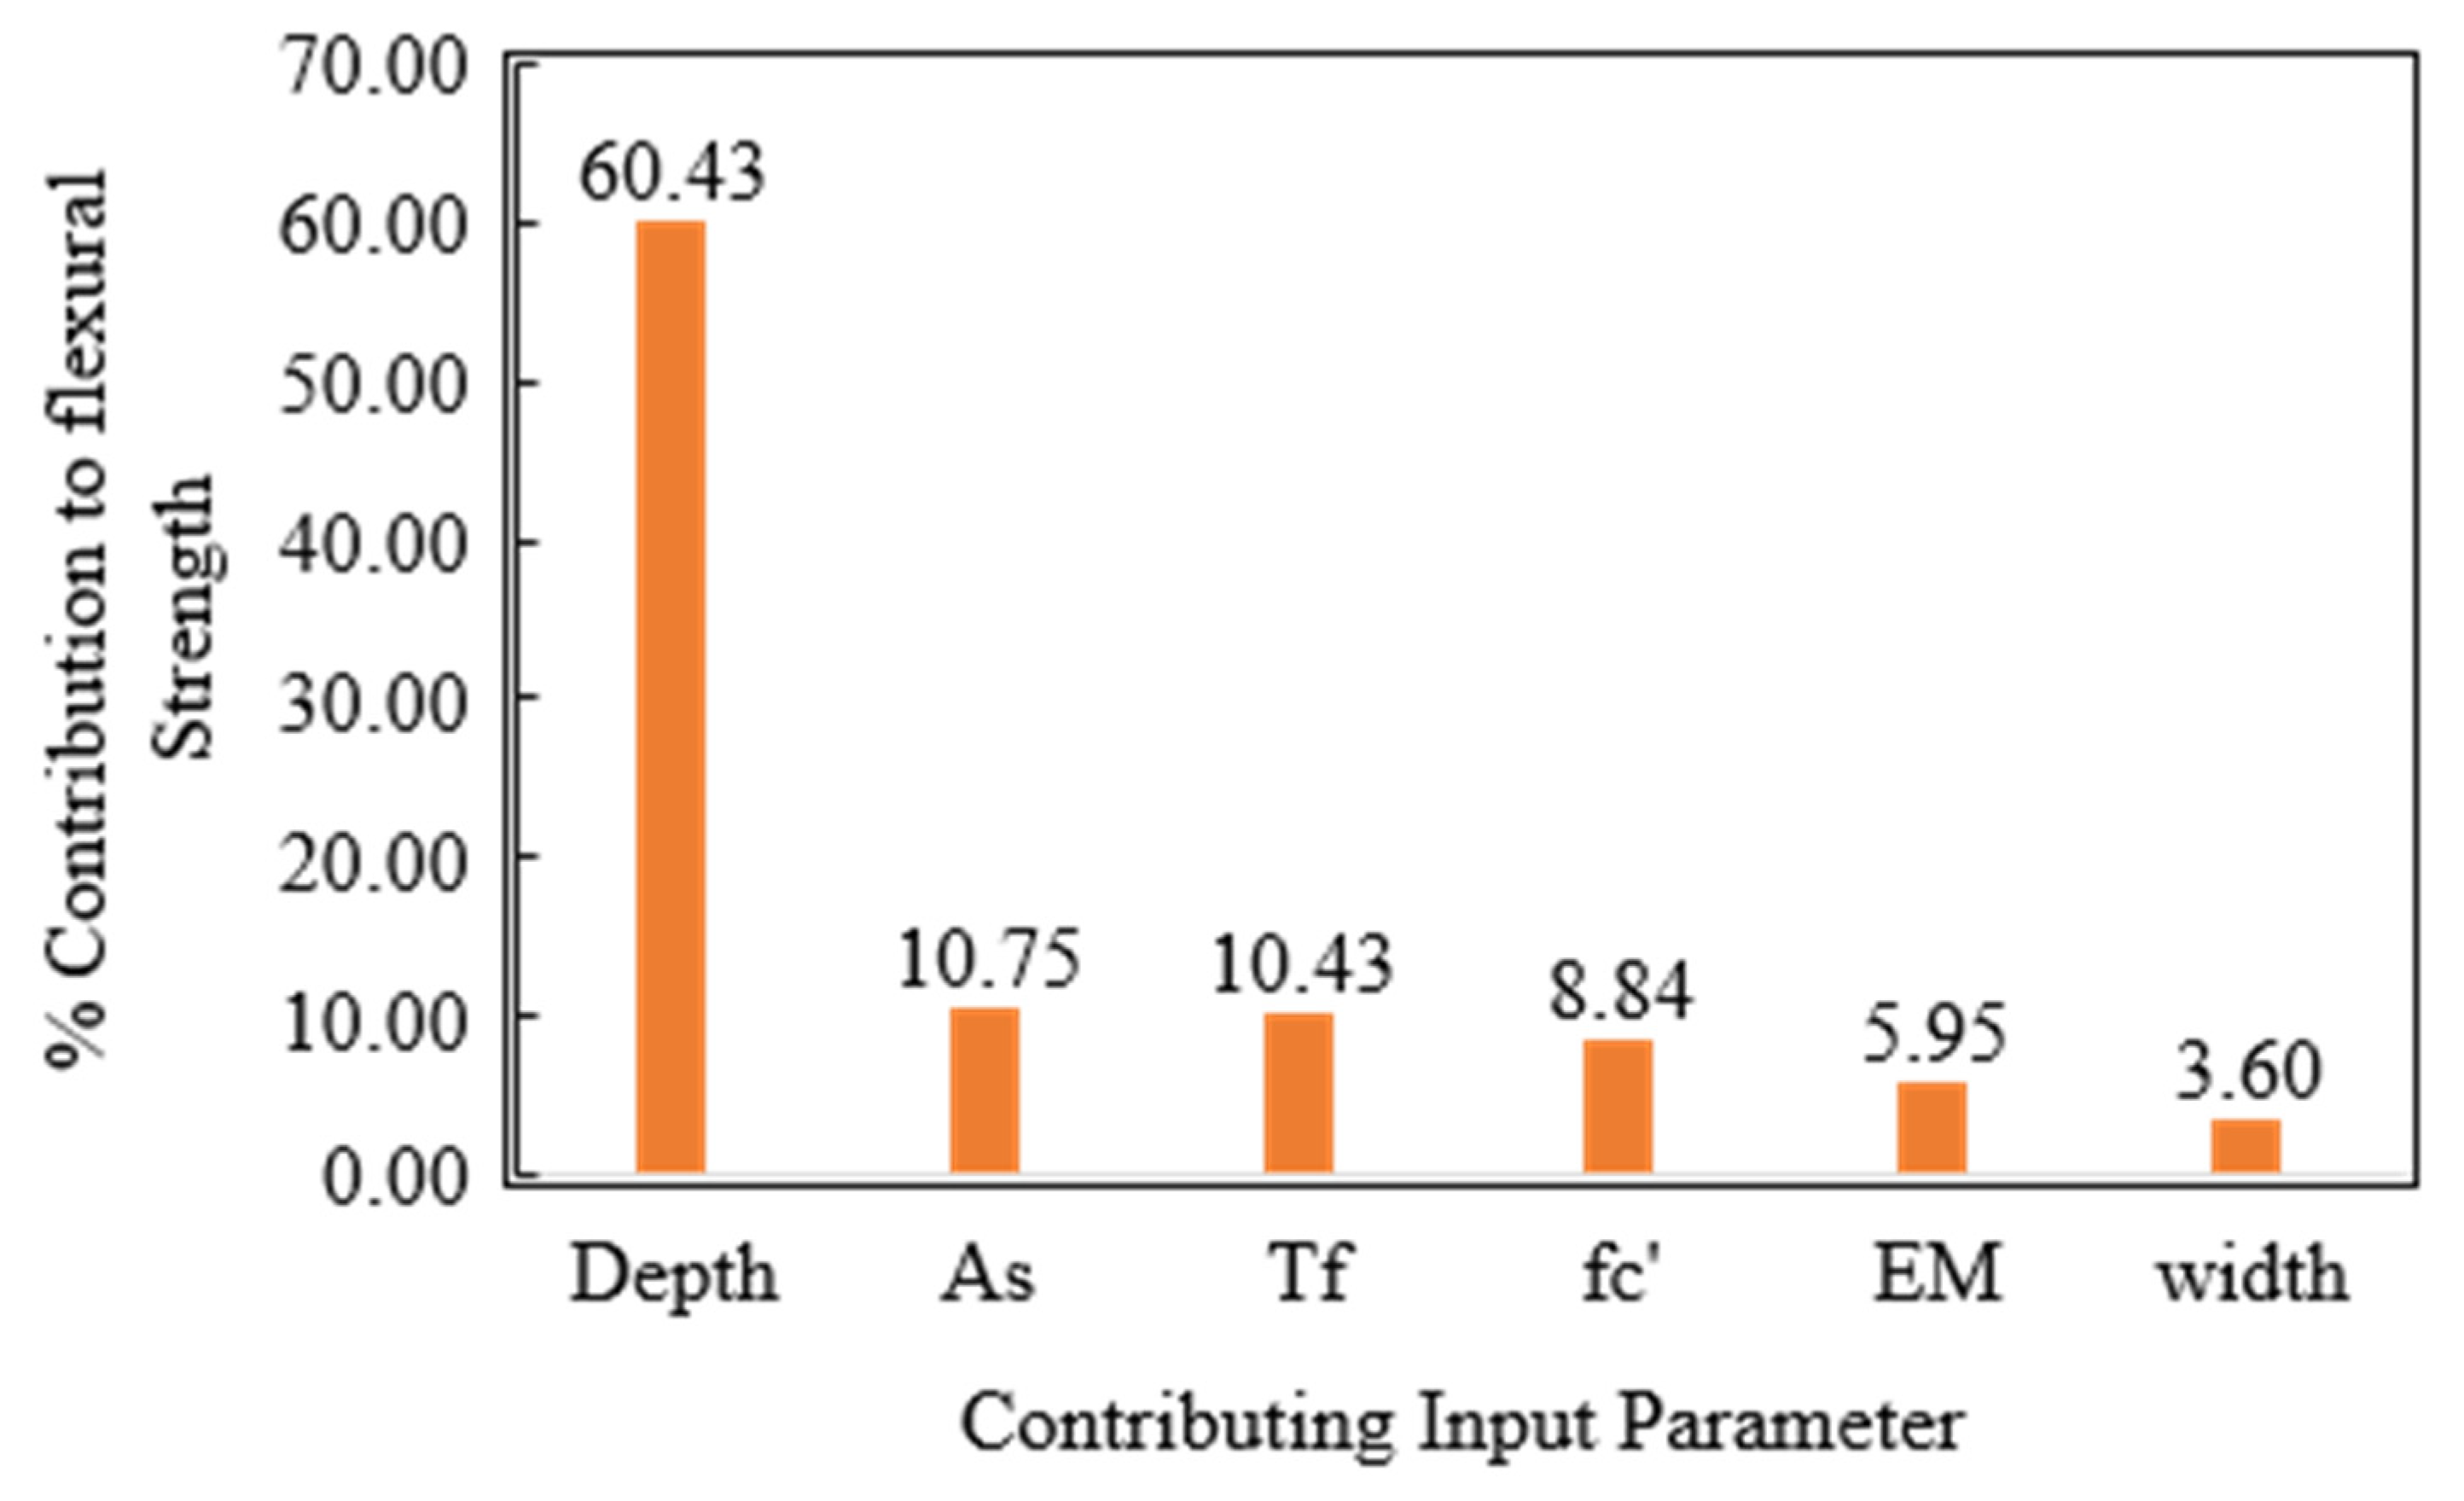
- The parametric study revealed a similar trend of the target variables with the change in the input variables coherent with the literature, further validating the trained model. The sensitivity analysis revealed the depth of the beam as the most influential parameter contributing towards flexural strength.
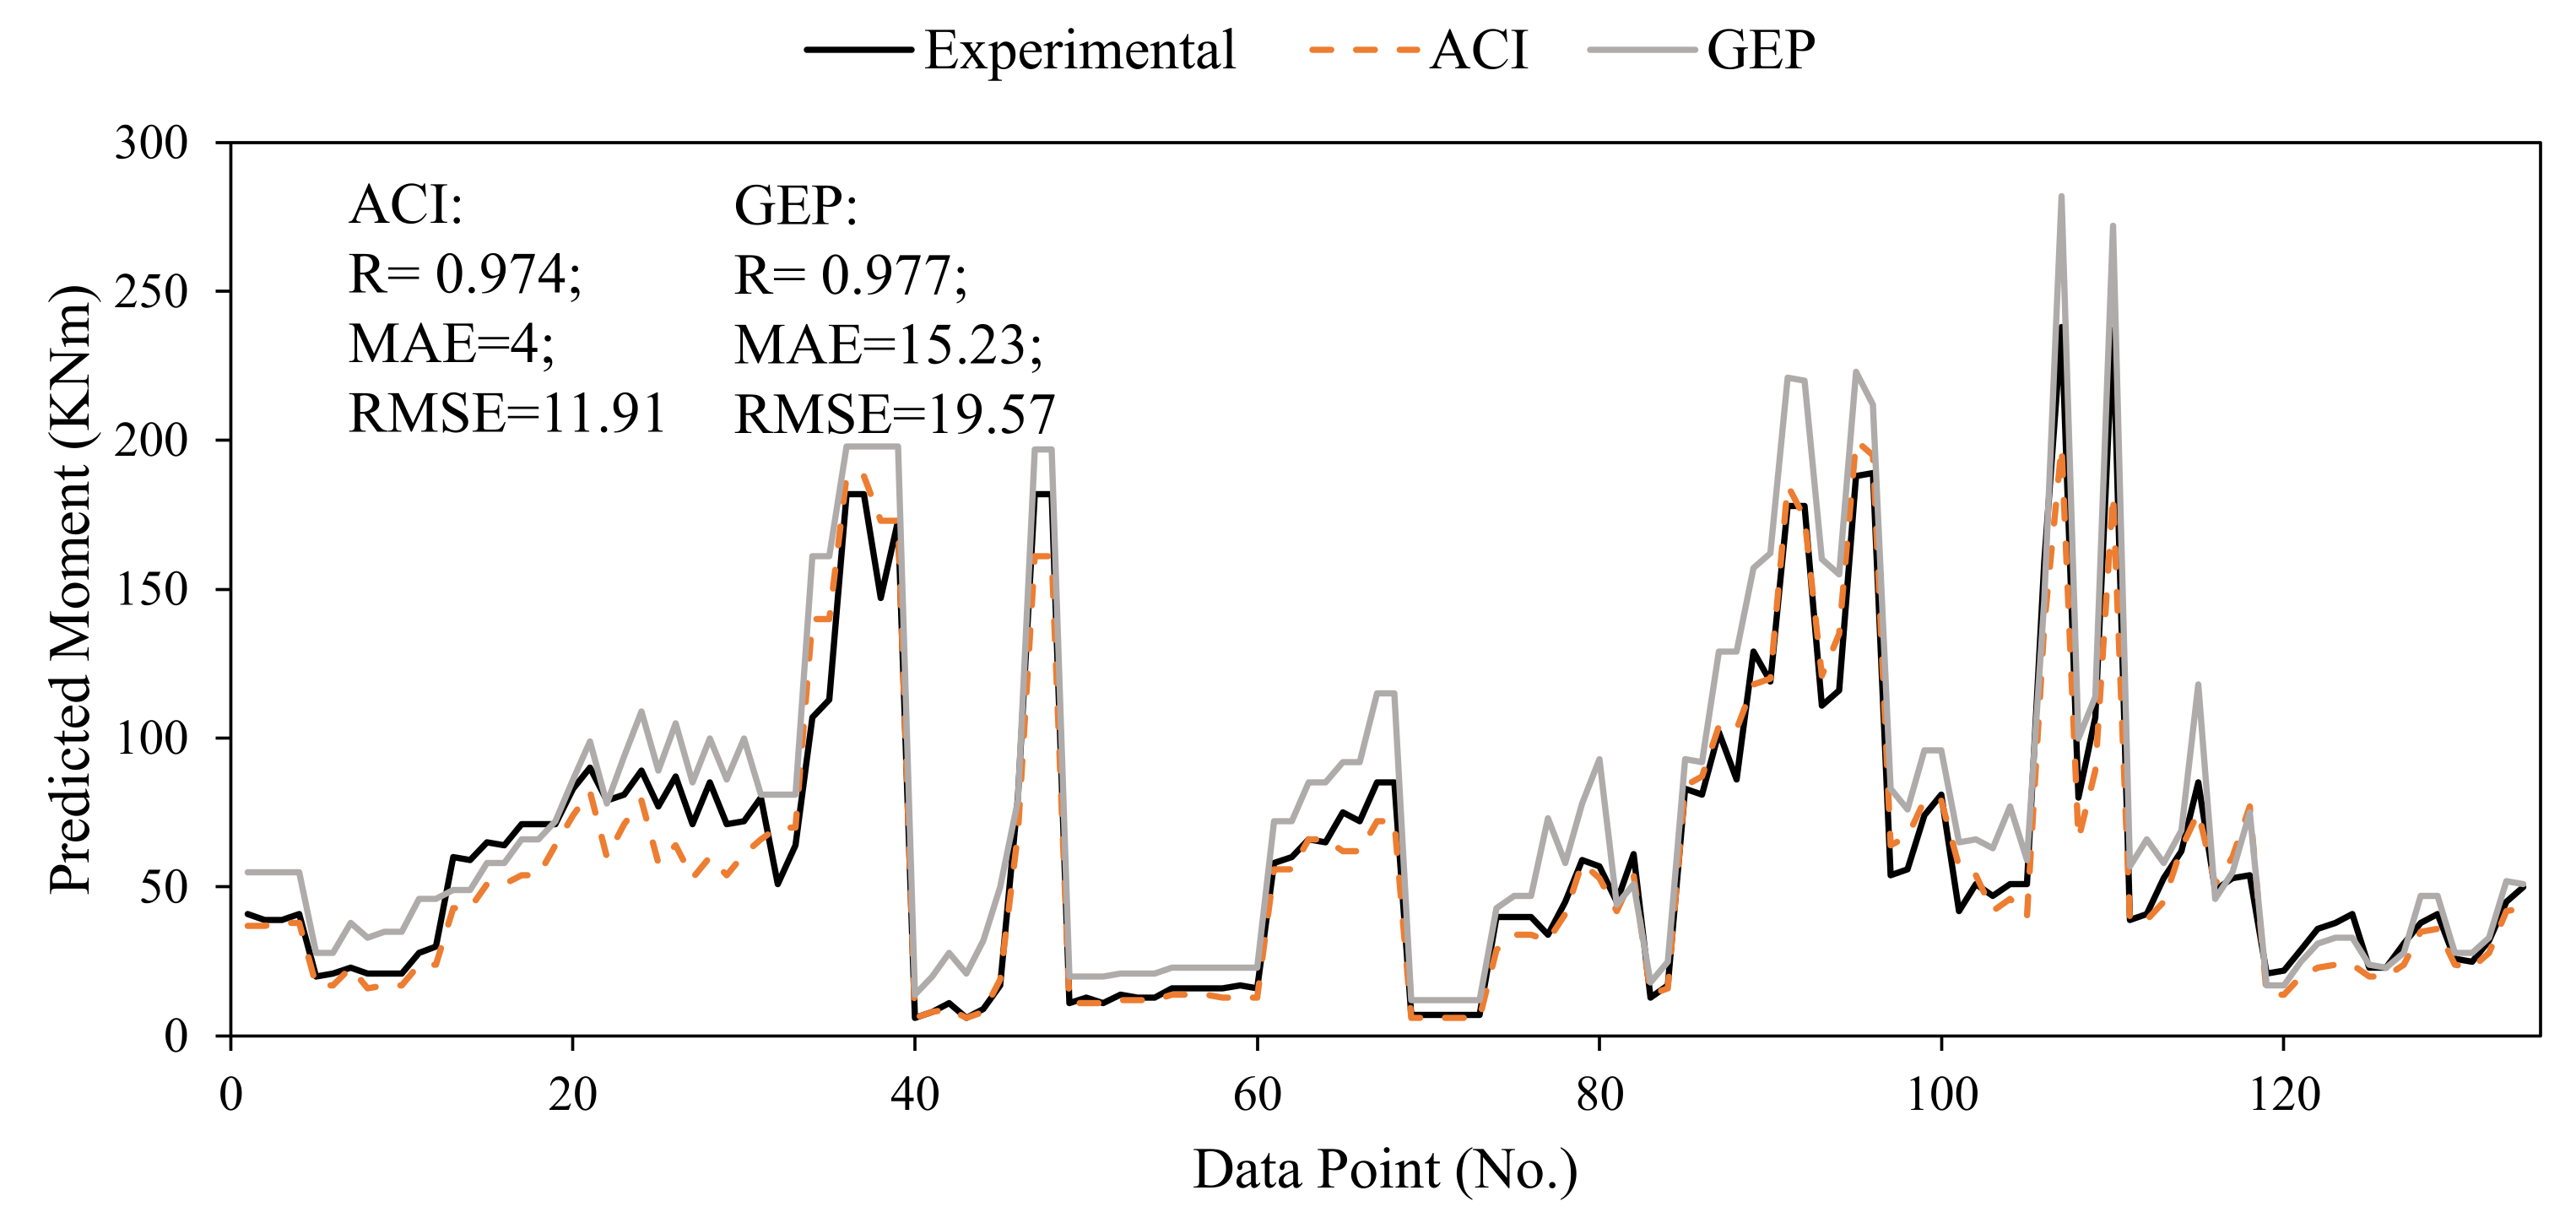
- The currently developed GBT model surpassed the accuracy of the previously developed GEP model. Hence, the GBT model can effectively predict flexural strength; however, the existing ACI equations are more reliable than the current and previously developed AI models. While comparing the models, it was shown that R should not be used as a single parameter in assessing the performance of the AI models; rather, a few error indices, specifically the MAE should be included.
Author Contributions
Funding
Data Availability Statement
Acknowledgments
Conflicts of Interest
References
- Van Damme, H. Concrete material science: Past, present, and future innovations. Cem. Concr. Res. 2018, 112, 5–24. [Google Scholar] [CrossRef]
- Bart, F.; Cau-di-Coumes, C.; Frizon, F.; Lorente, S. Cement-Based Materials for Nuclear Waste Storage; Springer Science & Business Media: Berlin/Heidelberg, Germany, 2012. [Google Scholar]
- Broomfield, J. Corrosion of Steel in Concrete: Understanding, Investigation and Repair; CRC Press: Boca Raton, FL, USA, 2003. [Google Scholar]
- Rodrigues, R.; Gaboreau, S.; Gance, J.; Ignatiadis, I.; Betelu, S. Reinforced concrete structures: A review of corrosion mechanisms and advances in electrical methods for corrosion monitoring. Constr. Build. Mater. 2021, 269, 121240. Available online: https://0-www-sciencedirect-com.brum.beds.ac.uk/science/article/pii/S095006182033244X (accessed on 30 November 2021). [CrossRef]
- Böhni, H. Corrosion in Reinforced Concrete Structures; Elsevier: Amsterdam, The Netherlands, 2005. [Google Scholar]
- Ahmad, S. Reinforcement corrosion in concrete structures, its monitoring and service life prediction—A review. Cem. Concr. Compos. 2003, 25, 459–471. [Google Scholar] [CrossRef]
- Polder, R.B.; Peelen, W.H.A.; Courage, W.M.G. Non-traditional assessment and maintenance methods for aging concrete structures—Technical and non-technical issues. Mater. Corros. 2012, 63, 1147–1153. [Google Scholar] [CrossRef]
- Angst, U.M. Challenges and opportunities in corrosion of steel in concrete. Mater. Struct. 2018, 51, 1–20. [Google Scholar] [CrossRef] [Green Version]
- Xiao, J.; Qiang, C.; Nanni, A.; Zhang, K. Use of sea-sand and seawater in concrete construction: Current status and future opportunities. Constr. Build. Mater. 2017, 155, 1101–1111. [Google Scholar] [CrossRef]
- Iqbal, M.; Zhao, Q.; Zhang, D.; Jalal, F.E.; Jamal, A. Evaluation of tensile strength degradation of gfrp rebars in harsh alkaline conditions using non-linear genetic-based models. Mater. Struct. 2021, 54, 1–20. [Google Scholar] [CrossRef]
- Benmokrane, B.; Manalo, A.; Bouhet, J.-C.; Mohamed, K.; Robert, M. Effects of diameter on the durability of glass-fiber-reinforced-polymer (gfrp) bars conditioned in alkaline solution. J. Compo. Constr. 2017, 21, 1–12. [Google Scholar] [CrossRef] [Green Version]
- Mousavi, T.; Shafei, E. Impact response of hybrid frp-steel reinforced concrete slabs. In Presented at Structures; Elsevier: Amsterdam, The Netherlands, 2019; Volume 19, pp. 436–448. [Google Scholar]
- Hassan, A.; Khairallah, F.; Mamdouh, H.; Kamal, M. Evaluation of self-compacting concrete columns reinforced with steel and frp bars with different strengthening techniques. In Presented at Structures; Elsevier: Amsterdam, The Netherlands, 2018; Volume 15, pp. 82–93. [Google Scholar]
- Li, Y.; Wang, Y.; Ou, J. Mechanical behavior of bfrp-steel composite plate under axial tension. Polymers 2014, 6, 1862–1876. [Google Scholar] [CrossRef]
- Iqbal, M.; Zhang, D.; Jalal, F.E. Durability evaluation of gfrp rebars in harsh alkaline environment using optimized tree-based random forest model. J. Ocean Eng. Sci. 2021. [Google Scholar] [CrossRef]
- Bencardino, F.; Condello, A.; Ombres, L. Numerical and analytical modeling of concrete beams with steel, frp and hybrid frp-steel reinforcements. Compos. Struct. 2016, 140, 53–65. [Google Scholar] [CrossRef]
- Zhou, Y.; Zheng, Y.; Pan, J.; Sui, L.; Xing, F.; Sun, H.; Li, P. Experimental investigations on corrosion resistance of innovative steel-frp composite bars using X-ray microcomputed tomography. Compos. Part B Eng. 2019, 161, 272–284. [Google Scholar] [CrossRef]
- Zhou, J.; Chen, X.; Chen, S. Durability and service life prediction of gfrp bars embedded in concrete under acid environment. Nucl. Eng. Des. 2011, 241, 4095–4102. [Google Scholar] [CrossRef]
- Wang, L.; Mao, Y.; Lv, H.; Chen, S.; Li, W. Bond properties between frp bars and coral concrete under seawater conditions at 30, 60, and 80 °C. Constr. Build. Mater. 2018, 162, 442–449. [Google Scholar] [CrossRef]
- Li, S.; Guo, S.; Yao, Y.; Jin, Z.; Shi, C.; Zhu, D. The effects of aging in seawater and SWSSC and strain rate on the tensile performance of gfrp/bfrp composites: A critical review. Constr. Build. Mater. 2021, 282, 122534. Available online: https://0-www-sciencedirect-com.brum.beds.ac.uk/science/article/pii/S0950061821002944 (accessed on 30 November 2021). [CrossRef]
- Jin, Q.; Chen, P.; Gao, Y.; Du, A.; Liu, D.; Sun, L. Tensile strength and degradation of gfrp bars under combined effects of mechanical load and alkaline solution. Materials 2020, 13, 3533. [Google Scholar] [CrossRef]
- Chen, Y.; Davalos, J.F.; Ray, I.; Kim, H.-Y. Accelerated aging tests for evaluations of durability performance of frp reinforcing bars for concrete structures. Compos. Struct. 2007, 78, 101–111. [Google Scholar] [CrossRef]
- Chen, Y.; Davalos, J.F.; Ray, I. Durability prediction for gfrp reinforcing bars using short-term data of accelerated aging tests. J. Compos. Constr. 2006, 10, 279–286. [Google Scholar] [CrossRef]
- Daelemans, L.; Van Paepegem, W.; D’Hooge, D.R.; De Clerck, K. Excellent nanofiber adhesion for hybrid polymer materials with high toughness based on matrix interdiffusion during chemical conversion. Adv. Funct. Mater. 2018, 29, 1807434. [Google Scholar] [CrossRef] [Green Version]
- Nanni, A. Guide for the design and construction of concrete reinforced with frp bars (ACI 440.1R-03). In Structures Congress 2005; American Society of Civil Engineers: Reston, VA, USA, 2005; pp. 1–6. [Google Scholar]
- Murad, Y.; Tarawneh, A.; Arar, F.; Al-Zu’Bi, A.; Al-Ghwairi, A.; Al-Jaafreh, A.; Tarawneh, M. Flexural strength prediction for concrete beams reinforced with FRP bars using gene expression programming. Structures 2021, 33, 3163–3172. Available online: https://0-www-sciencedirect-com.brum.beds.ac.uk/science/article/pii/S2352012421005506 (accessed on 30 November 2021). [CrossRef]
- Joshani, M.; Koloor, S.; Abdullah, R. Damage Mechanics Model for Fracture Process of Steel-Concrete Composite Slabs. Appl. Mech. Mater. 2012, 165, 339–345. Available online: https://www.scientific.net/AMM.165.339 (accessed on 30 November 2021). [CrossRef]
- Lammens, N.; Luyckx, G.; VAN Paepegem, W.; Degrieck, J. Finite element prediction of resin pocket geometries around arbitrary inclusions in composites: Case study for an embedded optical fiber interrogator. Compos. Struct. 2016, 146, 95–107. [Google Scholar] [CrossRef]
- Sevenois, R.D.B.; VAN Paepegem, W. Fatigue damage modeling techniques for textile composites: Review and comparison with unidirectional composite modeling techniques. Appl. Mech. Rev. 2015, 67, 020802. [Google Scholar] [CrossRef]
- Trong, D.K.; Pham, B.T.; Jalal, F.E.; Iqbal, M.; Roussis, P.C.; Mamou, A.; Ferentinou, M.; Vu, D.Q.; Dam, N.D.; Tran, Q.A.; et al. On random subspace optimization-based hybrid computing models predicting the california bearing ratio of soils. Materials 2021, 14, 6516. [Google Scholar] [CrossRef] [PubMed]
- Tran, T.-H.; Dam, N.D.; Jalal, F.E.; Al-Ansari, N.; Ho, L.S.; Van Phong, T.; Iqbal, M.; Van Le, H.; Nguyen, H.B.T.; Prakash, I.; et al. GIS-based soft computing models for landslide susceptibility mapping: A case study of pithoragarh district, uttarakhand state, India. Math. Probl. Eng. 2021, 2021, 9914650. [Google Scholar] [CrossRef]
- Jamal, A.; Al-Ahmadi, H.M.; Butt, F.M.; Iqbal, M.; Almoshaogeh, M.; Ali, S. Metaheuristics for Traffic Control and Optimization: Current Challenges and Prospects. 2021. Available online: https://www.intechopen.com/online-first/78022 (accessed on 30 November 2021).
- Jalal, F.E.; Xu, Y.; Li, X.; Jamhiri, B.; Iqbal, M. Fractal approach in expansive clay-based materials with special focus on compacted gmz bentonite in nuclear waste disposal: A systematic review. Environ. Sci. Pollut. Res. 2021, 28, 43287–43314. [Google Scholar] [CrossRef]
- Iqbal, M.; Onyelowe, K.C.; Jalal, F.E. Smart computing models of california bearing ratio, unconfined compressive strength, and resistance value of activated ash-modified soft clay soil with adaptive neuro-fuzzy inference system and ensemble random forest regression techniques. Multiscale Multidiscip. Model. Exp. Des. 2021, 4, 1–19. [Google Scholar] [CrossRef]
- Azimi-Pour, M.; Eskandari-Naddaf, H. ANN and GEP prediction for simultaneous effect of nano and micro silica on the compressive and flexural strength of cement mortar. Constr. Build. Mater. 2018, 189, 978–992. Available online: http://0-www-sciencedirect-com.brum.beds.ac.uk/science/article/pii/S0950061818322086 (accessed on 30 November 2021). [CrossRef]
- Khan, M.A.; Zafar, A.; Akbar, A.; Javed, M.; Mosavi, A. Application of gene expression programming (GEP) for the prediction of compressive strength of geopolymer concrete. Materials 2021, 14, 1106. [Google Scholar]
- Aslam, F.; Elkotb, M.A.; Iqtidar, A.; Khan, M.A.; Javed, M.F.; Usanova, K.I.; Alamri, S.; Musarat, M.A. Compressive strength prediction of rice husk ash using multiphysics genetic expression programming. Ain Shams Eng. J. 2021, 13, 101593. Available online: https://0-www-sciencedirect-com.brum.beds.ac.uk/science/article/pii/S2090447921003580 (accessed on 30 November 2021). [CrossRef]
- Faradonbeh, R.S.; Hasanipanah, M.; Amnieh, H.B.; Armaghani, D.J.; Monjezi, M. Development of gp and gep models to estimate an environmental issue induced by blasting operation. Environ. Monit. Assess. 2018, 190, 351. [Google Scholar] [CrossRef] [PubMed]
- Awoyera, P.O.; Kirgiz, M.S.; Viloria, A.; Ovallos-Gazabon, D. Estimating strength properties of geopolymer self-compacting concrete using machine learning techniques. J. Mater. Res. Technol. 2020, 9, 9016–9028. Available online: https://0-www-sciencedirect-com.brum.beds.ac.uk/science/article/pii/S2238785420314095 (accessed on 30 November 2021). [CrossRef]
- Wang, X.-Y. Prediction of flexural strength of natural pozzolana and limestone blended concrete using machine learning based models. In Presented at IOP Conference Series: Materials Science and Engineering; IOP Publishing: Bristol, UK, 2020; Volume 784, p. 012005. [Google Scholar]
- Ahmad, A.; Ostrowski, K.; Maślak, M.; Farooq, F.; Mehmood, I.; Nafees, A. Comparative study of supervised machine learning algorithms for predicting the compressive strength of concrete at high temperature. Materials 2021, 14, 4222. [Google Scholar] [CrossRef] [PubMed]
- Congro, M.; Monteiro, V.M.D.A.; Brandão, A.L.; dos Santos, B.F.; Roehl, D.; Silva, F.D.A. Prediction of the residual flexural strength of fiber reinforced concrete using artificial neural networks. Constr. Build. Mater. 2021, 303, 124502. Available online: https://0-www-sciencedirect-com.brum.beds.ac.uk/science/article/pii/S0950061821022583 (accessed on 30 November 2021). [CrossRef]
- Lee, S.; Lee, C. Prediction of shear strength of frp-reinforced concrete flexural members without stirrups using artificial neural networks. Eng. Struct. 2014, 61, 99–112. Available online: https://0-www-sciencedirect-com.brum.beds.ac.uk/science/article/pii/S0141029614000042 (accessed on 30 November 2021). [CrossRef]
- Köroğlu, M.A. Artificial neural network for predicting the flexural bond strength of frp bars in concrete. Sci. Eng. Compos. Mater. 2018, 26, 12–29. [Google Scholar] [CrossRef]
- Lee, S.; Moy, S. A Method for predicting the flexural strength of RC beams strengthened with carbon fiber reinforced polymer. J. Reinf. Plast. Compos. 2007, 26, 1383–1401. [Google Scholar] [CrossRef]
- Yang, J.-M.; Min, K.-H.; Shin, H.-O.; Yoon, Y.-S. Effect of steel and synthetic fibers on flexural behavior of high-strength concrete beams reinforced with frp bars. Compos. Part B Eng. 2012, 43, 1077–1086. [Google Scholar] [CrossRef]
- Pham, H.; Al-Mahaidi, R. Assessment of available prediction models for the strength of FRP retrofitted RC beams. Compos. Struct. 2004, 66, 601–610. [Google Scholar] [CrossRef]
- Ghosh, A.; Maiti, R. Soil erosion susceptibility assessment using logistic regression, decision tree and random forest: Study on the mayurakshi river basin of eastern india. Environ. Earth Sci. 2021, 80, 1–16. [Google Scholar] [CrossRef]
- Maloney, K.O.; Weller, D.E.; Russell, M.J.; Hothorn, T. Classifying the biological condition of small streams: An example using benthic macroinvertebrates. J. N. Am. Benthol. Soc. 2009, 28, 869–884. [Google Scholar] [CrossRef]
- Zounemat-Kermani, M.; Rajaee, T.; Ramezani-Charmahineh, A.; Adamowski, J.F. Estimating the aeration coefficient and air demand in bottom outlet conduits of dams using GEP and decision tree methods. Flow Meas. Instrum. 2017, 54, 9–19. Available online: https://0-www-sciencedirect-com.brum.beds.ac.uk/science/article/pii/S0955598616302217 (accessed on 30 November 2021). [CrossRef]
- Song, H.; Ahmad, A.; Farooq, F.; Ostrowski, K.A.; Maślak, M.; Czarnecki, S.; Aslam, F. Predicting the compressive strength of concrete with fly ash admixture using machine learning algorithms. Constr. Build. Mater. 2021, 308, 125021. Available online: https://0-www-sciencedirect-com.brum.beds.ac.uk/science/article/pii/S0950061821027677 (accessed on 30 November 2021). [CrossRef]
- Kamari, A.; Pournik, M.; Rostami, A.; Amirlatifi, A.; Mohammadi, A.H. Characterizing the CO2-brine interfacial tension (ift) using robust modeling approaches: A comparative study. J. Mol. Liq. 2017, 246, 32–38. Available online: https://0-www-sciencedirect-com.brum.beds.ac.uk/science/article/pii/S016773221730421X (accessed on 30 November 2021). [CrossRef]
- Huat, C.Y.; Moosavi, S.M.H.; Mohammed, A.S.; Armaghani, D.J.; Ulrikh, D.V.; Monjezi, M.; Lai, S.H. Factors influencing pile friction bearing capacity: Proposing a novel procedure based on gradient boosted tree technique. Sustainability 2021, 13, 11862. [Google Scholar] [CrossRef]
- Thériault, M.; Benmokrane, B. Effects of frp reinforcement ratio and concrete strength on flexural behavior of concrete beams. J. Compos. Constr. 1998, 2, 7–16. [Google Scholar] [CrossRef]
- Almusallam, T.; Al-Salloum, Y.; Alsayed, S.; Amjad, M. Behavior of concrete beams doubly reinforced by frp bars. In Proceedings of the Third International Symposium on Non-Metallic (FRP) Reinforcement for Concrete Structures (FRPRCS-3), Sapporo, Japan, 14–16 October 1997; Volume 2, pp. 471–478. [Google Scholar]
- Kassem, C.; Farghaly, A.S.; Benmokrane, B. Evaluation of flexural behavior and serviceability performance of concrete beams reinforced with frp bars. J. Compos. Constr. 2011, 15, 682–695. [Google Scholar] [CrossRef]
- Toutanji, H.A.; Saafi, M. Flexural behavior of concrete beams reinforced with glass fiber-reinforced polymer (gfrp) bars. ACI Struct. J. 2000, 97, 712–719. [Google Scholar] [CrossRef]
- Benmokrane, B.; Chaallal, O.; Masmoudi, R. Glass fibre reinforced plastic (gfrp) rebars for concrete structures. Constr. Build. Mater. 1995, 9, 353–364. [Google Scholar] [CrossRef]
- Benmokrane, B.; Masmoudi, R. Flexural response of concrete beams reinforced with frp reinforcing bars. Struct. J. 1996, 93, 46–55. [Google Scholar]
- Ashour, A. Flexural and shear capacities of concrete beams reinforced with GFRP bars. Constr. Build. Mater. 2006, 20, 1005–1015. [Google Scholar] [CrossRef]
- Yost, J.R.; Goodspeed, C.H.; Schmeckpeper, E.R. Flexural performance of concrete beams reinforced with frp grids. J. Compos. Constr. 2001, 5, 18–25. [Google Scholar] [CrossRef]
- Brown, V.L.; Bartholomew, C.L. Frp reinforcing bars in reinforced concrete members. Mater. J. 1993, 90, 34–39. [Google Scholar]
- Masmoudi, R.; Theriault, M.; Benmokrane, B. Flexural behavior of concrete beams reinforced with deformed fiber reinforced plastic reinforcing rods. Struct. J. 1998, 95, 665–676. [Google Scholar]
- Duranovic, N.; Pilakoutas, K.; Waldron, P. Tests on concrete beams reinforced with glass fibre reinforced plastic bars. Non-metallic (FRP) Reinf. Concr. Struct. 1997, 2, 479–486. [Google Scholar]
- Alsayed, S.; Al-Salloum, Y.; Almusallam, T. Performance of glass fiber reinforced plastic bars as a reinforcing material for concrete structures. Compos. Part B Eng. 2000, 31, 555–567. [Google Scholar] [CrossRef]
- Bischoff, P.H. Reevaluation of deflection prediction for concrete beams reinforced with steel and fiber reinforced polymer bars. J. Struct. Eng. 2005, 131, 752–767. [Google Scholar] [CrossRef]
- El-Nemr, B.A.; Ahmed, E.A.; Benmokrane, B. Flexural behavior and serviceability of normal- and high-strength concrete beams reinforced with glass fiber-reinforced polymer bars. ACI Struct. J. 2013, 110. [Google Scholar] [CrossRef]
- Faza, S.S. Bending and Bond Behavior and Design of Concrete Beams Reinforced with Fiber-Reinforced Plastic Rebars; West Virginia University Libraries: Morgantown, WV, USA, 1991. [Google Scholar]
- Wang, H.; Belarbi, A. Flexural behavior of fiber-reinforced-concrete beams reinforced with frp rebars. ACI Struct. J. 2005, SP230 51, 895–914. [Google Scholar]
- Lau, D.; Pam, H.J. Experimental study of hybrid frp reinforced concrete beams. Eng. Struct. 2010, 32, 3857–3865. [Google Scholar] [CrossRef]
- Gao, D.; Benmokrane, B. Calculation method of flexural capacity of gfrp-reinforced concrete beam. J. Hydraul. Eng. 2001, 4, 73–80. [Google Scholar]
- El Refai, A.; Abed, F.; Al-Rahmani, A. Structural performance and serviceability of concrete beams reinforced with hybrid (gfrp and steel) bars. Constr. Build. Mater. 2015, 96, 518–529. [Google Scholar] [CrossRef]
- Alkhraisha, H.; Mhanna, H.; Tello, N.; Abed, F. Serviceability and flexural behavior of concrete beams reinforced with basalt fiber-reinforced polymer (bfrp) bars exposed to harsh conditions. Polymers 2020, 12, 2110. [Google Scholar] [CrossRef] [PubMed]
- Abed, F.; Al-Mimar, M.; Ahmed, S. Performance of bfrp rc beams using high strength concrete. Compos. Part C Open Access 2021, 4, 100107. [Google Scholar] [CrossRef]
- Myles, A.J.; Feudale, R.N.; Liu, Y.; Woody, N.A.; Brown, S.D. An introduction to decision tree modeling. J. Chemom. 2004, 18, 275–285. [Google Scholar] [CrossRef]
- Ijaz, M.; Lan, L.; Zahid, M.; Jamal, A. A comparative study of machine learning classifiers for injury severity prediction of crashes involving three-wheeled motorized rickshaw. Accid. Anal. Prev. 2021, 154, 106094. [Google Scholar] [CrossRef]
- Jamal, A.; Zahid, M.; Rahman, M.T.; Al-Ahmadi, H.M.; Almoshaogeh, M.; Farooq, D.; Ahmad, M. Injury severity prediction of traffic crashes with ensemble machine learning techniques: A comparative study. Int. J. Inj. Control Saf. Promot. 2021, 28, 1–20. [Google Scholar] [CrossRef]
- Ullah, I.; Liu, K.; Yamamoto, T.; Al Mamlook, R.E.; Jamal, A. A comparative performance of machine learning algorithm to predict electric vehicles energy consumption: A path towards sustainability. Energy Environ. 2021. [Google Scholar] [CrossRef]
- Mrva, J.; Neupauer, S.; Hudec, L.; Sevcech, J.; Kapec, P. Decision Support in Medical Data Using 3D Decision Tree Visualisation. In Proceedings of the 2019 E-Health and Bioengineering Conference (EHB), Iasi, Romania, 21–23 November 2019; pp. 1–4. [Google Scholar]
- Kotsiantis, S.B. Decision trees: A recent overview. Artif. Intell. Rev. 2011, 39, 261–283. [Google Scholar] [CrossRef]
- Guelman, L. Gradient boosting trees for auto insurance loss cost modeling and prediction. Expert Syst. Appl. 2012, 39, 3659–3667. [Google Scholar] [CrossRef]
- Sun, Y.; Kamel, M.S.; Wong, A.K.; Wang, Y. Cost-sensitive boosting for classification of imbalanced data. Pattern Recognit. 2007, 40, 3358–3378. [Google Scholar] [CrossRef]
- Cortes, C.; Mohri, M.; Storcheus, D. Regularized gradient boosting. Adv. Neural Inf. Process. Syst. 2019, 32, 5449–5458. [Google Scholar]
- Iqbal, M.F.; Liu, Q.-F.; Azim, I.; Zhu, X.; Yang, J.; Javed, M.F.; Rauf, M. Prediction of mechanical properties of green concrete incorporating waste foundry sand based on gene expression programming. J. Hazard. Mater. 2020, 384, 121322. [Google Scholar] [CrossRef]
- Iqbal, M.F.; Javed, M.F.; Rauf, M.; Azim, I.; Ashraf, M.; Yang, J.; Liu, Q.-F. Sustainable utilization of foundry waste: Forecasting mechanical properties of foundry sand based concrete using multi-expression programming. Sci. Total Environ. 2021, 780, 146524. [Google Scholar] [CrossRef] [PubMed]
- Azim, I.; Yang, J.; Iqbal, M.F.; Javed, M.F.; Nazar, S.; Wang, F.; Liu, Q.-F. Semi-analytical model for compressive arch action capacity of RC frame structures. Structures 2020, 27, 1231–1245. [Google Scholar] [CrossRef]
- Babanajad, S.K.; Gandomi, A.H.; Alavi, A.H. New prediction models for concrete ultimate strength under true-triaxial stress states: An evolutionary approach. Adv. Eng. Softw. 2017, 110, 55–68. [Google Scholar] [CrossRef]
- Alavi, A.H.; Gandomi, A.H.; Nejad, H.C.; Mollahasani, A.; Rashed, A. Design equations for prediction of pressuremeter soil deformation moduli utilizing expression programming systems. Neural Comput. Appl. 2013, 23, 1771–1786. [Google Scholar] [CrossRef]


| Flexural Capacity (kN-m) Target Varaible | Number of Specimens | Input Parameters | ||||||
|---|---|---|---|---|---|---|---|---|
| Depth (mm) | Width (mm) | Compressive Strength (fc′) MPa | Flexural Reinforcemnet (As) mm2 | Elastic Modulus (EM) MPa | Tensile Strength Rebar at Failure (Tf) MPa | References | ||
| 20–30 | 8 | 180 | 130 | 46–97 | 238–475 | 38,000 | 773 | [54] |
| 39–41 | 4 | 240 | 200 | 35–36 | 508 | 43,370 | 885 | [55] |
| 71–90 | 12 | 300 | 200 | 39–41 | 254–1013 | 40,000–122,000 | 617–1988 | [56] |
| 49–66 | 6 | 300 | 180 | 35 | 253–507 | 40,000 | 695 | [57] |
| 81–198 | 9 | 300–550 | 200 | 43–52 | 573 | 42,000–49,000 | 641–689 | [58] |
| 80–182 | 3 | 300–550 | 43 | 573 | 600 | 45,000 | 600 | [59] |
| 6–17 | 14 | 200–300 | 150 | 28–50 | 57–113 | 38,000 | 650 | [60] |
| 11–17 | 12 | 152–203 | 191–381 | 28 | 80–320 | 41,400 | 830 | [61] |
| 6–34 | 9 | 152–250 | 150–152 | 25–36 | 71–429 | 45,000–44,800 | 760–1000 | [62] |
| 58–85 | 8 | 300 | 200 | 45–52 | 349–1046 | 37,600 | 773 | [63] |
| 34–57 | 4 | 210–300 | 200 | 31–41 | 507–1134 | 35,630–43,370 | 700–886 | [64] |
| 52–54 | 2 | 300 | 200 | 24–27 | 88–226 | 200,000 | 1061–2000 | [65] |
| 14–16 | 2 | 152 | 152 | 49–52 | 63–99 | 140,000 | 1900 | [66] |
| 81–189 | 12 | 400 | 200 | 29–73 | 261–1162 | 48,700–69,300 | 762–1639 | [67] |
| 42–81 | 6 | 305 | 152 | 29–45 | 355–1013 | 45,500–50,600 | 552–896 | [68] |
| 47–51 | 3 | 229 | 178 | 48 | 219–1077 | 41,000–124,000 | 552–896 | [69] |
| 80–238 | 5 | 380 | 280 | 34–43 | 339–1964 | 38,000–40,200 | 582–603 | [70] |
| 39–85 | 5 | 270–294 | 200 | 42–54 | 299–1356 | 38,000–49,000 | 552–773 | [71] |
| 49–54 | 3 | 254–256 | 230 | 40 | 226–603 | 50,000 | 1000 | [72] |
| 21–41 | 6 | 165 | 180 | 30 | 115–424 | 42,900–46,600 | 1075–1121 | [73] |
| 23–50 | 10 | 165 | 180 | 47–70 | 171–636 | 42,900–130,000 | 1029–2068 | [74] |
| Parameters | Minimum | Maximum | Mean | Median | Standard Deviation | Skewness | Kurtosis |
|---|---|---|---|---|---|---|---|
| Input parameters | |||||||
| Width, W (mm) | 130 | 381 | 194.2 | 200 | 3.9 | 2 | 6 |
| Depth, D (mm) | 152 | 550 | 274.4 | 294 | 8.6 | 0.9 | 0.7 |
| Concrete compressive strength, fc′ (MPa) | 24 | 97 | 42.9 | 41 | 1.2 | 1.6 | 3.4 |
| Bottom tensile reinforcement, As (mm2) | 57 | 1964 | 482.9 | 425 | 30.8 | 1.5 | 3.2 |
| Elastic Modulus, EM (MPa) | 35,630 | 200,000 | 53,060 | 43,370 | 2550 | 3 | 10 |
| Tensile strength at failure (Tf) | 552 | 2069 | 927.6 | 773 | 33.2 | 1.7 | 2.2 |
| Flexural capacity, M (kN-m) | 6 | 238 | 62.4 | 51 | 4.3 | 1.5 | 2 |
| Model | Parameter | Value | Error Rate Optimization (%) |
|---|---|---|---|
| DT | Maximal depth | 2 | 32.3 |
| 4 | 21.8 | ||
| 7 | 20.0 | ||
| 10 | 20.0 | ||
| 15 | 20.0 | ||
| 25 | 20.0 | ||
| GBT | Number of trees, maximum depth, Learning rate | 30, 2, 0.001 | 37.3 |
| 90, 2, 0.001 | 36.1 | ||
| 150, 2, 0.001 | 35.2 | ||
| 30, 4, 0.001 | 37.3 | ||
| 90, 4, 0.001 | 36.1 | ||
| 150, 4, 0.001 | 35.1 | ||
| 30, 7, 0.001 | 37.3 | ||
| 90, 7, 0.001 | 36.1 | ||
| 150, 7, 0.001 | 35.1 | ||
| 30, 2, 0.01 | 33.3 | ||
| 90, 2, 0.01 | 27.3 | ||
| 150, 2, 0.01 | 23.3 | ||
| 30, 4, 0.01 | 33.1 | ||
| 90, 4, 0.01 | 26.9 | ||
| 150, 4, 0.01 | 23.1 | ||
| 30, 7, 0.01 | 33.1 | ||
| 90, 7, 0.01 | 26.9 | ||
| 150, 7, 0.01 | 23.1 | ||
| 30, 2, 0.1 | 18.2 | ||
| 90, 2, 0.1 | 17.5 | ||
| 150, 2, 0.1 | 17.5 | ||
| 30, 4, 0.1 | 17.5 | ||
| 90, 4, 0.1 | 18.1 | ||
| 150, 4, 0.1 | 18.3 | ||
| 30, 7, 0.1 | 17.5 | ||
| 90, 7, 0.1 | 18.1 | ||
| 150, 7, 0.1 | 18.3 |
| Attribute | As | D | EM | fc′ | Tf | M | W |
|---|---|---|---|---|---|---|---|
| As | 1.00 | 0.44 | −0.17 | 0.09 | −0.23 | 0.70 | 0.09 |
| D | 0.44 | 1.00 | 0.01 | 0.03 | −0.17 | 0.85 | 0.19 |
| EM | −0.17 | 0.01 | 1.00 | −0.02 | 0.76 | 0.04 | −0.04 |
| fc′ | 0.09 | 0.03 | −0.02 | 1.00 | 0.06 | 0.16 | −0.31 |
| Tf | −0.23 | −0.17 | 0.76 | 0.06 | 1.00 | −0.06 | −0.04 |
| M | 0.70 | 0.85 | 0.04 | 0.16 | −0.06 | 1.00 | 0.22 |
| W | 0.09 | 0.19 | −0.04 | −0.31 | −0.04 | 0.22 | 1.00 |
| Variable Input Parameters | No. of Datapoints | Constant Input Parameters | |
|---|---|---|---|
| Parameter | Range | ||
| Width (mm) | 130–381 | 20 | Depth = 274.40 mm, fc′ = 42.85 MPa, As = 482.85 (mm2), EM = 53,060 MPa, Tf = 927.59 MPa |
| Depth (mm) | 152–550 | 20 | Width = 194.25 mm, fc′ = 42.85 MPa, As = 482.85 (mm2), EM = 53,060 MPa, Tf = 927.59 MPa |
| fc′ (MPa) | 24–97 | 20 | Depth = 274.40 mm, Width = 194.25 mm, As = 482.85 (mm2), EM = 53,060 MPa, Tf = 927.59 MPa |
| As (mm2) | 57–1964 | 20 | Depth = 274.40 mm, Width = 194.25 mm, fc′ = 42.85 MPa, EM = 53,060 MPa, Tf = 927.59 MPa |
| EM (MPa) | 35,630–200,000 | 20 | Depth = 274.40 mm, Width = 194.25 mm, fc′ = 42.85 MPa, As = 482.85 (mm2), Tf = 927.59 MPa |
| Tf (MPa) | 552–2069 | 20 | Depth = 274.40 mm, Width = 194.25 mm, fc′ = 42.85 MPa, As = 482.85 (mm2), EM = 53,060 MPa |
Publisher’s Note: MDPI stays neutral with regard to jurisdictional claims in published maps and institutional affiliations. |
© 2022 by the authors. Licensee MDPI, Basel, Switzerland. This article is an open access article distributed under the terms and conditions of the Creative Commons Attribution (CC BY) license (https://creativecommons.org/licenses/by/4.0/).
Share and Cite
Amin, M.N.; Iqbal, M.; Khan, K.; Qadir, M.G.; Shalabi, F.I.; Jamal, A. Ensemble Tree-Based Approach towards Flexural Strength Prediction of FRP Reinforced Concrete Beams. Polymers 2022, 14, 1303. https://0-doi-org.brum.beds.ac.uk/10.3390/polym14071303
Amin MN, Iqbal M, Khan K, Qadir MG, Shalabi FI, Jamal A. Ensemble Tree-Based Approach towards Flexural Strength Prediction of FRP Reinforced Concrete Beams. Polymers. 2022; 14(7):1303. https://0-doi-org.brum.beds.ac.uk/10.3390/polym14071303
Chicago/Turabian StyleAmin, Muhammad Nasir, Mudassir Iqbal, Kaffayatullah Khan, Muhammad Ghulam Qadir, Faisal I. Shalabi, and Arshad Jamal. 2022. "Ensemble Tree-Based Approach towards Flexural Strength Prediction of FRP Reinforced Concrete Beams" Polymers 14, no. 7: 1303. https://0-doi-org.brum.beds.ac.uk/10.3390/polym14071303