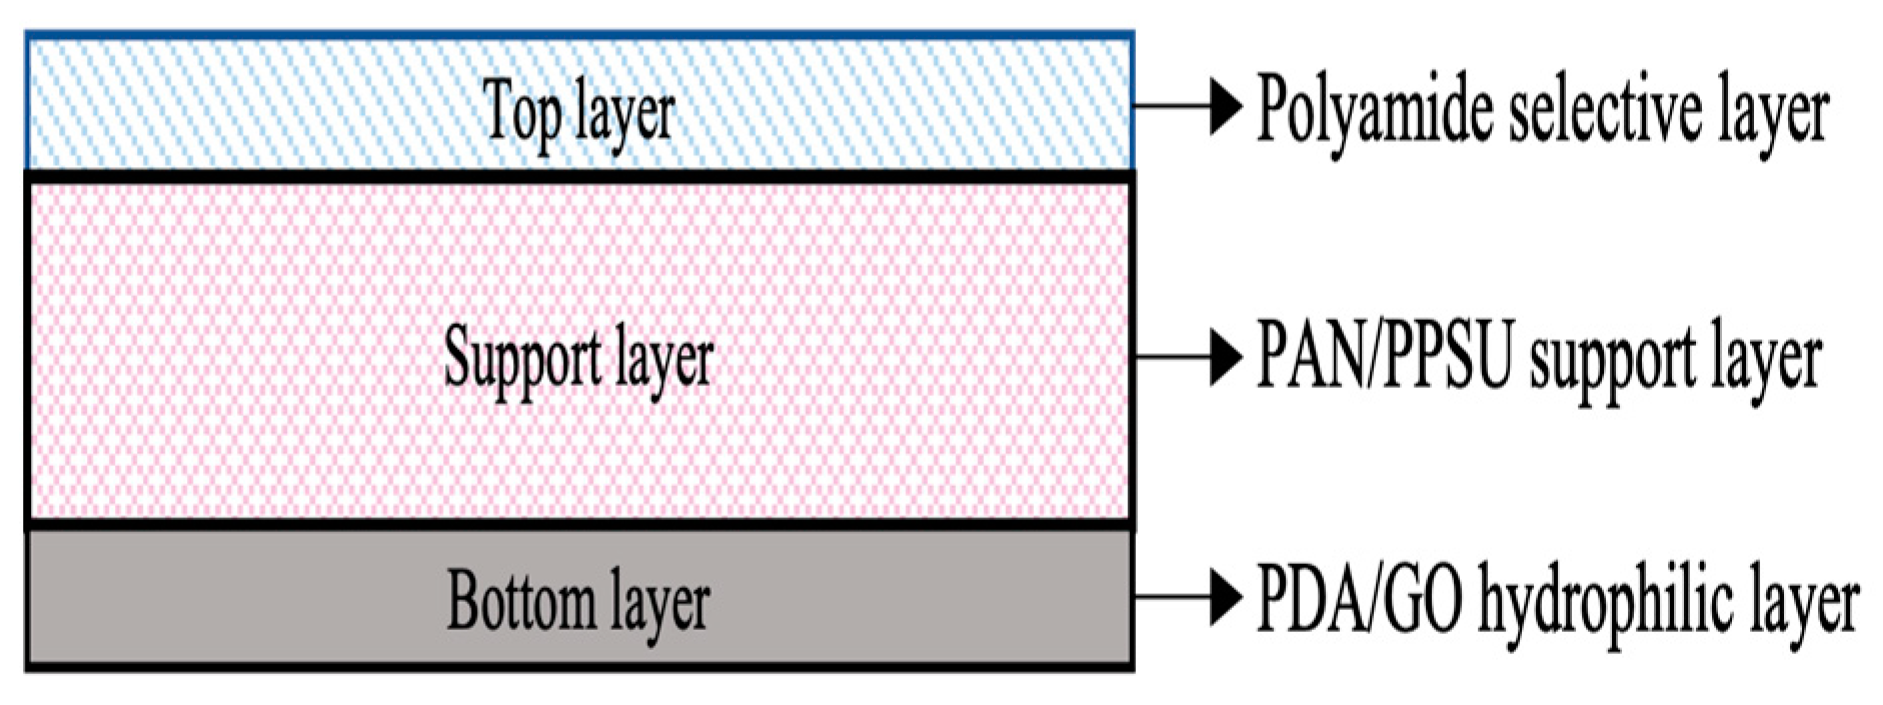
2.1. Materials
To fabricate the microporous substrate for the TFC membrane, polyacrylonitrile (PAN) (molecular weight (MW): 10,000 g/mol) and polyphenylsulfone (PPSU) (MW: 50,000 g/mol) purchased from Sigma-Aldrich (St. Louis, MO, USA) and Solvay Advanced Polymers (Greenville, SC, USA) were used, respectively. To prepare the dope solution, 1-methyl-2-pyrrolidone (NMP) with 99% purity from Acros Organics (Geel, Belgium) was used as solvent to dissolve PAN and PPSU. In order to establish the PA layer atop the PAN/PPSU substrate, piperazine (PIP) and trimesoyl chloride (TMC) obtained from Acros Organics (Geel, Belgium) were, respectively, used as the active amine monomer and acyl chloride monomer. GO was synthesized according to the method as described in our previous work [
25]. Dopamine hydrochloride with 98% purity and tris-hydrochloride (Tris-HCl) with 99% purity purchased from Sigma-Aldrich (St. Louis, MO, USA) were utilized to prepare PDA/GO solution and were used as coating materials for the bottom surface of the PAN/PPSU substrate. Magnesium chloride (MgCl
2), magnesium sulfate (MgSO
4), and sodium sulfate (NaSO
4) obtained from Sigma-Aldrich (St. Louis, Missouri, USA) were used as either feed solutes in the NF system or draw solutes in the osmotically driven process by dissolving them separately in pure water to prepare solutions with the desired solute concentration. Two commercial NF membranes, i.e., NF90 and NF270, supplied by DuPont FilmTec
TM (Edina, MN, USA) in dry condition were also tested during the FO/PRO process, and the results were used to compare with the performance of the membranes developed in this study.
The AT-POME samples were obtained from the PPNJ Palm Oil Mill Kahang located in Johor and stored at 4 °C prior to use. As there is no specific standard for the color determination of AT-POME, the commonly used methods in determining the color of water samples were, therefore, adopted in this study. The effluent samples were characterized with respect to conductivity, color, and total organic carbon (TOC). The conductivity of the sample was measured by a benchtop conductivity meter (4520, Jenway, London, UK), while a UV-vis spectrophotometer (DR5000, Hach, Singapore) and TOC analyzer (TOC LCPN, Shimadzu, Japan) were used to determine the color and TOC, respectively.
Table 1 summarizes the characteristics of the AT-POME used in this work.
2.5. Characterization of Membranes
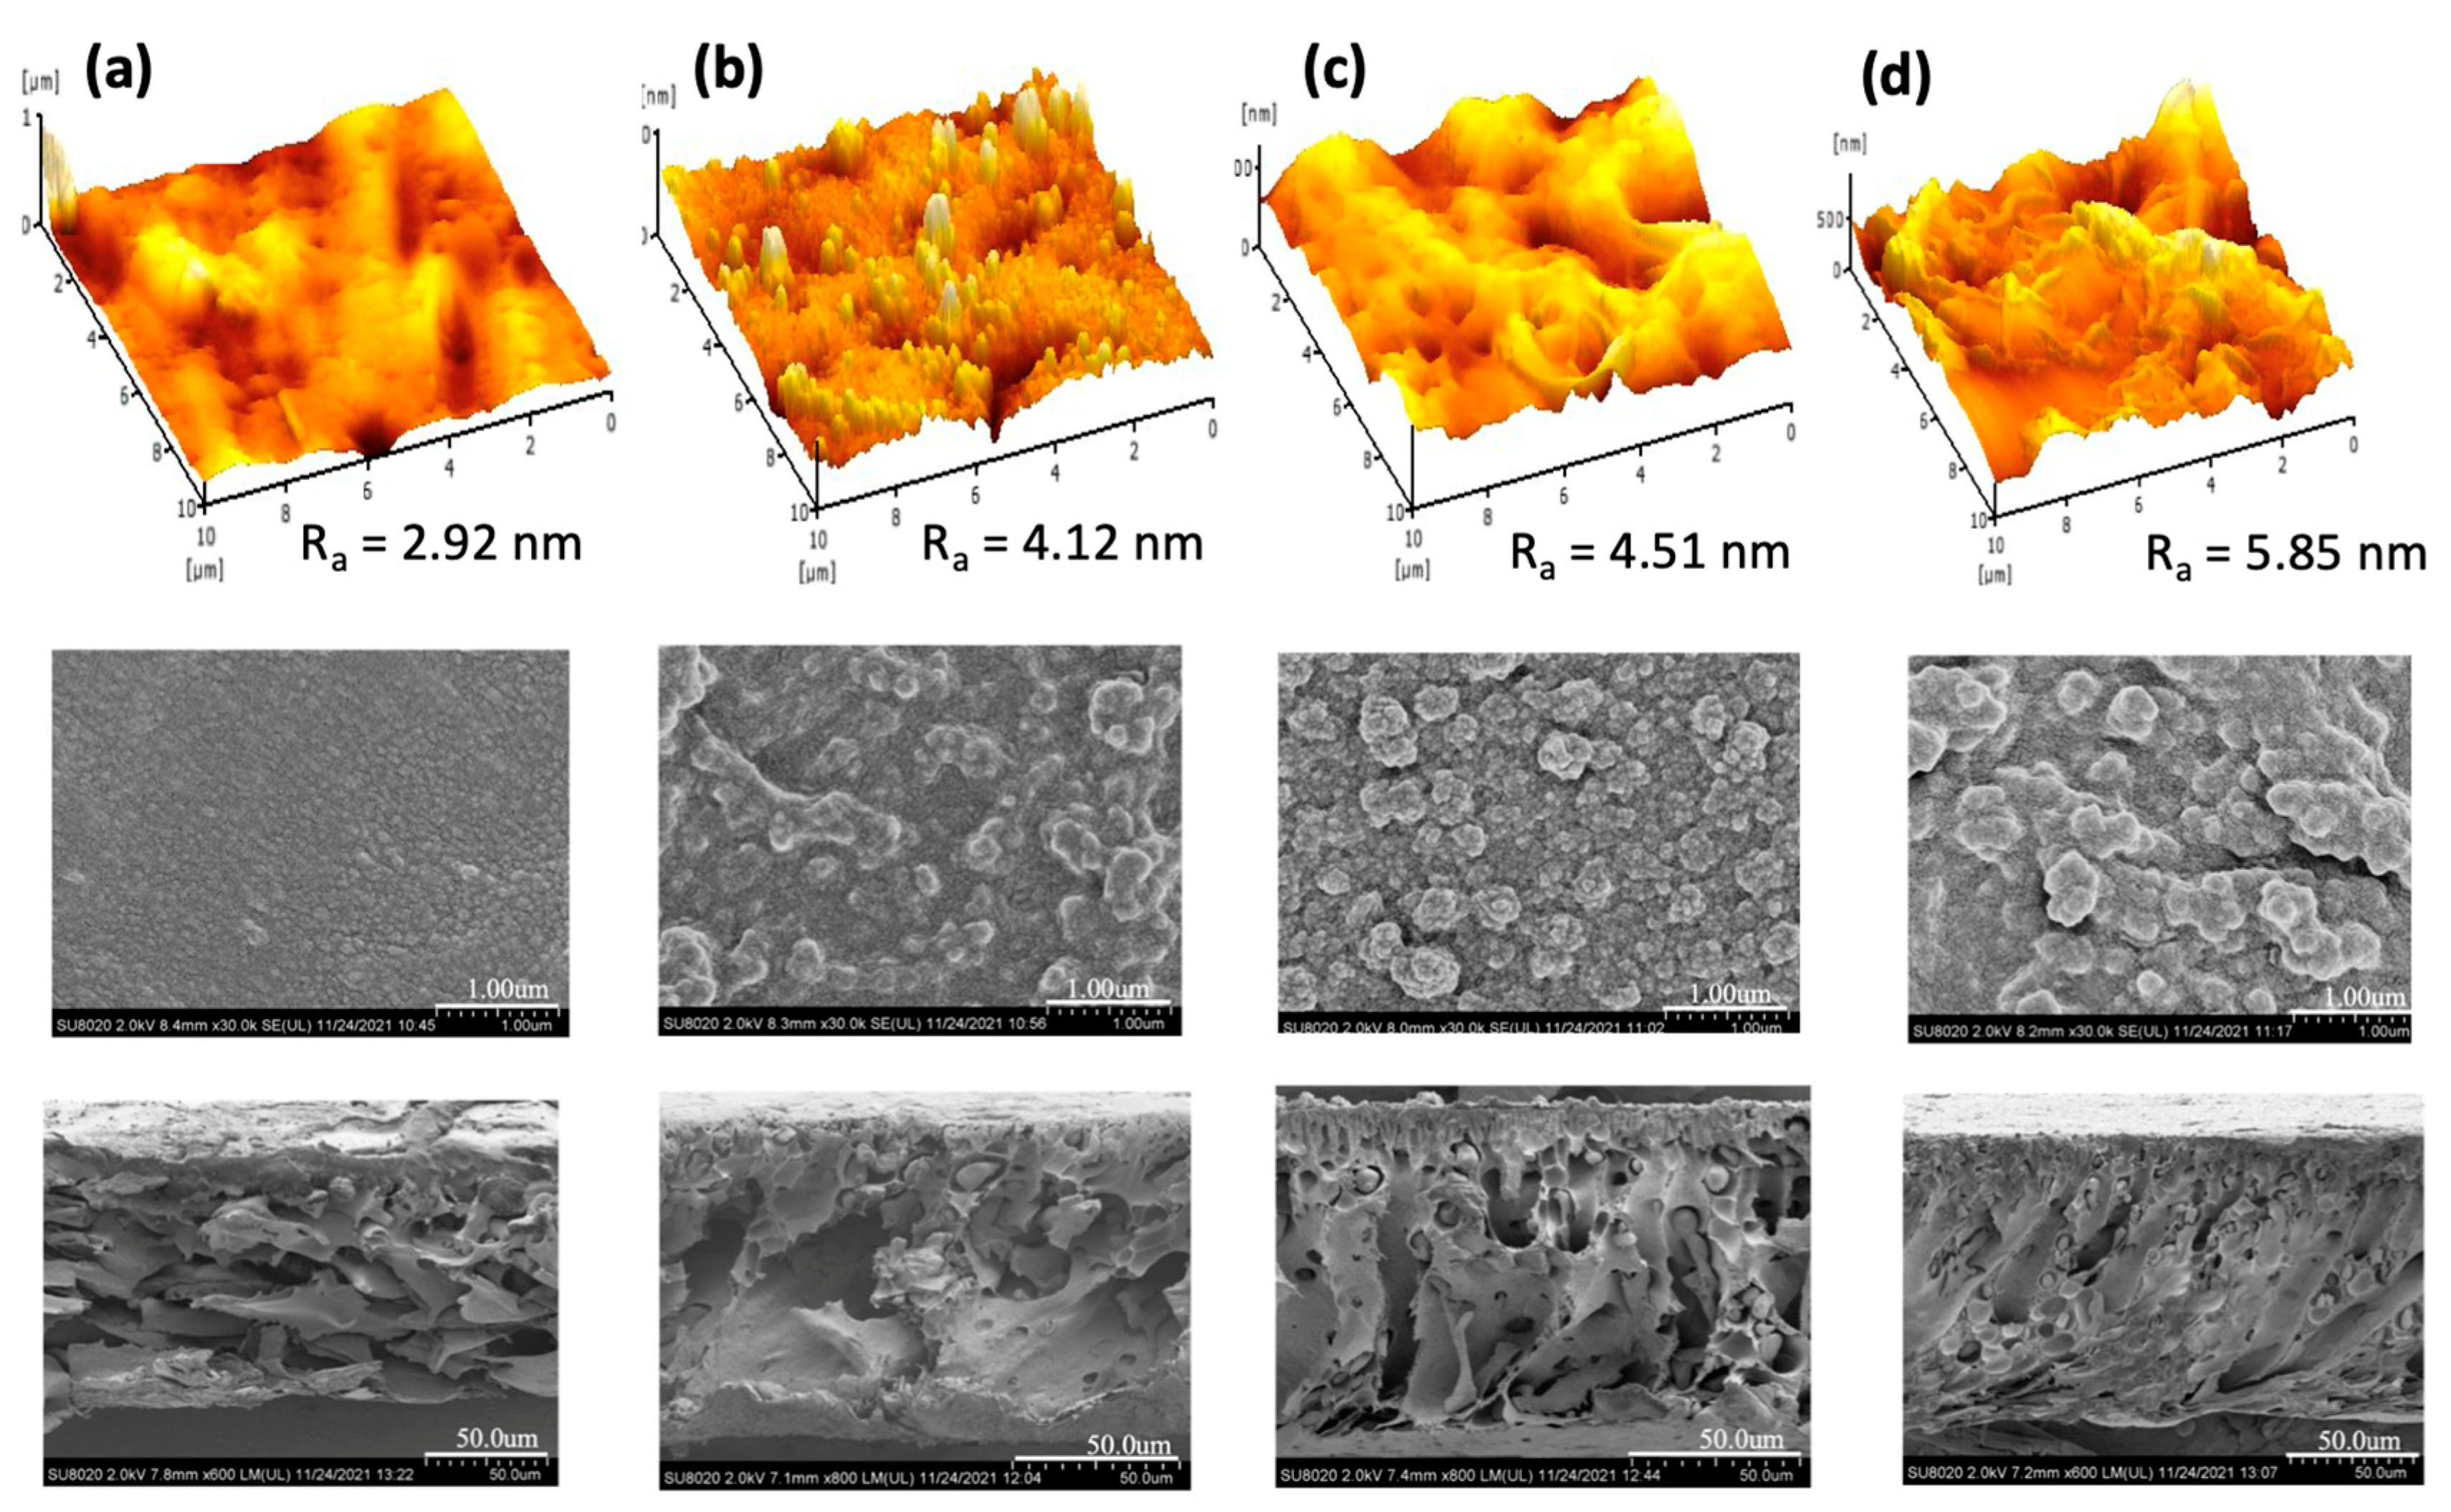
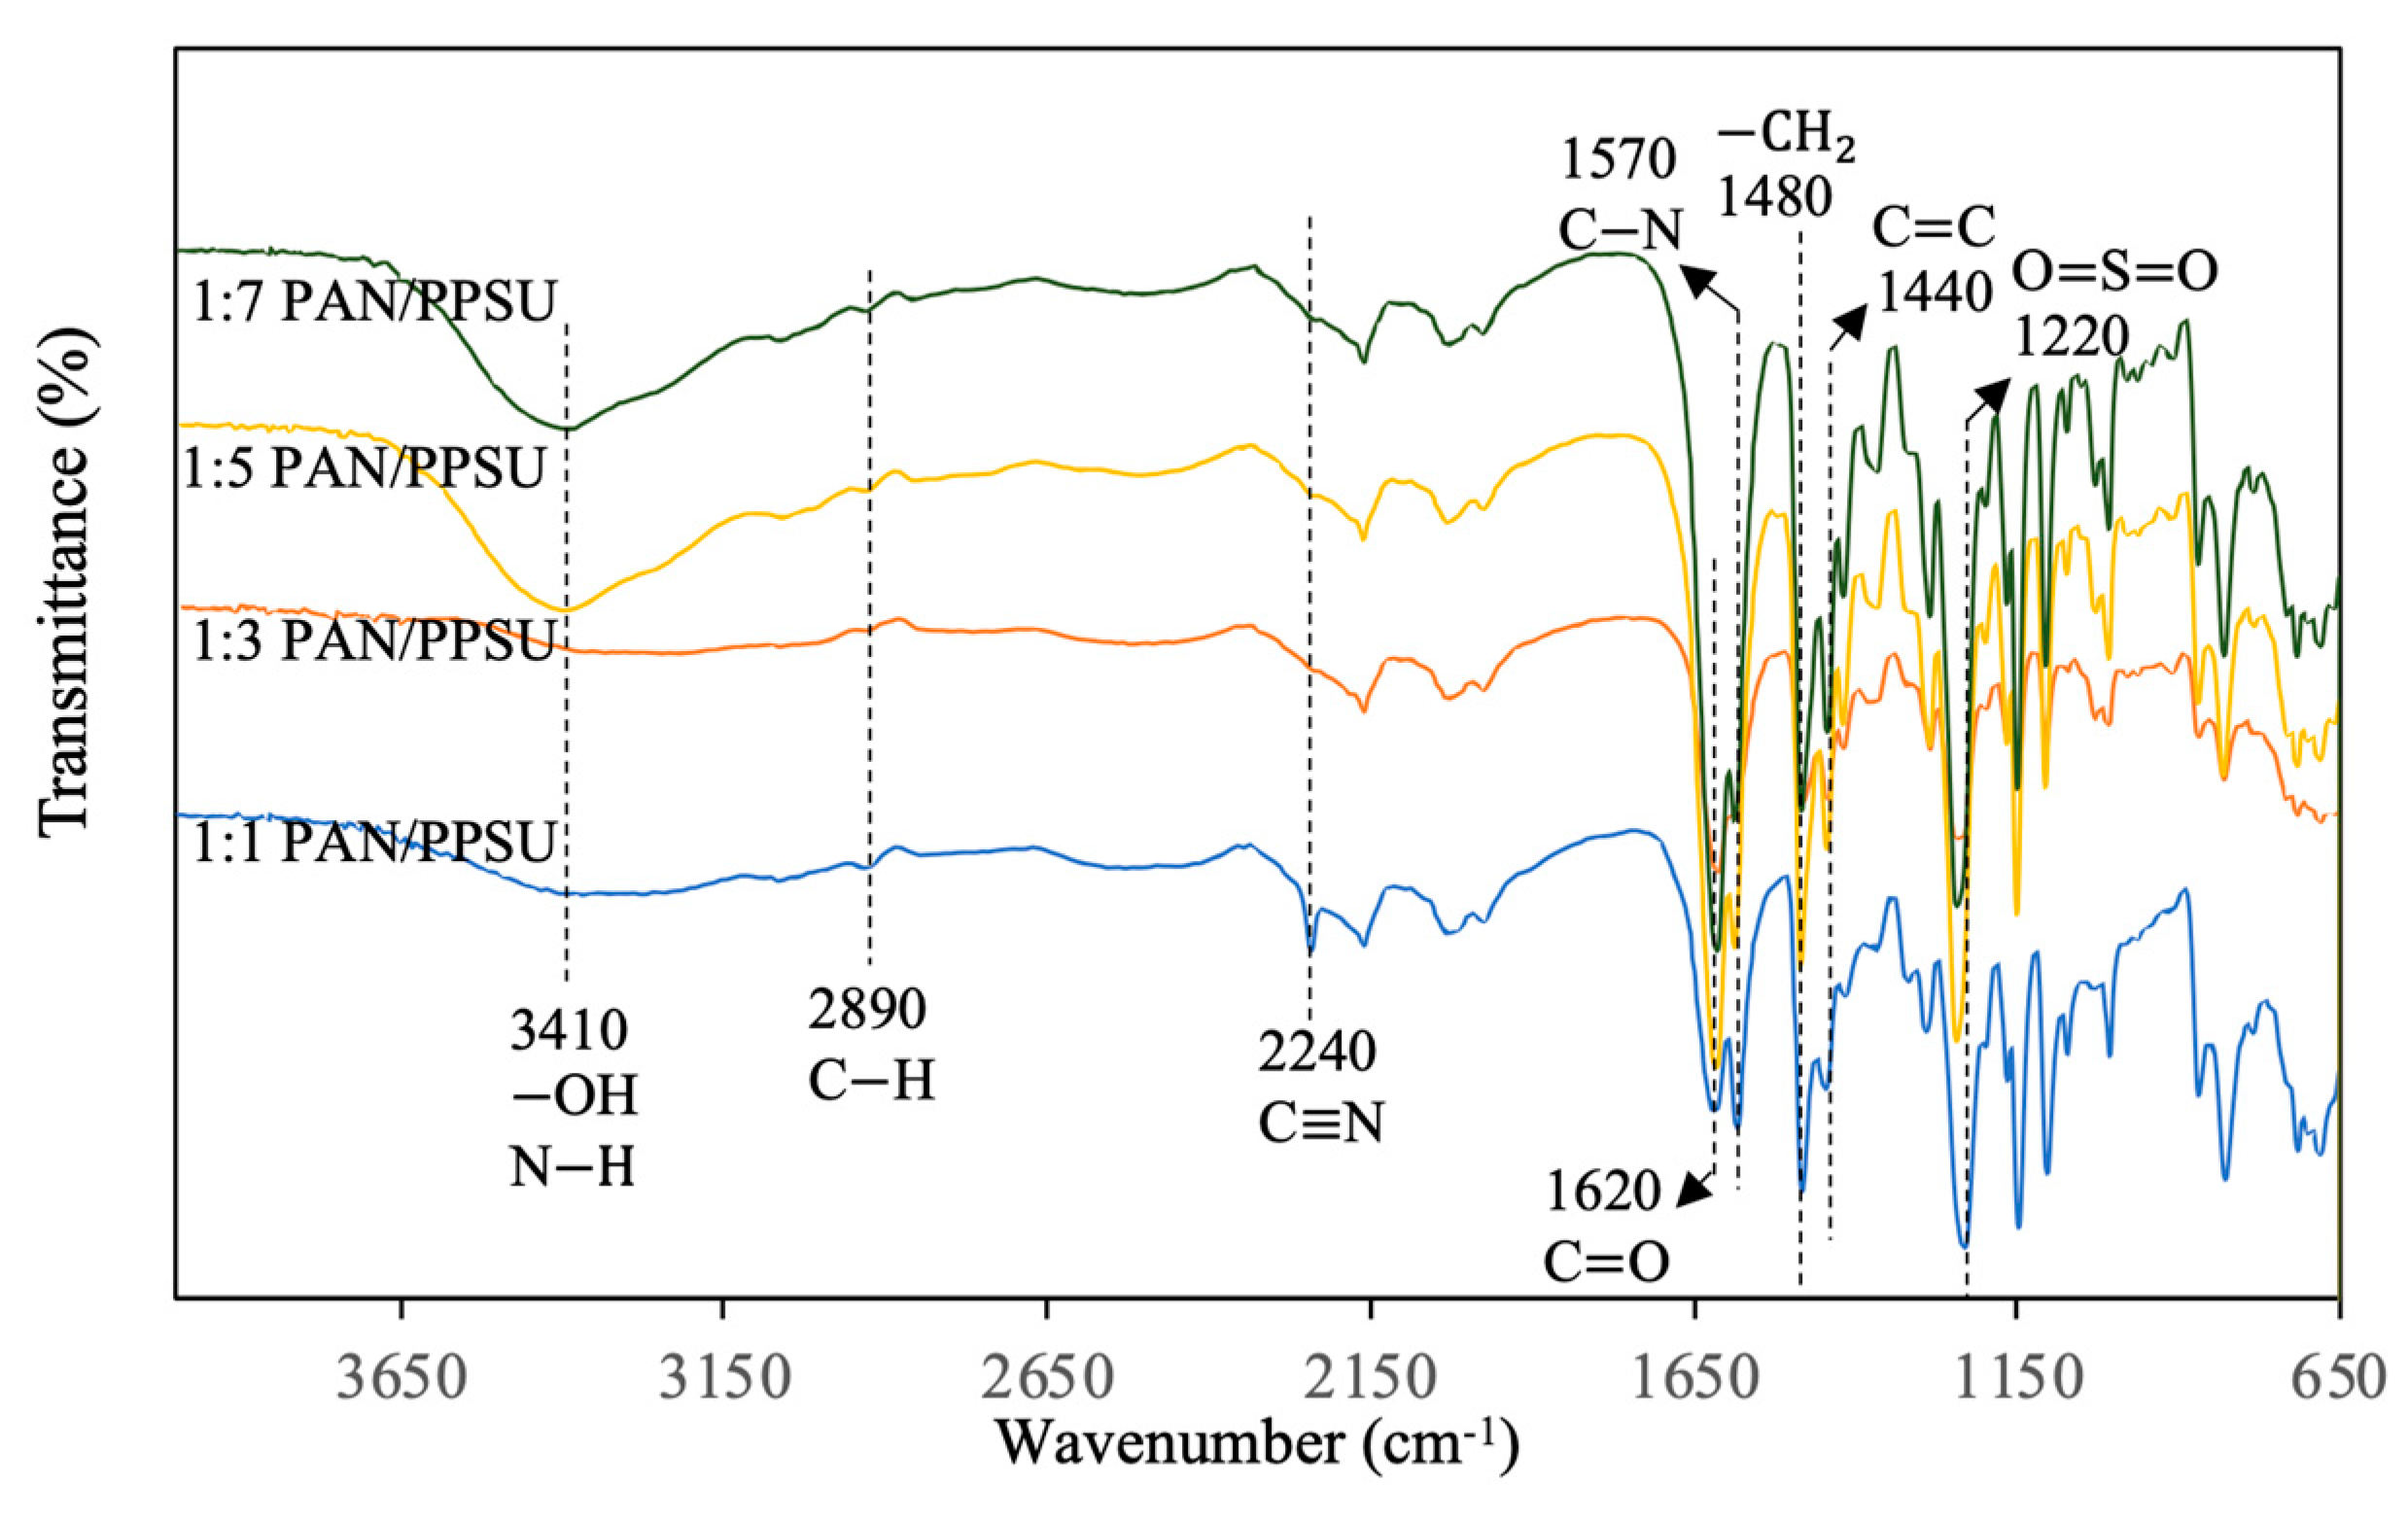
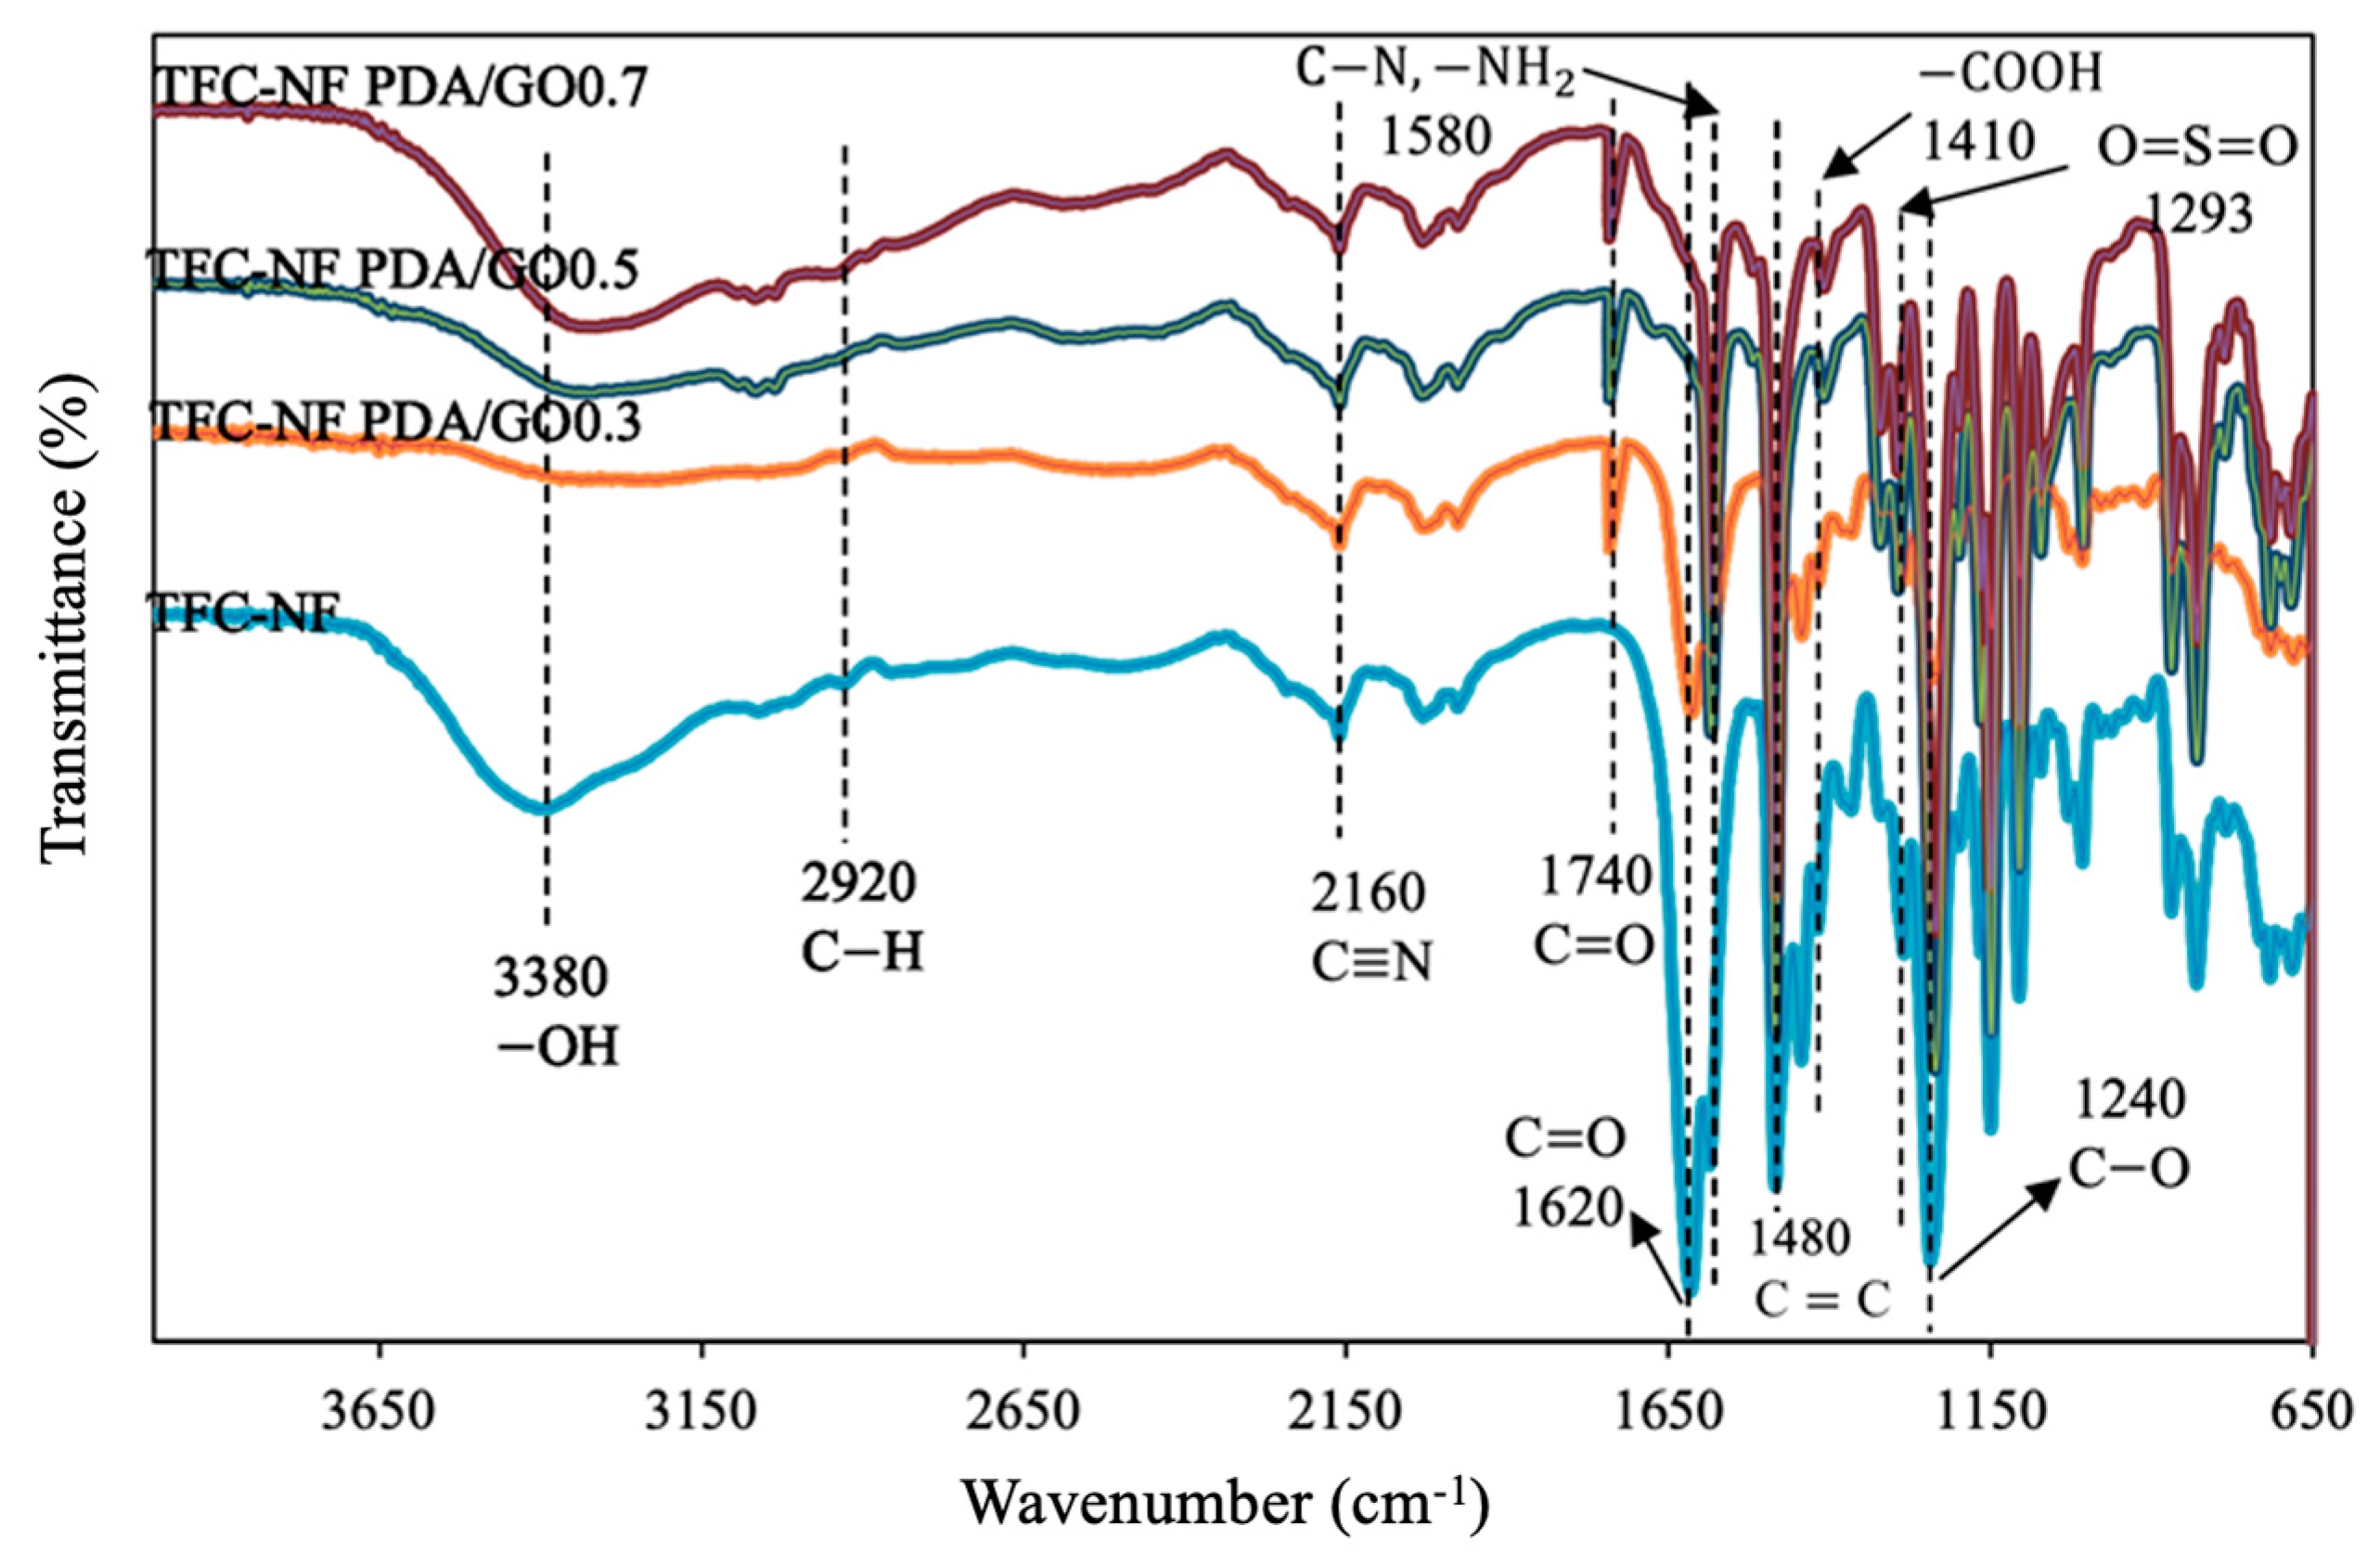
A field emission scanning electron microscope (FESEM) (Crossbeam 340, Zeiss, Birmingham, UK) was used to study the surface morphology and cross-sectional structure of the PAN/PPSU substrate as well as the TFC membrane at different magnifications. Fourier transmission Infrared spectroscope-attenuated total reflectance (FTIR-ATR) (Avatar 360, Thermo Nicolet, Thermo Fisher Scientific, Waltham, MA, USA) was utilized to identify the functional groups of the substrate and PA-selective layer. Each FTIR spectrum was collected between 4000 and 500 cm−1 and the results were the average of 32 scans. The Omnic software was used to process acquired data. An atomic force microscope (AFM) (NX10, Park Systems, Suwon, Republic of Korea) was utilized to obtain the mean roughness of the membrane at a scan area of 10 μm × 10 μm. The surface hydrophilicity meanwhile was measured using a contact angle (CA) goniometer (OCA 15Pro, DataPhysics, Filderstadt, Germany). The volume of pure water dosing was fixed at 0.3 μL when it was dropped on a dried membrane surface.
2.6. Performance Evaluation of Membranes
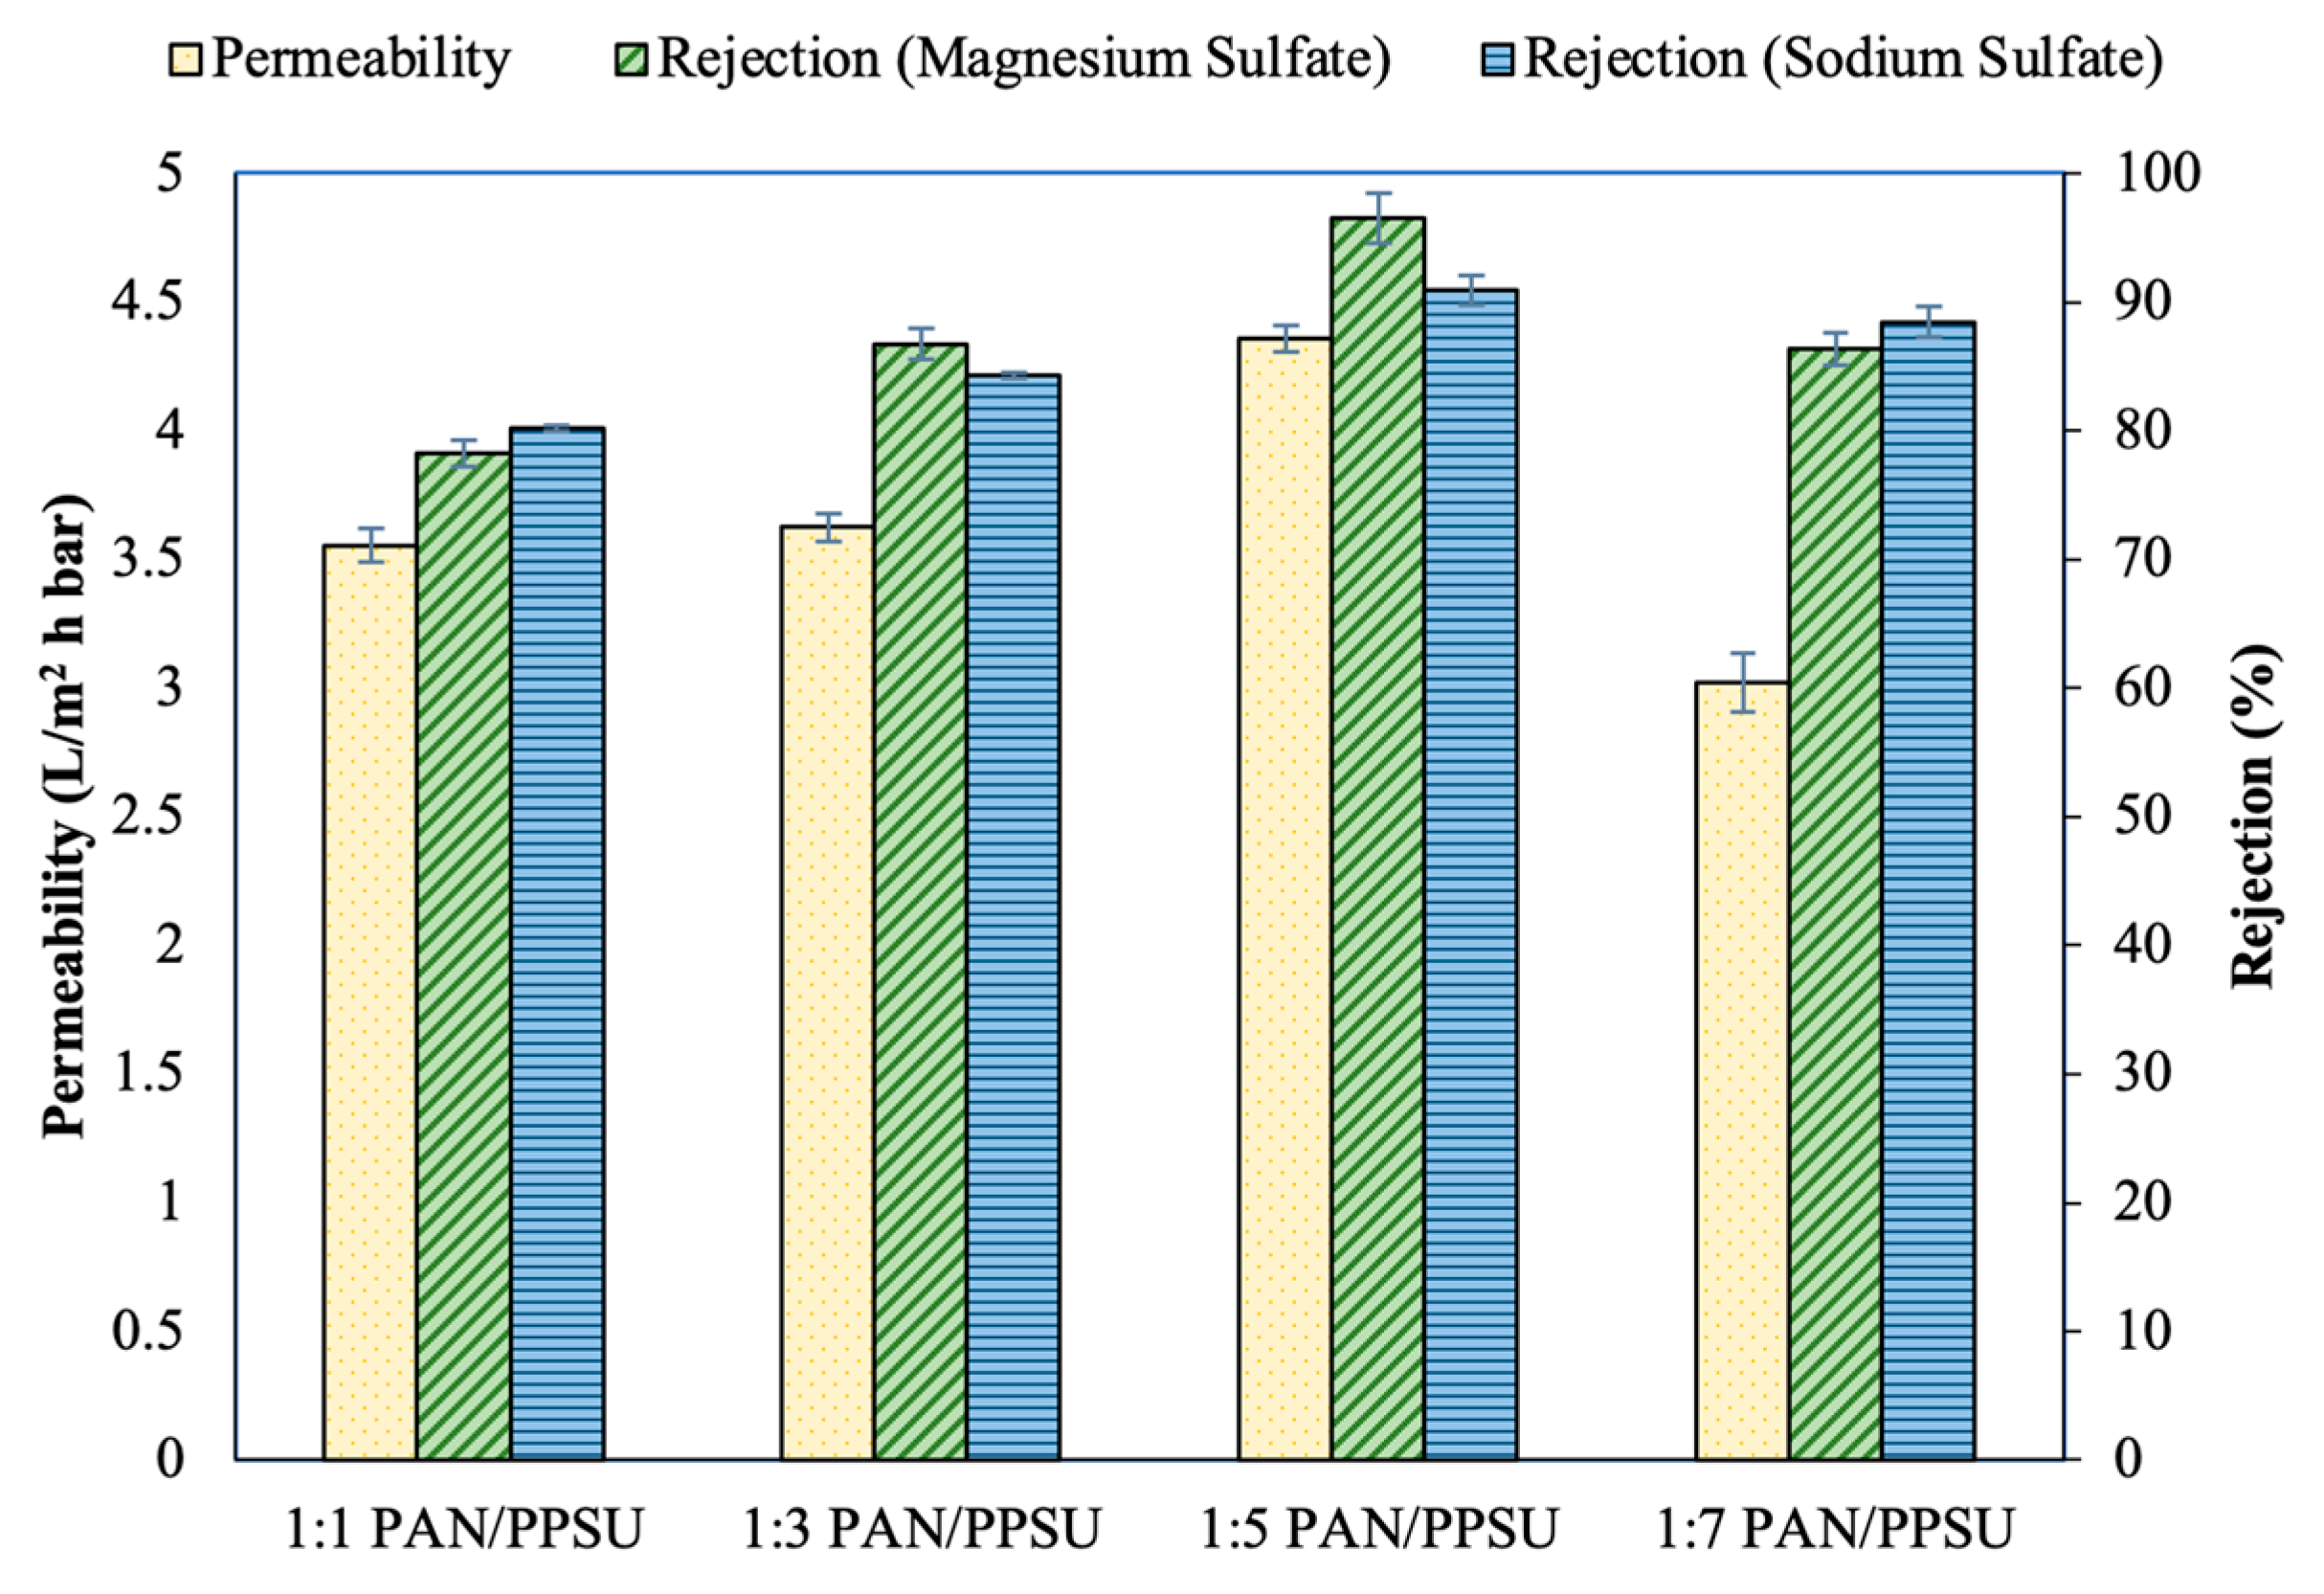
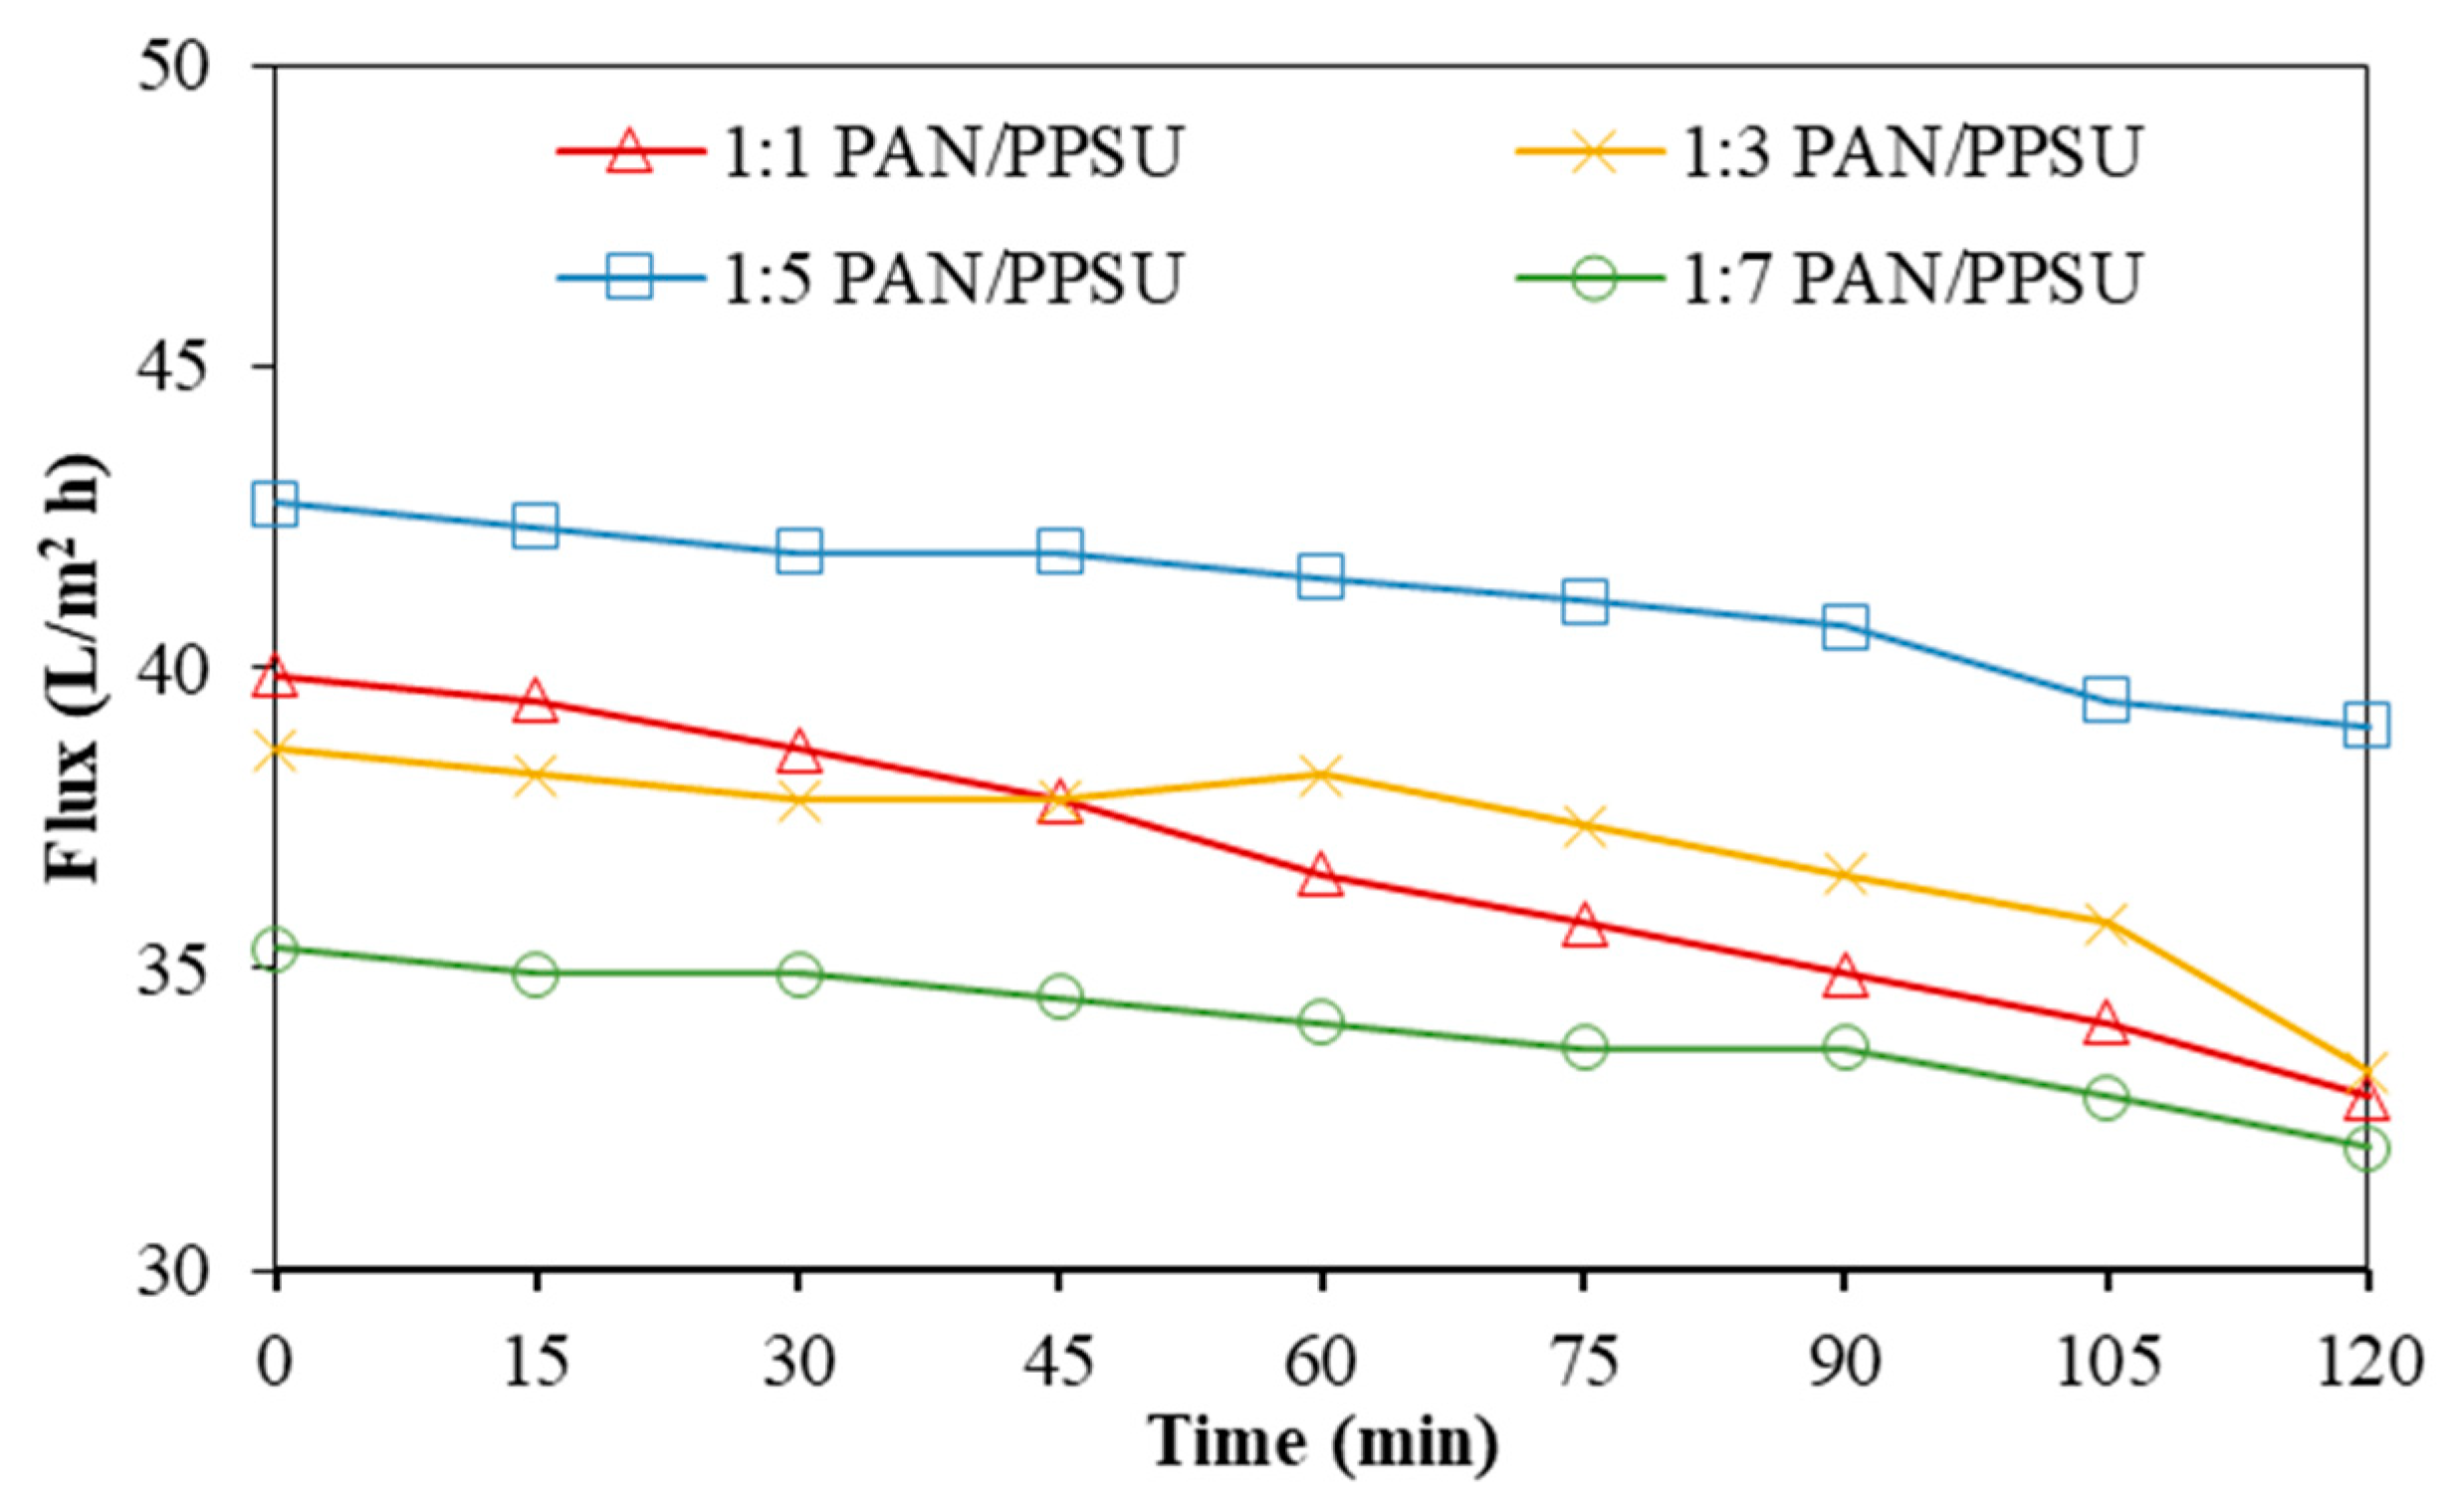
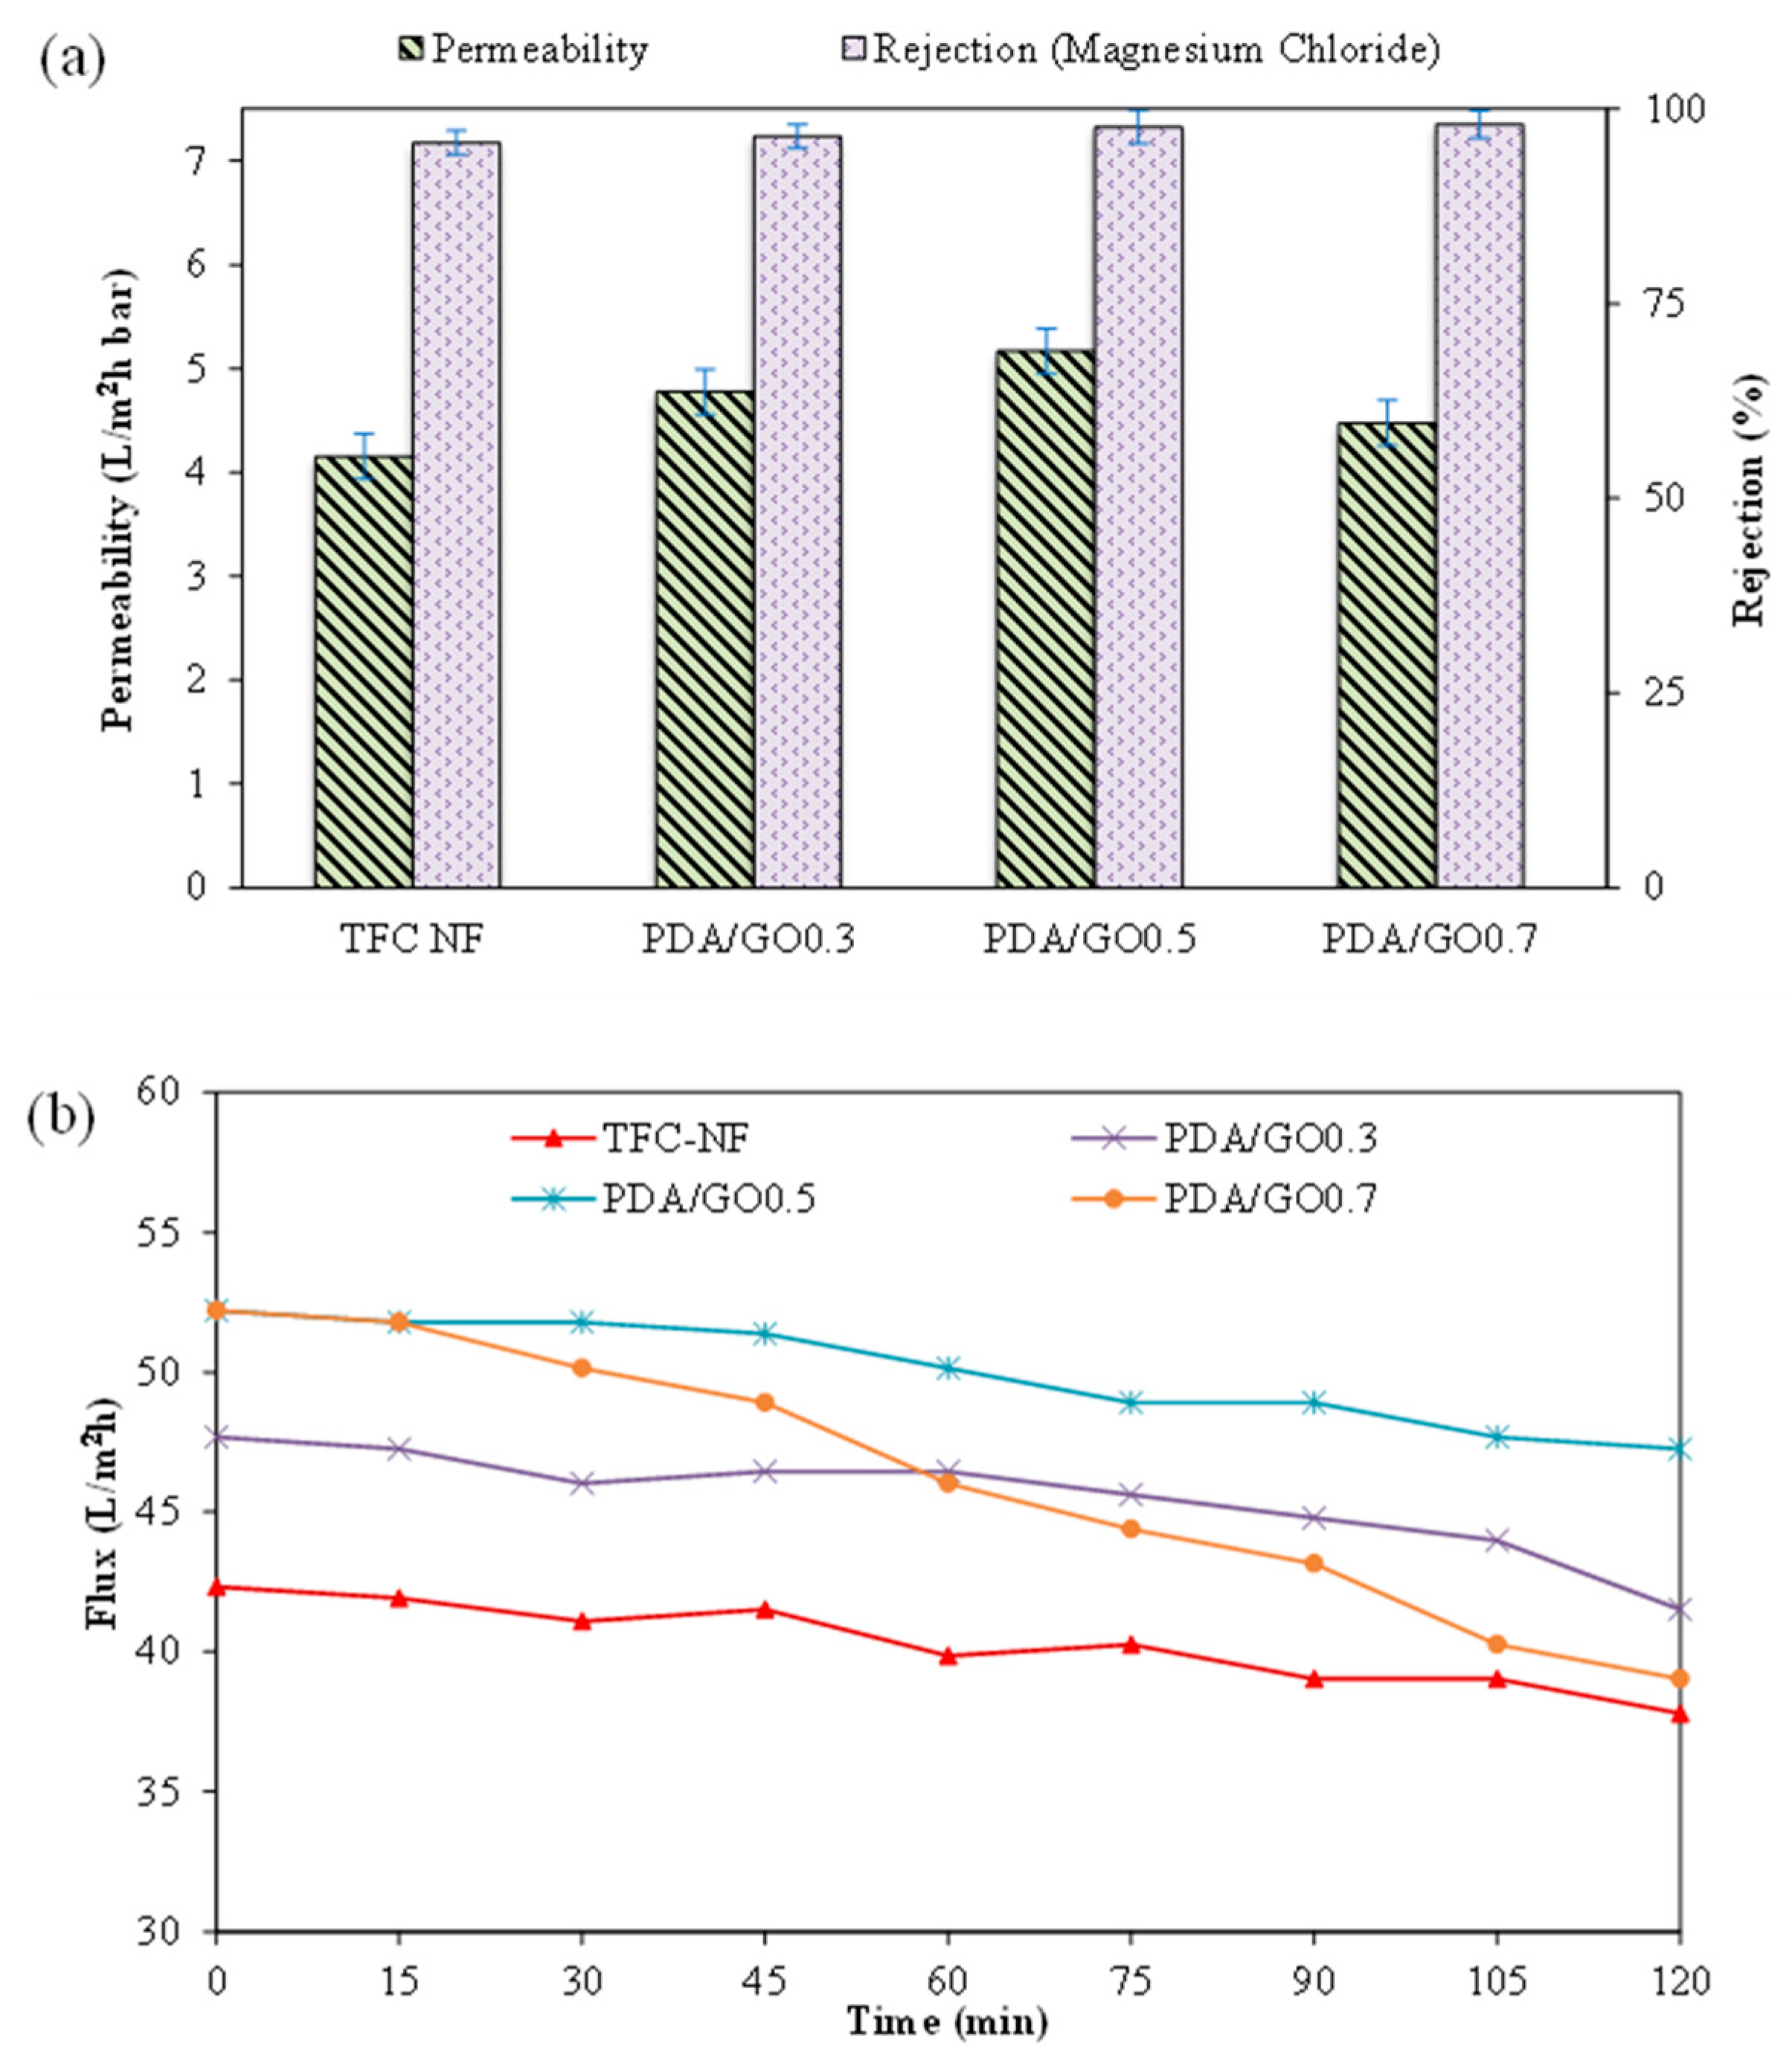
Prior to the FO/PRO filtration experiment, the water flux and solute rejection of membranes were first evaluated using a pressure-driven filtration setup composed of a 320 mL dead-end permeation cell (HP4750, Sterlitech, Auburn, WA, USA). All the membranes were subjected to a 30 min compaction at 11 bar to achieve a stable condition. Afterward, the pure water flux of the membrane was determined at 10 bar. In order to identify the suitable solutes that can be used as draw solutes during the FO/PRO process, the water flux and rejections of membranes in filtering different solutes were determined. The rejections of divalent salt (Na2SO4 or MgSO4) need to be at least 90% as it is one of the criteria to confirm the membrane properties (NF category). A solution containing 1000 ppm (equivalent to mg/L) of single solute was prepared and used as feed for the filtration process. The water flux and rejection were determined and collected for a period of 30 min for each membrane. Upon completion of the experiment, the membrane was further tested with AT-POME. Average water flux and rejection were reported for each membrane for each set of experiments.
The membrane pure water flux,
J, and water permeability,
A, were measured using Equations (1) and (2), respectively.
where ∆
V is the volume of permeate water flux,
Am is the effective area of the membrane, ∆
t is the time interval, and ∆
P is operating pressure. The total effective area of the membrane used in the dead-end permeation cell was 14.62 cm
2.
The solute rejection,
(%), of the membrane against 1000 ppm of single solute was then calculated according to Equation (3) based on the conductivity measurement. The conductivity of the samples was first determined by a conductivity meter followed by concentration conversion based on the conductivity against the salt concentration calibration curve.
where
cf and
cp are the concentrations of feed and permeate, respectively. The salt permeability, B, of a membrane was calculated according to the following equation:
where
A, Δ
P, and Δ
π in this equation refer to water permeability, operating pressure, and osmotic pressure of the feed solution, respectively.
For the FO/PRO experiment, a crossflow filtration setup equipped with two high-precision micro-gear pumps (WT3000-1JA, LongerPump, Hebei, China) was used. The total effective area of the membrane tested in the crossflow system was 42 cm2. The velocity of the feed and draw solution streams was circulated at 32.72 cm/s using two separate gear pumps. The draw solution tank with a 2 L maximum capacity was placed on a digital weight balance and the change in the draw solution was used to determine water flux.
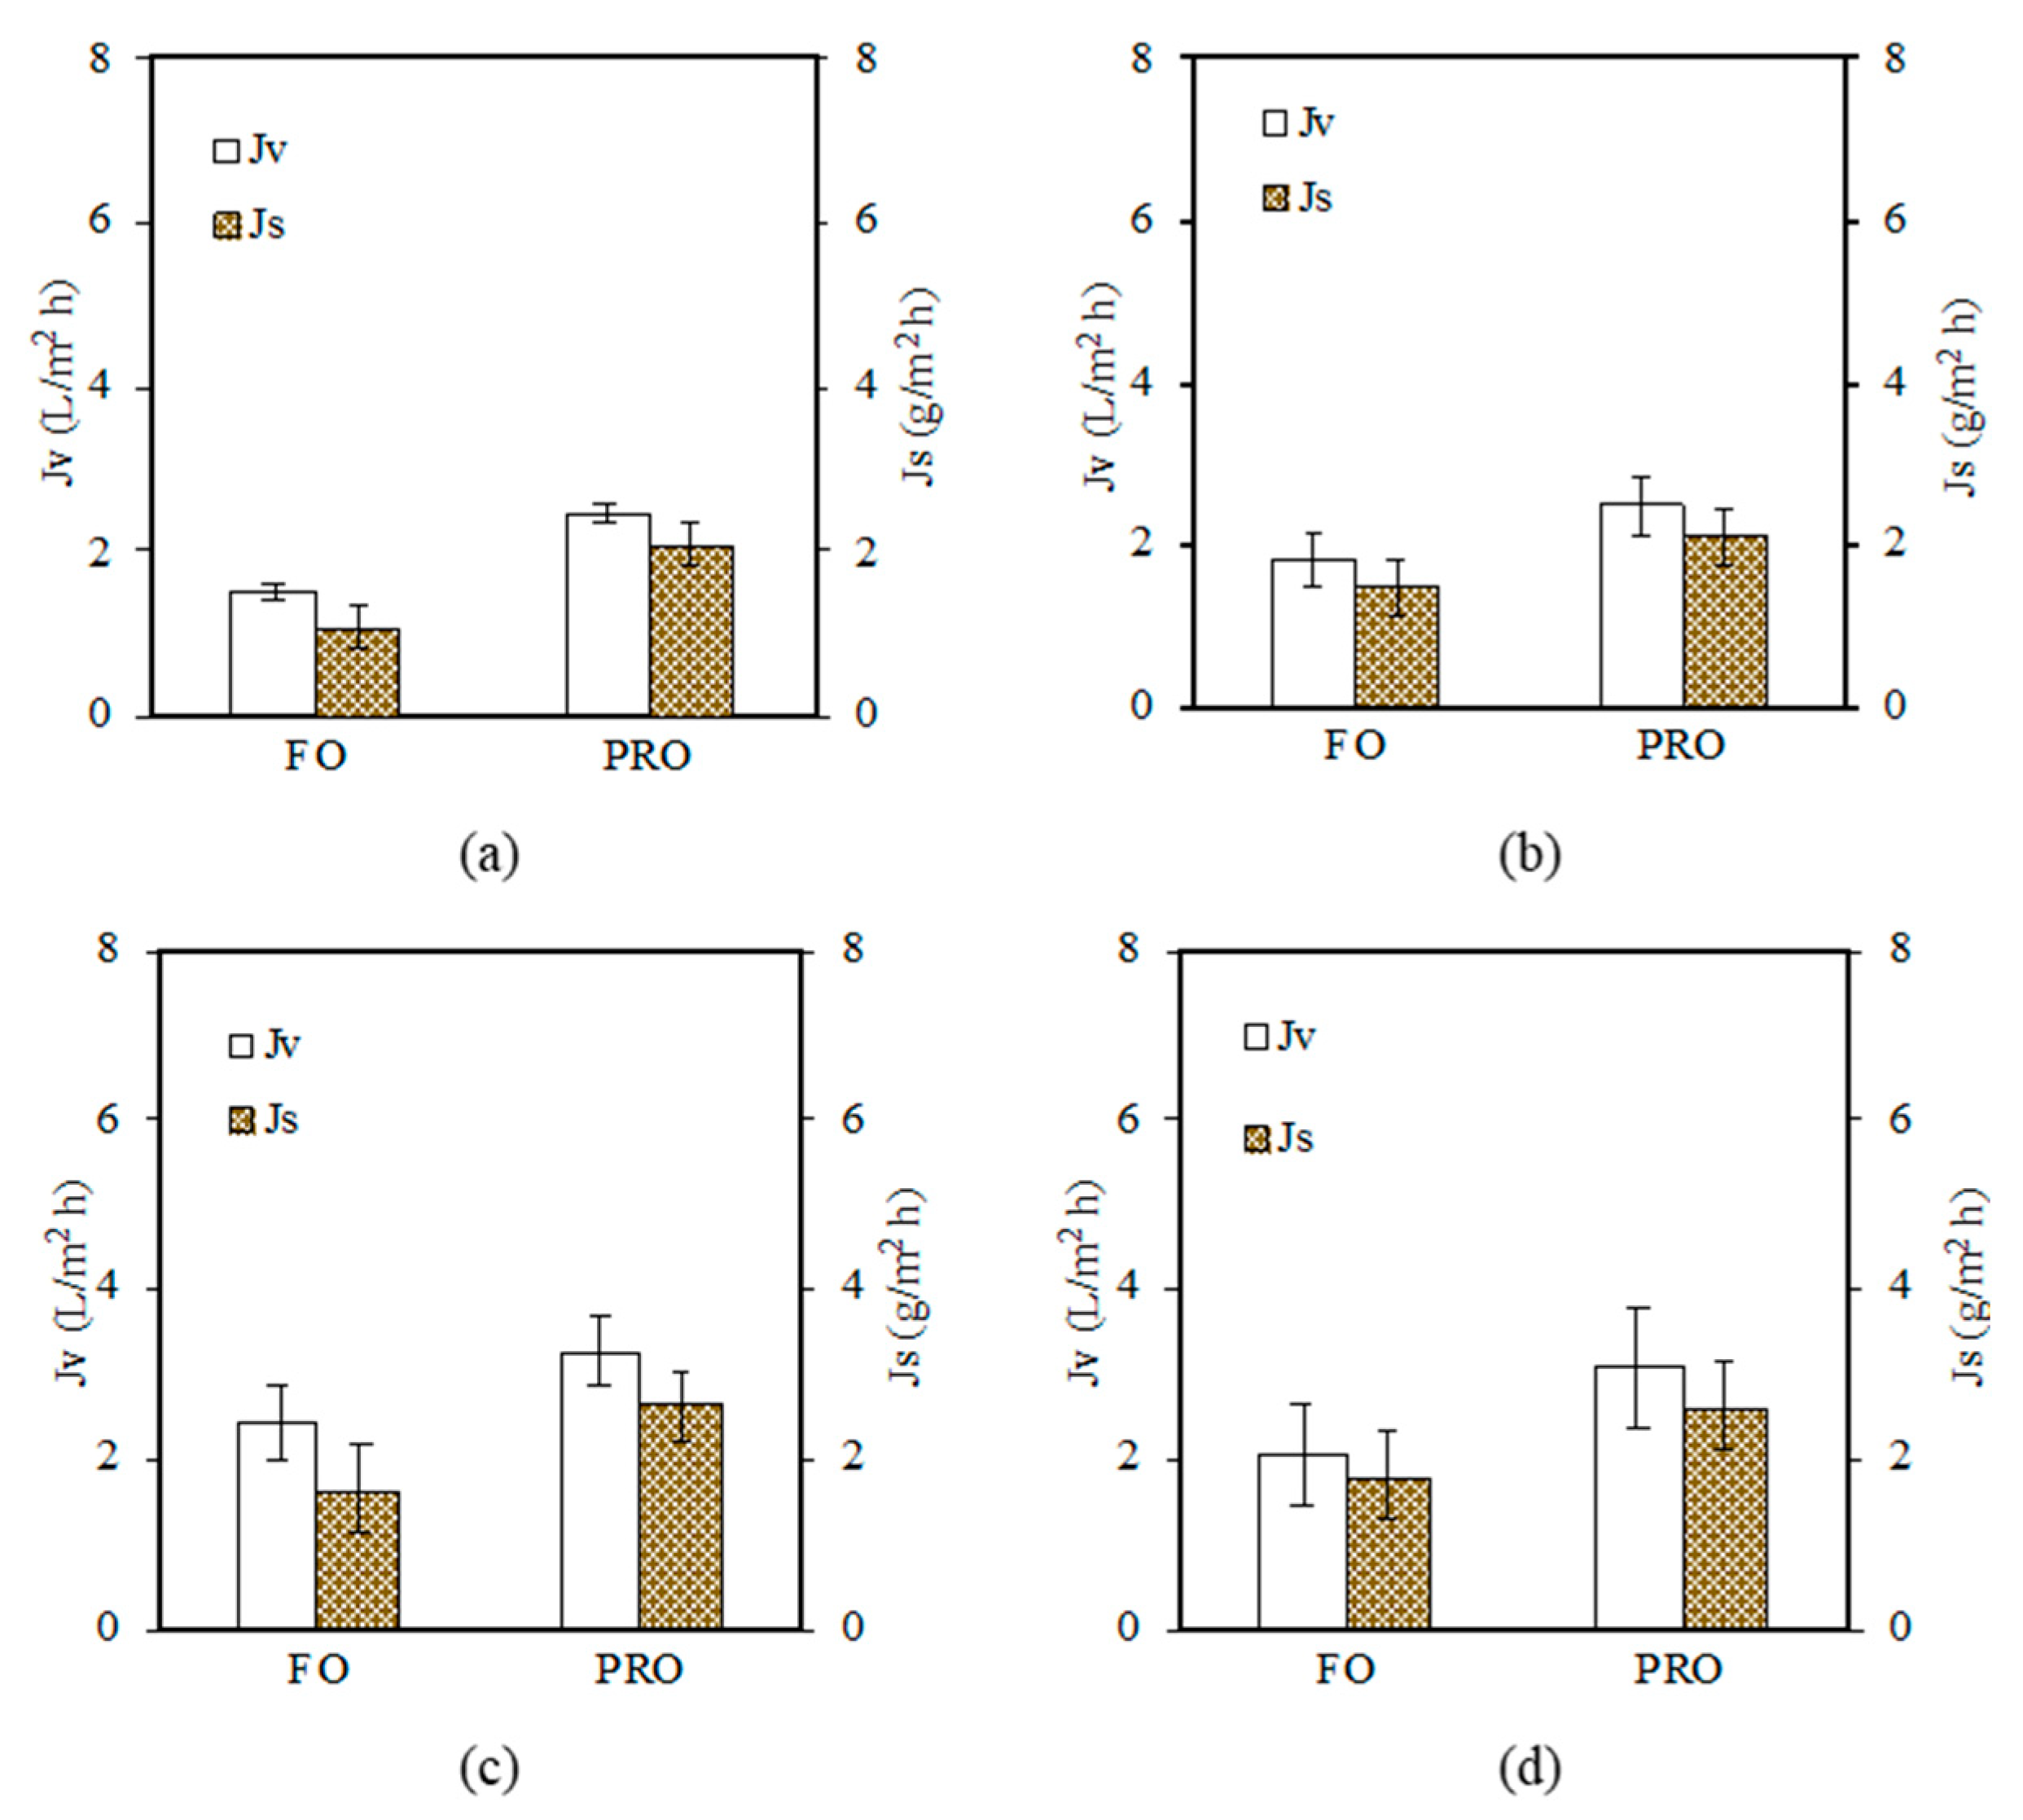
The water flux of the same membrane under the same feed and draw solution is different, depending on the membrane orientation mode, i.e., FO mode (active-layer-facing-feed-solution, AL-FS) and PRO mode (active-layer-facing-draw-solution, AL-DS). Unless otherwise specified, the water flux of each experiment reported in this work was the average of three replications with a running time of 20 min each. In the case where DI water was used as the feed solution, only selected draw solutes were considered in this work. After that, the DI water feed solution was replaced with AT-POME and the performance of membranes was further characterized with respect to water flux,
Jv (kg/m
2 h), and reverse draw solute flux,
Js (g/m
2 h), using the selected draw solute under FO/PRO mode. Both
Jv and
Js can be determined using Equations (5) and (6), respectively.
where ∆
V is the volume difference of the draw solution, ∆
m is the weight difference of the draw solution,
ρ is the density of the feed solution,
Ct and
C0 are the final and initial concentrations of the feed, respectively, and
Vt and
V0 are the final and initial volumes of the feed solution, respectively.
Upon completion of the experiment, the performance of membranes was further analyzed by varying the crossflow velocity of the feed and draw solution streams. The performance of membranes was evaluated prior to Jv and Js using the selected draw solute under FO/PRO mode.
A UV-vis spectrophotometer (DR5000, Hach) was used as an instrument to analyze the color intensity of AT-POME sample before and after filtration. The removal of color, R
c (%), was calculated using Equation (7):
where Abs
feed and Abs
permeate are the absorbances of the feed and permeate, respectively.
In order to measure the TOC value of the treated AT-POME sample, a TOC analyzer (TOC-LCPN, Shimadzu) was used. First, the sample liquid was injected into the 680 °C combustion tube to convert total carbon (TC) to CO
2 for TC analysis. The sample that contained inorganic carbon (IC) was mixed and reacted with 1-N hydrochloric acid to produce carbon dioxide. The TOC was obtained by subtracting the TC value from the IC value. The TOC removal, R
TOC (%), was calculated using Equation (8):
where TOC
feed and TOC
permeate are the TOCs of the feed and permeate, respectively.

 ,
, 


